Embed Size (px)
Citation preview
1208 VOLUME 13 | NUMBER 10 | OCTOBER 2010 nature neurOSCIenCe
a r t I C l e S
Synapses of the vertebrate nervous system are highly plastic and undergo short- and long-term modifications during developmen-tal refinement of the neural circuitry, as well as during learning and memory. Synaptic modulation can occur at the pre- and postsynaptic sides of the synapse. Presynaptically, synaptic strength can be modi-fied by the altered probability of neurotransmitter release in response to each action potential. At the postsynaptic site, modification of the number, types and properties of surface neurotransmitter receptors is believed to give rise to bidirectional plasticity of the synapse1–4. Several ionotropic glutamate receptors are involved in excitatory syn-aptic transmission, of which AMPARs are best known for their rapid trafficking into and out of the synapse by cycling between intracellular stores and the cell surface during synaptic potentiation and depres-sion, respectively1–4. Most of the excitatory synapses in the vertebrate brain reside on dendritic spines, tiny actin-based membrane pro-trusions that serve as the platform for postsynaptic specializations. Growth and shrinkage of dendritic spines have also been associated with long-term potentiation and depression (LTP and LTD), respec-tively5–7. It is generally thought that the morphological changes of postsynaptic spines are coupled to receptor trafficking during plasti-city, which may function to dynamically adjust the membrane area for accommodating the changing number of synaptic receptors8–10.
The actin cytoskeleton is important for postsynaptic structure, function and plasticity10–12. Actin is highly enriched in spines and provides the structural foundation for distinct spine shape, size and changes associated with synaptic modification. In addition, the actin cytoskeleton supports the scaffold for postsynaptic specializations
that include the localization and clustering of glutamate receptors for efficient synaptic transmission. ADF and cofilin regulate the dynamics of the actin cytoskeleton through their filament-severing and monomer-binding activities13,14. ADF/cofilin is mainly inacti-vated by phosphorylation of its serine-3 (Ser3) residue by LIM kinases (LIMKs) and activated by dephosphorylation by Slingshot (SSH) or chronophin phosphatases, although alternative mechanisms do exist14. ADF/cofilin phosphorylation and dephosphorylation have been associated with spine growth and shrinkage during LTP and LTD, respectively15–17. Lack of LIMK-1 results in elevated ADF/cofilin activity that leads to immature spines with reduced size and filopodia-like shape but enhances LTP18. It is conceivable that ADF/cofilin may regulate synaptic strength by mechanisms distinct from those that control spine morphology. We found that ADF/cofilin- mediated actin dynamics are important for postsynaptic trafficking and membrane addition of AMPA receptors during synaptic plasticity. Using live imaging to directly examine surface addition of AMPARs in single spines, we found that elevated ADF/cofilin-mediated actin dynamics were essential for AMPAR addition during chemically induced LTP. Our data indicate that rapid addition of AMPARs during chemical LTP was not directly coupled to a change in spine size. Instead, surface AMPAR addition and spine enlargement appeared to be temporally separated and depend on ADF/cofilin activation and inactivation, respectively. These findings suggest a mechanism by which temporally regulated ADF/cofilin-mediated actin dynamics regulate postsynaptic receptor trafficking and structural modifica-tions for synaptic potentiation.
1Departments of Cell Biology and Neurology, Center for Neurodegenerative Diseases, Emory University School of Medicine, Atlanta, Georgia, USA. 2Department of Cell Biology and Neuroscience, Rutgers University, Piscataway, New Jersey, USA. 3Department of Biology, Huck Institutes of Life Sciences, Pennsylvania State University, University Park, Pennsylvania, USA. 4Department of Biochemistry and Molecular Biology, Colorado State University, Fort Collins, Colorado, USA. 5These authors contributed equally to this work. Correspondence should be addressed to J.Q.Z. ([email protected]).
Received 22 June; accepted 17 August; published online 12 September 2010; doi:10.1038/nn.2634
ADF/cofilin-mediated actin dynamics regulate AMPA receptor trafficking during synaptic plasticityJiaping Gu1,5, Chi Wai Lee1,5, Yanjie Fan1,5, Daniel Komlos2, Xin Tang3, Chicheng Sun3, Kuai Yu1, H Criss Hartzell1, Gong Chen3, James R Bamburg4 & James Q Zheng1
Dendritic spines undergo actin-based growth and shrinkage during synaptic plasticity, in which the actin depolymerizing factor (ADF)/cofilin family of actin-associated proteins are important. Elevated ADF/cofilin activities often lead to reduced spine size and immature spine morphology but can also enhance synaptic potentiation in some cases. Thus, ADF/cofilin may have distinct effects on postsynaptic structure and function. We found that ADF/cofilin-mediated actin dynamics regulated AMPA receptor (AMPAR) trafficking during synaptic potentiation, which was distinct from actin’s structural role in spine morphology. Specifically, elevated ADF/cofilin activity markedly enhanced surface addition of AMPARs after chemically induced long-term potentiation (LTP), whereas inhibition of ADF/cofilin abolished AMPAR addition. We found that chemically induced LTP elicited a temporal sequence of ADF/cofilin dephosphorylation and phosphorylation that underlies AMPAR trafficking and spine enlargement. These findings suggest that temporally regulated ADF/cofilin activities function in postsynaptic modifications of receptor number and spine size during synaptic plasticity.
© 2
010
Nat
ure
Am
eric
a, In
c. A
ll ri
gh
ts r
eser
ved
.
nature neurOSCIenCe VOLUME 13 | NUMBER 10 | OCTOBER 2010 1209
a r t I C l e S
RESULTSRapid trafficking of AMPARs to spine surface during chemical LTPTo investigate rapid AMPAR trafficking at dendritic spines, we expressed super-ecliptic pHluorin (SEP) fused to the N terminus of glutamate receptor 1 (SEP-GluR1) in cultured hippocampal neurons and used live confocal imaging to examine the dynamic changes in SEP-GluR1 fluorescence (Fig. 1). Because the fluorescence of SEP is quenched when SEP-GluR1 is in the acidic environment of vesicu-lar compartments, this imaging approach enabled us to detect the surface presence of SEP-GluR1 as a result of its strong fluorescence at pH 7 and above19,20. To include spines in different focal planes, we performed a complete confocal z sectioning of the dendritic region of interest, followed by maximal intensity projection to pro-duce a two-dimensional image (Online Methods). We found that SEP-GluR1–expressing neurons of 21 d in vitro (DIV) exhibited numerous spines along the dendritic processes, of which many were highlighted by strong SEP-GluR1 fluorescence (Fig. 1a). The strong SEP-GluR1 fluorescence at spines is consistent with the notion that spines are the platform for postsynaptic specializations with concen-trated glutamate receptors. On the other hand, the dendritic shaft, as well as some of the spines, had a much lower level of SEP-GluR1 fluorescence, indicating a minimal level of diffusely distributed SEP-GluR1. It is plausible that the spines lacking substantial SEP-GluR1 fluorescence might represent the postsynaptic domains of silent or inactive synapses21.
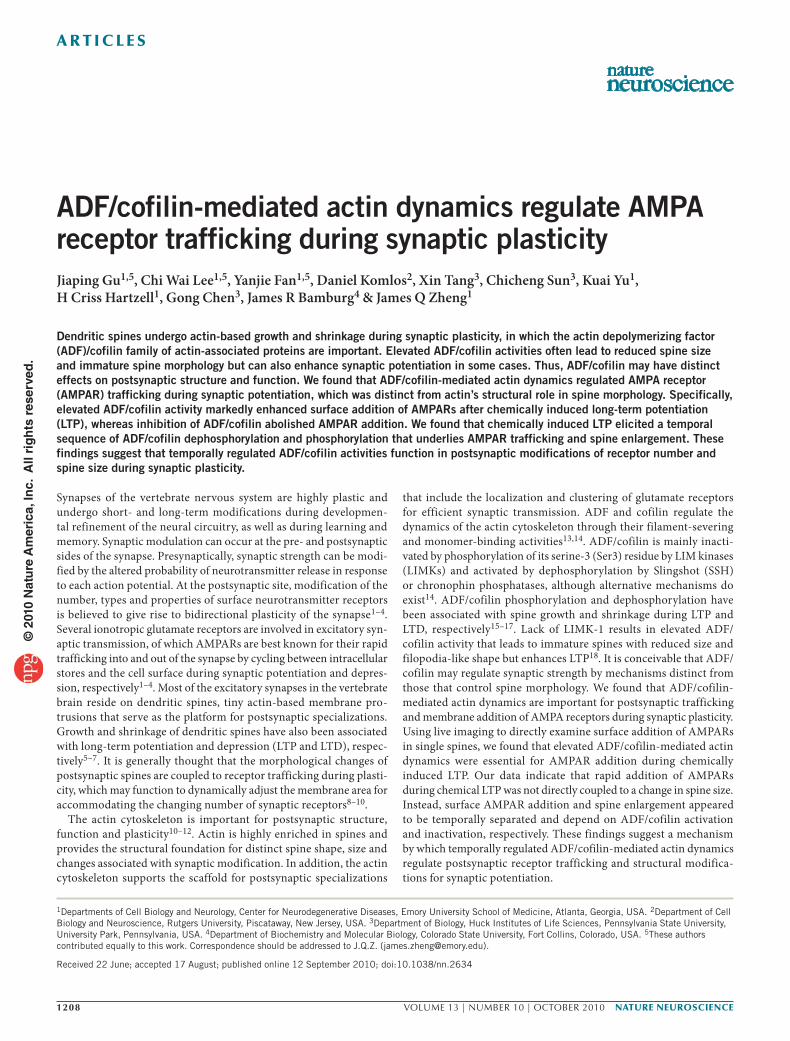
To study changes in surface AMPARs during synaptic plasticity, we adopted a method to chemically induce LTP by briefly exposing cells to the potassium channel blocker tetraethylammonium (TEA)22. Electrophysiological recordings of miniature excitatory postsynaptic currents (mEPSCs) showed that TEA-induced LTP could effectively potentiate synaptic transmission over an extended period of time (~2 h) in our high-density hippocampal cultures (Fig. 2). Specifically, 10-min exposure to 25 mM TEA resulted in a marked increase in the mEPSC frequency that lasted over 2 h (Fig. 2b). The median amplitude of mEPSCs followed a similar potentiation trend after TEA treatment, but was not statistically significant (P > 0.1, Student’s t test; Fig. 2c), which may be attributed to the presence of mEPSCs without amplitude changes. Indeed, the cumulative distribution plot of mEPSC amplitudes
revealed that TEA stimulation elicited a significant amplitude increase in a population of the mEPSCs in the first 20 min (P < 0.0001, Kolmogorov-Smirnov test; Fig. 2d). The amplitude increase became much smaller for mEPSCs recorded 20–40 min after TEA treatment. When all mEPSCs after induction of LTP by TEA (>2-h period) were averaged, no difference in the amplitude was seen (Fig. 2f). Consistent with previous findings22, induction of LTP by TEA was AMPAR dependent, as 6-cyano-7-nitroquinoxaline-2,3-dione (CNQX), an AMPAR antagonist, but not d(−)-2-amino-5-phospho-novaleric acid (AP5), an NMDA receptor blocker, was able to block the potentiation (Fig. 2e). In support of our electrophysiological data, we found that 10-min TEA stimulation resulted in a marked increase in SEP-GluR1 fluorescence in many dendritic spines (Fig. 1a). We measured the integrated intensity of SEP-GluR1 fluorescence of each spine before and after induction of LTP by TEA and calculated the relative change (ΔF/F). We found that, on average, induction of LTP by TEA resulted in an ~20% increase in spine SEP-GluR1 fluorescence per cell (Fig. 1a,b). A 10-min exposure to HEPES-buffered saline (HBS) alone did not have any effect on SEP-GluR1 fluorescence (Fig. 1b). We confirmed that SEP-GluR1 fluorescence reflects SEP-GluR1 expression on the cell surface by exposing the cells to a membrane impermeable acidic buffer of pH 6.0 (ref. 23), which resulted in a marked and immediate loss of SEP fluorescence (Fig. 1a). The SEP-GluR1 fluorescence was found to fully recover shortly after return-ing the cells to pH 7.4. Thus, induction of LTP by TEA results in the robust addition of new AMPARs to the postsynaptic surface.
The TEA-induced increase in spine SEP-GluR1 fluorescence is further supported by the cumulative ΔF/F distributions of all of the spines that we examined (Fig. 1c). TEA elicited a marked increase in the number of spines with positive ΔF/F values and shifted the distribution to the right. As only a portion of spines responded to TEA with an increase in SEP-GluR1 fluorescence, we used an inten-sity threshold to select the spines with SEP-GluR1 fluorescence that was brighter than that of the dendritic shaft (Supplementary Fig. 1) and determined the numbers of spines exhibiting bright SEP-GluR1 fluorescence before and after induction of LTP by TEA. Although this quantification method is likely to miss small changes in the SEP-GluR1 fluorescence of some spines, it enabled us to determine the number of spines exhibiting a definite increase in SEP-GluR1 fluo-rescence. We found that a 10-min exposure to TEA, but not HBS, resulted in an ~30% increase in the number of spines exhibiting bright SEP-GluR1 fluorescence (Fig. 1b). The increase in SEP-GluR1 signals
TEA Medium change
0 min pH 7.4
140
F/F
0 (%
)
40
40
20
0–100 100 200
HBS
TEA + AP5TEA + CNQX
TEA
150
Spine SEP-GluR1 ∆F/F (%)
0–50 50
HBS
∆F/F
10 min TEA
Number
40
30
20
10
–10 +None(6)
+CNQX(7)
+AP5(8)
+None(7)
**
**
Cha
nges
inS
EP
-Glu
R1
(%)
Cum
ulat
ive
dist
ribut
ion
(%)
0
n = 760
60
80
80
100
100
120
pH 6.010 mina
b c
Figure 1 Rapid addition of postsynaptic AMPA receptors to spine surface during chemical induction of LTP by TEA. (a) Representative images of a 21 DIV hippocampal neuron expressing SEP-GluR1 as revealed by live three-dimensional confocal imaging. Dendritic regions enclosed by red boxes were shown in a higher magnification before (0 min) and 10 min after 25 mM TEA treatment. Arrows indicate spines with new GluR1 addition. Application of a nonpermeable acid buffer (pH 6.0) caused a marked loss of SEP-GluR1 fluorescence, which was restored by changing back to a pH 7.4 buffer. The plot shows the quantification of fluorescent changes in correspondence to different treatments to the cells as depicted in the magnified panels. (b) Quantified data showing the changes in the integrated intensity of SEP-GluR1 fluorescence on all spines and the number of spines with bright SEP-GluR1 fluorescence after a 10-min exposure to either HBS or 25 mM TEA with or without CNQX or AP5. The numbers in parentheses represent the numbers of cells examined for each condition. *P < 0.01 (Student’s t test). (c) Cumulative distribution curve of SEP-GluR1 fluorescence change on all individual spines showing significant receptor insertion after TEA treatment. CNQX blocked the insertion, whereas AP5 did not have any effect. Scale bar represents 5 μm. Error bars represent s.e.m.
© 2
010
Nat
ure
Am
eric
a, In
c. A
ll ri
gh
ts r
eser
ved
.
1210 VOLUME 13 | NUMBER 10 | OCTOBER 2010 nature neurOSCIenCe
a r t I C l e S
after TEA treatment was blocked by 10 μM CNQX, but not by 100 μM AP5 (Fig. 1b,c), supporting the conclusion that induction of LTP by TEA is AMPAR dependent. Moreover, fast time-lapse imag-ing revealed that SEP-GluR1 addition to spine surface was rapid and mostly occurred within a few minutes (<5 min) of TEA application (Supplementary Fig. 2). Finally, to ensure that these results were not a result of an artifact of exogenous expression of SEP-GluR1, we subjected nontransfected hippocampal neurons to the same TEA induction of LTP, followed by fixation and immunostaining for surface GluR1. We consistently observed an increase in the sur-face GluR1 immunofluorescence that was similar to that observed by live cell SEP-GluR1 imaging (Supplementary Fig. 3), indicating that endogenous GluR1 goes to the surface membrane on induction of LTP by TEA.
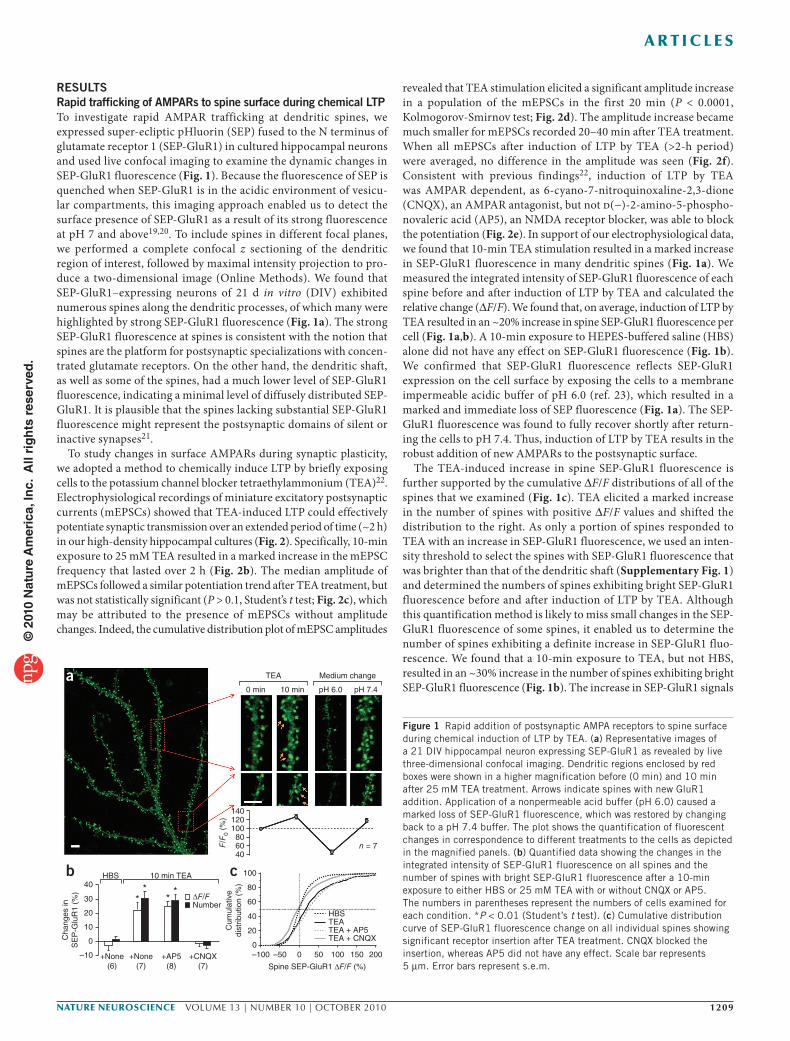
Actin dynamics are required for AMPAR traffickingWe tested whether the actin cytoskeleton is involved in the trafficking of AMPARs during synaptic plasticity. We first employed latrunculin A (LatA), an agent known to inhibit actin polymerization by sequester-ing actin monomers, to investigate whether the inhibition of actin polymerization (without disrupting the existing actin network) could affect the surface addition of AMPARs during TEA-induced LTP. We pretreated 21 DIV hippocampal neurons expressing SEP-GluR1 with varying LatA concentrations for 20 min, followed by 10 min of TEA treatment. Live confocal imaging of SEP-GluR1 was performed at the beginning of LatA treatment, before and after TEA treatment. We used the images at the onset of LatA treatment and the beginning of TEA
treatment to determine the effect of LatA on the baseline of SEP-GluR1 enrichment at the spines. The images at the onset and 10 min after TEA treatment were used to determine SEP-GluR1 insertion at dendritic spines induced by chemical LTP. We first estab-lished that SEP-GluR1 signals at spines did not change in a 20-min control period with-out any drug application or during a 10-min exposure to HBS but markedly increased after induction of LTP by TEA (Fig. 3).
Control TEA 0–20 min
20 pA1 s
5
8
8
10
12
14
16
4
3
2
1
1.2 3.0 12
14562
0 0
40.5
1.5
2.5
1.0
2.01.00.80.60.4
Cum
ulat
ive
prob
abili
ty
Fre
quen
cy (
Hz)
0.20
0 20 40 60 80 100Amplitude (pA)
Control
20–40 min0–20 min
0
57
TEA TEA
Time (min) Time (min)Con
trol
Contro
l0–
200–
20>1
20>1
20
60–1
20
TEATEA
TEA + A
P5
TEA + A
P5
TEA + C
NQX
TEA + C
NQX
Contro
l
Contro
l
60–1
20
40–6
0
40–6
0
20–4
0
20–4
0
12
* 13
**17
** 26
**
82
** 86
*
14
*
Fre
quen
cy (
Hz)
Am
plitu
de (
pA)
Am
plitu
de (
pA)
40–60 mina
b c
d fe
Figure 2 Long-term potentiation of synaptic function induced by TEA treatment. (a) Representative traces showing mEPSCs before and after 10-min TEA stimulation. (b) Quantified data showing TEA-induced increase in the mEPSC frequency (control = 1.2 ± 0.1Hz; after TEA treatment: 0–20 min, 3.1 ± 0.9 Hz, P < 0.05; 20–40 min, 2.6 ± 0.5 Hz, P < 0.01; 40–60 min, 2.6 ± 0.4 Hz, P < 0.002; 60–120 min, 2.3 ± 0.4 Hz, P < 0.004; >120 min, 2.1 ± 0.3 Hz, P < 0.02). *P < 0.05 and **P < 0.01 (two-tailed Student’s t test compared with the control). The numbers of cells examined in each group are shown above each data point. (c) Quantified data showing the changes of average mEPSC amplitude (median value) before and after TEA treatment (control = 10.1 ± 0.3 pA; after TEA treatment: 0–20 min, 12.6 ± 1.8 pA, P > 0.1; 20–40 min, 11.6 ± 0.8 pA, P > 0.1; 40–60 min, 11.3 ± 0.8 pA, P > 0.1; 60–120 min, 10.7 ± 0.3 pA, P > 0.2; >120 min, 10.2 ± 0.9 pA, P > 0.8). (d) Cumulative distribution curve showing a significant potentiation of the mEPSC amplitude after TEA treatment (P < 0.0001, Kolmogorov-Smirnov test). (e) Quantified data showing the effect of CNQX and AP5 on TEA-induced changes in the mEPSC frequency, which was determined from the entire recording over 2 h after a 10-min TEA stimulation. *P < 0.05 and **P < 0.01 (Student’s t test). The numbers of cells examined in each group are shown above the bars. (f) The effects of CNQX and AP5 on TEA-induced changes of the mEPSC amplitude (averaged from all mEPSCs after TEA stimulation). No significant difference was observed (P > 0.5, t test). Error bars represent s.e.m.
b
a
40
Jasp(1 µM)
LatA(2 µM)
LatA(200 nM)
Control
****
*10
20 min control(+/– drugs)
10 min LTP(25 mM TEA)
HBS control (6)
+None (7)
+20 nM LatA (6)
+200 nM LatA (7)
+100 nM Jasp (10)
+2 µM LatA (6)
+1 µM Jasp (10)
0
–10
20
30
–20
–30
–40
–20 min 0 min 10 min LTP
∆F/F
(%
)
Figure 3 Effects of actin drugs on TEA-induced AMPAR insertion. (a) Representative fluorescent images showing SEP-GluR1 fluorescence on dendritic regions before (−20) and after (0) 20 min of actin drug treatment, followed by 10 min of TEA-induced LTP. Arrows indicate spines with marked SEP-GluR1 addition. Arrowheads indicate spines with loss in SEP-GluR1 fluorescence. Scale bar represents 10 μm. (b) Quantification showing the integrated intensity of SEP-GluR1 fluorescence on all spines. Jasp, jasplakinolide. Error bars represent s.e.m. Numbers in parentheses represent the number of cells examined for each condition. *P < 0.05 and **P < 0.01.
© 2
010
Nat
ure
Am
eric
a, In
c. A
ll ri
gh
ts r
eser
ved
.
nature neurOSCIenCe VOLUME 13 | NUMBER 10 | OCTOBER 2010 1211
a r t I C l e S
LatA had dose-dependent effects on SEP-GluR1 signals at spines and insertion during induction of LTP by TEA. At a high concentration (2 μM), 20 min of LatA treatment caused a marked decline in SEP-GluR1 fluorescence at spines, which continued during 10 min of TEA-induced LTP. Some spines also shrunk after 2 μM LatA treatment (Fig. 3a). Thus, we suspect that 2 μM LatA adversely affected the integrity of the actin network required for spine receptor anchoring and clustering24.
Treatment with 200 nM LatA alone resulted in no obvious alteration in spine morphology (Fig. 3a), which was confirmed by phalloidin staining (Supplementary Fig. 4). However, SEP-GluR1 fluorescence intensity on spines was reduced by about 10%, indicating that this concentration of LatA minimally affected the baseline AMPARs. Notably, 200 nM LatA abolished the surface addition of SEP-GluR1 after chemical induction of LTP (Fig. 3b). At 20 nM, LatA did not affect either spine morphology or the baseline SEP-GluR1 on spines after 20-min pretreatment but effectively blocked the increase of SEP-GluR1 induced by TEA stimulation (Fig. 3b). Furthermore, the basal synaptic transmission was not affected by 20 nM LatA (Supplementary Fig. 5). Thus, AMPAR insertion during chemically induced LTP is dependent on actin polymerization.
To further elucidate the role of actin dynamics in AMPAR traffick-ing during synaptic plasticity, we used another membrane-permeable actin-binding drug, jasplakinolide. Jasplakinolide is a natural cyclic peptide that binds actin filaments at the same site as phalloidin to promote actin polymerization and stabilize the actin filaments by inhibiting depolymerization25. We tested different concentrations of jasplakinolide on SEP-GluR1 localization and insertion in spines. Unlike LatA, jasplakinolide did not affect the baseline SEP-GluR1 levels after 20-min pretreatment. However, we found that jasplakinolide at 1 μM, but not 100 nM, largely blocked the insertion of SEP-GluR1 in response to chemically induced LTP (Fig. 3). We also confirmed that 1 μM jasplakinolide did not affect dendritic actin networks, spine morphology and baseline synaptic transmission (Supplementary Figs. 4 and 5). As jasplakinolide functions to stabilize the actin fila-ments and inhibit depolymerization, these results suggest that actin depolymerization is also required for receptor insertion. Together with the results of LatA blockade of SEP-GluR1 insertion, these data indicate that although a stable actin network is required for AMPAR clustering and anchoring at the spine, bidirectional dynamics of the actin cytoskeleton (assembly and disassembly) are required for the rapid addition of AMPARs to spine surface during chemical LTP.
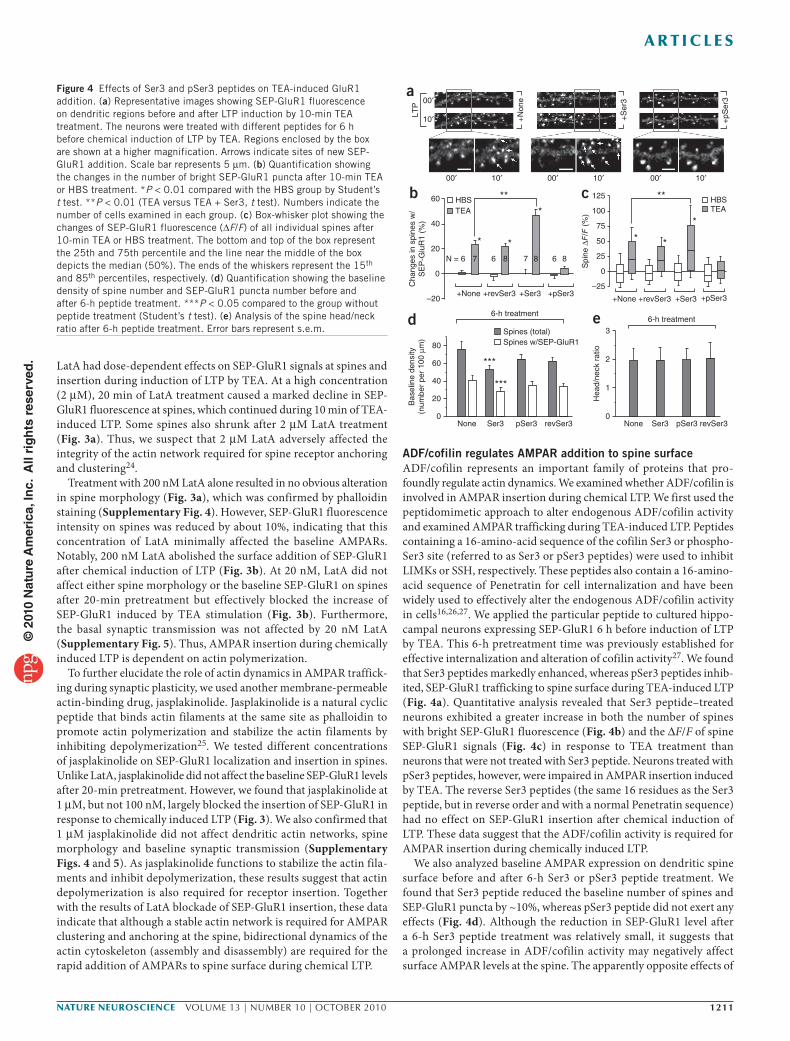
ADF/cofilin regulates AMPAR addition to spine surfaceADF/cofilin represents an important family of proteins that pro-foundly regulate actin dynamics. We examined whether ADF/cofilin is involved in AMPAR insertion during chemical LTP. We first used the peptidomimetic approach to alter endogenous ADF/cofilin activity and examined AMPAR trafficking during TEA-induced LTP. Peptides containing a 16-amino-acid sequence of the cofilin Ser3 or phospho-Ser3 site (referred to as Ser3 or pSer3 peptides) were used to inhibit LIMKs or SSH, respectively. These peptides also contain a 16-amino-acid sequence of Penetratin for cell internalization and have been widely used to effectively alter the endogenous ADF/cofilin activity in cells16,26,27. We applied the particular peptide to cultured hippo-campal neurons expressing SEP-GluR1 6 h before induction of LTP by TEA. This 6-h pretreatment time was previously established for effective internalization and alteration of cofilin activity27. We found that Ser3 peptides markedly enhanced, whereas pSer3 peptides inhib-ited, SEP-GluR1 trafficking to spine surface during TEA-induced LTP (Fig. 4a). Quantitative analysis revealed that Ser3 peptide–treated neurons exhibited a greater increase in both the number of spines with bright SEP-GluR1 fluorescence (Fig. 4b) and the ΔF/F of spine SEP-GluR1 signals (Fig. 4c) in response to TEA treatment than neurons that were not treated with Ser3 peptide. Neurons treated with pSer3 peptides, however, were impaired in AMPAR insertion induced by TEA. The reverse Ser3 peptides (the same 16 residues as the Ser3 peptide, but in reverse order and with a normal Penetratin sequence) had no effect on SEP-GluR1 insertion after chemical induction of LTP. These data suggest that the ADF/cofilin activity is required for AMPAR insertion during chemically induced LTP.
We also analyzed baseline AMPAR expression on dendritic spine surface before and after 6-h Ser3 or pSer3 peptide treatment. We found that Ser3 peptide reduced the baseline number of spines and SEP-GluR1 puncta by ~10%, whereas pSer3 peptide did not exert any effects (Fig. 4d). Although the reduction in SEP-GluR1 level after a 6-h Ser3 peptide treatment was relatively small, it suggests that a prolonged increase in ADF/cofilin activity may negatively affect surface AMPAR levels at the spine. The apparently opposite effects of
80
60
Bas
elin
e de
nsity
(num
ber
per
100
µm)
40
20
0None
Spines (total)
6-h treatment
Spines w/SEP-GluR1
Ser3
***
***
pSer3 revSer3
d e
cb
a
HBS**
* *
*TEA
Spi
ne ∆
F/F
(%
)
3
2
Hea
d/ne
ck r
atio
1
0
125
100
75
50
25
0
–25
None
+None +revSer3 +Ser3 +pSer3
6-h treatment
Ser3 pSer3 revSer3
HBS
00′ 10′
00′
10′
00′ 10′ 00′ 10′
**
* *
*TEA
Cha
nges
in s
pine
s w
/S
EP
-Glu
R1
(%)
60
40
20
0
N = 6 7 6 8 8 867
–20+None +revSer3 +Ser3 +pSer3
LTP
+N
one
+S
er3
+pS
er3
Figure 4 Effects of Ser3 and pSer3 peptides on TEA-induced GluR1 addition. (a) Representative images showing SEP-GluR1 fluorescence on dendritic regions before and after LTP induction by 10-min TEA treatment. The neurons were treated with different peptides for 6 h before chemical induction of LTP by TEA. Regions enclosed by the box are shown at a higher magnification. Arrows indicate sites of new SEP-GluR1 addition. Scale bar represents 5 μm. (b) Quantification showing the changes in the number of bright SEP-GluR1 puncta after 10-min TEA or HBS treatment. *P < 0.01 compared with the HBS group by Student’s t test. **P < 0.01 (TEA versus TEA + Ser3, t test). Numbers indicate the number of cells examined in each group. (c) Box-whisker plot showing the changes of SEP-GluR1 fluorescence (ΔF/F) of all individual spines after 10-min TEA or HBS treatment. The bottom and top of the box represent the 25th and 75th percentile and the line near the middle of the box depicts the median (50%). The ends of the whiskers represent the 15th and 85th percentiles, respectively. (d) Quantification showing the baseline density of spine number and SEP-GluR1 puncta number before and after 6-h peptide treatment. ***P < 0.05 compared to the group without peptide treatment (Student’s t test). (e) Analysis of the spine head/neck ratio after 6-h peptide treatment. Error bars represent s.e.m.
© 2
010
Nat
ure
Am
eric
a, In
c. A
ll ri
gh
ts r
eser
ved
.
1212 VOLUME 13 | NUMBER 10 | OCTOBER 2010 nature neurOSCIenCe
a r t I C l e S
ADF/cofilin on baseline AMPARs and LTP-induced surface addition suggest that ADF/cofilin may have different roles in AMPAR insertion and surface clustering. The finding that the spine head/neck ratio (based on analysis on coexpressed mOrange signals) was not substan-tially changed by either peptide (Fig. 4e) suggests that the effects of ADF/cofilin on AMPAR trafficking did not result from their action on the spine structure.
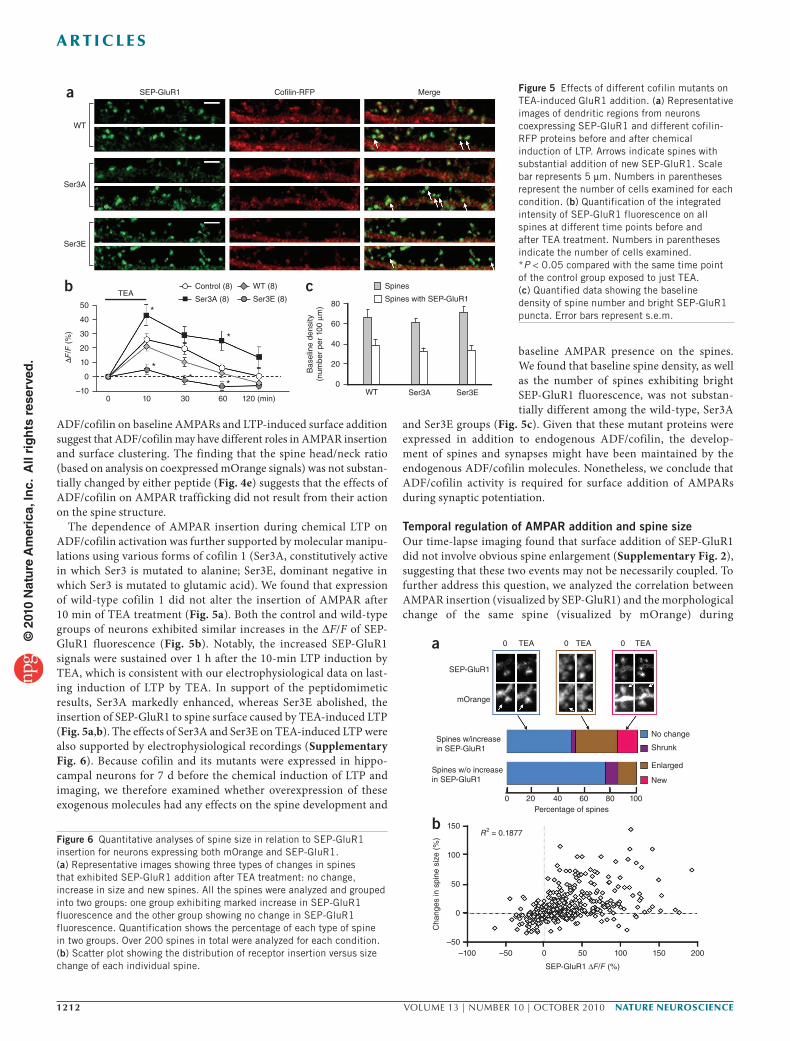
The dependence of AMPAR insertion during chemical LTP on ADF/cofilin activation was further supported by molecular manipu-lations using various forms of cofilin 1 (Ser3A, constitutively active in which Ser3 is mutated to alanine; Ser3E, dominant negative in which Ser3 is mutated to glutamic acid). We found that expression of wild-type cofilin 1 did not alter the insertion of AMPAR after 10 min of TEA treatment (Fig. 5a). Both the control and wild-type groups of neurons exhibited similar increases in the ΔF/F of SEP-GluR1 fluorescence (Fig. 5b). Notably, the increased SEP-GluR1 signals were sustained over 1 h after the 10-min LTP induction by TEA, which is consistent with our electrophysiological data on last-ing induction of LTP by TEA. In support of the peptidomimetic results, Ser3A markedly enhanced, whereas Ser3E abolished, the insertion of SEP-GluR1 to spine surface caused by TEA-induced LTP (Fig. 5a,b). The effects of Ser3A and Ser3E on TEA-induced LTP were also supported by electrophysiological recordings (Supplementary Fig. 6). Because cofilin and its mutants were expressed in hippo-campal neurons for 7 d before the chemical induction of LTP and imaging, we therefore examined whether overexpression of these exogenous molecules had any effects on the spine development and
baseline AMPAR presence on the spines. We found that baseline spine density, as well as the number of spines exhibiting bright SEP-GluR1 fluorescence, was not substan-tially different among the wild-type, Ser3A
and Ser3E groups (Fig. 5c). Given that these mutant proteins were expressed in addition to endogenous ADF/cofilin, the develop-ment of spines and synapses might have been maintained by the endogenous ADF/cofilin molecules. Nonetheless, we conclude that ADF/cofilin activity is required for surface addition of AMPARs during synaptic potentiation.
Temporal regulation of AMPAR addition and spine sizeOur time-lapse imaging found that surface addition of SEP-GluR1 did not involve obvious spine enlargement (Supplementary Fig. 2), suggesting that these two events may not be necessarily coupled. To further address this question, we analyzed the correlation between AMPAR insertion (visualized by SEP-GluR1) and the morphological change of the same spine (visualized by mOrange) during
b c Spines
WT
80
60
40
20
0
Bas
elin
e de
nsity
(num
ber
per
100
µm)
Ser3A Ser3E
Spines with SEP-GluR1TEA
Control (8) WT (8)
Ser3E (8)Ser3A (8)
*
**
*
*
50
∆F
/F (
%)
40
30
20
10
0
0 10 30 60 120 (min)–10
SEP-GluR1
WT
a
Ser3A
Ser3E
Cofilin-RFP Merge Figure 5 Effects of different cofilin mutants on TEA-induced GluR1 addition. (a) Representative images of dendritic regions from neurons coexpressing SEP-GluR1 and different cofilin-RFP proteins before and after chemical induction of LTP. Arrows indicate spines with substantial addition of new SEP-GluR1. Scale bar represents 5 μm. Numbers in parentheses represent the number of cells examined for each condition. (b) Quantification of the integrated intensity of SEP-GluR1 fluorescence on all spines at different time points before and after TEA treatment. Numbers in parentheses indicate the number of cells examined. *P < 0.05 compared with the same time point of the control group exposed to just TEA. (c) Quantified data showing the baseline density of spine number and bright SEP-GluR1 puncta. Error bars represent s.e.m.
TEA TEA TEA
No change
New
Enlarged
Shrunk
0Percentage of spines
20 40 60 80 100
0aSEP-GluR1
mOrange
Spines w/increasein SEP-GluR1
Spines w/o increasein SEP-GluR1
0 0
150
Cha
nges
in s
pine
siz
e (%
)
R2 = 0.1877
100
50
0
–50–100
SEP-GluR1 ∆F/F (%)
–50 0 50 100 150 200
bFigure 6 Quantitative analyses of spine size in relation to SEP-GluR1 insertion for neurons expressing both mOrange and SEP-GluR1. (a) Representative images showing three types of changes in spines that exhibited SEP-GluR1 addition after TEA treatment: no change, increase in size and new spines. All the spines were analyzed and grouped into two groups: one group exhibiting marked increase in SEP-GluR1 fluorescence and the other group showing no change in SEP-GluR1 fluorescence. Quantification shows the percentage of each type of spine in two groups. Over 200 spines in total were analyzed for each condition. (b) Scatter plot showing the distribution of receptor insertion versus size change of each individual spine.
© 2
010
Nat
ure
Am
eric
a, In
c. A
ll ri
gh
ts r
eser
ved
.
nature neurOSCIenCe VOLUME 13 | NUMBER 10 | OCTOBER 2010 1213
a r t I C l e S
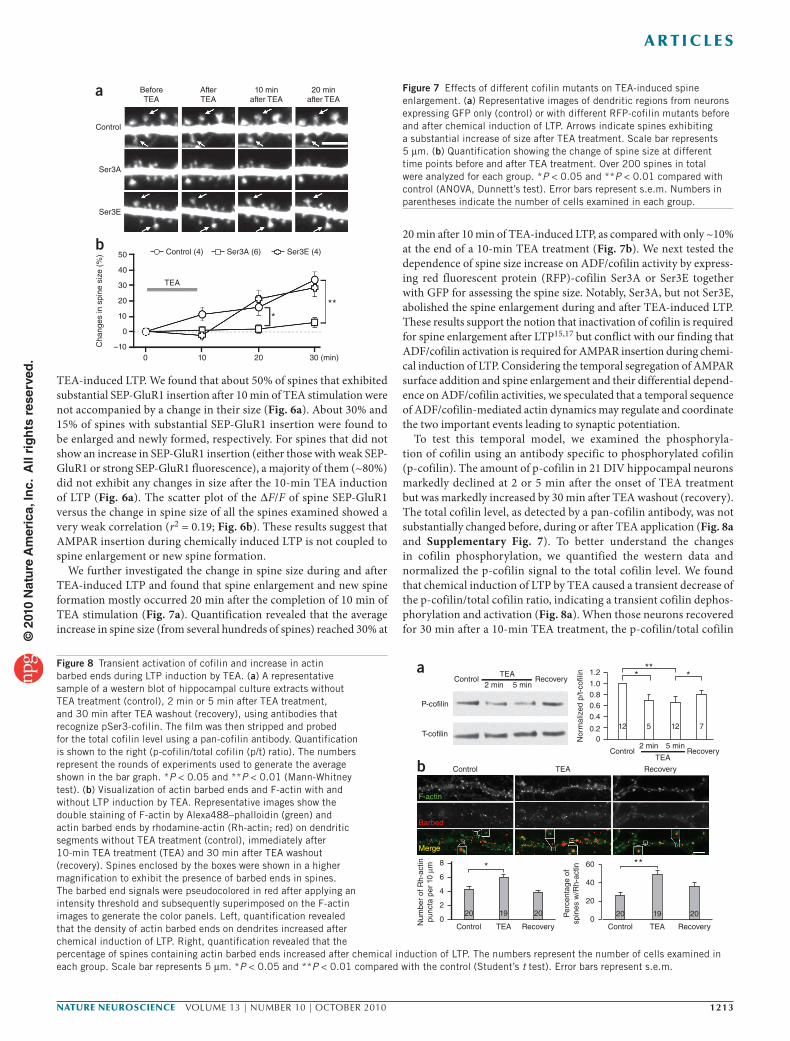
TEA-induced LTP. We found that about 50% of spines that exhibited substantial SEP-GluR1 insertion after 10 min of TEA stimulation were not accompanied by a change in their size (Fig. 6a). About 30% and 15% of spines with substantial SEP-GluR1 insertion were found to be enlarged and newly formed, respectively. For spines that did not show an increase in SEP-GluR1 insertion (either those with weak SEP-GluR1 or strong SEP-GluR1 fluorescence), a majority of them (~80%) did not exhibit any changes in size after the 10-min TEA induction of LTP (Fig. 6a). The scatter plot of the ΔF/F of spine SEP-GluR1 versus the change in spine size of all the spines examined showed a very weak correlation (r2 = 0.19; Fig. 6b). These results suggest that AMPAR insertion during chemically induced LTP is not coupled to spine enlargement or new spine formation.
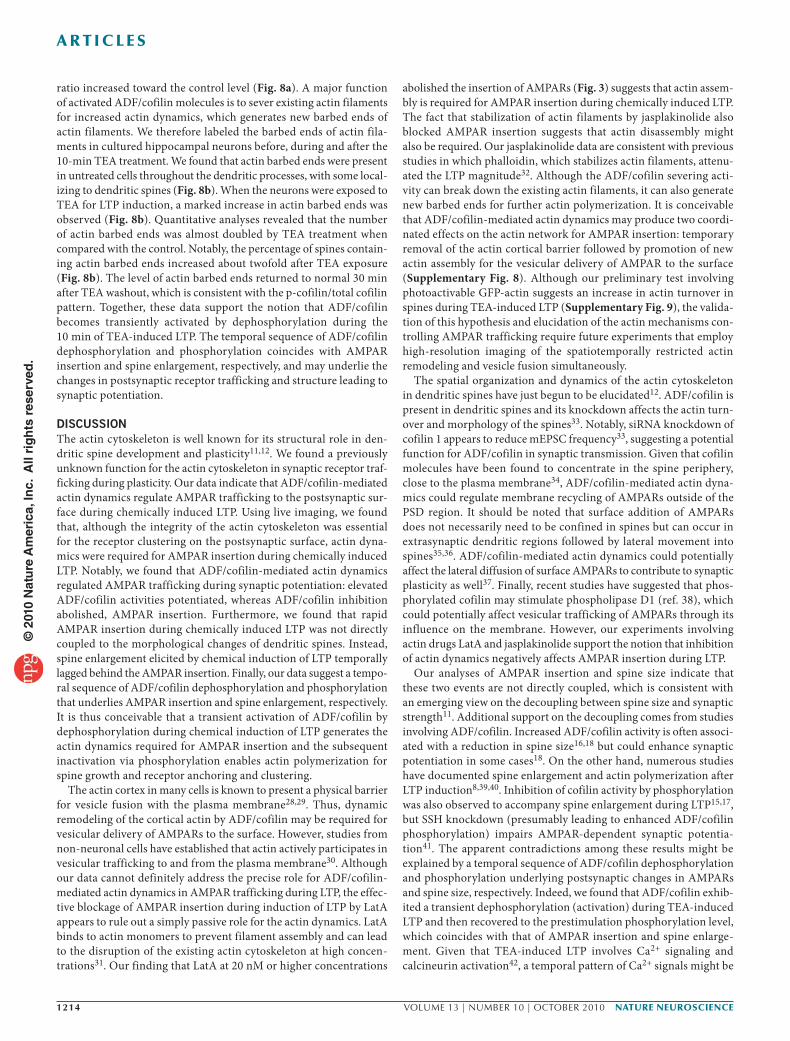
We further investigated the change in spine size during and after TEA-induced LTP and found that spine enlargement and new spine formation mostly occurred 20 min after the completion of 10 min of TEA stimulation (Fig. 7a). Quantification revealed that the average increase in spine size (from several hundreds of spines) reached 30% at
20 min after 10 min of TEA-induced LTP, as compared with only ~10% at the end of a 10-min TEA treatment (Fig. 7b). We next tested the dependence of spine size increase on ADF/cofilin activity by express-ing red fluorescent protein (RFP)-cofilin Ser3A or Ser3E together with GFP for assessing the spine size. Notably, Ser3A, but not Ser3E, abolished the spine enlargement during and after TEA-induced LTP. These results support the notion that inactivation of cofilin is required for spine enlargement after LTP15,17 but conflict with our finding that ADF/cofilin activation is required for AMPAR insertion during chemi-cal induction of LTP. Considering the temporal segregation of AMPAR surface addition and spine enlargement and their differential depend-ence on ADF/cofilin activities, we speculated that a temporal sequence of ADF/cofilin-mediated actin dynamics may regulate and coordinate the two important events leading to synaptic potentiation.
To test this temporal model, we examined the phosphoryla-tion of cofilin using an antibody specific to phosphorylated cofilin (p-cofilin). The amount of p-cofilin in 21 DIV hippocampal neurons markedly declined at 2 or 5 min after the onset of TEA treatment but was markedly increased by 30 min after TEA washout (recovery). The total cofilin level, as detected by a pan-cofilin antibody, was not substantially changed before, during or after TEA application (Fig. 8a and Supplementary Fig. 7). To better understand the changes in cofilin phosphorylation, we quantified the western data and normalized the p-cofilin signal to the total cofilin level. We found that chemical induction of LTP by TEA caused a transient decrease of the p-cofilin/total cofilin ratio, indicating a transient cofilin dephos-phorylation and activation (Fig. 8a). When those neurons recovered for 30 min after a 10-min TEA treatment, the p-cofilin/total cofilin
Figure 8 Transient activation of cofilin and increase in actin barbed ends during LTP induction by TEA. (a) A representative sample of a western blot of hippocampal culture extracts without TEA treatment (control), 2 min or 5 min after TEA treatment, and 30 min after TEA washout (recovery), using antibodies that recognize pSer3-cofilin. The film was then stripped and probed for the total cofilin level using a pan-cofilin antibody. Quantification is shown to the right (p-cofilin/total cofilin (p/t) ratio). The numbers represent the rounds of experiments used to generate the average shown in the bar graph. *P < 0.05 and **P < 0.01 (Mann-Whitney test). (b) Visualization of actin barbed ends and F-actin with and without LTP induction by TEA. Representative images show the double staining of F-actin by Alexa488–phalloidin (green) and actin barbed ends by rhodamine-actin (Rh-actin; red) on dendritic segments without TEA treatment (control), immediately after 10-min TEA treatment (TEA) and 30 min after TEA washout (recovery). Spines enclosed by the boxes were shown in a higher magnification to exhibit the presence of barbed ends in spines. The barbed end signals were pseudocolored in red after applying an intensity threshold and subsequently superimposed on the F-actin images to generate the color panels. Left, quantification revealed that the density of actin barbed ends on dendrites increased after chemical induction of LTP. Right, quantification revealed that the percentage of spines containing actin barbed ends increased after chemical induction of LTP. The numbers represent the number of cells examined in each group. Scale bar represents 5 μm. *P < 0.05 and **P < 0.01 compared with the control (Student’s t test). Error bars represent s.e.m.
BeforeTEA
a AfterTEA
10 minafter TEA
20 minafter TEA
Control
Ser3A
Ser3E
b50
TEA
0 10 20
***
30 (min)
Control (4) Ser3A (6) Ser3E (4)
40
30
20
10
0
–10Cha
nges
in s
pine
siz
e (%
)Figure 7 Effects of different cofilin mutants on TEA-induced spine enlargement. (a) Representative images of dendritic regions from neurons expressing GFP only (control) or with different RFP-cofilin mutants before and after chemical induction of LTP. Arrows indicate spines exhibiting a substantial increase of size after TEA treatment. Scale bar represents 5 μm. (b) Quantification showing the change of spine size at different time points before and after TEA treatment. Over 200 spines in total were analyzed for each group. *P < 0.05 and **P < 0.01 compared with control (ANOVA, Dunnett’s test). Error bars represent s.e.m. Numbers in parentheses indicate the number of cells examined in each group.
TEA 1.2
Nor
mal
ized
p/t-
cofil
in
1.00.80.6
0.20
12
*** *
Control
Control
F-actin
Barbed
Merge
2 min 5 minRecovery
Recovery
TEA
TEA
5 12 70.4
2 min 5 minRecoveryControl
a
b
P-cofilin
T-cofilin
8
6
4
2
020 19 20
RecoveryTEAControlNum
ber
of R
h-ac
tinpu
ncta
per
10
µm *
20
60
40
20
0Per
cent
age
ofsp
ines
w/R
h-ac
tin
19 20
RecoveryTEAControl
**
© 2
010
Nat
ure
Am
eric
a, In
c. A
ll ri
gh
ts r
eser
ved
.
1214 VOLUME 13 | NUMBER 10 | OCTOBER 2010 nature neurOSCIenCe
a r t I C l e S
ratio increased toward the control level (Fig. 8a). A major function of activated ADF/cofilin molecules is to sever existing actin filaments for increased actin dynamics, which generates new barbed ends of actin filaments. We therefore labeled the barbed ends of actin fila-ments in cultured hippocampal neurons before, during and after the 10-min TEA treatment. We found that actin barbed ends were present in untreated cells throughout the dendritic processes, with some local-izing to dendritic spines (Fig. 8b). When the neurons were exposed to TEA for LTP induction, a marked increase in actin barbed ends was observed (Fig. 8b). Quantitative analyses revealed that the number of actin barbed ends was almost doubled by TEA treatment when compared with the control. Notably, the percentage of spines contain-ing actin barbed ends increased about twofold after TEA exposure (Fig. 8b). The level of actin barbed ends returned to normal 30 min after TEA washout, which is consistent with the p-cofilin/total cofilin pattern. Together, these data support the notion that ADF/cofilin becomes transiently activated by dephosphorylation during the 10 min of TEA-induced LTP. The temporal sequence of ADF/cofilin dephosphorylation and phosphorylation coincides with AMPAR insertion and spine enlargement, respectively, and may underlie the changes in postsynaptic receptor trafficking and structure leading to synaptic potentiation.
DISCUSSIONThe actin cytoskeleton is well known for its structural role in den-dritic spine development and plasticity11,12. We found a previously unknown function for the actin cytoskeleton in synaptic receptor traf-ficking during plasticity. Our data indicate that ADF/cofilin-mediated actin dynamics regulate AMPAR trafficking to the postsynaptic sur-face during chemically induced LTP. Using live imaging, we found that, although the integrity of the actin cytoskeleton was essential for the receptor clustering on the postsynaptic surface, actin dyna-mics were required for AMPAR insertion during chemically induced LTP. Notably, we found that ADF/cofilin-mediated actin dynamics regulated AMPAR trafficking during synaptic potentiation: elevated ADF/cofilin activities potentiated, whereas ADF/cofilin inhibition abolished, AMPAR insertion. Furthermore, we found that rapid AMPAR insertion during chemically induced LTP was not directly coupled to the morphological changes of dendritic spines. Instead, spine enlargement elicited by chemical induction of LTP temporally lagged behind the AMPAR insertion. Finally, our data suggest a tempo-ral sequence of ADF/cofilin dephosphorylation and phosphorylation that underlies AMPAR insertion and spine enlargement, respectively. It is thus conceivable that a transient activation of ADF/cofilin by dephosphorylation during chemical induction of LTP generates the actin dynamics required for AMPAR insertion and the subsequent inactivation via phosphorylation enables actin polymerization for spine growth and receptor anchoring and clustering.
The actin cortex in many cells is known to present a physical barrier for vesicle fusion with the plasma membrane28,29. Thus, dynamic remodeling of the cortical actin by ADF/cofilin may be required for vesicular delivery of AMPARs to the surface. However, studies from non-neuronal cells have established that actin actively participates in vesicular trafficking to and from the plasma membrane30. Although our data cannot definitely address the precise role for ADF/cofilin-mediated actin dynamics in AMPAR trafficking during LTP, the effec-tive blockage of AMPAR insertion during induction of LTP by LatA appears to rule out a simply passive role for the actin dynamics. LatA binds to actin monomers to prevent filament assembly and can lead to the disruption of the existing actin cytoskeleton at high concen-trations31. Our finding that LatA at 20 nM or higher concentrations
abolished the insertion of AMPARs (Fig. 3) suggests that actin assem-bly is required for AMPAR insertion during chemically induced LTP. The fact that stabilization of actin filaments by jasplakinolide also blocked AMPAR insertion suggests that actin disassembly might also be required. Our jasplakinolide data are consistent with previous studies in which phalloidin, which stabilizes actin filaments, attenu-ated the LTP magnitude32. Although the ADF/cofilin severing acti-vity can break down the existing actin filaments, it can also generate new barbed ends for further actin polymerization. It is conceivable that ADF/cofilin-mediated actin dynamics may produce two coordi-nated effects on the actin network for AMPAR insertion: temporary removal of the actin cortical barrier followed by promotion of new actin assembly for the vesicular delivery of AMPAR to the surface (Supplementary Fig. 8). Although our preliminary test involving photoactivable GFP-actin suggests an increase in actin turnover in spines during TEA-induced LTP (Supplementary Fig. 9), the valida-tion of this hypothesis and elucidation of the actin mechanisms con-trolling AMPAR trafficking require future experiments that employ high-resolution imaging of the spatiotemporally restricted actin remodeling and vesicle fusion simultaneously.
The spatial organization and dynamics of the actin cytoskeleton in dendritic spines have just begun to be elucidated12. ADF/cofilin is present in dendritic spines and its knockdown affects the actin turn-over and morphology of the spines33. Notably, siRNA knockdown of cofilin 1 appears to reduce mEPSC frequency33, suggesting a potential function for ADF/cofilin in synaptic transmission. Given that cofilin molecules have been found to concentrate in the spine periphery, close to the plasma membrane34, ADF/cofilin-mediated actin dyna-mics could regulate membrane recycling of AMPARs outside of the PSD region. It should be noted that surface addition of AMPARs does not necessarily need to be confined in spines but can occur in extrasynaptic dendritic regions followed by lateral movement into spines35,36. ADF/cofilin-mediated actin dynamics could potentially affect the lateral diffusion of surface AMPARs to contribute to synaptic plasticity as well37. Finally, recent studies have suggested that phos-phorylated cofilin may stimulate phospholipase D1 (ref. 38), which could potentially affect vesicular trafficking of AMPARs through its influence on the membrane. However, our experiments involving actin drugs LatA and jasplakinolide support the notion that inhibition of actin dynamics negatively affects AMPAR insertion during LTP.
Our analyses of AMPAR insertion and spine size indicate that these two events are not directly coupled, which is consistent with an emerging view on the decoupling between spine size and synaptic strength11. Additional support on the decoupling comes from studies involving ADF/cofilin. Increased ADF/cofilin activity is often associ-ated with a reduction in spine size16,18 but could enhance synaptic potentiation in some cases18. On the other hand, numerous studies have documented spine enlargement and actin polymerization after LTP induction8,39,40. Inhibition of cofilin activity by phosphorylation was also observed to accompany spine enlargement during LTP15,17, but SSH knockdown (presumably leading to enhanced ADF/cofilin phosphorylation) impairs AMPAR-dependent synaptic potentia-tion41. The apparent contradictions among these results might be explained by a temporal sequence of ADF/cofilin dephosphorylation and phosphorylation underlying postsynaptic changes in AMPARs and spine size, respectively. Indeed, we found that ADF/cofilin exhib-ited a transient dephosphorylation (activation) during TEA-induced LTP and then recovered to the prestimulation phosphorylation level, which coincides with that of AMPAR insertion and spine enlarge-ment. Given that TEA-induced LTP involves Ca2+ signaling and calcineurin activation42, a temporal pattern of Ca2+ signals might be
© 2
010
Nat
ure
Am
eric
a, In
c. A
ll ri
gh
ts r
eser
ved
.
nature neurOSCIenCe VOLUME 13 | NUMBER 10 | OCTOBER 2010 1215
a r t I C l e S
responsible for the brief ADF/cofilin dephosphorylation followed by phosphorylation. Notably, we found that constitutively active cofilin (Ser3A) enhanced AMPAR insertion, but abolished spine enlarge-ment, whereas the dominant-negative cofilin (Ser3E) blocked AMPAR insertion without affecting spine enlargement. These findings suggest that spatiotemporal regulation of the actin structure and dynamics may support and regulate a sequence of postsynaptic events lead-ing to synaptic potentiation: receptor insertion at extrasynaptic sites, stabilization of the actin network for synaptic capture, anchoring and immobilization of receptors, and spine enlargement through actin polymerization to accommodate the increasing number of receptors on the surface (Supplementary Fig. 8). Our findings are consistent with an increasing number of studies on the active role of actin-based mechanisms in synaptic receptor trafficking43–45. Given that the ADF/cofilin regulation is altered in a number of neurological disorders, including Williams syndrome46, these findings could also shed light on the molecular and cellular mechanisms underlying some of the synaptic defects associated with these disorders.
METhODSMethods and any associated references are available in the online version of the paper at http://www.nature.com/natureneuroscience/.
Note: Supplementary information is available on the Nature Neuroscience website.
AcknowledgmentSThis research was supported by grants from the US National Institutes of Health to J.Q.Z. (GM083889 GM084363, and HD023315), J.R.B. (NS40371), G.C. (NS054858) and H.C.H. (EY014852 and GM60448).
AUtHoR contRIBUtIonSJ.G. performed a majority of the experiments on SEP-GluR1 insertion, C.W.L. contributed to the data on actin dynamics and Y.F. investigated cofilin phosphorylation and its contribution to spine size changes. D.K. performed the initial work on SEP-GluR1 imaging and cofilin regulation. X.T., C.S. and G.C. provided a majority of the electrophysiology data. K.Y. and H.C.H. contributed to the electrophysiological recordings on neurons expressing cofilin mutants. J.R.B. provided all of the cofilin reagents and insights into cofilin mechanisms and functions. J.Q.Z. designed, planned and guided the project and contributed to the image analysis.
comPetIng FInAncIAl InteReStSThe authors declare no competing financial interests.
Published online at http://www.nature.com/natureneuroscience/. Reprints and permissions information is available online at http://www.nature.com/reprintsandpermissions/.
1. Bredt, D.S. & Nicoll, R.A. AMPA receptor trafficking at excitatory synapses. Neuron 40, 361–379 (2003).
2. Collingridge, G.L., Isaac, J.T. & Wang, Y.T. Receptor trafficking and synaptic plasticity. Nat. Rev. Neurosci. 5, 952–962 (2004).
3. Malinow, R. & Malenka, R.C. AMPA receptor trafficking and synaptic plasticity. Annu. Rev. Neurosci. 25, 103–126 (2002).
4. Song, I. & Huganir, R.L. Regulation of AMPA receptors during synaptic plasticity. Trends Neurosci. 25, 578–588 (2002).
5. Yuste, R. & Bonhoeffer, T. Morphological changes in dendritic spines associated with long-term synaptic plasticity. Annu. Rev. Neurosci. 24, 1071–1089 (2001).
6. Nimchinsky, E.A., Sabatini, B.L. & Svoboda, K. Structure and function of dendritic spines. Annu. Rev. Physiol. 64, 313–353 (2002).
7. Segal, M. Dendritic spines and long-term plasticity. Nat. Rev. Neurosci. 6, 277–284 (2005).
8. Matsuzaki, M., Honkura, N., Ellis-Davies, G.C. & Kasai, H. Structural basis of long-term potentiation in single dendritic spines. Nature 429, 761–766 (2004).
9. Park, M. et al. Plasticity-induced growth of dendritic spines by exocytic trafficking from recycling endosomes. Neuron 52, 817–830 (2006).
10. Tada, T. & Sheng, M. Molecular mechanisms of dendritic spine morphogenesis. Curr. Opin. Neurobiol. 16, 95–101 (2006).
11. Cingolani, L.A. & Goda, Y. Actin in action: the interplay between the actin cytoskeleton and synaptic efficacy. Nat. Rev. Neurosci. 9, 344–356 (2008).
12. Hotulainen, P. & Hoogenraad, C.C. Actin in dendritic spines: connecting dynamics to function. J. Cell Biol. 189, 619–629 (2010).
13. Bernstein, B.W. & Bamburg, J.R. ADF/cofilin: a functional node in cell biology. Trends Cell Biol. 20, 187–195 (2010).
14. Van Troys, M. et al. Ins and outs of ADF/cofilin activity and regulation. Eur. J. Cell Biol. 87, 649–667 (2008).
15. Rex, C.S. et al. Different Rho GTPase–dependent signaling pathways initiate sequential steps in the consolidation of long-term potentiation. J. Cell Biol. 186, 85–97 (2009).
16. Zhou, Q., Homma, K.J. & Poo, M.M. Shrinkage of dendritic spines associated with long-term depression of hippocampal synapses. Neuron 44, 749–757 (2004).
17. Chen, L.Y., Rex, C.S., Casale, M.S., Gall, C.M. & Lynch, G. Changes in synaptic morphology accompany actin signaling during LTP. J. Neurosci. 27, 5363–5372 (2007).
18. Meng, Y. et al. Abnormal spine morphology and enhanced LTP in LIMK-1 knockout mice. Neuron 35, 121–133 (2002).
19. Sankaranarayanan, S., De Angelis, D., Rothman, J.E. & Ryan, T.A. The use of pHluorins for optical measurements of presynaptic activity. Biophys. J. 79, 2199–2208 (2000).
20. Lin, D.T. & Huganir, R.L. PICK1 and phosphorylation of the glutamate receptor 2 (GluR2) AMPA receptor subunit regulates GluR2 recycling after NMDA receptor–induced internalization. J. Neurosci. 27, 13903–13908 (2007).
21. Takumi, Y., Ramirez-Leon, V., Laake, P., Rinvik, E. & Ottersen, O.P. Different modes of expression of AMPA and NMDA receptors in hippocampal synapses. Nat. Neurosci. 2, 618–624 (1999).
22. Aniksztejn, L. & Ben-Ari, Y. Novel form of long-term potentiation produced by a K+ channel blocker in the hippocampus. Nature 349, 67–69 (1991).
23. Ashby, M.C., Maier, S.R., Nishimune, A. & Henley, J.M. Lateral diffusion drives constitutive exchange of AMPA receptors at dendritic spines and is regulated by spine morphology. J. Neurosci. 26, 7046–7055 (2006).
24. Allison, D.W., Gelfand, V.I., Spector, I. & Craig, A.M. Role of actin in anchoring postsynaptic receptors in cultured hippocampal neurons: differential attachment of NMDA versus AMPA receptors. J. Neurosci. 18, 2423–2436 (1998).
25. Bubb, M.R., Senderowicz, A.M., Sausville, E.A., Duncan, K.L. & Korn, E.D. Jasplakinolide, a cytotoxic natural product, induces actin polymerization and competitively inhibits the binding of phalloidin to F-actin. J. Biol. Chem. 269, 14869–14871 (1994).
26. Aizawa, H. et al. Phosphorylation of cofilin by LIM kinase is necessary for semaphorin 3A–induced growth cone collapse. Nat. Neurosci. 4, 367–373 (2001).
27. Heredia, L. et al. Phosphorylation of actin-depolymerizing factor/cofilin by LIM-kinase mediates amyloid beta–induced degeneration: a potential mechanism of neuronal dystrophy in Alzheimer’s disease. J. Neurosci. 26, 6533–6542 (2006).
28. Aunis, D. & Bader, M.F. The cytoskeleton as a barrier to exocytosis in secretory cells. J. Exp. Biol. 139, 253–266 (1988).
29. Eitzen, G. Actin remodeling to facilitate membrane fusion. Biochim. Biophys. Acta 1641, 175–181 (2003).
30. Lanzetti, L. Actin in membrane trafficking. Curr. Opin. Cell Biol. 19, 453–458 (2007).
31. Spector, I., Shochet, N.R., Kashman, Y. & Groweiss, A. Latrunculins: novel marine toxins that disrupt microfilament organization in cultured cells. Science 219, 493–495 (1983).
32. Kim, C.H. & Lisman, J.E. A role of actin filament in synaptic transmission and long-term potentiation. J. Neurosci. 19, 4314–4324 (1999).
33. Hotulainen, P. et al. Defining mechanisms of actin polymerization and depolymerization during dendritic spine morphogenesis. J. Cell Biol. 185, 323–339 (2009).
34. Racz, B. & Weinberg, R.J. Spatial organization of cofilin in dendritic spines. Neuroscience 138, 447–456 (2006).
35. Makino, H. & Malinow, R. AMPA receptor incorporation into synapses during LTP: the role of lateral movement and exocytosis. Neuron 64, 381–390 (2009).
36. Heine, M. et al. Surface mobility of postsynaptic AMPARs tunes synaptic transmission. Science 320, 201–205 (2008).
37. Rust, M.B. et al. Learning, AMPA receptor mobility and synaptic plasticity depend on n-cofilin–mediated actin dynamics. EMBO J. 29, 1889–1902 (2010).
38. Han, L. et al. Direct stimulation of receptor-controlled phospholipase D1 by phospho-cofilin. EMBO J. 26, 4189–4202 (2007).
39. Fukazawa, Y. et al. Hippocampal LTP is accompanied by enhanced F-actin content within the dendritic spine that is essential for late LTP maintenance in vivo. Neuron 38, 447–460 (2003).
40. Okamoto, K., Nagai, T., Miyawaki, A. & Hayashi, Y. Rapid and persistent modulation of actin dynamics regulates postsynaptic reorganization underlying bidirectional plasticity. Nat. Neurosci. 7, 1104–1112 (2004).
41. Yuen, E.Y., Liu, W., Kafri, T., van Praag, H. & Yan, Z. Regulation of AMPA receptor channels and synaptic plasticity by cofilin phosphatase slingshot in cortical neurons. J. Physiol. 588, 2361–2371 (2010).
42. Onuma, H. et al. A calcineurin inhibitor, FK506, blocks voltage-gated calcium channel-dependent LTP in the hippocampus. Neurosci. Res. 30, 313–319 (1998).
43. Wang, Z. et al. Myosin Vb mobilizes recycling endosomes and AMPA receptors for postsynaptic plasticity. Cell 135, 535–548 (2008).
44. Schulz, T.W. et al. Actin/alpha-actinin–dependent transport of AMPA receptors in dendritic spines: role of the PDZ-LIM protein RIL. J. Neurosci. 24, 8584–8594 (2004).
45. Lee, C.W. et al. Regulation of acetylcholine receptor clustering by ADF/cofilin-directed vesicular trafficking. Nat. Neurosci. 12, 848–856 (2009).
46. Hoogenraad, C.C., Akhmanova, A., Galjart, N. & De Zeeuw, C.I. LIMK1 and CLIP-115: linking cytoskeletal defects to Williams syndrome. Bioessays 26, 141–150 (2004).
© 2
010
Nat
ure
Am
eric
a, In
c. A
ll ri
gh
ts r
eser
ved
.
nature neurOSCIenCe doi:10.1038/nn.2634
ONLINE METhODSconstructs and reagents. pmOrange and pEGFP-N1 DNA constructs were from Clontech. The mOrange coding sequence was subcloned into pEGFP-N1 vector (with the GFP sequence excised) to allow expression in mammalian cells. The pCi-SEP-GluR1 construct was a gift from R. Malinow (University of California at San Diego). Human cofilin wild-type, Ser3A and Ser3E cDNAs with the stop codon removed by PCR modification were cloned into the pmRFP vector47 as previously described48. The Ser3, pSer3 and rev-Ser3 peptides were synthesized by GenScript and contained 16 amino acids of the N-terminal sequence of cofilin (MASGVAVSDGVIKVFN), the phosphorylated form (MAS(p)GVAVSDBVIKVFN) or in reverse order (NFVKIVGDSVAVGSAM), together with a Penetratin sequence (RQIKIWFQNRRMKWKK). All the pep-tides were used at 20 μg ml−1. Fluorescent secondary antibodies and jasplakino-lide were from Invitrogen. LatA was from Sigma.
Hippocampal neuron culture and transfection. Sprague Dawley timed- pregnant rats were purchased from Charles River Laboratories. Primary hippo-campal neurons were prepared from embryonic day 18 rat embryos and plated on 25-mm coverslips or 35-mm glass bottom dishes pretreated with 0.1 mg ml−1 poly-d-lysine at a density of approximately 350,000 cells per dish. Neurons were plated and maintained in Neurobasal medium supplemented with B-27 and GlutaMax (Invitrogen). Cells were transfected with a Calphos calcium phosphate transfection kit (Clontech) at 14–16 DIV and imaged between 21–23 DIV. All the experiments were carried out in accordance to the US National Institutes of Health guidelines for animal use and were approved by the Institutional Animal Care and Use Committee of Emory University.
live-cell imaging and chemical induction of ltP. Neurons were changed from culture medium to a HEPES buffered recording solution (140 mM NaCl, 5 mM KCl, 2 mM CaCl2, 1.5 mM MgCl2, 10 mM glucose and 25 mM HEPES, pH 7.4). Coverslips with neurons were mounted onto a heating chamber and maintained at 37 °C during imaging. LTP induction medium was a modified recording solu-tion with high calcium (5 mM) and low magnesium (0.1 mM) containing 25 mM TEA (Sigma). After the first image was taken, recording solution was replaced with the LTP induction medium for 10 min before being changed back to record-ing solution. To include spines in different focal planes, we acquired a complete confocal z sectioning of the dendritic region of interest (~12 slices), followed by maximal intensity projection to produce a two-dimensional image. A Nikon C1 laser-scanning confocal system on a Nikon inverted microscope was used for most of the imaging experiments.
electrophysiology. Whole-cell patch-clamp recordings were performed using Multiclamp 700A amplifier (Axon Instruments) as described previously49. Patch pipettes were pulled from borosilicate glass and fire polished (4–6 MΩ). The recording chamber was continuously perfused with HEPES buffered recording solution and switched to LTP induction medium for 10 min. The pipette solution contained 125 mM potassium-gluconate, 10 mM KCl, 5 mM Tris-phosphocrea-tine, 5 mM EGTA, 10 mM HEPES, 4 mM MgATP and 0.5 mM Na2GTP, pH 7.3 adjusted with KOH. The membrane potential was clamped at –70 mV. Data were acquired using pClamp 9 software, sampled at 5 kHz and filtered at 1 kHz. For mEPSC recordings, 0.5 μM TTX and 20 μM bicuculline (or 100 μM picrotoxin) were added to block action potentials and GABAA receptors. Off-line data analy-sis of mEPSCs was performed using MiniAnalysis software (Synaptosoft). Data were expressed as mean value ± standard errors and unpaired Student’s t test was used for statistical analysis, unless otherwise stated.
Quantitative analysis. Three-dimensional image stacks were taken on dendritic regions of a neuron and then projected to two-dimensional images using maximal
intensity. To count the numbers of spines with bright SEP-GluR1 fluorescence, we set the same threshold for both images (before and after chemical induc-tion of LTP) in the green channel to highlight postsynaptic receptor clusters. Then the number of receptor clusters was automatically counted using ImageJ (US National Institutes of Health). The integrated intensity of SEP-GluR1 signal on every spine was also measured in both images to calculate spine ΔF/F0. The sum of SEP-GluR1 signals of all spines in one neuron before and after chemical induction of LTP was used to calculate ΔF/F0 for the entire neuron. For spine size analysis, we measured the integrated intensity of mOrange or GFP signals in the entire spine before and after TEA treatment to detect volume changes of the spine. In Figure 6, we consider any spines showing more than 30% increase of integrated intensity to be enlarged spines and those with more than 30% decrease to be shrunken spines. Spines with changes in integrated intensity under 30% were categorized as having no change in size.
Immunostaining. For surface GluR1 staining, neurons were incubated with antibody to the N terminus of GluR1 (Calbiochem) in recording solution for 20 min at 37 °C, washed with phosphate-buffered saline (PBS), fixed with 4% paraformaldehyde (PFA, wt/vol) and 4% sucrose (wt/vol) in PBS for 20 min, and incubated with appropriate secondary antibody in 1% BSA (wt/vol) for 45 min before imaging. For F-actin labeling, neurons were first fixed for 20 min in 4% PFA before permeabilizing with 0.1% Triton X-100 (vol/vol) in PBS for 10 min and labeling with Alexa 488–phalloidin for 15 min (Invitrogen, 1:1,000).
western blot. We gently washed 21 DIV cultures of hippocampal neurons with the recording solution and then exposed them to the LTP induction medium containing TEA or the recording solution for the specific durations indicated. For the recovery group, the cultures were washed twice with the recording solution after TEA treatment and incubated at 37 °C for an additional 15 or 30 min. After treatment, cells were washed quickly with the recording solution and extracted with lysis buffer on ice (RIPA lysis buffer supplemented with protease inhibitor cocktail (Santa Cruz, SC-24948) and phosphatase inhibitors (Sigma, P2850)). Extracts were dissolved in NuPage sample buffer (Invitrogen) with 50 mM DTT and heated at 85 °C for 5 min. Equal amounts of protein were loaded and frac-tioned by SDS-PAGE in a 12% acrylamide gel and subsequently transferred to nitrocellulose membrane. Membranes were treated with 5% milk (wt/vol) in PBS buffer with 0.05% Tween-20 (vol/vol) and then blotted with primary antibody to cofilin (Abcam, ab42824, 1:1,000) or phospho-cofilin (Abcam, ab12866, 1:1,500). Bounded antibodies were detected by horseradish peroxidise–conjugated second-ary antibody (Jackson ImmunoResearch), visualized by chemiluminescence using ECL (Pierce) and quantified using the gel analysis routine of ImageJ.
Visualization of actin barbed ends. Free F-actin barbed ends were labeled with 0.45 μM rhodamine-conjugated G-actin (cytoskeleton) for 2 min in the saponin permeabilization solution (20 mM HEPES, 138 mM KCl, 4 mM MgCl2, 3 mM EGTA, 0.2 mg ml−1 saponin, 1 mM ATP and 1% BSA, pH 7.5)50. The labeled neurons were then immediately fixed with 4% PFA in PHEM buffer (60 mM PIPES, 25 mM HEPES, 10 mM EGTA, 2 mM MgCl2 and 0.12 M sucrose, pH 7.0) and labeled with phalloidin as described above.
47. Campbell, R.E. et al. A monomeric red fluorescent protein. Proc. Natl. Acad. Sci. USA 99, 7877–7882 (2002).
48. Flynn, K.C., Pak, C.W., Shaw, A.E., Bradke, F. & Bamburg, J.R. Growth cone-like waves transport actin and promote axonogenesis and neurite branching. Dev. Neurobiol. 69, 761–779 (2009).
49. Deng, L. et al. Sequential postsynaptic maturation governs the temporal order of GABAergic and glutamatergic synaptogenesis in rat embryonic cultures. J. Neurosci. 27, 10860–10869 (2007).
50. Schafer, D.A. et al. Visualization and molecular analysis of actin assembly in living cells. J. Cell Biol. 143, 1919–1930 (1998).
© 2
010
Nat
ure
Am
eric
a, In
c. A
ll ri
gh
ts r
eser
ved
.


![Review Actin-targeting natural products: structures ... · actin-binding proteins actively break or ‘sever’ actin filaments [e.g. actin-depolymerizing factor (ADF) and cofilin]](https://img.pdfslide.us/doc/110x75/5f0f85bd7e708231d44494d0/review-actin-targeting-natural-products-structures-actin-binding-proteins-actively.jpg)