Embed Size (px)
Citation preview

Accounting Conservatism and Bankruptcy Risk
Gary C Biddle Mary L Z Ma Frank M Song Faculty of Business and Economics
The University of Hong Kong
June 26 2011
Abstract
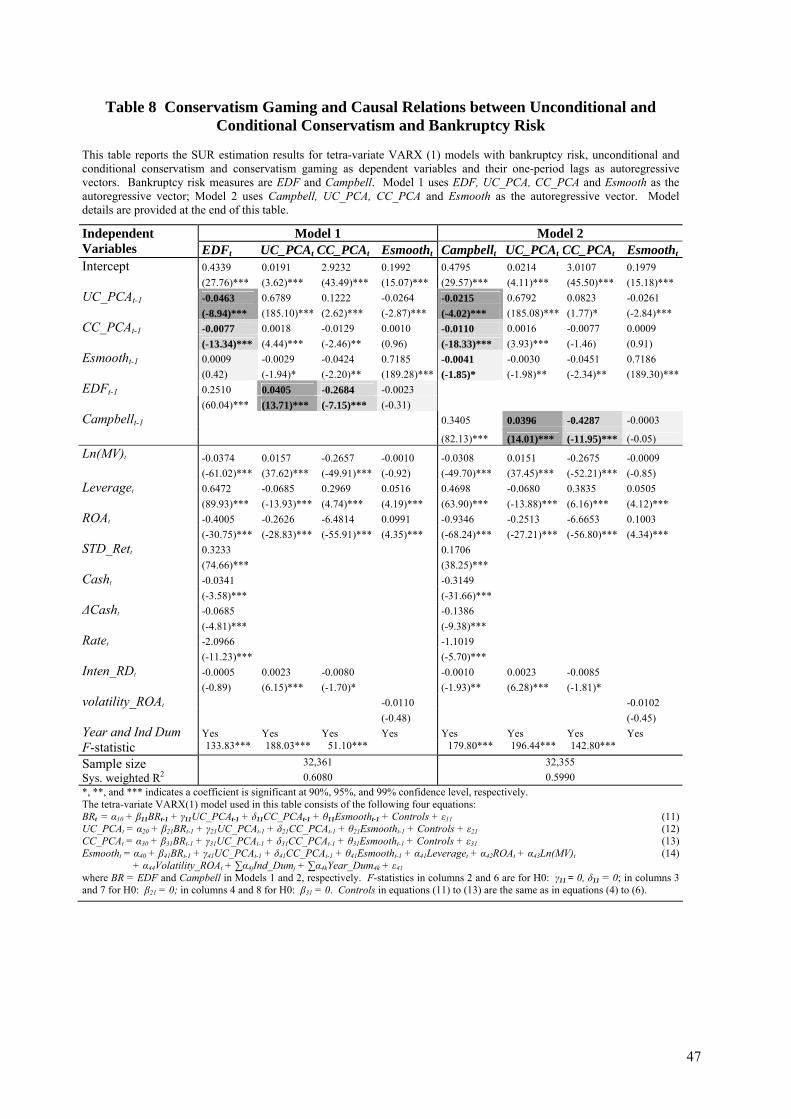
This study examines relations between accounting conservatism and bankruptcy risk and we present evidence that unconditional and conditional conservatism help mitigate subsequent bankruptcy risk via their cash enhancing and informational properties Bankruptcy risk is in turn positively associated with subsequent unconditional conservatism and negatively associated with subsequent conditional conservatism reflecting regulator and auditor monitoring and managerial career motives These findings are robust to endogeneity between unconditional and conditional conservatism conservatism gaming extreme distress and actual bankruptcy Combined our results suggest that accounting conservatism both influences and is influenced by bankruptcy risk thus lending support to a traditional rationale for conservatism and helping inform continuing deliberations regarding conservatismrsquos ongoing role as a pervasive and enduring tenet of financial accounting
JEL Classification M41 G32 G33
Keywords accounting conservatism bankruptcy risk unconditional conservatism conditional conservatism
Contact author Mary L Z Ma Email mlizhihkuhk Telephone number (852) 2241-5003
Gary C Biddle Email biddlehkuhk Telephone number (852) 2219-4388 Frank M Song Email fmsonghkuhk Telephone number (852) 2857-8507
This study derives from Mary Marsquos dissertation research at the University of Hong Kong We thank for their helpful advice and suggestions Sudipta Basu Kevin Chen Jinchuan Duan Dan Givoly Jens Hilscher Kai Wai Hui Mozaffar Khan Jeong Bon Kim Anya Kleymenova Stephannie Larocque Amy Lau Ningzhong Li Xiaohong Liu Zheng Liu Yuri Loktionov Chul Park Stephen Penman Xinrong Qiang Lakshmanan Shivakumar Anup Srivastava Zhigang Tao Kun Yu Li Zhang Mingshan Zhang Xiaojun Zhang and workshop participants at Chinese University of Hong Kong City University of Hong Kong University of Hong Kong Hong Kong University of Science and Technology London Business School Moscow School of Management National University of Singapore National Taiwan University Ohio State University University of Washington Xiamen University and Yale University We also thank discussants and participants at the American Accounting Association Annual Meetings in San Francisco the Financial Accounting Section Meetings in Tampa and an anonymous referee We further appreciate research support from the Asian Case Research Center at the School of Business and the Computer Lab at the School of Economics and Finance of the University of Hong Kong Any errors remain our responsibility
2
Accounting Conservatism and Bankruptcy Risk
1 Introduction This study examines relations between accounting conservatism and bankruptcy risk
Our results reveal negative associations between both unconditional and conditional
conservatism and subsequent bankruptcy risk that follow from conservatismrsquos accrual nature
cash enhancing and informational properties Bankruptcy risk is found to be positively related
to subsequent unconditional conservatism consistent with auditor and regulator incentives and
negatively related to subsequent conditional conservatism consistent with offsetting
managerial incentives to withhold bad news Overall our findings lend support to a traditional
economic rationale for accounting conservatism that will help inform ongoing debates
regarding its continuing role as a central tenet of financial accounting
Whereas historical evidence indicates that accounting conservatism arose at least a
millennium ago in response to demands by capital providers to inform lending and liquidation
decisions and potentially reduces failure risk (De Ste Croix (1956) Watts (2003) Basu
(2009)) prior empirical evidence is mixed Some studies find conservatism to reduce debt
costs (and by inference bankruptcy risk)1 Others find positive relations between conservatism
and debt covenant violations (eg DeAngelo et al (1994) DeFond and Jiambalvo (1994)
Sweeney (1994) and Zhang (2010)) suggests that conservatism are positively correlated with
bankruptcy risk Jones (2011) document that RampD capitalization increases corporate failure
implying that RampD expensing mitigates corporate failure However RampD expensing is an
extreme form of unconditional conservatism and its evidence cannot be readily generalized to
other types of unconditional and conditional conservatism Hence relations between
accounting conservatism and bankruptcy risk still wait to be explored
Evidence that accounting conservatism lowers bankruptcy risk is central to the interests
of debtholders and other stakeholders including shareholders (dividends and capital gains)
managers and employees (career and compensation) customers (products and services)
suppliers (sales) auditors and regulators (compliance) and governments (tax revenues) It is
also a precursor to assessing conservatismrsquos role in dampening economic panics and crises
with significant implications for economic policy making Recent financial crises have
heightened interest in mechanisms that promote cash adequacy and solvency given the
1 Zhang (2008) for example documents that conservatism can help lower initial interest rates in lending contracts Ahmed and Duellman (2002) Wittenberg-Moerman (2008) and Li (2010) document that accounting conservatism reduces the carrying costs of debt Hui et al (2009b) document that suppliers prefer customers with conservative reporting
3
contagion effects of bankruptcy risk within industries along the supply chains and between
nonfinancial and financial sectors2
Evidence regarding relations between accounting conservatism and bankruptcy risk will
also help inform ongoing debates regarding conservatismrsquos continuing role as both a pervasive
characteristic and longstanding tenet of financial accounting In Statement of Financial
Accounting Concepts (SFAC) No 2 the Financial Accounting Standards Board (FASB)
defined conservatism as ldquoa prudent reaction to uncertainty to ensure that uncertainty and risks
inherent in business situations are adequately consideredrdquo (FASB (1980) p 10) This
definition is consistent with conservatism being relevant to assessing bankruptcy risk
However the FASB and the International Accounting Standards Board (IASB) removed
conservatism from their conceptual framework in 2010 because it violates neutrality3 In its
exposure draft for the Conceptual Framework for Financial Reporting (FASB (2008)) the
FASB argued that conservatism may produce information asymmetries that reduce investor
insights into future cash flows from growth options4 In contrast Kothari et al (2010) argue
that the broader economic consequences of accounting standards are of first-order significance
while their role in equity valuation is of secondary significance
Recent studies distinguishing between unconditional and conditional conservatism
motivate a further examination of whether these two types of conservatism relate to bankruptcy
risk differently (Beaver and Ryan (2005) Qiang (2007) Ball et al (2009)) They observe that
conservatism can arise either ldquounconditionallyrdquo via inherently conservative accounting
principles or ldquoconditionallyrdquo via a more timely recognition of bad versus good news Their
evidence suggests that unconditional and conditional conservatism can play different roles in
contracting regulation taxation valuation and in reducing information asymmetries (Qiang
(2007 2008)) and that they are negatively (positively) correlated in the short (long) run
(Beaver and Ryan (2005) Roychowdhury and Watts (2007) Ball et al (2009)) They further
suggest that auditors and regulators focus primarily on unconditional conservatism litigation
risk induces both and that managers exercise more control over conditional conservatism at
2 Specifically Lang and Stulz (1992) document ldquocontagiousrdquo valuation effects of bankruptcy announcements within the same industry Hertzel et al (2008) show that bankruptcy filings generate wealth effects for suppliers and customers along the supply chain and Jorion et al (2009) provide evidence regarding credit contagions via counter-party effects suggesting that borrowing firmsrsquo bankruptcy announcements cause negative abnormal equity returns and increase credit default swap spreads among creditors 3 The FASBrsquos Conceptual Framework defines and describes basic concepts by which financial statements are prepared and identifies qualitative characteristics that make information in financial statements useful It serves as a guide to the Board in developing accounting standards and in resolving accounting issues not addressed directly by an existing standard The IASB has a corresponding Conceptual Framework These frameworks were combined into a unified set of accounting concepts and principles in SFAC No 8 (FASB 2010) 4 Similarly Penman and Zhang (2002) and Lev et al (2005) present evidence that the expensing of research and development costs reduces the value relevance of accounting information and causes market mispricing
4
least in the short run preferring counter-conservative treatments for career advancement (Watts
(2003) Qiang (2007) Kothari et al (2010)) Thus this study examines causal relations
between both unconditional and conditional conservatism and bankruptcy risk
That conservatism should influence subsequent bankruptcy risk is suggested by recent
studies of its cash enhancing and informational properties Specifically they find that
accounting conservatism reduces cash outflows by mitigating capital overinvestment reducing
risk-shifting delaying economic losses promoting precautionary savings and lowering agency
costs (Lara et al (2010a) Callen et al (2010) Kirschenheiter and Ramakrishnan (2010)
Srivastava and Tse (2010)) Others find conservatism increases cash inflows from operations
by evoking more favorable terms from trading partners and by reducing investment distortion
(Hui et al (2009b) Lara et al (2010a) Bushman et al (2010)) These cash enhancing
properties of conservatism should reduce subsequent bankruptcy risk since bankruptcy is
fundamentally a condition of cash insufficiency (Kim et al (1993) Uhrig-Homburg (2005)
Campbell et al (2008)
Recent evidence further suggests that conservatism lessens information uncertainty and
asymmetry via less optimistic reporting of net income and assets and more timely reporting of
bad news (Watts (2003) Guay and Verrechia (2007)) This informational role of conservatism
also enhances cash flows and reduces bankruptcy risk as better informed investors and trading
partners provide more favorable financing and contracting terms Under conditions of distress
conservatism facilitates negotiations and workouts among creditors equity holders trading
partners labor unions and other claimholders thus helping avoid bankruptcy filings
(Giammarino (1989) Mooradian (1994)) The cash-enhancing and informational properties of
conservatism suggest negative causal relations between both unconditional and conditional
conservatism and subsequent bankruptcy risk
That bankruptcy risk influences subsequent conservatism follows from the reasoning that
higher bankruptcy risk induces conservative treatments that enahnce cash and reduce
information uncertainty thereby reducing future bankruptcy risk Auditors and regulators pay
particular attention to unconditional conservatism as bankruptcy risk increases because
unconditional conservatism is is easy to monitor is the major contributor to total
conservatism and is not bad-news-driven ((Ryan (2006) and Qiang (2007)) In contrast
managers on average resist both unconditional and conditional conservatism to advance their
careers and to justify spending and portray more favorable performance especially when
bankruptcy risk increases and their ability to do so is stronger for conditional conservatism
The equilibrium tradeoff between the tension between auditorsrsquo and regulatorsrsquo interests and
5
managersrsquo career motives as bankruptcy risk increases suggest that bankruptcy risk is
positively associated with subsequent unconditional conservatism and negatively associated
with subsequent conditional conservatism
These predictions are tested using US firm-year observations for the period 1989-2007
with available data for unconditional and conditional conservatism bankruptcy risk and control
variables Two of the three bankruptcy risk measures are continuous ex ante estimates derived
from Merton (1974) and Campbell et al (2008) respectively that permit tests of causal
relations between accounting conservatism and bankruptcy risk The third measure is an ex
post discrete (zero-one) indicator of actual bankruptcy filings Four measures of unconditional
conservatism are considered total accruals (adapted from Ahmed and Duellman (2007)) rank
of industry-adjusted book-to-market ratio (eg Ahmed et al (2002) Zhang (2008)) hidden
reserves (Penman and Zhang (2002)) and a factor score from a principal components analysis
of the above three metrics Four measures of conditional conservatism are likewise examined
accumulated non-operating accruals adapted from Zhang (2008) an extended measure of Khan
and Watts (2009) a CR ratio measure adapted from Callen et al (2010a) and a factor score
from a principal component analysis of the above three metrics We mainly employ tri-variate
VARX (1) and tri-variate VARX (3) models to examine causal relations between conservatism
and bankruptcy risk extending Lara et al (2009)
Our main results confirm the above predictions (1) Unconditional and conditional
conservatism are negatively associated with subsequent bankruptcy risk consistent with
conservatismrsquos cash enhancement and informational properties serving to mitigate bankruptcy
risk (2) Bankruptcy risk is positively associated with subsequent unconditional conservatism
consistent with auditorsrsquo and regulatorsrsquo interests and negatively associated with subsequent
conditional conservatism consistent with countervailing managerial incentives to withhold bad
news to advance their careers (3) These findings are similar for extremely distressed firms and
for firms that actually declare bankruptcy
In further analyses we use VARX (1) models with interactions of conservatism and cash
holdings or information risk to examine separately whether the cash enhancing and
informational roles of conservatism help to mitigate bankruptcy risk We also use VARX (1)
model with interactions of bankruptcy risk and indicators of post-SOX or indicators of post-
auditor-resignation to examine whether auditorsrsquo and regulatorsrsquo monitoring enhances
unconditional conservatism as bankruptcy risk increases The findings support the assertions
that both the cash enhancing and informational roles of conservatism help mitigate bankruptcy
risk and that monitoring by auditors and regulators increases subsequent unconditional
6
conservatism as bankruptcy risk increases These results are robust to endogeneity between
unconditional and conditional conservatism extreme distress actual bankruptcy conservatism
gaming debt contracting considerations earnings management alternative measures for
unconditional and conditional conservatism and bankruptcy risk and other control variables
The remainder of the study is organized as follows Section 2 details the conceptual
framework and hypotheses to be tested Section 3 describes the data and test methodologies
Section 4 presents empirical results and Section 5 concludes Appendices A and B describe
results of bi-variate VARX (1) models Variable definitions are presented in Table 1
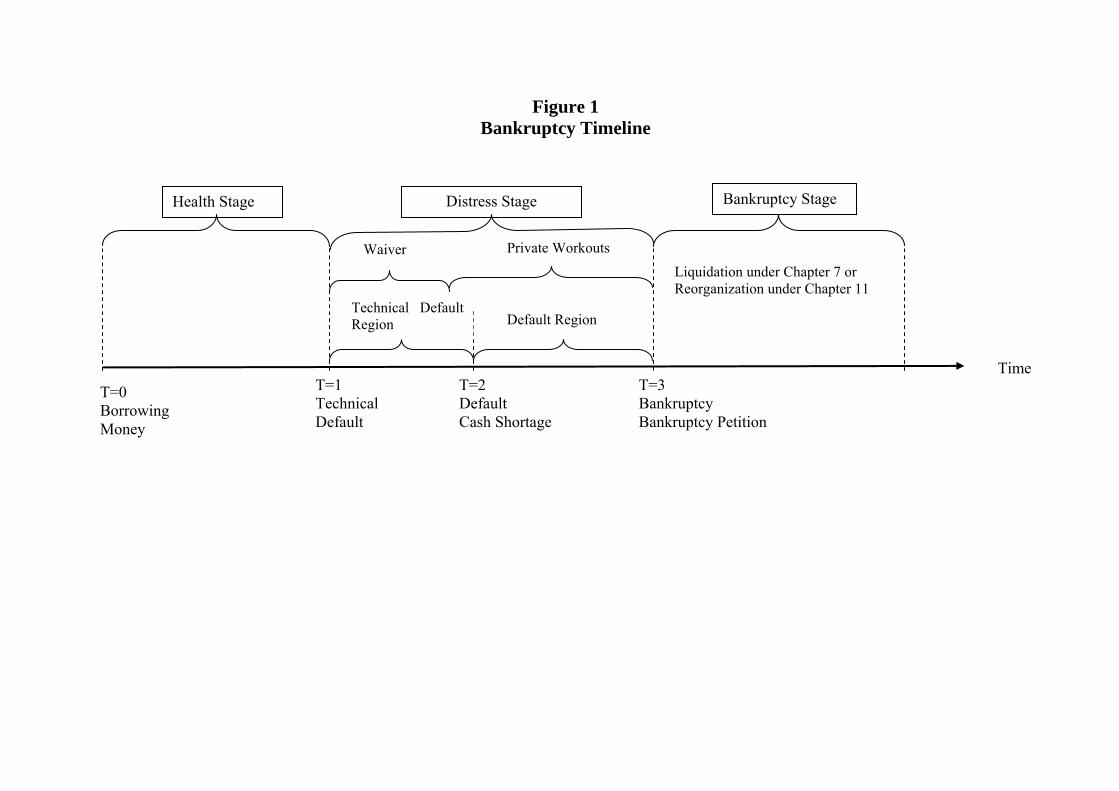
2 Theoretical Framework Figure 1 depicts the continuum along which firms evolve from financial health to
debtholder-triggered bankruptcy Accounting conservatism by definition reduces net income
and net assets but not cash flows and balances by increasing both operating cash flows (OCF
hereafter) and access to capital Bankruptcy in contrast is fundamentally a cash rather than
income condition A firm can operate indefinitely with reduced or even negative net income
without entering either default (Figure 1 T = 2) or bankruptcy (Figure 1 T = 3) so long as
cash remains available from some source(s) to meet rising obligations5 Anecdotal evidence of
firms that were not conservative and failed for example AIG and GM 6 suggest that
accounting conservatism can operate directly in both ldquohealthrdquo and ldquodistressrdquo stages (Figure 1 T
= 0 1) and even in the ldquodefaultrdquo stage (Figure 1 T = 2) to enhance cash and transparency
regarding net assets and net income thereby helping avert progressions into ultimate
conditions of default or bankruptcy Alternatively conservatism accelerates technical defaults
(Zhang (2008)) which appear to increase default and bankruptcy risk However Nini et al
(2009) documents that technical defaults trigger increased monitoring by capital providers who
impose capital expenditure restrictions that increase cash flows suggesting that conservatism
increases cash We next elaborate on the cash enhancing property of accounting conservatism
as they relate to bankruptcy risk 5 While certain creditors would monitor broader definitions of funds than cash such as working capital they ultimately are interested in the cash that working capital provides Indeed a firm with ample working capital can be bankrupt due to cash insufficiency if its working capital is comprised of uncollectible receivables and illiquid inventories Whereas accrual measures are often included in debt covenants they serve as ldquored flagsrdquo to bring to the attention of capital providers a condition of financial distress with actual bankruptcy determined by the ongoing availability of cash 6 Before the 2009 financial crisis AIG insured financial institutions but did not accrue related contingent liabilities When the financial crisis arose AIG experienced large losses and would have been forced into bankruptcy without a government bailout Similarly before 2007 subsequently bankrupt GM reported pension assets and liabilities as off-balance-sheet items under SFAS No 87 rather than as contingent liabilities following SFAS No 5 since before 2007 SFAS No 87 gave firms the option to report estimated net pension liabilities in footnotes to their financial statements as an exception to the more conservative treatment in SFAS No 5 Although we cannot assert from these anecdotal examples that greater accounting conservatism would have provided more cash for these firms thereby averting their bankruptcies their experiences are consistent with our predictions regarding relations between conservatism and bankruptcy risk developed below
7
21 The Cash Enhancing Role of Accounting Conservatism Conceptual constructs analytical modeling and evidence suggest that accounting
conservatism enhances cash availability by both increasing cash inflows and reducing cash
outflows Conservatism increases cash inflows by promoting precautionary savings reducing
cost of capital alleviating underinvestment and increasing OCFs Kirschenheiter et al (2010)
argue analytically that prudent decision makers prefer more conservative accounting to
facilitate decisions regarding precautionary savings as future cash inflows become riskier
thereby increasing (reducing) cash holdings (expenditures) Ahmed and Duellman (2002)
Lara et al (2010b) and Li (2010) document that conservatism lowers the cost of capital makes
external financing easier and increases cash flows from financing 7 Increased external
financing by conservatism mitigates capital underinvestment and enhances future OCF Hui et
al (2009b) argue that within some range conservatism is helpful for obtaining more lenient
contracting terms from other providers of factors of production which has the effects of
increasing OCF In a more general setting BMS (2011b) document that both unconditional
and conditional conservatism mitigate future OCF downside risk thus increasing future OCF
and its upside potential
Conservatism reduces cash outflows by discouraging cash disbursements reducing cash
wastage and lowering agency costs associated with cash holdings By delaying the recording
of net income and net assets conservatism reduces or defers cash expenditures for
performance-based compensation taxation and dividends (Watts (2003)) Biddle (1980) and
Callen et al (2010b) provide confirming evidence that LIFO firms reduce taxes by adopting
and subsequently managing inventories and that conservatism discourages or defers dividends
payout respectively Cash wastage and loss arise from perquisite consumption by managers
and investments in negative net present value projects especially when cash flows are
unconstrained Consistently Lara et al (2010b) argue that conditional conservatism increases
managerial incentives to avoid suboptimal investments ex ante and to abandon loss projects
quickly ex post (see also Srivastava and Tse (2010)) Bushman et al (2010) and Francis and
Martin (2010) report that timely loss recognition curbs over-investment in cross-country
settings and in acquisition settings respectively Loktionov (2009) argues that in distressed
firms conditional conservatism reduces risk-shifting in investment projects by speeding up
technical defaults timely signaling bad news and by reducing information asymmetries A
7 Ahmed and Duellman (2002) provide evidence that conservatism increases the debt ratings of borrowers which has the effect of reducing cash outflows as interest expenses as confirmed by Zhang (2008) Lara et al (2010a) argue and provide consistent evidence that conservative accounting can also reduce the cost of equity capital Li (2010) provides evidence that conservatism reduces the cost of both debt and equity capital in a cross-country comparison
8
similar reasoning extends to unconditional conservatism Louis et al (2009) further argue ans
document that timely losses reporting helps control value-destroying agency costs associated
with increased cash holdings
Ultimately the cash enhancing role of conservatism helps mitigate bankruptcy risk
because bankruptcy is fundamentally a condition of cash insufficiency as suggested by theories
and evidence in finance Kim et al (1993) Anderson and Sundaresan (1996) Uhrig-Homburg
(2005)) model bankruptcy as debt default triggered when cash flows available for payouts fall
below required debt service payments and Campbell et al (2008) provide confirming evidence
that prior cash holdings are negatively associated with default risk over various prediction
horizons from one month to three years Biddle et al (2011) provide evidence that both
unconditional and conditional conservatism are positively associated with the level and upside
potentials of cash holdings Thus the cash enhancing role of conservatism operates to both
increase internal cash flow generation and discourage or delay cash outflows thereby
decreasing bankruptcy risk
22 The Informational Role of Accounting Conservatism Prior research suggests that unconditional and conditional conservatism play an
informational role in decreasing information uncertainties and asymmetries by constraining
upward overstatement biases in net income or assets (Watts (2003) Li (2008)) and by timely
revealing bad news (Lafond and Watts (2008) Wittenberg-Moerman (2008)) respectively
Guay and Verrecchia (2007) and Gox et al (2009) suggest that conservative reporting
decreases information uncertainty In particular Guay and Verrecchia (2007) argue that
disclosing lower-end realizations of firm value via ex ante commitments to conservative
reporting promotes voluntary disclosures of higher-end realizations thereby promoting fuller
disclosures regarding cash flows and improving information precision and Gox et al (2009)
focus on one specific types of conditional conservatism and argue that impairment rules
increases information precision Watts (2003) and Qiang (2008) suggest that both
unconditional and conditional conservatism reduce information asymmetry between firms and
investors regarding asset values Hui et al (2009a) find that both unconditional and
conditional conservatism substitute for managerial forecasts in reducing information
asymmetry and information uncertainty
The informational role of accounting conservatism reduces bankruptcy risk indirectly by
supplementing its cash enhancing role By reducing information uncertainties and
asymmetries conservatism reduces adverse selection costs and risks to investors and the cost
of equity and debt capital increasing cash availability from external sources when firms
9
approach default (Figure 1 Stages 0 1 and 2) For firms that have entered into conditions of
distress (Figure 1 Stages 1 and 2) the informational properties of conservatism help avert
rightward progressions into bankruptcy by encouraging creditors other capital providers and
the borrowing firm to work more cooperatively with each other to avoid a bankruptcy filing at
least in the case of unconditional conservatism Varied finance theories suggest that less
information asymmetry facilitates debt renegotiations and reduces bankruptcy filings In
particular low information asymmetry stimulates bargaining and multiple reorganization plans
(Carapeto (2005)) helps to renegotiate their debts privately (Chen (2003)) and reduces
bankruptcy filings by creditors (Giammarino (1989) and Mooradian (1994)) Similar
arguments apply to information uncertainty Thus with improved transparency regarding
income and asset values via conservatismrsquos informational role creditors and other capital
providers can be more confident regarding the reliability of firmsrsquo financial conditions and
more willing to renegotiate debts and terms thereby reducing the chances of default resolution
via bankruptcy filings (Figure 1 Stage 3)
23 Relations between Accounting Conservatism and Subsequent Bankruptcy Risk Both the cash enhancing role and the informational roles of accounting conservatism
suggest that unconditional and conditional conservatism lower subsequent bankruptcy risk by
increasing subsequent cash holdings and flows and by facilitating the avoidance of formal
bankruptcy filings by firms that enter into financial distress This reasoning leads to the
prediction that both unconditional and conditional conservatism will be negatively related to
subsequent bankruptcy risk
H1a Unconditional conservatism is negatively associated with subsequent bankruptcy risk consistent with the cash enhancing and informational roles of conservatism
H1b Conditional conservatism is negatively associated with subsequent bankruptcy risk consistent with the cash enhancing and informational roles of conservatism
24 Relations between Bankruptcy Risk and Subsequent Accounting Conservatism
If unconditional and conditional conservatism are negatively associated with subsequent
bankruptcy risk as predicted by hypotheses H1a and H1b it follows that high bankruptcy risk
could generate demands for subsequent conservatism 8 However associations between
bankruptcy risk and subsequent conservatism may differ between unconditional and
conditional conservatism due to the countervailing interests of managers auditors and
8 Conceptually changes in conservatism are natural responses to increased bankruptcy risk and other risk dimensions which suggest that both unconditional and conditional conservatism change over time as risks in firmsrsquo environments change In a practical sense GAAP allows flexibility over time in applying accounting policies and estimates and firms do explore this flexibility
10
regulators Auditors regulators shareholders generally prefer more conservatism as financial
distress increases but shareholders and their collective-actions lawsuits focus on both
unconditional and unconditional conservatism and thus do not significantly impact the
differential demand for both Nonetheless auditors and regulators focus more on unconditional
than conditional conservatism because unconditional conservatism is more frequent is the
major contributor to total conservatism is not conditioned on bad news and involves less bad
news ldquoshocksrdquo that auditors and regulators may wish to avoid especially as bankruptcy risk
increases (Qiang (2007)) Especially as bankruptcy risk increases auditors and regulators
monitor more intensely and also require higher level of unconditional conservatism As a
result managers will face higher discipline costs for not applying unconditional conservatism
such costs include litigation liabilities regulatory penalties embarrassment and loss of
reputation for ldquocooking booksrdquo
In contrast managers generally prefer less unconditional and conditional conservatism
because conservatism understates earnings and assets timely reports bad news which is
particularly counter to managersrsquo career motives such as career advancement compensation
perquisites pet investment and other opportunistic expenditures Managers of distressed
firms have strong incentives to overstate earnings and withhold and defer the reporting of bad
news at least until performance improves or they secure alternative employment (Kothari et al
(2009) Kothari et al (2010)) Conditional conservatism accords managers more flexibility
and discretion regarding when and how to report bad news (Qiang (2007) Kothari et al
(2010)) partly due to the practical difficulty associated with a real-time monitoring of
conditional conservatism which would require continual active participation in reporting
decisions that would be costly for auditors and regulators to staff except for periodic ex post
reviews (Qiang (2007)) Therefore managers prefer to reduce conditional conservatism as
bankruptcy risk increases The analysis leads to the following hypotheses
H2a Bankruptcy risk is positively associated with subsequent unconditional conservatism
H2b Bankruptcy risk is negatively associated with subsequent conditional conservatism
3 Data Sources Sampling Measurements and Models 31 Data and Sampling
This study utilizes a pooled sample of firm-year observations from NYSE AMEX and
NASDAQ for fiscal years 1989 through 2007 Data were retrieved from a combination of
three data sources available via the Wharton Data Research Service (WDRS) Compustat
CRSP and the Federal Reserve Bank Reports Ex ante bankruptcy risk measures EDF from
11
Merton (1974) and Campbell following Campbell et al (2008) are estimated using CRSP and
Compustat data Ex-post-bankruptcy risk measure BANK indicator of firms that actually
declared bankruptcy is obtained from wwwbankruptcydatacom Firm-year observations with
missing values for conservatism bankruptcy risk stock price total assets and net income
before extraordinary items are omitted Since young firms have high bankruptcy risk and thus
survival bias can significantly influences sampling and results we include as much young
firms as possible by setting the minimum requirement for calculating accrual-based
conservatism measures as having prior two years and for using the one-period lag
specifications for VARX models so that only firms with less than three-year histories are
excluded We further omit post-bankruptcy firm-year observations for firms filing under
Chapter 11 of the US Bankruptcy Code since these observations may be incomparable with
pre-bankruptcy data To reduce the effects of outliers observations in the top and bottom 1
of the major variables are winsorized and firms in financial industries (SIC codes 6000-6999)
are excluded The final sample is comprised of 34897 firm-year observations for 4621 firms
32 Measures for Bankruptcy Risk Bankruptcy risk is measured as the probability that a firm will liquidate under Chapter 7
or reorganize under Chapter 11 of the US Bankruptcy Code which are conditions typically
triggered when firms cannot service their rising cash obligations Varied bankruptcy risk
measures have been previously estimated using both structural and restrictive form models
among which we choose Mertonrsquos (1974) EDF and Campbell score (Campbell et al (2008))
(2008) as bankruptcy risk metrics in the main tests in terms of predictive ability and freedom of
estimation bias caused by accounting conservatism EDF measure is estimated from a
structural model it has superior predictive ability (Hillegerst et al (2004)) and is less subject
to conservatism bias since its only accounting input is the face value of debt The Campbell
score is estimated from a restrictive form model it t has the best predictability for bankruptcy
risk among all available metrics (Campbell et al (2008)) and is less subject to conservatism
bias than accounting-based restrictive form model such as such as Altmanrsquos (1968) Z-score
(except as a robustness check) Olsonrsquos (1980) O-score and Zmijewskirsquos (1984) Z-score Both
EDF and Campbell are ex ante bankruptcy risk measure to provide a measure that is free of
estimation error we also employ an ex post bankruptcy risk measure BANK the indicator of
actual bankruptcy The three measures are detailed below
EDF EDF is the ranked probability that firmrsquos asset value will fall below its liabilities
after T years (T = one year in this study) assuming that the firmrsquos asset value (continuous rate
of growth in assets) is log-normally (normally) distributed Merton (1974) EDF is an option-
12
based structural model that expresses a firmrsquos market value (VE) as a call option on the firmrsquos
assets (VA) with a strike price equal to the face value of debt and time to expiration equal to T
Applying the Black and Scholes (1973) formula and Itorsquos lemma to Merton (1974) model we
estimate EDF as
EDFt = prob-[ln(VAt Xt) + (μ - 05σA2)T] (σAT12) ge εt+T (1)
= N(-(ln(VAt Xt) + (μ - 05σA2)T) (σAT12))
where N is the cumulative density function of the standard normal distribution X is the face
value of a firmrsquos debt σA is the volatility of a firmrsquos assets and μ is the instantaneous drift
assuming the firmrsquos market value follows Geometric Brownian Motion Its intuition is that the
probability that a firmrsquos assets are insufficient to pay the face value of its debt increases with
the firmrsquos debt and asset volatility and decreases with the firmrsquos assets Further details
regarding the estimation of EDF are available on request
The Merton (1974) model has strict assumptions for example it assumes that market is
efficient and information is complete 9 In this study we relax this assumption and allows
accounting conservatism to impact EDF through the accounting input leverage ratio
Conservatism facilitates external financing and increases the leverage ratio the strike price in
the Merton (1974) model and this may lead to an overestimate of EDFt However this is not a
serious issue because this bias runs counter to the predictions of all hypotheses except H2a
Thus if the empirical results for H1a H1b and H2b are as predicted the true results should be
stronger than those reported
Campbell Campbell is the ranked probability of a firm declaring bankruptcy one month
ahead It is estimated using a logit model based on monthly stock market variables and
quarterly accounting variables following the formula in the last column of Table III in
Campbell et al (2008) We estimate the Campbell for each fiscal quarter as follows and use
the Campbell for the last fiscal quarter in our main tests
Campbellt = exp(tempt) (1 +exp(tempt)) (2)
where tempt = -908 - 2967 NIMTAVGt + 336 TLMTAt - 735 EXRETAVGt + 148
SIGMAt + 0082 Rsizet - 240 CASHHMTAt + 0054 MBt - 0937 PRICEt The intuition
for Campbell is that bankruptcy risk decreases with the predictability of market-based
profitability (NIMTAVG) the predictability of excess return relative to SampP 500 index
9 Other relevant assumptions include (1) creditors and managers have symmetric information about firm value and can observe the inputs into the model (2) default occurs when a firmrsquos asset value drops below its debt obligations at the time of maturity (3) the default barrier is the exogenously determined fixed face value of debt and (4) the asset value follows a diffusion process without jumps
13
(EXRETAVG) the market-based liquidity ratio (CASHHMTA) and the stock price (PRICE)
Bankruptcy risk increases with the market-based leverage ratio (TLMTA) the stock return
volatility (SIGMA) the market-to-book equity ratio (MB) and with firm size relative to that of
the SampP 500 index (Rsize) Further details on estimating Campbell are available on request
In comparison to Merton (1974) model the assumptions underlying the restrictive form
logit model for Campbell are more relaxed for example it allows market inefficiency and
information asymmetry between creditors and the firm and short-term default that can occur
before net asset values breach bankruptcy barriers10 Therefore accounting conservatism could
bias Campbell on some degree conservatism understates net income eg NIMTAVGt asset
items eg CASHHMTAt and overstates total liabilities eg TLMTAt and this leads to an an
upward bias in estimating Campbell However this potential bias runs counter to the
predictions of all hypotheses except H2a Thus if the empirical results for H1a H1b and H2b
are as predicted the true results should be stronger than those reported
BANK BANK is an indicator variable that is equal to one if a firm files for bankruptcy
under Chapter 7 or 11 of the US Bankruptcy Code and zero otherwise In contrast to EDF
and Campbell which are ex-ante bankruptcy risk metrics BANK is an ex-post bankruptcy risk
measure that is free of estimation error and conservatism bias However the subsample of
firms that actually declare bankruptcy is much smaller and may not be representative of all
firms along a bankruptcy risk continuum Moreover BANK does not support an examination
of continuous relations between conservatism and bankruptcy risk and because data may not
exist or be comparable following the declaration of bankruptcy BANK does not facilitate the
testing of causal relationships between bankruptcy and subsequent unconditional and
conditional conservatism We therefore use EDF and Campbell in our main tests
33 Measures for Unconditional and Conditional Conservatism Givoly et al (2007) advocate using multiple measures of conservatism since different
metrics measure conservatism from different dimensions Following these studies we examine
four firm-year measures of unconditional conservatism UC_ACC (total accruals as adapted
from Ahmed and Duellman (2007)) UC_BM (rank of industry-adjusted book-to-market ratio)
UC_RES (hidden reserves) and UC_PCA (a factor score from a principal components analysis
of the above three metrics) We likewise examine four firm-year measures of conditional
conservatism CC_AR (extending Khan and Watts (2009)) CC_CR (extending Callen et al
10Other relevant assumptions include (1) default time is unobservable and no longer tied to firm value falling below a pre-specified default barrier (2) default follows an intensity-based process (eg PoissonCox process) with exogenous latent variables (3) the probability of default is logistically distributed ie the cumulative probability of default takes a logistic functional form
14
(2010a)) CC_ACM (accumulated non-operational accruals extending Zhang (2008)) and
CC_PCA (a factor score from a principal components analysis of the above three metrics) as
described below
UC_ACC A proxy for unconditional conservatism equal to negative one times the ratio
of average total accruals before depreciation to average total assets both averaged over a three-
year period ending with the current year Thus a higher total accrual indicates a higher degree
of unconditional conservatism The rationale is that conservatism results in persistently
negative accruals (Givoly and Hayn (2000) Ahmed et al (2007)) We calculate total accruals
as Total accrualsit = net income before extraordinary itemsit (Compustat IB) -operational cash
flowit (Compustat OANCF) + depreciation expenseit (Compustat DP)
UC_BM A proxy for unconditional conservatism measured as the industry-adjusted
ranking of the product of negative one times the ratio of book value to market value of
common shareholders equity (Ahmed et al (2007) Zhang (2008)) UC_BM also reflects
expected economic rents and future growth opportunities and we use RampD intensity to control
for them following Ahmed and Duellman (2007)
UC_RES A proxy for unconditional conservatism reflected in ldquohiddenrdquo reserves related
to advertising (ADV) research and development (RD) and last-in-first-out inventory
accounting (INV) Extending Penman and Zhang (2002) this study measures UC_RES as the
ratio of hidden reserves to total assets (TA)
UC_RESt = (INVtres + RDt
res + ADVtres) TAt
11 (3)
UC_PCA A proxy for unconditional conservatism measured as the factor score
generated from a principal components analysis of the three unconditional conservatism
measures UC_ACC UC_BM and UC_RES UC_PCA reflects commonalities across these
three measures that gauge unconditional conservatism at different dimensions and with
different weaknesses Specifically UC_ACC is an accrual-based metric that does not capture
non-accrual unconditional conservatism for example RampD and advertising expenditures
UC_BM is a market-based metric that not only measures the understatement of book value
relative to market value but also reflects expected economic rents and future growth
opportunities UC_RES captures only unconditional conservatism related to hidden reserves
Based on this reasoning we employ UC_PCA as the primary measure of unconditional 11 The inventory hidden reserve INVit
res equals the LIFO reserve RDitres is calculated using coefficients in Lev and Sougiannis
(1996) to capitalize and amortize RampD ADVitres is advertising expense capitalized and amortized over two years following
Bublitz and Ettredge (1989) Penman and Zhang (2002) use net operating assets as the deflator for hidden reserves but its value is negative for over one-sixth of our sample which would potentially bias estimated hidden reserves We therefore use total assets as the deflator When data are missing for LIFO reserves RampD expensing and advertisement expensing they are set to zero
15
conservatism in our main empirical tests To the extent that the three component metrics
measure unconditional conservatism from different dimensions convergent validity is not a
problem if they are all positively related with UC_PCA but are negative related with each
other12
CC_AR A proxy for conditional conservatism defined as the ratio of the sum of the C
Score and G Score to G Score from Khan and Watts (2009) and it is a measure of asymmetric
response similar to that derived from Basu (1997) Our sampling period 1989 through 2007
is similar to that examined in Khan and Watts (2009) 1963 through 2005 and our sample size
is also similar Hence we use model 2 in Table 3 of Khan and Watts (2009) to estimate
CC_AR13
CC_CR A proxy for conditional conservatism extending Callen et al (2010a) We
estimate CC_CR as the ratio of current earnings shocks to total earnings news for bad earnings
news with the ratio multiplied by -1 for good earnings news14 This definition derives from
Vuolteenahorsquos (2002) return decomposition model but differs from the definition of the CR
ratio in Callen et al (2010a) mainly at four respects (1) CC_CR uses the indirect method to
estimate earnings news as in Vuolteenaho (2002) (2) CC_CR multiplies the CR ratio by -1 for
good earnings news so that higher CC_CR represents greater conditional conservatism for the
good news case (3) negative observations of CC_CR are not eliminated from the sample (4)
Intercepts are added to the VAR (1) model for estimating CC_CR Additional details
regarding the estimation of CC_CR are available on demand
CC_ACM A proxy for conditional conservatism measured as negative one times the ratio of
accumulated non-operating accruals over a three-year period to accumulated total assets and is
adapted from Zhang (2008) A higher value for CC_ACM indicates a higher level of bad news
reported via non-operational accruals Non-operating accruals are calculated as follows
12 Convergent validity means multiple measures for a concept are valid when they are positively correlated with each other The underlying assumption is that they are measuring the same concept from the same dimension When measure from different dimension they may be negatively correlated For example firms with high hidden reserves may have fewer incentives to use accrual-based unconditional conservatism which may suggest a negative relation between UC_ACC and UC_RES 13 Khan and Watts (2009) use the following reverse earnings return response regression model Eit = b1 + b2DRit + Rit(m1 + m2Sizeit + m3MBit + m4LEVit) + DRitRit (l1 + l2Sizeit + l3MBit + l4LEVit) + b3Sizeit + b4MBit + b5 LEVit + DRit(l1 + l2Sizeit + l3MBit + l4LEVit) where C (G) score measures the timeliness of bad (good) news as follows G_Scoreit = m1 + m2Sizeit + m3MBit + m4 LEVit = 0237 - 0033Sizei - 0007MBit + 0033LEVit C_Scoreit = l1 + l2Sizeit + l3MBit + l4LEVit = 0031 + 0005Sizeit - 0006MBit + 0005LEVit Then CC_AR is calculated as CC_ARit = (C_Scoreit + G_Scoreit) G_Scoreit = 1 + C_Scoreit G_Scoreit CC_AR is the asymmetric response coefficient in the Khan and Watts (2009) framework corresponding to that in Basu (1997) However by construction CC_AR may be positively correlated with both EDF and Campbell For example Khan and Watts (2009) suggest that the C (G) score is positively (negatively) associated with the leverage ratio and that the C score is positively associated with return volatility 14 CC_AR derives from the Basu (1997) framework and its criterion for classifying good versus bad news is whether the associated stock return is positive or negative CC_CR derives from the Vuolteenaho (2002) framework and its criterion for classifying good versus bad news is whether ROE earnings scaled by book equity is greater than the risk-free rate
16
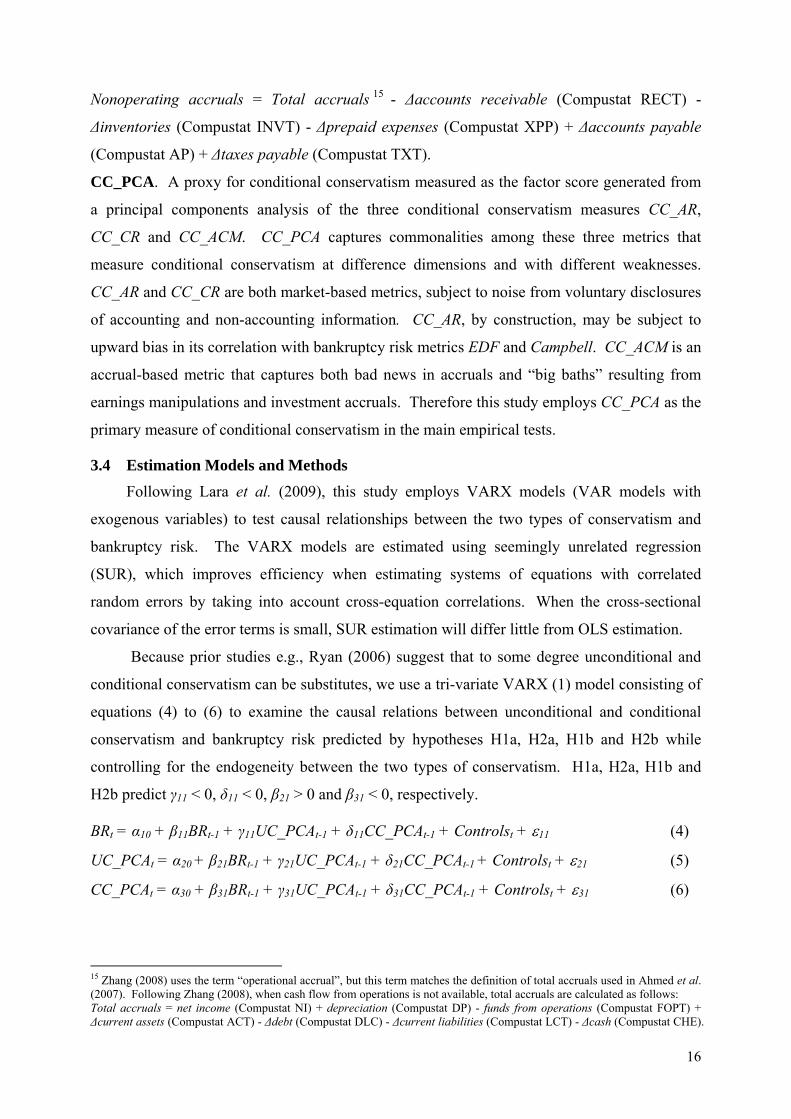
Nonoperating accruals = Total accruals 15 - Δaccounts receivable (Compustat RECT) -
Δinventories (Compustat INVT) - Δprepaid expenses (Compustat XPP) + Δaccounts payable
(Compustat AP) + Δtaxes payable (Compustat TXT)
CC_PCA A proxy for conditional conservatism measured as the factor score generated from
a principal components analysis of the three conditional conservatism measures CC_AR
CC_CR and CC_ACM CC_PCA captures commonalities among these three metrics that
measure conditional conservatism at difference dimensions and with different weaknesses
CC_AR and CC_CR are both market-based metrics subject to noise from voluntary disclosures
of accounting and non-accounting information CC_AR by construction may be subject to
upward bias in its correlation with bankruptcy risk metrics EDF and Campbell CC_ACM is an
accrual-based metric that captures both bad news in accruals and ldquobig bathsrdquo resulting from
earnings manipulations and investment accruals Therefore this study employs CC_PCA as the
primary measure of conditional conservatism in the main empirical tests
34 Estimation Models and Methods Following Lara et al (2009) this study employs VARX models (VAR models with
exogenous variables) to test causal relationships between the two types of conservatism and
bankruptcy risk The VARX models are estimated using seemingly unrelated regression
(SUR) which improves efficiency when estimating systems of equations with correlated
random errors by taking into account cross-equation correlations When the cross-sectional
covariance of the error terms is small SUR estimation will differ little from OLS estimation
Because prior studies eg Ryan (2006) suggest that to some degree unconditional and
conditional conservatism can be substitutes we use a tri-variate VARX (1) model consisting of
equations (4) to (6) to examine the causal relations between unconditional and conditional
conservatism and bankruptcy risk predicted by hypotheses H1a H2a H1b and H2b while
controlling for the endogeneity between the two types of conservatism H1a H2a H1b and
H2b predict γ11 lt 0 δ11 lt 0 β21 gt 0 and β31 lt 0 respectively
BRt = α10 + β11BRt-1 + γ11UC_PCAt-1 + δ11CC_PCAt-1 + Controlst + ε11 (4)
UC_PCAt = α20 + β21BRt-1 + γ21UC_PCAt-1 + δ21CC_PCAt-1 + Controlst + ε21 (5)
CC_PCAt = α30 + β31BRt-1 + γ31UC_PCAt-1 + δ31CC_PCAt-1 + Controlst + ε31 (6)
15 Zhang (2008) uses the term ldquooperational accrualrdquo but this term matches the definition of total accruals used in Ahmed et al (2007) Following Zhang (2008) when cash flow from operations is not available total accruals are calculated as follows Total accruals = net income (Compustat NI) + depreciation (Compustat DP) - funds from operations (Compustat FOPT) + Δcurrent assets (Compustat ACT) - Δdebt (Compustat DLC) - Δcurrent liabilities (Compustat LCT) - Δcash (Compustat CHE)
17
where BR refers to bankruptcy risk measures EDF or Campbell and the autoregressive vector
includes BRt-1 UC_PCAt-1 and CC_PCAt-1 Controlst in equation (4) include previously
identified determinants of bankruptcy risk (Anderson et al (1996) Shumway (2001) Parker et
al (2002) Uhrig-Homburg (2005) Campbell et al (2008) Eberhart et al (2008)) namely the
leverage ratio (Leveraget) return on total assets (ROAt) return volatility (STD_Rett) firm size
(Ln(MV)t) the risk-free rate (Ratet) liquidity (Casht) changes in liquidity (ΔCasht) and RampD
investment intensity (Inten_RDt) Consistent with Shumway (2001) Uhrig-Homburg (2004)
Campbell et al (2008) and Eberhart et al (2008) this study predicts bankruptcy risk to be
positively associated with leverage and return volatility and negatively associated with ROA
liquidity cash flow firm size the risk-free rate and RampD investment intensity Controlst in
equation (5) include previously identified determinants of unconditional conservatism namely
the leverage ratio (Leveraget) firm size (Ln(MV)t) and RampD investment intensity
(Inten_RDt)16 These variables proxy for demand for unconditional conservatism arising from
contracting considerations litigation risk taxation and regulation while investment intensity
Inten_RDt is used to control for the effects of RampD investment and growth opportunities
(Ahmed and Duellman (2007)) Controlst in equation (6) are the same as in equation (5) but
with different predictions17 Lastly in all the three equations dummies for the Fama and
French (1997) industry classification (Ind_Dum) and for the fiscal year (Year_Dum) are
included to capture fixed industry and year effects
VARX estimation is also sensitive to lag structure A lag structure that is too short
wastes information and risks non-zero serial correlations with error terms thus biasing
parameter estimates while an overly long lag length can risks inaccurate parameter estimation 16 We predict unconditional conservatism to be negatively related to financial leverage and ROA and positively related to firm size A negative association between unconditional conservatism and financial leverage follows from the reasoning that firms with high levels of leverage tend to have greater conflicts between bondholders and shareholders Beaver and Ryan (2000) provide confirming evidence that leverage is negatively associated with unconditional conservatism The relationship between unconditional conservatism and ROA reflects the net of incentives to mitigate bankruptcy risk and report higher earnings As ROA increases there is less incentive to use unconditional conservatism to lessen bankruptcy risk but also less incentive to boost earnings and more incentive to create hidden reserves that we predict will dominate A positive association between unconditional conservatism and firm size follows from the reasoning in Khan and Watts (2009) that larger firms have richer information environments reducing both overall uncertainty and information asymmetries thus leading to less contracting demand and findings in Qiang (2007) that contracting efficiency induces little demand for unconditional conservatism Hagerman and Zmijewki (1979) suggest that firm size proxies for political visibility and because larger firms are more visible they are subject to higher tax and regulation costs and receive lower subsidies Larger firms also may be more subject to greater litigation risk Consistent with these arguments Ahmed et al (2002) document that firm size is positively associated with the unconditional conservatism metrics BM ratio and total accruals 17 We predict conditional conservatism to be positively related to financial leverage but negatively related to firm size and ROA A positive association between conditional conservatism and financial leverage is expected because creditors preferring conditional conservatism will have increasing influence over firms as financial leverage increases especially for firms in financial distress A negative association between conditional conservatism and firm size is expected from the results of Khan and Watts (2009) who suggest that larger firms have richer information environments that reduce both overall uncertainty and information asymmetries and thus contracting demand for conditional conservatism Givoly et al (2007) and LaFond and Watts (2008) similarly document that the asymmetric timeliness of earnings for large firms is significantly smaller than for small firms A negative association between conditional conservatism and ROA follows from the reasoning that well-performing firms have less pressure to use conditional counter-conservatism to boost earnings
18
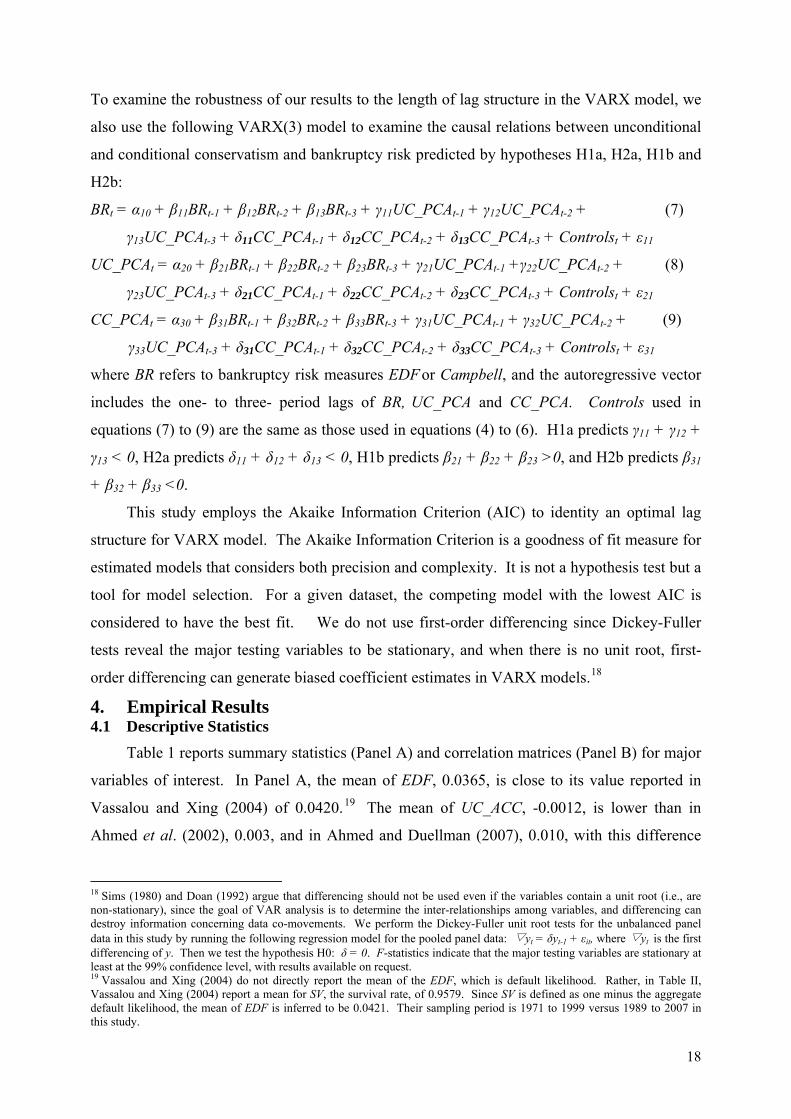
To examine the robustness of our results to the length of lag structure in the VARX model we
also use the following VARX(3) model to examine the causal relations between unconditional
and conditional conservatism and bankruptcy risk predicted by hypotheses H1a H2a H1b and
H2b
BRt = α10 + β11BRt-1 + β12BRt-2 + β13BRt-3 + γ11UC_PCAt-1 + γ12UC_PCAt-2 + (7)
γ13UC_PCAt-3 + δ11CC_PCAt-1 + δ12CC_PCAt-2 + δ13CC_PCAt-3 + Controlst + ε11
UC_PCAt = α20 + β21BRt-1 + β22BRt-2 + β23BRt-3 + γ21UC_PCAt-1 +γ22UC_PCAt-2 + (8)
γ23UC_PCAt-3 + δ21CC_PCAt-1 + δ22CC_PCAt-2 + δ23CC_PCAt-3 + Controlst + ε21
CC_PCAt = α30 + β31BRt-1 + β32BRt-2 + β33BRt-3 + γ31UC_PCAt-1 + γ32UC_PCAt-2 + (9)
γ33UC_PCAt-3 + δ31CC_PCAt-1 + δ32CC_PCAt-2 + δ33CC_PCAt-3 + Controlst + ε31
where BR refers to bankruptcy risk measures EDF or Campbell and the autoregressive vector
includes the one- to three- period lags of BR UC_PCA and CC_PCA Controls used in
equations (7) to (9) are the same as those used in equations (4) to (6) H1a predicts γ11 + γ12 +
γ13 lt 0 H2a predicts δ11 + δ12 + δ13 lt 0 H1b predicts β21 + β22 + β23 gt0 and H2b predicts β31
+ β32 + β33 lt0
This study employs the Akaike Information Criterion (AIC) to identity an optimal lag
structure for VARX model The Akaike Information Criterion is a goodness of fit measure for
estimated models that considers both precision and complexity It is not a hypothesis test but a
tool for model selection For a given dataset the competing model with the lowest AIC is
considered to have the best fit We do not use first-order differencing since Dickey-Fuller
tests reveal the major testing variables to be stationary and when there is no unit root first-
order differencing can generate biased coefficient estimates in VARX models18
4 Empirical Results 41 Descriptive Statistics
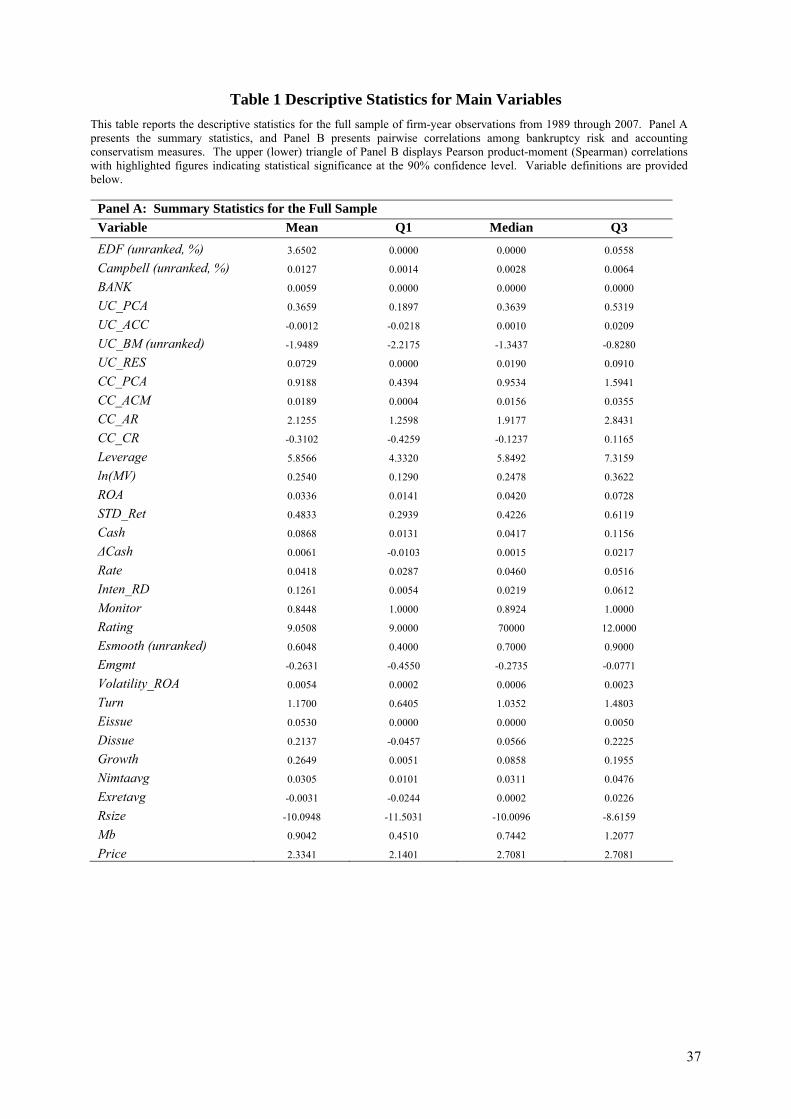
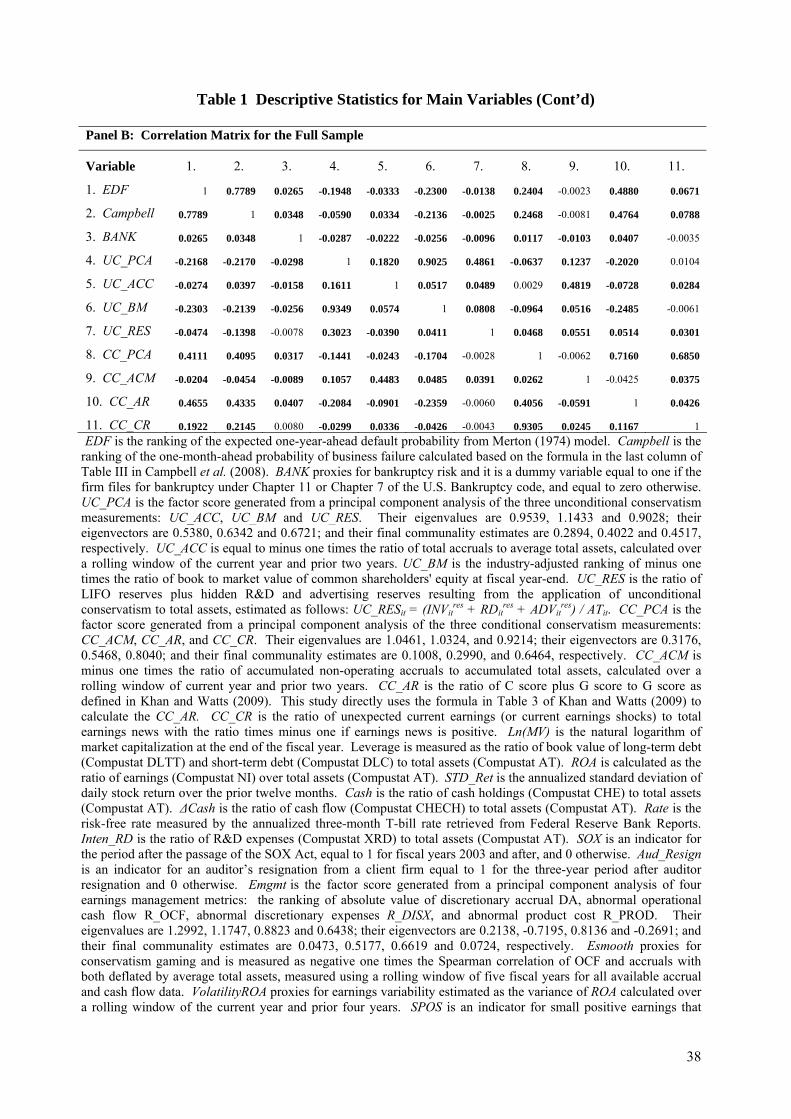
Table 1 reports summary statistics (Panel A) and correlation matrices (Panel B) for major
variables of interest In Panel A the mean of EDF 00365 is close to its value reported in
Vassalou and Xing (2004) of 0042019 The mean of UC_ACC -00012 is lower than in
Ahmed et al (2002) 0003 and in Ahmed and Duellman (2007) 0010 with this difference
18 Sims (1980) and Doan (1992) argue that differencing should not be used even if the variables contain a unit root (ie are non-stationary) since the goal of VAR analysis is to determine the inter-relationships among variables and differencing can destroy information concerning data co-movements We perform the Dickey-Fuller unit root tests for the unbalanced panel data in this study by running the following regression model for the pooled panel data yt = δyt-1 + εit where yt is the first differencing of y Then we test the hypothesis H0 δ = 0 F-statistics indicate that the major testing variables are stationary at least at the 99 confidence level with results available on request 19 Vassalou and Xing (2004) do not directly report the mean of the EDF which is default likelihood Rather in Table II Vassalou and Xing (2004) report a mean for SV the survival rate of 09579 Since SV is defined as one minus the aggregate default likelihood the mean of EDF is inferred to be 00421 Their sampling period is 1971 to 1999 versus 1989 to 2007 in this study
19
likely due to differing sample periods20 The mean of CC_CR is -03102 much lower than the
CR ratio in Callen et al (2010a) however these values are not comparable because the CR
ratio in Callen et al (2010a) omits observations with negative values whereas the CC_CR
measure in this study does not
Insert Table 1 about here
Panel B of Table 1 presents correlations among contemporaneous observations of the
main testing variables with Pearson (Spearman) correlations reported in the upper (lower)
triangle of the table The Spearman (Pearson) correlations between the bankruptcy risk metrics
EDF and Campbell are 07789 (07789) both statistically significant suggesting that they have
strong convergent validity in measuring ex ante bankruptcy risk Both measures are also
significantly positive related with the ex post bankruptcy risk measure BANK but both the
Pearson and Spearman correlations are as low as 2-35 However this does not mean that
BANK has low convergent validity with EDF and Campbell since they measures bankruptcy
risk from different dimensions
UC_PCA is significantly negatively associated with CC_PCA with their Spearman
(Pearson) correlation -01441 (-00637) Except for CC_ACM the Spearman correlations
among other component measures of the two types of conservatism are predominantly negative
a finding consistent with prior evidence (Beaver and Ryan (2005) Ryan (2006)
Roychowdhury and Watts (2007) Ball et al (2009)) Spearman and Pearson correlations
between UC_PCA and its component unconditional conservatism metrics at different
dimensions are uniformly positive and statistically significant suggesting UC_PCA is an
representative overall unconditional conservatism measure that possesses reasonable content
validity concurrent validity and convergent validity21
Likewise Spearman and Pearson correlations between CC_PCA and its component
conditional conservatism metrics are uniformly positive and statistically significant the only
exception being its Pearson correlation with CC_ACM which is insignificantly different from
zero These correlations suggest that CC_PCA is a representative metric that reasonably
reflects the overall levels of conditional conservatism and captures the commonality of
20 Ahmed et al (2002) and Ahmed and Duellman (2007) use samples of SampP 500 firms during 1993-1998 and 1998-2002 respectively whereas this study uses NYSE AMEX and NASDAQ listed firms for 1989-2007 21 The Spearman and Pearson correlations among the three component measures for unconditional conservatism are within the range of +-010 However this does not mean that they have low convergent validity because they measure unconditional conservatism on different dimensions rather than on the same dimension and thus could be highly uncorrelated In particular the Spearman correlation between UC_RES and UC_ACC is -00390 significantly negative suggesting that firms with higher hidden reserves has less incentives for accrual-based unconditional conservatism it does not suggest lower convergent validity between the two because both measures unconditional conservatism at different dimensions
20
component metrics that measure conditional conservatism from different dimensions22
The Pearson and Spearman correlations of unconditional conservatism with EDF and
Campbell are negative whereas the correlations of conditional conservatism with EDF and
Campbell are positive Care should be taken in interpreting these latter correlations because
they are subject to omitted variable biases In the following sections we systematically
examine the lead-lag relations between unconditional conservatism conditional conservatism
and bankruptcy risk in multivariate analyses
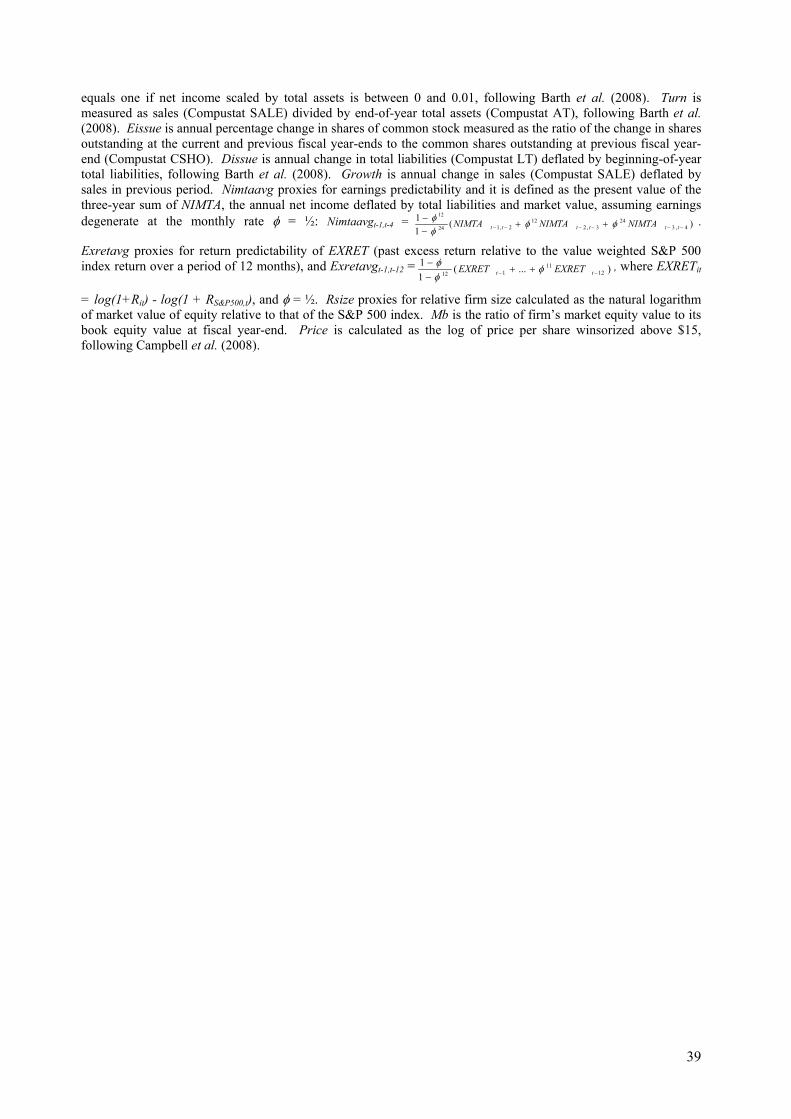
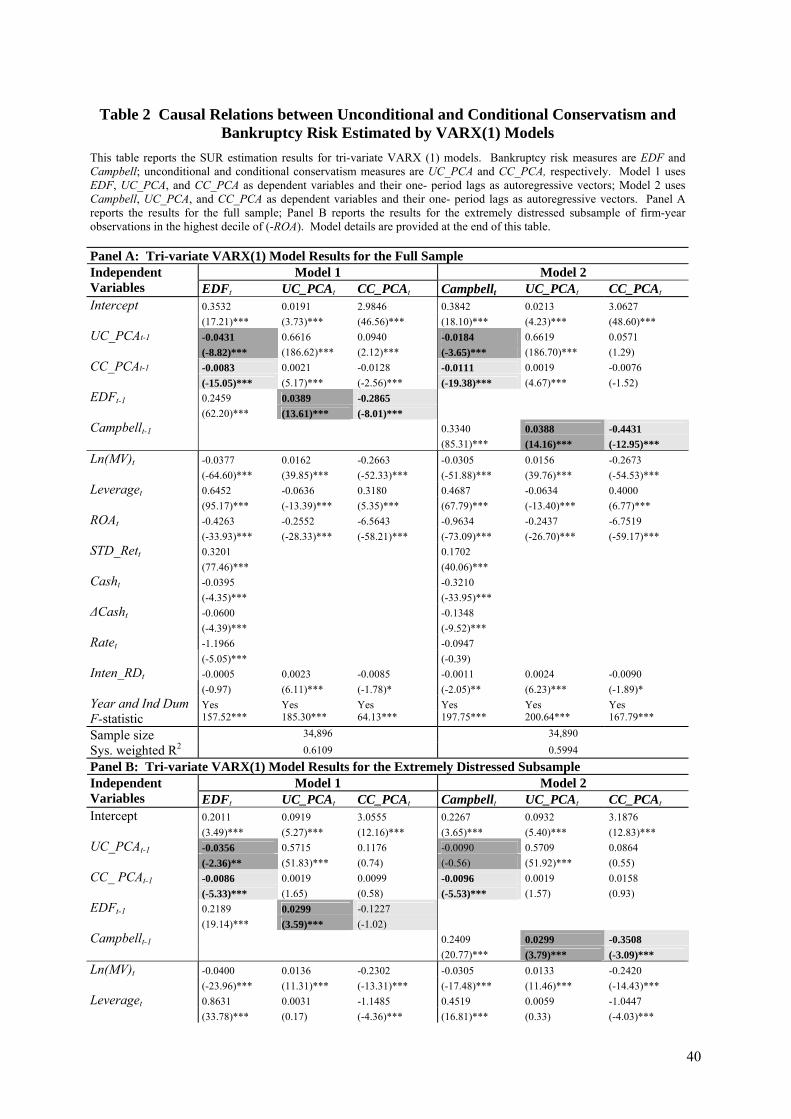
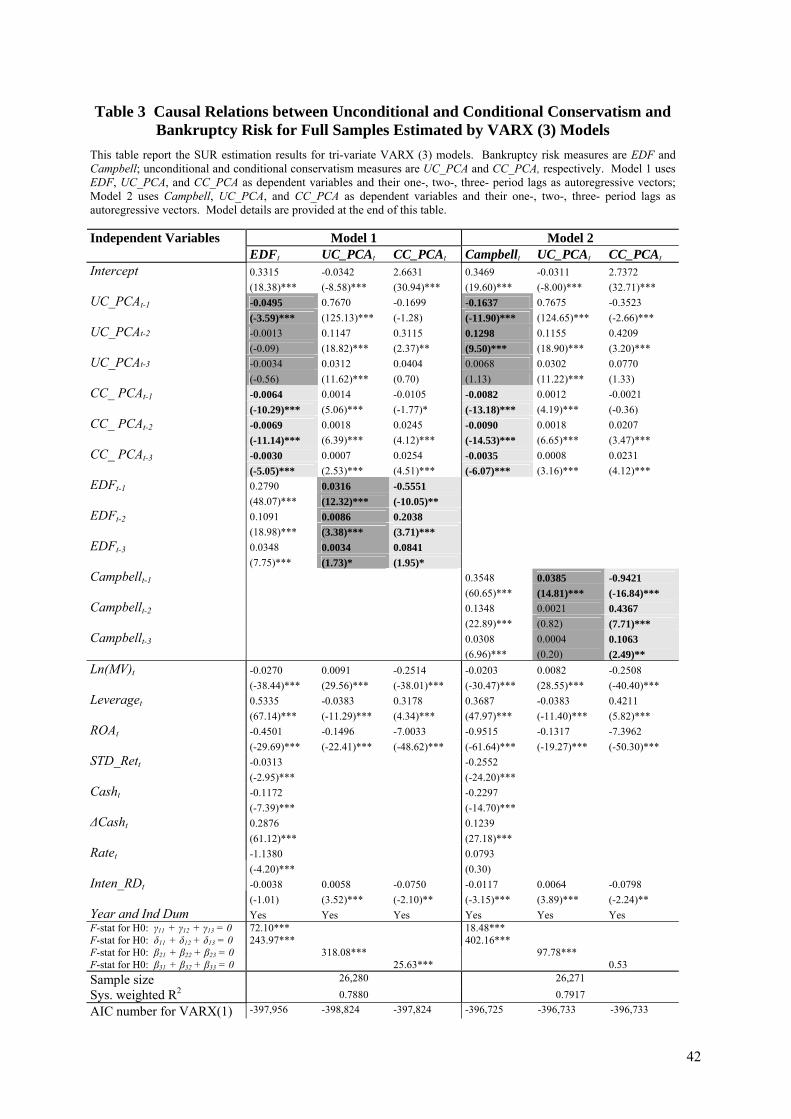
42 Causal Relations Between Unconditional and Conditional Conservatism in Full and Extremely Distressed Samples We first examine the lead-lag relations between unconditional and conditional
conservatism using a tri-variate VARX (1) model described by equations (4) to (6) with results
for the full sample and subsample of firms in extreme distress presented in Table 2 Panels A
and B respectively Models 1 and 2 in both Panels use EDFt and Campbellt as bankruptcy risk
measures respectively Panel A of Table 2 shows that in both Models 1 and 2 UC_PCAt-1 and
CC_PCAt-1 are significantly negatively associated with EDFt and Campbellt when both are
predictors with coefficients (t-statistics) of -00431 (-882) and -00083 (-1505) in the EDFt
equation respectively and -00184 (-365) and -00110 (-1938) in the Campbellt equation
respectively F-statistics for the null hypothesis that the predictor coefficients of EDFt and
Campbellt are zero indicate rejection beyond the 99 confidence level EDFt-1 and Campbellt-1
are both significantly positively associated with UC_PCAt and negatively associated with
CC_PCAt with coefficients (t-statistics) of 00389 (1361) and -02865 (-801) respectively
for UC_PCAt-1 and CC_PCAt-1 in the EDFt equation and 00388 (1416) and -04431 (-1295)
respectively in the Campbellt equation These results indicate that the evidence presented in
Tables 3 and 4 supporting H1a and H2a and H1b and H2b respectively and that the evidence
is robust to endogeneity between unconditional and conditional conservatism23
Insert Table 2 about here
For extremely distressed firms managerial incentives and governance mechanisms may 22 Some Spearman and Pearson correlations among the three component measures for conditional conservatism are within the range of +-005 However this does not mean that they have low convergent validity because they measure conditional conservatism from different perspectives rather than on the same dimensions and thus could be highly uncorrelated 23 In both models conditional conservatism CC_PCAt-1 exhibits a significant positive association with subsequent unconditional conservatism UC_PCAt with coefficients (T-statistics) 00021 (517) and 00019 (467) respectively in Panel A This result is consistent with expectation and suggests that bad news ldquoshocksrdquo associated with conditional conservatism generate demand for subsequent unconditional conservatism UC_PCAt-1 also exhibits a positive association with subsequent conditional conservatism CC_PCAt with coefficients (t-statistics) 00940 (212) and 00571 (129) respectively However when we take the first difference of UC_PCA to consider only the unconditional conservatism that occurred in a specific fiscal year the coefficient is significantly negative This result is consistent with prior notions that unconditional conservatism preempts conditional conservatism (Beaver and Ryan (2005) and Ryan (2006))
21
differ from those in healthier firms which may qualitatively change relations between
conservatism and bankruptcy risk for several reasons When shareholdersrsquo implicit call options
on assets are at or close to the money in deeply distressed firms equity values will increase in
asset volatility shareholdersrsquo risk-shifting incentives may dominate and firms may have less
incentive to use conservatism to mitigate bankruptcy risk Firmsrsquo control rights also may
progressively transfer to creditors who may demand higher levels of conservatism to prevent
risk shifting to creditors and wealth transferring to shareholders (Loktionov (2009)) Finally
the going concern assumption may no longer apply making accrual accounting and
unconditional conservatism less relevant To investigate whether the results for the full sample
still hold under these contexts we examine in Panel B of Table 5 a subsample of most
distressed firms defined by the lowest decile of returns-on-assets (largest (-ROA)) Consistent
with the results in Panel A both UC_PCAt-1 and CC_PCAt-1 remain significantly negatively
associated with subsequent bankruptcy risk except for UC_PCAt-1 with Campbellt EDFt-1 and
Campbellt-1 remain significantly and positively associated with UC_PCAt and CC_PCAt
except for EDFt-1 with CC_PCAt Thus the prior findings are qualitatively similar for deeply
distressed firms
Insert Table 3 about here
One may concern that our results are driven by cross-sectional relations between
unconditional conservatism conditional conservatism and bankruptcy risk and that our results
may be sensitive to lad structure To address these concerns we reexamine the lead-lag
relations between unconditional and conditional conservatism using a tri-variate VARX (3)
model described by equations (7) to (9) with results for the full sample presented in Table 3
Model 1 shows that UC_PCAt-1 UC_PCAt-2 and UC_PCAt-3 are all consistently negatively
associated with EDFt with the coefficient of UC_PCAt-1 statistically significant while Model 2
shows that UC_PCAt-1 are significantly negatively associated with EDFt and UC_PCAt-2 and
UC_PCAt-3 are positively associated with EDFt with the coefficient of UC_PCAt-2 statistically
significant The sum of the coefficients of UC_PCAt-1 UC_PCAt-2 and UC_PCAt-3 is all
negative and the F-test for the null hypothesis that the sum is zero derives significant F-
statistics 7210 and 1848 for EDFt and Campbellt equations respectively thus providing
strong support for H1a In both models CC_PCAt-1 CC_PCAt-2 and CC_PCAt-3 are all
significantly and negatively associated with EDFt and Campbellt and the F-test for the null
hypothesis that the sum of the coefficients of CC_PCAt-1 CC_PCAt-2 and CC_PCAt-3 are zero
for EDFt and Campbellt equations indicate rejection at least at the 99 confidence level thus
22
providing strong support for H1b
In Model 1 EDFt-1 EDFt-2 and EDFt-3 are significantly positively associated with
UC_PCAt and likewise in Model 2 Campbellt-1 Campbellt-2 and Campbellt-3 are consistently
positively associated with UC_PCAt but only the coefficient of Campbellt-1 is statistically
significant The F-tests for the null hypotheses that the sum of the coefficients of EDFt-1
EDFt-2 and EDFt-3 is zero and that the sum of the coefficients of Campbellt-1 Campbellt-2 and
Campbellt-3 is zero indicate rejection at least at the 99 confidence level thus providing strong
support for H2a that bankruptcy risk is positively associated with subsequent unconditional
conservatism Results for testing H2b are relatively weaker In Model 1 EDFt-1 are
significantly negatively associated with CC_PCAt while EDFt-2 and EDFt-3 are significantly
positively associated with CC_PCAt but the sum of their coefficient is still negative and the
same pattern applies to Campbellt-1 Campbellt-2 and Campbellt-3 in CC_PCAt equation in
Model 2 The F-test for the null hypothesis that the sum of the coefficients of EDFt-1 EDFt-2
and EDFt-3 is zero indicates a rejection at least at the 99 confidence level in Model 1 but the
F-test for the null hypothesis that the sum of the coefficients of Campbellt-1 Campbellt-2 and
Campbellt-3 is zero is insignificant thus providing partial support for H2b that bankruptcy risk
is negatively associated with subsequent unconditional conservatism
We further compare the Akaike Information Criterion (AIC) number for the
corresponding VARX (1) and VARX(3) models used in Tables 2 and 3 to examine the optimal
lag structure for VARX model AIC number is calculated as AIC = NLn((1 - R-sqr) N) +
2K where N is sample size K is number is independent variables and R-sqr is the proportion
of the sum of square accounted for by the model under consideration The last two lines in
Table 3 indicates that AIC numbers for VARX (1) models are unanimously smaller than those
for VARX (3) models Untabulated results also indicate that AIC numbers for VARX (1)
models are smaller than those for the corresponding VARX (2) models Since the models with
the lowest AIC number is best fitted we use VARX (1) model in the rest of the empirical tests
Moreover one may concern whether the results for each complement of UC_PCA and
CC_PCA are consistent with Tables 2 and 3 We further report the results for testing the lead-
lag relations between bankruptcy risk and unconditional conservatism and between bankruptc
risk and conditional conservatism by bi-variate VARX (1) models in Appendix A and B
respectively
23
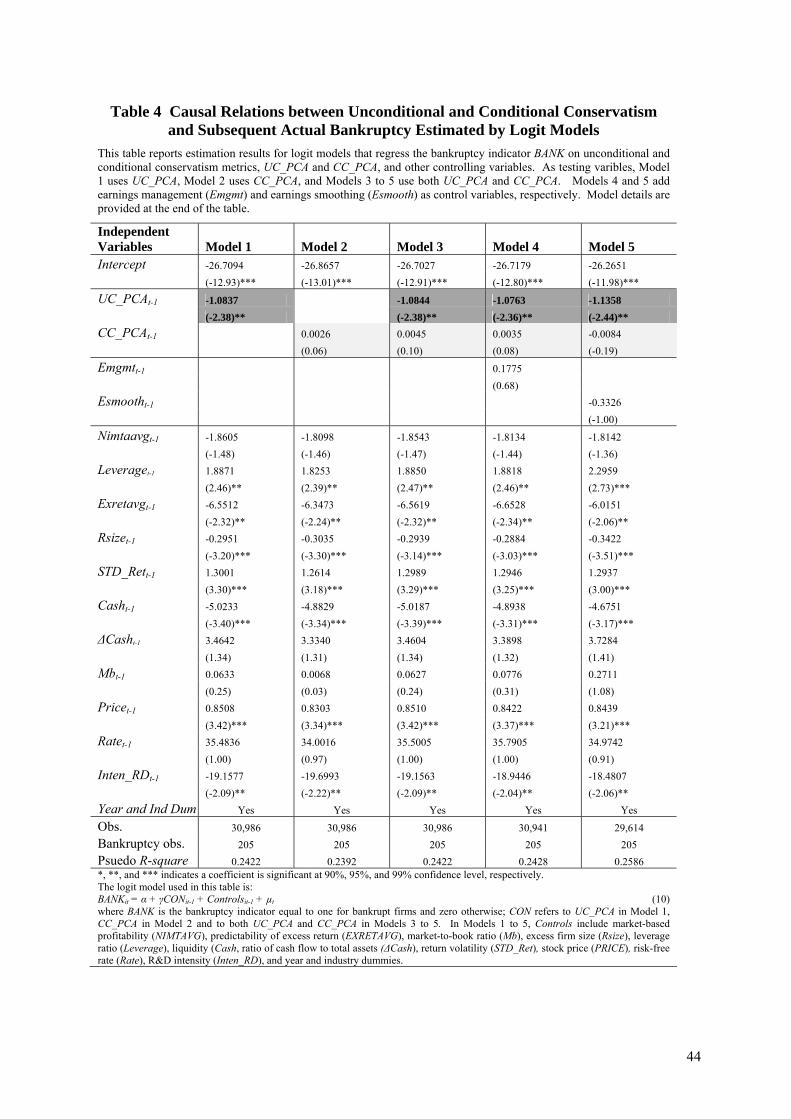
43 Causal Relations between Unconditional and Conditional Conservatism and Actual Bankruptcy Examining a subsample of firms that actually declared bankruptcy encompasses the
upper limit of bankruptcy risk and eliminates estimation error in calculating bankruptcy risk
However actual bankruptcy as an indicator variable precludes examining continual relations
and the effects of bankruptcy on subsequent conservatism For these reasons we test only
hypotheses H1a and H2a using a logit model following Compbell et al (2008) and H1a and
H2a predict that γ lt 0
BANKt = α + γCONt-1 + Controlst + microt (10)
where BANK equals one if a firm files for bankruptcy under Chapters 7 or 11 of the
Bankruptcy Code and zero otherwise and CON refers to unconditional or conditional
conservatism measured by UC_PCA or CC_PCA or both24 Models 1 and 3 to 5 in Table 4
find that UC_PCAt-1 is significantly negatively associated with the probability that firms file for
bankruptcy a result that holds after controlling for earnings management and earnings
smoothing However CC_PCAt-1 is insignificantly associated with the probability of
bankruptcy in Models 2 to 5 These results strongly confirm hypothesis H1a but do not
support hypothesis H2a for firms actually filing for bankruptcy This is consistent with
reduced incentives for conditional conservatism as firms enter into actual bankruptcy perhaps
because bad news is already revealed and further bad news is unhelpful for reducing
information asymmetries and could even cause frictions among claimants
Insert Table 4 about here
The signs of the control variable coefficients are consistent with expectations NIMTAVG
Exretavg Inten_RD Cash and Rate are negatively associated with BANK and Leverage
STD_ret and MB are positively associated with BANK
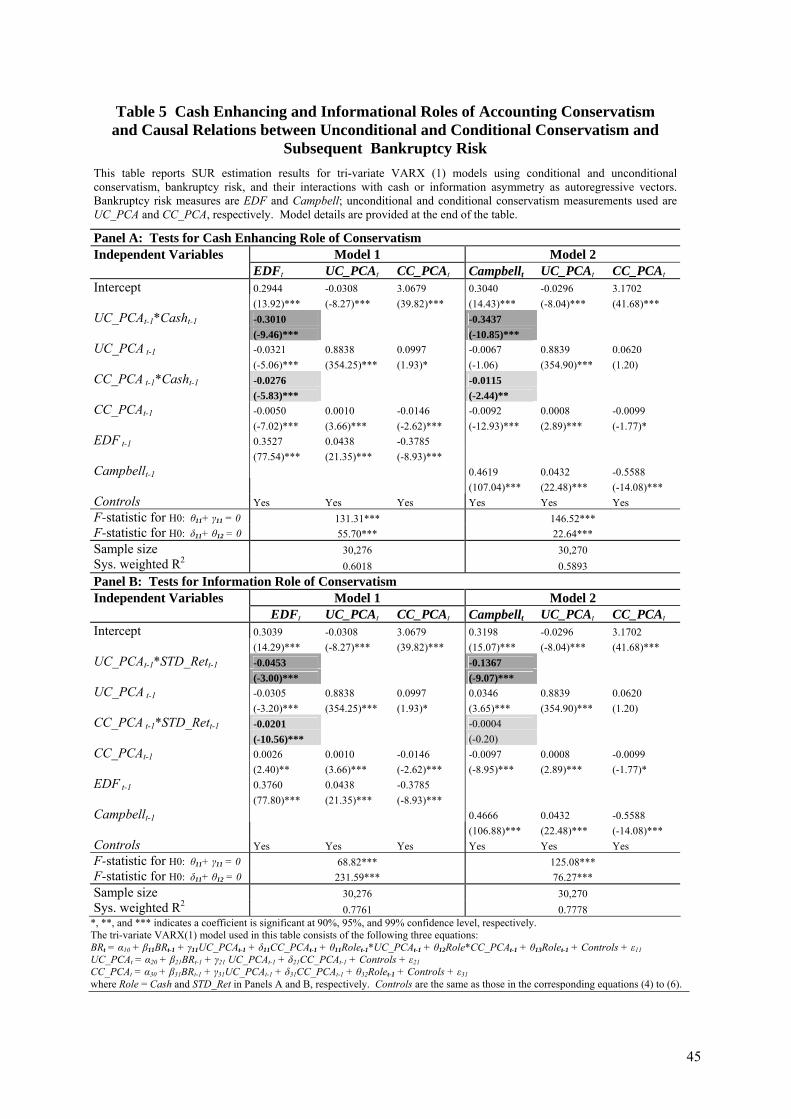
44 The Cash Enhancing and Informational Roles of Accounting Conservatism and Causal Relations between Conservatism and Bankruptcy Risk This section examines how unconditional and conditional conservatism impact
bankruptcy risk through the cash enhancing role and informational role Table 5 replicates
Table 3 adding interactions between UC_PCA CC_PCA and Cash (Panel A) and between 24 Following Campbell et al (2008) we employ the following commonly used determinants of bankruptcy risk as controlling variables the market-based profitability (NIMTAVG) the predictability of excess return relative to SampP 500 index (EXRETAVG) RampD investment intensity (Inten_RD) firm size relative to that of the SampP 500 index (Rsize) the stock price (PRICE) and the risk-free rate (Rate) which are expected to reduce the probability of BANK the leverage ratio (Leverage) the liquidity ratio (Cash) changes in the liquidity ratio (ΔCash) return volatility (STD_Ret) and the market-to-book equity ratio (MB) all of which are expected to increase the probability of BANK Other controlling variables include year and industry dummies earnings management (Emgmt) and earnings smoothing (Esmooth)
24
UC_PCA CC_PCA and STD_Rett-1 (Panel B) to the EDF and Campbell equations Stock
volatility STD_Rett-1 is used to proxy for information uncertainty and information asymmetry
following Zhang (2006) and Khan and Watts (2009) Panel A reveals that the interactions of
both unconditional and conditional conservatism with cash (UC_PCAt-1Casht-1 and CC_PCAt-
1Casht-1 respectively) are significantly negatively associated with subsequent bankruptcy risk
proxied by EDFt in Model 1 with coefficients (t-statistics) of -03010 (-946) and -00276 (-
583) and with subsequent bankruptcy risk proxied by Campbellt in Model 2 with coefficients
(t-statistics) -03437 (-1085) and -00115 (-244) respectively F-statistics for the null
hypothesis that the sum of the coefficients of conservatism and of its interaction with cash is
zero are significant beyond the 99 confidence level for both unconditional and conditional
conservatism in both Models 1 and 2 Thus the evidence in Panel A suggests that both
unconditional and conditional conservatism mitigate bankruptcy risk via their cash enhancing
roles
Insert Table 5 about here
Panel B of Table 7 shows that the interactions of conservatism with stock return volatility
(UC_PCAt-1STD_Rett-1 and CC_PCAt-1 STD_Rett-1) are also significantly negatively
associated with subsequent bankruptcy risk as proxied by EDFt in Model 1 with coefficients
(t-statistics) of -00453 (-300) and -00201 (-1056) respectively Similarly the interaction of
unconditional conservatism with return volatility is also significantly negative for Campbellt in
Model 2 with a coefficient (t-statistic) of -01367 (-907) but the interaction of conditional
conservatism with return volatility is statistically insignificant F-statistics for the null
hypothesis that the sum of coefficients for conservatismrsquos interactions with return volatility is
zero is nonetheless significant beyond the 90 confidence level for both unconditional and
conditional conservatism in both Models 1 and 2 Overall the evidence in Panel B suggests
that both unconditional and conditional conservatism help mitigate bankruptcy risk via their
informational roles
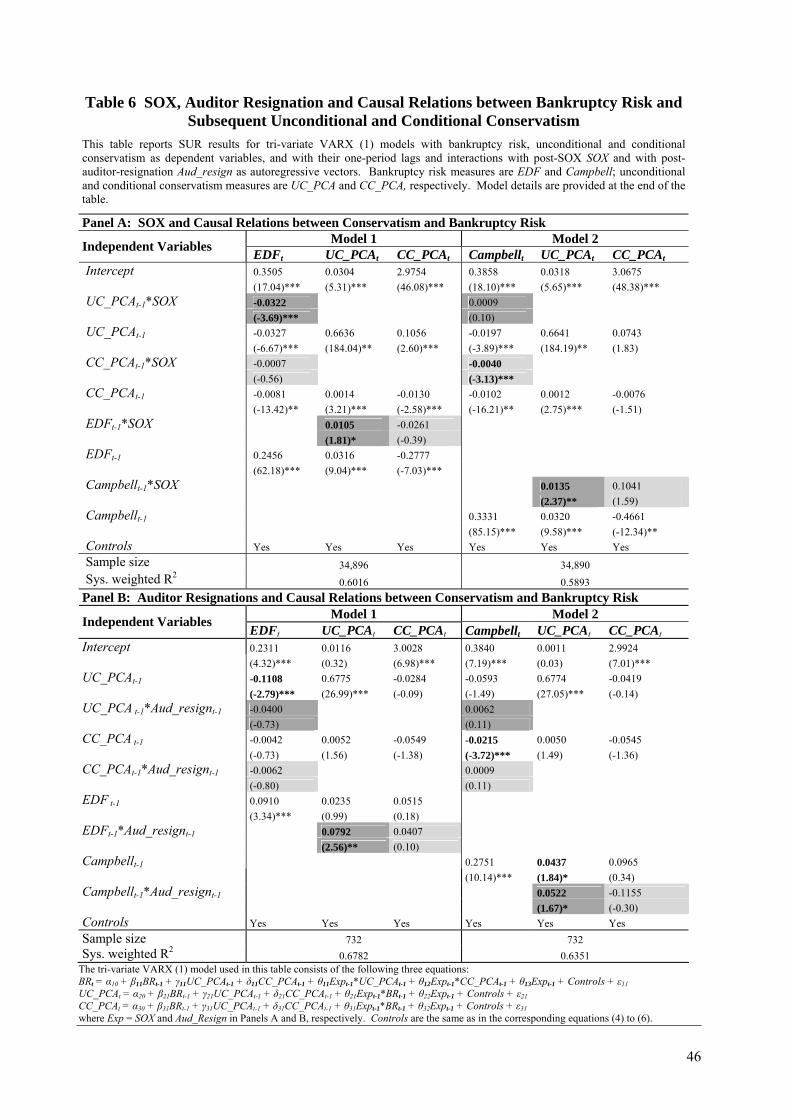
45 Sarbanes-Oxley Auditor Turnover and Causal Relations between Bankruptcy Risk and Subsequent Unconditional and Conditional Conservatism
This section uses the contexts of the passage of the Sarbanes-Oxley Act in 2002 (SOX)
and auditor resignations as natural experiments to examine the effects of auditors regulators
and litigation on causal relations between bankruptcy risk and subsequent unconditional and
conditional conservatism Prior evidence suggests that SOX heightened legal and regulatory
attention to financial reporting and increased managerial litigation exposures and punishment
25
which leads to enhanced accounting conservatism (Lobo and Zhou (2006) Cefaratti et al
(2010)) 25 Auditor resignations are often triggered by aggressive reporting or
misrepresentations (Krishnan and Krishnan (1997) Menon and William (2008) Krishnan et al
(2010)) therefore it signals enhanced litigation risk of firms and auditors enhanced monitoring
by successor auditors regulators and investors and thus enhanced conservatism in the post-
auditor-resignation period
Our main argument for the relations between bankruptcy risk and subsequent
unconditional and conditional conservatism is that different from shareholdersrsquo litigation that
creates demand for both unconditional and conditional conservatism enhanced monitoring by
auditors and regulators mainly enhance unconditional conservatism which is their primary
focus (Qiang (2007)) If this argument is valid the interaction of bankruptcy risk and indicator
for the post-SOX period (SOX) and the interaction of bankruptcy risk and indicator for the
post-auditor-resignation period (Post_resign) should increase subsequent unconditional
conservatism We test this conjecture by replicating the analysis in Panel A Table 2 adding
these interactions
Results reported in Panel A of Table 6 reveal that the interactions of SOX with EDFt-1
and Campbellt-1 are both statistically positive for UC_PCAt suggesting that enhanced auditors
and regulatorsrsquo monitoring following the passage of SOX enhanced the effects of bankruptcy
risk on subsequent unconditional conservatism as predicted by H2a In contrast interactions of
SOX with EDFt-1 and Campbellt-1 are statistically insignificantly associated with CC_PCAt
suggesting that SOX influenced little the effects of bankruptcy risk on subsequent conditional
conservatism predicted by H2b In addition the interaction of SOX with UC_PCAt-1 is
statistically significant for EDFt but is statistically insignificant for Campbellt and the opposite
is true for the interaction of SOX with CC_PCAt-1 suggesting that SOX enhanced albeit
modestly the mitigating effects of both unconditional and conditional conservatism on
subsequent bankruptcy risk
Insert Table 6 about here
We use a subsample of 124 firms with auditor resignations between 2000 and 2007 to
examine the effects of auditors on relations between accounting conservatism and bankruptcy
25Lobo and Zhou (2006) find that both unconditional conservatism (measured by total accruals) and conditional conservatism (Basu (1997) measure) increased in the post-SOX period Similarly Cefaratti et al (2010) report that the passage of SOX enhanced litigation risk and thereby increased conservatism Our study finds only the pattern of unconditional conservatism confirms Lobo and Zhou (2006) and Cefaratti et al (2010) In particular for the six years centered around SOX passage unconditional conservatism (UC_PCA) increases from 03443 in the pre-SOX period (2000-2002) to 03805 in the post-SOX period (2003-2005) with a t-statistic of 877 Conditional conservatism (CC_PCA) increases from 08055 in the pre-SOX period to 08582 in the post-SOX period with a t-statistic of 160
26
risk26 Panel B of Table 8 reveals that the interactions of Post_resign with EDFt-1 and with
Campbellt-1 are significant for UC_PCAt but insignificant for CC_PCAt in both Models 1 and 2
In addition the interactions of Post_resign with UC_PCAt-1 and with CC_PCAt-1 are
statistically insignificant for EDFt and Campbellt in both Models 1 and 2 We also perform the
t-test of the difference in mean for UC_PCA and CC_PCA for three years post- versus pre-
resignation periods The average UC_PCA (CC_PCA) in the pre-resignation period is 03710
(12295) then it increases (decreases) to 04200 (11639) in the post-resignation period with t-
statistic (292) significant for UC_PCA and insignificant for CC_PCA Overall Table 6
provides consistent evidence for the argument that enhanced monitoring by auditors and
regulators mainly enhance unconditional conservatism rather than enhance conditional
conservatism as bankruptcy risk increases using the nature experiments of SOX passage and
auditor resignations This evidence provides further support for hypotheses H2a and H2b
46 Conservatism Gaming and Causal Relations between Conservatism and Bankruptcy Risk One main concern that ldquoconservatism gamingrdquo a version of earnings smoothing whereby
managers apply more conservatism during good times to provide earnings cushions during
downturns may drive the relations between conservatism and bankruptcy risk because
conservatism gaming is expected to mitigate bankruptcy risk Smith and Stulz (1985)rsquos model
argue that earnings smoothing may serve as a hedge against bankruptcy risk and Trueman and
Titman (1988)rsquos model concur that earnings smoothing may lower claimholdersrsquo perceptions
of bankruptcy risk by lowering perceptions of earnings volatility To address this concern we
examine whether the causal relations between unconditional and conditional conservatism and
bankruptcy risk are robust to conservatism gaming employing a tetra-variate VARX (1) model
consisting of equations (11) to (14)
BRt = α10 + β11BRt-1 + γ11UC_PCAt-1 + δ11CC_PCAt-1 + θ11Esmootht-1 + Controlst + ε11 (11)
UC_PCAt = α20 + β21BRt-1 + γ21UC_PCAt-1 + δ21CC_PCAt-1 + θ21Esmootht-1 + Controlst + ε21 (12)
CC_PCAt = α30 + β31BRt-1 + γ31UC_PCAt-1 + δ31CC_PCAt-1 + θ31Esmootht-1 + Controlst + ε31 (13)
Esmootht = α40 + β41BRt-1 + γ41UC_PCAt-1 + δ41CC_PCAt-1 + θ41Esmootht-1 + Controlst + ε41 (14)
where BR is EDF or Campbell and Controlst in equations (11) to (13) and their predictions are
the same as for equations (4) to (6)27 We consider two types of income smoothing to proxy for
conservatism gaming innate smoothing the product of negative one times the Spearman 26 Auditor resignation data were collected from AuditAnalytics in the WRDS database Among the 124 firms with auditor resignations in our sample 6 occurred in fiscal year 2000 4 in 2001 6 in 2002 18 in 2003 33 in 2004 22 in 2005 23 in 2006 and 12 in 2007 27 Controlst in equation (14) include Leveraget ROAt Ln(MV)t Volatility_ROAt and industry and year dummies which are previously identified determinants of earnings smoothing
27
correlation between accruals and OCF and discretionary smoothing the decile ranking of the
product of negative one times the ratio of the standard deviation of accruals to that of OCF
Insert Table 7 about here
Table 7 report the testing results and reveals that the causal relations between the two
types of conservatism and bankruptcy risk observed above are robust to conservatism gaming
Qualitatively similar results hold for discretionary smoothing (results not tabulated) Table 7
further reveals that innate smoothing Esmootht-1 is significantly negatively associated with
Campbellt consistent with theoretical predictions (Smith and Stulz (1985) and Trueman and
Titman (1988)) and prior findings that innate smoothing reveals information and increases firm
value (Tucker and Zarowin (2006) Leuz et al (2003))28
49 Robustness Checks
Sensitivity Tests for Validity of the VARX Models VARX models may be sensitive to order So we reorder the predictors in each equation
of the VARX models derives qualitatively similar findings A first-differencing specification
for the VARX model finds the results weaker but qualitatively unchanged with autoregressive
coefficients for the two main conservatism measures significantly negative consistent with the
inference from our Dickey-Fuller unit-root tests that taking first-differences may yield biased
results in the VARX models where there is no unit-root Concerns that mean-reversions of
accruals or EDFt and Campbellt could explain certain findings is made unlikely by our design
that utilizes conservatism measures that are three-year smoothing for UC_ACC and CC_ACM
that considerably smooth away mean-reversions and other conservatism measures that are
relatively insensitive to accrual reversals (UC_BM UNC_RES CC_AR and CC_CR)
Moreover in all EDFt and Campbellt regressions the coefficients on EDFt-1 and on Campbellt-1
are significantly positive indicating there are no mean-reverting tendencies in the bankruptcy
risk measures
Alternative Tests for Cash Enhancing and Informational Roles of Conservatism Concerns that firms with weak (strong) cash flow prefers aggressive (conservative)
reporting so it is higher cash holdings that cause higher conservatism and then lower
bankruptcy risk To address this issue we orthogonalize both UC_PCA and CC_PCA by the
lagged value of cash and use the residual value of UC_PCA and CC_PCA to replace their
28 In contrast discretionary smoothing has a weak mitigating effect on bankruptcy risk whereas bankruptcy risk is negatively associated subsequent discretionary smoothing consistent with the argument that discretionary smoothing reduces information transparency (untabulated results available on request)
28
original value and rerun the VARX (1) models for Panel A Table 5 After netting the
endogeneity of both unconditional and conditional conservatism to cash holdings in this way
the results are qualitatively the same as previously reported We also use the upside potentials
of cash holdings to proxy for cash the results do not qualitatively change either Using
earnings forecast errors or earnings forecast dispersions to proxy for information uncertainty
and asymmetry following Zhang (2006) does not change the results FOR Panel B Table 5
We also use the information asymmetry component of PIN score adjPIN (Duarte and Young
(2009)) to measure information uncertainty and asymmetry with the results are qualitatively
unchanged too
Controls for Debt Contracting Debtholdersrsquo and Shareholdersrsquo Interests Whereas results in Panel B of Table 3 suggest that relations between conservatism and
bankruptcy risk still hold for bankrupt firms there remains the question of whether the
observed relations are robust to controls for debt contracting debtholdersrsquo and shareholdersrsquo
interests To address this question we replicate the tests in Panel A of Table 3 introducing
additional controls for private debtholder monitoring leverage auditor going-concern opinions
and credit ratings Private debtholder monitoring is measured as the ratio of the sum of private
long-term debt other long-term debt and capitalized lease obligations to total long-term debt
following Qiang (2007) and leverage is an noisy indicator of higher debt costs larger
debtholder claims more intense monitoring and accentuated conflicts of interests between
shareholders and debtholders A dummy for periods following auditorsrsquo going-concern
opinions proxies for enhanced debtholders control relative to shareholders Untabulated results
reveal that these further controls do not qualitatively change the previously reported causal
associations between conservatism and bankruptcy risk
Senior long-term debt ratings by SampP proxy for the cost of debt and monitoring by rating
agencies on a scale of 1 to 21 with 1 for a ldquoAAArdquo rating and ldquo21rdquo for ldquoDrdquo rating 29
Untabulated results show that the main results previously reported remain qualitatively
unchanged after controlling for credit ratings Its interactions with EDFt-1 and Campbellt-1 are
significantly positive for both UC_PCAt and CC_PCAt and its interactions with EDFt-1 and
Campbellt-1 are negative for CC_PCAt Moreover credit ratings per se are significantly
negatively associated with EDFt and Campbellt and positively associated with UC_PCAt and
CC_PCAt These findings are consistent with both the monitoring role of credit ratings and
with credit ratings inadequately capturing default risk as illustrated by the bankruptcies of 29 SampP rates a firms debt from AAA (indicating a strong capacity to pay interest and repay to SD (the obligor has selectively defaulted on a specific issue or class of obligations) Compustat codes these ratings on a scale from 2 to 29 such that AAA (the best SampP rating) corresponds with 2 and SD (the worst rating) with 29
29
highly-rated firms during the 2008-2009 financial crisis Alternatively we added a dummy to
proxy for the lowest-rated firms (SD and D) and highest-rated firms (AAA) which are subject
to the most intense public monitoring with qualitatively similar findings
Controls for Earnings Management
To examine whether our results are robust to earnings management we rerun the tetra-
variate VARX (1) model consisting of equations (11) to (14) by replacing Esmooth with
Emgmt Untabulated results show that the conclusions about the causal relations between
bankruptcy risk and unconditional and conditional conservatism still hold Importantly both
UC_PCAt-1 and CC_PCAt-1 are negatively associated with subsequent Emgmtt corroborating
Wattsrsquo (2003) and Kothari et alrsquos (2010) reasoning that absent conservatism financial
reporting would be biased upward a priori in practice
Alternative Measure of Unconditional and Conditional Conservatism and Bankruptcy Risk
One may concern that our unconditional conservatism measurement UC_ACC and
UC_RES do not isolate discretionary unconditional conservatism To address that concern we
alternatively use Qiang (2007)rsquos discretionary accrual-based measure to replace UC_ACC and
use the first difference of UC_RES to capture firm-specific discretionary hidden reserve Doing
so does not qualitatively change the previous results in Table 2 As an alternative to the
industry adjusted BM ratio UC_BM we also use Qiang (2007) approach that builds upon
Beaver amp Ryan (2005) to measure unconditional conservatism and the results are qualitatively
the same as using UC_BM We do not use Qiang (2007)rsquos measurement in the main tests
because it is firm-specific and invariant over time which is in appropriate for a time-series
model like VARX
One may concern that CC_AR is subject to potential mechanical relationship with
Campbell since both are functions of leverage size and book-to-market ratio We use the
negative skewness measure in Zhang (2008) to replaces CC_AR the results for Panel A of
Table 2 are qualitatively unchanged suggesting that the mechanical relation problem is not
serious However the skewness measure requires at least previous five yearsrsquo data and thus is
not used in the main tests because doing so could expose our sample to severe survival bias
Using an A_score defined as the ratio of the C score to the sum of C score and G score as in
Khan and Watts (2009) and CC_CR calculated using the direct method following Callen et al
(2009) results does not qualitatively change either We also use the averages (and rankings) of
UC_ACC UC_BM and UNCON_RES to measure unconditional conservatism and those of
30
CC_ACM CC_AR and CC_CR to measure conditional conservatism with qualitatively similar
(more statistically significant) findings (suggesting that ranking increases power by reducing
measurement error)
When the Z-score (Altman (1968)) is used as an alternative bankruptcy risk metric main
results in Tables 2 and 3 are qualitatively unchanged Z-score is accounting-based measure
subject to estimation bias caused by accounting conservatism and it has more missing values
therefore it is not used in the main tests In calculating Campbell we follow Campbell et al
(2009) to winterize stock price lower than $15 up to $15 to avoid estimation bias caused by
small stocks When we drop this limitation the main results do not change for an alternative
Campbell thus calculated
5 Conclusion This study examines relations between accounting conservatism and bankruptcy risk that
follow from conservatismrsquos cash enhancing and informational properties Our primary
findings are a negative association between both unconditional and conditional conservatism
and subsequent bankruptcy risk consistent with conservatismrsquos cash enhancing and
informational roles a positive (negative) association between bankruptcy risk and subsequent
unconditional conservatism consistent with the interests of auditors investors and regulators to
mitigate future failure risk and a negative association between bankruptcy risk and subsequent
and concurrent conditional conservatism consistent with countervailing managerial incentives
to withhold bad news for career motives Further analyses provide confirming evidence that
the cash enhancing and informational roles of conservatism help mitigate bankruptcy and that
regulatorsrsquo and auditorsrsquo monitoring enhance demand for unconditional conservatism as
bankruptcy risk increases The findings are qualitatively unchanged under conditions of
extreme distress and actual bankruptcy and are robust to controls for endogeneity between
unconditional and conditional conservatism debt contracting considerations conservatism
gaming and other controls
These findings have several key implications First they provide evidence consistent
with a traditional rationale for accounting conservatism that it arose in response to requests
from creditors joined in recent times by shareholders auditors and regulators to help conserve
cash and enhance transparency thereby reducing failure risk Second our evidence that
accounting conservatism mitigates bankruptcy risk is consistent with the findings that
conservatism reduces cost of capital and increases trading contracting efficiency (Zhang (2008)
Hui et al (2009b)) but makes contributions by showing that the evidence follows from the cash
31
enhancing and informational roles of conservatism Third this evidence is not only central to
the interests of firmsrsquo stakeholders but also to economic policy makers by helping to dampen
the contagion effects of bankruptcy In this sense this study complements the evidence of
Francis et al (2010) that conservatism benefited shareholders during the 2008-2009 financial
crisis and of Kim and Zhang (2010) that conservatism helps mitigate stock market crash risk
suggesting that conservatism is relevant to economic policy-making
Fourth findings that bankruptcy risk is related differently with subsequent unconditional
and conditional conservatism are consistent with offsetting managerial auditorsrsquo and
regulatorsrsquo interests Lastly our evidence helps inform ongoing debates regarding the role of
conservatism as an enduring core concept of financial accounting
Since this study is the first to examine empirically causal relations as well as
contemporaneous relations between unconditional and conditional conservatism and
bankruptcy risk there is considerable potential for related research For example this study
leaves largely unexplored specific linkages between conservatism and bankruptcy risk that
explain precisely how its cash enhancing and informational properties relate to bankruptcy risk
how bankruptcy risk influences decisions regarding unconditional and conditional
conservatism how these relations are affected by differing economic conditions and whether
they hold in other countries with different institutional arrangements for example in
developing economies and settings with differing bankruptcy provisions or regulations
32
References Ahmed A S Billings B K Morton R M and Stanford-Harris M 2002 The Role of Accounting Conservatism in Mitigating Bondholder-Shareholder Conflicts over Dividend Policy and in Reducing Debt Costs The Accounting Review 77 867ndash890 Ahmed A S and Duellman S 2007 Accounting Conservatism and Board of Director Characteristics An Empirical Analysis Journal of Accounting and Economics 43 411-437 Altman E 1968 Financial Ratios Discriminant Analysis and the Prediction of Corporate Bankruptcy Journal of Finance 23 589ndash609 Anderson R and Sundaresan S 1996 Design and Valuation of Debt Contracts Review of Financial Studies 9 37ndash68 Ball R 2001 Infrastructure Requirements for an Economically Efficient System of Public Financial Reporting and Disclosure Brookings-Wharton Papers on Financial Services 127-270 Ball R Kothari S P and Nikolaev V 2009 Econometrics of the Basu Asymmetric Timeliness Coefficient and the Accounting Conservatism Working paper University of Chicago Ball R and Shivakumar L 2005 Earnings Quality in UK Private Firms Comparative Loss Recognition Timeliness Journal of Accounting and Economics 39 83-125 Barath S T and Shumway T 2008 Forecasting Default with the Merton Distance-to-Default Model Review of Financial Studies 21 1339-1369 Barth M E Landsman W R and Lang M H 2008 International Accounting Standards and Accounting Quality Journal of Accounting Research 46 467-498 Basel III 2010 Basel Committee on Banking Supervision Basu S 1997 The Conservatism Principle and the Asymmetric Timeliness of Earnings Journal of Accounting and Economics 24 3-37 Basu S 2009 Conservatism Research Historical Development and Future Prospects Chinese Journal of Accounting Research 2 1-20 Beaver W H and Ryan S G 2000 Biases and Lags in Book Value and Their Effects on the Ability of the Book-To-Market Ratio to Predict Book Return on Equity Journal of Accounting Research 38 127ndash148 Beaver W H and Ryan S G 2005 Unconditional and conditional Conservatism Concepts and Modeling Review of Accounting Studies 10 269-309 Beneish M and Press E 1993 Costs of Technical Violation of Accounting-Based Debt Covenants The Accounting Review 68 233-257 Biddle G C 1980 Accounting Methods and Management Decisions The Case of Inventory Costing and Inventory Policy Journal of Accounting Research 18 235-280 Biddle G C Ma M and Song M 2011 The Risk Management Role of Accounting Conservatism Working paper University of Hong Kong Black F and Scholes M 1973 The Pricing of Options and Corporate Liabilities Journal of Political Economy 81 637ndash654 Bublitz B and Ettredge M 1989 The Information in Discretionary Outlays Advertising Research and Development The Accounting Review 64 108-124 Bushman R M Piotroski J D and Smith A 2010 Capital Allocation and Timely Accounting Recognition of Economic Losses Working Paper The University of North Carolina at Chapel Hill Callen J L Livnat J and Segal D 2006 Information Content of SEC Filings and Information Environment A Variance Decomposition Analysis The Accounting Review 81 1017-1043
33
Callen J L Segal D and Hope O-K 2010a The Pricing of Conservative Accounting and the Measurement of Conservatism at the Firm-Year Level Review of Accounting Studies 15 145-178 Callen J L Chen F Dou Y and Xin B 2010b Information Asymmetry and the Debt Contracting Demand for Accounting Conservatism Working paper University of Toronto Campbell J Hilscher J and Szilagyi J 2008 In Search of Distress Risk Journal of Finance 53 2899-2939 Carapeto M 2005 Bankruptcy Bargaining with Outside Options and Strategic Delay Journal of Corporate Finance 11 736ndash746 Cefaratti M Dorminey J Lin H and Reed T 2010 The Effect of Litigation Risk on Conservatism A Comparative Study of PSLRA and SOX Working paper Northern Illinois University Chen K and Wei K C 1993 Creditorrsquos Decision to Waive the Violations of Accounting-Based Debt Covenants The Accounting Review 68 218-232 Chen N 2003 Three Essays on Information Asymmetry and Corporate Defaults Columbia University DeFond M and Jiambalvo J 1994 Debt Covenant Violation and Manipulation of Accruals Journal of Accounting and Economics 17 145-176 Demirkan S and Platt H D 2009 Financial Status Corporate Governance Quality and the Likelihood of Managers Using Discretionary Accruals Accounting Research Journal 22 93-117 De Ste Croix G E M 1956 Greek and Roman Accounting pp 14-74 In Littleton A C and Yamey B S ed Studies in the History of Accounting Richard D Irwin Homewood IL Dichev I and Skinner D 2002 Large-Sample Evidence on the Debt Covenant Hypothesis Journal of Accounting Research 40 1091-1123 Doan T 1992 Rats Users Manual Version 40 Estima Duarte J and Young L 2009 Why is PIN priced Journal of Financial Economics 91 119-138 Eberhart A Maxwell W and Siddique A 2008 A Reexamination of the Tradeoff between the Future Benefit and Riskiness of RampD Increases Journal of Accounting Research 46 27-52 Elliott J A and Phibrick D R 1990 Accounting Changes and Earnings Predictability The Accounting Review 65 157-174 Fama E F and French K R 1997 Industry Costs of Equity Journal of Financial Economics 43 153-192 Financial Accounting Standards Board 1980 Statement of Financial Accounting Concepts No 2 Qualitative Characteristics of Accounting Information Financial Accounting Standards Board 2008 Conceptual Framework for Financial Reporting The Objective of Financial Reporting and Qualitative Characteristics and Constraints of Decision-Useful Financial Reporting Information Exposure Draft Financial Accounting Series No 1570-100 Financial Accounting Standards Board 2010 Statement of Financial Accounting Concepts No 8 Conceptual Framework for Financial Reporting Fischer P and Verrecchia R 2000 Reporting Bias The Accounting Review 75 229-245 Francis B Hasan I and Wu Q 2010 The Benefits of Accounting Conservatism to Shareholders Evidence from the Financial Crisis Working paper Rochester Institute of Technology Francis J and Martin X 2010 Acquisition Profitability and Timely Loss Recognition Journal of Accounting and Economics 49 161-178 Franzen L Rodgers K and Simin T 2007 Measuring Distress Risk The Effect of RampD Intensity Journal of Finance 62 2931-2967
34
Giammarino Ronald M 1989 The Resolution of Financial Distress Review of Financial Studies 2 25ndash47 Givoly D and Hayn C 2000 The Changing Time-Series Properties Of Earnings Cash Flows and Accruals Has Financial Reporting Become More Conservative Journal of Accounting and Economics 29 287ndash320 Givoly D Hayn C and Natarajan A 2007 Measuring Reporting Conservatism The Accounting Review 82 65-106 Gox R and Wagenhofer R 2009 Optimal Impairment Rules Journal of Accounting and Economics 48 2ndash16 Granger C W J 1969 Investigating Causal Relations by Econometric Models and Cross-spectral Methods Econometrica 37 424ndash438 Guay W and Verrecchia R E 2007 Conservative Disclosure Working paper University of Pennsylvania Hagerman R and Zmijewski M E 1979 Some Economic Determinants of Accounting Policy Choice Journal of Accounting and Economics 1 141-61 Hertzel M G Officer M S Li Z and Rodgers K J 2008 Inter-Firm Linkages and the Wealth Effects of Financial Distress Along the Supply Chain Journal of Financial Economics 87 374-387 Hillegeist Keating E K Cram D P and Lundstedt K G 2004 Assessing the Probability of Bankruptcy Review of Accounting Studies 9 5-34 Hui K W Morse D and Matsunaga S 2009a The Impact of Conservatism on Management Quantitative Earnings Forecasts Journal of Accounting and Economics 47 192-207 Hui K W Klasa S and Yeung E 2009b Corporate Suppliers and Customers and Accounting Conservatism Working paper Hong Kong University of Science and Technology Jackson S and Liu X T 2009 The Allowance for Uncollectible Accounts Conservatism and Earnings Management Journal of Accounting Research forthcoming Jones J 1991 Earnings Management during Import Relief Investigation Journal of Accounting Research 29 193-228 Jones S 2011 Does the Capitalization of Intangible Assets Increase the Predictability of Corporate Failure Jorion P and Zhang G 2009 Credit Contagion from Counterparty Risk Journal of Finance 64 2053-2087 Keating S and Zimmerman J L 2000 Depreciation-policy Changes Tax Earnings Management and Investment Opportunity Incentives Journal of Accounting and Economics 28 359-389 Khan M and Watts R 2009 Estimation and Empirical Properties of a Firm-Year Measure of Conservatism Journal of Accounting and Economics 48 132-150 Kim J Ramaswamy K and Sundaresan S 1993 Does Default Risk in Coupons Affect the Valuation of Corporate Bonds A Contingent Claims Model Financial Management 117ndash131 Kim J and Zhang L 2010 Does Accounting Conservatism Reduce Stock Price Crash Risk Firm-Level Evidence Working paper City University of Hong Kong Kirschenheiter M and Ramakrishnan R 2010 Prudence Demands Conservatism Working paper University of Illinois at Chicago Kothari S P Shu S and Wysocki P 2009 Do Managers Withhold Bad News Journal of Accounting Research 47 241-276 Kothari S P Ramanna K and Skinner D J 2010 Implications for GAAP from an Analysis of Positive Research in Accounting Journal of Accounting and Economics 50 246-248
35
Krishnan J and Krishnan J 1997 Litigation Risk and Auditor Resignations The Accounting Review 72 539-60 Krishnan G Sun L and Wang Q 2010 Accruals Quality Audit Fees and Auditor Resignations Working paper Lehigh University LaFond R and Watts R 2008 The Information Role of Conservatism The Accounting Review 83 447ndash478 Lang L and Stulz R 1992 Contagion and Competitive Intra-industry Effects of Bankruptcy Announcements Journal of Financial Economics 32 45ndash60 Lara J M G Osma B G and Penalva F 2009 Accounting Conservatism and Corporate Governance Review of Accounting Studies 14 161-201 Lara J M G Osma B G and Penalva F 2010a Conditional Conservatism and Cost of Capital Review of Accounting Studies forthcoming Lara J M G Osma B G and Penalva F 2010b Conditional Conservatism and Firm Investment Efficiency Working paper Universidad Carlos III De Madrid Leuz C Nanda D and Wysocki P 2003 Earnings Management and Investor Protection An International Comparison Journal of Financial Economics 69 505-527 Lev B Sarath B and Sougiannis T 2005 RampD Reporting Biases and Their Consequences Contemporary Accounting Research 22 977-1026 Li J 2008 Accounting Conservatism Information Uncertainty and Analystsrsquo Forecasts Working paper Carnegie Mellon University Li X 2010 Accounting Conservatism and the Cost of Capital International Analysis Working paper London Business School Lobo G J and Zhou J 2006 Did Conservatism in Financial Reporting Increase After the Sarbanes-Oxley Act Initial Evidence Accounting Horizons 20 57-73 Loktionov Y 2009 Does Accounting Quality Mitigate Risk Shifting Working paper Massachusetts Institute of Technology Louis H Sun A and Urcan O 2009 Value of Cash Holdings and Accounting Conservatism Working paper Pennsylvania State University Menon K and Williams D 2008 Management Turnover Following Auditor Resignations Contemporary Accounting Research 25 567ndash604 Merton R C 1974 On The Pricing of Corporate Debt The Risk Structure of Interest Rates Journal of Finance 29 449ndash470 Mooradian R M 1994 The Effect of Bankruptcy Protection on Investment Chapter 11 as a Screening Device Journal of Finance 49 1403ndash1430 Nini G Smith D and Su A 2009 Creditor Control Rights and Firm Investment Policy Journal of Financial Economics 92 400-420 Ohlson J A 1980 Financial Ratios and the Probabilistic Prediction of Bankruptcy Journal of Accounting Research 18 109-131 Parker S Peters G and Turetsky H 2002 Corporate Governance and Corporate Failure A Survival Analysis Corporate Governance 2 4-12 Penman S H and Zhang X 2002 Accounting Conservatism the Quality of Earnings and Stock Returns The Accounting Review 77 237-264 Qiang X 2007 The Effects of Contracting Litigation Regulation and Tax Costs on Unconditional and Conditional Conservatism Cross-Sectional Evidence at the Firm Level The Accounting Review 82 759-796 Qiang X 2008 The Information Role of Unconditional and Conditional Conservatism Working paper Xiamen University Rosner R L 2003 Earnings Manipulation in Failing Firms Contemporary Accounting Research 20 361-408
36
Roychowdhury S and Watts R L 2007 Asymmetric Timeliness of Earnings Market-To-Book and Conservatism in Financial Reporting Journal of Accounting and Economics 44 2-31 Ryan S G 2006 Identifying Conditional Conservatism European Accounting Review 15 511 -525 Shumway T 2001 Forecasting Bankruptcy More Accurately A Simple Hazard Model Journal of Business 74 101-124 Sims C A 1980 Macroeconomics and Reality Econometrica 48 1-49 Smith C W and Stulz R M 1985 The Determinants of Firmsrsquo Hedging Policies Journal of Financial and Quantitative Analysis 20 391-405 Srivastava A and Tse S 2010 The Contribution of Delayed Gain Recognition to Trends in Conservatism A Re-Examination Using a New Approach to Measuring Accounting Conservatism Working paper Northwestern University Sweeney A 1994 Debt-Covenant Violations and Managersrsquo Accounting Responses Journal of Accounting and Economics 17 281-308 Trueman B and Titman S 1988 An Explanation for Accounting Income Smoothing Journal of Accounting Research 26 127-139 Tucker J W and Zarowin P A 2006 Does Income Smoothing Improve Earnings Informativeness The Accounting Review 81 251-270 Uhrig-Homburg M 2005 Cash-flow Shortage as an Endogenous Bankruptcy Reason Journal of Banking and Finance 29 1509ndash1534 Vassalou M and Xing H 2004 Default Risk in Equity Returns Journal of Finance 59 831ndash868 Vuolteenaho T 2002 What Drives Firm-Level Stock Returns Journal of Finance 57 233ndash264 Watts R 2003 Conservatism in Accounting Part I Explanations and Implications Accounting Horizons 17 207ndash221 Wittenberg-Moerman R 2008 The Role of Information Asymmetry and Financial Reporting Quality in Debt Trading Evidence from the Secondary Loan Market Journal of Accounting and Economics 46 240-260 Zmijewski M E 1984 Methodological Issues Related to the Estimation of Financial Distress Prediction Models Journal of Accounting Research 22 59-82 Zhang J 2008 The Contracting Benefits of Accounting Conservatism to Lenders and Borrowers Journal of Accounting and Economics 45 27ndash54 Zhang F 2006 Information Uncertainty and Stock Returns Journal of Finance 61 105-137
37
Table 1 Descriptive Statistics for Main Variables
This table reports the descriptive statistics for the full sample of firm-year observations from 1989 through 2007 Panel A presents the summary statistics and Panel B presents pairwise correlations among bankruptcy risk and accounting conservatism measures The upper (lower) triangle of Panel B displays Pearson product-moment (Spearman) correlations with highlighted figures indicating statistical significance at the 90 confidence level Variable definitions are provided below
Panel A Summary Statistics for the Full Sample Variable Mean Q1 Median Q3 EDF (unranked ) 36502 00000 00000 00558
Campbell (unranked ) 00127 00014 00028 00064
BANK 00059 00000 00000 00000
UC_PCA 03659 01897 03639 05319
UC_ACC -00012 -00218 00010 00209
UC_BM (unranked) -19489 -22175 -13437 -08280
UC_RES 00729 00000 00190 00910
CC_PCA 09188 04394 09534 15941
CC_ACM 00189 00004 00156 00355
CC_AR 21255 12598 19177 28431
CC_CR -03102 -04259 -01237 01165
Leverage 58566 43320 58492 73159
ln(MV) 02540 01290 02478 03622
ROA 00336 00141 00420 00728
STD_Ret 04833 02939 04226 06119
Cash 00868 00131 00417 01156
ΔCash 00061 -00103 00015 00217
Rate 00418 00287 00460 00516
Inten_RD 01261 00054 00219 00612
Monitor 08448 10000 08924 10000
Rating 90508 90000 70000 120000
Esmooth (unranked) 06048 04000 07000 09000
Emgmt -02631 -04550 -02735 -00771
Volatility_ROA 00054 00002 00006 00023
Turn 11700 06405 10352 14803
Eissue 00530 00000 00000 00050
Dissue 02137 -00457 00566 02225
Growth 02649 00051 00858 01955
Nimtaavg 00305 00101 00311 00476
Exretavg -00031 -00244 00002 00226
Rsize -100948 -115031 -100096 -86159
Mb 09042 04510 07442 12077
Price 23341 21401 27081 27081
38
Table 1 Descriptive Statistics for Main Variables (Contrsquod)
Panel B Correlation Matrix for the Full Sample
Variable 1 2 3 4 5 6 7 8 9 10 11
1 EDF 1 07789 00265 -01948 -00333 -02300 -00138 02404 -00023 04880 00671
2 Campbell 07789 1 00348 -00590 00334 -02136 -00025 02468 -00081 04764 00788
3 BANK 00265 00348 1 -00287 -00222 -00256 -00096 00117 -00103 00407 -00035
4 UC_PCA -02168 -02170 -00298 1 01820 09025 04861 -00637 01237 -02020 00104
5 UC_ACC -00274 00397 -00158 01611 1 00517 00489 00029 04819 -00728 00284
6 UC_BM -02303 -02139 -00256 09349 00574 1 00808 -00964 00516 -02485 -00061
7 UC_RES -00474 -01398 -00078 03023 -00390 00411 1 00468 00551 00514 00301
8 CC_PCA 04111 04095 00317 -01441 -00243 -01704 -00028 1 -00062 07160 06850
9 CC_ACM -00204 -00454 -00089 01057 04483 00485 00391 00262 1 -00425 00375
10 CC_AR 04655 04335 00407 -02084 -00901 -02359 -00060 04056 -00591 1 00426
11 CC_CR 01922 02145 00080 -00299 00336 -00426 -00043 09305 00245 01167 1 EDF is the ranking of the expected one-year-ahead default probability from Merton (1974) model Campbell is the ranking of the one-month-ahead probability of business failure calculated based on the formula in the last column of Table III in Campbell et al (2008) BANK proxies for bankruptcy risk and it is a dummy variable equal to one if the firm files for bankruptcy under Chapter 11 or Chapter 7 of the US Bankruptcy code and equal to zero otherwise UC_PCA is the factor score generated from a principal component analysis of the three unconditional conservatism measurements UC_ACC UC_BM and UC_RES Their eigenvalues are 09539 11433 and 09028 their eigenvectors are 05380 06342 and 06721 and their final communality estimates are 02894 04022 and 04517 respectively UC_ACC is equal to minus one times the ratio of total accruals to average total assets calculated over a rolling window of the current year and prior two years UC_BM is the industry-adjusted ranking of minus one times the ratio of book to market value of common shareholders equity at fiscal year-end UC_RES is the ratio of LIFO reserves plus hidden RampD and advertising reserves resulting from the application of unconditional conservatism to total assets estimated as follows UC_RESit = (INVit
res + RDitres + ADVit
res) ATit CC_PCA is the factor score generated from a principal component analysis of the three conditional conservatism measurements CC_ACM CC_AR and CC_CR Their eigenvalues are 10461 10324 and 09214 their eigenvectors are 03176 05468 08040 and their final communality estimates are 01008 02990 and 06464 respectively CC_ACM is minus one times the ratio of accumulated non-operating accruals to accumulated total assets calculated over a rolling window of current year and prior two years CC_AR is the ratio of C score plus G score to G score as defined in Khan and Watts (2009) This study directly uses the formula in Table 3 of Khan and Watts (2009) to calculate the CC_AR CC_CR is the ratio of unexpected current earnings (or current earnings shocks) to total earnings news with the ratio times minus one if earnings news is positive Ln(MV) is the natural logarithm of market capitalization at the end of the fiscal year Leverage is measured as the ratio of book value of long-term debt (Compustat DLTT) and short-term debt (Compustat DLC) to total assets (Compustat AT) ROA is calculated as the ratio of earnings (Compustat NI) over total assets (Compustat AT) STD_Ret is the annualized standard deviation of daily stock return over the prior twelve months Cash is the ratio of cash holdings (Compustat CHE) to total assets (Compustat AT) ΔCash is the ratio of cash flow (Compustat CHECH) to total assets (Compustat AT) Rate is the risk-free rate measured by the annualized three-month T-bill rate retrieved from Federal Reserve Bank Reports Inten_RD is the ratio of RampD expenses (Compustat XRD) to total assets (Compustat AT) SOX is an indicator for the period after the passage of the SOX Act equal to 1 for fiscal years 2003 and after and 0 otherwise Aud_Resign is an indicator for an auditorrsquos resignation from a client firm equal to 1 for the three-year period after auditor resignation and 0 otherwise Emgmt is the factor score generated from a principal component analysis of four earnings management metrics the ranking of absolute value of discretionary accrual DA abnormal operational cash flow R_OCF abnormal discretionary expenses R_DISX and abnormal product cost R_PROD Their eigenvalues are 12992 11747 08823 and 06438 their eigenvectors are 02138 -07195 08136 and -02691 and their final communality estimates are 00473 05177 06619 and 00724 respectively Esmooth proxies for conservatism gaming and is measured as negative one times the Spearman correlation of OCF and accruals with both deflated by average total assets measured using a rolling window of five fiscal years for all available accrual and cash flow data VolatilityROA proxies for earnings variability estimated as the variance of ROA calculated over a rolling window of the current year and prior four years SPOS is an indicator for small positive earnings that
39
equals one if net income scaled by total assets is between 0 and 001 following Barth et al (2008) Turn is measured as sales (Compustat SALE) divided by end-of-year total assets (Compustat AT) following Barth et al (2008) Eissue is annual percentage change in shares of common stock measured as the ratio of the change in shares outstanding at the current and previous fiscal year-ends to the common shares outstanding at previous fiscal year-end (Compustat CSHO) Dissue is annual change in total liabilities (Compustat LT) deflated by beginning-of-year total liabilities following Barth et al (2008) Growth is annual change in sales (Compustat SALE) deflated by sales in previous period Nimtaavg proxies for earnings predictability and it is defined as the present value of the three-year sum of NIMTA the annual net income deflated by total liabilities and market value assuming earnings degenerate at the monthly rate φ = frac12 Nimtaavgt-1t-4 = 1 minus φ 12
1 minus φ 24 ( NIMTA t minus1 t minus 2 + φ 12 NIMTA t minus 2 t minus 3 + φ 24 NIMTA t minus 3 t minus 4 )
Exretavg proxies for return predictability of EXRET (past excess return relative to the value weighted SampP 500 index return over a period of 12 months) and Exretavgt-1t-12 = )(
11
1211
112 minusminus ++minusminus
tt EXRETEXRET φφφ where EXRETit
= log(1+Rit) - log(1 + RSampP500t) and φ = frac12 Rsize proxies for relative firm size calculated as the natural logarithm of market value of equity relative to that of the SampP 500 index Mb is the ratio of firmrsquos market equity value to its book equity value at fiscal year-end Price is calculated as the log of price per share winsorized above $15 following Campbell et al (2008)
40
Table 2 Causal Relations between Unconditional and Conditional Conservatism and
Bankruptcy Risk Estimated by VARX(1) Models
This table reports the SUR estimation results for tri-variate VARX (1) models Bankruptcy risk measures are EDF and Campbell unconditional and conditional conservatism measures are UC_PCA and CC_PCA respectively Model 1 uses EDF UC_PCA and CC_PCA as dependent variables and their one- period lags as autoregressive vectors Model 2 uses Campbell UC_PCA and CC_PCA as dependent variables and their one- period lags as autoregressive vectors Panel A reports the results for the full sample Panel B reports the results for the extremely distressed subsample of firm-year observations in the highest decile of (-ROA) Model details are provided at the end of this table Panel A Tri-variate VARX(1) Model Results for the Full Sample
Model 1 Model 2 Independent Variables EDFt UC_PCAt CC_PCAt Campbellt UC_PCAt CC_PCAt Intercept 03532 00191 29846 03842 00213 30627 (1721) (373) (4656) (1810) (423) (4860) UC_PCAt-1 -00431 06616 00940 -00184 06619 00571 (-882) (18662) (212) (-365) (18670) (129) CC_PCAt-1 -00083 00021 -00128 -00111 00019 -00076 (-1505) (517) (-256) (-1938) (467) (-152) EDFt-1 02459 00389 -02865 (6220) (1361) (-801) Campbellt-1 03340 00388 -04431 (8531) (1416) (-1295) Ln(MV)t -00377 00162 -02663 -00305 00156 -02673 (-6460) (3985) (-5233) (-5188) (3976) (-5453) Leveraget 06452 -00636 03180 04687 -00634 04000 (9517) (-1339) (535) (6779) (-1340) (677) ROAt -04263 -02552 -65643 -09634 -02437 -67519 (-3393) (-2833) (-5821) (-7309) (-2670) (-5917) STD_Rett 03201 01702 (7746) (4006) Casht -00395 -03210 (-435) (-3395) ΔCasht -00600 -01348 (-439) (-952) Ratet -11966 -00947 (-505) (-039) Inten_RDt -00005 00023 -00085 -00011 00024 -00090 (-097) (611) (-178) (-205) (623) (-189) Year and Ind Dum Yes Yes Yes Yes Yes Yes F-statistic 15752 18530 6413 19775 20064 16779
Sample size 34896 34890
Sys weighted R2 06109 05994
Panel B Tri-variate VARX(1) Model Results for the Extremely Distressed Subsample Model 1 Model 2 Independent
Variables EDFt UC_PCAt CC_PCAt Campbellt UC_PCAt CC_PCAt Intercept 02011 00919 30555 02267 00932 31876 (349) (527) (1216) (365) (540) (1283) UC_PCAt-1 -00356 05715 01176 -00090 05709 00864 (-236) (5183) (074) (-056) (5192) (055) CC_ PCAt-1 -00086 00019 00099 -00096 00019 00158 (-533) (165) (058) (-553) (157) (093) EDFt-1 02189 00299 -01227 (1914) (359) (-102) Campbellt-1 02409 00299 -03508 (2077) (379) (-309) Ln(MV)t -00400 00136 -02302 -00305 00133 -02420 (-2396) (1131) (-1331) (-1748) (1146) (-1443) Leveraget 08631 00031 -11485 04519 00059 -10447 (3378) (017) (-436) (1681) (033) (-403)
41
ROAt -01574 -00774 -65650 -02767 -00744 -64869 (-159) (-108) (-633) (-262) (-104) (-627) STD_Rett 03210 01909 (2806) (1548) Casht -00016 -01584 (-007) (-636) ΔCasht -00149 -00582 (-044) (-158) Ratet -10742 -04350 (-166) (-062) Inten_RDt 04858 03453 01069 04634 03449 02349 (638) (631) (014) (568) (631) (030) Year and Ind Dum Yes Yes Yes Yes Yes Yes F-statistic 1755 1292 105 1561 1434 953
Sample size 3488 3488
Sys weighted R2 05893 05125 and indicates a coefficient is significant at 90 95 and 99 confidence level respectively The tri-variate VARX(1) model used in this table consists of the following three equations BRt = α10 + β11BRt-1 + γ11UC_PCAt-1 + δ11CC_PCAt-1 + α11Leveraget + α12ROAt + α13STD_Rett + α14Ln(MV)t + α15Ratet (11)
+ α16Inten_RDt + α17 Casht + α18ΔCasht + sumα1jInd_Dum1j + sumα1k Year_Dum1k + ε11 UC_PCAt = α20 + β21BRt-1 + γ21UC_PCAt-1 + δ21CC_PCAt-1 + α22Leveraget + α23ROAt + α24Ln(MV)t + α25Inten_RDt (12)
+ sumα2jInd_Dum2j + sumα2kYear_Dum2k + ε21 CC_PCAt = α30 + β31BRt-1 + γ31UC_PCAt-1 + δ31CC_PCAt-1 + α32Leveraget + α33ROAt + α34Ln(MV)t + α35Inten_RDt (13)
+ sumα3jInd_Dum3j + sumα3kYear_Dum3k + ε31 where BR = EDF in Model 1 and BR = Campbell in Model 2 F-statistics reported in columns 2 and 5 are for H0 γ11 = 0 and δ11 = 0 F-statistics reported in columns 3 and 6 are for H0 δ21 = 0 and F-statistics reported in columns 4 and 7 are for H0 γ31 = 0
42
Table 3 Causal Relations between Unconditional and Conditional Conservatism and
Bankruptcy Risk for Full Samples Estimated by VARX (3) Models
This table report the SUR estimation results for tri-variate VARX (3) models Bankruptcy risk measures are EDF and Campbell unconditional and conditional conservatism measures are UC_PCA and CC_PCA respectively Model 1 uses EDF UC_PCA and CC_PCA as dependent variables and their one- two- three- period lags as autoregressive vectors Model 2 uses Campbell UC_PCA and CC_PCA as dependent variables and their one- two- three- period lags as autoregressive vectors Model details are provided at the end of this table
Model 1 Model 2 Independent Variables EDFt UC_PCAt CC_PCAt Campbellt UC_PCAt CC_PCAt
Intercept 03315 -00342 26631 03469 -00311 27372 (1838) (-858) (3094) (1960) (-800) (3271) UC_PCAt-1 -00495 07670 -01699 -01637 07675 -03523 (-359) (12513) (-128) (-1190) (12465) (-266) UC_PCAt-2 -00013 01147 03115 01298 01155 04209 (-009) (1882) (237) (950) (1890) (320) UC_PCAt-3 -00034 00312 00404 00068 00302 00770 (-056) (1162) (070) (113) (1122) (133) CC_ PCAt-1 -00064 00014 -00105 -00082 00012 -00021 (-1029) (506) (-177) (-1318) (419) (-036) CC_ PCAt-2 -00069 00018 00245 -00090 00018 00207 (-1114) (639) (412) (-1453) (665) (347) CC_ PCAt-3 -00030 00007 00254 -00035 00008 00231 (-505) (253) (451) (-607) (316) (412) EDFt-1 02790 00316 -05551 (4807) (1232) (-1005) EDFt-2 01091 00086 02038 (1898) (338) (371) EDFt-3 00348 00034 00841 (775) (173) (195) Campbellt-1 03548 00385 -09421 (6065) (1481) (-1684) Campbellt-2 01348 00021 04367 (2289) (082) (771) Campbellt-3 00308 00004 01063 (696) (020) (249) Ln(MV)t -00270 00091 -02514 -00203 00082 -02508 (-3844) (2956) (-3801) (-3047) (2855) (-4040) Leveraget 05335 -00383 03178 03687 -00383 04211 (6714) (-1129) (434) (4797) (-1140) (582) ROAt -04501 -01496 -70033 -09515 -01317 -73962 (-2969) (-2241) (-4862) (-6164) (-1927) (-5030) STD_Rett -00313 -02552 (-295) (-2420) Casht -01172 -02297 (-739) (-1470) ΔCasht 02876 01239 (6112) (2718) Ratet -11380 00793 (-420) (030) Inten_RDt -00038 00058 -00750 -00117 00064 -00798 (-101) (352) (-210) (-315) (389) (-224) Year and Ind Dum Yes Yes Yes Yes Yes Yes F-stat for H0 γ11 + γ12 + γ13 = 0 7210 1848 F-stat for H0 δ11 + δ12 + δ13 = 0 24397 40216 F-stat for H0 β21 + β22 + β23 = 0 31808 9778 F-stat for H0 β31 + β32 + β33 = 0 2563 053 Sample size 26280 26271
Sys weighted R2 07880 07917 AIC number for VARX(1) -397956 -398824 -397824 -396725 -396733 -396733
43
AIC number for VARX(3) -308057 -308065 -308065 -308405 -308413 -308413 and indicates a coefficient is significant at 90 95 and 99 confidence level respectively The tri-variate VARX(3) model used in this table consists of the following three equations BRt = α10 + β11BRt-1 + β12BRt-2 + β13BRt-3 + γ11UC_PCAt-1 + γ12UC_PCAt-2 + γ13UC_PCAt-3 + δ11CC_PCAt-1 + δ12CC_PCAt-2 + (7)
δ13CC_PCAt-3 + α22Leveraget + α12ROAt + α13 STD_Rett + α14Ln(MV)t + α15Ratet + α16Inten_RDt + α17Casht + α18ΔCasht + sumα1j Ind_Dum1j + sumα1k Year_Dum1k + ε11
UC_PCAt = α20 + β21BRt-1 + β22BRt-2 + β23BRt-3 + γ21UC_PCAt-1 +γ22UC_PCAt-2 + γ23UC_PCAt-3 + δ21CC_PCAt-1 + δ22CC_PCAt-2 (8)+ δ23CC_PCAt-3 + α22Leveraget + α23ROAt + α24Ln(MV)t + α25Inten_RDt + sumα2jInd_Dum2j + sumα2kYear_Dum2k + ε21
CC_PCAt = α30 + β31BRt-1 + β32BRt-2 + β33BRt-3 + γ31UC_PCAt-1 + γ32UC_PCAt-2 + γ33UC_PCAt-3 + δ31CC_PCAt-1 + δ32CC_PCAt-2 (9)+ δ33CC_PCAt-3 + α32Leveraget + α33ROAt + α34 Ln(MV)t + α35Inten_RDt + sumα3jInd_Dum3j + sumα3k Year_Dum3k + ε31
where BR = EDF in Model 1 and BR = Campbell in Model 2
44
Table 4 Causal Relations between Unconditional and Conditional Conservatism
and Subsequent Actual Bankruptcy Estimated by Logit Models
This table reports estimation results for logit models that regress the bankruptcy indicator BANK on unconditional and conditional conservatism metrics UC_PCA and CC_PCA and other controlling variables As testing varibles Model 1 uses UC_PCA Model 2 uses CC_PCA and Models 3 to 5 use both UC_PCA and CC_PCA Models 4 and 5 add earnings management (Emgmt) and earnings smoothing (Esmooth) as control variables respectively Model details are provided at the end of the table
Independent Variables Model 1 Model 2 Model 3 Model 4 Model 5 Intercept -267094 -268657 -267027 -267179 -262651 (-1293) (-1301) (-1291) (-1280) (-1198) UC_PCAt-1 -10837 -10844 -10763 -11358 (-238) (-238) (-236) (-244) CC_PCAt-1 00026 00045 00035 -00084 (006) (010) (008) (-019) Emgmtt-1 01775 (068) Esmootht-1 -03326 (-100) Nimtaavgt-1 -18605 -18098 -18543 -18134 -18142 (-148) (-146) (-147) (-144) (-136) Leveraget-1 18871 18253 18850 18818 22959 (246) (239) (247) (246) (273) Exretavgt-1 -65512 -63473 -65619 -66528 -60151 (-232) (-224) (-232) (-234) (-206) Rsizet-1 -02951 -03035 -02939 -02884 -03422 (-320) (-330) (-314) (-303) (-351) STD_Rett-1 13001 12614 12989 12946 12937 (330) (318) (329) (325) (300) Casht-1 -50233 -48829 -50187 -48938 -46751 (-340) (-334) (-339) (-331) (-317) ΔCasht-1 34642 33340 34604 33898 37284 (134) (131) (134) (132) (141) Mbt-1 00633 00068 00627 00776 02711 (025) (003) (024) (031) (108) Pricet-1 08508 08303 08510 08422 08439 (342) (334) (342) (337) (321) Ratet-1 354836 340016 355005 357905 349742 (100) (097) (100) (100) (091) Inten_RDt-1 -191577 -196993 -191563 -189446 -184807 (-209) (-222) (-209) (-204) (-206) Year and Ind Dum Yes Yes Yes Yes Yes Obs 30986 30986 30986 30941 29614 Bankruptcy obs 205 205 205 205 205 Psuedo R-square 02422 02392 02422 02428 02586 and indicates a coefficient is significant at 90 95 and 99 confidence level respectively The logit model used in this table is BANKit = α + γCONit-1 + Controlsit-1 + microt (10)where BANK is the bankruptcy indicator equal to one for bankrupt firms and zero otherwise CON refers to UC_PCA in Model 1 CC_PCA in Model 2 and to both UC_PCA and CC_PCA in Models 3 to 5 In Models 1 to 5 Controls include market-based profitability (NIMTAVG) predictability of excess return (EXRETAVG) market-to-book ratio (Mb) excess firm size (Rsize) leverage ratio (Leverage) liquidity (Cash ratio of cash flow to total assets (ΔCash) return volatility (STD_Ret) stock price (PRICE) risk-free rate (Rate) RampD intensity (Inten_RD) and year and industry dummies
45
Table 5 Cash Enhancing and Informational Roles of Accounting Conservatism
and Causal Relations between Unconditional and Conditional Conservatism and Subsequent Bankruptcy Risk
This table reports SUR estimation results for tri-variate VARX (1) models using conditional and unconditional conservatism bankruptcy risk and their interactions with cash or information asymmetry as autoregressive vectors Bankruptcy risk measures are EDF and Campbell unconditional and conditional conservatism measurements used are UC_PCA and CC_PCA respectively Model details are provided at the end of the table
Panel A Tests for Cash Enhancing Role of Conservatism Model 1 Model 2 Independent Variables
EDFt UC_PCAt CC_PCAt Campbellt UC_PCAt CC_PCAt Intercept 02944 -00308 30679 03040 -00296 31702 (1392) (-827) (3982) (1443) (-804) (4168) UC_PCAt-1Casht-1 -03010 -03437 (-946) (-1085) UC_PCA t-1 -00321 08838 00997 -00067 08839 00620 (-506) (35425) (193) (-106) (35490) (120) CC_PCA t-1Casht-1 -00276 -00115 (-583) (-244) CC_PCAt-1 -00050 00010 -00146 -00092 00008 -00099 (-702) (366) (-262) (-1293) (289) (-177) EDF t-1 03527 00438 -03785 (7754) (2135) (-893) Campbellt-1 04619 00432 -05588 (10704) (2248) (-1408) Controls Yes Yes Yes Yes Yes Yes F-statistic for H0 θ11+ γ11 = 0 13131 14652 F-statistic for H0 δ11+ θ12 = 0 5570 2264 Sample size 30276 30270 Sys weighted R2 06018 05893 Panel B Tests for Information Role of Conservatism
Model 1 Model 2 Independent Variables EDFt UC_PCAt CC_PCAt Campbellt UC_PCAt CC_PCAt
Intercept 03039 -00308 30679 03198 -00296 31702 (1429) (-827) (3982) (1507) (-804) (4168) UC_PCAt-1STD_Rett-1 -00453 -01367 (-300) (-907) UC_PCA t-1 -00305 08838 00997 00346 08839 00620 (-320) (35425) (193) (365) (35490) (120) CC_PCA t-1STD_Rett-1 -00201 -00004 (-1056) (-020) CC_PCAt-1 00026 00010 -00146 -00097 00008 -00099 (240) (366) (-262) (-895) (289) (-177) EDF t-1 03760 00438 -03785 (7780) (2135) (-893) Campbellt-1 04666 00432 -05588 (10688) (2248) (-1408) Controls Yes Yes Yes Yes Yes Yes F-statistic for H0 θ11+ γ11 = 0 6882 12508 F-statistic for H0 δ11+ θ12 = 0 23159 7627 Sample size 30276 30270 Sys weighted R2 07761 07778
and indicates a coefficient is significant at 90 95 and 99 confidence level respectively The tri-variate VARX(1) model used in this table consists of the following three equations BRt = α10 + β11BRt-1 + γ11UC_PCAt-1 + δ11CC_PCAt-1 + θ11Rolet-1UC_PCAt-1 + θ12RoleCC_PCAt-1 + θ13Rolet-1 + Controls + ε11 UC_PCAt = α20 + β21BRt-1 + γ21 UC_PCAt-1 + δ21CC_PCAt-1 + Controls + ε21 CC_PCAt = α30 + β31BRt-1 + γ31UC_PCAt-1 + δ31CC_PCAt-1 + θ32Rolet-1 + Controls + ε31 where Role = Cash and STD_Ret in Panels A and B respectively Controls are the same as those in the corresponding equations (4) to (6)
46
Table 6 SOX Auditor Resignation and Causal Relations between Bankruptcy Risk and Subsequent Unconditional and Conditional Conservatism
This table reports SUR results for tri-variate VARX (1) models with bankruptcy risk unconditional and conditional conservatism as dependent variables and with their one-period lags and interactions with post-SOX SOX and with post-auditor-resignation Aud_resign as autoregressive vectors Bankruptcy risk measures are EDF and Campbell unconditional and conditional conservatism measures are UC_PCA and CC_PCA respectively Model details are provided at the end of the table
Panel A SOX and Causal Relations between Conservatism and Bankruptcy Risk Model 1 Model 2 Independent Variables EDFt UC_PCAt CC_PCAt Campbellt UC_PCAt CC_PCAt
Intercept 03505 00304 29754 03858 00318 30675 (1704) (531) (4608) (1810) (565) (4838) UC_PCAt-1SOX -00322 00009 (-369) (010) UC_PCAt-1 -00327 06636 01056 -00197 06641 00743 (-667) (18404) (260) (-389) (18419) (183) CC_PCAt-1SOX -00007 -00040 (-056) (-313) CC_PCAt-1 -00081 00014 -00130 -00102 00012 -00076 (-1342) (321) (-258) (-1621) (275) (-151) EDFt-1SOX 00105 -00261 (181) (-039) EDFt-1 02456 00316 -02777 (6218) (904) (-703) Campbellt-1SOX 00135 01041 (237) (159) Campbellt-1 03331 00320 -04661 (8515) (958) (-1234) Controls Yes Yes Yes Yes Yes Yes Sample size 34896 34890 Sys weighted R2 06016 05893
Panel B Auditor Resignations and Causal Relations between Conservatism and Bankruptcy Risk Model 1 Model 2 Independent Variables EDFt UC_PCAt CC_PCAt Campbellt UC_PCAt CC_PCAt
Intercept 02311 00116 30028 03840 00011 29924 (432) (032) (698) (719) (003) (701) UC_PCAt-1 -01108 06775 -00284 -00593 06774 -00419 (-279) (2699) (-009) (-149) (2705) (-014) UC_PCA t-1Aud_resignt-1 -00400 00062 (-073) (011) CC_PCA t-1 -00042 00052 -00549 -00215 00050 -00545 (-073) (156) (-138) (-372) (149) (-136) CC_PCAt-1Aud_resignt-1 -00062 00009 (-080) (011) EDF t-1 00910 00235 00515 (334) (099) (018) EDFt-1Aud_resignt-1 00792 00407 (256) (010) Campbellt-1 02751 00437 00965 (1014) (184) (034) Campbellt-1Aud_resignt-1 00522 -01155 (167) (-030) Controls Yes Yes Yes Yes Yes Yes Sample size 732 732 Sys weighted R2 06782 06351
The tri-variate VARX (1) model used in this table consists of the following three equations BRt = α10 + β11BRt-1 + γ11UC_PCAt-1 + δ11CC_PCAt-1 + θ11Expt-1UC_PCAt-1 + θ12Expt-1CC_PCAt-1 + θ13Expt-1 + Controls + ε11 UC_PCAt = α20 + β21BRt-1 + γ21UC_PCAt-1 + δ21CC_PCAt-1 + θ21Expt-1BRt-1 + θ22Expt-1 + Controls + ε21 CC_PCAt = α30 + β31BRt-1 + γ31UC_PCAt-1 + δ31CC_PCAt-1 + θ31Expt-1BRt-1 + θ32Expt-1 + Controls + ε31
where Exp = SOX and Aud_Resign in Panels A and B respectively Controls are the same as in the corresponding equations (4) to (6)
47
Table 8 Conservatism Gaming and Causal Relations between Unconditional and Conditional Conservatism and Bankruptcy Risk
This table reports the SUR estimation results for tetra-variate VARX (1) models with bankruptcy risk unconditional and conditional conservatism and conservatism gaming as dependent variables and their one-period lags as autoregressive vectors Bankruptcy risk measures are EDF and Campbell Model 1 uses EDF UC_PCA CC_PCA and Esmooth as the autoregressive vector Model 2 uses Campbell UC_PCA CC_PCA and Esmooth as the autoregressive vector Model details are provided at the end of this table
Model 1 Model 2 Independent Variables EDFt UC_PCAt CC_PCAt Esmootht Campbellt UC_PCAt CC_PCAt EsmoothtIntercept 04339 00191 29232 01992 04795 00214 30107 01979 (2776) (362) (4349) (1507) (2957) (411) (4550) (1518)UC_PCAt-1 -00463 06789 01222 -00264 -00215 06792 00823 -00261 (-894) (18510) (262) (-287) (-402) (18508) (177) (-284) CC_PCAt-1 -00077 00018 -00129 00010 -00110 00016 -00077 00009 (-1334) (444) (-246) (096) (-1833) (393) (-146) (091) Esmootht-1 00009 -00029 -00424 07185 -00041 -00030 -00451 07186 (042) (-194) (-220) (18928) (-185) (-198) (-234) (18930)EDFt-1 02510 00405 -02684 -00023 (6004) (1371) (-715) (-031) Campbellt-1 03405 00396 -04287 -00003 (8213) (1401) (-1195) (-005) Ln(MV)t -00374 00157 -02657 -00010 -00308 00151 -02675 -00009 (-6102) (3762) (-4991) (-092) (-4970) (3745) (-5221) (-085) Leveraget 06472 -00685 02969 00516 04698 -00680 03835 00505 (8993) (-1393) (474) (419) (6390) (-1388) (616) (412) ROAt -04005 -02626 -64814 00991 -09346 -02513 -66653 01003 (-3075) (-2883) (-5591) (435) (-6824) (-2721) (-5680) (434) STD_Rett 03233 01706 (7466) (3825) Casht -00341 -03149 (-358) (-3166) ΔCasht -00685 -01386 (-481) (-938) Ratet -20966 -11019 (-1123) (-570) Inten_RDt -00005 00023 -00080 -00010 00023 -00085 (-089) (615) (-170) (-193) (628) (-181) volatility_ROAt -00110 -00102 (-048) (-045) Year and Ind Dum Yes Yes Yes Yes Yes Yes Yes Yes F-statistic 13383 18803 5110 17980 19644 14280
Sample size 32361 32355 Sys weighted R2 06080 05990 and indicates a coefficient is significant at 90 95 and 99 confidence level respectively The tetra-variate VARX(1) model used in this table consists of the following four equations BRt = α10 + β11BRt-1 + γ11UC_PCAt-1 + δ11CC_PCAt-1 + θ11Esmootht-1 + Controls + ε11 (11)UC_PCAt = α20 + β21BRt-1 + γ21UC_PCAt-1 + δ21CC_PCAt-1 + θ21Esmootht-1 + Controls + ε21 (12)CC_PCAt = α30 + β31BRt-1 + γ31UC_PCAt-1 + δ31CC_PCAt-1 + θ31Esmootht-1 + Controls + ε31 (13)Esmootht = α40 + β41BRt-1 + γ41UC_PCAt-1 + δ41CC_PCAt-1 + θ41Esmootht-1 + α41Leveraget + α42ROAt + α43Ln(MV)t (14)
+ α44Volatility_ROAt + sumα4jInd_Dumj + sumα4kYear_Dum4k + ε41 where BR = EDF and Campbell in Models 1 and 2 respectively F-statistics in columns 2 and 6 are for H0 γ11 = 0 δ11 = 0 in columns 3 and 7 for H0 β21 = 0 in columns 4 and 8 for H0 β31 = 0 Controls in equations (11) to (13) are the same as in equations (4) to (6)
Health Stage Distress Stage Bankruptcy Stage
T=1 Technical Default
T=2 Default Cash Shortage
T=3 Bankruptcy Bankruptcy Petition
Waiver Private Workouts Liquidation under Chapter 7 or Reorganization under Chapter 11
Technical Default Region Default Region
Figure 1 Bankruptcy Timeline
Time T=0 Borrowing Money
Appendix A Causal Relations between Unconditional Conservatism and Bankruptcy Risk and between Conditional Conservatism and Bankruptcy Risk
This appendix reports estimation models and results for examining relations between unconditional conservatism and bankruptcy risk using bi-variate VARX (1) In particular the bi-variate VARX (1) model consisting of equations (1a) and (2a) tests hypotheses H1a and H2a BRt = α10 + β11BRt-1 + γ11UCt-1 + Controlst + ε11 (1a) UCt = α20 + β21BRt-1 + γ21UCt-1 + Controlst + ε21 (2a) where UC refers to an unconditional conservatism metric UC_ACC UC_BM UC_RES or UC_PCA and BR refers to a bankruptcy risk measure EDF or Campbell The autoregressive vector includes BRt-1 and UCt-1 Exogenous Controlst in equations (1b) and (2b) are the same as in equations (4) and (5) respectively H1a and H1b predict that γ11 lt 0 and β21 gt 0 respectively and Table A1 reports the SUR estimation results
Table A1 Causal Relations between Unconditional Conservatism and Bankruptcy Risk
This table reports the SUR estimation results for bi-variate VARX (1) models consisting of equations (1b) and (2b) Panel A (Panel B) presents results for models using EDF (Campbell) bankruptcy risk measure Unconditional conservatism measures used in both panels are and UC_PCA UC_BM UC_ACC and UC_RES Model details are provided at the end of this table Panel A VARX (1) Model Results when Bankruptcy Risk is EDF
Model 1 Model 2 Model 3 Model 4 Independent Variables
EDFt UC_PCAt EDFt UC_BMt EDFt UC_ACCt EDFt UC_RESt Intercept 03426 00224 03397 -00342 03403 -00068 03365 00979 (1666) (440) (1660) (-524) (1611) (-458) (1591) (1985) UC_PCAt-1 -00458 06624 (-935) (18696) UC_BMt-1 -00310 07169 (-857) (21191) UC_ACCt-1 -01087 05198 (-554) (12107) UC_RESt-1 -00155 04717 (-255) (10882) EDFt-1 02387 00409 02386 00709 02465 00051 02463 -00127 (6065) (1442) (6032) (1935) (6352) (606) (6346) (-459) Ln(MV)t -00362 00158 -00364 00199 -00373 00023 -00374 -00008 (-6282) (3960) (-6334) (3876) (-6538) (1934) (-6553) (-208) Leveraget 06461 -00639 06432 -00132 06356 -00173 06345 -00947 (9500) (-1345) (9426) (-214) (9329) (-1209) (9288) (-2004) ROAt -04196 -02572 -04186 00106 -04291 -01458 -04265 -03507 (-3331) (-2856) (-3322) (091) (-3398) (-5379) (-3372) (-3927) STD_Rett 03161 03131 03029 03058 (7635) (7618) (7125) (7160) Casht -00388 -00477 -00457 -00557 (-426) (-350) (-323) (-393) ΔCasht -00638 -00694 -00703 -00715 (-465) (-768) (-748) (-757) Ratet -11990 -11148 -11902 -11492 (-504) (-472) (-485) (-468) Inten_RDt -00005 00023 -00005 00006 -00005 -00002 -00005 00045 (-100) (611) (-093) (123) (-093) (-168) (-093) (1189) Year and Ind Dum Yes Yes Yes Yes Yes Yes Yes Yes F-statistic 8751 20808 7344 37450 3074 3677 650 2103
Sample size 34896 34896 34896 34896 Sys weighted R2 06857 07035 05821 05962
Panel B VARX (1) Model Results when Bankruptcy Risk is Campbell Model 1 Model 2 Model 3 Model 4 Independent
Variables Campbellt UC_PCAt Campbellt UC_BMt Campbellt UC_ACCt Campbellt UC_RESt Intercept 03726 00347 03672 -00351 03751 -00059 03717 00668 (1743) (666) (1732) (-548) (1712) (-403) (1698) (1945)
50
UC_PCAt-1 -00231 05811 (-498) (17212) UC_BMt-1 -00150 07187 (-401) (21272) UC_ACCt-1 -00067 05183 (-033) (12045) UC_RESt-1 -00134 05221 (-165) (13262) Campbellt-1 03222 00337 03211 00772 03244 00040 03246 -00042 (8295) (1200) (8207) (2211) (8425) (499) (8455) (-227) Ln(MV)t -00285 00170 -00287 00191 -00295 00022 -00293 00020 (-4908) (4267) (-4945) (3880) (-5125) (1913) (-5099) (757) Leveraget 04709 -00712 04672 -00168 04615 -00168 04624 -00906 (6773) (-1446) (6702) (-275) (6629) (-1176) (6622) (-2725) ROAt -09579 -02793 -09612 00349 -09673 -01453 -09659 -03136 (-7233) (-2942) (-7260) (298) (-7291) (-5291) (-7247) (-4890) STD_Rett 01655 01634 01549 01576 (3868) (3862) (3532) (3588) Casht -01368 -01234 -01196 -01334 (-958) (-872) (-813) (-908) ΔCasht -03227 -03498 -03615 -03507 (-3387) (-3711) (-3681) (-3551) Ratet -01104 00047 -00734 -00593 (-045) (002) (-029) (-023) Inten_RDt -00011 00025 -00011 00007 -00011 -00002 -00011 00031 (-210) (636) (-203) (141) (-200) (-165) (-202) (1171) Year and Ind Dum Yes Yes Yes Yes Yes Yes Yes Yes F-statistic 1970 22845 1609 48885 011 2490 271 516 Sample size 34890 34890 34890 34890
Sys weighted R2 06742 06960 06965 06242 and indicates a coefficient is significant at 90 95 and 99 confidence level respectively The bi-variate VARX (1) model used in this table consists of the following two equations BRt = α10 + β11BRt-1 + γ11CONt-1 + α11Leveraget + α12ROAt + α13STD_Rett + α14Ln(MV)t + α15Ratet + α16Inten_RDt (1b)
+ α17Casht + α18ΔCasht + sumα1jInd_Dum1j + sumα1kYear_Dum1k + ε11 CONt = α20 + β21BRt-1 + γ22CONt-1 + α21Leveraget + α22ROAt + α23Ln(MV)t + α24Inten_RDt + sumα2jInd_Dum2j (2b)
+ sumα2kYear_Dum2k + ε21 where BR = EDF in Panel A and BR = Campbell in Panel B CON = UC_PCA in Model 1 CON = UC_BM in Model 2 CON = UC_ACC in Model 3 and CON = UC_RES in Model 4 F-statistics reported in columns 2 4 6 and 8 are for H0 γ11 = 0 those reported in columns 3 5 7 and 9 are for H0 β21 = 0
Panel A of Table A1 reveals that all four measures of unconditional conservatism UC_PCAt-1 UC_BMt-1 UC_ACCt-1 and UC_RESt-1 are significantly negatively associated with the subsequent bankruptcy risk as measured by EDFt Panel B reports the same pattern for Campbellt For the null hypothesis that the predictor coefficients for EDFt and Campbellt are equal to zero the F-statistics are all significant beyond the 95 confidence level except for UC_ACCt-1 in Panel B These results support hypothesis H1a in suggesting that the cash enhancing and informational roles of unconditional conservatism lowers subsequent bankruptcy risk
Table A1 further shows that EDFt-1 and Campbellt-1 are significantly positively associated with subsequent unconditional conservatism except for UC_RES suggesting that prior bankruptcy risk Granger-causes subsequent unconditional conservatism consistent with hypothesis H1b UC_RESt exhibits negative coefficients (t-statistics) of -00127 (-459) for EDFt-1 in Panel A and -00042 (-227) for Campbellt-1 in Panel B Although this result is inconsistent with H1b it is consistent with the intuition that extreme unconditional conservatism in the form of immediate expensing of RampD and advertising expenditures is detrimental to managersrsquo career motives and dominates managersrsquo disciplinary concerns and auditor and regulator interests resulting in disincentives for UC_RESt as bankruptcy risk rises Nor does this negative association for UC_RESt qualitatively change the positive association between bankruptcy risk and subsequent unconditional conservatism exhibited by the combined measure UC_PCAt For the null hypothesis that the predictor coefficients for UC_PCAt UC_BMt UC_ACCt and UC_RESt are equal to zero F-statistics indicate rejection beyond the 95 confidence level Overall these findings support hypothesis H1b in suggesting that bankruptcy risk stimulates subsequent unconditional conservatism consistent with the interests of auditors creditors and regulators offsetting managersrsquo career motives in the case of unconditional conservatism as predicted The signs of the coefficients of the exogenous control variable are also consistent with predictions For example EDFt and Campbellt are generally positively associated with Leveraget and STD_Rett and negatively associated with ROAt Ln(MV)t Ratet Casht ΔCasht and Inten_RDt
51
Appendix B Causal Relations between Conditional Conservatism and Bankruptcy Risk This appendix reports estimation results regarding examining relations between conditional conservatism and bankruptcy risk using bi-variate VARX (1) In particular the following bi-variate VARX (1) model consisting of equations (1b) and (2b) tests hypotheses H1b and H2b regarding causal relations between conditional conservatism and bankruptcy risk BRt = α10 + β11BRt-1 + γ11CCt-1 + Controlst + ε11 (1b) CCt = α20 + β21BRt-1 + γ21CCt-1 + Controlst + ε21 (2b) where CC refers to a conditional conservatism metric CC_ACM CC_AR CC_CR or CC_PCA and BR refers to a bankruptcy risk measure EDF or Campbell The autoregressive vector includes BRt-1 and CCt-1 Controlst in equations (3b) and (4b) are the same as in equations (4) and (6) respectively with the same predictions H1b and H2b predict that γ11 lt 0 and β21 lt 0 respectively and Table B1 reports the SUR estimation results
Table B1 Causal Relations between Conditional Conservatism and Bankruptcy Risk
This table reports the SUR estimation results for bi-variate VARX (1) models consisting of equations (1b) and (2b) Panel A (Panel B) presents results for models using EDF (Campbell) bankruptcy risk measure Conditional conservatism measurements are CC_PCA CC_AR CC_CR and CC_ACM Model details are provided at the end of this table
Panel A Bivaiate VARX (1) Model Results when Bankruptcy Risk is EDF Model 1 Model 2 Model 3 Model 4 Independent
Variables EDFt CC_PCAt EDFt CC_ARt EDFt CC_CRt EDFt CC_ACMt Intercept 03478 30130 06136 38327 03369 03381 03368 00051 (1648) (4806) (2970) (18658) (1592) (443) (1592) (377) CC_PCAt-1 -00084 -00124 (-1526) (-247) CC_ARt-1 -00724 02947 (-5920) (9398) CC_CRt-1 -00009 -00260 (-206) (-506) CC_ACMt-1 -00570 05317 (-254) (11959) EDFt-1 02531 -02990 03006 -03017 02468 -03311 02463 -00054 (6497) (-847) (7855) (-3083) (6348) (-769) (6346) (-707) Ln(MV)t -00389 -02648 -00641 -03903 -00374 00174 -00373 00010
(-6739) (-5256) (-8955)(-21572) (-6558) (286) (-6533) (890)
Leveraget 06343 03211 06495 09121 06345 -02801 06350 00065 (9334) (540) (9984) (5687) (9306) (-384) (9313) (503) ROAt -04323 -65718 -03462 -07408 -04274 -78724 -04252 -00695 (-3433) (-5830) (-2861) (-2428) (-3378) (-5678) (-3368) (-2833) STD_Rett 03088 03451 03040 03052 (7269) (8517) (7135) (7161) Casht -00780 -01184 -00776 -00796 (-833) (-1328) (-826) (-848) ΔCasht -00484 -00161 -00526 -00512 (-342) (-120) (-371) (-361) Ratet -11459 -14083 -11560 -11476 (-468) (-604) (-470) (-467) Inten_RDt -00005 -00084 -00006 -00020 -00005 -00087 -00005 -00003 (-089) (-177) (-112) (-154) (-091) (-149) (-089) (-246) Year and Ind Dum Yes Yes Yes Yes Yes Yes Yes Yes F-statistic
23276 7182 350580 95078 426 5909 648 4997
Sample size 34890 34896 34896 34896 Sys weighted R2 05516 08353 05263 05670 Panel B Bivaiate VARX (1) Model Results when Bankruptcy Risk is Campbell
Model 1 Model 2 Model 3 Model 4 Independent Variables Campbellt CC_PCAt Campbellt CC_ARt Campbellt CC_CRt Campbellt CC_ACMt Intercept 03872 30793 06594 37606 03691 05207 03730 00062 (1775) (4992) (3078) (18283) (1686) (694) (1703) (463)
52
CC_PCAt-1 -00110 -00073 (-1934) (-146) CC_ARt-1 -00721 02883 (-5488) (8802) CC_CRt-1 -00035 -00228 (-731) (-445) CC_ACMt-1 -00376 05323 (-162) (11981) Campbellt-1 03353 -04505 04035 -01588 03261 -06585 03241 -00076 (8681) (-1336) (10264) (-1629) (8480) (-1607) (8442) (-1044) Ln(MV)t -00315 -02663 -00579 -03824 -00294 00070 -00294 00009 (-5420) (-5509) (-7807) (-21063) (-5118) (121) (-5112) (905) Leveraget 04599 04018 04722 08396 04603 -01020 04610 00077 (6642) (680) (7079) (5210) (6618) (-141) (6623) (596) ROAt -09714 -67584 -08700 -07316 -09720 -81852 -09665 -00727 (-7362) (-5929) (-6769) (-2331) (-7323) (-5844) (-7286) (-2926) STD_Rett 01608 01480 01569 01567 (3682) (3541) (3579) (3570) Casht -03607 -03421 -03627 -03665 (-3700) (-3675) (-3705) (-3742) ΔCasht -01209 -01017 -01235 -01227 (-827) (-727) (-841) (-835) Ratet -00478 -02909 -00326 -00475 (-019) (-120) (-013) (-019) Inten_RDt -00010 -00089 -00011 -00022 -00011 -00094 -00011 -00003 (-195) (-188) (-221) (-169) (-197) (-161) (-197) (-255) Year and Ind Dum Yes Yes Yes Yes Yes Yes Yes Yes F-statistic
37387 16627 301392 26565 5343 25829 263 10891
Sample size 34890 34890 34890 34890 Sys weighted R2 05300 08111 05043 05471 and indicates a coefficient is significant at 90 95 and 99 confidence level respectively The bi-variate VARX (1) model used in this table consists of the following two equations BRt = α10 + β11BRt-1 + γ11CONt-1 + α11Leveraget + α12ROAt + α13STD_Rett + α14 Ln(MV)t + α15Ratet + α16Inten_RDt (1b)
+ α17Casht + α18ΔCasht + sumα1jInd_Dum1j + sumα1kYear_Dum1k + ε11 CONt = α20 + β21BRt-1 + γ22CONt-1 + α21Leveraget + α22ROAt + α23Ln(MV)t + α24Inten_RDt + sumα2jInd_Dum2j (2b)
+ sumα2kYear_Dum2k + ε21 where BR = EDF in Panel A and BR = Campbell in Panel B CON = CC_PCA in Model 1 CON = CC_AR in Model 2 CON = CC_CR in Model 3 and CON = CC_ACM in Model 4 F-statistics reported in columns 2 4 6 and 8 are for H0 γ11 = 0 those reported in columns 3 5 7 and 9 are for H0 β21 = 0
Panel A of Table B1 reveals that all four measures of conditional conservatism CC_PCAt-1 CC_ARt-1 CC_CRt-1 and CC_ACMt-1 are negatively associated with subsequent bankruptcy risk measured by EDFt and Panel B reveals the same pattern for Campbellt-1 For the null hypothesis that the predictor coefficients for EDFt and Campbellt are equal to zero the F-statistics are all significant beyond the 90 confidence level except for CC_ACMt-1 in Panel B These findings suggest that conditional conservatism reduces subsequent bankruptcy risk consistent with the cash enhancing and informational properties of conditional conservatism as predicted by hypothesis H2b Table B1 further shows that bankruptcy risk metrics EDFt-1 and Campbellt-1 are uniformly negatively associated with subsequent conditional conservatism measured by CC_PCAt CC_ARt CC_CRt and CC_ACMt These findings suggest that prior bankruptcy risk lowers subsequent conditional conservatism consistent with hypothesis H2b For the null hypothesis that the predictor coefficients for CC_PCAt CC_ARt CC_CRt and CC_ACMt are equal to zero F-statistics are all significant beyond the 99 confidence level These findings support hypothesis H2b in suggesting that bankruptcy risk reduces subsequent conditional conservatism and is consistent with the notion that although it mitigates subsequent bankruptcy risk conditional conservatism is resisted by managers whose career motives dominate their disciplinary concerns as predicted
2
Accounting Conservatism and Bankruptcy Risk
1 Introduction This study examines relations between accounting conservatism and bankruptcy risk
Our results reveal negative associations between both unconditional and conditional
conservatism and subsequent bankruptcy risk that follow from conservatismrsquos accrual nature
cash enhancing and informational properties Bankruptcy risk is found to be positively related
to subsequent unconditional conservatism consistent with auditor and regulator incentives and
negatively related to subsequent conditional conservatism consistent with offsetting
managerial incentives to withhold bad news Overall our findings lend support to a traditional
economic rationale for accounting conservatism that will help inform ongoing debates
regarding its continuing role as a central tenet of financial accounting
Whereas historical evidence indicates that accounting conservatism arose at least a
millennium ago in response to demands by capital providers to inform lending and liquidation
decisions and potentially reduces failure risk (De Ste Croix (1956) Watts (2003) Basu
(2009)) prior empirical evidence is mixed Some studies find conservatism to reduce debt
costs (and by inference bankruptcy risk)1 Others find positive relations between conservatism
and debt covenant violations (eg DeAngelo et al (1994) DeFond and Jiambalvo (1994)
Sweeney (1994) and Zhang (2010)) suggests that conservatism are positively correlated with
bankruptcy risk Jones (2011) document that RampD capitalization increases corporate failure
implying that RampD expensing mitigates corporate failure However RampD expensing is an
extreme form of unconditional conservatism and its evidence cannot be readily generalized to
other types of unconditional and conditional conservatism Hence relations between
accounting conservatism and bankruptcy risk still wait to be explored
Evidence that accounting conservatism lowers bankruptcy risk is central to the interests
of debtholders and other stakeholders including shareholders (dividends and capital gains)
managers and employees (career and compensation) customers (products and services)
suppliers (sales) auditors and regulators (compliance) and governments (tax revenues) It is
also a precursor to assessing conservatismrsquos role in dampening economic panics and crises
with significant implications for economic policy making Recent financial crises have
heightened interest in mechanisms that promote cash adequacy and solvency given the
1 Zhang (2008) for example documents that conservatism can help lower initial interest rates in lending contracts Ahmed and Duellman (2002) Wittenberg-Moerman (2008) and Li (2010) document that accounting conservatism reduces the carrying costs of debt Hui et al (2009b) document that suppliers prefer customers with conservative reporting
3
contagion effects of bankruptcy risk within industries along the supply chains and between
nonfinancial and financial sectors2
Evidence regarding relations between accounting conservatism and bankruptcy risk will
also help inform ongoing debates regarding conservatismrsquos continuing role as both a pervasive
characteristic and longstanding tenet of financial accounting In Statement of Financial
Accounting Concepts (SFAC) No 2 the Financial Accounting Standards Board (FASB)
defined conservatism as ldquoa prudent reaction to uncertainty to ensure that uncertainty and risks
inherent in business situations are adequately consideredrdquo (FASB (1980) p 10) This
definition is consistent with conservatism being relevant to assessing bankruptcy risk
However the FASB and the International Accounting Standards Board (IASB) removed
conservatism from their conceptual framework in 2010 because it violates neutrality3 In its
exposure draft for the Conceptual Framework for Financial Reporting (FASB (2008)) the
FASB argued that conservatism may produce information asymmetries that reduce investor
insights into future cash flows from growth options4 In contrast Kothari et al (2010) argue
that the broader economic consequences of accounting standards are of first-order significance
while their role in equity valuation is of secondary significance
Recent studies distinguishing between unconditional and conditional conservatism
motivate a further examination of whether these two types of conservatism relate to bankruptcy
risk differently (Beaver and Ryan (2005) Qiang (2007) Ball et al (2009)) They observe that
conservatism can arise either ldquounconditionallyrdquo via inherently conservative accounting
principles or ldquoconditionallyrdquo via a more timely recognition of bad versus good news Their
evidence suggests that unconditional and conditional conservatism can play different roles in
contracting regulation taxation valuation and in reducing information asymmetries (Qiang
(2007 2008)) and that they are negatively (positively) correlated in the short (long) run
(Beaver and Ryan (2005) Roychowdhury and Watts (2007) Ball et al (2009)) They further
suggest that auditors and regulators focus primarily on unconditional conservatism litigation
risk induces both and that managers exercise more control over conditional conservatism at
2 Specifically Lang and Stulz (1992) document ldquocontagiousrdquo valuation effects of bankruptcy announcements within the same industry Hertzel et al (2008) show that bankruptcy filings generate wealth effects for suppliers and customers along the supply chain and Jorion et al (2009) provide evidence regarding credit contagions via counter-party effects suggesting that borrowing firmsrsquo bankruptcy announcements cause negative abnormal equity returns and increase credit default swap spreads among creditors 3 The FASBrsquos Conceptual Framework defines and describes basic concepts by which financial statements are prepared and identifies qualitative characteristics that make information in financial statements useful It serves as a guide to the Board in developing accounting standards and in resolving accounting issues not addressed directly by an existing standard The IASB has a corresponding Conceptual Framework These frameworks were combined into a unified set of accounting concepts and principles in SFAC No 8 (FASB 2010) 4 Similarly Penman and Zhang (2002) and Lev et al (2005) present evidence that the expensing of research and development costs reduces the value relevance of accounting information and causes market mispricing
4
least in the short run preferring counter-conservative treatments for career advancement (Watts
(2003) Qiang (2007) Kothari et al (2010)) Thus this study examines causal relations
between both unconditional and conditional conservatism and bankruptcy risk
That conservatism should influence subsequent bankruptcy risk is suggested by recent
studies of its cash enhancing and informational properties Specifically they find that
accounting conservatism reduces cash outflows by mitigating capital overinvestment reducing
risk-shifting delaying economic losses promoting precautionary savings and lowering agency
costs (Lara et al (2010a) Callen et al (2010) Kirschenheiter and Ramakrishnan (2010)
Srivastava and Tse (2010)) Others find conservatism increases cash inflows from operations
by evoking more favorable terms from trading partners and by reducing investment distortion
(Hui et al (2009b) Lara et al (2010a) Bushman et al (2010)) These cash enhancing
properties of conservatism should reduce subsequent bankruptcy risk since bankruptcy is
fundamentally a condition of cash insufficiency (Kim et al (1993) Uhrig-Homburg (2005)
Campbell et al (2008)
Recent evidence further suggests that conservatism lessens information uncertainty and
asymmetry via less optimistic reporting of net income and assets and more timely reporting of
bad news (Watts (2003) Guay and Verrechia (2007)) This informational role of conservatism
also enhances cash flows and reduces bankruptcy risk as better informed investors and trading
partners provide more favorable financing and contracting terms Under conditions of distress
conservatism facilitates negotiations and workouts among creditors equity holders trading
partners labor unions and other claimholders thus helping avoid bankruptcy filings
(Giammarino (1989) Mooradian (1994)) The cash-enhancing and informational properties of
conservatism suggest negative causal relations between both unconditional and conditional
conservatism and subsequent bankruptcy risk
That bankruptcy risk influences subsequent conservatism follows from the reasoning that
higher bankruptcy risk induces conservative treatments that enahnce cash and reduce
information uncertainty thereby reducing future bankruptcy risk Auditors and regulators pay
particular attention to unconditional conservatism as bankruptcy risk increases because
unconditional conservatism is is easy to monitor is the major contributor to total
conservatism and is not bad-news-driven ((Ryan (2006) and Qiang (2007)) In contrast
managers on average resist both unconditional and conditional conservatism to advance their
careers and to justify spending and portray more favorable performance especially when
bankruptcy risk increases and their ability to do so is stronger for conditional conservatism
The equilibrium tradeoff between the tension between auditorsrsquo and regulatorsrsquo interests and
5
managersrsquo career motives as bankruptcy risk increases suggest that bankruptcy risk is
positively associated with subsequent unconditional conservatism and negatively associated
with subsequent conditional conservatism
These predictions are tested using US firm-year observations for the period 1989-2007
with available data for unconditional and conditional conservatism bankruptcy risk and control
variables Two of the three bankruptcy risk measures are continuous ex ante estimates derived
from Merton (1974) and Campbell et al (2008) respectively that permit tests of causal
relations between accounting conservatism and bankruptcy risk The third measure is an ex
post discrete (zero-one) indicator of actual bankruptcy filings Four measures of unconditional
conservatism are considered total accruals (adapted from Ahmed and Duellman (2007)) rank
of industry-adjusted book-to-market ratio (eg Ahmed et al (2002) Zhang (2008)) hidden
reserves (Penman and Zhang (2002)) and a factor score from a principal components analysis
of the above three metrics Four measures of conditional conservatism are likewise examined
accumulated non-operating accruals adapted from Zhang (2008) an extended measure of Khan
and Watts (2009) a CR ratio measure adapted from Callen et al (2010a) and a factor score
from a principal component analysis of the above three metrics We mainly employ tri-variate
VARX (1) and tri-variate VARX (3) models to examine causal relations between conservatism
and bankruptcy risk extending Lara et al (2009)
Our main results confirm the above predictions (1) Unconditional and conditional
conservatism are negatively associated with subsequent bankruptcy risk consistent with
conservatismrsquos cash enhancement and informational properties serving to mitigate bankruptcy
risk (2) Bankruptcy risk is positively associated with subsequent unconditional conservatism
consistent with auditorsrsquo and regulatorsrsquo interests and negatively associated with subsequent
conditional conservatism consistent with countervailing managerial incentives to withhold bad
news to advance their careers (3) These findings are similar for extremely distressed firms and
for firms that actually declare bankruptcy
In further analyses we use VARX (1) models with interactions of conservatism and cash
holdings or information risk to examine separately whether the cash enhancing and
informational roles of conservatism help to mitigate bankruptcy risk We also use VARX (1)
model with interactions of bankruptcy risk and indicators of post-SOX or indicators of post-
auditor-resignation to examine whether auditorsrsquo and regulatorsrsquo monitoring enhances
unconditional conservatism as bankruptcy risk increases The findings support the assertions
that both the cash enhancing and informational roles of conservatism help mitigate bankruptcy
risk and that monitoring by auditors and regulators increases subsequent unconditional
6
conservatism as bankruptcy risk increases These results are robust to endogeneity between
unconditional and conditional conservatism extreme distress actual bankruptcy conservatism
gaming debt contracting considerations earnings management alternative measures for
unconditional and conditional conservatism and bankruptcy risk and other control variables
The remainder of the study is organized as follows Section 2 details the conceptual
framework and hypotheses to be tested Section 3 describes the data and test methodologies
Section 4 presents empirical results and Section 5 concludes Appendices A and B describe
results of bi-variate VARX (1) models Variable definitions are presented in Table 1
2 Theoretical Framework Figure 1 depicts the continuum along which firms evolve from financial health to
debtholder-triggered bankruptcy Accounting conservatism by definition reduces net income
and net assets but not cash flows and balances by increasing both operating cash flows (OCF
hereafter) and access to capital Bankruptcy in contrast is fundamentally a cash rather than
income condition A firm can operate indefinitely with reduced or even negative net income
without entering either default (Figure 1 T = 2) or bankruptcy (Figure 1 T = 3) so long as
cash remains available from some source(s) to meet rising obligations5 Anecdotal evidence of
firms that were not conservative and failed for example AIG and GM 6 suggest that
accounting conservatism can operate directly in both ldquohealthrdquo and ldquodistressrdquo stages (Figure 1 T
= 0 1) and even in the ldquodefaultrdquo stage (Figure 1 T = 2) to enhance cash and transparency
regarding net assets and net income thereby helping avert progressions into ultimate
conditions of default or bankruptcy Alternatively conservatism accelerates technical defaults
(Zhang (2008)) which appear to increase default and bankruptcy risk However Nini et al
(2009) documents that technical defaults trigger increased monitoring by capital providers who
impose capital expenditure restrictions that increase cash flows suggesting that conservatism
increases cash We next elaborate on the cash enhancing property of accounting conservatism
as they relate to bankruptcy risk 5 While certain creditors would monitor broader definitions of funds than cash such as working capital they ultimately are interested in the cash that working capital provides Indeed a firm with ample working capital can be bankrupt due to cash insufficiency if its working capital is comprised of uncollectible receivables and illiquid inventories Whereas accrual measures are often included in debt covenants they serve as ldquored flagsrdquo to bring to the attention of capital providers a condition of financial distress with actual bankruptcy determined by the ongoing availability of cash 6 Before the 2009 financial crisis AIG insured financial institutions but did not accrue related contingent liabilities When the financial crisis arose AIG experienced large losses and would have been forced into bankruptcy without a government bailout Similarly before 2007 subsequently bankrupt GM reported pension assets and liabilities as off-balance-sheet items under SFAS No 87 rather than as contingent liabilities following SFAS No 5 since before 2007 SFAS No 87 gave firms the option to report estimated net pension liabilities in footnotes to their financial statements as an exception to the more conservative treatment in SFAS No 5 Although we cannot assert from these anecdotal examples that greater accounting conservatism would have provided more cash for these firms thereby averting their bankruptcies their experiences are consistent with our predictions regarding relations between conservatism and bankruptcy risk developed below
7
21 The Cash Enhancing Role of Accounting Conservatism Conceptual constructs analytical modeling and evidence suggest that accounting
conservatism enhances cash availability by both increasing cash inflows and reducing cash
outflows Conservatism increases cash inflows by promoting precautionary savings reducing
cost of capital alleviating underinvestment and increasing OCFs Kirschenheiter et al (2010)
argue analytically that prudent decision makers prefer more conservative accounting to
facilitate decisions regarding precautionary savings as future cash inflows become riskier
thereby increasing (reducing) cash holdings (expenditures) Ahmed and Duellman (2002)
Lara et al (2010b) and Li (2010) document that conservatism lowers the cost of capital makes
external financing easier and increases cash flows from financing 7 Increased external
financing by conservatism mitigates capital underinvestment and enhances future OCF Hui et
al (2009b) argue that within some range conservatism is helpful for obtaining more lenient
contracting terms from other providers of factors of production which has the effects of
increasing OCF In a more general setting BMS (2011b) document that both unconditional
and conditional conservatism mitigate future OCF downside risk thus increasing future OCF
and its upside potential
Conservatism reduces cash outflows by discouraging cash disbursements reducing cash
wastage and lowering agency costs associated with cash holdings By delaying the recording
of net income and net assets conservatism reduces or defers cash expenditures for
performance-based compensation taxation and dividends (Watts (2003)) Biddle (1980) and
Callen et al (2010b) provide confirming evidence that LIFO firms reduce taxes by adopting
and subsequently managing inventories and that conservatism discourages or defers dividends
payout respectively Cash wastage and loss arise from perquisite consumption by managers
and investments in negative net present value projects especially when cash flows are
unconstrained Consistently Lara et al (2010b) argue that conditional conservatism increases
managerial incentives to avoid suboptimal investments ex ante and to abandon loss projects
quickly ex post (see also Srivastava and Tse (2010)) Bushman et al (2010) and Francis and
Martin (2010) report that timely loss recognition curbs over-investment in cross-country
settings and in acquisition settings respectively Loktionov (2009) argues that in distressed
firms conditional conservatism reduces risk-shifting in investment projects by speeding up
technical defaults timely signaling bad news and by reducing information asymmetries A
7 Ahmed and Duellman (2002) provide evidence that conservatism increases the debt ratings of borrowers which has the effect of reducing cash outflows as interest expenses as confirmed by Zhang (2008) Lara et al (2010a) argue and provide consistent evidence that conservative accounting can also reduce the cost of equity capital Li (2010) provides evidence that conservatism reduces the cost of both debt and equity capital in a cross-country comparison
8
similar reasoning extends to unconditional conservatism Louis et al (2009) further argue ans
document that timely losses reporting helps control value-destroying agency costs associated
with increased cash holdings
Ultimately the cash enhancing role of conservatism helps mitigate bankruptcy risk
because bankruptcy is fundamentally a condition of cash insufficiency as suggested by theories
and evidence in finance Kim et al (1993) Anderson and Sundaresan (1996) Uhrig-Homburg
(2005)) model bankruptcy as debt default triggered when cash flows available for payouts fall
below required debt service payments and Campbell et al (2008) provide confirming evidence
that prior cash holdings are negatively associated with default risk over various prediction
horizons from one month to three years Biddle et al (2011) provide evidence that both
unconditional and conditional conservatism are positively associated with the level and upside
potentials of cash holdings Thus the cash enhancing role of conservatism operates to both
increase internal cash flow generation and discourage or delay cash outflows thereby
decreasing bankruptcy risk
22 The Informational Role of Accounting Conservatism Prior research suggests that unconditional and conditional conservatism play an
informational role in decreasing information uncertainties and asymmetries by constraining
upward overstatement biases in net income or assets (Watts (2003) Li (2008)) and by timely
revealing bad news (Lafond and Watts (2008) Wittenberg-Moerman (2008)) respectively
Guay and Verrecchia (2007) and Gox et al (2009) suggest that conservative reporting
decreases information uncertainty In particular Guay and Verrecchia (2007) argue that
disclosing lower-end realizations of firm value via ex ante commitments to conservative
reporting promotes voluntary disclosures of higher-end realizations thereby promoting fuller
disclosures regarding cash flows and improving information precision and Gox et al (2009)
focus on one specific types of conditional conservatism and argue that impairment rules
increases information precision Watts (2003) and Qiang (2008) suggest that both
unconditional and conditional conservatism reduce information asymmetry between firms and
investors regarding asset values Hui et al (2009a) find that both unconditional and
conditional conservatism substitute for managerial forecasts in reducing information
asymmetry and information uncertainty
The informational role of accounting conservatism reduces bankruptcy risk indirectly by
supplementing its cash enhancing role By reducing information uncertainties and
asymmetries conservatism reduces adverse selection costs and risks to investors and the cost
of equity and debt capital increasing cash availability from external sources when firms
9
approach default (Figure 1 Stages 0 1 and 2) For firms that have entered into conditions of
distress (Figure 1 Stages 1 and 2) the informational properties of conservatism help avert
rightward progressions into bankruptcy by encouraging creditors other capital providers and
the borrowing firm to work more cooperatively with each other to avoid a bankruptcy filing at
least in the case of unconditional conservatism Varied finance theories suggest that less
information asymmetry facilitates debt renegotiations and reduces bankruptcy filings In
particular low information asymmetry stimulates bargaining and multiple reorganization plans
(Carapeto (2005)) helps to renegotiate their debts privately (Chen (2003)) and reduces
bankruptcy filings by creditors (Giammarino (1989) and Mooradian (1994)) Similar
arguments apply to information uncertainty Thus with improved transparency regarding
income and asset values via conservatismrsquos informational role creditors and other capital
providers can be more confident regarding the reliability of firmsrsquo financial conditions and
more willing to renegotiate debts and terms thereby reducing the chances of default resolution
via bankruptcy filings (Figure 1 Stage 3)
23 Relations between Accounting Conservatism and Subsequent Bankruptcy Risk Both the cash enhancing role and the informational roles of accounting conservatism
suggest that unconditional and conditional conservatism lower subsequent bankruptcy risk by
increasing subsequent cash holdings and flows and by facilitating the avoidance of formal
bankruptcy filings by firms that enter into financial distress This reasoning leads to the
prediction that both unconditional and conditional conservatism will be negatively related to
subsequent bankruptcy risk
H1a Unconditional conservatism is negatively associated with subsequent bankruptcy risk consistent with the cash enhancing and informational roles of conservatism
H1b Conditional conservatism is negatively associated with subsequent bankruptcy risk consistent with the cash enhancing and informational roles of conservatism
24 Relations between Bankruptcy Risk and Subsequent Accounting Conservatism
If unconditional and conditional conservatism are negatively associated with subsequent
bankruptcy risk as predicted by hypotheses H1a and H1b it follows that high bankruptcy risk
could generate demands for subsequent conservatism 8 However associations between
bankruptcy risk and subsequent conservatism may differ between unconditional and
conditional conservatism due to the countervailing interests of managers auditors and
8 Conceptually changes in conservatism are natural responses to increased bankruptcy risk and other risk dimensions which suggest that both unconditional and conditional conservatism change over time as risks in firmsrsquo environments change In a practical sense GAAP allows flexibility over time in applying accounting policies and estimates and firms do explore this flexibility
10
regulators Auditors regulators shareholders generally prefer more conservatism as financial
distress increases but shareholders and their collective-actions lawsuits focus on both
unconditional and unconditional conservatism and thus do not significantly impact the
differential demand for both Nonetheless auditors and regulators focus more on unconditional
than conditional conservatism because unconditional conservatism is more frequent is the
major contributor to total conservatism is not conditioned on bad news and involves less bad
news ldquoshocksrdquo that auditors and regulators may wish to avoid especially as bankruptcy risk
increases (Qiang (2007)) Especially as bankruptcy risk increases auditors and regulators
monitor more intensely and also require higher level of unconditional conservatism As a
result managers will face higher discipline costs for not applying unconditional conservatism
such costs include litigation liabilities regulatory penalties embarrassment and loss of
reputation for ldquocooking booksrdquo
In contrast managers generally prefer less unconditional and conditional conservatism
because conservatism understates earnings and assets timely reports bad news which is
particularly counter to managersrsquo career motives such as career advancement compensation
perquisites pet investment and other opportunistic expenditures Managers of distressed
firms have strong incentives to overstate earnings and withhold and defer the reporting of bad
news at least until performance improves or they secure alternative employment (Kothari et al
(2009) Kothari et al (2010)) Conditional conservatism accords managers more flexibility
and discretion regarding when and how to report bad news (Qiang (2007) Kothari et al
(2010)) partly due to the practical difficulty associated with a real-time monitoring of
conditional conservatism which would require continual active participation in reporting
decisions that would be costly for auditors and regulators to staff except for periodic ex post
reviews (Qiang (2007)) Therefore managers prefer to reduce conditional conservatism as
bankruptcy risk increases The analysis leads to the following hypotheses
H2a Bankruptcy risk is positively associated with subsequent unconditional conservatism
H2b Bankruptcy risk is negatively associated with subsequent conditional conservatism
3 Data Sources Sampling Measurements and Models 31 Data and Sampling
This study utilizes a pooled sample of firm-year observations from NYSE AMEX and
NASDAQ for fiscal years 1989 through 2007 Data were retrieved from a combination of
three data sources available via the Wharton Data Research Service (WDRS) Compustat
CRSP and the Federal Reserve Bank Reports Ex ante bankruptcy risk measures EDF from
11
Merton (1974) and Campbell following Campbell et al (2008) are estimated using CRSP and
Compustat data Ex-post-bankruptcy risk measure BANK indicator of firms that actually
declared bankruptcy is obtained from wwwbankruptcydatacom Firm-year observations with
missing values for conservatism bankruptcy risk stock price total assets and net income
before extraordinary items are omitted Since young firms have high bankruptcy risk and thus
survival bias can significantly influences sampling and results we include as much young
firms as possible by setting the minimum requirement for calculating accrual-based
conservatism measures as having prior two years and for using the one-period lag
specifications for VARX models so that only firms with less than three-year histories are
excluded We further omit post-bankruptcy firm-year observations for firms filing under
Chapter 11 of the US Bankruptcy Code since these observations may be incomparable with
pre-bankruptcy data To reduce the effects of outliers observations in the top and bottom 1
of the major variables are winsorized and firms in financial industries (SIC codes 6000-6999)
are excluded The final sample is comprised of 34897 firm-year observations for 4621 firms
32 Measures for Bankruptcy Risk Bankruptcy risk is measured as the probability that a firm will liquidate under Chapter 7
or reorganize under Chapter 11 of the US Bankruptcy Code which are conditions typically
triggered when firms cannot service their rising cash obligations Varied bankruptcy risk
measures have been previously estimated using both structural and restrictive form models
among which we choose Mertonrsquos (1974) EDF and Campbell score (Campbell et al (2008))
(2008) as bankruptcy risk metrics in the main tests in terms of predictive ability and freedom of
estimation bias caused by accounting conservatism EDF measure is estimated from a
structural model it has superior predictive ability (Hillegerst et al (2004)) and is less subject
to conservatism bias since its only accounting input is the face value of debt The Campbell
score is estimated from a restrictive form model it t has the best predictability for bankruptcy
risk among all available metrics (Campbell et al (2008)) and is less subject to conservatism
bias than accounting-based restrictive form model such as such as Altmanrsquos (1968) Z-score
(except as a robustness check) Olsonrsquos (1980) O-score and Zmijewskirsquos (1984) Z-score Both
EDF and Campbell are ex ante bankruptcy risk measure to provide a measure that is free of
estimation error we also employ an ex post bankruptcy risk measure BANK the indicator of
actual bankruptcy The three measures are detailed below
EDF EDF is the ranked probability that firmrsquos asset value will fall below its liabilities
after T years (T = one year in this study) assuming that the firmrsquos asset value (continuous rate
of growth in assets) is log-normally (normally) distributed Merton (1974) EDF is an option-
12
based structural model that expresses a firmrsquos market value (VE) as a call option on the firmrsquos
assets (VA) with a strike price equal to the face value of debt and time to expiration equal to T
Applying the Black and Scholes (1973) formula and Itorsquos lemma to Merton (1974) model we
estimate EDF as
EDFt = prob-[ln(VAt Xt) + (μ - 05σA2)T] (σAT12) ge εt+T (1)
= N(-(ln(VAt Xt) + (μ - 05σA2)T) (σAT12))
where N is the cumulative density function of the standard normal distribution X is the face
value of a firmrsquos debt σA is the volatility of a firmrsquos assets and μ is the instantaneous drift
assuming the firmrsquos market value follows Geometric Brownian Motion Its intuition is that the
probability that a firmrsquos assets are insufficient to pay the face value of its debt increases with
the firmrsquos debt and asset volatility and decreases with the firmrsquos assets Further details
regarding the estimation of EDF are available on request
The Merton (1974) model has strict assumptions for example it assumes that market is
efficient and information is complete 9 In this study we relax this assumption and allows
accounting conservatism to impact EDF through the accounting input leverage ratio
Conservatism facilitates external financing and increases the leverage ratio the strike price in
the Merton (1974) model and this may lead to an overestimate of EDFt However this is not a
serious issue because this bias runs counter to the predictions of all hypotheses except H2a
Thus if the empirical results for H1a H1b and H2b are as predicted the true results should be
stronger than those reported
Campbell Campbell is the ranked probability of a firm declaring bankruptcy one month
ahead It is estimated using a logit model based on monthly stock market variables and
quarterly accounting variables following the formula in the last column of Table III in
Campbell et al (2008) We estimate the Campbell for each fiscal quarter as follows and use
the Campbell for the last fiscal quarter in our main tests
Campbellt = exp(tempt) (1 +exp(tempt)) (2)
where tempt = -908 - 2967 NIMTAVGt + 336 TLMTAt - 735 EXRETAVGt + 148
SIGMAt + 0082 Rsizet - 240 CASHHMTAt + 0054 MBt - 0937 PRICEt The intuition
for Campbell is that bankruptcy risk decreases with the predictability of market-based
profitability (NIMTAVG) the predictability of excess return relative to SampP 500 index
9 Other relevant assumptions include (1) creditors and managers have symmetric information about firm value and can observe the inputs into the model (2) default occurs when a firmrsquos asset value drops below its debt obligations at the time of maturity (3) the default barrier is the exogenously determined fixed face value of debt and (4) the asset value follows a diffusion process without jumps
13
(EXRETAVG) the market-based liquidity ratio (CASHHMTA) and the stock price (PRICE)
Bankruptcy risk increases with the market-based leverage ratio (TLMTA) the stock return
volatility (SIGMA) the market-to-book equity ratio (MB) and with firm size relative to that of
the SampP 500 index (Rsize) Further details on estimating Campbell are available on request
In comparison to Merton (1974) model the assumptions underlying the restrictive form
logit model for Campbell are more relaxed for example it allows market inefficiency and
information asymmetry between creditors and the firm and short-term default that can occur
before net asset values breach bankruptcy barriers10 Therefore accounting conservatism could
bias Campbell on some degree conservatism understates net income eg NIMTAVGt asset
items eg CASHHMTAt and overstates total liabilities eg TLMTAt and this leads to an an
upward bias in estimating Campbell However this potential bias runs counter to the
predictions of all hypotheses except H2a Thus if the empirical results for H1a H1b and H2b
are as predicted the true results should be stronger than those reported
BANK BANK is an indicator variable that is equal to one if a firm files for bankruptcy
under Chapter 7 or 11 of the US Bankruptcy Code and zero otherwise In contrast to EDF
and Campbell which are ex-ante bankruptcy risk metrics BANK is an ex-post bankruptcy risk
measure that is free of estimation error and conservatism bias However the subsample of
firms that actually declare bankruptcy is much smaller and may not be representative of all
firms along a bankruptcy risk continuum Moreover BANK does not support an examination
of continuous relations between conservatism and bankruptcy risk and because data may not
exist or be comparable following the declaration of bankruptcy BANK does not facilitate the
testing of causal relationships between bankruptcy and subsequent unconditional and
conditional conservatism We therefore use EDF and Campbell in our main tests
33 Measures for Unconditional and Conditional Conservatism Givoly et al (2007) advocate using multiple measures of conservatism since different
metrics measure conservatism from different dimensions Following these studies we examine
four firm-year measures of unconditional conservatism UC_ACC (total accruals as adapted
from Ahmed and Duellman (2007)) UC_BM (rank of industry-adjusted book-to-market ratio)
UC_RES (hidden reserves) and UC_PCA (a factor score from a principal components analysis
of the above three metrics) We likewise examine four firm-year measures of conditional
conservatism CC_AR (extending Khan and Watts (2009)) CC_CR (extending Callen et al
10Other relevant assumptions include (1) default time is unobservable and no longer tied to firm value falling below a pre-specified default barrier (2) default follows an intensity-based process (eg PoissonCox process) with exogenous latent variables (3) the probability of default is logistically distributed ie the cumulative probability of default takes a logistic functional form
14
(2010a)) CC_ACM (accumulated non-operational accruals extending Zhang (2008)) and
CC_PCA (a factor score from a principal components analysis of the above three metrics) as
described below
UC_ACC A proxy for unconditional conservatism equal to negative one times the ratio
of average total accruals before depreciation to average total assets both averaged over a three-
year period ending with the current year Thus a higher total accrual indicates a higher degree
of unconditional conservatism The rationale is that conservatism results in persistently
negative accruals (Givoly and Hayn (2000) Ahmed et al (2007)) We calculate total accruals
as Total accrualsit = net income before extraordinary itemsit (Compustat IB) -operational cash
flowit (Compustat OANCF) + depreciation expenseit (Compustat DP)
UC_BM A proxy for unconditional conservatism measured as the industry-adjusted
ranking of the product of negative one times the ratio of book value to market value of
common shareholders equity (Ahmed et al (2007) Zhang (2008)) UC_BM also reflects
expected economic rents and future growth opportunities and we use RampD intensity to control
for them following Ahmed and Duellman (2007)
UC_RES A proxy for unconditional conservatism reflected in ldquohiddenrdquo reserves related
to advertising (ADV) research and development (RD) and last-in-first-out inventory
accounting (INV) Extending Penman and Zhang (2002) this study measures UC_RES as the
ratio of hidden reserves to total assets (TA)
UC_RESt = (INVtres + RDt
res + ADVtres) TAt
11 (3)
UC_PCA A proxy for unconditional conservatism measured as the factor score
generated from a principal components analysis of the three unconditional conservatism
measures UC_ACC UC_BM and UC_RES UC_PCA reflects commonalities across these
three measures that gauge unconditional conservatism at different dimensions and with
different weaknesses Specifically UC_ACC is an accrual-based metric that does not capture
non-accrual unconditional conservatism for example RampD and advertising expenditures
UC_BM is a market-based metric that not only measures the understatement of book value
relative to market value but also reflects expected economic rents and future growth
opportunities UC_RES captures only unconditional conservatism related to hidden reserves
Based on this reasoning we employ UC_PCA as the primary measure of unconditional 11 The inventory hidden reserve INVit
res equals the LIFO reserve RDitres is calculated using coefficients in Lev and Sougiannis
(1996) to capitalize and amortize RampD ADVitres is advertising expense capitalized and amortized over two years following
Bublitz and Ettredge (1989) Penman and Zhang (2002) use net operating assets as the deflator for hidden reserves but its value is negative for over one-sixth of our sample which would potentially bias estimated hidden reserves We therefore use total assets as the deflator When data are missing for LIFO reserves RampD expensing and advertisement expensing they are set to zero
15
conservatism in our main empirical tests To the extent that the three component metrics
measure unconditional conservatism from different dimensions convergent validity is not a
problem if they are all positively related with UC_PCA but are negative related with each
other12
CC_AR A proxy for conditional conservatism defined as the ratio of the sum of the C
Score and G Score to G Score from Khan and Watts (2009) and it is a measure of asymmetric
response similar to that derived from Basu (1997) Our sampling period 1989 through 2007
is similar to that examined in Khan and Watts (2009) 1963 through 2005 and our sample size
is also similar Hence we use model 2 in Table 3 of Khan and Watts (2009) to estimate
CC_AR13
CC_CR A proxy for conditional conservatism extending Callen et al (2010a) We
estimate CC_CR as the ratio of current earnings shocks to total earnings news for bad earnings
news with the ratio multiplied by -1 for good earnings news14 This definition derives from
Vuolteenahorsquos (2002) return decomposition model but differs from the definition of the CR
ratio in Callen et al (2010a) mainly at four respects (1) CC_CR uses the indirect method to
estimate earnings news as in Vuolteenaho (2002) (2) CC_CR multiplies the CR ratio by -1 for
good earnings news so that higher CC_CR represents greater conditional conservatism for the
good news case (3) negative observations of CC_CR are not eliminated from the sample (4)
Intercepts are added to the VAR (1) model for estimating CC_CR Additional details
regarding the estimation of CC_CR are available on demand
CC_ACM A proxy for conditional conservatism measured as negative one times the ratio of
accumulated non-operating accruals over a three-year period to accumulated total assets and is
adapted from Zhang (2008) A higher value for CC_ACM indicates a higher level of bad news
reported via non-operational accruals Non-operating accruals are calculated as follows
12 Convergent validity means multiple measures for a concept are valid when they are positively correlated with each other The underlying assumption is that they are measuring the same concept from the same dimension When measure from different dimension they may be negatively correlated For example firms with high hidden reserves may have fewer incentives to use accrual-based unconditional conservatism which may suggest a negative relation between UC_ACC and UC_RES 13 Khan and Watts (2009) use the following reverse earnings return response regression model Eit = b1 + b2DRit + Rit(m1 + m2Sizeit + m3MBit + m4LEVit) + DRitRit (l1 + l2Sizeit + l3MBit + l4LEVit) + b3Sizeit + b4MBit + b5 LEVit + DRit(l1 + l2Sizeit + l3MBit + l4LEVit) where C (G) score measures the timeliness of bad (good) news as follows G_Scoreit = m1 + m2Sizeit + m3MBit + m4 LEVit = 0237 - 0033Sizei - 0007MBit + 0033LEVit C_Scoreit = l1 + l2Sizeit + l3MBit + l4LEVit = 0031 + 0005Sizeit - 0006MBit + 0005LEVit Then CC_AR is calculated as CC_ARit = (C_Scoreit + G_Scoreit) G_Scoreit = 1 + C_Scoreit G_Scoreit CC_AR is the asymmetric response coefficient in the Khan and Watts (2009) framework corresponding to that in Basu (1997) However by construction CC_AR may be positively correlated with both EDF and Campbell For example Khan and Watts (2009) suggest that the C (G) score is positively (negatively) associated with the leverage ratio and that the C score is positively associated with return volatility 14 CC_AR derives from the Basu (1997) framework and its criterion for classifying good versus bad news is whether the associated stock return is positive or negative CC_CR derives from the Vuolteenaho (2002) framework and its criterion for classifying good versus bad news is whether ROE earnings scaled by book equity is greater than the risk-free rate
16
Nonoperating accruals = Total accruals 15 - Δaccounts receivable (Compustat RECT) -
Δinventories (Compustat INVT) - Δprepaid expenses (Compustat XPP) + Δaccounts payable
(Compustat AP) + Δtaxes payable (Compustat TXT)
CC_PCA A proxy for conditional conservatism measured as the factor score generated from
a principal components analysis of the three conditional conservatism measures CC_AR
CC_CR and CC_ACM CC_PCA captures commonalities among these three metrics that
measure conditional conservatism at difference dimensions and with different weaknesses
CC_AR and CC_CR are both market-based metrics subject to noise from voluntary disclosures
of accounting and non-accounting information CC_AR by construction may be subject to
upward bias in its correlation with bankruptcy risk metrics EDF and Campbell CC_ACM is an
accrual-based metric that captures both bad news in accruals and ldquobig bathsrdquo resulting from
earnings manipulations and investment accruals Therefore this study employs CC_PCA as the
primary measure of conditional conservatism in the main empirical tests
34 Estimation Models and Methods Following Lara et al (2009) this study employs VARX models (VAR models with
exogenous variables) to test causal relationships between the two types of conservatism and
bankruptcy risk The VARX models are estimated using seemingly unrelated regression
(SUR) which improves efficiency when estimating systems of equations with correlated
random errors by taking into account cross-equation correlations When the cross-sectional
covariance of the error terms is small SUR estimation will differ little from OLS estimation
Because prior studies eg Ryan (2006) suggest that to some degree unconditional and
conditional conservatism can be substitutes we use a tri-variate VARX (1) model consisting of
equations (4) to (6) to examine the causal relations between unconditional and conditional
conservatism and bankruptcy risk predicted by hypotheses H1a H2a H1b and H2b while
controlling for the endogeneity between the two types of conservatism H1a H2a H1b and
H2b predict γ11 lt 0 δ11 lt 0 β21 gt 0 and β31 lt 0 respectively
BRt = α10 + β11BRt-1 + γ11UC_PCAt-1 + δ11CC_PCAt-1 + Controlst + ε11 (4)
UC_PCAt = α20 + β21BRt-1 + γ21UC_PCAt-1 + δ21CC_PCAt-1 + Controlst + ε21 (5)
CC_PCAt = α30 + β31BRt-1 + γ31UC_PCAt-1 + δ31CC_PCAt-1 + Controlst + ε31 (6)
15 Zhang (2008) uses the term ldquooperational accrualrdquo but this term matches the definition of total accruals used in Ahmed et al (2007) Following Zhang (2008) when cash flow from operations is not available total accruals are calculated as follows Total accruals = net income (Compustat NI) + depreciation (Compustat DP) - funds from operations (Compustat FOPT) + Δcurrent assets (Compustat ACT) - Δdebt (Compustat DLC) - Δcurrent liabilities (Compustat LCT) - Δcash (Compustat CHE)
17
where BR refers to bankruptcy risk measures EDF or Campbell and the autoregressive vector
includes BRt-1 UC_PCAt-1 and CC_PCAt-1 Controlst in equation (4) include previously
identified determinants of bankruptcy risk (Anderson et al (1996) Shumway (2001) Parker et
al (2002) Uhrig-Homburg (2005) Campbell et al (2008) Eberhart et al (2008)) namely the
leverage ratio (Leveraget) return on total assets (ROAt) return volatility (STD_Rett) firm size
(Ln(MV)t) the risk-free rate (Ratet) liquidity (Casht) changes in liquidity (ΔCasht) and RampD
investment intensity (Inten_RDt) Consistent with Shumway (2001) Uhrig-Homburg (2004)
Campbell et al (2008) and Eberhart et al (2008) this study predicts bankruptcy risk to be
positively associated with leverage and return volatility and negatively associated with ROA
liquidity cash flow firm size the risk-free rate and RampD investment intensity Controlst in
equation (5) include previously identified determinants of unconditional conservatism namely
the leverage ratio (Leveraget) firm size (Ln(MV)t) and RampD investment intensity
(Inten_RDt)16 These variables proxy for demand for unconditional conservatism arising from
contracting considerations litigation risk taxation and regulation while investment intensity
Inten_RDt is used to control for the effects of RampD investment and growth opportunities
(Ahmed and Duellman (2007)) Controlst in equation (6) are the same as in equation (5) but
with different predictions17 Lastly in all the three equations dummies for the Fama and
French (1997) industry classification (Ind_Dum) and for the fiscal year (Year_Dum) are
included to capture fixed industry and year effects
VARX estimation is also sensitive to lag structure A lag structure that is too short
wastes information and risks non-zero serial correlations with error terms thus biasing
parameter estimates while an overly long lag length can risks inaccurate parameter estimation 16 We predict unconditional conservatism to be negatively related to financial leverage and ROA and positively related to firm size A negative association between unconditional conservatism and financial leverage follows from the reasoning that firms with high levels of leverage tend to have greater conflicts between bondholders and shareholders Beaver and Ryan (2000) provide confirming evidence that leverage is negatively associated with unconditional conservatism The relationship between unconditional conservatism and ROA reflects the net of incentives to mitigate bankruptcy risk and report higher earnings As ROA increases there is less incentive to use unconditional conservatism to lessen bankruptcy risk but also less incentive to boost earnings and more incentive to create hidden reserves that we predict will dominate A positive association between unconditional conservatism and firm size follows from the reasoning in Khan and Watts (2009) that larger firms have richer information environments reducing both overall uncertainty and information asymmetries thus leading to less contracting demand and findings in Qiang (2007) that contracting efficiency induces little demand for unconditional conservatism Hagerman and Zmijewki (1979) suggest that firm size proxies for political visibility and because larger firms are more visible they are subject to higher tax and regulation costs and receive lower subsidies Larger firms also may be more subject to greater litigation risk Consistent with these arguments Ahmed et al (2002) document that firm size is positively associated with the unconditional conservatism metrics BM ratio and total accruals 17 We predict conditional conservatism to be positively related to financial leverage but negatively related to firm size and ROA A positive association between conditional conservatism and financial leverage is expected because creditors preferring conditional conservatism will have increasing influence over firms as financial leverage increases especially for firms in financial distress A negative association between conditional conservatism and firm size is expected from the results of Khan and Watts (2009) who suggest that larger firms have richer information environments that reduce both overall uncertainty and information asymmetries and thus contracting demand for conditional conservatism Givoly et al (2007) and LaFond and Watts (2008) similarly document that the asymmetric timeliness of earnings for large firms is significantly smaller than for small firms A negative association between conditional conservatism and ROA follows from the reasoning that well-performing firms have less pressure to use conditional counter-conservatism to boost earnings
18
To examine the robustness of our results to the length of lag structure in the VARX model we
also use the following VARX(3) model to examine the causal relations between unconditional
and conditional conservatism and bankruptcy risk predicted by hypotheses H1a H2a H1b and
H2b
BRt = α10 + β11BRt-1 + β12BRt-2 + β13BRt-3 + γ11UC_PCAt-1 + γ12UC_PCAt-2 + (7)
γ13UC_PCAt-3 + δ11CC_PCAt-1 + δ12CC_PCAt-2 + δ13CC_PCAt-3 + Controlst + ε11
UC_PCAt = α20 + β21BRt-1 + β22BRt-2 + β23BRt-3 + γ21UC_PCAt-1 +γ22UC_PCAt-2 + (8)
γ23UC_PCAt-3 + δ21CC_PCAt-1 + δ22CC_PCAt-2 + δ23CC_PCAt-3 + Controlst + ε21
CC_PCAt = α30 + β31BRt-1 + β32BRt-2 + β33BRt-3 + γ31UC_PCAt-1 + γ32UC_PCAt-2 + (9)
γ33UC_PCAt-3 + δ31CC_PCAt-1 + δ32CC_PCAt-2 + δ33CC_PCAt-3 + Controlst + ε31
where BR refers to bankruptcy risk measures EDF or Campbell and the autoregressive vector
includes the one- to three- period lags of BR UC_PCA and CC_PCA Controls used in
equations (7) to (9) are the same as those used in equations (4) to (6) H1a predicts γ11 + γ12 +
γ13 lt 0 H2a predicts δ11 + δ12 + δ13 lt 0 H1b predicts β21 + β22 + β23 gt0 and H2b predicts β31
+ β32 + β33 lt0
This study employs the Akaike Information Criterion (AIC) to identity an optimal lag
structure for VARX model The Akaike Information Criterion is a goodness of fit measure for
estimated models that considers both precision and complexity It is not a hypothesis test but a
tool for model selection For a given dataset the competing model with the lowest AIC is
considered to have the best fit We do not use first-order differencing since Dickey-Fuller
tests reveal the major testing variables to be stationary and when there is no unit root first-
order differencing can generate biased coefficient estimates in VARX models18
4 Empirical Results 41 Descriptive Statistics
Table 1 reports summary statistics (Panel A) and correlation matrices (Panel B) for major
variables of interest In Panel A the mean of EDF 00365 is close to its value reported in
Vassalou and Xing (2004) of 0042019 The mean of UC_ACC -00012 is lower than in
Ahmed et al (2002) 0003 and in Ahmed and Duellman (2007) 0010 with this difference
18 Sims (1980) and Doan (1992) argue that differencing should not be used even if the variables contain a unit root (ie are non-stationary) since the goal of VAR analysis is to determine the inter-relationships among variables and differencing can destroy information concerning data co-movements We perform the Dickey-Fuller unit root tests for the unbalanced panel data in this study by running the following regression model for the pooled panel data yt = δyt-1 + εit where yt is the first differencing of y Then we test the hypothesis H0 δ = 0 F-statistics indicate that the major testing variables are stationary at least at the 99 confidence level with results available on request 19 Vassalou and Xing (2004) do not directly report the mean of the EDF which is default likelihood Rather in Table II Vassalou and Xing (2004) report a mean for SV the survival rate of 09579 Since SV is defined as one minus the aggregate default likelihood the mean of EDF is inferred to be 00421 Their sampling period is 1971 to 1999 versus 1989 to 2007 in this study
19
likely due to differing sample periods20 The mean of CC_CR is -03102 much lower than the
CR ratio in Callen et al (2010a) however these values are not comparable because the CR
ratio in Callen et al (2010a) omits observations with negative values whereas the CC_CR
measure in this study does not
Insert Table 1 about here
Panel B of Table 1 presents correlations among contemporaneous observations of the
main testing variables with Pearson (Spearman) correlations reported in the upper (lower)
triangle of the table The Spearman (Pearson) correlations between the bankruptcy risk metrics
EDF and Campbell are 07789 (07789) both statistically significant suggesting that they have
strong convergent validity in measuring ex ante bankruptcy risk Both measures are also
significantly positive related with the ex post bankruptcy risk measure BANK but both the
Pearson and Spearman correlations are as low as 2-35 However this does not mean that
BANK has low convergent validity with EDF and Campbell since they measures bankruptcy
risk from different dimensions
UC_PCA is significantly negatively associated with CC_PCA with their Spearman
(Pearson) correlation -01441 (-00637) Except for CC_ACM the Spearman correlations
among other component measures of the two types of conservatism are predominantly negative
a finding consistent with prior evidence (Beaver and Ryan (2005) Ryan (2006)
Roychowdhury and Watts (2007) Ball et al (2009)) Spearman and Pearson correlations
between UC_PCA and its component unconditional conservatism metrics at different
dimensions are uniformly positive and statistically significant suggesting UC_PCA is an
representative overall unconditional conservatism measure that possesses reasonable content
validity concurrent validity and convergent validity21
Likewise Spearman and Pearson correlations between CC_PCA and its component
conditional conservatism metrics are uniformly positive and statistically significant the only
exception being its Pearson correlation with CC_ACM which is insignificantly different from
zero These correlations suggest that CC_PCA is a representative metric that reasonably
reflects the overall levels of conditional conservatism and captures the commonality of
20 Ahmed et al (2002) and Ahmed and Duellman (2007) use samples of SampP 500 firms during 1993-1998 and 1998-2002 respectively whereas this study uses NYSE AMEX and NASDAQ listed firms for 1989-2007 21 The Spearman and Pearson correlations among the three component measures for unconditional conservatism are within the range of +-010 However this does not mean that they have low convergent validity because they measure unconditional conservatism on different dimensions rather than on the same dimension and thus could be highly uncorrelated In particular the Spearman correlation between UC_RES and UC_ACC is -00390 significantly negative suggesting that firms with higher hidden reserves has less incentives for accrual-based unconditional conservatism it does not suggest lower convergent validity between the two because both measures unconditional conservatism at different dimensions
20
component metrics that measure conditional conservatism from different dimensions22
The Pearson and Spearman correlations of unconditional conservatism with EDF and
Campbell are negative whereas the correlations of conditional conservatism with EDF and
Campbell are positive Care should be taken in interpreting these latter correlations because
they are subject to omitted variable biases In the following sections we systematically
examine the lead-lag relations between unconditional conservatism conditional conservatism
and bankruptcy risk in multivariate analyses
42 Causal Relations Between Unconditional and Conditional Conservatism in Full and Extremely Distressed Samples We first examine the lead-lag relations between unconditional and conditional
conservatism using a tri-variate VARX (1) model described by equations (4) to (6) with results
for the full sample and subsample of firms in extreme distress presented in Table 2 Panels A
and B respectively Models 1 and 2 in both Panels use EDFt and Campbellt as bankruptcy risk
measures respectively Panel A of Table 2 shows that in both Models 1 and 2 UC_PCAt-1 and
CC_PCAt-1 are significantly negatively associated with EDFt and Campbellt when both are
predictors with coefficients (t-statistics) of -00431 (-882) and -00083 (-1505) in the EDFt
equation respectively and -00184 (-365) and -00110 (-1938) in the Campbellt equation
respectively F-statistics for the null hypothesis that the predictor coefficients of EDFt and
Campbellt are zero indicate rejection beyond the 99 confidence level EDFt-1 and Campbellt-1
are both significantly positively associated with UC_PCAt and negatively associated with
CC_PCAt with coefficients (t-statistics) of 00389 (1361) and -02865 (-801) respectively
for UC_PCAt-1 and CC_PCAt-1 in the EDFt equation and 00388 (1416) and -04431 (-1295)
respectively in the Campbellt equation These results indicate that the evidence presented in
Tables 3 and 4 supporting H1a and H2a and H1b and H2b respectively and that the evidence
is robust to endogeneity between unconditional and conditional conservatism23
Insert Table 2 about here
For extremely distressed firms managerial incentives and governance mechanisms may 22 Some Spearman and Pearson correlations among the three component measures for conditional conservatism are within the range of +-005 However this does not mean that they have low convergent validity because they measure conditional conservatism from different perspectives rather than on the same dimensions and thus could be highly uncorrelated 23 In both models conditional conservatism CC_PCAt-1 exhibits a significant positive association with subsequent unconditional conservatism UC_PCAt with coefficients (T-statistics) 00021 (517) and 00019 (467) respectively in Panel A This result is consistent with expectation and suggests that bad news ldquoshocksrdquo associated with conditional conservatism generate demand for subsequent unconditional conservatism UC_PCAt-1 also exhibits a positive association with subsequent conditional conservatism CC_PCAt with coefficients (t-statistics) 00940 (212) and 00571 (129) respectively However when we take the first difference of UC_PCA to consider only the unconditional conservatism that occurred in a specific fiscal year the coefficient is significantly negative This result is consistent with prior notions that unconditional conservatism preempts conditional conservatism (Beaver and Ryan (2005) and Ryan (2006))
21
differ from those in healthier firms which may qualitatively change relations between
conservatism and bankruptcy risk for several reasons When shareholdersrsquo implicit call options
on assets are at or close to the money in deeply distressed firms equity values will increase in
asset volatility shareholdersrsquo risk-shifting incentives may dominate and firms may have less
incentive to use conservatism to mitigate bankruptcy risk Firmsrsquo control rights also may
progressively transfer to creditors who may demand higher levels of conservatism to prevent
risk shifting to creditors and wealth transferring to shareholders (Loktionov (2009)) Finally
the going concern assumption may no longer apply making accrual accounting and
unconditional conservatism less relevant To investigate whether the results for the full sample
still hold under these contexts we examine in Panel B of Table 5 a subsample of most
distressed firms defined by the lowest decile of returns-on-assets (largest (-ROA)) Consistent
with the results in Panel A both UC_PCAt-1 and CC_PCAt-1 remain significantly negatively
associated with subsequent bankruptcy risk except for UC_PCAt-1 with Campbellt EDFt-1 and
Campbellt-1 remain significantly and positively associated with UC_PCAt and CC_PCAt
except for EDFt-1 with CC_PCAt Thus the prior findings are qualitatively similar for deeply
distressed firms
Insert Table 3 about here
One may concern that our results are driven by cross-sectional relations between
unconditional conservatism conditional conservatism and bankruptcy risk and that our results
may be sensitive to lad structure To address these concerns we reexamine the lead-lag
relations between unconditional and conditional conservatism using a tri-variate VARX (3)
model described by equations (7) to (9) with results for the full sample presented in Table 3
Model 1 shows that UC_PCAt-1 UC_PCAt-2 and UC_PCAt-3 are all consistently negatively
associated with EDFt with the coefficient of UC_PCAt-1 statistically significant while Model 2
shows that UC_PCAt-1 are significantly negatively associated with EDFt and UC_PCAt-2 and
UC_PCAt-3 are positively associated with EDFt with the coefficient of UC_PCAt-2 statistically
significant The sum of the coefficients of UC_PCAt-1 UC_PCAt-2 and UC_PCAt-3 is all
negative and the F-test for the null hypothesis that the sum is zero derives significant F-
statistics 7210 and 1848 for EDFt and Campbellt equations respectively thus providing
strong support for H1a In both models CC_PCAt-1 CC_PCAt-2 and CC_PCAt-3 are all
significantly and negatively associated with EDFt and Campbellt and the F-test for the null
hypothesis that the sum of the coefficients of CC_PCAt-1 CC_PCAt-2 and CC_PCAt-3 are zero
for EDFt and Campbellt equations indicate rejection at least at the 99 confidence level thus
22
providing strong support for H1b
In Model 1 EDFt-1 EDFt-2 and EDFt-3 are significantly positively associated with
UC_PCAt and likewise in Model 2 Campbellt-1 Campbellt-2 and Campbellt-3 are consistently
positively associated with UC_PCAt but only the coefficient of Campbellt-1 is statistically
significant The F-tests for the null hypotheses that the sum of the coefficients of EDFt-1
EDFt-2 and EDFt-3 is zero and that the sum of the coefficients of Campbellt-1 Campbellt-2 and
Campbellt-3 is zero indicate rejection at least at the 99 confidence level thus providing strong
support for H2a that bankruptcy risk is positively associated with subsequent unconditional
conservatism Results for testing H2b are relatively weaker In Model 1 EDFt-1 are
significantly negatively associated with CC_PCAt while EDFt-2 and EDFt-3 are significantly
positively associated with CC_PCAt but the sum of their coefficient is still negative and the
same pattern applies to Campbellt-1 Campbellt-2 and Campbellt-3 in CC_PCAt equation in
Model 2 The F-test for the null hypothesis that the sum of the coefficients of EDFt-1 EDFt-2
and EDFt-3 is zero indicates a rejection at least at the 99 confidence level in Model 1 but the
F-test for the null hypothesis that the sum of the coefficients of Campbellt-1 Campbellt-2 and
Campbellt-3 is zero is insignificant thus providing partial support for H2b that bankruptcy risk
is negatively associated with subsequent unconditional conservatism
We further compare the Akaike Information Criterion (AIC) number for the
corresponding VARX (1) and VARX(3) models used in Tables 2 and 3 to examine the optimal
lag structure for VARX model AIC number is calculated as AIC = NLn((1 - R-sqr) N) +
2K where N is sample size K is number is independent variables and R-sqr is the proportion
of the sum of square accounted for by the model under consideration The last two lines in
Table 3 indicates that AIC numbers for VARX (1) models are unanimously smaller than those
for VARX (3) models Untabulated results also indicate that AIC numbers for VARX (1)
models are smaller than those for the corresponding VARX (2) models Since the models with
the lowest AIC number is best fitted we use VARX (1) model in the rest of the empirical tests
Moreover one may concern whether the results for each complement of UC_PCA and
CC_PCA are consistent with Tables 2 and 3 We further report the results for testing the lead-
lag relations between bankruptcy risk and unconditional conservatism and between bankruptc
risk and conditional conservatism by bi-variate VARX (1) models in Appendix A and B
respectively
23
43 Causal Relations between Unconditional and Conditional Conservatism and Actual Bankruptcy Examining a subsample of firms that actually declared bankruptcy encompasses the
upper limit of bankruptcy risk and eliminates estimation error in calculating bankruptcy risk
However actual bankruptcy as an indicator variable precludes examining continual relations
and the effects of bankruptcy on subsequent conservatism For these reasons we test only
hypotheses H1a and H2a using a logit model following Compbell et al (2008) and H1a and
H2a predict that γ lt 0
BANKt = α + γCONt-1 + Controlst + microt (10)
where BANK equals one if a firm files for bankruptcy under Chapters 7 or 11 of the
Bankruptcy Code and zero otherwise and CON refers to unconditional or conditional
conservatism measured by UC_PCA or CC_PCA or both24 Models 1 and 3 to 5 in Table 4
find that UC_PCAt-1 is significantly negatively associated with the probability that firms file for
bankruptcy a result that holds after controlling for earnings management and earnings
smoothing However CC_PCAt-1 is insignificantly associated with the probability of
bankruptcy in Models 2 to 5 These results strongly confirm hypothesis H1a but do not
support hypothesis H2a for firms actually filing for bankruptcy This is consistent with
reduced incentives for conditional conservatism as firms enter into actual bankruptcy perhaps
because bad news is already revealed and further bad news is unhelpful for reducing
information asymmetries and could even cause frictions among claimants
Insert Table 4 about here
The signs of the control variable coefficients are consistent with expectations NIMTAVG
Exretavg Inten_RD Cash and Rate are negatively associated with BANK and Leverage
STD_ret and MB are positively associated with BANK
44 The Cash Enhancing and Informational Roles of Accounting Conservatism and Causal Relations between Conservatism and Bankruptcy Risk This section examines how unconditional and conditional conservatism impact
bankruptcy risk through the cash enhancing role and informational role Table 5 replicates
Table 3 adding interactions between UC_PCA CC_PCA and Cash (Panel A) and between 24 Following Campbell et al (2008) we employ the following commonly used determinants of bankruptcy risk as controlling variables the market-based profitability (NIMTAVG) the predictability of excess return relative to SampP 500 index (EXRETAVG) RampD investment intensity (Inten_RD) firm size relative to that of the SampP 500 index (Rsize) the stock price (PRICE) and the risk-free rate (Rate) which are expected to reduce the probability of BANK the leverage ratio (Leverage) the liquidity ratio (Cash) changes in the liquidity ratio (ΔCash) return volatility (STD_Ret) and the market-to-book equity ratio (MB) all of which are expected to increase the probability of BANK Other controlling variables include year and industry dummies earnings management (Emgmt) and earnings smoothing (Esmooth)
24
UC_PCA CC_PCA and STD_Rett-1 (Panel B) to the EDF and Campbell equations Stock
volatility STD_Rett-1 is used to proxy for information uncertainty and information asymmetry
following Zhang (2006) and Khan and Watts (2009) Panel A reveals that the interactions of
both unconditional and conditional conservatism with cash (UC_PCAt-1Casht-1 and CC_PCAt-
1Casht-1 respectively) are significantly negatively associated with subsequent bankruptcy risk
proxied by EDFt in Model 1 with coefficients (t-statistics) of -03010 (-946) and -00276 (-
583) and with subsequent bankruptcy risk proxied by Campbellt in Model 2 with coefficients
(t-statistics) -03437 (-1085) and -00115 (-244) respectively F-statistics for the null
hypothesis that the sum of the coefficients of conservatism and of its interaction with cash is
zero are significant beyond the 99 confidence level for both unconditional and conditional
conservatism in both Models 1 and 2 Thus the evidence in Panel A suggests that both
unconditional and conditional conservatism mitigate bankruptcy risk via their cash enhancing
roles
Insert Table 5 about here
Panel B of Table 7 shows that the interactions of conservatism with stock return volatility
(UC_PCAt-1STD_Rett-1 and CC_PCAt-1 STD_Rett-1) are also significantly negatively
associated with subsequent bankruptcy risk as proxied by EDFt in Model 1 with coefficients
(t-statistics) of -00453 (-300) and -00201 (-1056) respectively Similarly the interaction of
unconditional conservatism with return volatility is also significantly negative for Campbellt in
Model 2 with a coefficient (t-statistic) of -01367 (-907) but the interaction of conditional
conservatism with return volatility is statistically insignificant F-statistics for the null
hypothesis that the sum of coefficients for conservatismrsquos interactions with return volatility is
zero is nonetheless significant beyond the 90 confidence level for both unconditional and
conditional conservatism in both Models 1 and 2 Overall the evidence in Panel B suggests
that both unconditional and conditional conservatism help mitigate bankruptcy risk via their
informational roles
45 Sarbanes-Oxley Auditor Turnover and Causal Relations between Bankruptcy Risk and Subsequent Unconditional and Conditional Conservatism
This section uses the contexts of the passage of the Sarbanes-Oxley Act in 2002 (SOX)
and auditor resignations as natural experiments to examine the effects of auditors regulators
and litigation on causal relations between bankruptcy risk and subsequent unconditional and
conditional conservatism Prior evidence suggests that SOX heightened legal and regulatory
attention to financial reporting and increased managerial litigation exposures and punishment
25
which leads to enhanced accounting conservatism (Lobo and Zhou (2006) Cefaratti et al
(2010)) 25 Auditor resignations are often triggered by aggressive reporting or
misrepresentations (Krishnan and Krishnan (1997) Menon and William (2008) Krishnan et al
(2010)) therefore it signals enhanced litigation risk of firms and auditors enhanced monitoring
by successor auditors regulators and investors and thus enhanced conservatism in the post-
auditor-resignation period
Our main argument for the relations between bankruptcy risk and subsequent
unconditional and conditional conservatism is that different from shareholdersrsquo litigation that
creates demand for both unconditional and conditional conservatism enhanced monitoring by
auditors and regulators mainly enhance unconditional conservatism which is their primary
focus (Qiang (2007)) If this argument is valid the interaction of bankruptcy risk and indicator
for the post-SOX period (SOX) and the interaction of bankruptcy risk and indicator for the
post-auditor-resignation period (Post_resign) should increase subsequent unconditional
conservatism We test this conjecture by replicating the analysis in Panel A Table 2 adding
these interactions
Results reported in Panel A of Table 6 reveal that the interactions of SOX with EDFt-1
and Campbellt-1 are both statistically positive for UC_PCAt suggesting that enhanced auditors
and regulatorsrsquo monitoring following the passage of SOX enhanced the effects of bankruptcy
risk on subsequent unconditional conservatism as predicted by H2a In contrast interactions of
SOX with EDFt-1 and Campbellt-1 are statistically insignificantly associated with CC_PCAt
suggesting that SOX influenced little the effects of bankruptcy risk on subsequent conditional
conservatism predicted by H2b In addition the interaction of SOX with UC_PCAt-1 is
statistically significant for EDFt but is statistically insignificant for Campbellt and the opposite
is true for the interaction of SOX with CC_PCAt-1 suggesting that SOX enhanced albeit
modestly the mitigating effects of both unconditional and conditional conservatism on
subsequent bankruptcy risk
Insert Table 6 about here
We use a subsample of 124 firms with auditor resignations between 2000 and 2007 to
examine the effects of auditors on relations between accounting conservatism and bankruptcy
25Lobo and Zhou (2006) find that both unconditional conservatism (measured by total accruals) and conditional conservatism (Basu (1997) measure) increased in the post-SOX period Similarly Cefaratti et al (2010) report that the passage of SOX enhanced litigation risk and thereby increased conservatism Our study finds only the pattern of unconditional conservatism confirms Lobo and Zhou (2006) and Cefaratti et al (2010) In particular for the six years centered around SOX passage unconditional conservatism (UC_PCA) increases from 03443 in the pre-SOX period (2000-2002) to 03805 in the post-SOX period (2003-2005) with a t-statistic of 877 Conditional conservatism (CC_PCA) increases from 08055 in the pre-SOX period to 08582 in the post-SOX period with a t-statistic of 160
26
risk26 Panel B of Table 8 reveals that the interactions of Post_resign with EDFt-1 and with
Campbellt-1 are significant for UC_PCAt but insignificant for CC_PCAt in both Models 1 and 2
In addition the interactions of Post_resign with UC_PCAt-1 and with CC_PCAt-1 are
statistically insignificant for EDFt and Campbellt in both Models 1 and 2 We also perform the
t-test of the difference in mean for UC_PCA and CC_PCA for three years post- versus pre-
resignation periods The average UC_PCA (CC_PCA) in the pre-resignation period is 03710
(12295) then it increases (decreases) to 04200 (11639) in the post-resignation period with t-
statistic (292) significant for UC_PCA and insignificant for CC_PCA Overall Table 6
provides consistent evidence for the argument that enhanced monitoring by auditors and
regulators mainly enhance unconditional conservatism rather than enhance conditional
conservatism as bankruptcy risk increases using the nature experiments of SOX passage and
auditor resignations This evidence provides further support for hypotheses H2a and H2b
46 Conservatism Gaming and Causal Relations between Conservatism and Bankruptcy Risk One main concern that ldquoconservatism gamingrdquo a version of earnings smoothing whereby
managers apply more conservatism during good times to provide earnings cushions during
downturns may drive the relations between conservatism and bankruptcy risk because
conservatism gaming is expected to mitigate bankruptcy risk Smith and Stulz (1985)rsquos model
argue that earnings smoothing may serve as a hedge against bankruptcy risk and Trueman and
Titman (1988)rsquos model concur that earnings smoothing may lower claimholdersrsquo perceptions
of bankruptcy risk by lowering perceptions of earnings volatility To address this concern we
examine whether the causal relations between unconditional and conditional conservatism and
bankruptcy risk are robust to conservatism gaming employing a tetra-variate VARX (1) model
consisting of equations (11) to (14)
BRt = α10 + β11BRt-1 + γ11UC_PCAt-1 + δ11CC_PCAt-1 + θ11Esmootht-1 + Controlst + ε11 (11)
UC_PCAt = α20 + β21BRt-1 + γ21UC_PCAt-1 + δ21CC_PCAt-1 + θ21Esmootht-1 + Controlst + ε21 (12)
CC_PCAt = α30 + β31BRt-1 + γ31UC_PCAt-1 + δ31CC_PCAt-1 + θ31Esmootht-1 + Controlst + ε31 (13)
Esmootht = α40 + β41BRt-1 + γ41UC_PCAt-1 + δ41CC_PCAt-1 + θ41Esmootht-1 + Controlst + ε41 (14)
where BR is EDF or Campbell and Controlst in equations (11) to (13) and their predictions are
the same as for equations (4) to (6)27 We consider two types of income smoothing to proxy for
conservatism gaming innate smoothing the product of negative one times the Spearman 26 Auditor resignation data were collected from AuditAnalytics in the WRDS database Among the 124 firms with auditor resignations in our sample 6 occurred in fiscal year 2000 4 in 2001 6 in 2002 18 in 2003 33 in 2004 22 in 2005 23 in 2006 and 12 in 2007 27 Controlst in equation (14) include Leveraget ROAt Ln(MV)t Volatility_ROAt and industry and year dummies which are previously identified determinants of earnings smoothing
27
correlation between accruals and OCF and discretionary smoothing the decile ranking of the
product of negative one times the ratio of the standard deviation of accruals to that of OCF
Insert Table 7 about here
Table 7 report the testing results and reveals that the causal relations between the two
types of conservatism and bankruptcy risk observed above are robust to conservatism gaming
Qualitatively similar results hold for discretionary smoothing (results not tabulated) Table 7
further reveals that innate smoothing Esmootht-1 is significantly negatively associated with
Campbellt consistent with theoretical predictions (Smith and Stulz (1985) and Trueman and
Titman (1988)) and prior findings that innate smoothing reveals information and increases firm
value (Tucker and Zarowin (2006) Leuz et al (2003))28
49 Robustness Checks
Sensitivity Tests for Validity of the VARX Models VARX models may be sensitive to order So we reorder the predictors in each equation
of the VARX models derives qualitatively similar findings A first-differencing specification
for the VARX model finds the results weaker but qualitatively unchanged with autoregressive
coefficients for the two main conservatism measures significantly negative consistent with the
inference from our Dickey-Fuller unit-root tests that taking first-differences may yield biased
results in the VARX models where there is no unit-root Concerns that mean-reversions of
accruals or EDFt and Campbellt could explain certain findings is made unlikely by our design
that utilizes conservatism measures that are three-year smoothing for UC_ACC and CC_ACM
that considerably smooth away mean-reversions and other conservatism measures that are
relatively insensitive to accrual reversals (UC_BM UNC_RES CC_AR and CC_CR)
Moreover in all EDFt and Campbellt regressions the coefficients on EDFt-1 and on Campbellt-1
are significantly positive indicating there are no mean-reverting tendencies in the bankruptcy
risk measures
Alternative Tests for Cash Enhancing and Informational Roles of Conservatism Concerns that firms with weak (strong) cash flow prefers aggressive (conservative)
reporting so it is higher cash holdings that cause higher conservatism and then lower
bankruptcy risk To address this issue we orthogonalize both UC_PCA and CC_PCA by the
lagged value of cash and use the residual value of UC_PCA and CC_PCA to replace their
28 In contrast discretionary smoothing has a weak mitigating effect on bankruptcy risk whereas bankruptcy risk is negatively associated subsequent discretionary smoothing consistent with the argument that discretionary smoothing reduces information transparency (untabulated results available on request)
28
original value and rerun the VARX (1) models for Panel A Table 5 After netting the
endogeneity of both unconditional and conditional conservatism to cash holdings in this way
the results are qualitatively the same as previously reported We also use the upside potentials
of cash holdings to proxy for cash the results do not qualitatively change either Using
earnings forecast errors or earnings forecast dispersions to proxy for information uncertainty
and asymmetry following Zhang (2006) does not change the results FOR Panel B Table 5
We also use the information asymmetry component of PIN score adjPIN (Duarte and Young
(2009)) to measure information uncertainty and asymmetry with the results are qualitatively
unchanged too
Controls for Debt Contracting Debtholdersrsquo and Shareholdersrsquo Interests Whereas results in Panel B of Table 3 suggest that relations between conservatism and
bankruptcy risk still hold for bankrupt firms there remains the question of whether the
observed relations are robust to controls for debt contracting debtholdersrsquo and shareholdersrsquo
interests To address this question we replicate the tests in Panel A of Table 3 introducing
additional controls for private debtholder monitoring leverage auditor going-concern opinions
and credit ratings Private debtholder monitoring is measured as the ratio of the sum of private
long-term debt other long-term debt and capitalized lease obligations to total long-term debt
following Qiang (2007) and leverage is an noisy indicator of higher debt costs larger
debtholder claims more intense monitoring and accentuated conflicts of interests between
shareholders and debtholders A dummy for periods following auditorsrsquo going-concern
opinions proxies for enhanced debtholders control relative to shareholders Untabulated results
reveal that these further controls do not qualitatively change the previously reported causal
associations between conservatism and bankruptcy risk
Senior long-term debt ratings by SampP proxy for the cost of debt and monitoring by rating
agencies on a scale of 1 to 21 with 1 for a ldquoAAArdquo rating and ldquo21rdquo for ldquoDrdquo rating 29
Untabulated results show that the main results previously reported remain qualitatively
unchanged after controlling for credit ratings Its interactions with EDFt-1 and Campbellt-1 are
significantly positive for both UC_PCAt and CC_PCAt and its interactions with EDFt-1 and
Campbellt-1 are negative for CC_PCAt Moreover credit ratings per se are significantly
negatively associated with EDFt and Campbellt and positively associated with UC_PCAt and
CC_PCAt These findings are consistent with both the monitoring role of credit ratings and
with credit ratings inadequately capturing default risk as illustrated by the bankruptcies of 29 SampP rates a firms debt from AAA (indicating a strong capacity to pay interest and repay to SD (the obligor has selectively defaulted on a specific issue or class of obligations) Compustat codes these ratings on a scale from 2 to 29 such that AAA (the best SampP rating) corresponds with 2 and SD (the worst rating) with 29
29
highly-rated firms during the 2008-2009 financial crisis Alternatively we added a dummy to
proxy for the lowest-rated firms (SD and D) and highest-rated firms (AAA) which are subject
to the most intense public monitoring with qualitatively similar findings
Controls for Earnings Management
To examine whether our results are robust to earnings management we rerun the tetra-
variate VARX (1) model consisting of equations (11) to (14) by replacing Esmooth with
Emgmt Untabulated results show that the conclusions about the causal relations between
bankruptcy risk and unconditional and conditional conservatism still hold Importantly both
UC_PCAt-1 and CC_PCAt-1 are negatively associated with subsequent Emgmtt corroborating
Wattsrsquo (2003) and Kothari et alrsquos (2010) reasoning that absent conservatism financial
reporting would be biased upward a priori in practice
Alternative Measure of Unconditional and Conditional Conservatism and Bankruptcy Risk
One may concern that our unconditional conservatism measurement UC_ACC and
UC_RES do not isolate discretionary unconditional conservatism To address that concern we
alternatively use Qiang (2007)rsquos discretionary accrual-based measure to replace UC_ACC and
use the first difference of UC_RES to capture firm-specific discretionary hidden reserve Doing
so does not qualitatively change the previous results in Table 2 As an alternative to the
industry adjusted BM ratio UC_BM we also use Qiang (2007) approach that builds upon
Beaver amp Ryan (2005) to measure unconditional conservatism and the results are qualitatively
the same as using UC_BM We do not use Qiang (2007)rsquos measurement in the main tests
because it is firm-specific and invariant over time which is in appropriate for a time-series
model like VARX
One may concern that CC_AR is subject to potential mechanical relationship with
Campbell since both are functions of leverage size and book-to-market ratio We use the
negative skewness measure in Zhang (2008) to replaces CC_AR the results for Panel A of
Table 2 are qualitatively unchanged suggesting that the mechanical relation problem is not
serious However the skewness measure requires at least previous five yearsrsquo data and thus is
not used in the main tests because doing so could expose our sample to severe survival bias
Using an A_score defined as the ratio of the C score to the sum of C score and G score as in
Khan and Watts (2009) and CC_CR calculated using the direct method following Callen et al
(2009) results does not qualitatively change either We also use the averages (and rankings) of
UC_ACC UC_BM and UNCON_RES to measure unconditional conservatism and those of
30
CC_ACM CC_AR and CC_CR to measure conditional conservatism with qualitatively similar
(more statistically significant) findings (suggesting that ranking increases power by reducing
measurement error)
When the Z-score (Altman (1968)) is used as an alternative bankruptcy risk metric main
results in Tables 2 and 3 are qualitatively unchanged Z-score is accounting-based measure
subject to estimation bias caused by accounting conservatism and it has more missing values
therefore it is not used in the main tests In calculating Campbell we follow Campbell et al
(2009) to winterize stock price lower than $15 up to $15 to avoid estimation bias caused by
small stocks When we drop this limitation the main results do not change for an alternative
Campbell thus calculated
5 Conclusion This study examines relations between accounting conservatism and bankruptcy risk that
follow from conservatismrsquos cash enhancing and informational properties Our primary
findings are a negative association between both unconditional and conditional conservatism
and subsequent bankruptcy risk consistent with conservatismrsquos cash enhancing and
informational roles a positive (negative) association between bankruptcy risk and subsequent
unconditional conservatism consistent with the interests of auditors investors and regulators to
mitigate future failure risk and a negative association between bankruptcy risk and subsequent
and concurrent conditional conservatism consistent with countervailing managerial incentives
to withhold bad news for career motives Further analyses provide confirming evidence that
the cash enhancing and informational roles of conservatism help mitigate bankruptcy and that
regulatorsrsquo and auditorsrsquo monitoring enhance demand for unconditional conservatism as
bankruptcy risk increases The findings are qualitatively unchanged under conditions of
extreme distress and actual bankruptcy and are robust to controls for endogeneity between
unconditional and conditional conservatism debt contracting considerations conservatism
gaming and other controls
These findings have several key implications First they provide evidence consistent
with a traditional rationale for accounting conservatism that it arose in response to requests
from creditors joined in recent times by shareholders auditors and regulators to help conserve
cash and enhance transparency thereby reducing failure risk Second our evidence that
accounting conservatism mitigates bankruptcy risk is consistent with the findings that
conservatism reduces cost of capital and increases trading contracting efficiency (Zhang (2008)
Hui et al (2009b)) but makes contributions by showing that the evidence follows from the cash
31
enhancing and informational roles of conservatism Third this evidence is not only central to
the interests of firmsrsquo stakeholders but also to economic policy makers by helping to dampen
the contagion effects of bankruptcy In this sense this study complements the evidence of
Francis et al (2010) that conservatism benefited shareholders during the 2008-2009 financial
crisis and of Kim and Zhang (2010) that conservatism helps mitigate stock market crash risk
suggesting that conservatism is relevant to economic policy-making
Fourth findings that bankruptcy risk is related differently with subsequent unconditional
and conditional conservatism are consistent with offsetting managerial auditorsrsquo and
regulatorsrsquo interests Lastly our evidence helps inform ongoing debates regarding the role of
conservatism as an enduring core concept of financial accounting
Since this study is the first to examine empirically causal relations as well as
contemporaneous relations between unconditional and conditional conservatism and
bankruptcy risk there is considerable potential for related research For example this study
leaves largely unexplored specific linkages between conservatism and bankruptcy risk that
explain precisely how its cash enhancing and informational properties relate to bankruptcy risk
how bankruptcy risk influences decisions regarding unconditional and conditional
conservatism how these relations are affected by differing economic conditions and whether
they hold in other countries with different institutional arrangements for example in
developing economies and settings with differing bankruptcy provisions or regulations
32
References Ahmed A S Billings B K Morton R M and Stanford-Harris M 2002 The Role of Accounting Conservatism in Mitigating Bondholder-Shareholder Conflicts over Dividend Policy and in Reducing Debt Costs The Accounting Review 77 867ndash890 Ahmed A S and Duellman S 2007 Accounting Conservatism and Board of Director Characteristics An Empirical Analysis Journal of Accounting and Economics 43 411-437 Altman E 1968 Financial Ratios Discriminant Analysis and the Prediction of Corporate Bankruptcy Journal of Finance 23 589ndash609 Anderson R and Sundaresan S 1996 Design and Valuation of Debt Contracts Review of Financial Studies 9 37ndash68 Ball R 2001 Infrastructure Requirements for an Economically Efficient System of Public Financial Reporting and Disclosure Brookings-Wharton Papers on Financial Services 127-270 Ball R Kothari S P and Nikolaev V 2009 Econometrics of the Basu Asymmetric Timeliness Coefficient and the Accounting Conservatism Working paper University of Chicago Ball R and Shivakumar L 2005 Earnings Quality in UK Private Firms Comparative Loss Recognition Timeliness Journal of Accounting and Economics 39 83-125 Barath S T and Shumway T 2008 Forecasting Default with the Merton Distance-to-Default Model Review of Financial Studies 21 1339-1369 Barth M E Landsman W R and Lang M H 2008 International Accounting Standards and Accounting Quality Journal of Accounting Research 46 467-498 Basel III 2010 Basel Committee on Banking Supervision Basu S 1997 The Conservatism Principle and the Asymmetric Timeliness of Earnings Journal of Accounting and Economics 24 3-37 Basu S 2009 Conservatism Research Historical Development and Future Prospects Chinese Journal of Accounting Research 2 1-20 Beaver W H and Ryan S G 2000 Biases and Lags in Book Value and Their Effects on the Ability of the Book-To-Market Ratio to Predict Book Return on Equity Journal of Accounting Research 38 127ndash148 Beaver W H and Ryan S G 2005 Unconditional and conditional Conservatism Concepts and Modeling Review of Accounting Studies 10 269-309 Beneish M and Press E 1993 Costs of Technical Violation of Accounting-Based Debt Covenants The Accounting Review 68 233-257 Biddle G C 1980 Accounting Methods and Management Decisions The Case of Inventory Costing and Inventory Policy Journal of Accounting Research 18 235-280 Biddle G C Ma M and Song M 2011 The Risk Management Role of Accounting Conservatism Working paper University of Hong Kong Black F and Scholes M 1973 The Pricing of Options and Corporate Liabilities Journal of Political Economy 81 637ndash654 Bublitz B and Ettredge M 1989 The Information in Discretionary Outlays Advertising Research and Development The Accounting Review 64 108-124 Bushman R M Piotroski J D and Smith A 2010 Capital Allocation and Timely Accounting Recognition of Economic Losses Working Paper The University of North Carolina at Chapel Hill Callen J L Livnat J and Segal D 2006 Information Content of SEC Filings and Information Environment A Variance Decomposition Analysis The Accounting Review 81 1017-1043
33
Callen J L Segal D and Hope O-K 2010a The Pricing of Conservative Accounting and the Measurement of Conservatism at the Firm-Year Level Review of Accounting Studies 15 145-178 Callen J L Chen F Dou Y and Xin B 2010b Information Asymmetry and the Debt Contracting Demand for Accounting Conservatism Working paper University of Toronto Campbell J Hilscher J and Szilagyi J 2008 In Search of Distress Risk Journal of Finance 53 2899-2939 Carapeto M 2005 Bankruptcy Bargaining with Outside Options and Strategic Delay Journal of Corporate Finance 11 736ndash746 Cefaratti M Dorminey J Lin H and Reed T 2010 The Effect of Litigation Risk on Conservatism A Comparative Study of PSLRA and SOX Working paper Northern Illinois University Chen K and Wei K C 1993 Creditorrsquos Decision to Waive the Violations of Accounting-Based Debt Covenants The Accounting Review 68 218-232 Chen N 2003 Three Essays on Information Asymmetry and Corporate Defaults Columbia University DeFond M and Jiambalvo J 1994 Debt Covenant Violation and Manipulation of Accruals Journal of Accounting and Economics 17 145-176 Demirkan S and Platt H D 2009 Financial Status Corporate Governance Quality and the Likelihood of Managers Using Discretionary Accruals Accounting Research Journal 22 93-117 De Ste Croix G E M 1956 Greek and Roman Accounting pp 14-74 In Littleton A C and Yamey B S ed Studies in the History of Accounting Richard D Irwin Homewood IL Dichev I and Skinner D 2002 Large-Sample Evidence on the Debt Covenant Hypothesis Journal of Accounting Research 40 1091-1123 Doan T 1992 Rats Users Manual Version 40 Estima Duarte J and Young L 2009 Why is PIN priced Journal of Financial Economics 91 119-138 Eberhart A Maxwell W and Siddique A 2008 A Reexamination of the Tradeoff between the Future Benefit and Riskiness of RampD Increases Journal of Accounting Research 46 27-52 Elliott J A and Phibrick D R 1990 Accounting Changes and Earnings Predictability The Accounting Review 65 157-174 Fama E F and French K R 1997 Industry Costs of Equity Journal of Financial Economics 43 153-192 Financial Accounting Standards Board 1980 Statement of Financial Accounting Concepts No 2 Qualitative Characteristics of Accounting Information Financial Accounting Standards Board 2008 Conceptual Framework for Financial Reporting The Objective of Financial Reporting and Qualitative Characteristics and Constraints of Decision-Useful Financial Reporting Information Exposure Draft Financial Accounting Series No 1570-100 Financial Accounting Standards Board 2010 Statement of Financial Accounting Concepts No 8 Conceptual Framework for Financial Reporting Fischer P and Verrecchia R 2000 Reporting Bias The Accounting Review 75 229-245 Francis B Hasan I and Wu Q 2010 The Benefits of Accounting Conservatism to Shareholders Evidence from the Financial Crisis Working paper Rochester Institute of Technology Francis J and Martin X 2010 Acquisition Profitability and Timely Loss Recognition Journal of Accounting and Economics 49 161-178 Franzen L Rodgers K and Simin T 2007 Measuring Distress Risk The Effect of RampD Intensity Journal of Finance 62 2931-2967
34
Giammarino Ronald M 1989 The Resolution of Financial Distress Review of Financial Studies 2 25ndash47 Givoly D and Hayn C 2000 The Changing Time-Series Properties Of Earnings Cash Flows and Accruals Has Financial Reporting Become More Conservative Journal of Accounting and Economics 29 287ndash320 Givoly D Hayn C and Natarajan A 2007 Measuring Reporting Conservatism The Accounting Review 82 65-106 Gox R and Wagenhofer R 2009 Optimal Impairment Rules Journal of Accounting and Economics 48 2ndash16 Granger C W J 1969 Investigating Causal Relations by Econometric Models and Cross-spectral Methods Econometrica 37 424ndash438 Guay W and Verrecchia R E 2007 Conservative Disclosure Working paper University of Pennsylvania Hagerman R and Zmijewski M E 1979 Some Economic Determinants of Accounting Policy Choice Journal of Accounting and Economics 1 141-61 Hertzel M G Officer M S Li Z and Rodgers K J 2008 Inter-Firm Linkages and the Wealth Effects of Financial Distress Along the Supply Chain Journal of Financial Economics 87 374-387 Hillegeist Keating E K Cram D P and Lundstedt K G 2004 Assessing the Probability of Bankruptcy Review of Accounting Studies 9 5-34 Hui K W Morse D and Matsunaga S 2009a The Impact of Conservatism on Management Quantitative Earnings Forecasts Journal of Accounting and Economics 47 192-207 Hui K W Klasa S and Yeung E 2009b Corporate Suppliers and Customers and Accounting Conservatism Working paper Hong Kong University of Science and Technology Jackson S and Liu X T 2009 The Allowance for Uncollectible Accounts Conservatism and Earnings Management Journal of Accounting Research forthcoming Jones J 1991 Earnings Management during Import Relief Investigation Journal of Accounting Research 29 193-228 Jones S 2011 Does the Capitalization of Intangible Assets Increase the Predictability of Corporate Failure Jorion P and Zhang G 2009 Credit Contagion from Counterparty Risk Journal of Finance 64 2053-2087 Keating S and Zimmerman J L 2000 Depreciation-policy Changes Tax Earnings Management and Investment Opportunity Incentives Journal of Accounting and Economics 28 359-389 Khan M and Watts R 2009 Estimation and Empirical Properties of a Firm-Year Measure of Conservatism Journal of Accounting and Economics 48 132-150 Kim J Ramaswamy K and Sundaresan S 1993 Does Default Risk in Coupons Affect the Valuation of Corporate Bonds A Contingent Claims Model Financial Management 117ndash131 Kim J and Zhang L 2010 Does Accounting Conservatism Reduce Stock Price Crash Risk Firm-Level Evidence Working paper City University of Hong Kong Kirschenheiter M and Ramakrishnan R 2010 Prudence Demands Conservatism Working paper University of Illinois at Chicago Kothari S P Shu S and Wysocki P 2009 Do Managers Withhold Bad News Journal of Accounting Research 47 241-276 Kothari S P Ramanna K and Skinner D J 2010 Implications for GAAP from an Analysis of Positive Research in Accounting Journal of Accounting and Economics 50 246-248
35
Krishnan J and Krishnan J 1997 Litigation Risk and Auditor Resignations The Accounting Review 72 539-60 Krishnan G Sun L and Wang Q 2010 Accruals Quality Audit Fees and Auditor Resignations Working paper Lehigh University LaFond R and Watts R 2008 The Information Role of Conservatism The Accounting Review 83 447ndash478 Lang L and Stulz R 1992 Contagion and Competitive Intra-industry Effects of Bankruptcy Announcements Journal of Financial Economics 32 45ndash60 Lara J M G Osma B G and Penalva F 2009 Accounting Conservatism and Corporate Governance Review of Accounting Studies 14 161-201 Lara J M G Osma B G and Penalva F 2010a Conditional Conservatism and Cost of Capital Review of Accounting Studies forthcoming Lara J M G Osma B G and Penalva F 2010b Conditional Conservatism and Firm Investment Efficiency Working paper Universidad Carlos III De Madrid Leuz C Nanda D and Wysocki P 2003 Earnings Management and Investor Protection An International Comparison Journal of Financial Economics 69 505-527 Lev B Sarath B and Sougiannis T 2005 RampD Reporting Biases and Their Consequences Contemporary Accounting Research 22 977-1026 Li J 2008 Accounting Conservatism Information Uncertainty and Analystsrsquo Forecasts Working paper Carnegie Mellon University Li X 2010 Accounting Conservatism and the Cost of Capital International Analysis Working paper London Business School Lobo G J and Zhou J 2006 Did Conservatism in Financial Reporting Increase After the Sarbanes-Oxley Act Initial Evidence Accounting Horizons 20 57-73 Loktionov Y 2009 Does Accounting Quality Mitigate Risk Shifting Working paper Massachusetts Institute of Technology Louis H Sun A and Urcan O 2009 Value of Cash Holdings and Accounting Conservatism Working paper Pennsylvania State University Menon K and Williams D 2008 Management Turnover Following Auditor Resignations Contemporary Accounting Research 25 567ndash604 Merton R C 1974 On The Pricing of Corporate Debt The Risk Structure of Interest Rates Journal of Finance 29 449ndash470 Mooradian R M 1994 The Effect of Bankruptcy Protection on Investment Chapter 11 as a Screening Device Journal of Finance 49 1403ndash1430 Nini G Smith D and Su A 2009 Creditor Control Rights and Firm Investment Policy Journal of Financial Economics 92 400-420 Ohlson J A 1980 Financial Ratios and the Probabilistic Prediction of Bankruptcy Journal of Accounting Research 18 109-131 Parker S Peters G and Turetsky H 2002 Corporate Governance and Corporate Failure A Survival Analysis Corporate Governance 2 4-12 Penman S H and Zhang X 2002 Accounting Conservatism the Quality of Earnings and Stock Returns The Accounting Review 77 237-264 Qiang X 2007 The Effects of Contracting Litigation Regulation and Tax Costs on Unconditional and Conditional Conservatism Cross-Sectional Evidence at the Firm Level The Accounting Review 82 759-796 Qiang X 2008 The Information Role of Unconditional and Conditional Conservatism Working paper Xiamen University Rosner R L 2003 Earnings Manipulation in Failing Firms Contemporary Accounting Research 20 361-408
36
Roychowdhury S and Watts R L 2007 Asymmetric Timeliness of Earnings Market-To-Book and Conservatism in Financial Reporting Journal of Accounting and Economics 44 2-31 Ryan S G 2006 Identifying Conditional Conservatism European Accounting Review 15 511 -525 Shumway T 2001 Forecasting Bankruptcy More Accurately A Simple Hazard Model Journal of Business 74 101-124 Sims C A 1980 Macroeconomics and Reality Econometrica 48 1-49 Smith C W and Stulz R M 1985 The Determinants of Firmsrsquo Hedging Policies Journal of Financial and Quantitative Analysis 20 391-405 Srivastava A and Tse S 2010 The Contribution of Delayed Gain Recognition to Trends in Conservatism A Re-Examination Using a New Approach to Measuring Accounting Conservatism Working paper Northwestern University Sweeney A 1994 Debt-Covenant Violations and Managersrsquo Accounting Responses Journal of Accounting and Economics 17 281-308 Trueman B and Titman S 1988 An Explanation for Accounting Income Smoothing Journal of Accounting Research 26 127-139 Tucker J W and Zarowin P A 2006 Does Income Smoothing Improve Earnings Informativeness The Accounting Review 81 251-270 Uhrig-Homburg M 2005 Cash-flow Shortage as an Endogenous Bankruptcy Reason Journal of Banking and Finance 29 1509ndash1534 Vassalou M and Xing H 2004 Default Risk in Equity Returns Journal of Finance 59 831ndash868 Vuolteenaho T 2002 What Drives Firm-Level Stock Returns Journal of Finance 57 233ndash264 Watts R 2003 Conservatism in Accounting Part I Explanations and Implications Accounting Horizons 17 207ndash221 Wittenberg-Moerman R 2008 The Role of Information Asymmetry and Financial Reporting Quality in Debt Trading Evidence from the Secondary Loan Market Journal of Accounting and Economics 46 240-260 Zmijewski M E 1984 Methodological Issues Related to the Estimation of Financial Distress Prediction Models Journal of Accounting Research 22 59-82 Zhang J 2008 The Contracting Benefits of Accounting Conservatism to Lenders and Borrowers Journal of Accounting and Economics 45 27ndash54 Zhang F 2006 Information Uncertainty and Stock Returns Journal of Finance 61 105-137
37
Table 1 Descriptive Statistics for Main Variables
This table reports the descriptive statistics for the full sample of firm-year observations from 1989 through 2007 Panel A presents the summary statistics and Panel B presents pairwise correlations among bankruptcy risk and accounting conservatism measures The upper (lower) triangle of Panel B displays Pearson product-moment (Spearman) correlations with highlighted figures indicating statistical significance at the 90 confidence level Variable definitions are provided below
Panel A Summary Statistics for the Full Sample Variable Mean Q1 Median Q3 EDF (unranked ) 36502 00000 00000 00558
Campbell (unranked ) 00127 00014 00028 00064
BANK 00059 00000 00000 00000
UC_PCA 03659 01897 03639 05319
UC_ACC -00012 -00218 00010 00209
UC_BM (unranked) -19489 -22175 -13437 -08280
UC_RES 00729 00000 00190 00910
CC_PCA 09188 04394 09534 15941
CC_ACM 00189 00004 00156 00355
CC_AR 21255 12598 19177 28431
CC_CR -03102 -04259 -01237 01165
Leverage 58566 43320 58492 73159
ln(MV) 02540 01290 02478 03622
ROA 00336 00141 00420 00728
STD_Ret 04833 02939 04226 06119
Cash 00868 00131 00417 01156
ΔCash 00061 -00103 00015 00217
Rate 00418 00287 00460 00516
Inten_RD 01261 00054 00219 00612
Monitor 08448 10000 08924 10000
Rating 90508 90000 70000 120000
Esmooth (unranked) 06048 04000 07000 09000
Emgmt -02631 -04550 -02735 -00771
Volatility_ROA 00054 00002 00006 00023
Turn 11700 06405 10352 14803
Eissue 00530 00000 00000 00050
Dissue 02137 -00457 00566 02225
Growth 02649 00051 00858 01955
Nimtaavg 00305 00101 00311 00476
Exretavg -00031 -00244 00002 00226
Rsize -100948 -115031 -100096 -86159
Mb 09042 04510 07442 12077
Price 23341 21401 27081 27081
38
Table 1 Descriptive Statistics for Main Variables (Contrsquod)
Panel B Correlation Matrix for the Full Sample
Variable 1 2 3 4 5 6 7 8 9 10 11
1 EDF 1 07789 00265 -01948 -00333 -02300 -00138 02404 -00023 04880 00671
2 Campbell 07789 1 00348 -00590 00334 -02136 -00025 02468 -00081 04764 00788
3 BANK 00265 00348 1 -00287 -00222 -00256 -00096 00117 -00103 00407 -00035
4 UC_PCA -02168 -02170 -00298 1 01820 09025 04861 -00637 01237 -02020 00104
5 UC_ACC -00274 00397 -00158 01611 1 00517 00489 00029 04819 -00728 00284
6 UC_BM -02303 -02139 -00256 09349 00574 1 00808 -00964 00516 -02485 -00061
7 UC_RES -00474 -01398 -00078 03023 -00390 00411 1 00468 00551 00514 00301
8 CC_PCA 04111 04095 00317 -01441 -00243 -01704 -00028 1 -00062 07160 06850
9 CC_ACM -00204 -00454 -00089 01057 04483 00485 00391 00262 1 -00425 00375
10 CC_AR 04655 04335 00407 -02084 -00901 -02359 -00060 04056 -00591 1 00426
11 CC_CR 01922 02145 00080 -00299 00336 -00426 -00043 09305 00245 01167 1 EDF is the ranking of the expected one-year-ahead default probability from Merton (1974) model Campbell is the ranking of the one-month-ahead probability of business failure calculated based on the formula in the last column of Table III in Campbell et al (2008) BANK proxies for bankruptcy risk and it is a dummy variable equal to one if the firm files for bankruptcy under Chapter 11 or Chapter 7 of the US Bankruptcy code and equal to zero otherwise UC_PCA is the factor score generated from a principal component analysis of the three unconditional conservatism measurements UC_ACC UC_BM and UC_RES Their eigenvalues are 09539 11433 and 09028 their eigenvectors are 05380 06342 and 06721 and their final communality estimates are 02894 04022 and 04517 respectively UC_ACC is equal to minus one times the ratio of total accruals to average total assets calculated over a rolling window of the current year and prior two years UC_BM is the industry-adjusted ranking of minus one times the ratio of book to market value of common shareholders equity at fiscal year-end UC_RES is the ratio of LIFO reserves plus hidden RampD and advertising reserves resulting from the application of unconditional conservatism to total assets estimated as follows UC_RESit = (INVit
res + RDitres + ADVit
res) ATit CC_PCA is the factor score generated from a principal component analysis of the three conditional conservatism measurements CC_ACM CC_AR and CC_CR Their eigenvalues are 10461 10324 and 09214 their eigenvectors are 03176 05468 08040 and their final communality estimates are 01008 02990 and 06464 respectively CC_ACM is minus one times the ratio of accumulated non-operating accruals to accumulated total assets calculated over a rolling window of current year and prior two years CC_AR is the ratio of C score plus G score to G score as defined in Khan and Watts (2009) This study directly uses the formula in Table 3 of Khan and Watts (2009) to calculate the CC_AR CC_CR is the ratio of unexpected current earnings (or current earnings shocks) to total earnings news with the ratio times minus one if earnings news is positive Ln(MV) is the natural logarithm of market capitalization at the end of the fiscal year Leverage is measured as the ratio of book value of long-term debt (Compustat DLTT) and short-term debt (Compustat DLC) to total assets (Compustat AT) ROA is calculated as the ratio of earnings (Compustat NI) over total assets (Compustat AT) STD_Ret is the annualized standard deviation of daily stock return over the prior twelve months Cash is the ratio of cash holdings (Compustat CHE) to total assets (Compustat AT) ΔCash is the ratio of cash flow (Compustat CHECH) to total assets (Compustat AT) Rate is the risk-free rate measured by the annualized three-month T-bill rate retrieved from Federal Reserve Bank Reports Inten_RD is the ratio of RampD expenses (Compustat XRD) to total assets (Compustat AT) SOX is an indicator for the period after the passage of the SOX Act equal to 1 for fiscal years 2003 and after and 0 otherwise Aud_Resign is an indicator for an auditorrsquos resignation from a client firm equal to 1 for the three-year period after auditor resignation and 0 otherwise Emgmt is the factor score generated from a principal component analysis of four earnings management metrics the ranking of absolute value of discretionary accrual DA abnormal operational cash flow R_OCF abnormal discretionary expenses R_DISX and abnormal product cost R_PROD Their eigenvalues are 12992 11747 08823 and 06438 their eigenvectors are 02138 -07195 08136 and -02691 and their final communality estimates are 00473 05177 06619 and 00724 respectively Esmooth proxies for conservatism gaming and is measured as negative one times the Spearman correlation of OCF and accruals with both deflated by average total assets measured using a rolling window of five fiscal years for all available accrual and cash flow data VolatilityROA proxies for earnings variability estimated as the variance of ROA calculated over a rolling window of the current year and prior four years SPOS is an indicator for small positive earnings that
39
equals one if net income scaled by total assets is between 0 and 001 following Barth et al (2008) Turn is measured as sales (Compustat SALE) divided by end-of-year total assets (Compustat AT) following Barth et al (2008) Eissue is annual percentage change in shares of common stock measured as the ratio of the change in shares outstanding at the current and previous fiscal year-ends to the common shares outstanding at previous fiscal year-end (Compustat CSHO) Dissue is annual change in total liabilities (Compustat LT) deflated by beginning-of-year total liabilities following Barth et al (2008) Growth is annual change in sales (Compustat SALE) deflated by sales in previous period Nimtaavg proxies for earnings predictability and it is defined as the present value of the three-year sum of NIMTA the annual net income deflated by total liabilities and market value assuming earnings degenerate at the monthly rate φ = frac12 Nimtaavgt-1t-4 = 1 minus φ 12
1 minus φ 24 ( NIMTA t minus1 t minus 2 + φ 12 NIMTA t minus 2 t minus 3 + φ 24 NIMTA t minus 3 t minus 4 )
Exretavg proxies for return predictability of EXRET (past excess return relative to the value weighted SampP 500 index return over a period of 12 months) and Exretavgt-1t-12 = )(
11
1211
112 minusminus ++minusminus
tt EXRETEXRET φφφ where EXRETit
= log(1+Rit) - log(1 + RSampP500t) and φ = frac12 Rsize proxies for relative firm size calculated as the natural logarithm of market value of equity relative to that of the SampP 500 index Mb is the ratio of firmrsquos market equity value to its book equity value at fiscal year-end Price is calculated as the log of price per share winsorized above $15 following Campbell et al (2008)
40
Table 2 Causal Relations between Unconditional and Conditional Conservatism and
Bankruptcy Risk Estimated by VARX(1) Models
This table reports the SUR estimation results for tri-variate VARX (1) models Bankruptcy risk measures are EDF and Campbell unconditional and conditional conservatism measures are UC_PCA and CC_PCA respectively Model 1 uses EDF UC_PCA and CC_PCA as dependent variables and their one- period lags as autoregressive vectors Model 2 uses Campbell UC_PCA and CC_PCA as dependent variables and their one- period lags as autoregressive vectors Panel A reports the results for the full sample Panel B reports the results for the extremely distressed subsample of firm-year observations in the highest decile of (-ROA) Model details are provided at the end of this table Panel A Tri-variate VARX(1) Model Results for the Full Sample
Model 1 Model 2 Independent Variables EDFt UC_PCAt CC_PCAt Campbellt UC_PCAt CC_PCAt Intercept 03532 00191 29846 03842 00213 30627 (1721) (373) (4656) (1810) (423) (4860) UC_PCAt-1 -00431 06616 00940 -00184 06619 00571 (-882) (18662) (212) (-365) (18670) (129) CC_PCAt-1 -00083 00021 -00128 -00111 00019 -00076 (-1505) (517) (-256) (-1938) (467) (-152) EDFt-1 02459 00389 -02865 (6220) (1361) (-801) Campbellt-1 03340 00388 -04431 (8531) (1416) (-1295) Ln(MV)t -00377 00162 -02663 -00305 00156 -02673 (-6460) (3985) (-5233) (-5188) (3976) (-5453) Leveraget 06452 -00636 03180 04687 -00634 04000 (9517) (-1339) (535) (6779) (-1340) (677) ROAt -04263 -02552 -65643 -09634 -02437 -67519 (-3393) (-2833) (-5821) (-7309) (-2670) (-5917) STD_Rett 03201 01702 (7746) (4006) Casht -00395 -03210 (-435) (-3395) ΔCasht -00600 -01348 (-439) (-952) Ratet -11966 -00947 (-505) (-039) Inten_RDt -00005 00023 -00085 -00011 00024 -00090 (-097) (611) (-178) (-205) (623) (-189) Year and Ind Dum Yes Yes Yes Yes Yes Yes F-statistic 15752 18530 6413 19775 20064 16779
Sample size 34896 34890
Sys weighted R2 06109 05994
Panel B Tri-variate VARX(1) Model Results for the Extremely Distressed Subsample Model 1 Model 2 Independent
Variables EDFt UC_PCAt CC_PCAt Campbellt UC_PCAt CC_PCAt Intercept 02011 00919 30555 02267 00932 31876 (349) (527) (1216) (365) (540) (1283) UC_PCAt-1 -00356 05715 01176 -00090 05709 00864 (-236) (5183) (074) (-056) (5192) (055) CC_ PCAt-1 -00086 00019 00099 -00096 00019 00158 (-533) (165) (058) (-553) (157) (093) EDFt-1 02189 00299 -01227 (1914) (359) (-102) Campbellt-1 02409 00299 -03508 (2077) (379) (-309) Ln(MV)t -00400 00136 -02302 -00305 00133 -02420 (-2396) (1131) (-1331) (-1748) (1146) (-1443) Leveraget 08631 00031 -11485 04519 00059 -10447 (3378) (017) (-436) (1681) (033) (-403)
41
ROAt -01574 -00774 -65650 -02767 -00744 -64869 (-159) (-108) (-633) (-262) (-104) (-627) STD_Rett 03210 01909 (2806) (1548) Casht -00016 -01584 (-007) (-636) ΔCasht -00149 -00582 (-044) (-158) Ratet -10742 -04350 (-166) (-062) Inten_RDt 04858 03453 01069 04634 03449 02349 (638) (631) (014) (568) (631) (030) Year and Ind Dum Yes Yes Yes Yes Yes Yes F-statistic 1755 1292 105 1561 1434 953
Sample size 3488 3488
Sys weighted R2 05893 05125 and indicates a coefficient is significant at 90 95 and 99 confidence level respectively The tri-variate VARX(1) model used in this table consists of the following three equations BRt = α10 + β11BRt-1 + γ11UC_PCAt-1 + δ11CC_PCAt-1 + α11Leveraget + α12ROAt + α13STD_Rett + α14Ln(MV)t + α15Ratet (11)
+ α16Inten_RDt + α17 Casht + α18ΔCasht + sumα1jInd_Dum1j + sumα1k Year_Dum1k + ε11 UC_PCAt = α20 + β21BRt-1 + γ21UC_PCAt-1 + δ21CC_PCAt-1 + α22Leveraget + α23ROAt + α24Ln(MV)t + α25Inten_RDt (12)
+ sumα2jInd_Dum2j + sumα2kYear_Dum2k + ε21 CC_PCAt = α30 + β31BRt-1 + γ31UC_PCAt-1 + δ31CC_PCAt-1 + α32Leveraget + α33ROAt + α34Ln(MV)t + α35Inten_RDt (13)
+ sumα3jInd_Dum3j + sumα3kYear_Dum3k + ε31 where BR = EDF in Model 1 and BR = Campbell in Model 2 F-statistics reported in columns 2 and 5 are for H0 γ11 = 0 and δ11 = 0 F-statistics reported in columns 3 and 6 are for H0 δ21 = 0 and F-statistics reported in columns 4 and 7 are for H0 γ31 = 0
42
Table 3 Causal Relations between Unconditional and Conditional Conservatism and
Bankruptcy Risk for Full Samples Estimated by VARX (3) Models
This table report the SUR estimation results for tri-variate VARX (3) models Bankruptcy risk measures are EDF and Campbell unconditional and conditional conservatism measures are UC_PCA and CC_PCA respectively Model 1 uses EDF UC_PCA and CC_PCA as dependent variables and their one- two- three- period lags as autoregressive vectors Model 2 uses Campbell UC_PCA and CC_PCA as dependent variables and their one- two- three- period lags as autoregressive vectors Model details are provided at the end of this table
Model 1 Model 2 Independent Variables EDFt UC_PCAt CC_PCAt Campbellt UC_PCAt CC_PCAt
Intercept 03315 -00342 26631 03469 -00311 27372 (1838) (-858) (3094) (1960) (-800) (3271) UC_PCAt-1 -00495 07670 -01699 -01637 07675 -03523 (-359) (12513) (-128) (-1190) (12465) (-266) UC_PCAt-2 -00013 01147 03115 01298 01155 04209 (-009) (1882) (237) (950) (1890) (320) UC_PCAt-3 -00034 00312 00404 00068 00302 00770 (-056) (1162) (070) (113) (1122) (133) CC_ PCAt-1 -00064 00014 -00105 -00082 00012 -00021 (-1029) (506) (-177) (-1318) (419) (-036) CC_ PCAt-2 -00069 00018 00245 -00090 00018 00207 (-1114) (639) (412) (-1453) (665) (347) CC_ PCAt-3 -00030 00007 00254 -00035 00008 00231 (-505) (253) (451) (-607) (316) (412) EDFt-1 02790 00316 -05551 (4807) (1232) (-1005) EDFt-2 01091 00086 02038 (1898) (338) (371) EDFt-3 00348 00034 00841 (775) (173) (195) Campbellt-1 03548 00385 -09421 (6065) (1481) (-1684) Campbellt-2 01348 00021 04367 (2289) (082) (771) Campbellt-3 00308 00004 01063 (696) (020) (249) Ln(MV)t -00270 00091 -02514 -00203 00082 -02508 (-3844) (2956) (-3801) (-3047) (2855) (-4040) Leveraget 05335 -00383 03178 03687 -00383 04211 (6714) (-1129) (434) (4797) (-1140) (582) ROAt -04501 -01496 -70033 -09515 -01317 -73962 (-2969) (-2241) (-4862) (-6164) (-1927) (-5030) STD_Rett -00313 -02552 (-295) (-2420) Casht -01172 -02297 (-739) (-1470) ΔCasht 02876 01239 (6112) (2718) Ratet -11380 00793 (-420) (030) Inten_RDt -00038 00058 -00750 -00117 00064 -00798 (-101) (352) (-210) (-315) (389) (-224) Year and Ind Dum Yes Yes Yes Yes Yes Yes F-stat for H0 γ11 + γ12 + γ13 = 0 7210 1848 F-stat for H0 δ11 + δ12 + δ13 = 0 24397 40216 F-stat for H0 β21 + β22 + β23 = 0 31808 9778 F-stat for H0 β31 + β32 + β33 = 0 2563 053 Sample size 26280 26271
Sys weighted R2 07880 07917 AIC number for VARX(1) -397956 -398824 -397824 -396725 -396733 -396733
43
AIC number for VARX(3) -308057 -308065 -308065 -308405 -308413 -308413 and indicates a coefficient is significant at 90 95 and 99 confidence level respectively The tri-variate VARX(3) model used in this table consists of the following three equations BRt = α10 + β11BRt-1 + β12BRt-2 + β13BRt-3 + γ11UC_PCAt-1 + γ12UC_PCAt-2 + γ13UC_PCAt-3 + δ11CC_PCAt-1 + δ12CC_PCAt-2 + (7)
δ13CC_PCAt-3 + α22Leveraget + α12ROAt + α13 STD_Rett + α14Ln(MV)t + α15Ratet + α16Inten_RDt + α17Casht + α18ΔCasht + sumα1j Ind_Dum1j + sumα1k Year_Dum1k + ε11
UC_PCAt = α20 + β21BRt-1 + β22BRt-2 + β23BRt-3 + γ21UC_PCAt-1 +γ22UC_PCAt-2 + γ23UC_PCAt-3 + δ21CC_PCAt-1 + δ22CC_PCAt-2 (8)+ δ23CC_PCAt-3 + α22Leveraget + α23ROAt + α24Ln(MV)t + α25Inten_RDt + sumα2jInd_Dum2j + sumα2kYear_Dum2k + ε21
CC_PCAt = α30 + β31BRt-1 + β32BRt-2 + β33BRt-3 + γ31UC_PCAt-1 + γ32UC_PCAt-2 + γ33UC_PCAt-3 + δ31CC_PCAt-1 + δ32CC_PCAt-2 (9)+ δ33CC_PCAt-3 + α32Leveraget + α33ROAt + α34 Ln(MV)t + α35Inten_RDt + sumα3jInd_Dum3j + sumα3k Year_Dum3k + ε31
where BR = EDF in Model 1 and BR = Campbell in Model 2
44
Table 4 Causal Relations between Unconditional and Conditional Conservatism
and Subsequent Actual Bankruptcy Estimated by Logit Models
This table reports estimation results for logit models that regress the bankruptcy indicator BANK on unconditional and conditional conservatism metrics UC_PCA and CC_PCA and other controlling variables As testing varibles Model 1 uses UC_PCA Model 2 uses CC_PCA and Models 3 to 5 use both UC_PCA and CC_PCA Models 4 and 5 add earnings management (Emgmt) and earnings smoothing (Esmooth) as control variables respectively Model details are provided at the end of the table
Independent Variables Model 1 Model 2 Model 3 Model 4 Model 5 Intercept -267094 -268657 -267027 -267179 -262651 (-1293) (-1301) (-1291) (-1280) (-1198) UC_PCAt-1 -10837 -10844 -10763 -11358 (-238) (-238) (-236) (-244) CC_PCAt-1 00026 00045 00035 -00084 (006) (010) (008) (-019) Emgmtt-1 01775 (068) Esmootht-1 -03326 (-100) Nimtaavgt-1 -18605 -18098 -18543 -18134 -18142 (-148) (-146) (-147) (-144) (-136) Leveraget-1 18871 18253 18850 18818 22959 (246) (239) (247) (246) (273) Exretavgt-1 -65512 -63473 -65619 -66528 -60151 (-232) (-224) (-232) (-234) (-206) Rsizet-1 -02951 -03035 -02939 -02884 -03422 (-320) (-330) (-314) (-303) (-351) STD_Rett-1 13001 12614 12989 12946 12937 (330) (318) (329) (325) (300) Casht-1 -50233 -48829 -50187 -48938 -46751 (-340) (-334) (-339) (-331) (-317) ΔCasht-1 34642 33340 34604 33898 37284 (134) (131) (134) (132) (141) Mbt-1 00633 00068 00627 00776 02711 (025) (003) (024) (031) (108) Pricet-1 08508 08303 08510 08422 08439 (342) (334) (342) (337) (321) Ratet-1 354836 340016 355005 357905 349742 (100) (097) (100) (100) (091) Inten_RDt-1 -191577 -196993 -191563 -189446 -184807 (-209) (-222) (-209) (-204) (-206) Year and Ind Dum Yes Yes Yes Yes Yes Obs 30986 30986 30986 30941 29614 Bankruptcy obs 205 205 205 205 205 Psuedo R-square 02422 02392 02422 02428 02586 and indicates a coefficient is significant at 90 95 and 99 confidence level respectively The logit model used in this table is BANKit = α + γCONit-1 + Controlsit-1 + microt (10)where BANK is the bankruptcy indicator equal to one for bankrupt firms and zero otherwise CON refers to UC_PCA in Model 1 CC_PCA in Model 2 and to both UC_PCA and CC_PCA in Models 3 to 5 In Models 1 to 5 Controls include market-based profitability (NIMTAVG) predictability of excess return (EXRETAVG) market-to-book ratio (Mb) excess firm size (Rsize) leverage ratio (Leverage) liquidity (Cash ratio of cash flow to total assets (ΔCash) return volatility (STD_Ret) stock price (PRICE) risk-free rate (Rate) RampD intensity (Inten_RD) and year and industry dummies
45
Table 5 Cash Enhancing and Informational Roles of Accounting Conservatism
and Causal Relations between Unconditional and Conditional Conservatism and Subsequent Bankruptcy Risk
This table reports SUR estimation results for tri-variate VARX (1) models using conditional and unconditional conservatism bankruptcy risk and their interactions with cash or information asymmetry as autoregressive vectors Bankruptcy risk measures are EDF and Campbell unconditional and conditional conservatism measurements used are UC_PCA and CC_PCA respectively Model details are provided at the end of the table
Panel A Tests for Cash Enhancing Role of Conservatism Model 1 Model 2 Independent Variables
EDFt UC_PCAt CC_PCAt Campbellt UC_PCAt CC_PCAt Intercept 02944 -00308 30679 03040 -00296 31702 (1392) (-827) (3982) (1443) (-804) (4168) UC_PCAt-1Casht-1 -03010 -03437 (-946) (-1085) UC_PCA t-1 -00321 08838 00997 -00067 08839 00620 (-506) (35425) (193) (-106) (35490) (120) CC_PCA t-1Casht-1 -00276 -00115 (-583) (-244) CC_PCAt-1 -00050 00010 -00146 -00092 00008 -00099 (-702) (366) (-262) (-1293) (289) (-177) EDF t-1 03527 00438 -03785 (7754) (2135) (-893) Campbellt-1 04619 00432 -05588 (10704) (2248) (-1408) Controls Yes Yes Yes Yes Yes Yes F-statistic for H0 θ11+ γ11 = 0 13131 14652 F-statistic for H0 δ11+ θ12 = 0 5570 2264 Sample size 30276 30270 Sys weighted R2 06018 05893 Panel B Tests for Information Role of Conservatism
Model 1 Model 2 Independent Variables EDFt UC_PCAt CC_PCAt Campbellt UC_PCAt CC_PCAt
Intercept 03039 -00308 30679 03198 -00296 31702 (1429) (-827) (3982) (1507) (-804) (4168) UC_PCAt-1STD_Rett-1 -00453 -01367 (-300) (-907) UC_PCA t-1 -00305 08838 00997 00346 08839 00620 (-320) (35425) (193) (365) (35490) (120) CC_PCA t-1STD_Rett-1 -00201 -00004 (-1056) (-020) CC_PCAt-1 00026 00010 -00146 -00097 00008 -00099 (240) (366) (-262) (-895) (289) (-177) EDF t-1 03760 00438 -03785 (7780) (2135) (-893) Campbellt-1 04666 00432 -05588 (10688) (2248) (-1408) Controls Yes Yes Yes Yes Yes Yes F-statistic for H0 θ11+ γ11 = 0 6882 12508 F-statistic for H0 δ11+ θ12 = 0 23159 7627 Sample size 30276 30270 Sys weighted R2 07761 07778
and indicates a coefficient is significant at 90 95 and 99 confidence level respectively The tri-variate VARX(1) model used in this table consists of the following three equations BRt = α10 + β11BRt-1 + γ11UC_PCAt-1 + δ11CC_PCAt-1 + θ11Rolet-1UC_PCAt-1 + θ12RoleCC_PCAt-1 + θ13Rolet-1 + Controls + ε11 UC_PCAt = α20 + β21BRt-1 + γ21 UC_PCAt-1 + δ21CC_PCAt-1 + Controls + ε21 CC_PCAt = α30 + β31BRt-1 + γ31UC_PCAt-1 + δ31CC_PCAt-1 + θ32Rolet-1 + Controls + ε31 where Role = Cash and STD_Ret in Panels A and B respectively Controls are the same as those in the corresponding equations (4) to (6)
46
Table 6 SOX Auditor Resignation and Causal Relations between Bankruptcy Risk and Subsequent Unconditional and Conditional Conservatism
This table reports SUR results for tri-variate VARX (1) models with bankruptcy risk unconditional and conditional conservatism as dependent variables and with their one-period lags and interactions with post-SOX SOX and with post-auditor-resignation Aud_resign as autoregressive vectors Bankruptcy risk measures are EDF and Campbell unconditional and conditional conservatism measures are UC_PCA and CC_PCA respectively Model details are provided at the end of the table
Panel A SOX and Causal Relations between Conservatism and Bankruptcy Risk Model 1 Model 2 Independent Variables EDFt UC_PCAt CC_PCAt Campbellt UC_PCAt CC_PCAt
Intercept 03505 00304 29754 03858 00318 30675 (1704) (531) (4608) (1810) (565) (4838) UC_PCAt-1SOX -00322 00009 (-369) (010) UC_PCAt-1 -00327 06636 01056 -00197 06641 00743 (-667) (18404) (260) (-389) (18419) (183) CC_PCAt-1SOX -00007 -00040 (-056) (-313) CC_PCAt-1 -00081 00014 -00130 -00102 00012 -00076 (-1342) (321) (-258) (-1621) (275) (-151) EDFt-1SOX 00105 -00261 (181) (-039) EDFt-1 02456 00316 -02777 (6218) (904) (-703) Campbellt-1SOX 00135 01041 (237) (159) Campbellt-1 03331 00320 -04661 (8515) (958) (-1234) Controls Yes Yes Yes Yes Yes Yes Sample size 34896 34890 Sys weighted R2 06016 05893
Panel B Auditor Resignations and Causal Relations between Conservatism and Bankruptcy Risk Model 1 Model 2 Independent Variables EDFt UC_PCAt CC_PCAt Campbellt UC_PCAt CC_PCAt
Intercept 02311 00116 30028 03840 00011 29924 (432) (032) (698) (719) (003) (701) UC_PCAt-1 -01108 06775 -00284 -00593 06774 -00419 (-279) (2699) (-009) (-149) (2705) (-014) UC_PCA t-1Aud_resignt-1 -00400 00062 (-073) (011) CC_PCA t-1 -00042 00052 -00549 -00215 00050 -00545 (-073) (156) (-138) (-372) (149) (-136) CC_PCAt-1Aud_resignt-1 -00062 00009 (-080) (011) EDF t-1 00910 00235 00515 (334) (099) (018) EDFt-1Aud_resignt-1 00792 00407 (256) (010) Campbellt-1 02751 00437 00965 (1014) (184) (034) Campbellt-1Aud_resignt-1 00522 -01155 (167) (-030) Controls Yes Yes Yes Yes Yes Yes Sample size 732 732 Sys weighted R2 06782 06351
The tri-variate VARX (1) model used in this table consists of the following three equations BRt = α10 + β11BRt-1 + γ11UC_PCAt-1 + δ11CC_PCAt-1 + θ11Expt-1UC_PCAt-1 + θ12Expt-1CC_PCAt-1 + θ13Expt-1 + Controls + ε11 UC_PCAt = α20 + β21BRt-1 + γ21UC_PCAt-1 + δ21CC_PCAt-1 + θ21Expt-1BRt-1 + θ22Expt-1 + Controls + ε21 CC_PCAt = α30 + β31BRt-1 + γ31UC_PCAt-1 + δ31CC_PCAt-1 + θ31Expt-1BRt-1 + θ32Expt-1 + Controls + ε31
where Exp = SOX and Aud_Resign in Panels A and B respectively Controls are the same as in the corresponding equations (4) to (6)
47
Table 8 Conservatism Gaming and Causal Relations between Unconditional and Conditional Conservatism and Bankruptcy Risk
This table reports the SUR estimation results for tetra-variate VARX (1) models with bankruptcy risk unconditional and conditional conservatism and conservatism gaming as dependent variables and their one-period lags as autoregressive vectors Bankruptcy risk measures are EDF and Campbell Model 1 uses EDF UC_PCA CC_PCA and Esmooth as the autoregressive vector Model 2 uses Campbell UC_PCA CC_PCA and Esmooth as the autoregressive vector Model details are provided at the end of this table
Model 1 Model 2 Independent Variables EDFt UC_PCAt CC_PCAt Esmootht Campbellt UC_PCAt CC_PCAt EsmoothtIntercept 04339 00191 29232 01992 04795 00214 30107 01979 (2776) (362) (4349) (1507) (2957) (411) (4550) (1518)UC_PCAt-1 -00463 06789 01222 -00264 -00215 06792 00823 -00261 (-894) (18510) (262) (-287) (-402) (18508) (177) (-284) CC_PCAt-1 -00077 00018 -00129 00010 -00110 00016 -00077 00009 (-1334) (444) (-246) (096) (-1833) (393) (-146) (091) Esmootht-1 00009 -00029 -00424 07185 -00041 -00030 -00451 07186 (042) (-194) (-220) (18928) (-185) (-198) (-234) (18930)EDFt-1 02510 00405 -02684 -00023 (6004) (1371) (-715) (-031) Campbellt-1 03405 00396 -04287 -00003 (8213) (1401) (-1195) (-005) Ln(MV)t -00374 00157 -02657 -00010 -00308 00151 -02675 -00009 (-6102) (3762) (-4991) (-092) (-4970) (3745) (-5221) (-085) Leveraget 06472 -00685 02969 00516 04698 -00680 03835 00505 (8993) (-1393) (474) (419) (6390) (-1388) (616) (412) ROAt -04005 -02626 -64814 00991 -09346 -02513 -66653 01003 (-3075) (-2883) (-5591) (435) (-6824) (-2721) (-5680) (434) STD_Rett 03233 01706 (7466) (3825) Casht -00341 -03149 (-358) (-3166) ΔCasht -00685 -01386 (-481) (-938) Ratet -20966 -11019 (-1123) (-570) Inten_RDt -00005 00023 -00080 -00010 00023 -00085 (-089) (615) (-170) (-193) (628) (-181) volatility_ROAt -00110 -00102 (-048) (-045) Year and Ind Dum Yes Yes Yes Yes Yes Yes Yes Yes F-statistic 13383 18803 5110 17980 19644 14280
Sample size 32361 32355 Sys weighted R2 06080 05990 and indicates a coefficient is significant at 90 95 and 99 confidence level respectively The tetra-variate VARX(1) model used in this table consists of the following four equations BRt = α10 + β11BRt-1 + γ11UC_PCAt-1 + δ11CC_PCAt-1 + θ11Esmootht-1 + Controls + ε11 (11)UC_PCAt = α20 + β21BRt-1 + γ21UC_PCAt-1 + δ21CC_PCAt-1 + θ21Esmootht-1 + Controls + ε21 (12)CC_PCAt = α30 + β31BRt-1 + γ31UC_PCAt-1 + δ31CC_PCAt-1 + θ31Esmootht-1 + Controls + ε31 (13)Esmootht = α40 + β41BRt-1 + γ41UC_PCAt-1 + δ41CC_PCAt-1 + θ41Esmootht-1 + α41Leveraget + α42ROAt + α43Ln(MV)t (14)
+ α44Volatility_ROAt + sumα4jInd_Dumj + sumα4kYear_Dum4k + ε41 where BR = EDF and Campbell in Models 1 and 2 respectively F-statistics in columns 2 and 6 are for H0 γ11 = 0 δ11 = 0 in columns 3 and 7 for H0 β21 = 0 in columns 4 and 8 for H0 β31 = 0 Controls in equations (11) to (13) are the same as in equations (4) to (6)
Health Stage Distress Stage Bankruptcy Stage
T=1 Technical Default
T=2 Default Cash Shortage
T=3 Bankruptcy Bankruptcy Petition
Waiver Private Workouts Liquidation under Chapter 7 or Reorganization under Chapter 11
Technical Default Region Default Region
Figure 1 Bankruptcy Timeline
Time T=0 Borrowing Money
Appendix A Causal Relations between Unconditional Conservatism and Bankruptcy Risk and between Conditional Conservatism and Bankruptcy Risk
This appendix reports estimation models and results for examining relations between unconditional conservatism and bankruptcy risk using bi-variate VARX (1) In particular the bi-variate VARX (1) model consisting of equations (1a) and (2a) tests hypotheses H1a and H2a BRt = α10 + β11BRt-1 + γ11UCt-1 + Controlst + ε11 (1a) UCt = α20 + β21BRt-1 + γ21UCt-1 + Controlst + ε21 (2a) where UC refers to an unconditional conservatism metric UC_ACC UC_BM UC_RES or UC_PCA and BR refers to a bankruptcy risk measure EDF or Campbell The autoregressive vector includes BRt-1 and UCt-1 Exogenous Controlst in equations (1b) and (2b) are the same as in equations (4) and (5) respectively H1a and H1b predict that γ11 lt 0 and β21 gt 0 respectively and Table A1 reports the SUR estimation results
Table A1 Causal Relations between Unconditional Conservatism and Bankruptcy Risk
This table reports the SUR estimation results for bi-variate VARX (1) models consisting of equations (1b) and (2b) Panel A (Panel B) presents results for models using EDF (Campbell) bankruptcy risk measure Unconditional conservatism measures used in both panels are and UC_PCA UC_BM UC_ACC and UC_RES Model details are provided at the end of this table Panel A VARX (1) Model Results when Bankruptcy Risk is EDF
Model 1 Model 2 Model 3 Model 4 Independent Variables
EDFt UC_PCAt EDFt UC_BMt EDFt UC_ACCt EDFt UC_RESt Intercept 03426 00224 03397 -00342 03403 -00068 03365 00979 (1666) (440) (1660) (-524) (1611) (-458) (1591) (1985) UC_PCAt-1 -00458 06624 (-935) (18696) UC_BMt-1 -00310 07169 (-857) (21191) UC_ACCt-1 -01087 05198 (-554) (12107) UC_RESt-1 -00155 04717 (-255) (10882) EDFt-1 02387 00409 02386 00709 02465 00051 02463 -00127 (6065) (1442) (6032) (1935) (6352) (606) (6346) (-459) Ln(MV)t -00362 00158 -00364 00199 -00373 00023 -00374 -00008 (-6282) (3960) (-6334) (3876) (-6538) (1934) (-6553) (-208) Leveraget 06461 -00639 06432 -00132 06356 -00173 06345 -00947 (9500) (-1345) (9426) (-214) (9329) (-1209) (9288) (-2004) ROAt -04196 -02572 -04186 00106 -04291 -01458 -04265 -03507 (-3331) (-2856) (-3322) (091) (-3398) (-5379) (-3372) (-3927) STD_Rett 03161 03131 03029 03058 (7635) (7618) (7125) (7160) Casht -00388 -00477 -00457 -00557 (-426) (-350) (-323) (-393) ΔCasht -00638 -00694 -00703 -00715 (-465) (-768) (-748) (-757) Ratet -11990 -11148 -11902 -11492 (-504) (-472) (-485) (-468) Inten_RDt -00005 00023 -00005 00006 -00005 -00002 -00005 00045 (-100) (611) (-093) (123) (-093) (-168) (-093) (1189) Year and Ind Dum Yes Yes Yes Yes Yes Yes Yes Yes F-statistic 8751 20808 7344 37450 3074 3677 650 2103
Sample size 34896 34896 34896 34896 Sys weighted R2 06857 07035 05821 05962
Panel B VARX (1) Model Results when Bankruptcy Risk is Campbell Model 1 Model 2 Model 3 Model 4 Independent
Variables Campbellt UC_PCAt Campbellt UC_BMt Campbellt UC_ACCt Campbellt UC_RESt Intercept 03726 00347 03672 -00351 03751 -00059 03717 00668 (1743) (666) (1732) (-548) (1712) (-403) (1698) (1945)
50
UC_PCAt-1 -00231 05811 (-498) (17212) UC_BMt-1 -00150 07187 (-401) (21272) UC_ACCt-1 -00067 05183 (-033) (12045) UC_RESt-1 -00134 05221 (-165) (13262) Campbellt-1 03222 00337 03211 00772 03244 00040 03246 -00042 (8295) (1200) (8207) (2211) (8425) (499) (8455) (-227) Ln(MV)t -00285 00170 -00287 00191 -00295 00022 -00293 00020 (-4908) (4267) (-4945) (3880) (-5125) (1913) (-5099) (757) Leveraget 04709 -00712 04672 -00168 04615 -00168 04624 -00906 (6773) (-1446) (6702) (-275) (6629) (-1176) (6622) (-2725) ROAt -09579 -02793 -09612 00349 -09673 -01453 -09659 -03136 (-7233) (-2942) (-7260) (298) (-7291) (-5291) (-7247) (-4890) STD_Rett 01655 01634 01549 01576 (3868) (3862) (3532) (3588) Casht -01368 -01234 -01196 -01334 (-958) (-872) (-813) (-908) ΔCasht -03227 -03498 -03615 -03507 (-3387) (-3711) (-3681) (-3551) Ratet -01104 00047 -00734 -00593 (-045) (002) (-029) (-023) Inten_RDt -00011 00025 -00011 00007 -00011 -00002 -00011 00031 (-210) (636) (-203) (141) (-200) (-165) (-202) (1171) Year and Ind Dum Yes Yes Yes Yes Yes Yes Yes Yes F-statistic 1970 22845 1609 48885 011 2490 271 516 Sample size 34890 34890 34890 34890
Sys weighted R2 06742 06960 06965 06242 and indicates a coefficient is significant at 90 95 and 99 confidence level respectively The bi-variate VARX (1) model used in this table consists of the following two equations BRt = α10 + β11BRt-1 + γ11CONt-1 + α11Leveraget + α12ROAt + α13STD_Rett + α14Ln(MV)t + α15Ratet + α16Inten_RDt (1b)
+ α17Casht + α18ΔCasht + sumα1jInd_Dum1j + sumα1kYear_Dum1k + ε11 CONt = α20 + β21BRt-1 + γ22CONt-1 + α21Leveraget + α22ROAt + α23Ln(MV)t + α24Inten_RDt + sumα2jInd_Dum2j (2b)
+ sumα2kYear_Dum2k + ε21 where BR = EDF in Panel A and BR = Campbell in Panel B CON = UC_PCA in Model 1 CON = UC_BM in Model 2 CON = UC_ACC in Model 3 and CON = UC_RES in Model 4 F-statistics reported in columns 2 4 6 and 8 are for H0 γ11 = 0 those reported in columns 3 5 7 and 9 are for H0 β21 = 0
Panel A of Table A1 reveals that all four measures of unconditional conservatism UC_PCAt-1 UC_BMt-1 UC_ACCt-1 and UC_RESt-1 are significantly negatively associated with the subsequent bankruptcy risk as measured by EDFt Panel B reports the same pattern for Campbellt For the null hypothesis that the predictor coefficients for EDFt and Campbellt are equal to zero the F-statistics are all significant beyond the 95 confidence level except for UC_ACCt-1 in Panel B These results support hypothesis H1a in suggesting that the cash enhancing and informational roles of unconditional conservatism lowers subsequent bankruptcy risk
Table A1 further shows that EDFt-1 and Campbellt-1 are significantly positively associated with subsequent unconditional conservatism except for UC_RES suggesting that prior bankruptcy risk Granger-causes subsequent unconditional conservatism consistent with hypothesis H1b UC_RESt exhibits negative coefficients (t-statistics) of -00127 (-459) for EDFt-1 in Panel A and -00042 (-227) for Campbellt-1 in Panel B Although this result is inconsistent with H1b it is consistent with the intuition that extreme unconditional conservatism in the form of immediate expensing of RampD and advertising expenditures is detrimental to managersrsquo career motives and dominates managersrsquo disciplinary concerns and auditor and regulator interests resulting in disincentives for UC_RESt as bankruptcy risk rises Nor does this negative association for UC_RESt qualitatively change the positive association between bankruptcy risk and subsequent unconditional conservatism exhibited by the combined measure UC_PCAt For the null hypothesis that the predictor coefficients for UC_PCAt UC_BMt UC_ACCt and UC_RESt are equal to zero F-statistics indicate rejection beyond the 95 confidence level Overall these findings support hypothesis H1b in suggesting that bankruptcy risk stimulates subsequent unconditional conservatism consistent with the interests of auditors creditors and regulators offsetting managersrsquo career motives in the case of unconditional conservatism as predicted The signs of the coefficients of the exogenous control variable are also consistent with predictions For example EDFt and Campbellt are generally positively associated with Leveraget and STD_Rett and negatively associated with ROAt Ln(MV)t Ratet Casht ΔCasht and Inten_RDt
51
Appendix B Causal Relations between Conditional Conservatism and Bankruptcy Risk This appendix reports estimation results regarding examining relations between conditional conservatism and bankruptcy risk using bi-variate VARX (1) In particular the following bi-variate VARX (1) model consisting of equations (1b) and (2b) tests hypotheses H1b and H2b regarding causal relations between conditional conservatism and bankruptcy risk BRt = α10 + β11BRt-1 + γ11CCt-1 + Controlst + ε11 (1b) CCt = α20 + β21BRt-1 + γ21CCt-1 + Controlst + ε21 (2b) where CC refers to a conditional conservatism metric CC_ACM CC_AR CC_CR or CC_PCA and BR refers to a bankruptcy risk measure EDF or Campbell The autoregressive vector includes BRt-1 and CCt-1 Controlst in equations (3b) and (4b) are the same as in equations (4) and (6) respectively with the same predictions H1b and H2b predict that γ11 lt 0 and β21 lt 0 respectively and Table B1 reports the SUR estimation results
Table B1 Causal Relations between Conditional Conservatism and Bankruptcy Risk
This table reports the SUR estimation results for bi-variate VARX (1) models consisting of equations (1b) and (2b) Panel A (Panel B) presents results for models using EDF (Campbell) bankruptcy risk measure Conditional conservatism measurements are CC_PCA CC_AR CC_CR and CC_ACM Model details are provided at the end of this table
Panel A Bivaiate VARX (1) Model Results when Bankruptcy Risk is EDF Model 1 Model 2 Model 3 Model 4 Independent
Variables EDFt CC_PCAt EDFt CC_ARt EDFt CC_CRt EDFt CC_ACMt Intercept 03478 30130 06136 38327 03369 03381 03368 00051 (1648) (4806) (2970) (18658) (1592) (443) (1592) (377) CC_PCAt-1 -00084 -00124 (-1526) (-247) CC_ARt-1 -00724 02947 (-5920) (9398) CC_CRt-1 -00009 -00260 (-206) (-506) CC_ACMt-1 -00570 05317 (-254) (11959) EDFt-1 02531 -02990 03006 -03017 02468 -03311 02463 -00054 (6497) (-847) (7855) (-3083) (6348) (-769) (6346) (-707) Ln(MV)t -00389 -02648 -00641 -03903 -00374 00174 -00373 00010
(-6739) (-5256) (-8955)(-21572) (-6558) (286) (-6533) (890)
Leveraget 06343 03211 06495 09121 06345 -02801 06350 00065 (9334) (540) (9984) (5687) (9306) (-384) (9313) (503) ROAt -04323 -65718 -03462 -07408 -04274 -78724 -04252 -00695 (-3433) (-5830) (-2861) (-2428) (-3378) (-5678) (-3368) (-2833) STD_Rett 03088 03451 03040 03052 (7269) (8517) (7135) (7161) Casht -00780 -01184 -00776 -00796 (-833) (-1328) (-826) (-848) ΔCasht -00484 -00161 -00526 -00512 (-342) (-120) (-371) (-361) Ratet -11459 -14083 -11560 -11476 (-468) (-604) (-470) (-467) Inten_RDt -00005 -00084 -00006 -00020 -00005 -00087 -00005 -00003 (-089) (-177) (-112) (-154) (-091) (-149) (-089) (-246) Year and Ind Dum Yes Yes Yes Yes Yes Yes Yes Yes F-statistic
23276 7182 350580 95078 426 5909 648 4997
Sample size 34890 34896 34896 34896 Sys weighted R2 05516 08353 05263 05670 Panel B Bivaiate VARX (1) Model Results when Bankruptcy Risk is Campbell
Model 1 Model 2 Model 3 Model 4 Independent Variables Campbellt CC_PCAt Campbellt CC_ARt Campbellt CC_CRt Campbellt CC_ACMt Intercept 03872 30793 06594 37606 03691 05207 03730 00062 (1775) (4992) (3078) (18283) (1686) (694) (1703) (463)
52
CC_PCAt-1 -00110 -00073 (-1934) (-146) CC_ARt-1 -00721 02883 (-5488) (8802) CC_CRt-1 -00035 -00228 (-731) (-445) CC_ACMt-1 -00376 05323 (-162) (11981) Campbellt-1 03353 -04505 04035 -01588 03261 -06585 03241 -00076 (8681) (-1336) (10264) (-1629) (8480) (-1607) (8442) (-1044) Ln(MV)t -00315 -02663 -00579 -03824 -00294 00070 -00294 00009 (-5420) (-5509) (-7807) (-21063) (-5118) (121) (-5112) (905) Leveraget 04599 04018 04722 08396 04603 -01020 04610 00077 (6642) (680) (7079) (5210) (6618) (-141) (6623) (596) ROAt -09714 -67584 -08700 -07316 -09720 -81852 -09665 -00727 (-7362) (-5929) (-6769) (-2331) (-7323) (-5844) (-7286) (-2926) STD_Rett 01608 01480 01569 01567 (3682) (3541) (3579) (3570) Casht -03607 -03421 -03627 -03665 (-3700) (-3675) (-3705) (-3742) ΔCasht -01209 -01017 -01235 -01227 (-827) (-727) (-841) (-835) Ratet -00478 -02909 -00326 -00475 (-019) (-120) (-013) (-019) Inten_RDt -00010 -00089 -00011 -00022 -00011 -00094 -00011 -00003 (-195) (-188) (-221) (-169) (-197) (-161) (-197) (-255) Year and Ind Dum Yes Yes Yes Yes Yes Yes Yes Yes F-statistic
37387 16627 301392 26565 5343 25829 263 10891
Sample size 34890 34890 34890 34890 Sys weighted R2 05300 08111 05043 05471 and indicates a coefficient is significant at 90 95 and 99 confidence level respectively The bi-variate VARX (1) model used in this table consists of the following two equations BRt = α10 + β11BRt-1 + γ11CONt-1 + α11Leveraget + α12ROAt + α13STD_Rett + α14 Ln(MV)t + α15Ratet + α16Inten_RDt (1b)
+ α17Casht + α18ΔCasht + sumα1jInd_Dum1j + sumα1kYear_Dum1k + ε11 CONt = α20 + β21BRt-1 + γ22CONt-1 + α21Leveraget + α22ROAt + α23Ln(MV)t + α24Inten_RDt + sumα2jInd_Dum2j (2b)
+ sumα2kYear_Dum2k + ε21 where BR = EDF in Panel A and BR = Campbell in Panel B CON = CC_PCA in Model 1 CON = CC_AR in Model 2 CON = CC_CR in Model 3 and CON = CC_ACM in Model 4 F-statistics reported in columns 2 4 6 and 8 are for H0 γ11 = 0 those reported in columns 3 5 7 and 9 are for H0 β21 = 0
Panel A of Table B1 reveals that all four measures of conditional conservatism CC_PCAt-1 CC_ARt-1 CC_CRt-1 and CC_ACMt-1 are negatively associated with subsequent bankruptcy risk measured by EDFt and Panel B reveals the same pattern for Campbellt-1 For the null hypothesis that the predictor coefficients for EDFt and Campbellt are equal to zero the F-statistics are all significant beyond the 90 confidence level except for CC_ACMt-1 in Panel B These findings suggest that conditional conservatism reduces subsequent bankruptcy risk consistent with the cash enhancing and informational properties of conditional conservatism as predicted by hypothesis H2b Table B1 further shows that bankruptcy risk metrics EDFt-1 and Campbellt-1 are uniformly negatively associated with subsequent conditional conservatism measured by CC_PCAt CC_ARt CC_CRt and CC_ACMt These findings suggest that prior bankruptcy risk lowers subsequent conditional conservatism consistent with hypothesis H2b For the null hypothesis that the predictor coefficients for CC_PCAt CC_ARt CC_CRt and CC_ACMt are equal to zero F-statistics are all significant beyond the 99 confidence level These findings support hypothesis H2b in suggesting that bankruptcy risk reduces subsequent conditional conservatism and is consistent with the notion that although it mitigates subsequent bankruptcy risk conditional conservatism is resisted by managers whose career motives dominate their disciplinary concerns as predicted
11
Merton (1974) and Campbell following Campbell et al (2008) are estimated using CRSP and
Compustat data Ex-post-bankruptcy risk measure BANK indicator of firms that actually
declared bankruptcy is obtained from wwwbankruptcydatacom Firm-year observations with
missing values for conservatism bankruptcy risk stock price total assets and net income
before extraordinary items are omitted Since young firms have high bankruptcy risk and thus
survival bias can significantly influences sampling and results we include as much young
firms as possible by setting the minimum requirement for calculating accrual-based
conservatism measures as having prior two years and for using the one-period lag
specifications for VARX models so that only firms with less than three-year histories are
excluded We further omit post-bankruptcy firm-year observations for firms filing under
Chapter 11 of the US Bankruptcy Code since these observations may be incomparable with
pre-bankruptcy data To reduce the effects of outliers observations in the top and bottom 1
of the major variables are winsorized and firms in financial industries (SIC codes 6000-6999)
are excluded The final sample is comprised of 34897 firm-year observations for 4621 firms
32 Measures for Bankruptcy Risk Bankruptcy risk is measured as the probability that a firm will liquidate under Chapter 7
or reorganize under Chapter 11 of the US Bankruptcy Code which are conditions typically
triggered when firms cannot service their rising cash obligations Varied bankruptcy risk
measures have been previously estimated using both structural and restrictive form models
among which we choose Mertonrsquos (1974) EDF and Campbell score (Campbell et al (2008))
(2008) as bankruptcy risk metrics in the main tests in terms of predictive ability and freedom of
estimation bias caused by accounting conservatism EDF measure is estimated from a
structural model it has superior predictive ability (Hillegerst et al (2004)) and is less subject
to conservatism bias since its only accounting input is the face value of debt The Campbell
score is estimated from a restrictive form model it t has the best predictability for bankruptcy
risk among all available metrics (Campbell et al (2008)) and is less subject to conservatism
bias than accounting-based restrictive form model such as such as Altmanrsquos (1968) Z-score
(except as a robustness check) Olsonrsquos (1980) O-score and Zmijewskirsquos (1984) Z-score Both
EDF and Campbell are ex ante bankruptcy risk measure to provide a measure that is free of
estimation error we also employ an ex post bankruptcy risk measure BANK the indicator of
actual bankruptcy The three measures are detailed below
EDF EDF is the ranked probability that firmrsquos asset value will fall below its liabilities
after T years (T = one year in this study) assuming that the firmrsquos asset value (continuous rate
of growth in assets) is log-normally (normally) distributed Merton (1974) EDF is an option-
12
based structural model that expresses a firmrsquos market value (VE) as a call option on the firmrsquos
assets (VA) with a strike price equal to the face value of debt and time to expiration equal to T
Applying the Black and Scholes (1973) formula and Itorsquos lemma to Merton (1974) model we
estimate EDF as
EDFt = prob-[ln(VAt Xt) + (μ - 05σA2)T] (σAT12) ge εt+T (1)
= N(-(ln(VAt Xt) + (μ - 05σA2)T) (σAT12))
where N is the cumulative density function of the standard normal distribution X is the face
value of a firmrsquos debt σA is the volatility of a firmrsquos assets and μ is the instantaneous drift
assuming the firmrsquos market value follows Geometric Brownian Motion Its intuition is that the
probability that a firmrsquos assets are insufficient to pay the face value of its debt increases with
the firmrsquos debt and asset volatility and decreases with the firmrsquos assets Further details
regarding the estimation of EDF are available on request
The Merton (1974) model has strict assumptions for example it assumes that market is
efficient and information is complete 9 In this study we relax this assumption and allows
accounting conservatism to impact EDF through the accounting input leverage ratio
Conservatism facilitates external financing and increases the leverage ratio the strike price in
the Merton (1974) model and this may lead to an overestimate of EDFt However this is not a
serious issue because this bias runs counter to the predictions of all hypotheses except H2a
Thus if the empirical results for H1a H1b and H2b are as predicted the true results should be
stronger than those reported
Campbell Campbell is the ranked probability of a firm declaring bankruptcy one month
ahead It is estimated using a logit model based on monthly stock market variables and
quarterly accounting variables following the formula in the last column of Table III in
Campbell et al (2008) We estimate the Campbell for each fiscal quarter as follows and use
the Campbell for the last fiscal quarter in our main tests
Campbellt = exp(tempt) (1 +exp(tempt)) (2)
where tempt = -908 - 2967 NIMTAVGt + 336 TLMTAt - 735 EXRETAVGt + 148
SIGMAt + 0082 Rsizet - 240 CASHHMTAt + 0054 MBt - 0937 PRICEt The intuition
for Campbell is that bankruptcy risk decreases with the predictability of market-based
profitability (NIMTAVG) the predictability of excess return relative to SampP 500 index
9 Other relevant assumptions include (1) creditors and managers have symmetric information about firm value and can observe the inputs into the model (2) default occurs when a firmrsquos asset value drops below its debt obligations at the time of maturity (3) the default barrier is the exogenously determined fixed face value of debt and (4) the asset value follows a diffusion process without jumps
13
(EXRETAVG) the market-based liquidity ratio (CASHHMTA) and the stock price (PRICE)
Bankruptcy risk increases with the market-based leverage ratio (TLMTA) the stock return
volatility (SIGMA) the market-to-book equity ratio (MB) and with firm size relative to that of
the SampP 500 index (Rsize) Further details on estimating Campbell are available on request
In comparison to Merton (1974) model the assumptions underlying the restrictive form
logit model for Campbell are more relaxed for example it allows market inefficiency and
information asymmetry between creditors and the firm and short-term default that can occur
before net asset values breach bankruptcy barriers10 Therefore accounting conservatism could
bias Campbell on some degree conservatism understates net income eg NIMTAVGt asset
items eg CASHHMTAt and overstates total liabilities eg TLMTAt and this leads to an an
upward bias in estimating Campbell However this potential bias runs counter to the
predictions of all hypotheses except H2a Thus if the empirical results for H1a H1b and H2b
are as predicted the true results should be stronger than those reported
BANK BANK is an indicator variable that is equal to one if a firm files for bankruptcy
under Chapter 7 or 11 of the US Bankruptcy Code and zero otherwise In contrast to EDF
and Campbell which are ex-ante bankruptcy risk metrics BANK is an ex-post bankruptcy risk
measure that is free of estimation error and conservatism bias However the subsample of
firms that actually declare bankruptcy is much smaller and may not be representative of all
firms along a bankruptcy risk continuum Moreover BANK does not support an examination
of continuous relations between conservatism and bankruptcy risk and because data may not
exist or be comparable following the declaration of bankruptcy BANK does not facilitate the
testing of causal relationships between bankruptcy and subsequent unconditional and
conditional conservatism We therefore use EDF and Campbell in our main tests
33 Measures for Unconditional and Conditional Conservatism Givoly et al (2007) advocate using multiple measures of conservatism since different
metrics measure conservatism from different dimensions Following these studies we examine
four firm-year measures of unconditional conservatism UC_ACC (total accruals as adapted
from Ahmed and Duellman (2007)) UC_BM (rank of industry-adjusted book-to-market ratio)
UC_RES (hidden reserves) and UC_PCA (a factor score from a principal components analysis
of the above three metrics) We likewise examine four firm-year measures of conditional
conservatism CC_AR (extending Khan and Watts (2009)) CC_CR (extending Callen et al
10Other relevant assumptions include (1) default time is unobservable and no longer tied to firm value falling below a pre-specified default barrier (2) default follows an intensity-based process (eg PoissonCox process) with exogenous latent variables (3) the probability of default is logistically distributed ie the cumulative probability of default takes a logistic functional form
14
(2010a)) CC_ACM (accumulated non-operational accruals extending Zhang (2008)) and
CC_PCA (a factor score from a principal components analysis of the above three metrics) as
described below
UC_ACC A proxy for unconditional conservatism equal to negative one times the ratio
of average total accruals before depreciation to average total assets both averaged over a three-
year period ending with the current year Thus a higher total accrual indicates a higher degree
of unconditional conservatism The rationale is that conservatism results in persistently
negative accruals (Givoly and Hayn (2000) Ahmed et al (2007)) We calculate total accruals
as Total accrualsit = net income before extraordinary itemsit (Compustat IB) -operational cash
flowit (Compustat OANCF) + depreciation expenseit (Compustat DP)
UC_BM A proxy for unconditional conservatism measured as the industry-adjusted
ranking of the product of negative one times the ratio of book value to market value of
common shareholders equity (Ahmed et al (2007) Zhang (2008)) UC_BM also reflects
expected economic rents and future growth opportunities and we use RampD intensity to control
for them following Ahmed and Duellman (2007)
UC_RES A proxy for unconditional conservatism reflected in ldquohiddenrdquo reserves related
to advertising (ADV) research and development (RD) and last-in-first-out inventory
accounting (INV) Extending Penman and Zhang (2002) this study measures UC_RES as the
ratio of hidden reserves to total assets (TA)
UC_RESt = (INVtres + RDt
res + ADVtres) TAt
11 (3)
UC_PCA A proxy for unconditional conservatism measured as the factor score
generated from a principal components analysis of the three unconditional conservatism
measures UC_ACC UC_BM and UC_RES UC_PCA reflects commonalities across these
three measures that gauge unconditional conservatism at different dimensions and with
different weaknesses Specifically UC_ACC is an accrual-based metric that does not capture
non-accrual unconditional conservatism for example RampD and advertising expenditures
UC_BM is a market-based metric that not only measures the understatement of book value
relative to market value but also reflects expected economic rents and future growth
opportunities UC_RES captures only unconditional conservatism related to hidden reserves
Based on this reasoning we employ UC_PCA as the primary measure of unconditional 11 The inventory hidden reserve INVit
res equals the LIFO reserve RDitres is calculated using coefficients in Lev and Sougiannis
(1996) to capitalize and amortize RampD ADVitres is advertising expense capitalized and amortized over two years following
Bublitz and Ettredge (1989) Penman and Zhang (2002) use net operating assets as the deflator for hidden reserves but its value is negative for over one-sixth of our sample which would potentially bias estimated hidden reserves We therefore use total assets as the deflator When data are missing for LIFO reserves RampD expensing and advertisement expensing they are set to zero
15
conservatism in our main empirical tests To the extent that the three component metrics
measure unconditional conservatism from different dimensions convergent validity is not a
problem if they are all positively related with UC_PCA but are negative related with each
other12
CC_AR A proxy for conditional conservatism defined as the ratio of the sum of the C
Score and G Score to G Score from Khan and Watts (2009) and it is a measure of asymmetric
response similar to that derived from Basu (1997) Our sampling period 1989 through 2007
is similar to that examined in Khan and Watts (2009) 1963 through 2005 and our sample size
is also similar Hence we use model 2 in Table 3 of Khan and Watts (2009) to estimate
CC_AR13
CC_CR A proxy for conditional conservatism extending Callen et al (2010a) We
estimate CC_CR as the ratio of current earnings shocks to total earnings news for bad earnings
news with the ratio multiplied by -1 for good earnings news14 This definition derives from
Vuolteenahorsquos (2002) return decomposition model but differs from the definition of the CR
ratio in Callen et al (2010a) mainly at four respects (1) CC_CR uses the indirect method to
estimate earnings news as in Vuolteenaho (2002) (2) CC_CR multiplies the CR ratio by -1 for
good earnings news so that higher CC_CR represents greater conditional conservatism for the
good news case (3) negative observations of CC_CR are not eliminated from the sample (4)
Intercepts are added to the VAR (1) model for estimating CC_CR Additional details
regarding the estimation of CC_CR are available on demand
CC_ACM A proxy for conditional conservatism measured as negative one times the ratio of
accumulated non-operating accruals over a three-year period to accumulated total assets and is
adapted from Zhang (2008) A higher value for CC_ACM indicates a higher level of bad news
reported via non-operational accruals Non-operating accruals are calculated as follows
12 Convergent validity means multiple measures for a concept are valid when they are positively correlated with each other The underlying assumption is that they are measuring the same concept from the same dimension When measure from different dimension they may be negatively correlated For example firms with high hidden reserves may have fewer incentives to use accrual-based unconditional conservatism which may suggest a negative relation between UC_ACC and UC_RES 13 Khan and Watts (2009) use the following reverse earnings return response regression model Eit = b1 + b2DRit + Rit(m1 + m2Sizeit + m3MBit + m4LEVit) + DRitRit (l1 + l2Sizeit + l3MBit + l4LEVit) + b3Sizeit + b4MBit + b5 LEVit + DRit(l1 + l2Sizeit + l3MBit + l4LEVit) where C (G) score measures the timeliness of bad (good) news as follows G_Scoreit = m1 + m2Sizeit + m3MBit + m4 LEVit = 0237 - 0033Sizei - 0007MBit + 0033LEVit C_Scoreit = l1 + l2Sizeit + l3MBit + l4LEVit = 0031 + 0005Sizeit - 0006MBit + 0005LEVit Then CC_AR is calculated as CC_ARit = (C_Scoreit + G_Scoreit) G_Scoreit = 1 + C_Scoreit G_Scoreit CC_AR is the asymmetric response coefficient in the Khan and Watts (2009) framework corresponding to that in Basu (1997) However by construction CC_AR may be positively correlated with both EDF and Campbell For example Khan and Watts (2009) suggest that the C (G) score is positively (negatively) associated with the leverage ratio and that the C score is positively associated with return volatility 14 CC_AR derives from the Basu (1997) framework and its criterion for classifying good versus bad news is whether the associated stock return is positive or negative CC_CR derives from the Vuolteenaho (2002) framework and its criterion for classifying good versus bad news is whether ROE earnings scaled by book equity is greater than the risk-free rate
16
Nonoperating accruals = Total accruals 15 - Δaccounts receivable (Compustat RECT) -
Δinventories (Compustat INVT) - Δprepaid expenses (Compustat XPP) + Δaccounts payable
(Compustat AP) + Δtaxes payable (Compustat TXT)
CC_PCA A proxy for conditional conservatism measured as the factor score generated from
a principal components analysis of the three conditional conservatism measures CC_AR
CC_CR and CC_ACM CC_PCA captures commonalities among these three metrics that
measure conditional conservatism at difference dimensions and with different weaknesses
CC_AR and CC_CR are both market-based metrics subject to noise from voluntary disclosures
of accounting and non-accounting information CC_AR by construction may be subject to
upward bias in its correlation with bankruptcy risk metrics EDF and Campbell CC_ACM is an
accrual-based metric that captures both bad news in accruals and ldquobig bathsrdquo resulting from
earnings manipulations and investment accruals Therefore this study employs CC_PCA as the
primary measure of conditional conservatism in the main empirical tests
34 Estimation Models and Methods Following Lara et al (2009) this study employs VARX models (VAR models with
exogenous variables) to test causal relationships between the two types of conservatism and
bankruptcy risk The VARX models are estimated using seemingly unrelated regression
(SUR) which improves efficiency when estimating systems of equations with correlated
random errors by taking into account cross-equation correlations When the cross-sectional
covariance of the error terms is small SUR estimation will differ little from OLS estimation
Because prior studies eg Ryan (2006) suggest that to some degree unconditional and
conditional conservatism can be substitutes we use a tri-variate VARX (1) model consisting of
equations (4) to (6) to examine the causal relations between unconditional and conditional
conservatism and bankruptcy risk predicted by hypotheses H1a H2a H1b and H2b while
controlling for the endogeneity between the two types of conservatism H1a H2a H1b and
H2b predict γ11 lt 0 δ11 lt 0 β21 gt 0 and β31 lt 0 respectively
BRt = α10 + β11BRt-1 + γ11UC_PCAt-1 + δ11CC_PCAt-1 + Controlst + ε11 (4)
UC_PCAt = α20 + β21BRt-1 + γ21UC_PCAt-1 + δ21CC_PCAt-1 + Controlst + ε21 (5)
CC_PCAt = α30 + β31BRt-1 + γ31UC_PCAt-1 + δ31CC_PCAt-1 + Controlst + ε31 (6)
15 Zhang (2008) uses the term ldquooperational accrualrdquo but this term matches the definition of total accruals used in Ahmed et al (2007) Following Zhang (2008) when cash flow from operations is not available total accruals are calculated as follows Total accruals = net income (Compustat NI) + depreciation (Compustat DP) - funds from operations (Compustat FOPT) + Δcurrent assets (Compustat ACT) - Δdebt (Compustat DLC) - Δcurrent liabilities (Compustat LCT) - Δcash (Compustat CHE)
17
where BR refers to bankruptcy risk measures EDF or Campbell and the autoregressive vector
includes BRt-1 UC_PCAt-1 and CC_PCAt-1 Controlst in equation (4) include previously
identified determinants of bankruptcy risk (Anderson et al (1996) Shumway (2001) Parker et
al (2002) Uhrig-Homburg (2005) Campbell et al (2008) Eberhart et al (2008)) namely the
leverage ratio (Leveraget) return on total assets (ROAt) return volatility (STD_Rett) firm size
(Ln(MV)t) the risk-free rate (Ratet) liquidity (Casht) changes in liquidity (ΔCasht) and RampD
investment intensity (Inten_RDt) Consistent with Shumway (2001) Uhrig-Homburg (2004)
Campbell et al (2008) and Eberhart et al (2008) this study predicts bankruptcy risk to be
positively associated with leverage and return volatility and negatively associated with ROA
liquidity cash flow firm size the risk-free rate and RampD investment intensity Controlst in
equation (5) include previously identified determinants of unconditional conservatism namely
the leverage ratio (Leveraget) firm size (Ln(MV)t) and RampD investment intensity
(Inten_RDt)16 These variables proxy for demand for unconditional conservatism arising from
contracting considerations litigation risk taxation and regulation while investment intensity
Inten_RDt is used to control for the effects of RampD investment and growth opportunities
(Ahmed and Duellman (2007)) Controlst in equation (6) are the same as in equation (5) but
with different predictions17 Lastly in all the three equations dummies for the Fama and
French (1997) industry classification (Ind_Dum) and for the fiscal year (Year_Dum) are
included to capture fixed industry and year effects
VARX estimation is also sensitive to lag structure A lag structure that is too short
wastes information and risks non-zero serial correlations with error terms thus biasing
parameter estimates while an overly long lag length can risks inaccurate parameter estimation 16 We predict unconditional conservatism to be negatively related to financial leverage and ROA and positively related to firm size A negative association between unconditional conservatism and financial leverage follows from the reasoning that firms with high levels of leverage tend to have greater conflicts between bondholders and shareholders Beaver and Ryan (2000) provide confirming evidence that leverage is negatively associated with unconditional conservatism The relationship between unconditional conservatism and ROA reflects the net of incentives to mitigate bankruptcy risk and report higher earnings As ROA increases there is less incentive to use unconditional conservatism to lessen bankruptcy risk but also less incentive to boost earnings and more incentive to create hidden reserves that we predict will dominate A positive association between unconditional conservatism and firm size follows from the reasoning in Khan and Watts (2009) that larger firms have richer information environments reducing both overall uncertainty and information asymmetries thus leading to less contracting demand and findings in Qiang (2007) that contracting efficiency induces little demand for unconditional conservatism Hagerman and Zmijewki (1979) suggest that firm size proxies for political visibility and because larger firms are more visible they are subject to higher tax and regulation costs and receive lower subsidies Larger firms also may be more subject to greater litigation risk Consistent with these arguments Ahmed et al (2002) document that firm size is positively associated with the unconditional conservatism metrics BM ratio and total accruals 17 We predict conditional conservatism to be positively related to financial leverage but negatively related to firm size and ROA A positive association between conditional conservatism and financial leverage is expected because creditors preferring conditional conservatism will have increasing influence over firms as financial leverage increases especially for firms in financial distress A negative association between conditional conservatism and firm size is expected from the results of Khan and Watts (2009) who suggest that larger firms have richer information environments that reduce both overall uncertainty and information asymmetries and thus contracting demand for conditional conservatism Givoly et al (2007) and LaFond and Watts (2008) similarly document that the asymmetric timeliness of earnings for large firms is significantly smaller than for small firms A negative association between conditional conservatism and ROA follows from the reasoning that well-performing firms have less pressure to use conditional counter-conservatism to boost earnings
18
To examine the robustness of our results to the length of lag structure in the VARX model we
also use the following VARX(3) model to examine the causal relations between unconditional
and conditional conservatism and bankruptcy risk predicted by hypotheses H1a H2a H1b and
H2b
BRt = α10 + β11BRt-1 + β12BRt-2 + β13BRt-3 + γ11UC_PCAt-1 + γ12UC_PCAt-2 + (7)
γ13UC_PCAt-3 + δ11CC_PCAt-1 + δ12CC_PCAt-2 + δ13CC_PCAt-3 + Controlst + ε11
UC_PCAt = α20 + β21BRt-1 + β22BRt-2 + β23BRt-3 + γ21UC_PCAt-1 +γ22UC_PCAt-2 + (8)
γ23UC_PCAt-3 + δ21CC_PCAt-1 + δ22CC_PCAt-2 + δ23CC_PCAt-3 + Controlst + ε21
CC_PCAt = α30 + β31BRt-1 + β32BRt-2 + β33BRt-3 + γ31UC_PCAt-1 + γ32UC_PCAt-2 + (9)
γ33UC_PCAt-3 + δ31CC_PCAt-1 + δ32CC_PCAt-2 + δ33CC_PCAt-3 + Controlst + ε31
where BR refers to bankruptcy risk measures EDF or Campbell and the autoregressive vector
includes the one- to three- period lags of BR UC_PCA and CC_PCA Controls used in
equations (7) to (9) are the same as those used in equations (4) to (6) H1a predicts γ11 + γ12 +
γ13 lt 0 H2a predicts δ11 + δ12 + δ13 lt 0 H1b predicts β21 + β22 + β23 gt0 and H2b predicts β31
+ β32 + β33 lt0
This study employs the Akaike Information Criterion (AIC) to identity an optimal lag
structure for VARX model The Akaike Information Criterion is a goodness of fit measure for
estimated models that considers both precision and complexity It is not a hypothesis test but a
tool for model selection For a given dataset the competing model with the lowest AIC is
considered to have the best fit We do not use first-order differencing since Dickey-Fuller
tests reveal the major testing variables to be stationary and when there is no unit root first-
order differencing can generate biased coefficient estimates in VARX models18
4 Empirical Results 41 Descriptive Statistics
Table 1 reports summary statistics (Panel A) and correlation matrices (Panel B) for major
variables of interest In Panel A the mean of EDF 00365 is close to its value reported in
Vassalou and Xing (2004) of 0042019 The mean of UC_ACC -00012 is lower than in
Ahmed et al (2002) 0003 and in Ahmed and Duellman (2007) 0010 with this difference
18 Sims (1980) and Doan (1992) argue that differencing should not be used even if the variables contain a unit root (ie are non-stationary) since the goal of VAR analysis is to determine the inter-relationships among variables and differencing can destroy information concerning data co-movements We perform the Dickey-Fuller unit root tests for the unbalanced panel data in this study by running the following regression model for the pooled panel data yt = δyt-1 + εit where yt is the first differencing of y Then we test the hypothesis H0 δ = 0 F-statistics indicate that the major testing variables are stationary at least at the 99 confidence level with results available on request 19 Vassalou and Xing (2004) do not directly report the mean of the EDF which is default likelihood Rather in Table II Vassalou and Xing (2004) report a mean for SV the survival rate of 09579 Since SV is defined as one minus the aggregate default likelihood the mean of EDF is inferred to be 00421 Their sampling period is 1971 to 1999 versus 1989 to 2007 in this study
19
likely due to differing sample periods20 The mean of CC_CR is -03102 much lower than the
CR ratio in Callen et al (2010a) however these values are not comparable because the CR
ratio in Callen et al (2010a) omits observations with negative values whereas the CC_CR
measure in this study does not
Insert Table 1 about here
Panel B of Table 1 presents correlations among contemporaneous observations of the
main testing variables with Pearson (Spearman) correlations reported in the upper (lower)
triangle of the table The Spearman (Pearson) correlations between the bankruptcy risk metrics
EDF and Campbell are 07789 (07789) both statistically significant suggesting that they have
strong convergent validity in measuring ex ante bankruptcy risk Both measures are also
significantly positive related with the ex post bankruptcy risk measure BANK but both the
Pearson and Spearman correlations are as low as 2-35 However this does not mean that
BANK has low convergent validity with EDF and Campbell since they measures bankruptcy
risk from different dimensions
UC_PCA is significantly negatively associated with CC_PCA with their Spearman
(Pearson) correlation -01441 (-00637) Except for CC_ACM the Spearman correlations
among other component measures of the two types of conservatism are predominantly negative
a finding consistent with prior evidence (Beaver and Ryan (2005) Ryan (2006)
Roychowdhury and Watts (2007) Ball et al (2009)) Spearman and Pearson correlations
between UC_PCA and its component unconditional conservatism metrics at different
dimensions are uniformly positive and statistically significant suggesting UC_PCA is an
representative overall unconditional conservatism measure that possesses reasonable content
validity concurrent validity and convergent validity21
Likewise Spearman and Pearson correlations between CC_PCA and its component
conditional conservatism metrics are uniformly positive and statistically significant the only
exception being its Pearson correlation with CC_ACM which is insignificantly different from
zero These correlations suggest that CC_PCA is a representative metric that reasonably
reflects the overall levels of conditional conservatism and captures the commonality of
20 Ahmed et al (2002) and Ahmed and Duellman (2007) use samples of SampP 500 firms during 1993-1998 and 1998-2002 respectively whereas this study uses NYSE AMEX and NASDAQ listed firms for 1989-2007 21 The Spearman and Pearson correlations among the three component measures for unconditional conservatism are within the range of +-010 However this does not mean that they have low convergent validity because they measure unconditional conservatism on different dimensions rather than on the same dimension and thus could be highly uncorrelated In particular the Spearman correlation between UC_RES and UC_ACC is -00390 significantly negative suggesting that firms with higher hidden reserves has less incentives for accrual-based unconditional conservatism it does not suggest lower convergent validity between the two because both measures unconditional conservatism at different dimensions
20
component metrics that measure conditional conservatism from different dimensions22
The Pearson and Spearman correlations of unconditional conservatism with EDF and
Campbell are negative whereas the correlations of conditional conservatism with EDF and
Campbell are positive Care should be taken in interpreting these latter correlations because
they are subject to omitted variable biases In the following sections we systematically
examine the lead-lag relations between unconditional conservatism conditional conservatism
and bankruptcy risk in multivariate analyses
42 Causal Relations Between Unconditional and Conditional Conservatism in Full and Extremely Distressed Samples We first examine the lead-lag relations between unconditional and conditional
conservatism using a tri-variate VARX (1) model described by equations (4) to (6) with results
for the full sample and subsample of firms in extreme distress presented in Table 2 Panels A
and B respectively Models 1 and 2 in both Panels use EDFt and Campbellt as bankruptcy risk
measures respectively Panel A of Table 2 shows that in both Models 1 and 2 UC_PCAt-1 and
CC_PCAt-1 are significantly negatively associated with EDFt and Campbellt when both are
predictors with coefficients (t-statistics) of -00431 (-882) and -00083 (-1505) in the EDFt
equation respectively and -00184 (-365) and -00110 (-1938) in the Campbellt equation
respectively F-statistics for the null hypothesis that the predictor coefficients of EDFt and
Campbellt are zero indicate rejection beyond the 99 confidence level EDFt-1 and Campbellt-1
are both significantly positively associated with UC_PCAt and negatively associated with
CC_PCAt with coefficients (t-statistics) of 00389 (1361) and -02865 (-801) respectively
for UC_PCAt-1 and CC_PCAt-1 in the EDFt equation and 00388 (1416) and -04431 (-1295)
respectively in the Campbellt equation These results indicate that the evidence presented in
Tables 3 and 4 supporting H1a and H2a and H1b and H2b respectively and that the evidence
is robust to endogeneity between unconditional and conditional conservatism23
Insert Table 2 about here
For extremely distressed firms managerial incentives and governance mechanisms may 22 Some Spearman and Pearson correlations among the three component measures for conditional conservatism are within the range of +-005 However this does not mean that they have low convergent validity because they measure conditional conservatism from different perspectives rather than on the same dimensions and thus could be highly uncorrelated 23 In both models conditional conservatism CC_PCAt-1 exhibits a significant positive association with subsequent unconditional conservatism UC_PCAt with coefficients (T-statistics) 00021 (517) and 00019 (467) respectively in Panel A This result is consistent with expectation and suggests that bad news ldquoshocksrdquo associated with conditional conservatism generate demand for subsequent unconditional conservatism UC_PCAt-1 also exhibits a positive association with subsequent conditional conservatism CC_PCAt with coefficients (t-statistics) 00940 (212) and 00571 (129) respectively However when we take the first difference of UC_PCA to consider only the unconditional conservatism that occurred in a specific fiscal year the coefficient is significantly negative This result is consistent with prior notions that unconditional conservatism preempts conditional conservatism (Beaver and Ryan (2005) and Ryan (2006))
21
differ from those in healthier firms which may qualitatively change relations between
conservatism and bankruptcy risk for several reasons When shareholdersrsquo implicit call options
on assets are at or close to the money in deeply distressed firms equity values will increase in
asset volatility shareholdersrsquo risk-shifting incentives may dominate and firms may have less
incentive to use conservatism to mitigate bankruptcy risk Firmsrsquo control rights also may
progressively transfer to creditors who may demand higher levels of conservatism to prevent
risk shifting to creditors and wealth transferring to shareholders (Loktionov (2009)) Finally
the going concern assumption may no longer apply making accrual accounting and
unconditional conservatism less relevant To investigate whether the results for the full sample
still hold under these contexts we examine in Panel B of Table 5 a subsample of most
distressed firms defined by the lowest decile of returns-on-assets (largest (-ROA)) Consistent
with the results in Panel A both UC_PCAt-1 and CC_PCAt-1 remain significantly negatively
associated with subsequent bankruptcy risk except for UC_PCAt-1 with Campbellt EDFt-1 and
Campbellt-1 remain significantly and positively associated with UC_PCAt and CC_PCAt
except for EDFt-1 with CC_PCAt Thus the prior findings are qualitatively similar for deeply
distressed firms
Insert Table 3 about here
One may concern that our results are driven by cross-sectional relations between
unconditional conservatism conditional conservatism and bankruptcy risk and that our results
may be sensitive to lad structure To address these concerns we reexamine the lead-lag
relations between unconditional and conditional conservatism using a tri-variate VARX (3)
model described by equations (7) to (9) with results for the full sample presented in Table 3
Model 1 shows that UC_PCAt-1 UC_PCAt-2 and UC_PCAt-3 are all consistently negatively
associated with EDFt with the coefficient of UC_PCAt-1 statistically significant while Model 2
shows that UC_PCAt-1 are significantly negatively associated with EDFt and UC_PCAt-2 and
UC_PCAt-3 are positively associated with EDFt with the coefficient of UC_PCAt-2 statistically
significant The sum of the coefficients of UC_PCAt-1 UC_PCAt-2 and UC_PCAt-3 is all
negative and the F-test for the null hypothesis that the sum is zero derives significant F-
statistics 7210 and 1848 for EDFt and Campbellt equations respectively thus providing
strong support for H1a In both models CC_PCAt-1 CC_PCAt-2 and CC_PCAt-3 are all
significantly and negatively associated with EDFt and Campbellt and the F-test for the null
hypothesis that the sum of the coefficients of CC_PCAt-1 CC_PCAt-2 and CC_PCAt-3 are zero
for EDFt and Campbellt equations indicate rejection at least at the 99 confidence level thus
22
providing strong support for H1b
In Model 1 EDFt-1 EDFt-2 and EDFt-3 are significantly positively associated with
UC_PCAt and likewise in Model 2 Campbellt-1 Campbellt-2 and Campbellt-3 are consistently
positively associated with UC_PCAt but only the coefficient of Campbellt-1 is statistically
significant The F-tests for the null hypotheses that the sum of the coefficients of EDFt-1
EDFt-2 and EDFt-3 is zero and that the sum of the coefficients of Campbellt-1 Campbellt-2 and
Campbellt-3 is zero indicate rejection at least at the 99 confidence level thus providing strong
support for H2a that bankruptcy risk is positively associated with subsequent unconditional
conservatism Results for testing H2b are relatively weaker In Model 1 EDFt-1 are
significantly negatively associated with CC_PCAt while EDFt-2 and EDFt-3 are significantly
positively associated with CC_PCAt but the sum of their coefficient is still negative and the
same pattern applies to Campbellt-1 Campbellt-2 and Campbellt-3 in CC_PCAt equation in
Model 2 The F-test for the null hypothesis that the sum of the coefficients of EDFt-1 EDFt-2
and EDFt-3 is zero indicates a rejection at least at the 99 confidence level in Model 1 but the
F-test for the null hypothesis that the sum of the coefficients of Campbellt-1 Campbellt-2 and
Campbellt-3 is zero is insignificant thus providing partial support for H2b that bankruptcy risk
is negatively associated with subsequent unconditional conservatism
We further compare the Akaike Information Criterion (AIC) number for the
corresponding VARX (1) and VARX(3) models used in Tables 2 and 3 to examine the optimal
lag structure for VARX model AIC number is calculated as AIC = NLn((1 - R-sqr) N) +
2K where N is sample size K is number is independent variables and R-sqr is the proportion
of the sum of square accounted for by the model under consideration The last two lines in
Table 3 indicates that AIC numbers for VARX (1) models are unanimously smaller than those
for VARX (3) models Untabulated results also indicate that AIC numbers for VARX (1)
models are smaller than those for the corresponding VARX (2) models Since the models with
the lowest AIC number is best fitted we use VARX (1) model in the rest of the empirical tests
Moreover one may concern whether the results for each complement of UC_PCA and
CC_PCA are consistent with Tables 2 and 3 We further report the results for testing the lead-
lag relations between bankruptcy risk and unconditional conservatism and between bankruptc
risk and conditional conservatism by bi-variate VARX (1) models in Appendix A and B
respectively
23
43 Causal Relations between Unconditional and Conditional Conservatism and Actual Bankruptcy Examining a subsample of firms that actually declared bankruptcy encompasses the
upper limit of bankruptcy risk and eliminates estimation error in calculating bankruptcy risk
However actual bankruptcy as an indicator variable precludes examining continual relations
and the effects of bankruptcy on subsequent conservatism For these reasons we test only
hypotheses H1a and H2a using a logit model following Compbell et al (2008) and H1a and
H2a predict that γ lt 0
BANKt = α + γCONt-1 + Controlst + microt (10)
where BANK equals one if a firm files for bankruptcy under Chapters 7 or 11 of the
Bankruptcy Code and zero otherwise and CON refers to unconditional or conditional
conservatism measured by UC_PCA or CC_PCA or both24 Models 1 and 3 to 5 in Table 4
find that UC_PCAt-1 is significantly negatively associated with the probability that firms file for
bankruptcy a result that holds after controlling for earnings management and earnings
smoothing However CC_PCAt-1 is insignificantly associated with the probability of
bankruptcy in Models 2 to 5 These results strongly confirm hypothesis H1a but do not
support hypothesis H2a for firms actually filing for bankruptcy This is consistent with
reduced incentives for conditional conservatism as firms enter into actual bankruptcy perhaps
because bad news is already revealed and further bad news is unhelpful for reducing
information asymmetries and could even cause frictions among claimants
Insert Table 4 about here
The signs of the control variable coefficients are consistent with expectations NIMTAVG
Exretavg Inten_RD Cash and Rate are negatively associated with BANK and Leverage
STD_ret and MB are positively associated with BANK
44 The Cash Enhancing and Informational Roles of Accounting Conservatism and Causal Relations between Conservatism and Bankruptcy Risk This section examines how unconditional and conditional conservatism impact
bankruptcy risk through the cash enhancing role and informational role Table 5 replicates
Table 3 adding interactions between UC_PCA CC_PCA and Cash (Panel A) and between 24 Following Campbell et al (2008) we employ the following commonly used determinants of bankruptcy risk as controlling variables the market-based profitability (NIMTAVG) the predictability of excess return relative to SampP 500 index (EXRETAVG) RampD investment intensity (Inten_RD) firm size relative to that of the SampP 500 index (Rsize) the stock price (PRICE) and the risk-free rate (Rate) which are expected to reduce the probability of BANK the leverage ratio (Leverage) the liquidity ratio (Cash) changes in the liquidity ratio (ΔCash) return volatility (STD_Ret) and the market-to-book equity ratio (MB) all of which are expected to increase the probability of BANK Other controlling variables include year and industry dummies earnings management (Emgmt) and earnings smoothing (Esmooth)
24
UC_PCA CC_PCA and STD_Rett-1 (Panel B) to the EDF and Campbell equations Stock
volatility STD_Rett-1 is used to proxy for information uncertainty and information asymmetry
following Zhang (2006) and Khan and Watts (2009) Panel A reveals that the interactions of
both unconditional and conditional conservatism with cash (UC_PCAt-1Casht-1 and CC_PCAt-
1Casht-1 respectively) are significantly negatively associated with subsequent bankruptcy risk
proxied by EDFt in Model 1 with coefficients (t-statistics) of -03010 (-946) and -00276 (-
583) and with subsequent bankruptcy risk proxied by Campbellt in Model 2 with coefficients
(t-statistics) -03437 (-1085) and -00115 (-244) respectively F-statistics for the null
hypothesis that the sum of the coefficients of conservatism and of its interaction with cash is
zero are significant beyond the 99 confidence level for both unconditional and conditional
conservatism in both Models 1 and 2 Thus the evidence in Panel A suggests that both
unconditional and conditional conservatism mitigate bankruptcy risk via their cash enhancing
roles
Insert Table 5 about here
Panel B of Table 7 shows that the interactions of conservatism with stock return volatility
(UC_PCAt-1STD_Rett-1 and CC_PCAt-1 STD_Rett-1) are also significantly negatively
associated with subsequent bankruptcy risk as proxied by EDFt in Model 1 with coefficients
(t-statistics) of -00453 (-300) and -00201 (-1056) respectively Similarly the interaction of
unconditional conservatism with return volatility is also significantly negative for Campbellt in
Model 2 with a coefficient (t-statistic) of -01367 (-907) but the interaction of conditional
conservatism with return volatility is statistically insignificant F-statistics for the null
hypothesis that the sum of coefficients for conservatismrsquos interactions with return volatility is
zero is nonetheless significant beyond the 90 confidence level for both unconditional and
conditional conservatism in both Models 1 and 2 Overall the evidence in Panel B suggests
that both unconditional and conditional conservatism help mitigate bankruptcy risk via their
informational roles
45 Sarbanes-Oxley Auditor Turnover and Causal Relations between Bankruptcy Risk and Subsequent Unconditional and Conditional Conservatism
This section uses the contexts of the passage of the Sarbanes-Oxley Act in 2002 (SOX)
and auditor resignations as natural experiments to examine the effects of auditors regulators
and litigation on causal relations between bankruptcy risk and subsequent unconditional and
conditional conservatism Prior evidence suggests that SOX heightened legal and regulatory
attention to financial reporting and increased managerial litigation exposures and punishment
25
which leads to enhanced accounting conservatism (Lobo and Zhou (2006) Cefaratti et al
(2010)) 25 Auditor resignations are often triggered by aggressive reporting or
misrepresentations (Krishnan and Krishnan (1997) Menon and William (2008) Krishnan et al
(2010)) therefore it signals enhanced litigation risk of firms and auditors enhanced monitoring
by successor auditors regulators and investors and thus enhanced conservatism in the post-
auditor-resignation period
Our main argument for the relations between bankruptcy risk and subsequent
unconditional and conditional conservatism is that different from shareholdersrsquo litigation that
creates demand for both unconditional and conditional conservatism enhanced monitoring by
auditors and regulators mainly enhance unconditional conservatism which is their primary
focus (Qiang (2007)) If this argument is valid the interaction of bankruptcy risk and indicator
for the post-SOX period (SOX) and the interaction of bankruptcy risk and indicator for the
post-auditor-resignation period (Post_resign) should increase subsequent unconditional
conservatism We test this conjecture by replicating the analysis in Panel A Table 2 adding
these interactions
Results reported in Panel A of Table 6 reveal that the interactions of SOX with EDFt-1
and Campbellt-1 are both statistically positive for UC_PCAt suggesting that enhanced auditors
and regulatorsrsquo monitoring following the passage of SOX enhanced the effects of bankruptcy
risk on subsequent unconditional conservatism as predicted by H2a In contrast interactions of
SOX with EDFt-1 and Campbellt-1 are statistically insignificantly associated with CC_PCAt
suggesting that SOX influenced little the effects of bankruptcy risk on subsequent conditional
conservatism predicted by H2b In addition the interaction of SOX with UC_PCAt-1 is
statistically significant for EDFt but is statistically insignificant for Campbellt and the opposite
is true for the interaction of SOX with CC_PCAt-1 suggesting that SOX enhanced albeit
modestly the mitigating effects of both unconditional and conditional conservatism on
subsequent bankruptcy risk
Insert Table 6 about here
We use a subsample of 124 firms with auditor resignations between 2000 and 2007 to
examine the effects of auditors on relations between accounting conservatism and bankruptcy
25Lobo and Zhou (2006) find that both unconditional conservatism (measured by total accruals) and conditional conservatism (Basu (1997) measure) increased in the post-SOX period Similarly Cefaratti et al (2010) report that the passage of SOX enhanced litigation risk and thereby increased conservatism Our study finds only the pattern of unconditional conservatism confirms Lobo and Zhou (2006) and Cefaratti et al (2010) In particular for the six years centered around SOX passage unconditional conservatism (UC_PCA) increases from 03443 in the pre-SOX period (2000-2002) to 03805 in the post-SOX period (2003-2005) with a t-statistic of 877 Conditional conservatism (CC_PCA) increases from 08055 in the pre-SOX period to 08582 in the post-SOX period with a t-statistic of 160
26
risk26 Panel B of Table 8 reveals that the interactions of Post_resign with EDFt-1 and with
Campbellt-1 are significant for UC_PCAt but insignificant for CC_PCAt in both Models 1 and 2
In addition the interactions of Post_resign with UC_PCAt-1 and with CC_PCAt-1 are
statistically insignificant for EDFt and Campbellt in both Models 1 and 2 We also perform the
t-test of the difference in mean for UC_PCA and CC_PCA for three years post- versus pre-
resignation periods The average UC_PCA (CC_PCA) in the pre-resignation period is 03710
(12295) then it increases (decreases) to 04200 (11639) in the post-resignation period with t-
statistic (292) significant for UC_PCA and insignificant for CC_PCA Overall Table 6
provides consistent evidence for the argument that enhanced monitoring by auditors and
regulators mainly enhance unconditional conservatism rather than enhance conditional
conservatism as bankruptcy risk increases using the nature experiments of SOX passage and
auditor resignations This evidence provides further support for hypotheses H2a and H2b
46 Conservatism Gaming and Causal Relations between Conservatism and Bankruptcy Risk One main concern that ldquoconservatism gamingrdquo a version of earnings smoothing whereby
managers apply more conservatism during good times to provide earnings cushions during
downturns may drive the relations between conservatism and bankruptcy risk because
conservatism gaming is expected to mitigate bankruptcy risk Smith and Stulz (1985)rsquos model
argue that earnings smoothing may serve as a hedge against bankruptcy risk and Trueman and
Titman (1988)rsquos model concur that earnings smoothing may lower claimholdersrsquo perceptions
of bankruptcy risk by lowering perceptions of earnings volatility To address this concern we
examine whether the causal relations between unconditional and conditional conservatism and
bankruptcy risk are robust to conservatism gaming employing a tetra-variate VARX (1) model
consisting of equations (11) to (14)
BRt = α10 + β11BRt-1 + γ11UC_PCAt-1 + δ11CC_PCAt-1 + θ11Esmootht-1 + Controlst + ε11 (11)
UC_PCAt = α20 + β21BRt-1 + γ21UC_PCAt-1 + δ21CC_PCAt-1 + θ21Esmootht-1 + Controlst + ε21 (12)
CC_PCAt = α30 + β31BRt-1 + γ31UC_PCAt-1 + δ31CC_PCAt-1 + θ31Esmootht-1 + Controlst + ε31 (13)
Esmootht = α40 + β41BRt-1 + γ41UC_PCAt-1 + δ41CC_PCAt-1 + θ41Esmootht-1 + Controlst + ε41 (14)
where BR is EDF or Campbell and Controlst in equations (11) to (13) and their predictions are
the same as for equations (4) to (6)27 We consider two types of income smoothing to proxy for
conservatism gaming innate smoothing the product of negative one times the Spearman 26 Auditor resignation data were collected from AuditAnalytics in the WRDS database Among the 124 firms with auditor resignations in our sample 6 occurred in fiscal year 2000 4 in 2001 6 in 2002 18 in 2003 33 in 2004 22 in 2005 23 in 2006 and 12 in 2007 27 Controlst in equation (14) include Leveraget ROAt Ln(MV)t Volatility_ROAt and industry and year dummies which are previously identified determinants of earnings smoothing
27
correlation between accruals and OCF and discretionary smoothing the decile ranking of the
product of negative one times the ratio of the standard deviation of accruals to that of OCF
Insert Table 7 about here
Table 7 report the testing results and reveals that the causal relations between the two
types of conservatism and bankruptcy risk observed above are robust to conservatism gaming
Qualitatively similar results hold for discretionary smoothing (results not tabulated) Table 7
further reveals that innate smoothing Esmootht-1 is significantly negatively associated with
Campbellt consistent with theoretical predictions (Smith and Stulz (1985) and Trueman and
Titman (1988)) and prior findings that innate smoothing reveals information and increases firm
value (Tucker and Zarowin (2006) Leuz et al (2003))28
49 Robustness Checks
Sensitivity Tests for Validity of the VARX Models VARX models may be sensitive to order So we reorder the predictors in each equation
of the VARX models derives qualitatively similar findings A first-differencing specification
for the VARX model finds the results weaker but qualitatively unchanged with autoregressive
coefficients for the two main conservatism measures significantly negative consistent with the
inference from our Dickey-Fuller unit-root tests that taking first-differences may yield biased
results in the VARX models where there is no unit-root Concerns that mean-reversions of
accruals or EDFt and Campbellt could explain certain findings is made unlikely by our design
that utilizes conservatism measures that are three-year smoothing for UC_ACC and CC_ACM
that considerably smooth away mean-reversions and other conservatism measures that are
relatively insensitive to accrual reversals (UC_BM UNC_RES CC_AR and CC_CR)
Moreover in all EDFt and Campbellt regressions the coefficients on EDFt-1 and on Campbellt-1
are significantly positive indicating there are no mean-reverting tendencies in the bankruptcy
risk measures
Alternative Tests for Cash Enhancing and Informational Roles of Conservatism Concerns that firms with weak (strong) cash flow prefers aggressive (conservative)
reporting so it is higher cash holdings that cause higher conservatism and then lower
bankruptcy risk To address this issue we orthogonalize both UC_PCA and CC_PCA by the
lagged value of cash and use the residual value of UC_PCA and CC_PCA to replace their
28 In contrast discretionary smoothing has a weak mitigating effect on bankruptcy risk whereas bankruptcy risk is negatively associated subsequent discretionary smoothing consistent with the argument that discretionary smoothing reduces information transparency (untabulated results available on request)
28
original value and rerun the VARX (1) models for Panel A Table 5 After netting the
endogeneity of both unconditional and conditional conservatism to cash holdings in this way
the results are qualitatively the same as previously reported We also use the upside potentials
of cash holdings to proxy for cash the results do not qualitatively change either Using
earnings forecast errors or earnings forecast dispersions to proxy for information uncertainty
and asymmetry following Zhang (2006) does not change the results FOR Panel B Table 5
We also use the information asymmetry component of PIN score adjPIN (Duarte and Young
(2009)) to measure information uncertainty and asymmetry with the results are qualitatively
unchanged too
Controls for Debt Contracting Debtholdersrsquo and Shareholdersrsquo Interests Whereas results in Panel B of Table 3 suggest that relations between conservatism and
bankruptcy risk still hold for bankrupt firms there remains the question of whether the
observed relations are robust to controls for debt contracting debtholdersrsquo and shareholdersrsquo
interests To address this question we replicate the tests in Panel A of Table 3 introducing
additional controls for private debtholder monitoring leverage auditor going-concern opinions
and credit ratings Private debtholder monitoring is measured as the ratio of the sum of private
long-term debt other long-term debt and capitalized lease obligations to total long-term debt
following Qiang (2007) and leverage is an noisy indicator of higher debt costs larger
debtholder claims more intense monitoring and accentuated conflicts of interests between
shareholders and debtholders A dummy for periods following auditorsrsquo going-concern
opinions proxies for enhanced debtholders control relative to shareholders Untabulated results
reveal that these further controls do not qualitatively change the previously reported causal
associations between conservatism and bankruptcy risk
Senior long-term debt ratings by SampP proxy for the cost of debt and monitoring by rating
agencies on a scale of 1 to 21 with 1 for a ldquoAAArdquo rating and ldquo21rdquo for ldquoDrdquo rating 29
Untabulated results show that the main results previously reported remain qualitatively
unchanged after controlling for credit ratings Its interactions with EDFt-1 and Campbellt-1 are
significantly positive for both UC_PCAt and CC_PCAt and its interactions with EDFt-1 and
Campbellt-1 are negative for CC_PCAt Moreover credit ratings per se are significantly
negatively associated with EDFt and Campbellt and positively associated with UC_PCAt and
CC_PCAt These findings are consistent with both the monitoring role of credit ratings and
with credit ratings inadequately capturing default risk as illustrated by the bankruptcies of 29 SampP rates a firms debt from AAA (indicating a strong capacity to pay interest and repay to SD (the obligor has selectively defaulted on a specific issue or class of obligations) Compustat codes these ratings on a scale from 2 to 29 such that AAA (the best SampP rating) corresponds with 2 and SD (the worst rating) with 29
29
highly-rated firms during the 2008-2009 financial crisis Alternatively we added a dummy to
proxy for the lowest-rated firms (SD and D) and highest-rated firms (AAA) which are subject
to the most intense public monitoring with qualitatively similar findings
Controls for Earnings Management
To examine whether our results are robust to earnings management we rerun the tetra-
variate VARX (1) model consisting of equations (11) to (14) by replacing Esmooth with
Emgmt Untabulated results show that the conclusions about the causal relations between
bankruptcy risk and unconditional and conditional conservatism still hold Importantly both
UC_PCAt-1 and CC_PCAt-1 are negatively associated with subsequent Emgmtt corroborating
Wattsrsquo (2003) and Kothari et alrsquos (2010) reasoning that absent conservatism financial
reporting would be biased upward a priori in practice
Alternative Measure of Unconditional and Conditional Conservatism and Bankruptcy Risk
One may concern that our unconditional conservatism measurement UC_ACC and
UC_RES do not isolate discretionary unconditional conservatism To address that concern we
alternatively use Qiang (2007)rsquos discretionary accrual-based measure to replace UC_ACC and
use the first difference of UC_RES to capture firm-specific discretionary hidden reserve Doing
so does not qualitatively change the previous results in Table 2 As an alternative to the
industry adjusted BM ratio UC_BM we also use Qiang (2007) approach that builds upon
Beaver amp Ryan (2005) to measure unconditional conservatism and the results are qualitatively
the same as using UC_BM We do not use Qiang (2007)rsquos measurement in the main tests
because it is firm-specific and invariant over time which is in appropriate for a time-series
model like VARX
One may concern that CC_AR is subject to potential mechanical relationship with
Campbell since both are functions of leverage size and book-to-market ratio We use the
negative skewness measure in Zhang (2008) to replaces CC_AR the results for Panel A of
Table 2 are qualitatively unchanged suggesting that the mechanical relation problem is not
serious However the skewness measure requires at least previous five yearsrsquo data and thus is
not used in the main tests because doing so could expose our sample to severe survival bias
Using an A_score defined as the ratio of the C score to the sum of C score and G score as in
Khan and Watts (2009) and CC_CR calculated using the direct method following Callen et al
(2009) results does not qualitatively change either We also use the averages (and rankings) of
UC_ACC UC_BM and UNCON_RES to measure unconditional conservatism and those of
30
CC_ACM CC_AR and CC_CR to measure conditional conservatism with qualitatively similar
(more statistically significant) findings (suggesting that ranking increases power by reducing
measurement error)
When the Z-score (Altman (1968)) is used as an alternative bankruptcy risk metric main
results in Tables 2 and 3 are qualitatively unchanged Z-score is accounting-based measure
subject to estimation bias caused by accounting conservatism and it has more missing values
therefore it is not used in the main tests In calculating Campbell we follow Campbell et al
(2009) to winterize stock price lower than $15 up to $15 to avoid estimation bias caused by
small stocks When we drop this limitation the main results do not change for an alternative
Campbell thus calculated
5 Conclusion This study examines relations between accounting conservatism and bankruptcy risk that
follow from conservatismrsquos cash enhancing and informational properties Our primary
findings are a negative association between both unconditional and conditional conservatism
and subsequent bankruptcy risk consistent with conservatismrsquos cash enhancing and
informational roles a positive (negative) association between bankruptcy risk and subsequent
unconditional conservatism consistent with the interests of auditors investors and regulators to
mitigate future failure risk and a negative association between bankruptcy risk and subsequent
and concurrent conditional conservatism consistent with countervailing managerial incentives
to withhold bad news for career motives Further analyses provide confirming evidence that
the cash enhancing and informational roles of conservatism help mitigate bankruptcy and that
regulatorsrsquo and auditorsrsquo monitoring enhance demand for unconditional conservatism as
bankruptcy risk increases The findings are qualitatively unchanged under conditions of
extreme distress and actual bankruptcy and are robust to controls for endogeneity between
unconditional and conditional conservatism debt contracting considerations conservatism
gaming and other controls
These findings have several key implications First they provide evidence consistent
with a traditional rationale for accounting conservatism that it arose in response to requests
from creditors joined in recent times by shareholders auditors and regulators to help conserve
cash and enhance transparency thereby reducing failure risk Second our evidence that
accounting conservatism mitigates bankruptcy risk is consistent with the findings that
conservatism reduces cost of capital and increases trading contracting efficiency (Zhang (2008)
Hui et al (2009b)) but makes contributions by showing that the evidence follows from the cash
31
enhancing and informational roles of conservatism Third this evidence is not only central to
the interests of firmsrsquo stakeholders but also to economic policy makers by helping to dampen
the contagion effects of bankruptcy In this sense this study complements the evidence of
Francis et al (2010) that conservatism benefited shareholders during the 2008-2009 financial
crisis and of Kim and Zhang (2010) that conservatism helps mitigate stock market crash risk
suggesting that conservatism is relevant to economic policy-making
Fourth findings that bankruptcy risk is related differently with subsequent unconditional
and conditional conservatism are consistent with offsetting managerial auditorsrsquo and
regulatorsrsquo interests Lastly our evidence helps inform ongoing debates regarding the role of
conservatism as an enduring core concept of financial accounting
Since this study is the first to examine empirically causal relations as well as
contemporaneous relations between unconditional and conditional conservatism and
bankruptcy risk there is considerable potential for related research For example this study
leaves largely unexplored specific linkages between conservatism and bankruptcy risk that
explain precisely how its cash enhancing and informational properties relate to bankruptcy risk
how bankruptcy risk influences decisions regarding unconditional and conditional
conservatism how these relations are affected by differing economic conditions and whether
they hold in other countries with different institutional arrangements for example in
developing economies and settings with differing bankruptcy provisions or regulations
32
References Ahmed A S Billings B K Morton R M and Stanford-Harris M 2002 The Role of Accounting Conservatism in Mitigating Bondholder-Shareholder Conflicts over Dividend Policy and in Reducing Debt Costs The Accounting Review 77 867ndash890 Ahmed A S and Duellman S 2007 Accounting Conservatism and Board of Director Characteristics An Empirical Analysis Journal of Accounting and Economics 43 411-437 Altman E 1968 Financial Ratios Discriminant Analysis and the Prediction of Corporate Bankruptcy Journal of Finance 23 589ndash609 Anderson R and Sundaresan S 1996 Design and Valuation of Debt Contracts Review of Financial Studies 9 37ndash68 Ball R 2001 Infrastructure Requirements for an Economically Efficient System of Public Financial Reporting and Disclosure Brookings-Wharton Papers on Financial Services 127-270 Ball R Kothari S P and Nikolaev V 2009 Econometrics of the Basu Asymmetric Timeliness Coefficient and the Accounting Conservatism Working paper University of Chicago Ball R and Shivakumar L 2005 Earnings Quality in UK Private Firms Comparative Loss Recognition Timeliness Journal of Accounting and Economics 39 83-125 Barath S T and Shumway T 2008 Forecasting Default with the Merton Distance-to-Default Model Review of Financial Studies 21 1339-1369 Barth M E Landsman W R and Lang M H 2008 International Accounting Standards and Accounting Quality Journal of Accounting Research 46 467-498 Basel III 2010 Basel Committee on Banking Supervision Basu S 1997 The Conservatism Principle and the Asymmetric Timeliness of Earnings Journal of Accounting and Economics 24 3-37 Basu S 2009 Conservatism Research Historical Development and Future Prospects Chinese Journal of Accounting Research 2 1-20 Beaver W H and Ryan S G 2000 Biases and Lags in Book Value and Their Effects on the Ability of the Book-To-Market Ratio to Predict Book Return on Equity Journal of Accounting Research 38 127ndash148 Beaver W H and Ryan S G 2005 Unconditional and conditional Conservatism Concepts and Modeling Review of Accounting Studies 10 269-309 Beneish M and Press E 1993 Costs of Technical Violation of Accounting-Based Debt Covenants The Accounting Review 68 233-257 Biddle G C 1980 Accounting Methods and Management Decisions The Case of Inventory Costing and Inventory Policy Journal of Accounting Research 18 235-280 Biddle G C Ma M and Song M 2011 The Risk Management Role of Accounting Conservatism Working paper University of Hong Kong Black F and Scholes M 1973 The Pricing of Options and Corporate Liabilities Journal of Political Economy 81 637ndash654 Bublitz B and Ettredge M 1989 The Information in Discretionary Outlays Advertising Research and Development The Accounting Review 64 108-124 Bushman R M Piotroski J D and Smith A 2010 Capital Allocation and Timely Accounting Recognition of Economic Losses Working Paper The University of North Carolina at Chapel Hill Callen J L Livnat J and Segal D 2006 Information Content of SEC Filings and Information Environment A Variance Decomposition Analysis The Accounting Review 81 1017-1043
33
Callen J L Segal D and Hope O-K 2010a The Pricing of Conservative Accounting and the Measurement of Conservatism at the Firm-Year Level Review of Accounting Studies 15 145-178 Callen J L Chen F Dou Y and Xin B 2010b Information Asymmetry and the Debt Contracting Demand for Accounting Conservatism Working paper University of Toronto Campbell J Hilscher J and Szilagyi J 2008 In Search of Distress Risk Journal of Finance 53 2899-2939 Carapeto M 2005 Bankruptcy Bargaining with Outside Options and Strategic Delay Journal of Corporate Finance 11 736ndash746 Cefaratti M Dorminey J Lin H and Reed T 2010 The Effect of Litigation Risk on Conservatism A Comparative Study of PSLRA and SOX Working paper Northern Illinois University Chen K and Wei K C 1993 Creditorrsquos Decision to Waive the Violations of Accounting-Based Debt Covenants The Accounting Review 68 218-232 Chen N 2003 Three Essays on Information Asymmetry and Corporate Defaults Columbia University DeFond M and Jiambalvo J 1994 Debt Covenant Violation and Manipulation of Accruals Journal of Accounting and Economics 17 145-176 Demirkan S and Platt H D 2009 Financial Status Corporate Governance Quality and the Likelihood of Managers Using Discretionary Accruals Accounting Research Journal 22 93-117 De Ste Croix G E M 1956 Greek and Roman Accounting pp 14-74 In Littleton A C and Yamey B S ed Studies in the History of Accounting Richard D Irwin Homewood IL Dichev I and Skinner D 2002 Large-Sample Evidence on the Debt Covenant Hypothesis Journal of Accounting Research 40 1091-1123 Doan T 1992 Rats Users Manual Version 40 Estima Duarte J and Young L 2009 Why is PIN priced Journal of Financial Economics 91 119-138 Eberhart A Maxwell W and Siddique A 2008 A Reexamination of the Tradeoff between the Future Benefit and Riskiness of RampD Increases Journal of Accounting Research 46 27-52 Elliott J A and Phibrick D R 1990 Accounting Changes and Earnings Predictability The Accounting Review 65 157-174 Fama E F and French K R 1997 Industry Costs of Equity Journal of Financial Economics 43 153-192 Financial Accounting Standards Board 1980 Statement of Financial Accounting Concepts No 2 Qualitative Characteristics of Accounting Information Financial Accounting Standards Board 2008 Conceptual Framework for Financial Reporting The Objective of Financial Reporting and Qualitative Characteristics and Constraints of Decision-Useful Financial Reporting Information Exposure Draft Financial Accounting Series No 1570-100 Financial Accounting Standards Board 2010 Statement of Financial Accounting Concepts No 8 Conceptual Framework for Financial Reporting Fischer P and Verrecchia R 2000 Reporting Bias The Accounting Review 75 229-245 Francis B Hasan I and Wu Q 2010 The Benefits of Accounting Conservatism to Shareholders Evidence from the Financial Crisis Working paper Rochester Institute of Technology Francis J and Martin X 2010 Acquisition Profitability and Timely Loss Recognition Journal of Accounting and Economics 49 161-178 Franzen L Rodgers K and Simin T 2007 Measuring Distress Risk The Effect of RampD Intensity Journal of Finance 62 2931-2967
34
Giammarino Ronald M 1989 The Resolution of Financial Distress Review of Financial Studies 2 25ndash47 Givoly D and Hayn C 2000 The Changing Time-Series Properties Of Earnings Cash Flows and Accruals Has Financial Reporting Become More Conservative Journal of Accounting and Economics 29 287ndash320 Givoly D Hayn C and Natarajan A 2007 Measuring Reporting Conservatism The Accounting Review 82 65-106 Gox R and Wagenhofer R 2009 Optimal Impairment Rules Journal of Accounting and Economics 48 2ndash16 Granger C W J 1969 Investigating Causal Relations by Econometric Models and Cross-spectral Methods Econometrica 37 424ndash438 Guay W and Verrecchia R E 2007 Conservative Disclosure Working paper University of Pennsylvania Hagerman R and Zmijewski M E 1979 Some Economic Determinants of Accounting Policy Choice Journal of Accounting and Economics 1 141-61 Hertzel M G Officer M S Li Z and Rodgers K J 2008 Inter-Firm Linkages and the Wealth Effects of Financial Distress Along the Supply Chain Journal of Financial Economics 87 374-387 Hillegeist Keating E K Cram D P and Lundstedt K G 2004 Assessing the Probability of Bankruptcy Review of Accounting Studies 9 5-34 Hui K W Morse D and Matsunaga S 2009a The Impact of Conservatism on Management Quantitative Earnings Forecasts Journal of Accounting and Economics 47 192-207 Hui K W Klasa S and Yeung E 2009b Corporate Suppliers and Customers and Accounting Conservatism Working paper Hong Kong University of Science and Technology Jackson S and Liu X T 2009 The Allowance for Uncollectible Accounts Conservatism and Earnings Management Journal of Accounting Research forthcoming Jones J 1991 Earnings Management during Import Relief Investigation Journal of Accounting Research 29 193-228 Jones S 2011 Does the Capitalization of Intangible Assets Increase the Predictability of Corporate Failure Jorion P and Zhang G 2009 Credit Contagion from Counterparty Risk Journal of Finance 64 2053-2087 Keating S and Zimmerman J L 2000 Depreciation-policy Changes Tax Earnings Management and Investment Opportunity Incentives Journal of Accounting and Economics 28 359-389 Khan M and Watts R 2009 Estimation and Empirical Properties of a Firm-Year Measure of Conservatism Journal of Accounting and Economics 48 132-150 Kim J Ramaswamy K and Sundaresan S 1993 Does Default Risk in Coupons Affect the Valuation of Corporate Bonds A Contingent Claims Model Financial Management 117ndash131 Kim J and Zhang L 2010 Does Accounting Conservatism Reduce Stock Price Crash Risk Firm-Level Evidence Working paper City University of Hong Kong Kirschenheiter M and Ramakrishnan R 2010 Prudence Demands Conservatism Working paper University of Illinois at Chicago Kothari S P Shu S and Wysocki P 2009 Do Managers Withhold Bad News Journal of Accounting Research 47 241-276 Kothari S P Ramanna K and Skinner D J 2010 Implications for GAAP from an Analysis of Positive Research in Accounting Journal of Accounting and Economics 50 246-248
35
Krishnan J and Krishnan J 1997 Litigation Risk and Auditor Resignations The Accounting Review 72 539-60 Krishnan G Sun L and Wang Q 2010 Accruals Quality Audit Fees and Auditor Resignations Working paper Lehigh University LaFond R and Watts R 2008 The Information Role of Conservatism The Accounting Review 83 447ndash478 Lang L and Stulz R 1992 Contagion and Competitive Intra-industry Effects of Bankruptcy Announcements Journal of Financial Economics 32 45ndash60 Lara J M G Osma B G and Penalva F 2009 Accounting Conservatism and Corporate Governance Review of Accounting Studies 14 161-201 Lara J M G Osma B G and Penalva F 2010a Conditional Conservatism and Cost of Capital Review of Accounting Studies forthcoming Lara J M G Osma B G and Penalva F 2010b Conditional Conservatism and Firm Investment Efficiency Working paper Universidad Carlos III De Madrid Leuz C Nanda D and Wysocki P 2003 Earnings Management and Investor Protection An International Comparison Journal of Financial Economics 69 505-527 Lev B Sarath B and Sougiannis T 2005 RampD Reporting Biases and Their Consequences Contemporary Accounting Research 22 977-1026 Li J 2008 Accounting Conservatism Information Uncertainty and Analystsrsquo Forecasts Working paper Carnegie Mellon University Li X 2010 Accounting Conservatism and the Cost of Capital International Analysis Working paper London Business School Lobo G J and Zhou J 2006 Did Conservatism in Financial Reporting Increase After the Sarbanes-Oxley Act Initial Evidence Accounting Horizons 20 57-73 Loktionov Y 2009 Does Accounting Quality Mitigate Risk Shifting Working paper Massachusetts Institute of Technology Louis H Sun A and Urcan O 2009 Value of Cash Holdings and Accounting Conservatism Working paper Pennsylvania State University Menon K and Williams D 2008 Management Turnover Following Auditor Resignations Contemporary Accounting Research 25 567ndash604 Merton R C 1974 On The Pricing of Corporate Debt The Risk Structure of Interest Rates Journal of Finance 29 449ndash470 Mooradian R M 1994 The Effect of Bankruptcy Protection on Investment Chapter 11 as a Screening Device Journal of Finance 49 1403ndash1430 Nini G Smith D and Su A 2009 Creditor Control Rights and Firm Investment Policy Journal of Financial Economics 92 400-420 Ohlson J A 1980 Financial Ratios and the Probabilistic Prediction of Bankruptcy Journal of Accounting Research 18 109-131 Parker S Peters G and Turetsky H 2002 Corporate Governance and Corporate Failure A Survival Analysis Corporate Governance 2 4-12 Penman S H and Zhang X 2002 Accounting Conservatism the Quality of Earnings and Stock Returns The Accounting Review 77 237-264 Qiang X 2007 The Effects of Contracting Litigation Regulation and Tax Costs on Unconditional and Conditional Conservatism Cross-Sectional Evidence at the Firm Level The Accounting Review 82 759-796 Qiang X 2008 The Information Role of Unconditional and Conditional Conservatism Working paper Xiamen University Rosner R L 2003 Earnings Manipulation in Failing Firms Contemporary Accounting Research 20 361-408
36
Roychowdhury S and Watts R L 2007 Asymmetric Timeliness of Earnings Market-To-Book and Conservatism in Financial Reporting Journal of Accounting and Economics 44 2-31 Ryan S G 2006 Identifying Conditional Conservatism European Accounting Review 15 511 -525 Shumway T 2001 Forecasting Bankruptcy More Accurately A Simple Hazard Model Journal of Business 74 101-124 Sims C A 1980 Macroeconomics and Reality Econometrica 48 1-49 Smith C W and Stulz R M 1985 The Determinants of Firmsrsquo Hedging Policies Journal of Financial and Quantitative Analysis 20 391-405 Srivastava A and Tse S 2010 The Contribution of Delayed Gain Recognition to Trends in Conservatism A Re-Examination Using a New Approach to Measuring Accounting Conservatism Working paper Northwestern University Sweeney A 1994 Debt-Covenant Violations and Managersrsquo Accounting Responses Journal of Accounting and Economics 17 281-308 Trueman B and Titman S 1988 An Explanation for Accounting Income Smoothing Journal of Accounting Research 26 127-139 Tucker J W and Zarowin P A 2006 Does Income Smoothing Improve Earnings Informativeness The Accounting Review 81 251-270 Uhrig-Homburg M 2005 Cash-flow Shortage as an Endogenous Bankruptcy Reason Journal of Banking and Finance 29 1509ndash1534 Vassalou M and Xing H 2004 Default Risk in Equity Returns Journal of Finance 59 831ndash868 Vuolteenaho T 2002 What Drives Firm-Level Stock Returns Journal of Finance 57 233ndash264 Watts R 2003 Conservatism in Accounting Part I Explanations and Implications Accounting Horizons 17 207ndash221 Wittenberg-Moerman R 2008 The Role of Information Asymmetry and Financial Reporting Quality in Debt Trading Evidence from the Secondary Loan Market Journal of Accounting and Economics 46 240-260 Zmijewski M E 1984 Methodological Issues Related to the Estimation of Financial Distress Prediction Models Journal of Accounting Research 22 59-82 Zhang J 2008 The Contracting Benefits of Accounting Conservatism to Lenders and Borrowers Journal of Accounting and Economics 45 27ndash54 Zhang F 2006 Information Uncertainty and Stock Returns Journal of Finance 61 105-137
37
Table 1 Descriptive Statistics for Main Variables
This table reports the descriptive statistics for the full sample of firm-year observations from 1989 through 2007 Panel A presents the summary statistics and Panel B presents pairwise correlations among bankruptcy risk and accounting conservatism measures The upper (lower) triangle of Panel B displays Pearson product-moment (Spearman) correlations with highlighted figures indicating statistical significance at the 90 confidence level Variable definitions are provided below
Panel A Summary Statistics for the Full Sample Variable Mean Q1 Median Q3 EDF (unranked ) 36502 00000 00000 00558
Campbell (unranked ) 00127 00014 00028 00064
BANK 00059 00000 00000 00000
UC_PCA 03659 01897 03639 05319
UC_ACC -00012 -00218 00010 00209
UC_BM (unranked) -19489 -22175 -13437 -08280
UC_RES 00729 00000 00190 00910
CC_PCA 09188 04394 09534 15941
CC_ACM 00189 00004 00156 00355
CC_AR 21255 12598 19177 28431
CC_CR -03102 -04259 -01237 01165
Leverage 58566 43320 58492 73159
ln(MV) 02540 01290 02478 03622
ROA 00336 00141 00420 00728
STD_Ret 04833 02939 04226 06119
Cash 00868 00131 00417 01156
ΔCash 00061 -00103 00015 00217
Rate 00418 00287 00460 00516
Inten_RD 01261 00054 00219 00612
Monitor 08448 10000 08924 10000
Rating 90508 90000 70000 120000
Esmooth (unranked) 06048 04000 07000 09000
Emgmt -02631 -04550 -02735 -00771
Volatility_ROA 00054 00002 00006 00023
Turn 11700 06405 10352 14803
Eissue 00530 00000 00000 00050
Dissue 02137 -00457 00566 02225
Growth 02649 00051 00858 01955
Nimtaavg 00305 00101 00311 00476
Exretavg -00031 -00244 00002 00226
Rsize -100948 -115031 -100096 -86159
Mb 09042 04510 07442 12077
Price 23341 21401 27081 27081
38
Table 1 Descriptive Statistics for Main Variables (Contrsquod)
Panel B Correlation Matrix for the Full Sample
Variable 1 2 3 4 5 6 7 8 9 10 11
1 EDF 1 07789 00265 -01948 -00333 -02300 -00138 02404 -00023 04880 00671
2 Campbell 07789 1 00348 -00590 00334 -02136 -00025 02468 -00081 04764 00788
3 BANK 00265 00348 1 -00287 -00222 -00256 -00096 00117 -00103 00407 -00035
4 UC_PCA -02168 -02170 -00298 1 01820 09025 04861 -00637 01237 -02020 00104
5 UC_ACC -00274 00397 -00158 01611 1 00517 00489 00029 04819 -00728 00284
6 UC_BM -02303 -02139 -00256 09349 00574 1 00808 -00964 00516 -02485 -00061
7 UC_RES -00474 -01398 -00078 03023 -00390 00411 1 00468 00551 00514 00301
8 CC_PCA 04111 04095 00317 -01441 -00243 -01704 -00028 1 -00062 07160 06850
9 CC_ACM -00204 -00454 -00089 01057 04483 00485 00391 00262 1 -00425 00375
10 CC_AR 04655 04335 00407 -02084 -00901 -02359 -00060 04056 -00591 1 00426
11 CC_CR 01922 02145 00080 -00299 00336 -00426 -00043 09305 00245 01167 1 EDF is the ranking of the expected one-year-ahead default probability from Merton (1974) model Campbell is the ranking of the one-month-ahead probability of business failure calculated based on the formula in the last column of Table III in Campbell et al (2008) BANK proxies for bankruptcy risk and it is a dummy variable equal to one if the firm files for bankruptcy under Chapter 11 or Chapter 7 of the US Bankruptcy code and equal to zero otherwise UC_PCA is the factor score generated from a principal component analysis of the three unconditional conservatism measurements UC_ACC UC_BM and UC_RES Their eigenvalues are 09539 11433 and 09028 their eigenvectors are 05380 06342 and 06721 and their final communality estimates are 02894 04022 and 04517 respectively UC_ACC is equal to minus one times the ratio of total accruals to average total assets calculated over a rolling window of the current year and prior two years UC_BM is the industry-adjusted ranking of minus one times the ratio of book to market value of common shareholders equity at fiscal year-end UC_RES is the ratio of LIFO reserves plus hidden RampD and advertising reserves resulting from the application of unconditional conservatism to total assets estimated as follows UC_RESit = (INVit
res + RDitres + ADVit
res) ATit CC_PCA is the factor score generated from a principal component analysis of the three conditional conservatism measurements CC_ACM CC_AR and CC_CR Their eigenvalues are 10461 10324 and 09214 their eigenvectors are 03176 05468 08040 and their final communality estimates are 01008 02990 and 06464 respectively CC_ACM is minus one times the ratio of accumulated non-operating accruals to accumulated total assets calculated over a rolling window of current year and prior two years CC_AR is the ratio of C score plus G score to G score as defined in Khan and Watts (2009) This study directly uses the formula in Table 3 of Khan and Watts (2009) to calculate the CC_AR CC_CR is the ratio of unexpected current earnings (or current earnings shocks) to total earnings news with the ratio times minus one if earnings news is positive Ln(MV) is the natural logarithm of market capitalization at the end of the fiscal year Leverage is measured as the ratio of book value of long-term debt (Compustat DLTT) and short-term debt (Compustat DLC) to total assets (Compustat AT) ROA is calculated as the ratio of earnings (Compustat NI) over total assets (Compustat AT) STD_Ret is the annualized standard deviation of daily stock return over the prior twelve months Cash is the ratio of cash holdings (Compustat CHE) to total assets (Compustat AT) ΔCash is the ratio of cash flow (Compustat CHECH) to total assets (Compustat AT) Rate is the risk-free rate measured by the annualized three-month T-bill rate retrieved from Federal Reserve Bank Reports Inten_RD is the ratio of RampD expenses (Compustat XRD) to total assets (Compustat AT) SOX is an indicator for the period after the passage of the SOX Act equal to 1 for fiscal years 2003 and after and 0 otherwise Aud_Resign is an indicator for an auditorrsquos resignation from a client firm equal to 1 for the three-year period after auditor resignation and 0 otherwise Emgmt is the factor score generated from a principal component analysis of four earnings management metrics the ranking of absolute value of discretionary accrual DA abnormal operational cash flow R_OCF abnormal discretionary expenses R_DISX and abnormal product cost R_PROD Their eigenvalues are 12992 11747 08823 and 06438 their eigenvectors are 02138 -07195 08136 and -02691 and their final communality estimates are 00473 05177 06619 and 00724 respectively Esmooth proxies for conservatism gaming and is measured as negative one times the Spearman correlation of OCF and accruals with both deflated by average total assets measured using a rolling window of five fiscal years for all available accrual and cash flow data VolatilityROA proxies for earnings variability estimated as the variance of ROA calculated over a rolling window of the current year and prior four years SPOS is an indicator for small positive earnings that
39
equals one if net income scaled by total assets is between 0 and 001 following Barth et al (2008) Turn is measured as sales (Compustat SALE) divided by end-of-year total assets (Compustat AT) following Barth et al (2008) Eissue is annual percentage change in shares of common stock measured as the ratio of the change in shares outstanding at the current and previous fiscal year-ends to the common shares outstanding at previous fiscal year-end (Compustat CSHO) Dissue is annual change in total liabilities (Compustat LT) deflated by beginning-of-year total liabilities following Barth et al (2008) Growth is annual change in sales (Compustat SALE) deflated by sales in previous period Nimtaavg proxies for earnings predictability and it is defined as the present value of the three-year sum of NIMTA the annual net income deflated by total liabilities and market value assuming earnings degenerate at the monthly rate φ = frac12 Nimtaavgt-1t-4 = 1 minus φ 12
1 minus φ 24 ( NIMTA t minus1 t minus 2 + φ 12 NIMTA t minus 2 t minus 3 + φ 24 NIMTA t minus 3 t minus 4 )
Exretavg proxies for return predictability of EXRET (past excess return relative to the value weighted SampP 500 index return over a period of 12 months) and Exretavgt-1t-12 = )(
11
1211
112 minusminus ++minusminus
tt EXRETEXRET φφφ where EXRETit
= log(1+Rit) - log(1 + RSampP500t) and φ = frac12 Rsize proxies for relative firm size calculated as the natural logarithm of market value of equity relative to that of the SampP 500 index Mb is the ratio of firmrsquos market equity value to its book equity value at fiscal year-end Price is calculated as the log of price per share winsorized above $15 following Campbell et al (2008)
40
Table 2 Causal Relations between Unconditional and Conditional Conservatism and
Bankruptcy Risk Estimated by VARX(1) Models
This table reports the SUR estimation results for tri-variate VARX (1) models Bankruptcy risk measures are EDF and Campbell unconditional and conditional conservatism measures are UC_PCA and CC_PCA respectively Model 1 uses EDF UC_PCA and CC_PCA as dependent variables and their one- period lags as autoregressive vectors Model 2 uses Campbell UC_PCA and CC_PCA as dependent variables and their one- period lags as autoregressive vectors Panel A reports the results for the full sample Panel B reports the results for the extremely distressed subsample of firm-year observations in the highest decile of (-ROA) Model details are provided at the end of this table Panel A Tri-variate VARX(1) Model Results for the Full Sample
Model 1 Model 2 Independent Variables EDFt UC_PCAt CC_PCAt Campbellt UC_PCAt CC_PCAt Intercept 03532 00191 29846 03842 00213 30627 (1721) (373) (4656) (1810) (423) (4860) UC_PCAt-1 -00431 06616 00940 -00184 06619 00571 (-882) (18662) (212) (-365) (18670) (129) CC_PCAt-1 -00083 00021 -00128 -00111 00019 -00076 (-1505) (517) (-256) (-1938) (467) (-152) EDFt-1 02459 00389 -02865 (6220) (1361) (-801) Campbellt-1 03340 00388 -04431 (8531) (1416) (-1295) Ln(MV)t -00377 00162 -02663 -00305 00156 -02673 (-6460) (3985) (-5233) (-5188) (3976) (-5453) Leveraget 06452 -00636 03180 04687 -00634 04000 (9517) (-1339) (535) (6779) (-1340) (677) ROAt -04263 -02552 -65643 -09634 -02437 -67519 (-3393) (-2833) (-5821) (-7309) (-2670) (-5917) STD_Rett 03201 01702 (7746) (4006) Casht -00395 -03210 (-435) (-3395) ΔCasht -00600 -01348 (-439) (-952) Ratet -11966 -00947 (-505) (-039) Inten_RDt -00005 00023 -00085 -00011 00024 -00090 (-097) (611) (-178) (-205) (623) (-189) Year and Ind Dum Yes Yes Yes Yes Yes Yes F-statistic 15752 18530 6413 19775 20064 16779
Sample size 34896 34890
Sys weighted R2 06109 05994
Panel B Tri-variate VARX(1) Model Results for the Extremely Distressed Subsample Model 1 Model 2 Independent
Variables EDFt UC_PCAt CC_PCAt Campbellt UC_PCAt CC_PCAt Intercept 02011 00919 30555 02267 00932 31876 (349) (527) (1216) (365) (540) (1283) UC_PCAt-1 -00356 05715 01176 -00090 05709 00864 (-236) (5183) (074) (-056) (5192) (055) CC_ PCAt-1 -00086 00019 00099 -00096 00019 00158 (-533) (165) (058) (-553) (157) (093) EDFt-1 02189 00299 -01227 (1914) (359) (-102) Campbellt-1 02409 00299 -03508 (2077) (379) (-309) Ln(MV)t -00400 00136 -02302 -00305 00133 -02420 (-2396) (1131) (-1331) (-1748) (1146) (-1443) Leveraget 08631 00031 -11485 04519 00059 -10447 (3378) (017) (-436) (1681) (033) (-403)
41
ROAt -01574 -00774 -65650 -02767 -00744 -64869 (-159) (-108) (-633) (-262) (-104) (-627) STD_Rett 03210 01909 (2806) (1548) Casht -00016 -01584 (-007) (-636) ΔCasht -00149 -00582 (-044) (-158) Ratet -10742 -04350 (-166) (-062) Inten_RDt 04858 03453 01069 04634 03449 02349 (638) (631) (014) (568) (631) (030) Year and Ind Dum Yes Yes Yes Yes Yes Yes F-statistic 1755 1292 105 1561 1434 953
Sample size 3488 3488
Sys weighted R2 05893 05125 and indicates a coefficient is significant at 90 95 and 99 confidence level respectively The tri-variate VARX(1) model used in this table consists of the following three equations BRt = α10 + β11BRt-1 + γ11UC_PCAt-1 + δ11CC_PCAt-1 + α11Leveraget + α12ROAt + α13STD_Rett + α14Ln(MV)t + α15Ratet (11)
+ α16Inten_RDt + α17 Casht + α18ΔCasht + sumα1jInd_Dum1j + sumα1k Year_Dum1k + ε11 UC_PCAt = α20 + β21BRt-1 + γ21UC_PCAt-1 + δ21CC_PCAt-1 + α22Leveraget + α23ROAt + α24Ln(MV)t + α25Inten_RDt (12)
+ sumα2jInd_Dum2j + sumα2kYear_Dum2k + ε21 CC_PCAt = α30 + β31BRt-1 + γ31UC_PCAt-1 + δ31CC_PCAt-1 + α32Leveraget + α33ROAt + α34Ln(MV)t + α35Inten_RDt (13)
+ sumα3jInd_Dum3j + sumα3kYear_Dum3k + ε31 where BR = EDF in Model 1 and BR = Campbell in Model 2 F-statistics reported in columns 2 and 5 are for H0 γ11 = 0 and δ11 = 0 F-statistics reported in columns 3 and 6 are for H0 δ21 = 0 and F-statistics reported in columns 4 and 7 are for H0 γ31 = 0
42
Table 3 Causal Relations between Unconditional and Conditional Conservatism and
Bankruptcy Risk for Full Samples Estimated by VARX (3) Models
This table report the SUR estimation results for tri-variate VARX (3) models Bankruptcy risk measures are EDF and Campbell unconditional and conditional conservatism measures are UC_PCA and CC_PCA respectively Model 1 uses EDF UC_PCA and CC_PCA as dependent variables and their one- two- three- period lags as autoregressive vectors Model 2 uses Campbell UC_PCA and CC_PCA as dependent variables and their one- two- three- period lags as autoregressive vectors Model details are provided at the end of this table
Model 1 Model 2 Independent Variables EDFt UC_PCAt CC_PCAt Campbellt UC_PCAt CC_PCAt
Intercept 03315 -00342 26631 03469 -00311 27372 (1838) (-858) (3094) (1960) (-800) (3271) UC_PCAt-1 -00495 07670 -01699 -01637 07675 -03523 (-359) (12513) (-128) (-1190) (12465) (-266) UC_PCAt-2 -00013 01147 03115 01298 01155 04209 (-009) (1882) (237) (950) (1890) (320) UC_PCAt-3 -00034 00312 00404 00068 00302 00770 (-056) (1162) (070) (113) (1122) (133) CC_ PCAt-1 -00064 00014 -00105 -00082 00012 -00021 (-1029) (506) (-177) (-1318) (419) (-036) CC_ PCAt-2 -00069 00018 00245 -00090 00018 00207 (-1114) (639) (412) (-1453) (665) (347) CC_ PCAt-3 -00030 00007 00254 -00035 00008 00231 (-505) (253) (451) (-607) (316) (412) EDFt-1 02790 00316 -05551 (4807) (1232) (-1005) EDFt-2 01091 00086 02038 (1898) (338) (371) EDFt-3 00348 00034 00841 (775) (173) (195) Campbellt-1 03548 00385 -09421 (6065) (1481) (-1684) Campbellt-2 01348 00021 04367 (2289) (082) (771) Campbellt-3 00308 00004 01063 (696) (020) (249) Ln(MV)t -00270 00091 -02514 -00203 00082 -02508 (-3844) (2956) (-3801) (-3047) (2855) (-4040) Leveraget 05335 -00383 03178 03687 -00383 04211 (6714) (-1129) (434) (4797) (-1140) (582) ROAt -04501 -01496 -70033 -09515 -01317 -73962 (-2969) (-2241) (-4862) (-6164) (-1927) (-5030) STD_Rett -00313 -02552 (-295) (-2420) Casht -01172 -02297 (-739) (-1470) ΔCasht 02876 01239 (6112) (2718) Ratet -11380 00793 (-420) (030) Inten_RDt -00038 00058 -00750 -00117 00064 -00798 (-101) (352) (-210) (-315) (389) (-224) Year and Ind Dum Yes Yes Yes Yes Yes Yes F-stat for H0 γ11 + γ12 + γ13 = 0 7210 1848 F-stat for H0 δ11 + δ12 + δ13 = 0 24397 40216 F-stat for H0 β21 + β22 + β23 = 0 31808 9778 F-stat for H0 β31 + β32 + β33 = 0 2563 053 Sample size 26280 26271
Sys weighted R2 07880 07917 AIC number for VARX(1) -397956 -398824 -397824 -396725 -396733 -396733
43
AIC number for VARX(3) -308057 -308065 -308065 -308405 -308413 -308413 and indicates a coefficient is significant at 90 95 and 99 confidence level respectively The tri-variate VARX(3) model used in this table consists of the following three equations BRt = α10 + β11BRt-1 + β12BRt-2 + β13BRt-3 + γ11UC_PCAt-1 + γ12UC_PCAt-2 + γ13UC_PCAt-3 + δ11CC_PCAt-1 + δ12CC_PCAt-2 + (7)
δ13CC_PCAt-3 + α22Leveraget + α12ROAt + α13 STD_Rett + α14Ln(MV)t + α15Ratet + α16Inten_RDt + α17Casht + α18ΔCasht + sumα1j Ind_Dum1j + sumα1k Year_Dum1k + ε11
UC_PCAt = α20 + β21BRt-1 + β22BRt-2 + β23BRt-3 + γ21UC_PCAt-1 +γ22UC_PCAt-2 + γ23UC_PCAt-3 + δ21CC_PCAt-1 + δ22CC_PCAt-2 (8)+ δ23CC_PCAt-3 + α22Leveraget + α23ROAt + α24Ln(MV)t + α25Inten_RDt + sumα2jInd_Dum2j + sumα2kYear_Dum2k + ε21
CC_PCAt = α30 + β31BRt-1 + β32BRt-2 + β33BRt-3 + γ31UC_PCAt-1 + γ32UC_PCAt-2 + γ33UC_PCAt-3 + δ31CC_PCAt-1 + δ32CC_PCAt-2 (9)+ δ33CC_PCAt-3 + α32Leveraget + α33ROAt + α34 Ln(MV)t + α35Inten_RDt + sumα3jInd_Dum3j + sumα3k Year_Dum3k + ε31
where BR = EDF in Model 1 and BR = Campbell in Model 2
44
Table 4 Causal Relations between Unconditional and Conditional Conservatism
and Subsequent Actual Bankruptcy Estimated by Logit Models
This table reports estimation results for logit models that regress the bankruptcy indicator BANK on unconditional and conditional conservatism metrics UC_PCA and CC_PCA and other controlling variables As testing varibles Model 1 uses UC_PCA Model 2 uses CC_PCA and Models 3 to 5 use both UC_PCA and CC_PCA Models 4 and 5 add earnings management (Emgmt) and earnings smoothing (Esmooth) as control variables respectively Model details are provided at the end of the table
Independent Variables Model 1 Model 2 Model 3 Model 4 Model 5 Intercept -267094 -268657 -267027 -267179 -262651 (-1293) (-1301) (-1291) (-1280) (-1198) UC_PCAt-1 -10837 -10844 -10763 -11358 (-238) (-238) (-236) (-244) CC_PCAt-1 00026 00045 00035 -00084 (006) (010) (008) (-019) Emgmtt-1 01775 (068) Esmootht-1 -03326 (-100) Nimtaavgt-1 -18605 -18098 -18543 -18134 -18142 (-148) (-146) (-147) (-144) (-136) Leveraget-1 18871 18253 18850 18818 22959 (246) (239) (247) (246) (273) Exretavgt-1 -65512 -63473 -65619 -66528 -60151 (-232) (-224) (-232) (-234) (-206) Rsizet-1 -02951 -03035 -02939 -02884 -03422 (-320) (-330) (-314) (-303) (-351) STD_Rett-1 13001 12614 12989 12946 12937 (330) (318) (329) (325) (300) Casht-1 -50233 -48829 -50187 -48938 -46751 (-340) (-334) (-339) (-331) (-317) ΔCasht-1 34642 33340 34604 33898 37284 (134) (131) (134) (132) (141) Mbt-1 00633 00068 00627 00776 02711 (025) (003) (024) (031) (108) Pricet-1 08508 08303 08510 08422 08439 (342) (334) (342) (337) (321) Ratet-1 354836 340016 355005 357905 349742 (100) (097) (100) (100) (091) Inten_RDt-1 -191577 -196993 -191563 -189446 -184807 (-209) (-222) (-209) (-204) (-206) Year and Ind Dum Yes Yes Yes Yes Yes Obs 30986 30986 30986 30941 29614 Bankruptcy obs 205 205 205 205 205 Psuedo R-square 02422 02392 02422 02428 02586 and indicates a coefficient is significant at 90 95 and 99 confidence level respectively The logit model used in this table is BANKit = α + γCONit-1 + Controlsit-1 + microt (10)where BANK is the bankruptcy indicator equal to one for bankrupt firms and zero otherwise CON refers to UC_PCA in Model 1 CC_PCA in Model 2 and to both UC_PCA and CC_PCA in Models 3 to 5 In Models 1 to 5 Controls include market-based profitability (NIMTAVG) predictability of excess return (EXRETAVG) market-to-book ratio (Mb) excess firm size (Rsize) leverage ratio (Leverage) liquidity (Cash ratio of cash flow to total assets (ΔCash) return volatility (STD_Ret) stock price (PRICE) risk-free rate (Rate) RampD intensity (Inten_RD) and year and industry dummies
45
Table 5 Cash Enhancing and Informational Roles of Accounting Conservatism
and Causal Relations between Unconditional and Conditional Conservatism and Subsequent Bankruptcy Risk
This table reports SUR estimation results for tri-variate VARX (1) models using conditional and unconditional conservatism bankruptcy risk and their interactions with cash or information asymmetry as autoregressive vectors Bankruptcy risk measures are EDF and Campbell unconditional and conditional conservatism measurements used are UC_PCA and CC_PCA respectively Model details are provided at the end of the table
Panel A Tests for Cash Enhancing Role of Conservatism Model 1 Model 2 Independent Variables
EDFt UC_PCAt CC_PCAt Campbellt UC_PCAt CC_PCAt Intercept 02944 -00308 30679 03040 -00296 31702 (1392) (-827) (3982) (1443) (-804) (4168) UC_PCAt-1Casht-1 -03010 -03437 (-946) (-1085) UC_PCA t-1 -00321 08838 00997 -00067 08839 00620 (-506) (35425) (193) (-106) (35490) (120) CC_PCA t-1Casht-1 -00276 -00115 (-583) (-244) CC_PCAt-1 -00050 00010 -00146 -00092 00008 -00099 (-702) (366) (-262) (-1293) (289) (-177) EDF t-1 03527 00438 -03785 (7754) (2135) (-893) Campbellt-1 04619 00432 -05588 (10704) (2248) (-1408) Controls Yes Yes Yes Yes Yes Yes F-statistic for H0 θ11+ γ11 = 0 13131 14652 F-statistic for H0 δ11+ θ12 = 0 5570 2264 Sample size 30276 30270 Sys weighted R2 06018 05893 Panel B Tests for Information Role of Conservatism
Model 1 Model 2 Independent Variables EDFt UC_PCAt CC_PCAt Campbellt UC_PCAt CC_PCAt
Intercept 03039 -00308 30679 03198 -00296 31702 (1429) (-827) (3982) (1507) (-804) (4168) UC_PCAt-1STD_Rett-1 -00453 -01367 (-300) (-907) UC_PCA t-1 -00305 08838 00997 00346 08839 00620 (-320) (35425) (193) (365) (35490) (120) CC_PCA t-1STD_Rett-1 -00201 -00004 (-1056) (-020) CC_PCAt-1 00026 00010 -00146 -00097 00008 -00099 (240) (366) (-262) (-895) (289) (-177) EDF t-1 03760 00438 -03785 (7780) (2135) (-893) Campbellt-1 04666 00432 -05588 (10688) (2248) (-1408) Controls Yes Yes Yes Yes Yes Yes F-statistic for H0 θ11+ γ11 = 0 6882 12508 F-statistic for H0 δ11+ θ12 = 0 23159 7627 Sample size 30276 30270 Sys weighted R2 07761 07778
and indicates a coefficient is significant at 90 95 and 99 confidence level respectively The tri-variate VARX(1) model used in this table consists of the following three equations BRt = α10 + β11BRt-1 + γ11UC_PCAt-1 + δ11CC_PCAt-1 + θ11Rolet-1UC_PCAt-1 + θ12RoleCC_PCAt-1 + θ13Rolet-1 + Controls + ε11 UC_PCAt = α20 + β21BRt-1 + γ21 UC_PCAt-1 + δ21CC_PCAt-1 + Controls + ε21 CC_PCAt = α30 + β31BRt-1 + γ31UC_PCAt-1 + δ31CC_PCAt-1 + θ32Rolet-1 + Controls + ε31 where Role = Cash and STD_Ret in Panels A and B respectively Controls are the same as those in the corresponding equations (4) to (6)
46
Table 6 SOX Auditor Resignation and Causal Relations between Bankruptcy Risk and Subsequent Unconditional and Conditional Conservatism
This table reports SUR results for tri-variate VARX (1) models with bankruptcy risk unconditional and conditional conservatism as dependent variables and with their one-period lags and interactions with post-SOX SOX and with post-auditor-resignation Aud_resign as autoregressive vectors Bankruptcy risk measures are EDF and Campbell unconditional and conditional conservatism measures are UC_PCA and CC_PCA respectively Model details are provided at the end of the table
Panel A SOX and Causal Relations between Conservatism and Bankruptcy Risk Model 1 Model 2 Independent Variables EDFt UC_PCAt CC_PCAt Campbellt UC_PCAt CC_PCAt
Intercept 03505 00304 29754 03858 00318 30675 (1704) (531) (4608) (1810) (565) (4838) UC_PCAt-1SOX -00322 00009 (-369) (010) UC_PCAt-1 -00327 06636 01056 -00197 06641 00743 (-667) (18404) (260) (-389) (18419) (183) CC_PCAt-1SOX -00007 -00040 (-056) (-313) CC_PCAt-1 -00081 00014 -00130 -00102 00012 -00076 (-1342) (321) (-258) (-1621) (275) (-151) EDFt-1SOX 00105 -00261 (181) (-039) EDFt-1 02456 00316 -02777 (6218) (904) (-703) Campbellt-1SOX 00135 01041 (237) (159) Campbellt-1 03331 00320 -04661 (8515) (958) (-1234) Controls Yes Yes Yes Yes Yes Yes Sample size 34896 34890 Sys weighted R2 06016 05893
Panel B Auditor Resignations and Causal Relations between Conservatism and Bankruptcy Risk Model 1 Model 2 Independent Variables EDFt UC_PCAt CC_PCAt Campbellt UC_PCAt CC_PCAt
Intercept 02311 00116 30028 03840 00011 29924 (432) (032) (698) (719) (003) (701) UC_PCAt-1 -01108 06775 -00284 -00593 06774 -00419 (-279) (2699) (-009) (-149) (2705) (-014) UC_PCA t-1Aud_resignt-1 -00400 00062 (-073) (011) CC_PCA t-1 -00042 00052 -00549 -00215 00050 -00545 (-073) (156) (-138) (-372) (149) (-136) CC_PCAt-1Aud_resignt-1 -00062 00009 (-080) (011) EDF t-1 00910 00235 00515 (334) (099) (018) EDFt-1Aud_resignt-1 00792 00407 (256) (010) Campbellt-1 02751 00437 00965 (1014) (184) (034) Campbellt-1Aud_resignt-1 00522 -01155 (167) (-030) Controls Yes Yes Yes Yes Yes Yes Sample size 732 732 Sys weighted R2 06782 06351
The tri-variate VARX (1) model used in this table consists of the following three equations BRt = α10 + β11BRt-1 + γ11UC_PCAt-1 + δ11CC_PCAt-1 + θ11Expt-1UC_PCAt-1 + θ12Expt-1CC_PCAt-1 + θ13Expt-1 + Controls + ε11 UC_PCAt = α20 + β21BRt-1 + γ21UC_PCAt-1 + δ21CC_PCAt-1 + θ21Expt-1BRt-1 + θ22Expt-1 + Controls + ε21 CC_PCAt = α30 + β31BRt-1 + γ31UC_PCAt-1 + δ31CC_PCAt-1 + θ31Expt-1BRt-1 + θ32Expt-1 + Controls + ε31
where Exp = SOX and Aud_Resign in Panels A and B respectively Controls are the same as in the corresponding equations (4) to (6)
47
Table 8 Conservatism Gaming and Causal Relations between Unconditional and Conditional Conservatism and Bankruptcy Risk
This table reports the SUR estimation results for tetra-variate VARX (1) models with bankruptcy risk unconditional and conditional conservatism and conservatism gaming as dependent variables and their one-period lags as autoregressive vectors Bankruptcy risk measures are EDF and Campbell Model 1 uses EDF UC_PCA CC_PCA and Esmooth as the autoregressive vector Model 2 uses Campbell UC_PCA CC_PCA and Esmooth as the autoregressive vector Model details are provided at the end of this table
Model 1 Model 2 Independent Variables EDFt UC_PCAt CC_PCAt Esmootht Campbellt UC_PCAt CC_PCAt EsmoothtIntercept 04339 00191 29232 01992 04795 00214 30107 01979 (2776) (362) (4349) (1507) (2957) (411) (4550) (1518)UC_PCAt-1 -00463 06789 01222 -00264 -00215 06792 00823 -00261 (-894) (18510) (262) (-287) (-402) (18508) (177) (-284) CC_PCAt-1 -00077 00018 -00129 00010 -00110 00016 -00077 00009 (-1334) (444) (-246) (096) (-1833) (393) (-146) (091) Esmootht-1 00009 -00029 -00424 07185 -00041 -00030 -00451 07186 (042) (-194) (-220) (18928) (-185) (-198) (-234) (18930)EDFt-1 02510 00405 -02684 -00023 (6004) (1371) (-715) (-031) Campbellt-1 03405 00396 -04287 -00003 (8213) (1401) (-1195) (-005) Ln(MV)t -00374 00157 -02657 -00010 -00308 00151 -02675 -00009 (-6102) (3762) (-4991) (-092) (-4970) (3745) (-5221) (-085) Leveraget 06472 -00685 02969 00516 04698 -00680 03835 00505 (8993) (-1393) (474) (419) (6390) (-1388) (616) (412) ROAt -04005 -02626 -64814 00991 -09346 -02513 -66653 01003 (-3075) (-2883) (-5591) (435) (-6824) (-2721) (-5680) (434) STD_Rett 03233 01706 (7466) (3825) Casht -00341 -03149 (-358) (-3166) ΔCasht -00685 -01386 (-481) (-938) Ratet -20966 -11019 (-1123) (-570) Inten_RDt -00005 00023 -00080 -00010 00023 -00085 (-089) (615) (-170) (-193) (628) (-181) volatility_ROAt -00110 -00102 (-048) (-045) Year and Ind Dum Yes Yes Yes Yes Yes Yes Yes Yes F-statistic 13383 18803 5110 17980 19644 14280
Sample size 32361 32355 Sys weighted R2 06080 05990 and indicates a coefficient is significant at 90 95 and 99 confidence level respectively The tetra-variate VARX(1) model used in this table consists of the following four equations BRt = α10 + β11BRt-1 + γ11UC_PCAt-1 + δ11CC_PCAt-1 + θ11Esmootht-1 + Controls + ε11 (11)UC_PCAt = α20 + β21BRt-1 + γ21UC_PCAt-1 + δ21CC_PCAt-1 + θ21Esmootht-1 + Controls + ε21 (12)CC_PCAt = α30 + β31BRt-1 + γ31UC_PCAt-1 + δ31CC_PCAt-1 + θ31Esmootht-1 + Controls + ε31 (13)Esmootht = α40 + β41BRt-1 + γ41UC_PCAt-1 + δ41CC_PCAt-1 + θ41Esmootht-1 + α41Leveraget + α42ROAt + α43Ln(MV)t (14)
+ α44Volatility_ROAt + sumα4jInd_Dumj + sumα4kYear_Dum4k + ε41 where BR = EDF and Campbell in Models 1 and 2 respectively F-statistics in columns 2 and 6 are for H0 γ11 = 0 δ11 = 0 in columns 3 and 7 for H0 β21 = 0 in columns 4 and 8 for H0 β31 = 0 Controls in equations (11) to (13) are the same as in equations (4) to (6)
Health Stage Distress Stage Bankruptcy Stage
T=1 Technical Default
T=2 Default Cash Shortage
T=3 Bankruptcy Bankruptcy Petition
Waiver Private Workouts Liquidation under Chapter 7 or Reorganization under Chapter 11
Technical Default Region Default Region
Figure 1 Bankruptcy Timeline
Time T=0 Borrowing Money
Appendix A Causal Relations between Unconditional Conservatism and Bankruptcy Risk and between Conditional Conservatism and Bankruptcy Risk
This appendix reports estimation models and results for examining relations between unconditional conservatism and bankruptcy risk using bi-variate VARX (1) In particular the bi-variate VARX (1) model consisting of equations (1a) and (2a) tests hypotheses H1a and H2a BRt = α10 + β11BRt-1 + γ11UCt-1 + Controlst + ε11 (1a) UCt = α20 + β21BRt-1 + γ21UCt-1 + Controlst + ε21 (2a) where UC refers to an unconditional conservatism metric UC_ACC UC_BM UC_RES or UC_PCA and BR refers to a bankruptcy risk measure EDF or Campbell The autoregressive vector includes BRt-1 and UCt-1 Exogenous Controlst in equations (1b) and (2b) are the same as in equations (4) and (5) respectively H1a and H1b predict that γ11 lt 0 and β21 gt 0 respectively and Table A1 reports the SUR estimation results
Table A1 Causal Relations between Unconditional Conservatism and Bankruptcy Risk
This table reports the SUR estimation results for bi-variate VARX (1) models consisting of equations (1b) and (2b) Panel A (Panel B) presents results for models using EDF (Campbell) bankruptcy risk measure Unconditional conservatism measures used in both panels are and UC_PCA UC_BM UC_ACC and UC_RES Model details are provided at the end of this table Panel A VARX (1) Model Results when Bankruptcy Risk is EDF
Model 1 Model 2 Model 3 Model 4 Independent Variables
EDFt UC_PCAt EDFt UC_BMt EDFt UC_ACCt EDFt UC_RESt Intercept 03426 00224 03397 -00342 03403 -00068 03365 00979 (1666) (440) (1660) (-524) (1611) (-458) (1591) (1985) UC_PCAt-1 -00458 06624 (-935) (18696) UC_BMt-1 -00310 07169 (-857) (21191) UC_ACCt-1 -01087 05198 (-554) (12107) UC_RESt-1 -00155 04717 (-255) (10882) EDFt-1 02387 00409 02386 00709 02465 00051 02463 -00127 (6065) (1442) (6032) (1935) (6352) (606) (6346) (-459) Ln(MV)t -00362 00158 -00364 00199 -00373 00023 -00374 -00008 (-6282) (3960) (-6334) (3876) (-6538) (1934) (-6553) (-208) Leveraget 06461 -00639 06432 -00132 06356 -00173 06345 -00947 (9500) (-1345) (9426) (-214) (9329) (-1209) (9288) (-2004) ROAt -04196 -02572 -04186 00106 -04291 -01458 -04265 -03507 (-3331) (-2856) (-3322) (091) (-3398) (-5379) (-3372) (-3927) STD_Rett 03161 03131 03029 03058 (7635) (7618) (7125) (7160) Casht -00388 -00477 -00457 -00557 (-426) (-350) (-323) (-393) ΔCasht -00638 -00694 -00703 -00715 (-465) (-768) (-748) (-757) Ratet -11990 -11148 -11902 -11492 (-504) (-472) (-485) (-468) Inten_RDt -00005 00023 -00005 00006 -00005 -00002 -00005 00045 (-100) (611) (-093) (123) (-093) (-168) (-093) (1189) Year and Ind Dum Yes Yes Yes Yes Yes Yes Yes Yes F-statistic 8751 20808 7344 37450 3074 3677 650 2103
Sample size 34896 34896 34896 34896 Sys weighted R2 06857 07035 05821 05962
Panel B VARX (1) Model Results when Bankruptcy Risk is Campbell Model 1 Model 2 Model 3 Model 4 Independent
Variables Campbellt UC_PCAt Campbellt UC_BMt Campbellt UC_ACCt Campbellt UC_RESt Intercept 03726 00347 03672 -00351 03751 -00059 03717 00668 (1743) (666) (1732) (-548) (1712) (-403) (1698) (1945)
50
UC_PCAt-1 -00231 05811 (-498) (17212) UC_BMt-1 -00150 07187 (-401) (21272) UC_ACCt-1 -00067 05183 (-033) (12045) UC_RESt-1 -00134 05221 (-165) (13262) Campbellt-1 03222 00337 03211 00772 03244 00040 03246 -00042 (8295) (1200) (8207) (2211) (8425) (499) (8455) (-227) Ln(MV)t -00285 00170 -00287 00191 -00295 00022 -00293 00020 (-4908) (4267) (-4945) (3880) (-5125) (1913) (-5099) (757) Leveraget 04709 -00712 04672 -00168 04615 -00168 04624 -00906 (6773) (-1446) (6702) (-275) (6629) (-1176) (6622) (-2725) ROAt -09579 -02793 -09612 00349 -09673 -01453 -09659 -03136 (-7233) (-2942) (-7260) (298) (-7291) (-5291) (-7247) (-4890) STD_Rett 01655 01634 01549 01576 (3868) (3862) (3532) (3588) Casht -01368 -01234 -01196 -01334 (-958) (-872) (-813) (-908) ΔCasht -03227 -03498 -03615 -03507 (-3387) (-3711) (-3681) (-3551) Ratet -01104 00047 -00734 -00593 (-045) (002) (-029) (-023) Inten_RDt -00011 00025 -00011 00007 -00011 -00002 -00011 00031 (-210) (636) (-203) (141) (-200) (-165) (-202) (1171) Year and Ind Dum Yes Yes Yes Yes Yes Yes Yes Yes F-statistic 1970 22845 1609 48885 011 2490 271 516 Sample size 34890 34890 34890 34890
Sys weighted R2 06742 06960 06965 06242 and indicates a coefficient is significant at 90 95 and 99 confidence level respectively The bi-variate VARX (1) model used in this table consists of the following two equations BRt = α10 + β11BRt-1 + γ11CONt-1 + α11Leveraget + α12ROAt + α13STD_Rett + α14Ln(MV)t + α15Ratet + α16Inten_RDt (1b)
+ α17Casht + α18ΔCasht + sumα1jInd_Dum1j + sumα1kYear_Dum1k + ε11 CONt = α20 + β21BRt-1 + γ22CONt-1 + α21Leveraget + α22ROAt + α23Ln(MV)t + α24Inten_RDt + sumα2jInd_Dum2j (2b)
+ sumα2kYear_Dum2k + ε21 where BR = EDF in Panel A and BR = Campbell in Panel B CON = UC_PCA in Model 1 CON = UC_BM in Model 2 CON = UC_ACC in Model 3 and CON = UC_RES in Model 4 F-statistics reported in columns 2 4 6 and 8 are for H0 γ11 = 0 those reported in columns 3 5 7 and 9 are for H0 β21 = 0
Panel A of Table A1 reveals that all four measures of unconditional conservatism UC_PCAt-1 UC_BMt-1 UC_ACCt-1 and UC_RESt-1 are significantly negatively associated with the subsequent bankruptcy risk as measured by EDFt Panel B reports the same pattern for Campbellt For the null hypothesis that the predictor coefficients for EDFt and Campbellt are equal to zero the F-statistics are all significant beyond the 95 confidence level except for UC_ACCt-1 in Panel B These results support hypothesis H1a in suggesting that the cash enhancing and informational roles of unconditional conservatism lowers subsequent bankruptcy risk
Table A1 further shows that EDFt-1 and Campbellt-1 are significantly positively associated with subsequent unconditional conservatism except for UC_RES suggesting that prior bankruptcy risk Granger-causes subsequent unconditional conservatism consistent with hypothesis H1b UC_RESt exhibits negative coefficients (t-statistics) of -00127 (-459) for EDFt-1 in Panel A and -00042 (-227) for Campbellt-1 in Panel B Although this result is inconsistent with H1b it is consistent with the intuition that extreme unconditional conservatism in the form of immediate expensing of RampD and advertising expenditures is detrimental to managersrsquo career motives and dominates managersrsquo disciplinary concerns and auditor and regulator interests resulting in disincentives for UC_RESt as bankruptcy risk rises Nor does this negative association for UC_RESt qualitatively change the positive association between bankruptcy risk and subsequent unconditional conservatism exhibited by the combined measure UC_PCAt For the null hypothesis that the predictor coefficients for UC_PCAt UC_BMt UC_ACCt and UC_RESt are equal to zero F-statistics indicate rejection beyond the 95 confidence level Overall these findings support hypothesis H1b in suggesting that bankruptcy risk stimulates subsequent unconditional conservatism consistent with the interests of auditors creditors and regulators offsetting managersrsquo career motives in the case of unconditional conservatism as predicted The signs of the coefficients of the exogenous control variable are also consistent with predictions For example EDFt and Campbellt are generally positively associated with Leveraget and STD_Rett and negatively associated with ROAt Ln(MV)t Ratet Casht ΔCasht and Inten_RDt
51
Appendix B Causal Relations between Conditional Conservatism and Bankruptcy Risk This appendix reports estimation results regarding examining relations between conditional conservatism and bankruptcy risk using bi-variate VARX (1) In particular the following bi-variate VARX (1) model consisting of equations (1b) and (2b) tests hypotheses H1b and H2b regarding causal relations between conditional conservatism and bankruptcy risk BRt = α10 + β11BRt-1 + γ11CCt-1 + Controlst + ε11 (1b) CCt = α20 + β21BRt-1 + γ21CCt-1 + Controlst + ε21 (2b) where CC refers to a conditional conservatism metric CC_ACM CC_AR CC_CR or CC_PCA and BR refers to a bankruptcy risk measure EDF or Campbell The autoregressive vector includes BRt-1 and CCt-1 Controlst in equations (3b) and (4b) are the same as in equations (4) and (6) respectively with the same predictions H1b and H2b predict that γ11 lt 0 and β21 lt 0 respectively and Table B1 reports the SUR estimation results
Table B1 Causal Relations between Conditional Conservatism and Bankruptcy Risk
This table reports the SUR estimation results for bi-variate VARX (1) models consisting of equations (1b) and (2b) Panel A (Panel B) presents results for models using EDF (Campbell) bankruptcy risk measure Conditional conservatism measurements are CC_PCA CC_AR CC_CR and CC_ACM Model details are provided at the end of this table
Panel A Bivaiate VARX (1) Model Results when Bankruptcy Risk is EDF Model 1 Model 2 Model 3 Model 4 Independent
Variables EDFt CC_PCAt EDFt CC_ARt EDFt CC_CRt EDFt CC_ACMt Intercept 03478 30130 06136 38327 03369 03381 03368 00051 (1648) (4806) (2970) (18658) (1592) (443) (1592) (377) CC_PCAt-1 -00084 -00124 (-1526) (-247) CC_ARt-1 -00724 02947 (-5920) (9398) CC_CRt-1 -00009 -00260 (-206) (-506) CC_ACMt-1 -00570 05317 (-254) (11959) EDFt-1 02531 -02990 03006 -03017 02468 -03311 02463 -00054 (6497) (-847) (7855) (-3083) (6348) (-769) (6346) (-707) Ln(MV)t -00389 -02648 -00641 -03903 -00374 00174 -00373 00010
(-6739) (-5256) (-8955)(-21572) (-6558) (286) (-6533) (890)
Leveraget 06343 03211 06495 09121 06345 -02801 06350 00065 (9334) (540) (9984) (5687) (9306) (-384) (9313) (503) ROAt -04323 -65718 -03462 -07408 -04274 -78724 -04252 -00695 (-3433) (-5830) (-2861) (-2428) (-3378) (-5678) (-3368) (-2833) STD_Rett 03088 03451 03040 03052 (7269) (8517) (7135) (7161) Casht -00780 -01184 -00776 -00796 (-833) (-1328) (-826) (-848) ΔCasht -00484 -00161 -00526 -00512 (-342) (-120) (-371) (-361) Ratet -11459 -14083 -11560 -11476 (-468) (-604) (-470) (-467) Inten_RDt -00005 -00084 -00006 -00020 -00005 -00087 -00005 -00003 (-089) (-177) (-112) (-154) (-091) (-149) (-089) (-246) Year and Ind Dum Yes Yes Yes Yes Yes Yes Yes Yes F-statistic
23276 7182 350580 95078 426 5909 648 4997
Sample size 34890 34896 34896 34896 Sys weighted R2 05516 08353 05263 05670 Panel B Bivaiate VARX (1) Model Results when Bankruptcy Risk is Campbell
Model 1 Model 2 Model 3 Model 4 Independent Variables Campbellt CC_PCAt Campbellt CC_ARt Campbellt CC_CRt Campbellt CC_ACMt Intercept 03872 30793 06594 37606 03691 05207 03730 00062 (1775) (4992) (3078) (18283) (1686) (694) (1703) (463)
52
CC_PCAt-1 -00110 -00073 (-1934) (-146) CC_ARt-1 -00721 02883 (-5488) (8802) CC_CRt-1 -00035 -00228 (-731) (-445) CC_ACMt-1 -00376 05323 (-162) (11981) Campbellt-1 03353 -04505 04035 -01588 03261 -06585 03241 -00076 (8681) (-1336) (10264) (-1629) (8480) (-1607) (8442) (-1044) Ln(MV)t -00315 -02663 -00579 -03824 -00294 00070 -00294 00009 (-5420) (-5509) (-7807) (-21063) (-5118) (121) (-5112) (905) Leveraget 04599 04018 04722 08396 04603 -01020 04610 00077 (6642) (680) (7079) (5210) (6618) (-141) (6623) (596) ROAt -09714 -67584 -08700 -07316 -09720 -81852 -09665 -00727 (-7362) (-5929) (-6769) (-2331) (-7323) (-5844) (-7286) (-2926) STD_Rett 01608 01480 01569 01567 (3682) (3541) (3579) (3570) Casht -03607 -03421 -03627 -03665 (-3700) (-3675) (-3705) (-3742) ΔCasht -01209 -01017 -01235 -01227 (-827) (-727) (-841) (-835) Ratet -00478 -02909 -00326 -00475 (-019) (-120) (-013) (-019) Inten_RDt -00010 -00089 -00011 -00022 -00011 -00094 -00011 -00003 (-195) (-188) (-221) (-169) (-197) (-161) (-197) (-255) Year and Ind Dum Yes Yes Yes Yes Yes Yes Yes Yes F-statistic
37387 16627 301392 26565 5343 25829 263 10891
Sample size 34890 34890 34890 34890 Sys weighted R2 05300 08111 05043 05471 and indicates a coefficient is significant at 90 95 and 99 confidence level respectively The bi-variate VARX (1) model used in this table consists of the following two equations BRt = α10 + β11BRt-1 + γ11CONt-1 + α11Leveraget + α12ROAt + α13STD_Rett + α14 Ln(MV)t + α15Ratet + α16Inten_RDt (1b)
+ α17Casht + α18ΔCasht + sumα1jInd_Dum1j + sumα1kYear_Dum1k + ε11 CONt = α20 + β21BRt-1 + γ22CONt-1 + α21Leveraget + α22ROAt + α23Ln(MV)t + α24Inten_RDt + sumα2jInd_Dum2j (2b)
+ sumα2kYear_Dum2k + ε21 where BR = EDF in Panel A and BR = Campbell in Panel B CON = CC_PCA in Model 1 CON = CC_AR in Model 2 CON = CC_CR in Model 3 and CON = CC_ACM in Model 4 F-statistics reported in columns 2 4 6 and 8 are for H0 γ11 = 0 those reported in columns 3 5 7 and 9 are for H0 β21 = 0
Panel A of Table B1 reveals that all four measures of conditional conservatism CC_PCAt-1 CC_ARt-1 CC_CRt-1 and CC_ACMt-1 are negatively associated with subsequent bankruptcy risk measured by EDFt and Panel B reveals the same pattern for Campbellt-1 For the null hypothesis that the predictor coefficients for EDFt and Campbellt are equal to zero the F-statistics are all significant beyond the 90 confidence level except for CC_ACMt-1 in Panel B These findings suggest that conditional conservatism reduces subsequent bankruptcy risk consistent with the cash enhancing and informational properties of conditional conservatism as predicted by hypothesis H2b Table B1 further shows that bankruptcy risk metrics EDFt-1 and Campbellt-1 are uniformly negatively associated with subsequent conditional conservatism measured by CC_PCAt CC_ARt CC_CRt and CC_ACMt These findings suggest that prior bankruptcy risk lowers subsequent conditional conservatism consistent with hypothesis H2b For the null hypothesis that the predictor coefficients for CC_PCAt CC_ARt CC_CRt and CC_ACMt are equal to zero F-statistics are all significant beyond the 99 confidence level These findings support hypothesis H2b in suggesting that bankruptcy risk reduces subsequent conditional conservatism and is consistent with the notion that although it mitigates subsequent bankruptcy risk conditional conservatism is resisted by managers whose career motives dominate their disciplinary concerns as predicted
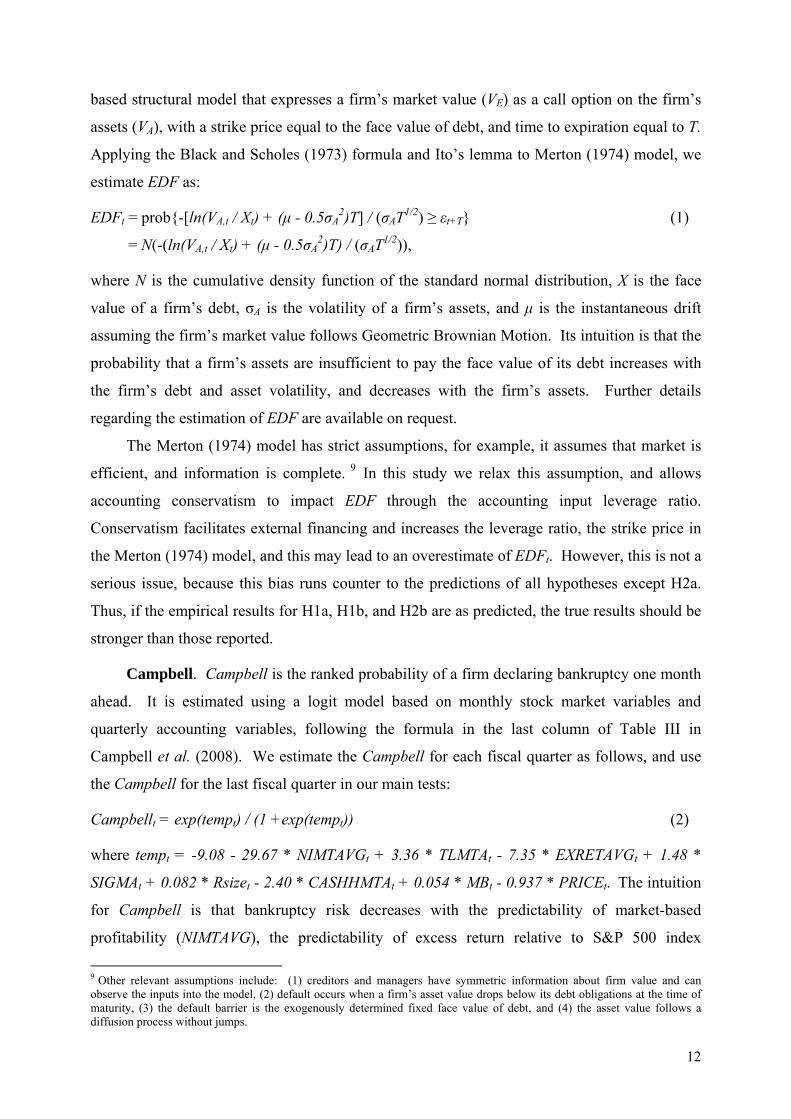
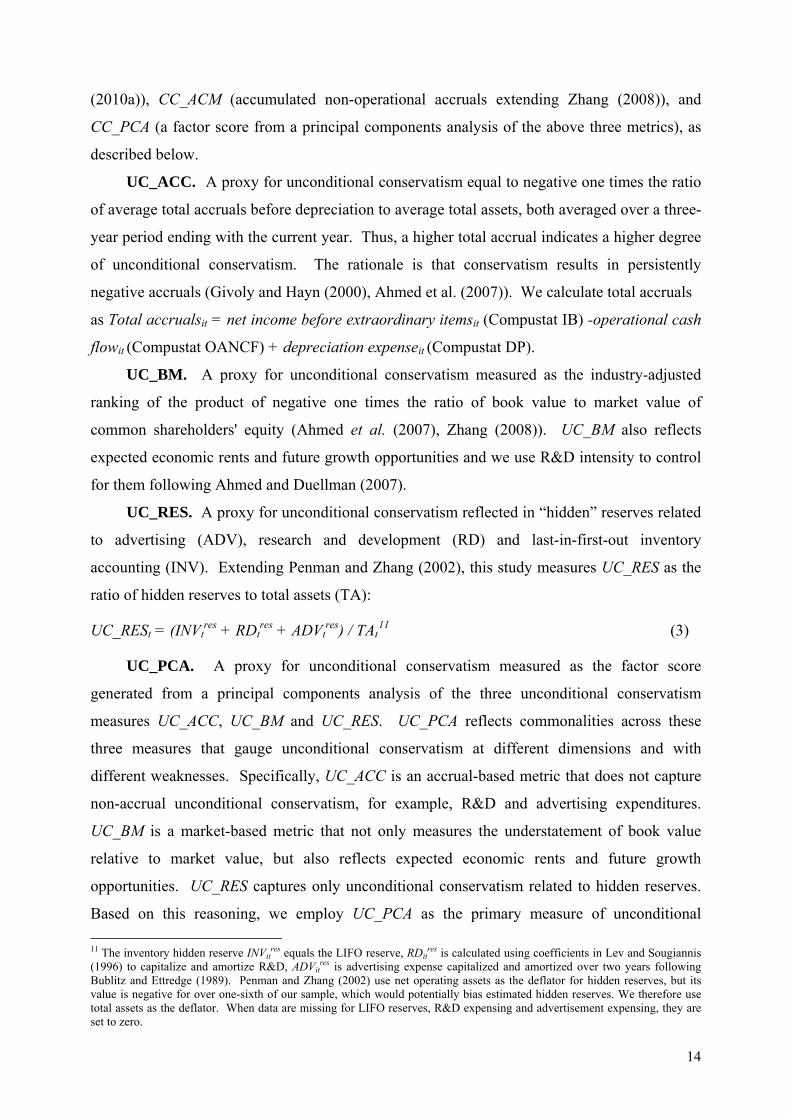