Embed Size (px)
Citation preview
ACCEPTED VERSION
Coleman, H. W.; Simpson, Angus Ross; de Garcia, L. M. Aeration for cavitation protection of Uribante Spillway Proceedings of the Conference on Frontiers in Hydraulic Engineering, Massachusetts, USA, 9-12 August 1983/Hung Tao Shen (ed.): pp. 438-443
Copyright © 1983, ASCE
http://hdl.handle.net/2440/80881
PERMISSIONS
http://www.asce.org/Content.aspx?id=29734
Authors may post the final draft of their work on open, unrestricted Internet sites or deposit it in an institutional repository when the draft contains a link to the bibliographic record of the published version in the ASCE Civil Engineering Database. "Final draft" means the version submitted to ASCE after peer review and prior to copyediting or other ASCE production activities; it does not include the copyedited version, the page proof, or a PDF of the published version
18 March 2014
Aeration for Cavitation Protection of Uribante Spillway
By H.W. Coleman, l M. ASCE, A.R. Simpson, 2 Assoc. M. ASCE
and L.M. de Garcia3
Abstract: Analytical and hydraulic model studies have been made to determine geometry for aeration ramps for Uribante spillway. Two aeration ramps were desi~ned, one at mid-length and one near the flipbucket. Analytical studies were made using finite element analysis of the jet trajectory in order to predict the air demand of the jet. Air supply flowrate was estimated by computation of hydraulic losses in the air supply conduits. The interaction of air demand and supply as functions of jet underpressure allowed prediction of air entrainment. A model study was used to confirm computation of jet trajectory.
Introduction
'!he Uribante-Doradas Project is located in western Venezuela, near the city of San Cristobal, in the Andes mountains. Compania Anonima de Administracion y Fomento (CADAFE) is developing the project which consists of a 130-meter-high fill dam and intake on the Uribante River, an 8-km-long power tunnel to a 300~ powerhouse discharging into the San Agaton River. Harza Engineering Company has been involved in reconnaissance, planning, design and construction of the project. The spillway is an ungated l2-meter-wide chute with a discharge capacity of 1100 m3/s.
Analytical Studies of Aeration Ramps
'!he following steps provide a summary of the procedure used in the analytical studies of various aeration ramp geometries for Uribante spillway.
1. L'etermine the spillway design discharge and range of discharges to be analyzed. FOr Uribante, the design discharge was 300 m3/s. The range of discharges considered was 50 m3/s (normal flow) to 1l00m 3/s (R-IF).
1 Assistant Head of Hydraulic Analysis and Design Section, Harza Engineering Company, 150 S. Wacker Drive, Chicago, Illinois, 60606.
2 Hydraulic Engineer, Harza Engineering Corrpany 3 Ingeniera, CEH Ingenieros Consultores, C.A., Caracas, Venezuela.
1

2. r:etermine if aeration ramps are needed. Calculate the growth of the boundary layer along the spillway, the water surface profile and energy grade line for each discharge. Calculate the cavitation number, a (flow), at locations along the spillway chute and compare with the acceptable cavitation number, a (allowable), corresponding to an expected surface irregularity. '!he irregularity size should be related to the finish tolerances required for construction of the spillway. At locations on the spillway chute where a (flow) is less than a (allowable) aeration is required. An equivalent roughness height of the spillway surface is selected to determine the boundary layer growth.
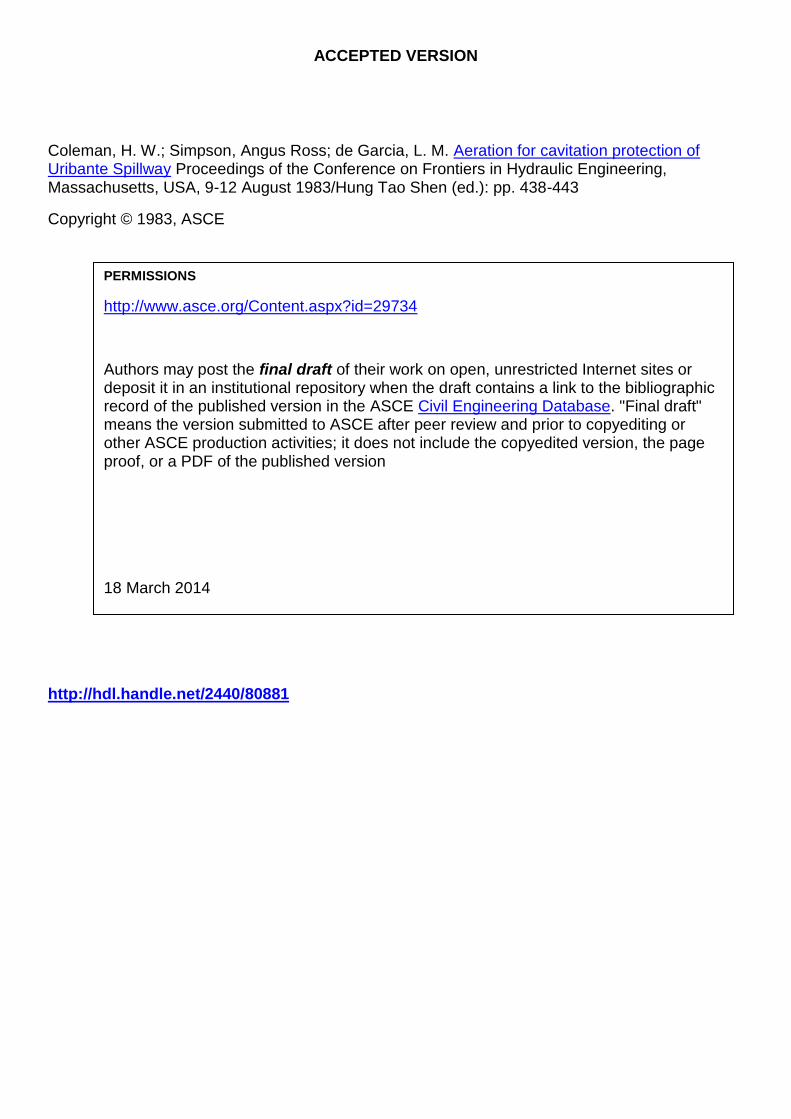
3. Select the aeration ramp locations along the chute. On Uribante spillway (Figure 1), aeration ramps were located at mid-length just upstream of a convex curve (referred to as the upper ramp) and near the flip bucket (the lower ramp).
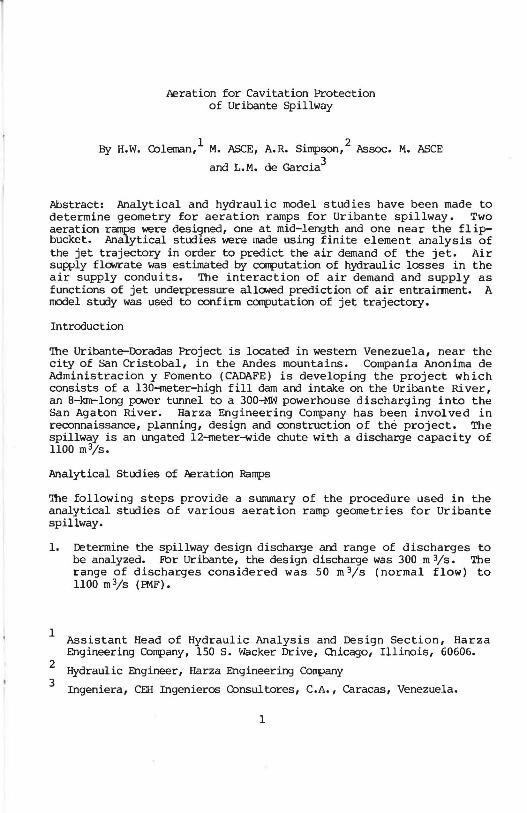
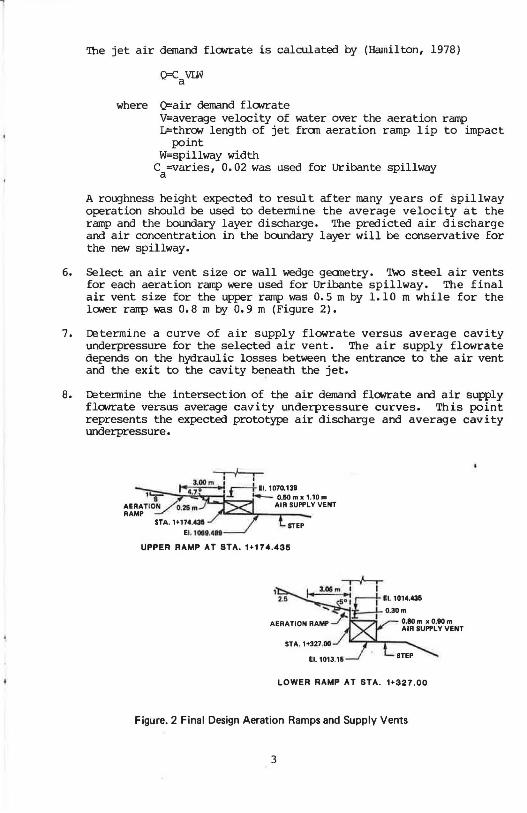
4. Select a trial ramp size and step geometry. The final design aeration ramp sizes selected for Uribante spillway were a 25 cm (vertical height) by 3.0 m (horizontal length) by 4.7 degree ramp (angle between the ramp surface and the original spillway surface) for the upper ramp and a 30 cm by 3.06 m by 5 degree ramp for the lower ramp. '!hese ramps are shown in Figure 2.
5. fur the selected aeration ramp geometry, determine the curve of air demand of the jet versus average cavity underpressure. The air demand depends on throw length and velocity of water. The throw length is calculated using a finite element analysis of jet trajectory based on the cavity underpressure (Wei and DeFazio, 1982) •
L CREST EI. 1098.000 UPPER AERATION RAMP
\ I~
LOWER AERATION RAMP
1+00 11"50 1+100 1+150 1+200 1+250 1+300 H 350 1...00 ST AnON (Mot«.)
Figure 1. Uribante Spillway Chute and Aeration Ramp Locations
2
..
The jet air demand flowrate is calculated by (~nilton, 1978)
Q=CaVW
where Q=air demand flowrate V=average velocity of water over the aeration ramp L=throw length of jet from aeration ramp lip to impact
point W=spillway width
Ca=varies, 0.02 was used for Uribante spillway
A roughness height expected to result after many years of spillway operation should be used to determine the average velocity at the ramp and the boundary layer discharge. The predicted air discharge and air concentration in the boundary layer will be conservative for the new spillway.
6. Select an air vent size or wall wedge geometry. 'l\,Q steel air vents for each aeration ramp were used for Uribante spillway. The final air vent size for the upper ramp was 0.5 m by 1.10 m while for the lower ramp was 0.8 m by 0.9 m (Figure 2).
7. Determine a curve of air supply flowrate versus average cavity underpressure for the selected air vent. The air supply flowrate depends on the hydraulic losses between the entrance to the air vent and the exit to the cavity beneath the jet.
8. Determine the intersection of the air demand flowrate am air supply flowrate versus average cavity underpressure curves. This point represents the expected prototype air discharge and average cavity underpressure.
300 i ' r 1-4 1'0 m -lrlEl.l070.139
1""r ' a..- O.SOmxl.10m AERATION /0.26 m AIR SUPPLY VENT RAMP ::../'
STA.1+174.43&
EI.1QGt.4H STEP
UPPER RAMP AT STA. 1+174.435
LOWER RAMP AT STA. 1+327.00
Figure. 2 Final Design Aeration Ramps and Supply Vents
3

9. Determine the air concentration in the boundary layer to insure that adequate air is being entrained to provide sufficient protection of the spillway fram cavitation damage. The air concentration in the boundary layer for Uribante spillway was calculated as
c =
where C = air concentration Q = air discharge a Qb = boundary layer water discharge
If the air concentrations are too low, the size of the ramp is increased and the new geometry is analyzed. For Uribante spillway, an air concentration in the prototype boundary layer ranging fram 22 to 30% depending on spillway discharge was predicted at the upper ramp while 26 to 54% was predicted at the lower ramp. Typical cavity underpressu~es at the upper ramp were 0.02 to 0.48 m of water and 0.02 to 0.43 m of water at the lower ramp. It was felt the air concentrations in the boundary layer for the predicted prototype cavity underpressure should be the major consideration in assessing aeration ramp performance.
10. Determine if the boundary layer has reached the surface of the flCM. If the boundary layer is entraining air from the surface then assess the effect on the air concentrations calculated above.
11. Determine the jet trajectory with respect to the spillway surface dCMnstream. The lCMer nappe of the jet should clear the step of the aeration ramp for all flCMS. If the jet hits the step the ramp may be drCMned out by the return flCM and cavitation damage could occur just downstream of the ramp and at the ramp itself.
12. Determine the spillway wall heights required to insure they will not be overtopped by the upper surface of the jet trajectory over the air ramp for the maximum spillway discharge.
13. Determine the jet impact pressures on the spillway floor downstream of the aeration ramp. This is done by an empirical formula verified by model results.
14. Determine the pressures at the spillway surface on the aeration ramp and upstream of the ramp. The finite element analysis provides these pressures.
15. Check the expected air velocities in the air vents. Velocities of less than 50 m/s are desirable for the design flCM. Compressibility effects may influence the accuracy of the analysis of the air supply flowrate if air velocities exceed 100 mls.
16. Performance of the flip-bucket should be observed for the full range of flCMS with the final design aeration ramps.
4

r \
t
Hydraulic Model Studies
Physical model studies for each ramp were made using a 1: 20 scale model of the one half the chute and one wall vent at the Laboratorio Nacional de Hidraulica, Caracas, Venezuela. Froude law scaling was used for similitude purposes. The model simulates 120 m upstream of the aeration ramp and 40 m downstream. (Laboratorio Nacional de Hidraulica, 1982).
The depth of flow upstream of the aeration ramps used in the hydraulic model studies for each discharge investigated were those determined from the boundary layer analysis. The boundary layer growth was calculated assuming a roughness height expected after many years of spillway operation. The depth of flow approaching the ramp was controlled with a sluice flap gate well upstream of the ramp. Visual determination of model throw lengths was impossible. Therefore, the throw lengths in the model were defined by the point of maximum impact pressure on the chute surface downstream of the aeration ramp. The predicted prototype underpressure to produce a boundary layer air concentration of 45 percent was used in the model for each water discharge investigated.
As a result of analytical studies the aeration ramps suggested for initial model study investigation were 10 em by 3.0 m by 1.9 degrees at the upper ramp and 10 cm by 3.0 m by 1.6 degrees at the lower ramp. When the upper ramp was tested in the model it was evident that the performance of the ramp was not satisfactory for 50 m3/s and 100 m 3/s • The 50 m3/s flow flooded the step am did not draw air. The hydraulic model tests for 100 m3/s were considered to be very important because this is the normal maximum spill. For flows of 100 m 3/s and less the flow is expected to be self-aerating from the surface which will provide additional protection from cavitation damage. In the hydraulic model the horizontal portion of the ramp was intermittently full of water due to return flow. The analytical analysis based on the finite element modeling of the jet presently being used cannot predict return flow of the impinging jet. 'lb improve the performance of the aeration ramp at low flows the height of the upper ramp was increased and the size of air vents enlarged. After further analytical studies two geanetries for the upper aeration ramp were then tested in the model. The aeration ramps included a 25 em by 3.0 m by 4.7 degree ramp and a 30 cm by 2.45 m by 7 degree ramp. SOme spray problems were experienced at higher discharges (600 m3/s) in the model studies. The final selected design for the upper ramp was the 25 em by 3.0 cm by 4.7 degree. The initial lower ramp design functioned better in the model than the upper ramp. The lower aeration ramp selected was 30 cm by 3.06 m by 5 degree.
Conclusion
This paper describes the analytical and hydraulic model studies of aeration ramps on Uribante spillway. An analytical procedure for designing aeration ramps on Uribante spillway is presented. This general design procedure and the guidelines presented here have evolved over a period of years and can be applied to aeration ramp design for other projects. The finite element analysis of the flow over the aeration ramps for various underpressures is one of the more important steps in the analytical procedure for the determination of the air demand of the jet. The model testing of the air ramps is a very
5
necessary aspect of the slzlng of aeration ramps. The analytical studies provide a guide as to the desirable geometry of the aeration rarrps. However, these geanetries should be confitmed in hydraulic model studies because of return flow and other effects. We mpe to present a detailed comparison of analytical and model results for Uribante spillway in a future paper.
Fbr Uribante spillway it was necessary to increase the height of the aeration rarrps in order to improve the perfotmance of the ramp for low flow conditions. Scaling between model and prototype is still not clearly defined and the results of the analytical and hydraulic model studies should be assessed carefully. In the case of the studies for the Uribante spillway, the analytical studies were able to assist in the prediction of the expected prototype air discharge cavity underpressure and boundary layer air concentrations.
Appendix.- References
1. Hamilton, W.S., "Aeration of Flow Cown a Spillway." An Unpublished Harza Engineering Company Memorandum, February, 1978.
2. Iaboratorio Nacional de Hidraulica, "Estudio Sobre Modelo Reducido De Las Aireacion Para El Aliviadero De La Presa La Honda" No. 82-05, Octubre, 1982.
3. Wei, C. Y., and DeFazio, F.G., "Simulation of Free Jet Trajectories for the Design of Aeration Devices on Hydraulic Structures," 4th International Conference on Finite Elements in Water Resources, Hannover, F.R.G., June, 1982.
6
--
."

i '"
Key ~rds: Spillways; Aeration RalTps; cavitation; Aeration; Construction Tolerances; Hydraulic Models; Finite Elenent Analysis; Botmdcny layer; Air Slots