Embed Size (px)
Citation preview

The 11th International Days of Statistics and Economics, Prague, September 14-16, 2017
19
ABOUT THE HISTORY OF STATISTICAL CHARTS ON THE
TERRITORY OF THE CZECH REPUBLIC
Michaela Antovová – Prokop Závodský
Abstract
The beginnings of graphical illustration in the statistical literature on our territory are linked
with the name of professor of statistics at the University of Prague Georg Norbert Schnabel.
These are mainly his publications from years 1826–1833. Modern methods of graphical
illustration introduced to its statistical publications Karel Kořistka, organizer of the provincial
statistical service in Bohemia, four decades later. It was especially cartograms (year 1868) and
since year 1872 line graphs to illustrate the long-time series. Here, for the illustration of the
development of several commodities prices in one chart used Kořistka on the vertical axis
logarithmic scale, that is more suitable for comparison of faster and slower growth in the
relative prices of various commodities. Our paper offers an excursion into the history of these
that are using a logarithmic scale and also discusses whether it is possible that those two authors
could know about each other’s research.
Key words: history of statistics, Georg N. Schnabel, Ernst von Schwarzer, Karel Kořistka
JEL Code: B16, B23, N33
Introduction
Unlike other scientific disciplines, the history of statistics in our country is still inadequately
elaborated. The authors of this paper try to gradually contribute to improving this state by partial
papers on the development of statistics in the XIXth and XXth century; see e.g. Závodský (1992),
Závodský and Šimpach (2014, 2015), Kodera, Závodský and Šimpach (2015) etc.
In this paper, we are concerned with the development of graphical illustration1 in
statistical publications at the area of the Czech Republic in XIXth century as statisticians from
the end of XVIIIth century did not used graphs in their work. Continuous introduction of
statistical graphs has three milestones at our area – work of professor of Prague University
Georg Norbert Schnabel in 20s and 30s, economic map of Bohemia by Ernst Schwarzer from
1 In general, the history of graphical representation in statistics is discussed, for example by Beniger and Robyn
(1978).

The 11th International Days of Statistics and Economics, Prague, September 14-16, 2017
20
year 1842 and finally using of modern statistical graphs by professor Karel Kořistka starting in
1860s.
1 Georg Norbert Schnabel
G. N. Schnabel was born in year 1791 in town Bezdružice in Western Bohemia. He graduated
from grammar school in Pilsen and studied philosophy and law at the university in Prague. He
gained a doctorate degree in year 1816 at Vienna university, where he worked for a short time
as an assistant. He was a professor of statistics at Law Faculty of Prague University since 1817.
He took over here a department of law philosophy and criminal law in year 1835. Only in the
more liberal atmosphere after 1848 Schnabel could be elected to be dean and in year 1852 also
to be a rector. He died in year 18572.
Besides the history of Law Faculty of Prague University and law publications, Schnabel
published also 11 books from the field of statistics in years 1819–1848, and also many journal
articles, reviews, etc. His books illustrate the modernization of Central European university
statistics in the three decades. Schnabel’s Statistische Darstellung von Böhmen (1826) is
essentially the first finished description of Bohemia in the spirit of classical university statistics
of Achenwall and Schlözer. Last Schnabel’s gook Tafeln zur Statistik von Böhmen (1848) is
already a modern publication that consists of only tables supplemented by brief analysis and
comments.
In our contribution, we will have a look especially on the statistical graphs, which were
first began to be used by Schnabel in the 1820s. To the brief publication Ueber Raum-3 und
Bevölkerungs-Verhältnisse (Schnabel 1826) are attached appendixes with graphs. The first
graph compares the size of particular lands of Habsburg monarchy using squares of different
colours where the square content corresponded to the acreage of the land (square is drawn one
to the other and “hang out” on one straight line.
Second graph illustrates combination of the number of inhabitants, their density and
national composition in individual countries. The basis of the graph is the size of the area that
belongs to 1000 inhabitants (inverse value of population density), illustrated for each country
by a circle (of a size proportional to the value of this indicator; the centres of the circles lie on
one horizontal line).
2 Frequently stated year 1856 is wrong. 3 In the catalogues of some libraries (including the National Library of the Czech Republic!) and in Google, the
title of the publication is incorrectly transcribed from the decorative font in the Latin to the Latin Ueber Kaum-

The 11th International Days of Statistics and Economics, Prague, September 14-16, 2017
21
Fig. 1: No. of inhabitants of particular countries of the
monarchy on Schnabel’s graph
The numerical figure in the circle represents an index
comparison with the value of the indicator in the most populous
country of the monarchy4 (e.g. for Bohemia was this index 11/3).
Vertical half-tangents of different colours express the number
of inhabitants in round millions (top left Germans, down left
Hungarians, top right Slavs, down right Italians). Elongated
sloping radials show the remaining hundreds of thousands of
inhabitants (nationality is again expressed in colour and
direction; auxiliary lines allow reading of values). This graph,
especially for the presentation of the number of inhabitants is
not particularly illustrative – see Fig. 1.
Two large appendixes5 to General statistics6 (Schnabel
1829a) – to 1st and 2nd issue – consist of similar statistical
graphs in combinative set with geographical schemes and
statistical tables. While in the case of tables it is possible to
appreciate their clarity and selection of interesting data,
statistical graphs here barely make progress against the
previous publication. Schnabel depicts the size and population
of European states this time by a coordinate graph in which the
number of inhabitants is recorded for each state on the vertical
axis, the extent of the population on the horizontal axis, and to
the line between these two points he writes the population
density. Due to the considerable number of European countries
compared, the chart is generally unclear. Even more due to the
fact, that the author does not respect (on any axis) the scale and,
in some cases, the ranking of the states.
4 This was the Lombard-Venetian Kingdom, at that time part of the Austrian
Empire. 5 They were published also individually as Schnabel (1829b). 6 General statistics was in the era of university statistics the description of
wide empire or the whole part of the world or its important part. The
description of one country or smaller state was called special statistics.
The 11th International Days of Statistics and Economics, Prague, September 14-16, 2017
22
Second of previously described graphs is modified so that the circles are replaced by
squares and instead of tangents and radials are supplemented by different ranking numbers.
Illustration of the length and size of the catchment area of the eight most important European
rivers is simple and clear. In the graphs of the altitudes of the Austrian and other European
mountains (two variants of the graph) can be seen the predecessor of the pictograms. Some
clarity cannot be denied also to a historical rather than a statistical, somewhat monstrous graph,
presenting the territorial development of the Habsburg monarchy and the succession of
sovereigns in the individual countries (forming the Austrian Empire at the time of the creation
of this book)7.
Schnabel for his graphs usually used without much changes originals of other authors.
A comparison of the size of European states with a set of interlocking squares has already been
found in Crome’s Grössen-Karte von Europa from year 17858. Verhältniss-Karte of the same
author from year 1820 illustrates the number of inhabitants and their density in particular
German states using above described circles (with tangents and radials). For graphic
representation of the height of the mountains, Schnabel used probably an article by von Gothe
Höhen Tableau from year 18139 or work of one of his followers10.
2 Ernst von Schwarzer
Ernst Schwarzer von Heldenstamm (1808-1860) was born in Fulnek in Moravia in a family of
an officer. He attended a cadet school, served with artillery, but then worked mostly as a
journalist. He was elected to the parliament in Frankfurt am Main in year 1848, and to the
Reichstag in Vienna, and for a short time he was the Austrian Minister of Public Works.
Industrial Union (Verein zur Ermunterung des Gewerbsgeistes in Böhmen), that started
its activities in Bohemia in year 1833, had from the beginning an interest in industrial statistics.
The Industrial Union established its own statistical office, the first statistical office in the
territory of today's Czech Republic, in year 1841. This office was in year 1842 managed by
approximately for a year by Ernst Schwarzer. During this period he assembled and published a
7 Graph has a form of monstrous huge river (he co-ordinates at the shoreline indicate the run of time), which has
been spreading over the centuries from several rivers (Bohemia, Moravia, Austria, Hungary, etc.), with minor
tributaries showing later territorial gains. Time frame is from Přemysl Oráč to František I. 8 A. F. W. Crome (1753-1833) was a professor of university in Gießen and a pioneer of graphical illustration in
statistics. Here mentioned publication was an attachment of Crome's book Ueber die Grösse und Bevölkerung der
sämtlichen europäischen Staaten. 9 In: Allgemeine geographische Ephemeriden, vol. 41, pp. 1 and following. 10 See Závodský (1992), pp. 86-88.

The 11th International Days of Statistics and Economics, Prague, September 14-16, 2017
23
map of industry in Bohemia – Schwarzer (1842). It is the first cartographic work with
economical-statistical thematic at our territory.
Relatively detailed map (53 x 60 cm, scale 1 : 547 000) contains besides basic
topographic information also former administrative division of the land, transport and post
network and especially the distribution of different areas of industrial and handicraft production
at the Bohemian territory (using 136 types of marks). Despite its details, the map is quite clear
- mainly due to the colour differentiation of the basic production sectors - illustration in Fig. 2.
Fig. 2 – Sample from Schwarzer’s Industrie-Karte
Source: Schwarzer (1842).
3 Karel Kořistka
Karel Kořistka was born in year 1825 in Moravia in Březová nad Svitavou. After studies of the
grammar school in Jihlava and Brno, he attended Philosophical faculty (then propedeutic) of
the Vienna University. Then graduated from the Mining and Forestry Academy in Banská

The 11th International Days of Statistics and Economics, Prague, September 14-16, 2017
24
Štiavnica. He was a professor of mathematics and geodetics in years 1851–1893 at polytechnic
in Prague. He was elected its first rector after the reorganization on two-language Technical
university (since year 1864). He was promoted to a knightly state (with a gold geodetic tower
in a coat of arms) for his merits in the development of geodesy, cartography and geography,
and the organization of technical higher education in the monarchy in year 1879.
Fig. 3 – Cartogram of potato yields in Bohemia in year 1868
Source: Zpráva o činnosti ústředního výboru pro statistiku polního a lesního hospodářství v království Českém za
rok 1868, (Prague 1869) – reduced.
From the multifaceted activities of the Kořistka we are interested mainly in the long-
term management of agricultural statistics in Bohemia. In year 1864 Kořistka became a member
of Central Committee for Field and Forestry Statistics of the Kingdom of Bohemia and at the
beginning of year 1868 he took up exhausting function of the leader of his executive body – the

The 11th International Days of Statistics and Economics, Prague, September 14-16, 2017
25
Statistical Office, which, despite very limited personnel and financial possibilities, showed
agile activity11.
Central Committee and its Statistic Office published annually the Report on their
activities in German and Czech (Zpráva o činnosti 1867– ...). They contained an overview of
the activities in previous year and table summarization and analysis of surveyed realities.
Already in the Report about activities for year 1868, there is published six colour cartograms
whose author is professor Kořistka (see Fig. 3). Similar cartograms Kořistka created also for
some other volumes of the Reports. They report not only the yields of different crops, but also
the distribution of damage due to natural disasters, the intensity of afforestation of individual
districts, the proportion of beef cattle per 100 inhabitants etc.
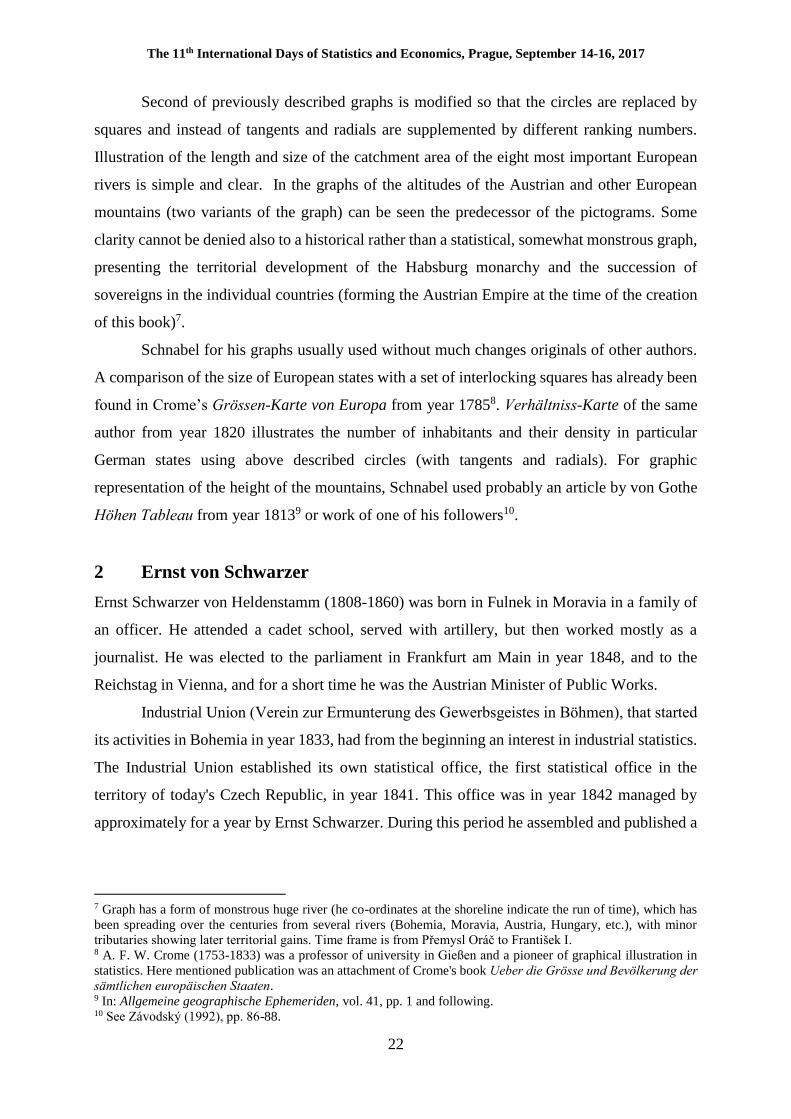
Starting with Reports for year 1872 there are in some years published line graphs
illustrating long time series, mostly the development of prices of various agricultural products.
It is the first usage of such graphs in statistical literature on our territory. Kořistka explains here
in detail the possibilities of usage of different scales on vertical axes. In the case of graph
expressing the development of the price of one commodity, it is possible to use usual uniform
scale. However, if we want to illustrate the development of prices of several types of
commodities in one graph, usual scale does not enable to correctly capture relatively faster
growth in the price of a cheaper product (e.g. potatoes) against a relatively slower rise in the
price of more expensive commodities (e.g. wheat). Therefore, Kořistka uses in some graphs on
vertical axes logarithmic scale, that is justified in a text. Because of the labour and financial
demands of making and printing such graphs, it was necessary to abandon them in some years,
otherwise the graphs were usually made with bilingual descriptions for publication in the Czech
and German versions.
When in 50th years of XIXth century started from the initiative of famous Belgium
statistician Adolphe Quételet an international cooperation of statisticians started to
continuously develop, also professor Kořistka played an active role there. At 3rd International
Statistical Congress in Vienna (1857) he worked in section for graphic illustration in statistics.
As a leader of the statistical office Kořistka already regularly took part at the Negotiations of
the congresses – in Haag (1869), in Saint Petersburg (1872) and in Budapest (1876). In the last
mentioned he successfully presented a statistic of the forests in Bohemian and his own
methodology of statistical graphs).
11 See Závodský and Šimpach (2016a); Závodský and Šimpach (2016b).

The 11th International Days of Statistics and Economics, Prague, September 14-16, 2017
26
Fig. 4 – Graph of the development of the prices of corn in Bohemia in years 1800–1890
(using normal scale)
Source: Zprávy statistické kanceláře zemědělské rady pro království České za léta 1891-1892, (Prague 1893) –
reduced.
He also presented the successes of the land statistics in Bohemia as a member of the
International Statistical Institute (since year 1889), especially at meetings in Kristiania (todays
Oslo – 1899) and in Budapest (1901).

The 11th International Days of Statistics and Economics, Prague, September 14-16, 2017
27
Professor Kořistka established the Land Statistical Office in Bohemia (1898) and
became the head of his statistical office (1898). He retired only at the age of 80 and died soon
after (19th January 1906).
Conclusion
In our article we describe the gradual introduction of graphic representation in statistical
literature on our territory during the XIXth century. The first stage was the publication of a long-
time professor of statistics at the University of Prague, G. N. Schnabel. Has been inspired by
the work of classical statisticians Achenwall and Schlözer in his pedagogical work12 and in rich
publishing activities. A remarkable contribution to the development of statistical graphs in the
Czech lands was Statistical-topographical industrial map of Bohemia, the first work of this
type at our territory, from E. Schwarzer, rather occasional statistician.
Beginnings of modern statistical graphs are linked at our territory with the activities of
K. Kořistka in land statistical service in Bohemia in the last third of XIXth century. Kořistka as
experience university professor of mathematics and geodesy introduced the usage of cartograms
and line graphs of time series (also with logarithmic scale on axis y) to statistics at our territory
and became also an internationally recognized personality in area of statistical graphs.
Acknowledgment
Supported by the Internal Grant of the University of Economics Prague no. 39/2017 “Initial
development of activities of the State Statistical Office”.
References
BENIGER, J., ROBYN, D. L. (1978). Quantitative Graphics in Statistics: A Brief History. The
American Statistician, vol. 32, iss. 1, pp. 1–11.
KODERA, J., ZÁVODSKÝ, P., ŠIMPACH, O. (2015). Jan Stocký, Southern Bohemia and
Mathematical Methods in Economics. In: Applications of Mathematics and Statistics in
Economics – AMSE 2015. Prague: University of Economics, Prague, 11 p.
SCHNABEL, G. N. (1826). Ueber Raum- und Bevölkerungs-Verhältnisse der österreichischen
Länder. Prag 1826.
SCHNABEL, G. N. (1829a). General-Statistik der europäischen Staaten mit vorzüglicher
Berücksichtung des Kaiserthumes Oesterreich I-II. Prag 1829.
12 However, he was here limited by obligatory literature prescribed by Vienna offices.

The 11th International Days of Statistics and Economics, Prague, September 14-16, 2017
28
SCHNABEL, G. N. (1829b). Zwey geographisch-statistische Übersichtskarten. Prag 1829.
SCHWARZER, E. v. (1842). Statistisch-topographische Industrie-Karte des Koenigreiches
Boehmen. Prag 1842.
ZÁVODSKÝ, P. (1992). Vývoj statistické teorie na území Československa do roku 1848. Praha:
FSÚ a Infostat, pobočka Praha.
ZÁVODSKÝ, P., ŠIMPACH, O. (2014). J. N. Müllner and the Beginnings of Demographic
Statistics in the Czech Lands. In: The 8th International Days of Statistics and Economics. Slaný:
Melandrium, pp. 1687–1695.
ZÁVODSKÝ, P., ŠIMPACH, O. (2015). Statistical and Topographical Description of the
Czech Lands in the 18th and 19th Century. In: The 9th International Days of Statistics and
Economics. Slaný: Melandrium, pp. 1804–1813.
ZÁVODSKÝ, P., ŠIMPACH, O. (2016a). The Development of Provincial Statistical Office in
Bohemia in Historical Context. In: The 10th International Days of Statistics and Economics.
Slaný: Melandrium, pp. 2096–2106.
ZÁVODSKÝ, P., ŠIMPACH, O. (2016b). Karel Kořistka and the Provincial Statistical Service
in the Czech Lands. In: AMSE 2016 (Applications of Mathematics and Statistics in Economics).
Banská Bystrica: Občianske združenie Financ, pp. 387–398.
Zpráva o činnosti ústředního výboru pro statistiku polního a lesního hospodářství v království
Českém. Praha 1867 – ...13
Rechenschafts-Bericht über die Thätigkeit des Central-Comité für die land- und
forstwirthschaftliche Statistik Böhmens. Prag 1867 – ...
Contact
Michaela Antovová
University of Economics Prague, Faculty of Informatics and Statistics
W. Churchill sq. 4, 130 67 Prague 3, Czech Republic
Prokop Závodský
University of Economics Prague, Faculty of Informatics and Statistics
W. Churchill sq. 4, 130 67 Prague 3, Czech Republic
13 The report was published in the Czech and German language every year and changed its name many times.