Embed Size (px)
Citation preview
STATISTICAL POCKET-BOOK
OF THE
UNION TERRITORY
OF
GOA. D AM AN AND DIU
1984
N IEPA DC
D03071DEEIBCTORATE O P PLANNINCk. STATISTIC S AND
EKAL.UATION
GOVERNMENT O F GOA, DAM AN AND DJU.
QQ-.ifi ike complimenis
Ilird Hoor, Junta Annex, Svam Vivekanand Road,
Panaji-G oa.
J. N. AGRAWALDIRECTOR
Directorate of Planning, Statistics and Evaluation,
Govt, of Goa, Daman and Diu
Sub. National Systems Unit, National Instinjtc of EducationalPlrnmng r i A ministration 17-B,SnAuiV i.do M argJsew pe lh i-110016
DOC. N o .. . .3 Q r r » L L .T ^
GOA, DAMAN <S DIU
PREFACE
The current issue of the Statistical Pocket Book for 1984 is eighteenth in the series. It presents in a comfact form essential information pertaining to differert sectors of the economy of the Union Territojy of Goa, Daman and Diu. Every endeavour has been made to incorporate the latest data available. II is hoped tliat the Pocket Book will be useful fcs a reference book to all those seeking such statisticil information.
The continued and geneirous cooperation extended by the Heads of Departments of the Government and otker public sector undertakings and private agencies in furnishing the required data is gratefully acknowledged.
The Pocket Book has been compiled in DivisionIII of the Directorate under the supervision of Shri S. M. Naik, Statistical Officer who in the task w£s assisted by Shri P. O. Colaco, Research Assistait. My thanks are due to all of them and, in particular to Kumari Rupa N. Raikar who put in hard and svistained efforts. My thanlcs are also
due to Shri G. V. Kamat, Joint Director fo-r ’ the valuable sugrgestions made by him at diflfererent stages and effecting improvements.
Although the Pocket Book is for the year 181984, information regarding the composition of the Couiuncil of Ministers, formed in January, 1985 has b«been incorporated. Improvements elsewhere have also b'been made in the presentation of information.
While continuous efforts are made to improve j the scope and contents of this publication, sugge^titions from users are always welcome.
J. N. AgrawcU Director
Tel. 4935
Panaji, lltli March, 1985.
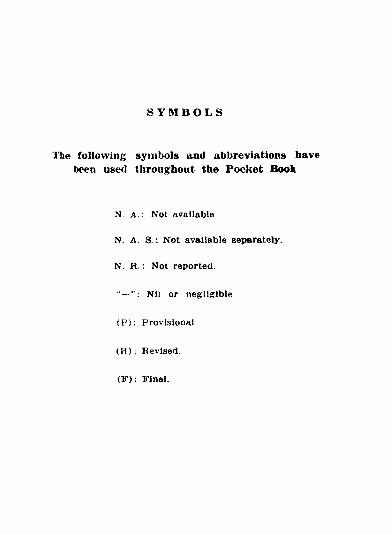
S Y M B O L S
The following symbols and abbreviations have been used throughout the Pocket Book
N A .: Not available
N. A. S .: Not available separately.
N. R . : Not reported.
Nil or negligible
<F): Provisional.
( R ) : Revised.
(F ) : Final.

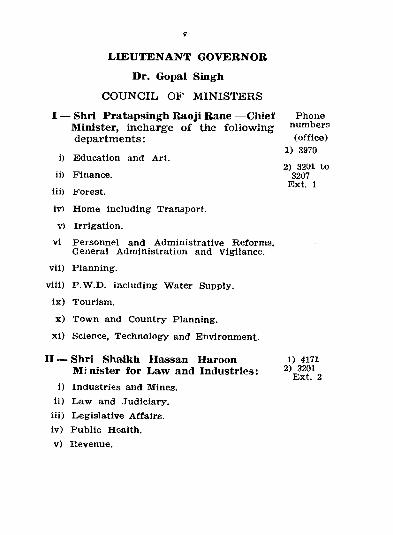
LIEUTENANT GOVERNOR Dr. Gopal Singh
COUNCIL OF MINISTERSI — Shri Pratapsingh Raoji Rane — Chief Phone
Minister, incharge of the following numbersdepartments: (o ffice )
1) 3970i) Education and Art.
2) 3201 toii) Finance. 3207
Ext. 1iii) Forest.
iv) Home including Transport.
V ) Irrigation.
vi Personnel and Administrative Reform s,General Adm inistration and Vigilance.
vii) Planning.
viii) P .W .D . including W ater Supply.
ix ) Tourism .
x ) Tow n and Country Planning.
x l) Science, T echnology and Environment.
II — Shri Shaikh Hassan Haroon i) 4171Minister for Law and Industries:
i) Industries and Mines.ii) Law and Judiciary.
iii) Legislative Affairs.iv) P ublic HOAlth.v) Revenue.
V i
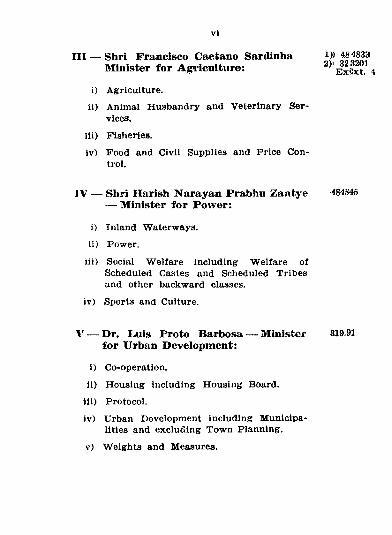
m — Shri Francisco Caetano Sardinha D)Minister for Ag>riculture: Ex5xt 4
i) Agriculture.ii) Animal Husbandry and Veterinary Ser
vices.
lii) Fisheries.
iv) Food and Civil Supplies and P rice Control.
IV — Shri Harish Narayan Prabhu Zantye 484845 — Minister for Power:
i) Inland W aterways.
i i ) Power.
iii) Social W elfare including W elfare o f Scheduled Castes and Scheduled Tribes and other backward classes.
iv) Sports and Culture.
V — Dr. Liuis Proto Barbosa — Minister 819 for Urban Development:
i) Co-operation.
ii) H ousing including H ousing Board.
Hi) Protocol.
iv) Urban Development including M unicipalities and excluding Tow n Planning.
v) W eights and Measures.
vil
VI — Shri Viiikimth Govind Desai — Mi- 4277 nister for Labour & Employment:
1) Information.
ij) Labour and Employment.
iii) Panchayati Raj and Community Development.
iv> Provedoria and P ublic Assistance.
The departments which are not included In this list .shall continue to be under the Chief Minister.
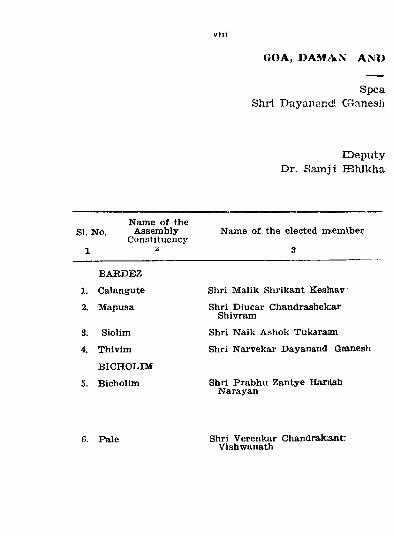
GOA, DAMAN AND
Spea Shri Dayanand Gianesli
IDeputy Dr. Samj:i Khikha
SI. No.Name o f the
Assem bly Constituency
Name o f the elected miemlber
3
BARDBZ
1. Calangute
2. Mapusa
3. Siolim
4. Thivim
BICHOL.IM
5. Bicholim
Shri M alik Shrikant KesKiav
Shri Diucar Chandrashefcar Shivram
Shri Naik Ashok Tukarann
Shri Narvekar Dayanand Gsanesh
Shri Prabhu Zantye Hanish Narayan
6. Pale Shri Verenkar Chandrakantc Vishwanath
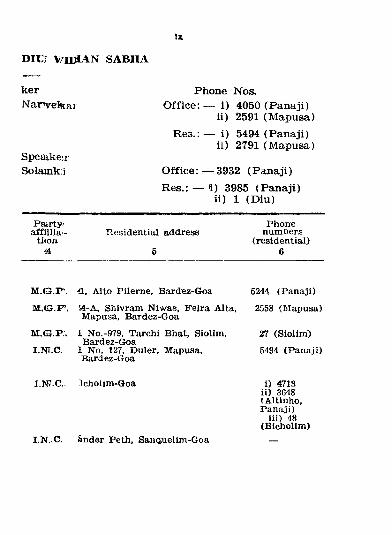
DIi;j SABHA
U
kerNar^elkai
Speaike'.rSolamk;i
Phone Nos,Office; — i) 4050 (Panaji)
ii) 2591 (Mapusa)Res.: — i) 5494 (Panaji)
ii) 2791 (Mapusa)
Office:— 3932 (Panaji)Res.: — 1) 3985 (Panaji)
ii) 1 (Diu)
Pairty;^a ffillla -
ticon.Residential address
5
PhonenumDers
(residential)6
M .G .P '. <1, Alto Pilerne, Bardez-Goa 5244 (P anaji)
M.CGr.F*. !4-A. Shivram Niwas, Feira Alta, 2558 (Mapusa) Mapusa, Bardez-Goa
M.G5.P.. I NO.-979, Tarchi Bhat, Siolim, 27 (Siolim )Bardez-Goa
I.NI.C. 1 No. 127, Duler, Mapusa, 5494 (Panaji)Bardez-Goa
I.NT.C. ^cholim-Goa
I.N..C. Sinder Peth, Sanq,uelim-Goa
i) 4713ii) 3648 (Altinho, P anaji)
iii) 48 (Bicholim )
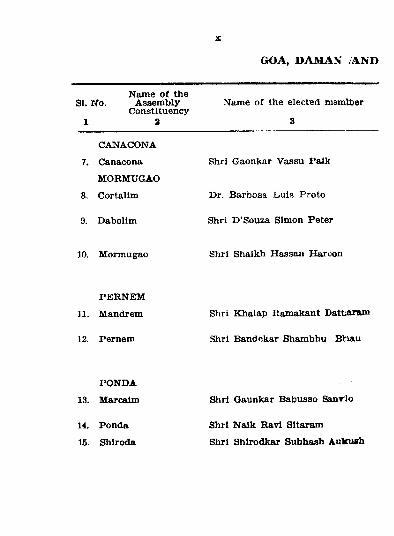
GOA, DAAIAX AJND
Name o f the SI. No. Assem bly
Constituency 1 2
Name o f the elected memtber
3
CANACONA
7. Canacona
MORMUGAO
8. Cortalim
9. Dabolim
Shri Gaonkar Vassu Palk
Dr. Barbosa Luis Proto
Shri D ’Souza Simon Peter
10. M ormugao Shri Shaikh Hassan Haroon
PERNEM
11. Mandrem
12. Pernem
Shri Khalap Ramakant Dattar&m
Shri Bandekar Shambhu Bltuiu
PONDA
13. Marcalm
14. Ponda
15. Shiroda
Shri Gaunkar Babiisso Sanrlo
Shri Naik Ravi Sitaram
Shri Shirodkar Subhash A nkiuh
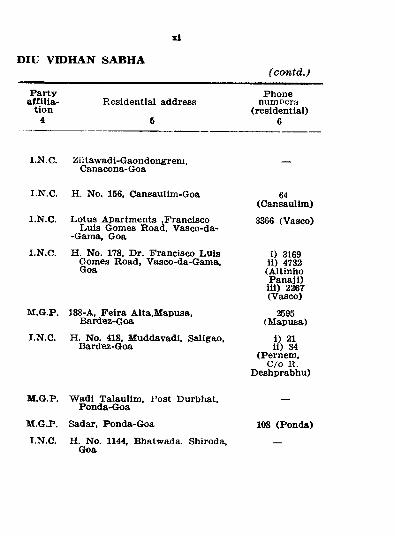
DIU VroHAN SABHA(contd.)
P artya ffilia
tionResidential address
6
Phonenumoers
(residential)6
I.N.C. 2iltawadi-Gaondongreni, Canacona-Goa
I.N.C. H. No. 156, Cansaulim-Goa
I.N.C. Lotus Apartments .Francisco Luis Gomes Road, Vasco-da-
-Gama, Goa
I.N.C. H. No. 178, Dr. Francisco Lula Gomes Hoad, Vasco-da-Gama, Goa
M.G.P. 188-A, Feira Alta.Mapusa, Bardez-Goa
I.N.C. H. No. 418, Muddavadi, Saligao, Bardez-Goa
64(Cansaullm)
3366 (Vasco)
i) 3169 11) 4732 (Altinho Panajl) iii) 2267 (Vasco)
2595(Mapusa)
1) 21 li) 34
(Pem em , C /o R.
Deshprabhu)
M.G.P. W adi Talaulim, Post Durbhat, Ponda-Goa
M.G.P. Sadar, Ponda-Goa
I.N.C. H. No. 1144, Bhatwada, Shiroda, Goa
108 (Ponda)
XU
GOA, DAMAN AND
Name o f the SI. No. Assem bly
Constituency1 2
Name o f the elected memlber
3
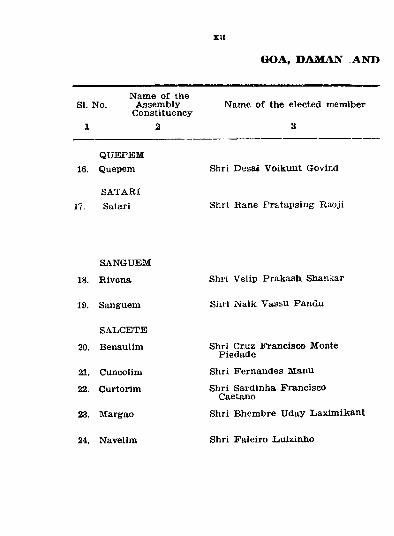
QUEPEM 16. Quepem
SATARI J7. Satari
Shri Desai Voikunt Govirxd
Shri Rane Pratapsing Raoji
SANGUEM
18. Rivona
19. Sanguem
SALCETB
20. Benaulim
21. Cuncolim
22. Curtorim
23. Margao
24. Navellm
Shri Velip Prakash Shan'^ar
Shri Naik Vassu Pandu
Shri Cruz Francisco Monte Piedade
Shri Fernandes Manu
Shri Sardinha Francisco Caetano
Shri Bhem bre Uday Laximiikant
Shri F aleiro JLuizinho
xiil
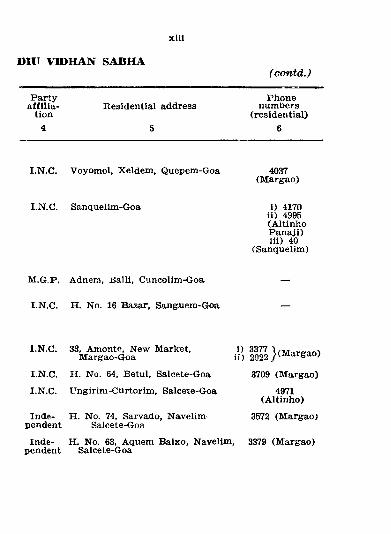
DIIT VroHAN SABHA(contd.)
Partyaffilia
tionResidential address
5
Phonenumbers
(residential)
I.N.C. Voyomol, Xeldem , Quepem-Goa 4037(M argao)
I.N.C. Sanquelim-Goa i ) 4170ii) 4995 (A ltinho P anaji)iii) 40
(Sanquelim)
M.G.P. Adnera, Balli, Cuncolim-Goa
I.N.C. H. No. 16 Bazar, Sang.uem-Goa
I.N.C. 33, Amonte, New Market, M argao-Goa
I.N.C. H. No. 64, Betul, Salcete-Goa
I.N.C. Ungirim-Curtorim, Salcete-Goa
H)
3709 (M argao)
4971(A ltinho)
3572 (M argao;Inde- H. No. 74, Sarvado, Navelini' pendent Salcete-Goa
Inde- H. No. 63, Aquenx Baixo, Navelim, 3379 (M argao) pendent Salcete-Goa
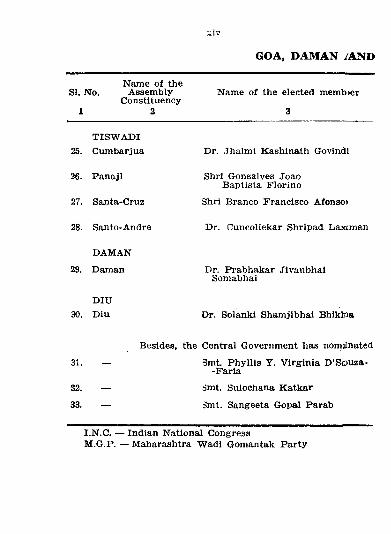
GOA, DAMAN iAND
SI. No.Name o f the
Assem bly Constituency
2
Name o f the elected memb>er
3
T ISW A D I25. Cumbarjua
26. Panajl
27. Santa-Cruz
28. Santo-Andre
DAMAN
29. Daman
DIU30. D iu
Dr. Jhalmi Kashinath Govindl
Shri Gonsalves Joao Baptista F lorino
Shrl Branco Francisco Afonso)
Dr. Cuncoliekar Shripad Laxcman
Dr. Prabhakar Jivanbhai Somabhai
Dr. Solanki Shamjibhai Bhiklna
Besides, the Central Government has nomiinated
31. — 3mt. P hyllis Y. V irgin ia D ’Souza--Faria
32. — Smt. Sulochana Katkar
33. — Smt. Sangeeta Gopal Parab
I.N.C. — Indian National CongressM.G.P. — Maharashtra W adi Gomantak Party
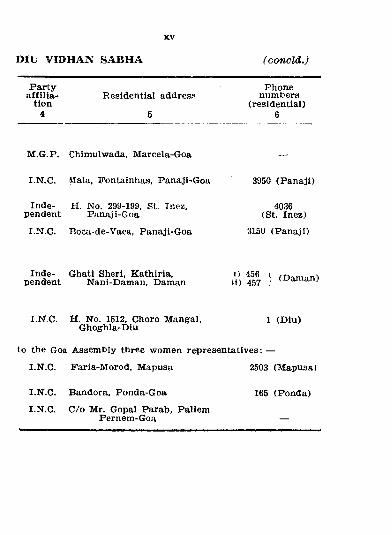
D IU V ro H A N S A B H A ( concld.)
P artyaffilia
tion4
Residential address
6
Phonenumbers
(residential)6
M .G.P. Chimulwada, M arcela-Goa
I.N.C. (llala, Fontainhas, Panaji-Goa 3950 (Panajl)
Inde- H. No. 299-199, St. Inez, 4036pendent Panaji-Goa (St. Inez)
I.N.C. Boca-de-Vaca, Panaji-G oa 3150 (Panajl)
Inde- Ghati Sheri, Kathiria, pendent Nani-Daman, Daman I'l) 1
I.N.C. H. No. 1512, Choro Mangal, Ghoghla-Diu
1 (Diu)
to the Goa Assem bly three women representatives: —
I.N.C. Paria-M orod, Mapusa 2603 (Mapusa)
I.N.C. Bandora, Ponda-Goa
I.N.C. C /o Mr. Gopal Parab, Paliem Pernem-Goa
165 (Ponda)
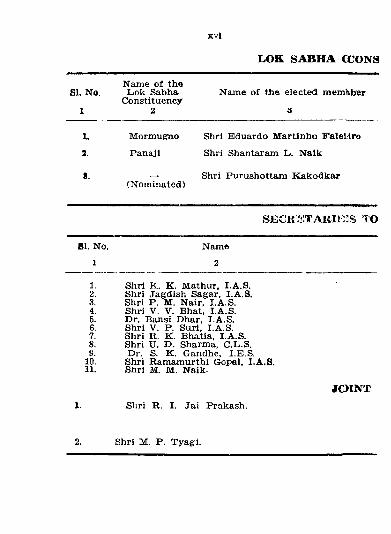
LOK 8ABHA CCONS
xvl
Name o f theSI. No. L ok Sabha Name o f the elected raemhber
Constituency 1 2 a
L M orm ugao Shri Eduardo M artinho Faleldro
2. Panajl Shri Shantaram L. Naik
(Nom inated)Shri Purushottam K akodkar
SECRSTABIKCS TO
SI. No. Name1 2
1. Shri K. K . Mathur, I.A.S.2. Shri Jagdish Sagar, I.A.S.3. Shri P. M. Nair, I.A.S.4. Shri V. V. Bhat, I.A.S.6. Dr. Bansi Dhar, I.A.S.6. Shri V. P . Suri, I.A.S.7. Shri R. K. Bhatia, I.A.S.8. Shri U. D. Sharma, C.L.S.9. Dr. S. K. Gandhe, I.E.S.
10. Shri Ram am urthi Gopel, I.A.S.11. Shri M. M. Naik.
J O IN TShri R. I. Jai Prakash.
Shri M. P. Tyagi.
xvil
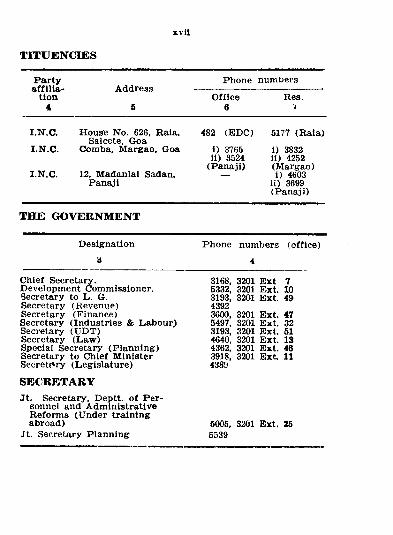
TITUENCBES
P artyaffilia
tion4
Address
S
Phone numbers
Office6
Res.
I.N .C. House No. 626, Raia, Salcete, Goa
I.N.C. Comba, M argao, Goa
I.N.C. 12. Madanlal Sadan, Panaji
482 (E D O 5177 (Rala)
i) 3765ii) 3524
(Panaji)
i) 3832ii) 4252 (M argao)i) 4603
ii) 3699 (Panaji)
THE GOVERNMENT
Designation3
Chief Secretary.Development Commissioner. Secretary to L. G.Secretary (Revenue)Secretary (Finance)Secretary (Industries & Labour) Secretary (U DT)Secretary (Law )Special Secretary (P lanning) Secretary to Chief M inister Secretf*ry (Legislature)
SECRETARYJt. Secretary, Deptt. o f P er
sonnel and Adm inistrative Reform s (Under training abroad)
Jt. Secretary Planning
Phone numbers (office)
4
3168, 3201 Ext 75332, 3201 Ext. 103193, 3201 Ext. 4943923600, 3201 Ext. 475497, 3201 Ext. 323193, 3201 Ext. 514640, 3201 Ext. 134362, 3201 Ext. 463918, 3201 E x t 114389
6005, 3201 Ext. 25 5539
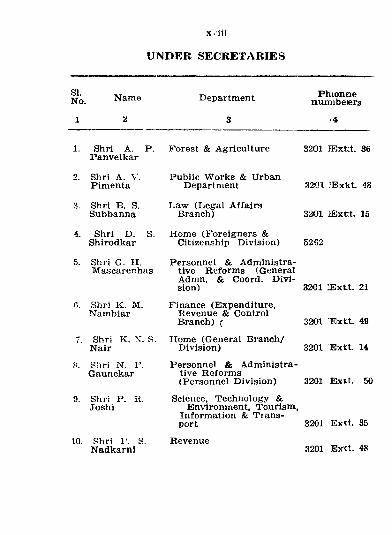
UNDER SECRETARIES
x.’iii
SI.No. Name Department
3
Phioneienumibeiers
1. Shri A. P. Panvelkar
Shri A. V. Pim enta
3. Shri B. S. Subbanna
4. Shri D. S. Shirodkar
5. Shri G. H. M ascarenhas
0. Shri K . M. Nambiar
Forest & Agriculture
7. Shri K. X. S. Nair
8. Hhri N. P. Gaunekar
9. Shri P. R. Joshi
10. Shri V. S. Nadkarnl
Public W orks & Urban Department
Law (Legal A ffairs Branch)
Home (Foreigners & Citizenship Division)
Personnel & Adm inistrative R eform s (General Admn. & Coord. D ivision)
Finance (Expenditure, Revenue & Control Branch) (
Home (General B ranch/ D ivision)
3201 }Ext;t. 36
32'01 JBxtet. 48
32(01 lE xtt. 16
5262
3201 lExtt. 21
3201 ^Extt. 49
3201 Extt. 14
Personnel & Adm inistrative Reform s(Personnel D ivision) 3201 E xit. 50
Science, Technology &Environment, Taurism ,
Inform ation & Transport
Revenue
3201 E x tt . 35
3201 ExKt. 48
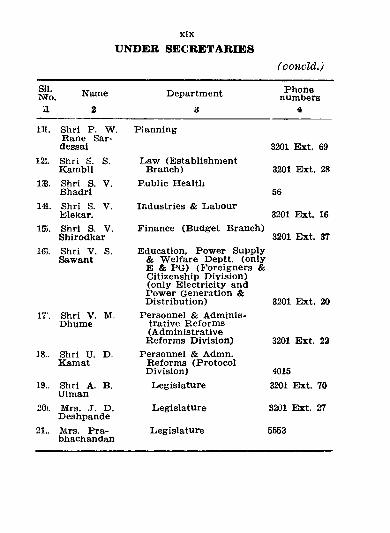
xixUNDER SECRETARIES
( concld.)
Sll.NTo. Name Department Phone
numbers2 d 4
111. Shri P. W . Rane Sar- dessai
Planning
3201 Ext. 6912!. Shri S. S.
KainbliLaw (Establi.shment
Branch) 3201 Ext. 2813. Shri S. V.
BhadriPublic Health
56141. Shri S. V.
Elekar.Industries & L abour
3201 Ext. 16155. Shri S. V.
ShirodkarFinance (B udget Branch)
3201 Ext. 37163. Shri V. S.
SawantEducation, P ow er Supply
& W elfare Deptt. (on ly E & PG) (P’oreigners & Citizenship D ivision) (on ly E lectricity and P ow er Generation & Distribution) 3201 Ext. 20
IT. Shri V. M. Dhume
Personnel & A dm inistrative R eform s (Adm inistrative Reform s D ivision) 3201 Ext. 22
18.. Shri U. D. Kam at
Personnel & Admn. R eform s (P rotocol D ivision) 4015
19.. Shri A. B. Ulman
Legislature 3201 Ext. 70
20). Mrs. J. D. Deshpande
Legislature 3201 Ext. 27
21.. Mrs. Pra- bhachandan
Legislature 5553
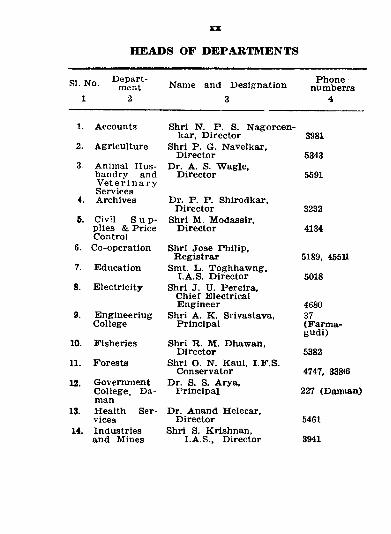
HEADS OF DEPARTMENTS
SI. No. Department
1 2Name and Designation
3
Phonenumberrs
4
1. Accounts
2. Agriculture
3. Animal H usbandry and V e t e r in a r y Services
4 . Archives
6. Civil S u p- plies & Price Control
6. Co-operation
7. Education
8. E lectricity
9. Engineeriug College
10. Fisheries
11. Forests
13. Government College, Daman
18. Health Services
14. Industries and Mines
Shri N. P. S. N agorcen- kar, D irector
Shri P. G. Navelkar, D irector
Dr. A. S. W agle,D irector
Dr. P. P. Shirodkar, D irector
Shri M. M odassir, D irector
Shri Jose Philip, R egistrar
Smt. L. Toghhawng,I.A . S. D irector
Shri J. U. Pereira, Chief Electrical Engineer
Shri A. K. Srivastava, Principal
Shri R. M. Dhawan, D irector
Shri O. N. Kaul, I.F .S .Conservator
Dr. S. S. Arya, Principal
Dr. Anand Helecar, D irector
Shri S. Krishnan, I.A .S., D irector
3981
5343
5591
3232
4134
5189, 455U
5018
468037(Farm a-gudi)
5382
4747, 338(6
227 (Damian)
5461
3941
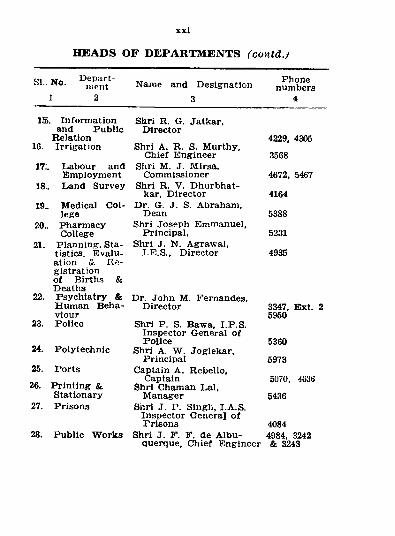
xxi
HEADS OF DEPARTMENTS (contd.)
SI.. No. 1
Department
2Name and Designation
3
Phonenumbers
4
15. Inform ation and P ublic
Relation16. Irrigation
17.. Labour and Employment
18.. Land Survey
19„ Medical C ollege
20.. Pharmacy College
21. Planning, Statistics, Evaluation & R egistrationo f Births & Deaths
22. Psychiatry & Human Behaviour
23. Police
24. Polytechnic
25. Ports
26. P rinting &Stationary
27. Prisons
28. P ublic W orks
Shri R. G. Jatkar, D irector
Shri A. R . S. Murthy, Chief Engineer
Shri M. J. Mirsa, Commissioner
Shri R. V. Dhurbhat- kar. D irector
Dr. G. J. S. Abraham, Dean
Shri Joseph Emmanuel, Principal,
Shri J. N. Agrawal, I.E.S., Director
Dr. John M. Fernandes, D irector
4229, 4305
3568
4672, 5467
4164
5388
5231
4935
3347, Ext. 2 5950
Shrt P. S. Bawa, I.P .S.Inspector General o f Police
Shri A. W . Joglekar,Principal
Captain A. Rebello,Captain
Shri Chaman Lai,Manager
Shri J, P. Singh, I.A.S.Inspector General o f Prisons
Shri J. F. F. de A lbuquerque, Chief Engineer & 3243
5360
5973
5070, 4636
5436
40844984, 3242
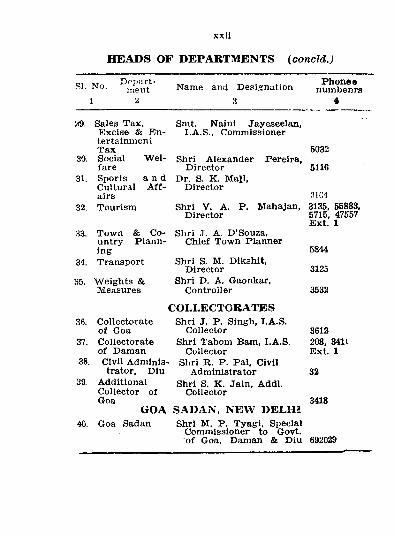
xxll
HEADS OF DEPARTMENTS (concld.J
SI. No. 1
Department Name and Designation
3
P honeeiiumbenrs
4
29. Sales Tax,E xcise & Entertainment T ax
30. Social W elfare
31. Sports a n d Cultural A ffairs
32. Tourism
H3. Tow n & Country Planning
34. Transport
35. W eights &Measures
Smt. Naini Jayeseelan,I.A.S., Commissioner
Shri Alexander Director
Dr. S. K. Mall, D irector
Pereira,5032
5116
Shri V. A. Director
P. Mahajan, 3135, 55883.5715, 47557 Ext. 1
Shri J. A. D ’Souza,Chief Tow n Planner
Shri S. M. Dikshit,Director
Shri D. A. Gaonkar,Controller
COLLECTORATES36. Collectorate Shri J. P. Singh, I.A.S.
of Goa Collector37. Collectorate Shri Tabom Bam, I.A.S.
o f Daman Collector38. Civil Adm inis- Shri R . P. Pal. Civil
trator, Diu Administrator39. Additional sh ri S. K. Jain, Addl.
Collector o f CollectorGoa
GOA SAD AN, NEW DELHI40. Goa Sadan Shri M. P. Tyagi. Special
Commissioner to Govt, o f Goa, Daman & Diu 692029
5844
3125
3532
3612208, 3411 Ext. 1
32
3418
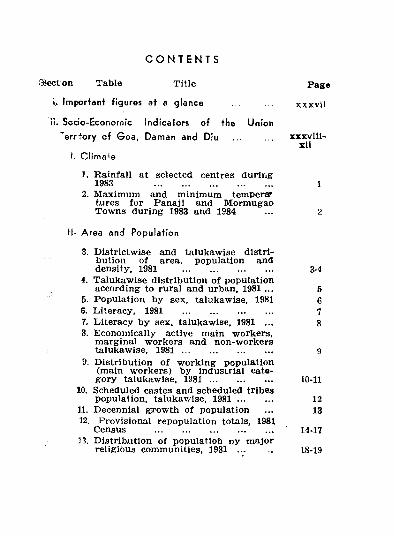
C O N T E N T S
SJecton Table Title
i. Important figures at a glance
ii. Socio-Economic Indicators of the Union
""errfory of Goa, Daman and Diu
I. Climaie
1. Rainfall at selected centres during1983
2. Maximum and minimum temperaf tures for Panaji and M orm ugao Towns during 1983 and 1984
ti- Area and Population
3. D istrictw ise and talukawise distribution o f area, population and density, 1981 ......................................
4. Talukawise distribution o f population according to rural and urban, 1981 ...
5. Population by sex, talukawise, 19816. L iteracy, 1981 ......................................7. L iteracy by sex, talukawise, 1981 ...8. Econom ically active main workers,
marginal workers and non-workers talukawise, 1 9 8 1 ......................................
9. Distribution o f w orking population(main w orkers) by industrial category talukawise, 1 9 8 1 ..........................
10. Scheduled castes and scheduled tribespopulation, talukawise, 19 81 ...............
11. Decennial gprowth o f population12. Provisional repopulation totals, 1981
Census .................................................13. D istribution o f populatloft oy m ajor
religious communities, 1981 ...
Page
xxxvii
xxxviii-xli
3-4
&67
10-11
1213
14-17
18-19
xxlv
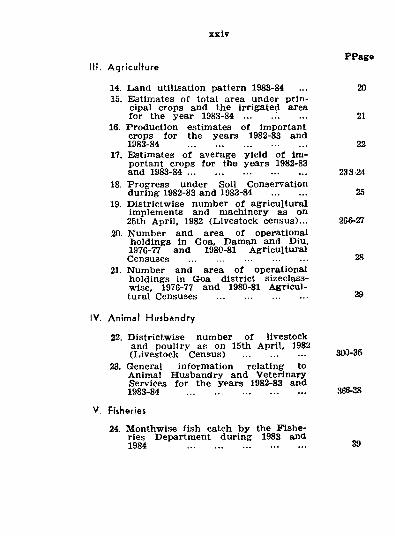
III. AgriculturePPage
14. Land utilisation pattern 1983-84 ... 2015. Estimates of total area under prin
cipal crops and the irrigated areafor the year 1983-84 ... ... 21
16. Production estimates o f im portant crops for the years 1982-83 and1983-84 .............................................. 22
17. Estimates o f average yield o f important crops for the years 1982-83and 1983-84 ................................................. 233 24
18. P rogress under Soil Conservationduring 1982-83 and 1983-84 ............... 25
19. D istrictw ise number o f agricultural implements and m achinery as on25th April, 1982 (Livestock census)... 266-27
20. Number and area o f operationalholdings in Goa, Daman and Diu,1976-77 and 1980-81 AgriculturalCensuses ............................................... 28
21. Num ber and area o f operationalholdings in Goa district sizeclass- wise, 1976-77 and 1980-81 A gricultural Censuses 29
IV. Animal Husbandry
22. D istrictw ise number o f livestockand poultry as on 15th April, 1982 (Livestock Census) .............................. 300-35
23. General inform ation relating to Animal Husbandry and Veterinary Services for the years 1982-83 and1983-84 ............................................. 366-38
V. Fisheries
24. Monthwise fish catch by the F isheries Departm ent during 1983 and1984 ............................................. S9
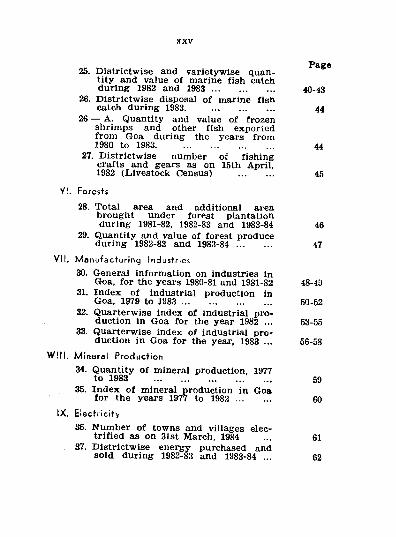
25. D istrictw ise and varietywise quantity and value o f marine fish catchduring 1982 and 1983 .......................... 40-43
26. D istrictw ise disposal o f marine fishcatch during 1983. .......................... 44
26 — A. Quantity and value o f frozen shrimps and other fish exported from Goa during the years from 1980 to 1983................................................. 44
27. Districtw ise number o f fishing crafts and gears as on 15th April,1982 (Livestock Census) ....... 45
VI. Forests
28. Total area and additional area brought under forest plantationduring 1981-82, 1982-83 and 1983-84 46
29. Quantity and value o f forest produceduring 1982-83 and 1983-84 ............... 47
VII. Manu'fad’Liring Industries
30. General inform ation on industries inGoa, for the years 1980-81 and 1981-82 48-49
31. Index o f industrial production inGoa, 1979 to 1983 ...................................... 50-52
32. Quarterwiae index o f industrial production in Goa for the year 1982 ... 53-55
33. Quarterwise index o f industrial production in Goa for the yeax, 1983 ... 56-58
Will, Mineral Production
34. Quantity o f mineral production. 1977to 1983 ..................................... ... 59
35. Ind ex o f mineral production in Goafor the years 1977 to 1982 ................ 60
IX. Electricity
36. Num ber o f towns and villages electrified as on 31st March, 1984 ... 61
37. D istrictw ise energy purchased andsold during 1982-83 and 1983-84 ... 62
Page
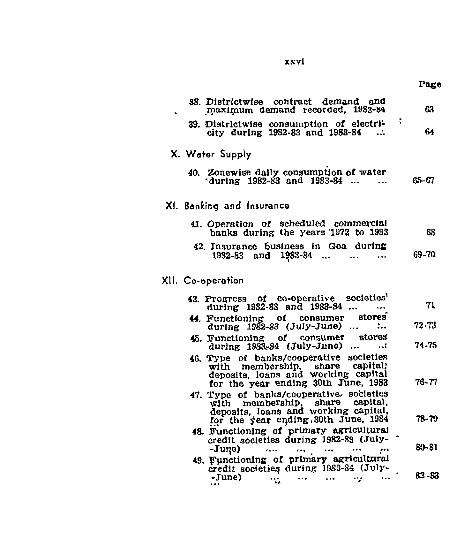
38. P lstrictw ise contract demand andmaximum demand recorded, 1S83-M 63
39. District-wise consumption o f electrl- 'c ity during 1982-83 and 1983-84 64
X. Water Supply
40. Zonewise daily consum ption o f water'during 1982-83 and 1983-84 ............... 65-C7
XI. Banfctng and Insurance
41. Operation o f scheduled commercialbanks during the years 1872 to 1983 G8
42. Insurance business in Goa during1982-83 and 1983-84 .......................... 69-70
XII. Co-oporatton
43. Propn'esa of co-operative societies'during 19S2-83 and 1983-84 . Tl
44. Functioning o f consumer stores'during 1 9 ^ 8 3 (July-June) ... 72-TJ
45. Functioning o f consumer storesduring 198a-S4 (J u ly -J u n e ) ................. i 74-75
4G. T ype of banks/cooperative societieswith m embership, share capital*deposits, loans and w orldng capital fo r the year ending 30th June, 1983 76'77
47. T ype o f banks/cooperative^ societieswith m embership, share capital,deposits, loans and w orking capital,for the year eijdlng.SOth June, 1984 78-79
48. Sanction ing o f prim ary agricultural credit societies during 1982-83 (Ju ly--Jui^e) ................ ............... .... 80'81
49. ¥Vnctioning o f prim ary agricultural credit societies during 19S3-S4 (July--June) .................................... ■ 83-83
xxvl
Page
xxvll
num bers for non-manual employeea
1979 t o ^ lS s T "num bers for
r o a (labour class) InGoa for the years from 1979 to 198462. Average retail, prices o f som e Impor-
cornmodlties consum ed by. f i . people In P a ra ji townf o r the years 1982 and 1983 .1 ..
53. Average wholesale prices o f som ^ Important com m odities in Panajl -S e ^ y ^ r 1983 during
o f some, im” ’ portant comm odities conaumed by people in im por-
S a r district fo r the
XIV. Transpor and Communicafion
65. mstrictTrtse length o f roads b y typoof -Burfaee as on 31st M arch. 1982 •
66. D istrlctw lse length o f roads by typo Of .surface as on 31st March. 1983 .
under19^ Panchayats as on 31st March.
58. B lockwise length o f roa d s ' "under 1983 panchayats aa on 31st March,
59. M otor vehicles 'registered in Goa, D ^ a n and Diu as on 31st March.
registered la the
XIII. Price*
84
8fi
86-
87
Pag4.
89-91
92-93-
94
95
96
97-
xxviii
I Page
61. M otor vehicles in operation in the Union Territory o f Goa, Daman andDiu as on 31st March, 1984 ............... 98
62. Distance from Panaji town to othertowns by r o a d ...................................... 99
63. Details of navigability of inland waterways o f Goa r iv e rs :.......................... 100-)-102
64. Main waterways and total number o f passengers ferried d,uring 1982-83and 1983-84 ................................................. 103
65. Road traffic accidents during theyears from 1980 to 1983 ............... 104
66. D istrictw ise number o f post offices,telegraph offices, telephone exchanges etc. as on 31st March, 1984 105
67. D istrictw ise number o f radio licencesissued during 1983-84 .......................... 106
XV. Administrative Statistics
68. Number o f police stations w ith staff strength and crim es r ^ o r t e d during1982 and 1983 ...................................... 107
69. Number o f prisons and prisoners inja ils during the year 1983 ............... 108
XVI. Tourism
70. TaLukawise number o f existing boarding and lodging houses with bed capacity for the years 1982-83 and1983-84 109
71. Talukawise arrival o f Indian touristsduring 1982-83 and 1983-84 ............ HO
72. Talukawise arrival o f Foreign tourists during 1982-83 and 1983-84 ... H I
XVlil. Foregn Trade
7c. Quantity and value o f merchandise imported through M ormugao Port, 1976-77 .......................... ............. ;
74. Quantity and value o f m erchandiseexported through M ormugao Port, 1976-77 .................................................
75. Value o f imports and exports o f m erchandise by principal countries through M ormugao Port, 1976-77 ...
76. Quantity and value o f im ports o f merchandise by principal countries through Mormugao Port, 1976-77 ...
77. Quantity and value o f exports o f m erchandise by principal countries through M ormugao Port, 1976-77 ...
XViiJ. Public Finance
112-114
115-116
117
118-119
120-121
122
Page
78. Budget at a glance, 1984-85 ...............79A. Revenue and expenditure o f the
Government o f Goa, Daman and Diu for the years from 1982-83 to 1984-85
A. Total revenue on revenue account 123-12579B. Revenue and expenditure o f the
Government of Goa. Daman and Diu for the years from. 1982-83 to
1984-85 ... ... ,,, ,,,B. Total expenditure on revenue
account...........................................................80A. Capital budget o f the Government
o f Goa, Daman and Diu for theyears from 1982-83 to 1984-85 ..............
A. Total capital receipts .............. 130
SOB. Total budget o f the Government o f Goa, Daman and Diu for the years from 1982-83 to 1984-85 ..........................
B. Total capital disbursements ... 131-133
126-129
Pag'e
XIX. Five Year Plans
81. year-wise plan outlay and expenditure by heads o f developm ent during theSixth Five Year Plan (1980-85) ... 134-145, |
82. Plan outlay and expenditure b y niajor heads o f developm ent duringthe plan periods from 1962 onw ards 146-147
XX. State Income
83. Net state dom estic product at factorcost for the years, 1981-82 and 1982-83(at current and constant prices) ... l^S
84. Net state dom estic product at factorcost by industry o f origin for the years, 1981-82 and 1982-83 (at constant p r ic e s ) ................................................ . 149-151
85. Net state dom estic product at factorcost by industry o f origin fo r the years, 1978-79 to 1982-83 (at current prices) ................................................. 152-153
XXI. Local Bodies
86. Income, expenditure and important achievements o f the village pancha-yats for the year 1982-83 ............... 154-155
87. Talukawise estimates o f receipts and expenditure o f m unicipalities fo r theyears 1983-84 and 1984-85 ............... 156
88. D istrictw ise ir^come and expenditureolf municipal councils during 1982-83. 157-158
XXII. Community Development Programm«
89. Physical achievements in community developm ent projects for the yearending March, 1984 .......................... 159-165
XX III. Taxes
90. Customs revenue collected during1982-83 and 1988-84 .......................... 166-169
91. Com m odity wise central excise revenue collected in Goa during- 1982-83and 1983-84 ......................................... 170
92. Talukawise number o f registered sales tax dealers at the end of1982-83 and 1983-84 .......................... 371
93. Talukawise sales tax collected durinjr1982-83 and 1983-84 .......................... ^ 2
94. Talukawise entertainment tax collected during 1982-83 and 1983-84 ... 173
XX IV . Excise
95. Talukawise number o f shops licencedto sell liquor at the end o f 1983-84 ... 174
S6. Talukawise number o f licences issued fo r stills (m anufacture o f liquor) during 1982-83 and 1983-84 ............... 175
97. Production, im ports and exports o fliquors during 1982-83 and 1983-84 ... 176
98. E xcise revenue receipts collected during 1982-83 and 1983-84 .............. 177
XXV, Labour and Employment
99. W orkin g o f Em ploym ent Exchanges during the years from 1980-81 to
•1983-84 ... ........................................ 178-179100. Num ber o f applicants (m atric and
above) on live register o f Em ploym ent Exchange during 1983 (regis
trations and placements in em ploym ent by level o f e d u ca t io n ).............. 180-183
101. L oss o f mandays due to strikes and lockouts for the years 1980 to
^983 ............................................................. 184102. Trade unions during 1981 and 1982. 184103. D istribution o f em ployees o f the
State and the Central Govt, by category fo r the years 1981-82 and1982-83 ................................................. 185
Page
104. D istrictw ise distribution o f regular em ployees o f the State and the Central Govt, for the years 1981-82and 1982-83................................................. ] 186
105. D istribution o f regular em ployees o f the Govt, o f Goa, Daman and Diu for the years 1981-82 and 1982-83
(b y basic pay r a n g e s ) .......................... 1187106. Department / O fficewise number o f
regular employees for the years1981-82 and 1982-83 .......................... 188-H93
XXVI. Education
107. Districtwisfc number o f schools,colleges and enrolment during the academic year 1983-84 .......................... 194—197
108. Sex-wise outturn o f matriculatesduring the years 1975-76 to 1982-83 119S
109. Outturn o f graduates and post graduates during the academ ic years1981-82 and 1982-83 ....................... 199
110. Num ber o f sports coaching camps organised and participants during1982-83 and 1983-84 . . . . ... ... 200
111. Num ber o f libraries and news papers/periodicals during the year1983-84 .................................................. 201
112. Perform ance o f cinema houses in the T erritory during 1982-83 and1983-84 202
XXVil. Public Health and Vitel Statistics
113. D istrictw ise number o f medical institutions and their activitiesduring 1983-84 ....................................... 203i-208
114. M onthwise progress o f Fam ilyW elfare Program m e during 1983-84 209
115. Talukawise targets and achievements under Fam ily Planning Program m e during 1983-84 ... 210
PPage
116. Progress o f National Tuberculosis ooiitrol Program m e during 1982
XX'VIII. Housing
Page
211117. M onthwise a n d age-groupw ise
BCG activities during IGSJ-S- ; ... 212-213118. General inform ation about the
Institute o f Psychiatry and H u- maii Behaviour for the year1983 214
119. General inform ation about the Cancer Hospital fo r the years 1982and 1983 .............. ... ............... 215
120. Vital statistics for the years 1979to 1983 ............................................. 216
121. B uilding works sanctioned in private sector during 1983-84 (inUrban area) ...................................... 217-218
122. Building v/orks sanctioned in p rivate sector during 1983-84 (inrural area) ...................................... 219-220
XIX;X. General Elections
123. Results o f General Elections in the Union T erritory o f Goa, Damanand Diu d,uring 1984 ... ................ 221-222
XXX!. Joint Stock Companies
124. D istrictw ise number o f join t stock companies limited by shares at
work as on 31st March, 1982/1983 223125. .Joint stock companies (lim ited
by shares) at work in Goa, Daman and Diu during 1979-80 to 1982-83 (by industries) .......................... 224-225
xxxiv
XXXI. Miscellaneous
FPage
126 Joint stock companies (lim ited by shares) in Goa, Daman and Diu during 1981-82 and 1982-83 (new ly registered and gone into liquidation) ...................................... 226
127. Progress o f National Small Savings Program m e in the Territory
during 1983-84 ...................................... 228-J-230128. Quantity o f food grains and sugar
received from the Govt, o f India(central stock) and distributed during 1982-83 and 1983-84 .... 231
129. M erchandisewise tra ffic handled at M orm ugao P ort during 1982-83and 1983-84 ................................. ........ 2'32-2-233
130. P rogress o f Social W elfare P rogrammes during 1982-83 a n d1983-84 234-4-236
131. Activities o f the O ffice o f the Controller ot W eights and Measuresduring 1982-83 and 1983-84 .... 237
132. Achievements o f selected program m es/schem es under 20-Point P ro
gramme (A pril’ 83 to M arch’ 84) 2388-240133. Yearwise number o f passports
is.sued during 1980 to 1984 .... 241134. D istrictw ise distribution o f non-
-agricultural enterprises by types,1980 Econom ic Census .... 2422-213
135. D istribution o f non-agrlculturalenterprises according to m ajor activity group and by type o f enterprise, 1980 Econom ic Census 2444--4o
136. D istribution o f non-agricultural establishments o f 1977 and 1980 Econom ic Censuses by m ajor activity ^gro.up .............. ..................... 2466-247
C O N T E N T S
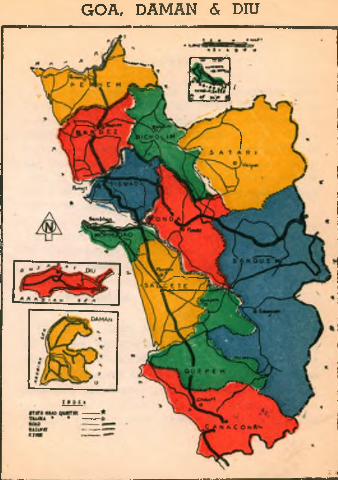
MAP AND CHARTSMap of Goa, Daman and Diu
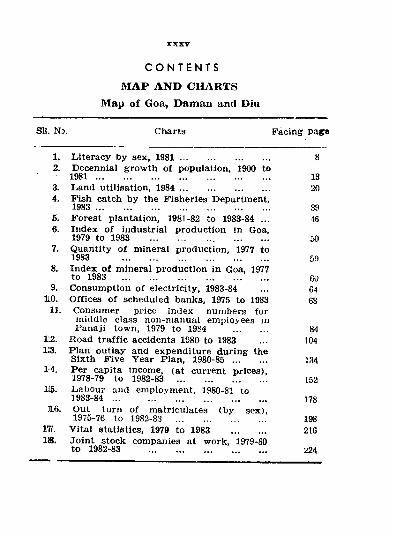
Sll. Nj Charts Facing page
1, Literacy by sex, 1 9 8 1 ..................................... 82. Decennial grow th o f population, 1900 to
1 9 8 1 ......................................................................... 133. Land utilisation, 1984 ..................................... 204. Pish catch by the Fisheries Department,
1983 ........................................................................ 395. Forest plantation, 1981-82 to 1983-84 ... 466. Index o f industrial production in Goa,
1979 to 1983 ......................... . .............. 507, Quantity o f mineral production, 1977 to
1983 ............................................................. 598. Index o f m ineral production in Goa, 1977
to 1983 ............................................................. 609. Consumption o f electricity, 1983-84 64
liO. Offices o f scheduled banks, 1975 to 1983 6811. Consumer price index numbers for
m iddle class non-manual employees in P anaji town, 1979 to 1984 .............. 84
112. Road tra ffic accidents 1980 to 1983 1041:3. Plan outlay and expenditure during the
Sixth Five Year Plan, 1980-85 .............. 1341-4. Per capita income, (at current prices),
1978-79 to 1982-83 ............... ... 152115. L abour and employment, 1980-81 to
1983-84 ............................. .......................... 178116. Out turn of matriculates (by sex),
1975-76 to 1982-83 ..................................... 198m . Vital statistics, 1979 to 1983 .............. 21618. Joint stock companies at work, 1979-80
to 1982-83 ................................................. 224
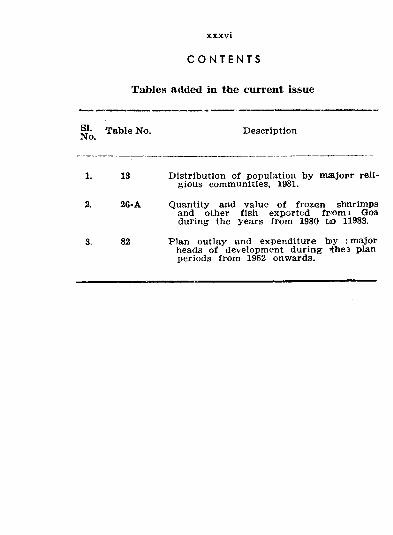
CONTENTS
Tables added in the current issue
xxxvi
SI.No. Table No. Description
1. 13 Distribution o f population by niaijopr religious communities, 1981.
2. 26-A Quantity and value o f frozen shhrimps and other fish exported friom i Goa during the years from 1980 tio 11983.
3. 82 Plan outlay and expenditure toy J m ajor heads o f development during thea plan periods from 1962 onwards.
XXX vii
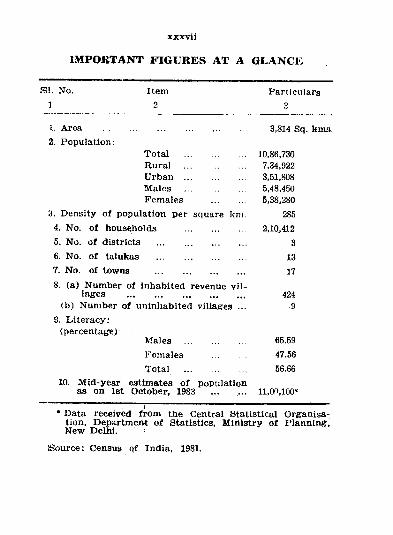
IMPOJBTAJ T FIGURES AT A GLANCE
SI. No.1
Item2
1. Area ............................................................2. Population:
Total .........................Rural .........................Urban .........................Males .........................Females ..............
3. Density o f population per square km.4. No. o f households .........................5. No. o f districts ... ..............6. No. o f taluka.s .....................................7. No. o f towna .....................................8. (a) Number o f inhabited revenue v il
lages .................................................(b ) Number of uninhabited villages ...
9. L iteracy:(percentage)
Males .........................Females ..............Total ..........................
10. M id-year estimates o f population as on 1st October. 1983
Particulars3
3,814 Sq. kma
10,86,7307,34,9223,51,8085,48,4505,38,280
2852,10,412
31317
4249
65.5947.5656.66
11,00,100*
• Data received from the Central Ktatistical Organisation, Department o f Statistics, M inistry o f Planning, New Delhi. ^
S ource : Census qf India, 1981.
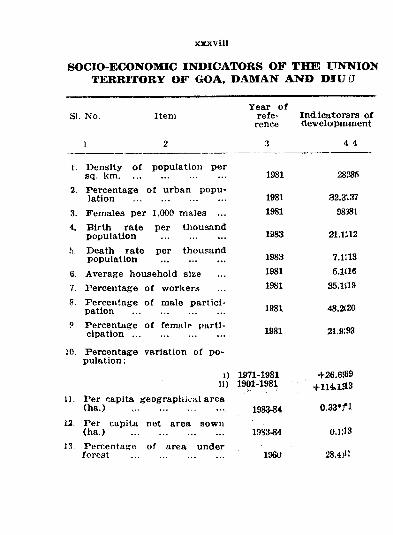
SOCIO-ECONOMIC INDICATORS OF THE L7NNION TERRITORY OF GOA, DAMAN AND DIU
x xxv iii
SI. No. ItemYear o f
reference
Ind-icaitorsrs o f rteveloipmment
1 2 3 4 4
I. Density o f population per sq. 1cm............................................ 1981 28.'285
2. Percentage o f urban population ...................................... 1981 .32.3'.37
3. Females per 1,000 males ... 1981 98)814. Birth rate per thousand
population ........................... 1983 21.1il2
5. Death rate per thousand population ........................... 1983 7.r,13
6. Average household size 1981 5.1(16
7. Percentage o f workers 1981 35.1519
8. P ercentage o f male p articipation ...................................... 1981 48.2(20
p. P ercentage o f female participation ...................................... 1981 21.9:93
JO. Percentage variation o f p o pulation:
1)ii)
1971-19811901-1981
+26.6<89+114.1513
n . P er capita geographical area (ha.) 1983-84 0.33*fl
12. P er capita net area sown (ha.) ...................................... 19S3-84 0.1 ;i 3
13 Percentage of area under forest ...................................... 1960 28.4)11
xx xlx
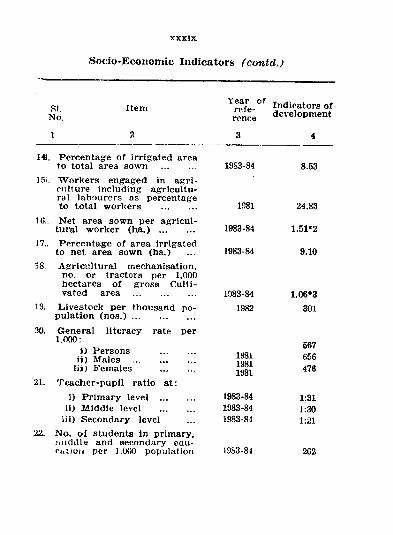
Socio-Economic Indicators (contd.)
SI.No,
Item Indicators o f ronc^ developm ent
1^. Percentage o f irrigated area to total area sown ..............
]5i. W orkers engaged in agriculture including agricultural labourers os percentage to total workers ..............
1().. Net area sown per agricultural w orker (ha.) ..............
17.. Percentage o f area irrigated to net area sown (ha.)
18. Agricultural mechanisation,no. or tractors per 1,000 hectares o f gross Cultivated area ..........................
19. L ivestock per thousand population ( n o s . ) ..........................
20. General literacy rate per1.000:
i) Persons ..............ii) Males ..........................
lii) Females ..............21. Teactier-pupH ratio at;
1) Prim ary level .............ii) M iddle level ..............
iii) Secondary level22. No. o f students in primary,
m iddle and secondary eau- c-a ion per 1,000 population
19S3-84
1981
1983-84
1983-84
1983-841982
198119811981
1983-841983-841983-84
19S3-84
8.53
24.83
1.51*2
9.10
1.06*3301
567656476
1:311:301:21
262
xl
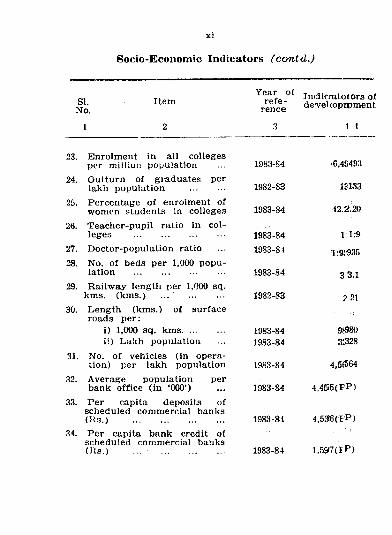
Socio-Economic Indicators (contd.)
SI.No,
Item ^ rpfp Incdlcaatotors ol rence de-veltopDpment
3 4 4
23. Enrolm ent in all collegesper million population .. 1983-84
24. Outturn o f graduates perlakh population .............. 1982-83
25. Percentage o f enrolment ofwomen students in colleges 1983-84
26. Teacher-pupil ratio in colleges ...................................... 1983-84
27. D octor-population ratio ... 1983-8128. No. o f beds per 1,000 popu
lation .......................................... 1983-8429. R ailw ay length per 1,000 sq.
kms. (km s.) ... .............. 1982-8330. Length (km s.) o f surface
roads per:i) 1,000 sq. km s.................. 1983-84ii) Lakh population ... 1983-84
31. No. o f vehicles (in operation) per lakh population 1983-84
32. Average population perbank office (in ‘000’ ) ... 1983-84
33. Per capita deposits of scheduled comm ercial banks(R s.) ...................................... 1983-84
34. Per capita bank credit of scheduled commercial banks(R s.) ... .......................... 1983-84
■6,4S493
1S133
42.2.20
1 1:9
1:9J'935
3 3.1
2 21
9^8031828
4,5(564
4,45)5(FP)
4,53i6(FP)
1,597(IP)
xli
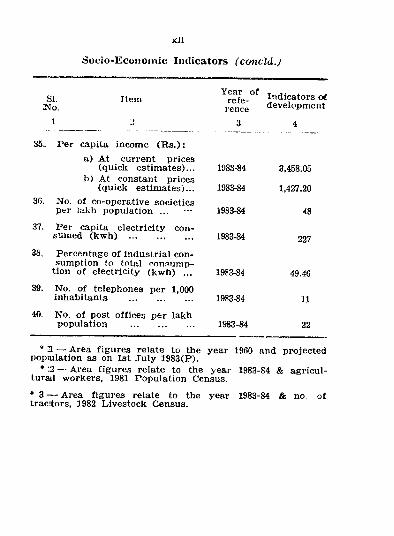
Socio-Economic Indicators (concld.)
Si. Item 3SIo.
Year of reference
Indicators ol development
1 3 4
35. Per capita incom e (R s .) :a) At current prices
(quick estim ates)...b ) At constant prices
(quick estim ates)...
1983-84
1983-84
3,458.05
1,427.203G. No. o f co-operative societies
per lakh population ... 1983-84 4837. Per capita electricity con
sumed (kw h) .......................... 1983-84 22738. Percentage o f industrial con
sumption to total oonsump- tion o f electricity (kw h) ... 1983-84 49.46
39. No. o f telephones per 1,000 inhabitants .......................... 1983-84 11
40. No. o f post offices per lakh population .......................... 1983-84 22
* 1 — Area figures relate to the year 1960 and projected poptulation as on 1st July 1983(P).
* ^ — Area figures relate to the year 1983-84 & agricul- tura.1 workers, 1981 Population Census.
* 3 — Area figures relate to the year 1983-84 & no. o f tracitors, 1982 L ivestock Census.
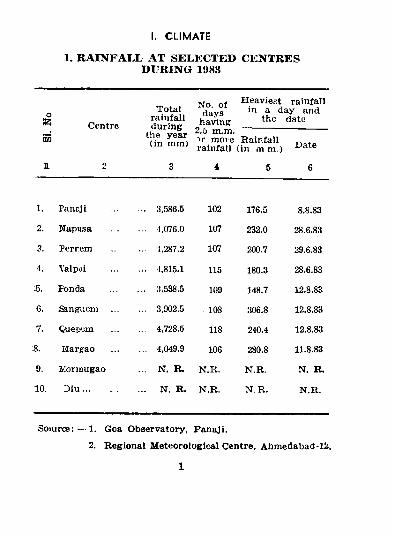
1. RAINFAIX AT SELECTED CENTRES DURING 1983
I. CLIMATE
oCentre
Total rainfall during
the year (in mmj
No. o f days
having
Heaviest rainfall in a day and
the date
m2.5 m.m."'r more rainfall
Rainfall (in m m .) Date
n 2 3 4 5 6
1. Paneji ... 3,586.5 102 176.5 8.8.83
2. Ilapusa ... 1,076.0 107 232.0 28.6.83
3. Perrem ... 4,287.2 107 200.7 29.6.83
4. Yalpoi ... 4,815.1 115 180.3 28.6.83
:5. Fonda ... 3,538.5 109 148.7 12.8.83
6. Sangiiem ... ... 3,902.5 108 306.8 12.8.83
7. Quepem ... 4,728.5 118 240.4 12.8.83
S. Margao ... 4,049.9 106 280.8 11.8.83
9. jVCorniugao . . N. R . N.R. N.R. N. R.
10. D iu .............. ... N, R. N.R. N .R . N .R.
5o)urce: — 1. Goa Observatory, Panaji.
2. Regional M eteorological Centre, Ahm edabad-lX
1
C L IM A T E
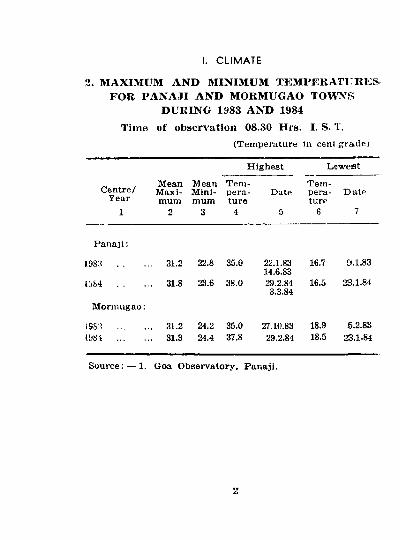
2. MAXIMUM AND MINIMUM TKMFF.KATUIIES FOR PANAJI AND MOKMUGAO TOWNS
DURING 1983 AND 1984 Time of observation 08.30 Hrs. I. S. T.
(Tem perature in cent grade ;
Highest Lowest
Centre/Year
MeanM aximum
MeanM inimum
Tem perature
DateTem perature
Date
1 2 3 4 5 6 7
P an a ji:
I98;j . . . 31.2 22.8 35.0 22.1.8314.6.83
16.7 9.1.83
i:iS4 ........ . 31.8 23.6 38.0 29.2.843.3.84
16.5 23.1.84
M orm ugao:
i9S;? ............... 31.2 24.2 35.0 27.10.83 18.9 6.2.83l'J84 ............. . 31.3 24.4 37.8 29.2.84 18.5 2S.1.S4
Source: — ! . Goa Observatory, Panaji.
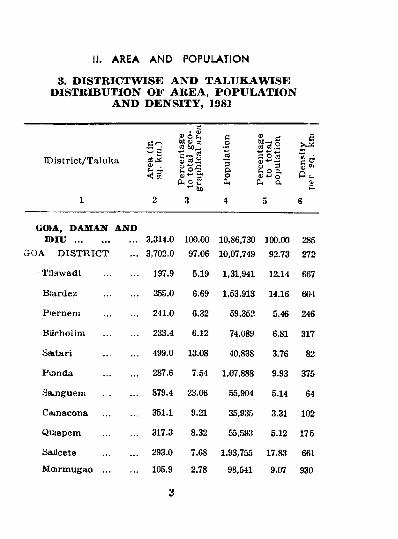
3. DISTRICTWISE AND TALUKAWISE DISTRIBUTION OF AREA, POPULATION
AND DENSITY, 1981
II. AREA AND POPULATION
IDistrict/Taluka
i3^
08
aj« ohi) 41 d
Ph c 2
V r-“ 3-2 'S P'S K
§ « 0 u.
GOIA, DAM AX ANDr o r u .............. ... 3,314.0 100.00 10,86,730 100.00 285
'A D ISTRICT ... 3,702.0 97.06 10,07,749 92.73 272
Tilswadi ... 197.9 5.19 1,31,941 12.14 667
Biardez ... 255.0 6.69 1,53,913 14.16 604
Pfernem ... 241.0 6.32 59,352 5.46 246
Biicholim ... 233.4 6.12 74,089 6.81 317
Saitari ... 499.0 13.08 40,838 3.76 82
P onda ... 287.6 7.54 1,07,888 9.93 375
Sa.nguein ... 879.4 23.06 55,904 5.14 64
Cainacona 351.1 9.21 35,935 3.31 102
Qmepem ... 317.3 8.32 55,593 5.12 175
Sallcete ... 293.0 7.68 1,93,755 17.83 661
M orm ugao ... ... 105.9 2.78 98,541 9.07 930
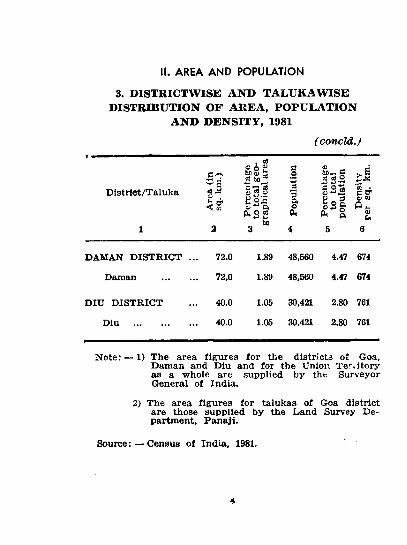
II. AREA AND POPULATION
3. DISTBICTWISE AND TALUKAWISE DISTRIBUTION OF AREA, POPULATION
AND DENSITY, 1981(concld.)
D lstrlct/Taluka
f i r -" S
.b c
® o |
<1) D. CL q C3
ao
S3
( k
WJ— ccfl 05 O
c o - g
P ^ 3
w p ,
I t<i>u
1 2bo
3 4 5 6
DAMAN D IST R IC T ... 72.0 1.89 48,560 4.47 674
Daman ............... 72,0 1.89 48,560 4.47 674
DIU D ISTR IC T 40.0 1.05 30,421 2.80 761
Diu .......................... 40.0 1.05 30,421 2.80 761
N ote: — 1) The area figures fo r tlie districts o f Goa, Daman and Diu and for the Union T e-..itory as a whole are supplied by the Surveyor General o f India.
2) The area figures fo r talukas o f Goa district are those supplied by the Land Survey Departm ent, Panaji.
Source: — Census o f India, 1981.
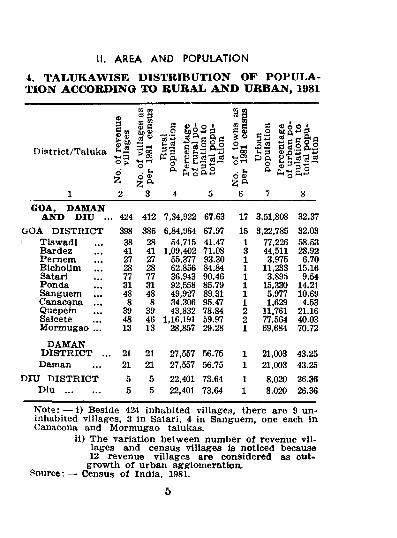
4, TALUKAWISE DISTRIBUTION OF POPUl.A- TION ACCORDING TO RURAL AND URBAN, 1981
K 02 mm
2 S c B o j k o ' 2 s C ® o Q ' .S s ^ -2 | 8 C.2
District/Taluka •£!o ? i s “ I S E | | 5 ? a P | | «o piioftw o a?
3
II. AREA AND POPULATION
15
GOA, DAM AIfAND DIU ... 424 412 7,34,922 67.63 17 3,51,808 32.37
GOA D ISTR IC T 398 386 6,84,964 67.97 15 3,22,785 32.03I Tlsw adl ... 38 28 54,715 41.47 1 77,226 58.53
Bardez ... 41 41 1,09,402 71.08 3 44,511 28.92Pernem ... 27 27 55,377 93.30 1 3,975 6.70BlchoUm ... 28 28 62,856 84.84 1 11,233 15.16Satari ... 77 77 36,943 90.46 1 3,895 9.54Ponda ... 31 31 92,558 85.79 1 15,330 14.21Sanguem ... 48 48 49,927 89.31 1 5,977 10.69Canacona ... 8 8 34,306 95.47 1 1,629 4.53Quepefn ... 39 39 43,832 78.84 2 11,761 21.16Salcete ... 48 46 1,16,191 59.97 2 77,564 40.03Mormugao ... 13 13 28,857 29.28 1 69,684 70.72
DAMAND ISTRIC T ... 21 21 27.557 56.75 1 21,003 43.25Daman ... 21 21 27,557 56.75 1 21,003 43.25
DIU DISTR ICT 5 5 22,401 73.64 1 8,020 26.36Diu ................ 5 5 22,401 73.64 1 8,020 26.36
N o t e :— i) Beside 424 Inhabited villages, there are 9 uninhabited villages, 3 in Satari, 4 in Sanguem, one each in Canacona and M orm ugao talukas.
ii) The variation between num ber o f revenue villages and census villages is noticed because 12 revenue villages are considered as out
grow th o f urban agglom eration.Source: — Census o f India, 1981.
II. AREA AND POPULATION
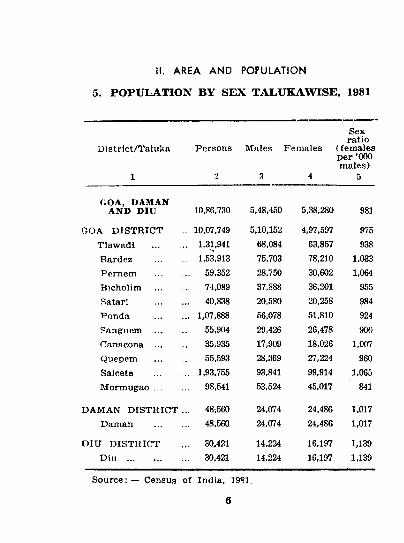
5. POPULATION BY SEX TALUKAWISE, 1981
District/Taluka
1
Persons Males Females
Sex ratio
( females per '000 m ales)
5
AND D ili 10,86,730 5,48,450 5,38,280 981
aOA D ISTRICT . 10,07,749 5,10,152 4,97,597 975Tiswadi ............. 1.31,941'■a 68,084 63,857 938Bardez 1,53,913 75,703 78,210 1,033Pem em . 59,352 28,750 30,602 1,064Bicholim 74,089 37,888 36,201 955Satari 40,838 20,580 20,258 984Ponda , 1,07,888 56,078 51,810 924Sangiiem 55,904 29,426 26,478 900Canacona 35,935 17,909 18,026 1,007Quepem 55,593 28,369 27,224 960Salcete . 1,93,755 93,841 99,914 1,065Mormugao ... 98,541 53,524 45,017 841
DAMAN D ISTRICT . 48-.560 24,074 24,486 1,017Daman 48,560 24,074 24,486 1,017
OIU D ISTRICT . 30.421 14,224 16,197 1,139D i n ....................... . 30,421 14,224 16,197 1,139
Source: — Census o f India, 1981.
6
il. AREA AND POPULATION
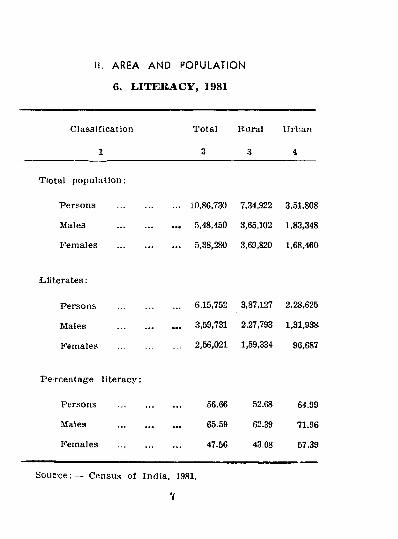
6. LITERACY, 1981
Classification Total Rural Urban
1 3 3 4
Tiotal population:
Persons .............. ... 10,86,730 7,34,922 3,51,808
Males ............... ... 5,48,450 3,65,102 1,83,348
Females ............... ... 5,38,280 3,69,820 1,68,460
L iiterates:
Persons .............. ... 6,15,752 3,87,127 2,28,625
Males ............... . .. 3,59,731 2,27,793 1,31,938
Females .............. ... 2,56,021 1,59,334 96,687
Percentage literacy:
Persons .............. 56.66 52.68 64.99
Males ............... 65.59 62.39 71.96
Females .............. 47.56 43.08 57.39
S ou rce : — Census of India, 1981.
V
II. AREA AND POPULATION
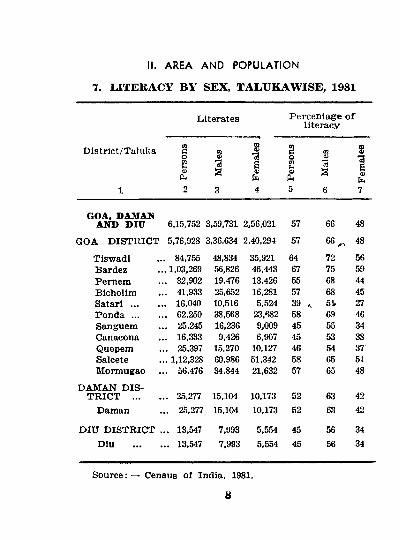
7. LITERACY BY SEX, TALUKAWISE, 1981
Literates Percentage o f literacy
District/Taluka 01co2S
mJS
s
s•3Sfe
so2
m<u'aS
S-3S
1 2 3 4 5 6 7
GOA, DAJVTAli AND DID 6,15,752 3,59,731 2,56,021 57 66 48
GOA DISTRICT 5,76,928 3,36,634 2,40,294 57 66^ , 48
Tiswadi . 84,755 48,834 35,921 64 72 56Bardez . 1,03,269 56,826 46,443 67 75 59Pernem . 32,902 19,476 13,426 55 68 44Bicholim . 41,933 25,652 16,281 57 68 45S a t a r i ............. . 16,040 10,516 5,524 39 <. 51, 27Ponda ............. . 62,250 38,568 23,682 58 69 46Sanguem 25,245 16,236 9,009 45 55 34Canacona ,. 16,333 9,426 6,907 45 53 38Quepem .. 25,397 15,270 10,127 46 54 37Salcete .. 1,12,328 60,986 51,342 58 65 51Mormugao .. 56,476 34,844 21,632 57 65 48
DAMAN DISTR ICT ... .. 25,277 15,104 10,173 52 63 42
Daman .. 25,277 15,104 10,173 52 63 42
DIU DISTRICT ... 13,547 7,993 5,554 45 56 34Diu .. 13,547 7,993 5,554 45 56 34
Source: — Census of India. 1981.
8
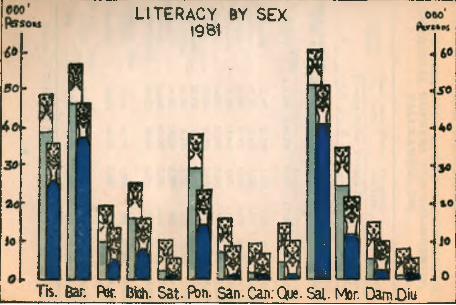
LITERACY BY SEX I9B1
h. Bar. Rbt. fekai. SatFbn. San.Can.-Qge. Sal. Mor DamDiu
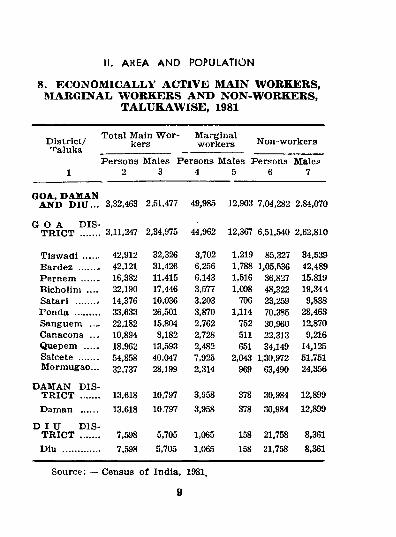
8. ECONOMICAL.LY ACTIVE MAIN WORKERS, aiARGINAl. WORKERS AND NON-WORKERS,
TALUKAWISE, 1981
II. AREA AND POPULATION
, Total Main W or- M arginal^ s t r i c t / kers workers Non-workersT'aluka ________________ __________________________________
Persons Males Persons Males Persons Males1 2 3 4 5 6 7
GOA, DAMAN AND D IU ... 3,32,463 2,51,477 49,985 12,903 7.04,282 2,84,070
G O A DIST R IC T ........ 3,11,247 2,34,975 44,962 12,367 6,51,540 2,62,810
42,912 32,326 3,702 1,219 85,327 34,539Bardez ........ 42,121 31,426 6,256 1,788 1,05,536 42,489Pernem ....... 16,382 11,415 6,143 1,516 36,827 15,819Bicholim .... 22,190 17,446 3,577 1,098 48,322 19,344Satari ........* 14,376 10,036 3,203 706 23,259 9,838Ponda .......... 33,633 26,501 3,870 1,114 70,385 28,463Sanguem .... 22,182 15,804 2,762 752 30,960 12,870Canacona 10,894 8,182 2,728 511 22,313 9,216Quepem . 18,962 13,593 2,482 651 34,149 14,125Salcete ....... 54,858 40.047 7,925 2,043 1,30,972 51,751M ormugao... 32,737 28,199 2,314 969 63,490 24,356
DAMAN DISTR IC T ....... 13,618 10,797 3,958 378 30,984 12,899Daman ...... 13,618 10.797 3,958 378 30,984 12,899
D I U DISTR IC T 7,598 5,705 1,065 158 21,758 8,361Diu ............... 7,598 5,705 1,065 158 21,758 8,361
Source: — Census o f India, 1981.
9
I. A R E A A N D
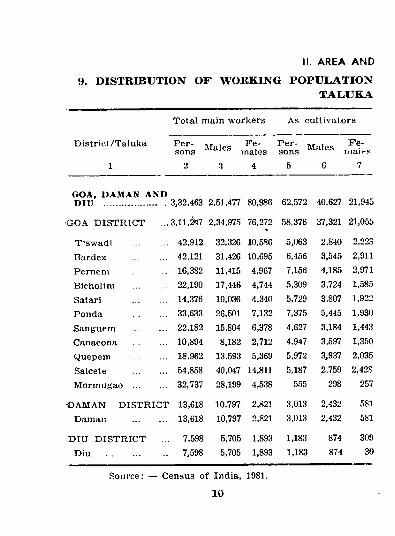
9. DISTRIBUTION OF WORKING POPULATIONTALUKA
Total main workers As cultivators
Districl /Taluka P er- ] sons r S 'e s ?on s 1
F e-tiiaifs
1 ■j 3 4 5 6 7
GOA, DAMAN AND DIU .......................... 3,32,463 2,51,477 80,986 62,572 40,627 21,945
GOA DISTRICT 3,11,^7 2,34,975 76,272 58,376 37,321 21,055
T ’swadi .............. 42,912 32,326 10,586 5,063 2,840 2,223Bardez .............. 42,121 31,426 10,695 6,456 3,545 2,911Pem em 16,382 11,415 4,967 7,156 4,185 2,971Bicholim .............. 22,190 17,446 4,744 5,309 3,724 1,585Safari .............. 14,376 10,036 4,340 5,729 3,807 1,922Ponda .............. 33,633 26,501 7,132 7,375 5,445 1,930Sanguem 22,182 15,804 6,378 4,627 3,184 1,443Canacona .............. 10,894 8,182 2,712 4,947 3,597 1,350Quepem .............. 18,962 13,593 5,369 5,972 3,937 2,035Salcete .............. 54,858 40,047 14,811 5,187 2,759 2,428Mormugao .............. 32,737 28,199 4,538 565 298 257
lOAMAN DISTRICT 13,618 10,797 2,821 3,013 2.432 581Daman .............. 13,618 10,797 2,821 3,013 2,432 581
DIU DISTRICT ... 7,598 5,705 1,893 1,183 874 309Diu ......................... 7,598 5,705 1,893 1,183 874 30
Source: — Census o f India, 1981.
10
P O P U LA T IO N
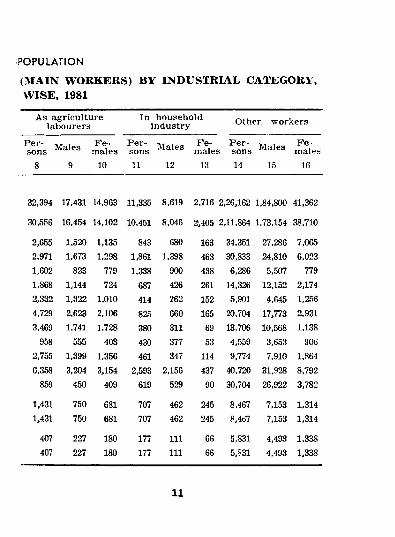
(MAIN WORKERS) BY INDUSTRIAL CATEGORY, WISE, 1981
As agriculture labourers
In household industry Other workers
’^onsF e
malesP ersons Males Fe
malesP ersons Males F e
males8 9 10 11 12 13 14 15 16
32,394 17,431 14,963 11,335 8,619 2,716 2,26,162 1.84,800 41,362
30,556 16,454 14,102 10,451 8,046 2-,405 2.11,864 1,73,154 38.710
2,655 1,520 1,135 843 680 163 34,351 27,286 7,0652,971 1,673 1,298 1,861 1,398 463 30,833 24,810 6,0231,602 823 779 1.338 900 438 6,286 5,507 7791,868 1,144 724 687 426 261 14,326 12,152 2,1742,332 1,322 1,010 414 262 152 5,901 4,645 1,2564,729 2,623 2,106 825 660 165 20,704 17,773 2,9313,469 1,741 1,728 380 311 69 13,706 10,568 1,138
958 555 403 430 377 53 4,559 3,653 9062,755 1,399 1,356 461 347 114 9,774 7,910 1,8646,358 3,204 3,154 2,593 2,156 437 40,720 31,928 8,792
859 450 409 619 529 90 30,704 26,922 3,782
1,431 750 681 707 462 245 8,467 7,153 1,3141,431 750 681 707 462 245 8,467 7.153 1,314
407 227 180 177 111 66 5.831 4,493 1,338407 227 180 177 111 66 5,831 4.493 1,338
11
11. A R E A A N D PO PU LA T IO N
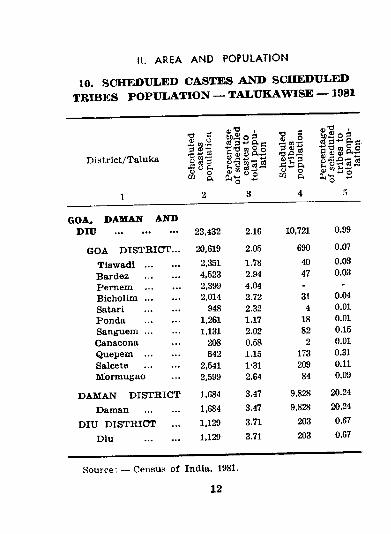
10. SCHEDULED CASTES AND SCHEDULED TRIBES POPULATION — TALUKAWISE — 1981
District/Taluka
^ TO -r-3§o!i o i
(Voi 2
® .2
O Om n
o 3 S 3*" e*n- e'® “ Ro § 2 s °*r ^’oS’S *
3 4 s
GOA, DAM AN AND D ID .......................... 23,432 2.16 10,721 0.99
GOA D IST R IC T ... 20,619 2.05 690 0.07
Tiswadi .............. 2,351 1.78 40 0.03Bardez .............. 4,523 2.94 47 0.03P em em .............. 2,399 4.04 - -B ic h o l im .............. 2,014 2.72 31 0.04Satari .............. 948 2.32 4 0.01Ponda .............. 1,261 1.17 18 0.01Sanguem .............. 1,131 2.02 82 0.15Canacona 208 0.58 2 0.01Quepem .............. 642 1.15 173 0.31Salcete .............. 2,541 1-31 209 0.11M ormugao 2,599 2.64 84 0.09
DAMAN DISTRIC T 1,684 3.47 9,828 20.24
Daman .............. 1,684 3.47 9,828 20.24
DIU DISTRIC T 1,129 3.71 203 0.67
Diu .............. 1,129 3.71 203 0.67
Source: — Census o f India, 1981.
12
DECENNIAL GROWTH OF POPL.
me m> i%8 mo i9se mj' mt
II. AREA AND POPULATION
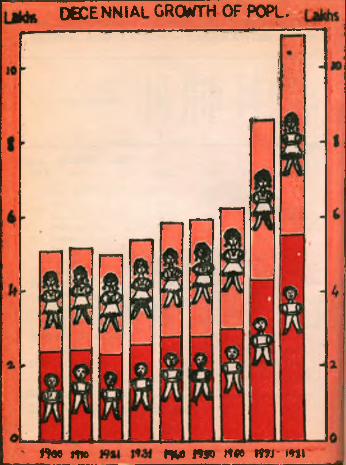
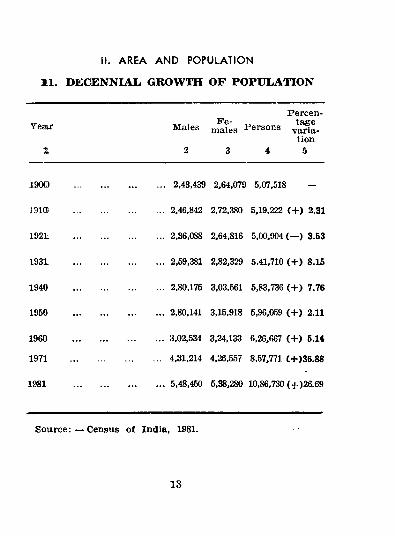
11. DECENNIAL GROWTH OF POPULATION
Y earPercen-
FG” t3£6Males jnales Persons varia
tionTL 2 3 4 5
1900 ........................ 2,43,439 2,64,079 5,07,518 -
19105 ...................... 2,46,842 2,72,380 5,19,222 ( + ) 2.31
192L ........................ 2,36,088 2,64,816 5,00,904 (— ) 3.53
1931 ........................ 2,59,381 2,82,329 5,41,710 (+ ) 8.15
1940 ....................... 2,80,175 3,03,561 5,83,736 ( + ) 7.76
1950 ........................2,80,141 3,15,918 5,96,0!59 ( + ) 2.11
1960 ........................ 3,02,534 3,24,133 6,26,667 ( + ) 5.14
1971 ............. .............. 4,31,214 4,26,557 8,57,771 C+)36.88
1981 ........................ 5,48,450 5,38,280 10,86,730 (+)26.69
S ou rce : — Census o f India, 1981.
13
II. A R E A A N D
A JLL
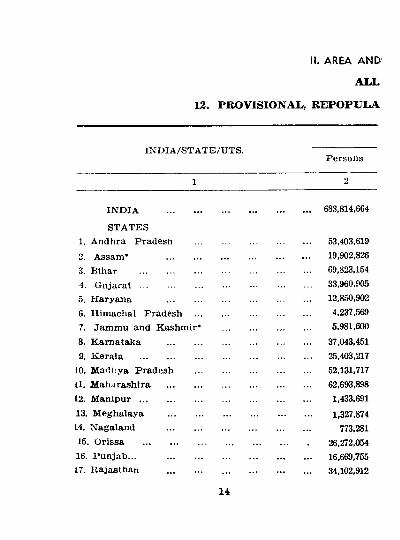
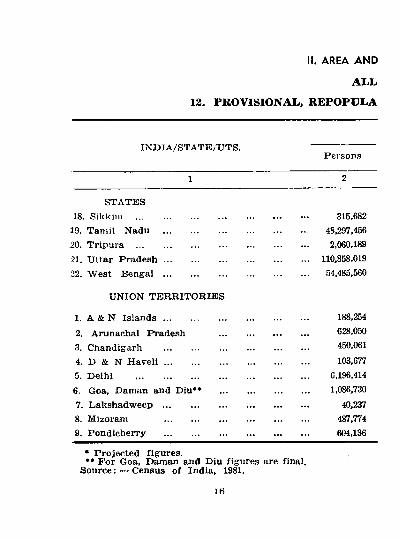
12. PROVISIONAI., BEPOPULA
IN D IA /ST AT E /U T S.Persons
IN D IA .............
STATES1. Andhra Pradesh2. Assam* ..............3. Bihar ........................4. G u ja r a t ........................5. H aryana .............6. Him achal Pradesh7. Jammu and Kashmir*8. Karnataka .............9. Kerala .........................
10. Madl'.ya Pradesh11. Maharashtra12. M a n ip u r ........................13. M eghalaya .............14. Nagaland .............15. Orissa .......................16. P un jab ... .............1.7. Kajasthan .............
683,814,664
53,403,619^19,902,82669,823,15433,960,90512,850,9024,237,5695,981,600
37,043,45125,403,21752,131,71762,693,8981,433,6911,327,874
773,28126,272,05416,669,75534,102,912
14
P O P U L A T IO N
IN D IA
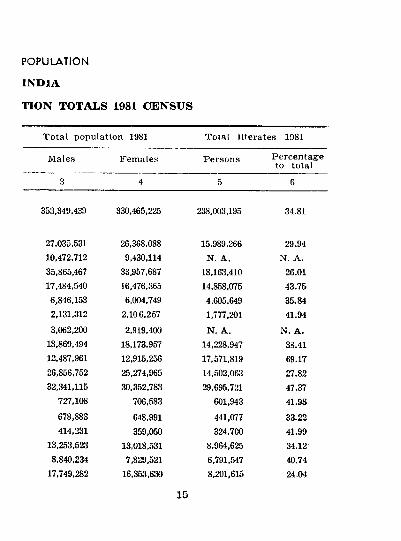
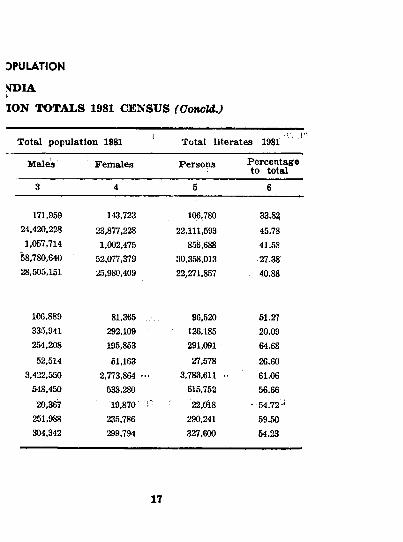
TION TOTALS 1981 C5ENSUS
T ota l population 1981 Total literates 1981
Males
3
Females Persons Percentage to total
353,349.439 330,465,225 238,003,195 34.81
27,035,531 26,368,088 15,989,266 29.9410,472,712 9,430,114 N. A. N. A.35,865,467 33,957,687 18,163,410 26.0117,484,540 16,476,365 14,858,075 43.756,846,153 6,004,749 4,605,649 35.842,131,312 2,106,257 1,777,201 41.943,062,200 2,919,400 N. A. N. A.
18,869,494 18,173,957 14,228,947 38.4112,487,961 12,915,256 17,571,819 69.1726,856,752 25,274,965 14,502,063 27.8232,341,115 30,352,783 29,695,721 47.37
727,108 706,583 601,943 41.98678,883 648,991 441,077 33.22414,231 359,050 324,700 41.99
13,253,523 13,018,531 8,964,625 34.128,840,234 7,829,521 6,791,547 40.74
17,749,282 16,353,630 8,201,615 24.04
15
II. AREA AND
A L L
12. PROVISIONAL, REPOPCLA
IN D IA /ST A T E /U T S.Persons
STATES18. Sikkim
19. Tam il Nadu20. Tripura ...21. Uttar Pradesh22. W est Bengal
UNION T E R R IT O R IE S
1. A & N I s la n d s ..............2. Arunachal Pradesh3. Chandigarh ..............4. D & N H a v e l i ..............5. D elhi ..........................
Goa, Daman and Diu**7. Lakshadweep ...............8. Mizoram ..............9. P ondicherry ..............
315,68248,297,4562,060,189
110,858.01954,485,560
188,254628,050450,061103,677
6,196,4141,086,730
40,237487,774604,136
• P rojected figures.•• F or Goa, Daman and Diu figures are final.
S ou rce ; — Censxis o f India, 1981.
IH
ION TOTALS 1981 CENSUS (ConcU.)
Total population 1981 ^ Total literates 1981 '
Male's Females Persons Percentage to total
3 4 5 6
171,959 143,723 106,780 33.8224,420,228 23,877,228 22,111,593 45.781,057,714 1,002,475 856,688 41.58
58,780,640 52,077,379 30,358,013 27.3828,505,151 25,980,409 22,271,857 40.88
106,88!) 81,365 96,520 51.27335,941 292,109 126,185 20.09254,208 195,853 291,091 64.6852.514 51,163 27,578 26.60
3,422,550 2,773,864 — 3,783,611 • 61.06548.450 538,280 615,752 56.6620,367 19,870' ' 22,018 •-54.72-^
251,988 235,786 290,241 59.50304,342 299,794 327,600 54.23
17
\\. A m
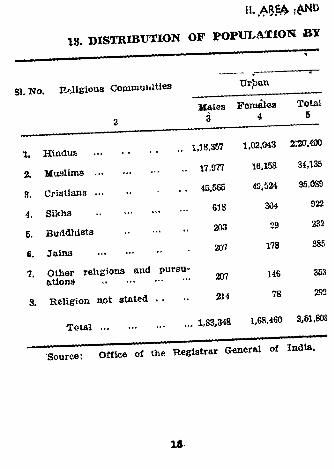
13. DISTRIBUTION OF P0PUL*^TI01S BX
51, No. P.«iligiou3 Commuuities XjTpsxn
Males Females 3 4
Total5
1,18.^7 1,02,043 230.4001. H indus ........................
17,977 16,158 34,1352. Muslims
. . 45,565 49,524 95,0893. C r is t ia n a ...............
618 304 9224. Sikhs
5. Buddhists 203 29 232
207 178 386fi. Jaina
7. Other religions and pursu-... 207 146 353
ations .............
8. R elig ion not stated 214 78 292
T ota l .............. ............. 1,83,348 l,6S.460 3,61,808
Source: Office of the Registrar General of India.
15
POPUUTION
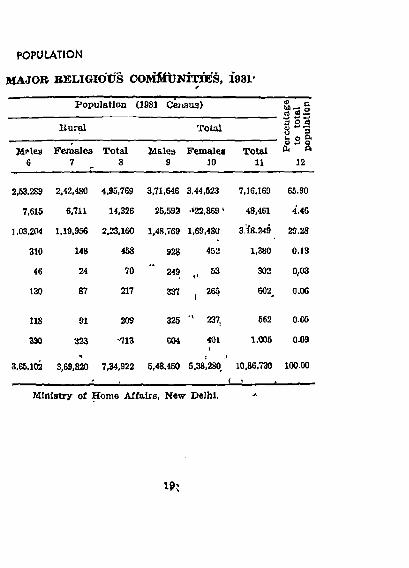
MAJOR BELIGldtJS CH>»lSttJNiTieS, 1981'
Population '(1981 Cejisus) <l> cb a o
B u r^ T otal■g O dr d
MPles6
Females7
Total8
Males9
Females10
Total11 12
2.53.289 2,42,480 4,95.769 3,71,646 3.44,523 7.16.169 66.90
7,615 6,711 14,326 25,593 *»22,869' 48,461 4.4G
1,03,204 1.19,956 2,23,160 1,48,769 1,69,480 3.18.249 29.28
310 148 468 92$ 452 1,380 0,13
46 24 70 249 302 0,03
130 87 217 337 , 26^ 602 O.OG
118 ffl 209 325 ■' 237, 662 0.05
330 323 ■ 13 G04 401(
1,005 0.09
3,65.102 3,69,820 7,34,922 6,48.450!
5,38,280I
10,86,730 100.00
Ministry of Home Affairs, New Delhi.
1?^
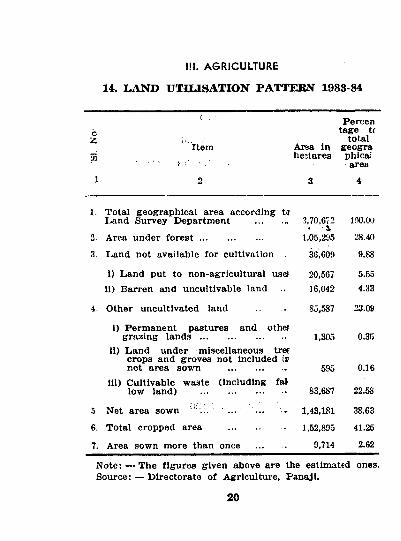
lil. AGRICULTURE
14. LAND UTILISATION PATTERN 1983-84
b
pQ
1
( . ■
Item
2
Area in heitares
3
Percen tage tf
total geogra phica! area
4
1. Total geographical area according ta Land Survey Departm ent ............. 3.70,672 100.00
2 Area under f o r e s t ..........................* -S.
1,05,295 28.40
3. Land not available for cultivation 36,609 9.88
1) Land put to non-agricultural usef 20,567 5.55ii) Barren and uncultivable land 16,042 4.33
4. Other uncultivated land 85,587 23.09
1) Perm anent pastures and otha grazing l a n d s ................................... l,3a’5 0.35
11) Land under miscellaneous tree crops and groves not included ir net area sown ...................... . 59"> 0.16
iil) Cultivable waste (including fai low land) ................................... 83,687 22.58
5. Net area sown ... ... 1,43,181 38.63
6. Total cropped area .............. 1,52,895 41.25
7. Area sown m ore than once 9,714 2.62
^Jote: — The figures given above are the estimated ones. Source: — D irectorate o f Agriculture, Panajl.
20
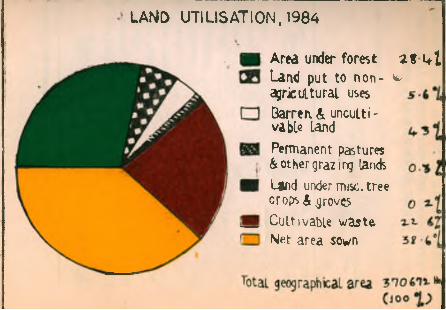
LAND UTILISATION. 1984
Area under forest i f w l Land put to non- ^ agricuLtural uses Darren. & unculti- vabU Land
Permanent pastures Mother grazing landsLtnd under m»sc. treecrops 4 provesCultivable waste Net area sown
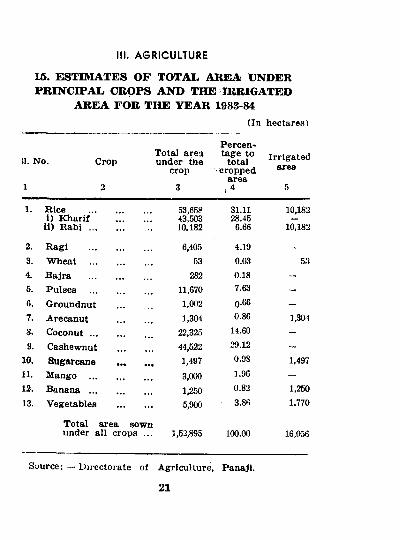
III. AGRICULTURE
15. ESTIMATES OF TOTAL AREA UNDER PRINCIPAI, CROPS AND THE IRRIGATED
AREA FOR THE YEAR 1983-84(In hectares)
51. No.
1
Crop
2
Total area under tJie
cropIrrigated
Percentage to
total ■ cropped
area, 4 5
1. R ice ..........................1) Khar if ..............
ii) R a b i ..............
53,65843,50310,182
31.1128.456.66
10,182
10,182
2. R agi .......................... 6,405 4.19 -
3. W heat .......................... 53 0.03 534. Bajra .......................... 282 0.18 -5. Pulses .......................... 11,670 7.63 -6. Groundnut .............. 1,002 0.66 -7. Arecanut ............... 1,304 0.86 1,3048. Coconut ............ 22,325 14.60 -9. Cashewnut ............... 44,522 29.12 -
10. Sugarcane 1,497 0.98 1,49711. Mango .......................... 3,000 1.96 -12. Banana .......................... 1,260 0.82 1.25013. Vegetables ............... 5,900 3.86 1.770
Total area sown vinder all crops ... 1,52,895 100.00 16,056
Source: — Directorate of Agriculture, Panaji.
21
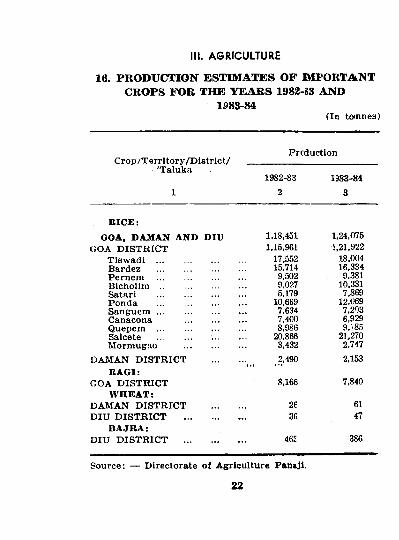
III. AGRICULTURE
16. PRODUCTION ESTIMATES OF BIPORTANT CROPS FOR THE YEARS 1982-J3 AND
1983-84(In tonnes)
PrcductionC rop /T erritory /D istrict/
'Taluka1982-83 1983-84
1 3 3
B IC E :GOA, DAMAN AND DIU 1.18,451 1,24,075
GOA DISTRIC T 1,15,961 1,21,922Tisw adi ..................................... 17,552 18,004Bardez ..................................... 15,714 16,334Pem em ..................................... 9,502 9,381B ic h o l im ..................................... 9,027 10,331Satari ..................................... 5,179 7.869Fonda ..................................... 10,669 12.069Sanguem ..................................... 7,634 7,203Canacona .......................... 7,400 6,929Quepem ..................................... 8,986 9,'85Salcete .............. 20,866 21,270Mormugao 3,432 2,747
DAMAN D ISTRICT ............. 2,490 2,153B A G I:
GOA D ISTRICT 8,166 7,840W H EAT:
DAMAN DISTRICT .............. 26 61DIU D IST R IC T .......................... 36 47
B A JK A :DIU D ISTRIC T .............. 46c 386
Source: — Directorate o f Agriculture Pan&ji.
22
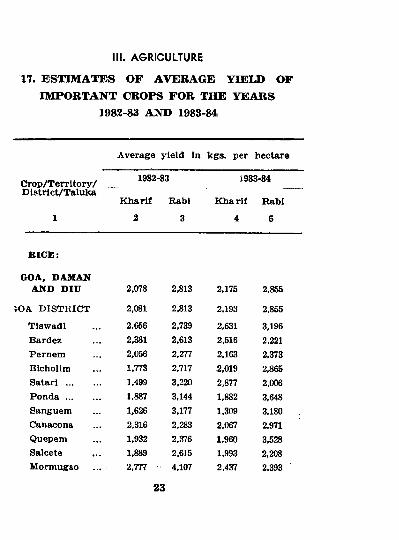
17. ESTIMATES OF AVERAGE YIELD OF IMPORTANT CROPS FOR THE YEARS
1982-83 AND 198S-84
III. A&RICULTURE
Average yield in kgs. per hectare
C rop /T erritory /D lstrict/T aluka
1982-83
K h arlf Rabl
2 3
1983-84
K h arif R abi
4 5
B IC E :
GOA, DAMANAND DIU 2,078 2,813 2,175 2,855
A. D ISTR ICT 2,081 2,813 2.193 2,855
Tiawadl 2,656 2,739 2,631 3,196Bardez 2,381 2,613 2,516 2,221Pem em 2,056 2,277 2,163 2,373Bichollm 1,773 2,717 2,019 2,865S a t a r i .............. 1,499 3,220 2,877 2,006Ponda .............. 1,887 3,144 1,882 3,648Sanguem 1,626 3,177 1,309 3,180Canacona 2,316 2,283 2,067 2,971Quepem 1,932 2,376 1,960 3,528Salcete 1,889 2,615 1,993 2,208Mormugao ... 2,777 • 4,107 2,437 2,393
23
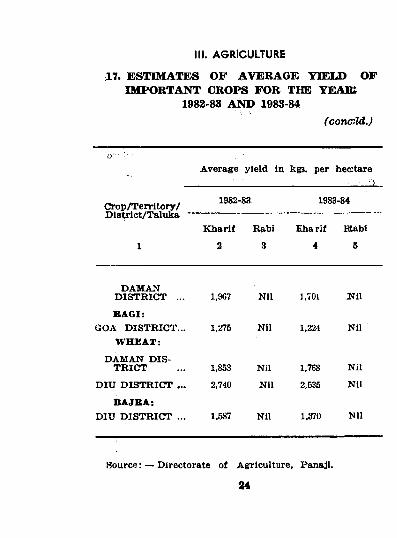
17. ESTIMATES OF 4>VEBAGE YIELD OF IMPORTANT CROPS FOR THE YEAR:
1982-83 A ^ 1983-84( c o n o i d . )
III. AGRICULTURE
Average yield In k|3. per hectare
C rop /T erritory / 1982-83 1983-84.Dist,rict/Taluka '
1
K harif
2
Rabi
3
Eharif
4
H abi
6
DAMAN D IST R IC T ... 1,967 Nil 1,701 N il
B A G I:GOA DISTRIC T... 1,275 Nil 1,224 Nil
W H E A T :
DAMAN D IST R IC T 1,853 Nil 1,768 Nil
DIU D IST R IC T ... 2,740 Nil 2,535 Nil
B A JB A :DIU D IST R IC T ... 1,587 Nil 1,370 Nil
Source: — Directorate o f Agriculture, Panaji.
24
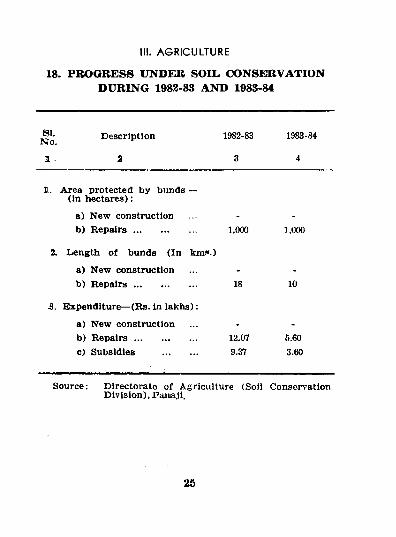
18. PROGRESS UNDER SOIL CONSERVATION DURING 198Z-8S AND 1988-84
III. AGRICULTURE
SI.NTo. Description 1982-83 1983-84
1 2 3 4
1. Area protected by bunds — (In h ectares):
a) New construction - -
b) R e p a ir s .......................... 1,000 1,000
2. Length o f bunds (In km/».)
a) New construction - -b) R e p a ir s .......................... 18 10
3. Expenditure— (R s. In lak h s):
a) New construction - -
b) R e p a ir s .......................... 12.07 5.60c) Subsidies .............. 9.37 3.60
Source: D irectorate o f Agriculture (Soli ConserA^atlonD ivision), Panaji.
25
ill. AGRICULTURE
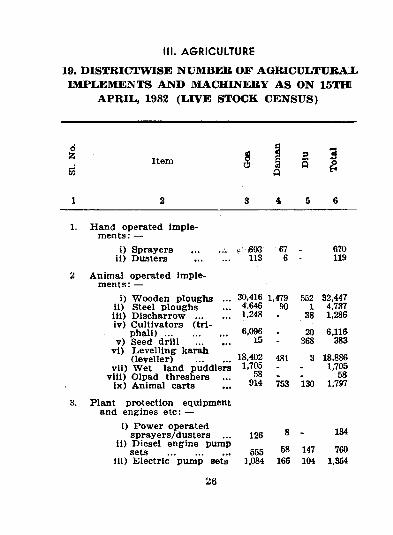
19. DISTBICTWISE NUMBER OF AGMCULTUBAXIMPLEMENTS AND MACHINERY AS ON 15THI
APRIL, 1983 (LIVE STOCK CENSUS)
Item
3 4 5 6
■r . S03 67 670113 6 119
30,416 1,479 552 32,4474.646 90 1 4,7371,248 - 38 1,286
6,096 20 6,11615 - 368 383
18,402 481 3 18,8861,705 1,705
58 . _ 58914 753 130 1,797
126 8 . 134
555 58 147 7603,084 166 104 1,364
1. Hand operated im plements : —
1) Sprayers ii) Dusters
2 Anim al operated im plem ents: —
i) W ooden ploughsii) Steel ploughsiii) D ischarrowiv) Cultivators (tri-
phali) ...v ) Seed drill
v i) Levelling karah (leveller)
v ii) W et land puddlers v iii) Olpad threshers
ix ) Animal carts
.H. Plant protection equipment and engines etc: —
1) Pow er operated sprayers/dusters ...
ii) D iesel engine pumpsets ..........................
iii) Electric pump sets
26
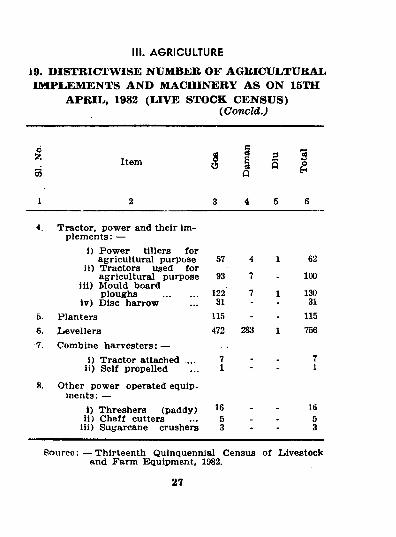
19. DISTBICTWISE NUMBER OF AGBICULTUBAL IMPLEMENTS AND MACHINERY AS ON 15TH
APRIL, 1982 (LIVE STOCK CENSUS){Concld.)
III. AGRICULTURE
1 2 3 4 5 6
4. T ractor, pow er and their implem ents: —
i) P ow er tillers for agricultural purpose 57 4 1 62
ii) Tractors used for agricultural purpose 93 7 100
iii) M ould boardploughs .............. 122 7 1 130
iv) D isc harrow 31 - - 316. Planters 115 - - 1156. Levellers 472 283 1 7567. Combine harvesters: —
i) Tractor attached ... 7 7ii) Self propelled 1 ■ - 1
8. Other pow er operated equipm ents: —
i) Threshers (paddy) 16 16ii) C heff cutters 5 . 5
iii) Sugarcane crushers 3 - - 3
S ource: — Thirteenth Quinquennial Census o f Livestock and Farm Equipment, 1982.
27
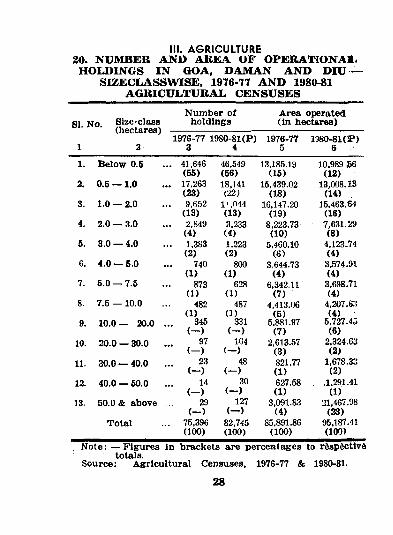
III. AGRICULTURE20. NUIVIBEB AND AREA OF OPERATIONAL. HOLDINGS IN GOA, DAMAN AND DIU
SIZECLASSWISE, 1976-77 AND 1980-81 AGRICULTURAL CENSUSES___________
Number of Area operatedSI. No. Size-class holdings (in hectares)
(hectares)1976-77 1980-8KP) 1976-77 1980-8K1P)
1____________ r _________ 3_________ 4_________ 5__________ 6
1. Below 0.5 ... 41,646 46,549 13,185.19 10,989.B6(56) (56) (15) (12)
2. 0.5 — 1.0 ... 17,263 18,141 15,439.02 13,008.13(23) (22; (IS) (14)
S. 1.0 — 2.0 ... 9,652 l',044 16,147.20 15.463.64(13) (13) (19) (16)
4. 2.0 — 3.0 ... 2,849 3.233 8,223.73 7,631.29(4) (4) (10) (8)
5. 3.0 — 4.0 ... 1.3f53 1,223 5,460.10 4,123.74(2) (2) (6) (4)
6. 4.0 — 5.0 ... 740 800 3,644.73 3,574-91(1) (1) (4) (4)
7. 5.0 — 7.5 ... 873 628 6,342.11 3,698.71(1) (1) (7) (4)
8. 7.5 — 10.0 ... 482 487 4,413.06 4,207-6;!(1) (1) (5) (4)
9. 10.0 — 20.0 ... 345 331 5,881.97 5,727.45(— ) ( - ) (7) (6)
10. 20.0 — 30.0 ... 97 104 2,613.57 2.324SJ( - ) ( - ) (3) (2)
11. 30.0 — 40.0 ... 23 48 821.77 1.678.33(— ) ( - ) (1 ) (2)
12. 40.0 — 50.0 ... 14 30 627.58 ,1,291.41(— ) (—) (1) (1)
13. 50.0 & above ... 29 127 3,091.83 21,467.98(— ) (— ) (4) (23)
Total ... 75,396 82,745 85,891.86 95,187.41__________________________(100) (100) (ICO) (100)
Note: — Figures in brackets are percentages to rSspfectlvd totals.
Source: Agricultural Censuses, 1976-77 & 1980-81.
28
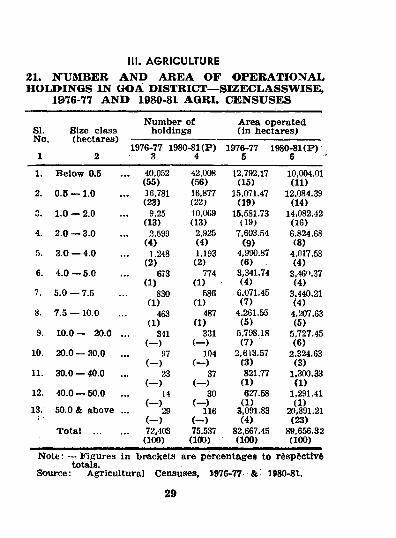
21. NUMBER AND AREA OF OPERATIONAL HOLDINGS IN GOA DISTRICT— SIZECLASSWISE,
1976-77 AND 1980-81 AGRI. CENSUSES
III. AGRICULTURE
SI.No.
Size class (hectares)
Num ber o f holdings
Area operated (in hectares)
1976-77 1980-81 (P ) 1976-77 3 4 5
1980-81 (P ) : 6
1. B«low 0.5
2. 0.5 —1.0
3. 1.0 — 2.0
4. 2.0 — 3.0
5. 3.0 — 4.0
6. 4.0 —5.0
7. 5 .0 — 7.5
8. 7.5 — 10.0
9. 10.0 — 20.0
10. 20.0 — 30.0
11. 30.0 — 40.0
12. 40.0 — 50.013. 50.0 & above
) ■Total ...
40,052(55)16,781(23)
9,25(13)
2,599(4)
1,248(2)
673(1)
830(1)
463( 1)
341( - )
97( - )
23( - )
14( - )
29( - )72.403(100)
42,008 (56) 16,877 (22) 10,069 (13)
2,925 (4) 1,193 (2)
774 (1)
586 (1)
487 (1)
331 (— )
104 (— )
37 (— )
30 (— )
116 ( - ) 75,537 (100)
12,792.17(15)
15,071.47(19)
15,581.73(19)
7,603.54(9)
4,990.87(6)
3,341.74(4)
6,071.45(7)
'4,261.55(5)
5,798.18(7)
2,613.57(3)821.77
(1)627.58
(1)3,091.83(4)
82,667.45 (100)
10,004.01(11)
12.084.39(14)
14i082.42(16)6,824.68(8)
4,017.58(4)
3,46<*.37(4)
3.440.21(4)
4.207.63(5)
5,727.45(6)
2.324.63(3)
1,300.33(1)
1,291.41(1)
20.891.21 (23)
89,656.32(100)
N ote: — Figures in brackets are percentages to r6»pfectiv6 totals.
Source: Agricultural Censuses, 1976-77 &■ 1980-81.
29
IV. AN IM AL HUSBANDRY
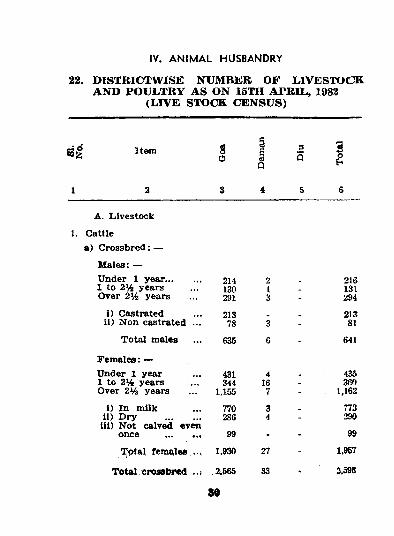
22. DISTRICTWISE NUMBER OF LIVESTOCKAND POULTRY AS ON 15TH APRIL, 1982
(LIVE STOCK CENSUS)
s | Item
A. Livestock
1. Cattlea) C rossbred : —
M ales: —Under 1 year... ... 214 21 to 2 % years ... 130 1Over 21 years ... 291 3
i) Castrated ... 213ii) Non castrated ... 78 3
T otal males ... 635 6
Fem ales:Under 1 year ... 431 41 to 2 % years ... 344 16Over 2Vi years ... 1,155 7
1) In milk ... 770 3ii) D ry .............. 286 4lii) Not calved even
once ............ 99Tjptal fema,les 1.930 27
Total crossbred 2 665 33
216131294
21381
641
435360
1,162
773290
99
1,957
3.598
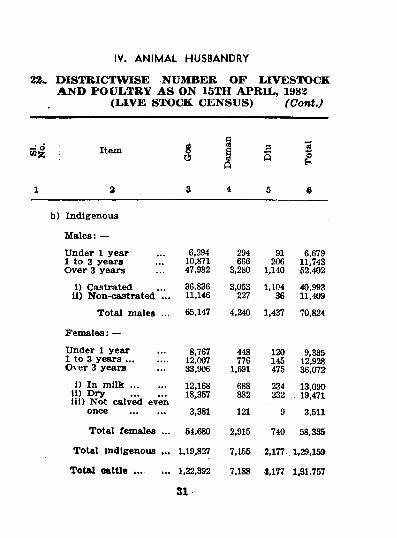
IV. AN IM AL HUSBANDRY
DISTRICTWISE NUMBER OF LIVESTOCKAND POULTRY AS ON 15TH APRIL, 1982
(LIVE STOCK CENSUS) (Ccmt.)
53| Item %o i 35 1
2 3 4 5 6
Indigenous
M ales: —
Under 1 year 1 to 3 years Over 3 years
6,29410,87147,982
294666
3,280
91206
1,140
6,67911,74352,402
i) Castratedii) N on-castrated ...
36,83611,146
3,053227
1,10436
40,99311,409
T ota l males ... 65,147 4,240 1,437 70,824
F em ales: —
Under 1 year1 to 3 y e a r s ................Over 3 years
8,76712,00733,906
448776
1,691
120145475
9,33512,92836,072
i) In m i l k ...............11) D ry ...............ill) N ot calved even
once ...............
12,16818,357
3,381
688882
121
234232
9
13,09019,471
3,511
T otal fem ales ... 54,680 2,915 740 58,335
T otal indigenous ... 1,19,827 7,155 ,2.177. 1,29,159
T ota l eattle ... 1,22,392 ,7.188 :,177 1.31,757
31
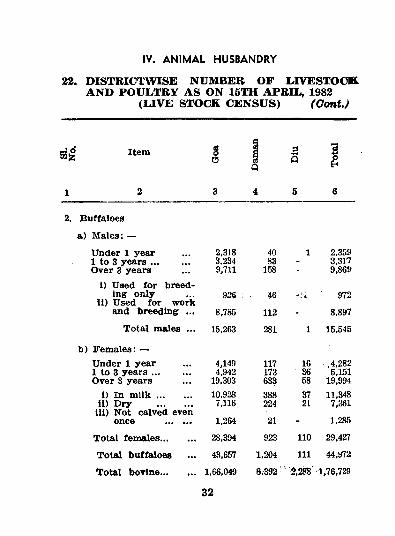
IV. AN IM AL HUSBANDRY
22. DISTRICTWISE NUMBER OF LIVESTOCKAND POUL,TR¥ AS ON 15TH APRIL, 1982
(LIVE STOCK CENSUS) (ContJ
Item
2. Buffaloes
a) M ales: —
Under 1 year 2,318 40 1 2,3S91 to 3 y e a r s ................ 3,234 83 - 3,317Over 3 years 9,711 158 - 9,869
i) Used for breeding only
li) Used for work926 . 46 u ■ 972
and breeding ... 8,785 112 - 8,897
T ota l males ... 15,263 281 1 15,545
Fem ales: —Under 1 year 4,149 117 16 , ,4,2821 to 3 y e a r s ................ 4,942 173 36 5,151Over 3 years 19,303 633 58 19,994
I) In m i lk .............. 10,923 388 37 11,34811) D ry ..............
ill) Not calved even7,116 224 21 7,361
once ........... 1,264 21 * 1,285
Total fem ales.............. 28,394 923 110 29,427
T otal buffaloes 43,657 1,204 111 44,972
Total bovine.............. 1,66,049 8;3g2 ■3,2^ ' 1,76,729
32
IV. A N IM A L HUSBANDRY
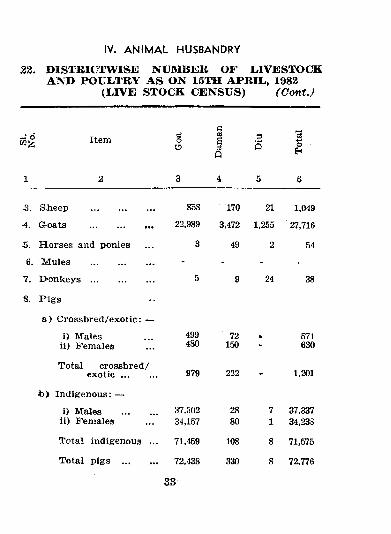
22. DISTRICTWISE NUMBER OF LIVESTOCKAND POULTRY AS ON ISl'H APRIL, 1982
(LIVE STOCK CENSUS) {ContJ
—• d ItemO
cb31Q
30
3
1 2 3 4 5 6
3. S;heep .......................... 858 170 21 1,049
4. G oats .......................... 22,989 3,472 1,255 27,716
S. H orses and ponies 3 49 2 54
6. M ules .......................... - - - -
7. I > o n k e y s .......................... 5 9 24 38
« . P igs
a ) C rossbred /exotic: —
i) Malesii) Females
499480
72150
* 571630
Total crossbred / e x o t i c ............... 979 222 - 1,201
to) Indigenous: —
i) Males ...............ii) Females
37.S0234,157
2880
71
37,33734,233
Total indigenous ... 71,459 108 8 71,575
Total pigs ............... 72,438 330 8 72,776
33
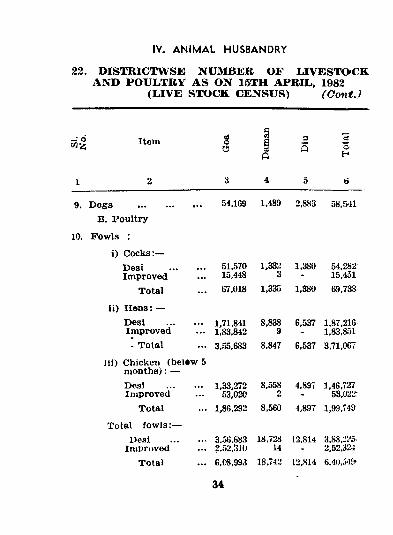
22. DISTRICTWSE NUMBER OF LIVESTOCK AND POULTRY AS ON 15TH APRIL, 1982
(LIVE STOCK CENSUS) (ContJ
IV. AN IM AL HUSBANDRY
Item
9. D ogs ..........................B. P ou ltry
10. F ow ls :
i) C ocks:—D esl ...............Im proved
Total
ii) HM is: —Deai ...............Im proved* Total
iii) Chicken (bel«w 5 m ontha): —Desl ...............Im proved
Total
T otal fo w ls :—Desi ...............
IniprovedTotal
54,169 1,489 2,883 58,541
51,57015,448
1.71.8411.83.8423.55,683
1,33.27253,020
1,3323
1,380 54,28215,451
67,018 1,335 1,380 69,733
98,847
8,5582
1,86,292 8,560
6.537 1,87,216 1,83,851
6.537 3,71,067
4.897 1,46,72753,022-
4.897 1,99,749
3,56,683 18,728 2,52,310 146,08,993 18J42 12,814 6,40,548»
12,814 3,88,225- 2,52,324
34
23. mSTBICTWSE NUMBER OF ULVESTOCK AND POULTRY AS ON 15TH APRIL, 1982
(LIVE STOCK CENSUS) (ConcU.)
IV. AN IM AL HUSBANDRY
— d02'z Item g
O
cC3eC3Q
5soh
1 2 3 4 5 «
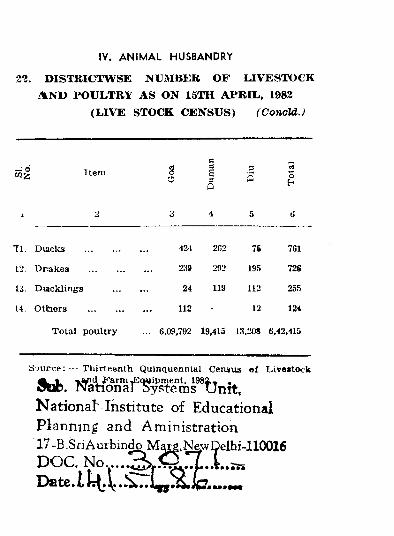
11. Duiclcjs 424 262 75 761
1 2 . D rakes .............. 23» 292 195 726
13. Duicklings 24 119 112 255
14. Others ............... 112 - 12 124
Total poultry ... 6,09,792 19,415 13,208 6,42.415
ti;>urce: — Thirteenth Quinquennial Census o f L ive«tock
9 d b ,
Nationaf-Institute of Educational Planning and A ministration 17-B ,SnAurbm^M^.N^wC)elhi-110016 D O C.
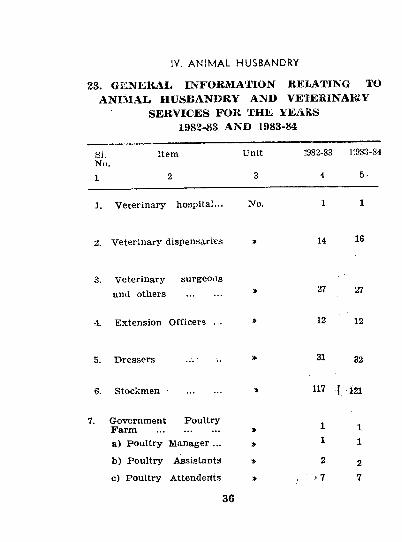
23. GSilNKBAL INFORMATION RELATING TO ANIMAL, HUSBANDRY AND VETEKINAKiY
SERVICES FOR THE YEARS1982-83 AND 1983-84
IV. AN'IMAL HUSBANDRY
S I . Item Unit 1982-83 1J983-84No,1 2 3 4 5-
1. Veterinary hospital... No. 1 1
2. Veterinary dispensaries » 14 16
3. Veterinary surgeonsand otliers .............. * 27 27
•1. Extension Officers ... » 12 12
5. D ressers ... •• ^1 32
6. Stockmen ■ .............. * I 121
7. Government P oultry Farm .......................... 1 1a) Poultry Manager ... » 1
b ) P oultry Assistants » ^ 2
c) Poultry Attendents > ; '
36
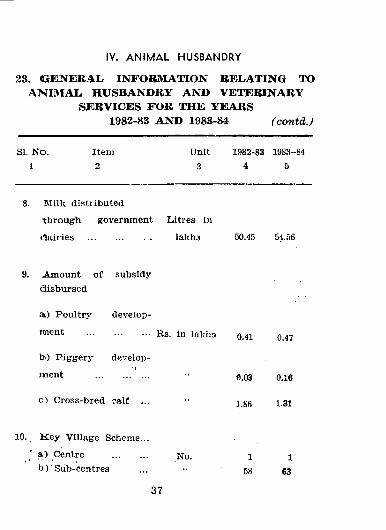
23. GEJ^EBAL. INFORMATION RELATING TO AN »IAL. HUSBANDRY AND VETERINARY
SERVICES FOR THE YEARS1983-83 AND 1983-84 (contd.)
SI. N o. Item Unit 1982-83 1983-841 2 3 4 5
IV. AN IM AL HUSBANDRY
8 . MilK distributed
th rou gh governm ent Litres in
dairies .......................... lakhs 50.45 54.56
9. A m ou nt o f subsidy d isbursed
a ) P oultry de’/e lop -
.......................... Rs. in lakhs q.41 0.47
b ) P iggery develop
m ent ...................... 0 03 0.16
c ) Cross-bred calf ... ” j gg 31
10. K e y V illage Scheme...
Centre ............... No. 1 1
b ) ' Sub-centres ... •• 58 63
37
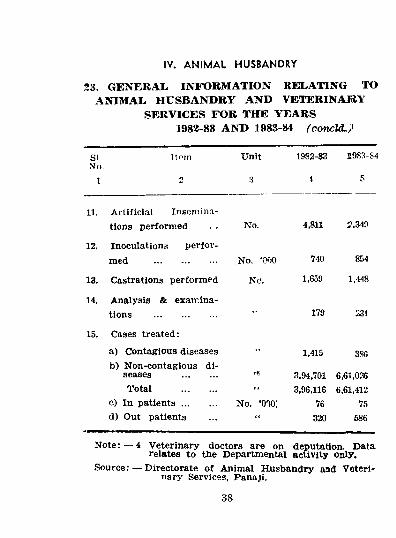
23. GENERAL INFORMATION RELATING TO ANIMAL HUSBANDRY AND VETERINARY
SERVICES FOR THE YEARS1982-88 AND 1983-84 (concld.^>
IV. AN IM AL HUSBANDRY
SINo.
1
I loin Unit 1982-83
i
1983-84
5
11. Artificial Inseminations perform ed No. 4,811 2,349
12. Inoculations performed .......................... No. '000 740 854
13. Castrations perform ed No. 1,659 1,448
14. Analysis & exam inations .......................... 179 231
15. Cases treated:
a) Contagious diseases 1,415 3S6b ) Non-contagious d i
seases .............. 3,94,701 6,61,026Total .............. 3,96,116 6,61,412
c) In p a t ie n ts .............. No. ‘ooo: 76 75d) Out patients “ 320 586
N ote : — 4 Veterinary doctors are on deputation. Data relates to the Departmental activity only.
Source: — Directorate o f Animal H usbandry and Veterinary Services, Panaji.
38
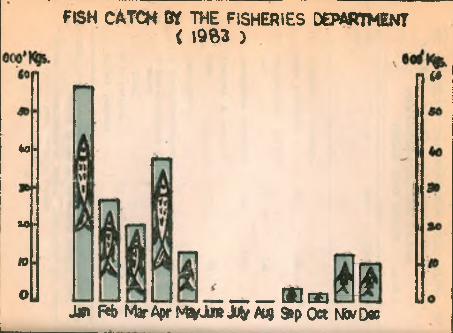
40>
a o>
n
o
FISH catch W the fisheries OEPMffMlNT< 1 9 6 3 )
(•
uir____ ____ E E o q ___
J«i (%b MarAprNtt kisJi Ats 9>pOct NtvOes
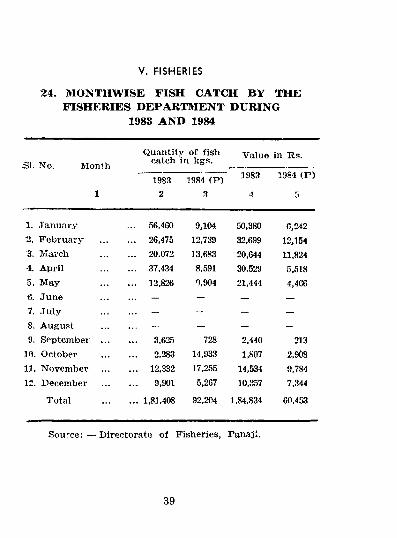
24. MONTHWISE FISH CATCH BY THE FISHERIES DEPARTMENT DURING
1988 AND 1984
V. FISHERIES
:31. No. MonthQuantity o f fish
catch in kgs. Value in Rs.
1983 1984 (P ) 1983 1984 (P )
1 2 3 4 5
1. January ... 56,460 9,104 50,380 6,242February ... 26,475 12,739 32,699 12,154
3. March ... 20.072 13.683 20,644 11,8244. April ... 37,434 8,591 30,529 5,5185. May ... 12,826 0,904 21,444 4,-166f). June ... — — — —7. July ... - - - -8. August ... - - - -9. September ... 3,625 728 2,440 213
10. October 2,283 14,933 1,807 2,i90811. November ... 12,332 17,255 14,534 9,78412. December 9,901 5,267 10,357 7,344
Total ... 1,81,408 92,204 1,84,834 60,453
Sou*-ce:— Directorate o f Fisheries, Panaji.
39
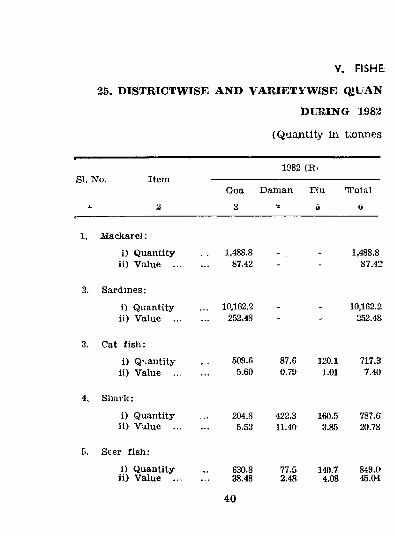
25. DISTRICTWISE AND VAIIIETYWISE QJUAN
DURING 1983
(Quantity in ttonnes
V. FISHE
SI. No. ItemGoa
3
1982 (R ,
Daman Diu TTotal
6
1, M ackarel;
i) Quantityii) Value ...
1,488.887.42
1,488.887.42-
2. Sardines:
i) Quantityii) Value ...
10,162.2252.48
10,162.2252.48
3. Cat fish :
i) Quantityii) Value ...
509.65.60
87.6 120.1 717.30.79 1.01 7.40-
4. Shark:
i) Quantityii) Value
204.8 422.3 160.5 787.ff5.53 11.40 3.85 20.78
5. Seer fish :
i) Quantityii) Value
630.8 77.5 140.7 849.0-38.48 2.48 4.08 45.04
40
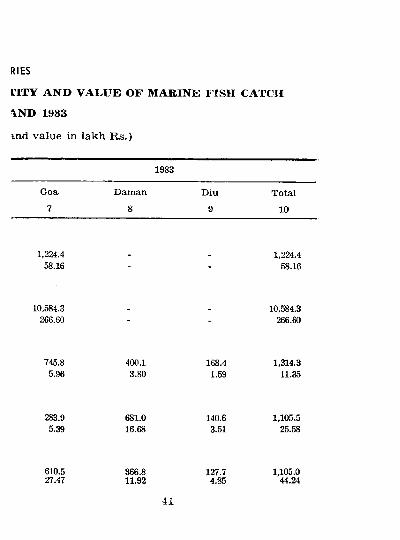
RIES
riTY AND VALUE OF MARINE FISH CATCH
\ND 1983
ind value in lakh Rs.)
1983
Goa Daman Diu Total7 8 9 10
1,224.4 1,224.458.16 ■ ■ 58.16
10,584.3 10,584.3266.60 “ ■ 266.60
745.8 400.1 168.4 1,314.35.96 3.80 1.59 11.35
283.9 681.0 140.6 1,105.55.39 16.68 3.51 25.58
610.5 366.8 127.7 1,105.027.47 11.92
41
4.85 44.24
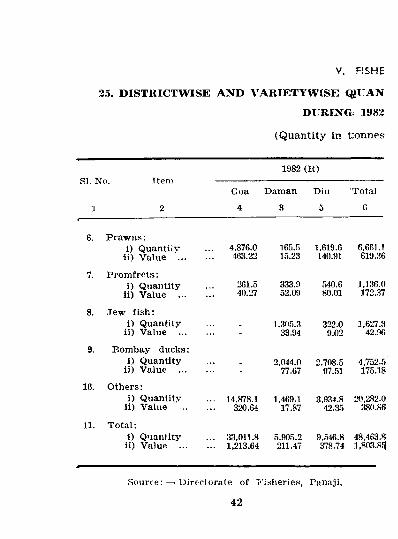
25. DISTRICTWISE AND VARIETYWISE QJUANDURING 1982
(Quantity in tonnes
V. FiSHE
1982 (R )
Goa Daman Diu •Total
i 2 4 3 5 6
6. P raw n s:i) Quantity
ii) Value ...... 4,876.0
m .22165..'S15.23
1,619.6140.91
6,661.1619.36
7. P rom fre is :i) Quantity
ii) Value ...261.540.27
333.952.09
540.680.01
1,136.0172.37
8. Jew fish :i) Quantity
ii) Value ...... 1,305.3
33.94322.09.02
1,627.342.96
9. Bom bay ducks:i) Quantity
ii) Value ...... 2,044.0
77.672,708.5
97.514,752.5175.18
10. Others:i) Quantity
ii) Value... 14.878.1
320.641,469.1
17.873,934.8
42.3520,282.0
380.8^
11. T otal:i) Quantityii) Value ...
... 33.011.8 ... 1,213.64
5.905.2211.47
9,546.8378.74
48,463.«1,803.8^
Source: — Directorate of J'isheries, Panaji.
42
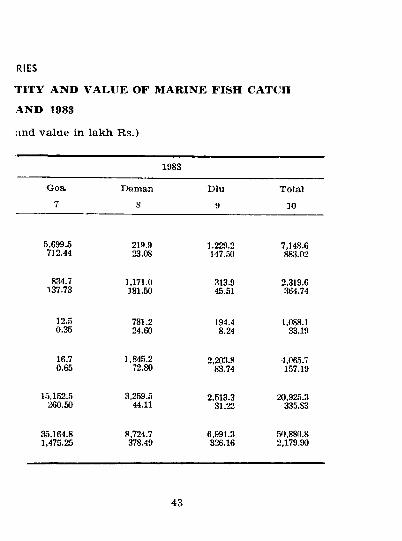
RIES
TITY AND VALUE OF MARINE FISH CATCH
AND 1983
and value in lakh Rs.)
1983
Goa. Daman Diu Total7 8 9 10
5.699.5 219.9 1.229.2 7,148.6712.44 23.08 147.50 883.02
834.7 1,171.0 313.9 2,319.6137.73 181.50 45.51 364.74
12.5 781.2 194.4 1,088.10.35 24.60 8.24 33.19
16.7 1,845.2 2,203.8 4,065.70.65 72.80 83.74 157.19
15.152.5 3,259.5 2,,513.3 20,925.3260.50 44.11 31.22 335.83
35,164.8 8,724.7 6,991.3 50,880.81,475.25 378.49 326.16 2,179.90
43
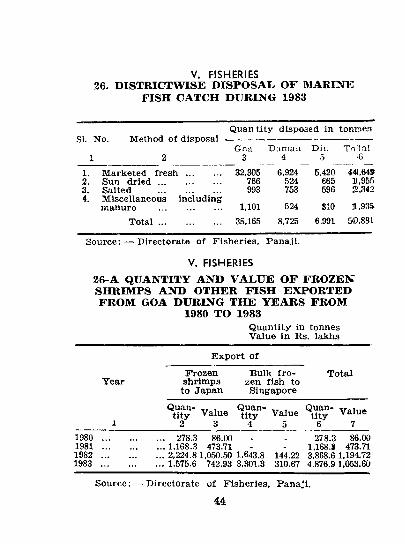
V. FISHERIES26. DISTRICTWISE DISPOSAL, OF MARINE
FISH CATCH DURING 1983
Q uantity disposed in tonineft SU No. Method o f disposal ----------------------------- ----------------------
1 2Goa
3Daman
4Diu
5To^tal
•6
1. M arketed f r e s h .............. 32,305 6,924 5,420 441,6492. Sun d r i e d .......................... 766 524 665 11,95.53. Salted .......................... 993 753 596 2,3424. Miscellaneous including
manure .......................... 1,101 524 810 1,935T o t a l .......................... 35,165 8,725 6,991 5(0,881
Source: — Directorate o f F isheries. Panaji.
V. FISHERIES
26-A QUANTITY AND VALUE OF FROZEN SHRIMPS AND OTHER FISH EXPORTED FROM GOA DURING THE YEARS FROM
1980 TO 1983Quantity in tonnes Value in Rs. lakhs
E xport o f
Frozen Bulk fro - T ota lY ear shrim ps zen fish to
to Japan Singapore
Quan- , Quan- , Quan-tity Value tity Value y ty
2 3_____4 5 6 79 7 S Q BC m _ _ 0 7 a 9 Rfi m1980 ........................................ 278.3 86.00 - - 278.3 86.00
1981 ........................... 1,168.3 473.71 - - 1,168.8 473.711982 ............ 2,224.8 1,050.50 1.643.8 144.22 3,868.6 1,194.721983 .......................... 1,575.6 742.93 3,301.3 310.67 4,876.91,053.60
Source ; — Directorate o f F isheries, Panaji.
44
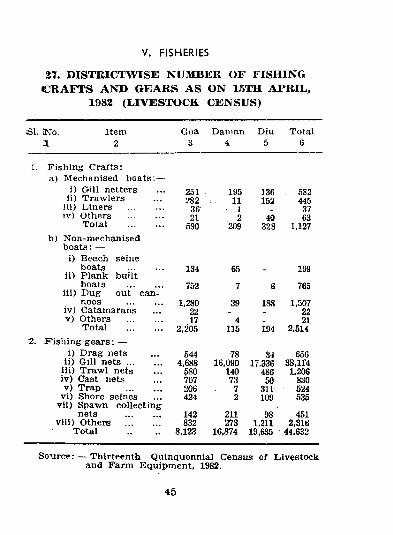
V. FISHERIES
27. DISTBICTWISE NUMBER OF FISHINGCRAFTS AND GEARS AS ON 15TH APRIL,
1982 (LIVESTOCK CENSUS)
SI. BMo. Item Goa Daman Diu Totala 2 3 4 5 6
1. F ishing Crafts;a) Mechanised b oa ts :—
1) G-ill netters 251 195 136 . 58211) Trawlers 282 . 11 152 445ill) L iners ............... 36 1 37iv) Others ............... 21 2 40 63Total ............... 590 209 328 1,127b) Non-mechanised
boats: —i) Beach seine
boats ............... 134 65 . 19911) P lank built
boats ............... 752 7 6 763iii) D ug out can-
noes ............... 1,280 39 188 1,507iv) Catamarans 22 22v) Others ............... 17 4 _ 21
Total ............... 2,205 115 194 2,5142: F ish in g g ea rs : —
i) D rag nets 544 78 84 656ii) Gill n e t s .............. 4,688 16,090 17,336 38,114
iii) Trawl nets 580 140 486 1,206iv) Cast nets 707 73 50 830V ) Trap ............... 206 7 311 524
V i ) Shore seines 424 2 109 535v i i ) Spawn collecting
nets ............... 142 211 98 451viii) Others .............. 832 273 1,211 2,316
Total 8,123 16,874 19,635 44,632
S ou rce : — Thirteenth Quinquennial Census of Livestock and Farm Equipm ent, 1982.
45
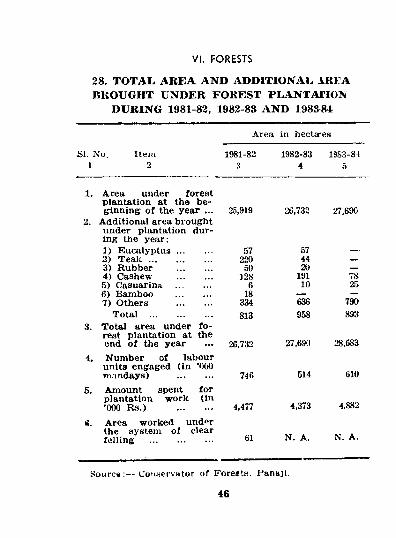
38. TOTAL AREA AND ADDITIONAL A.REA BROUGHT UNDER FOREST PL.ANTATION
DURING 1981-82, 1982-83 AND 198884
VI. FORESTS
Area In hectares
SI. No. Item 1981-82 1982-83 1983-841 2 4 5
1. Area under forest p lantation at the beg inn ing o f the year ... 25,919 26,732 27,690
2. A dditional area bi-ought under plantation during the year:1) K u ca ly p lu s ...............2) T e a k ..........................3) R ubber ..............4) Cashew ...............5) Casuarina ...............6) Bam boo ...............7) Others ...............
5722050
3286
18334
574420
19110
7825
790T otal .......................... 813 958 893
3. T otal area under fo rest plantation at the end o f the year 26,732 27,690 28,583
4. N um ber of labour units engaged (in ‘000 m andays) ............... 746 514 610
5. Am ount spent for plantation w ork (in '000 R s .) ............... 4,477 4,373 4,882
6. Area w orked und<ir the system o f clear felling .......................... 61 N. A, N. A.
S o iir c a C o iis e r v a to r ot Forests, Panaji.
46
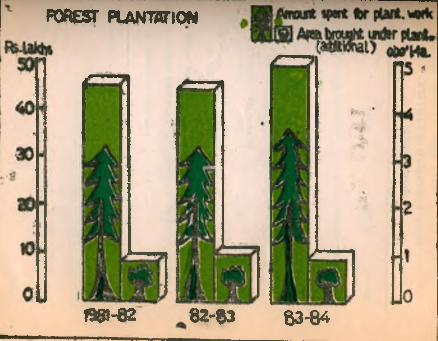
FQAESr PLANWION
199-62 8 2 - 6 3 83-84
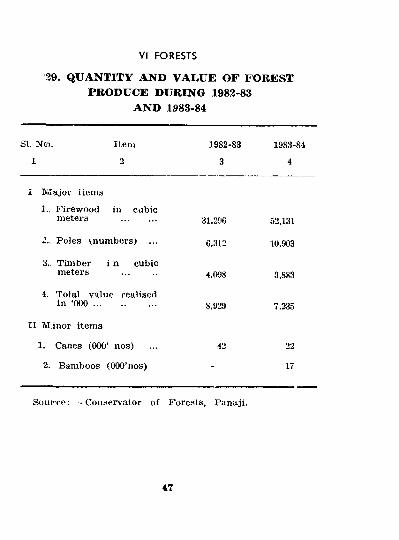
29, QUANTITY AND VALUE OF FOREST PRODUCE DURING 1983-83
AND 1983-84
VI FORESTS
SI. No). Item 1982-83 1983-811 2 3 4
I IVviajor items
1., F irew ood in cubic meters .............. 31,296 52,131
2.. Poles (,numbers) ... 6,312 10,903
3,. Tim ber i n cubic meters .............. 4.098 3,883
4. Total value realised in ‘000 .......................... 8,929 7,235
II M inor items
1. Canes (000’ nos) 42 22
2. Bamboos (OOO’nos) - 17
Source; — Conservator of Forests, Panaji.
47
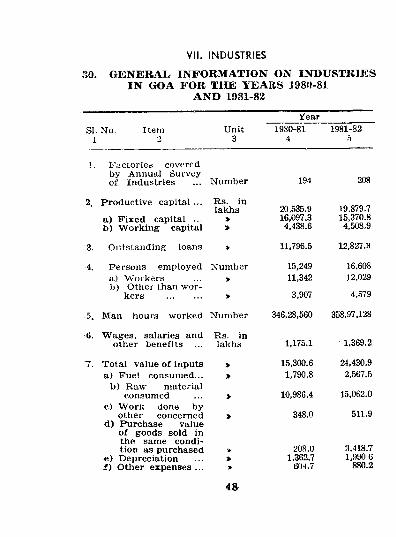
50. GENERAL INFORMATION ON INDUSTRIES IN GOA FOR THE YEARS 1980-81
AND 1981-82
VII. INDUSTRIES
SI. No. i
Item Unit3
Year1980-81
41981-82
Factories covered by Annual Survey o f Industries Number 194 208
2. Productive capital ... Rs. inlakhs 20,535.9
a) F ixed capital ... > 16,097.3b ) W orking capital » 4,438.6
3. Out.standing loans > 11,796.5
4. Persons em ployed Number 15,249a) W orkers ... » 11,342b) Other than w or
kers .... » 3,907
5. Man hours worked Number 346,28,560
19.879.715.370.8 4,508.9
12,827.3
16,60812,029
4,579
358,97,128
6. W ages, salaries and Rs. inother benefits ... lakhs
7. Total value o f inputs >a) Fuel consumed... *
b ) R aw materialconsumed ... »
c) W ork done byother concerned >
d) Purchase valueo f goods sold in the same condition as purchased >
« ) Depreciation ... »I ) Other expenses ... »
1,175.1
15,300.61,790.8
10,986.4
348.0
1,369.2
24,430.92,567.5
15,062.0
511.9
208.0 3,418.71,362.7 1.990.6
604.7 880.2
48
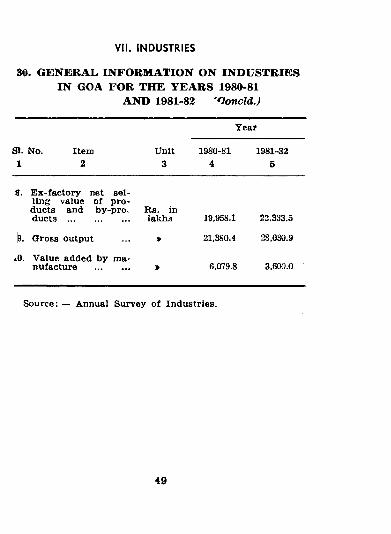
30. GENERAL INFORMATION ON INDUSTRIES IN GOA FOR THE YEARS 1980-81
AND 1981-82 'fioncldj
VII. INDUSTRIES
SI. No. 1
Item2
Unit3
Year
1980-814
1981-325
8. E x-factory net selling value of products and by-prov Rs. inducts .......................... Iakh3 19,958.1 22.333.5
b. Gross output ... * 21,380.4 28,030.9
lO. Value added by manufacture » 6,079.8 3,600.0
Source: — Annual Survey o f Industries.
49
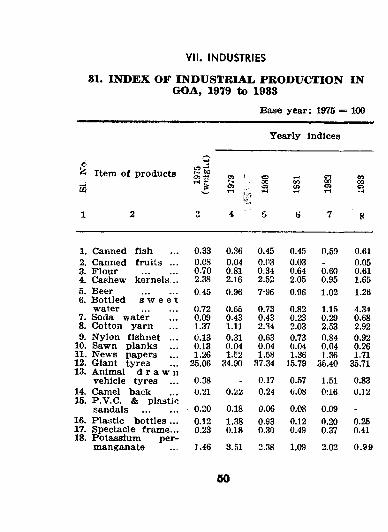
81. INDEX OF INDUSTRIAL, PRODUCTION IN GOA, 1979 to 1983
Base year: 1975 «= 100
Y early indices
VII. INDUSTRIES
^ Item o f products ,
1 2 3 4 5 B 7 8
1. Canned fish 0.33 0.36 0.45 0.45 0.59 0.612. Canned fruits ... 0.08 0.04 0.('3 0.03 _ 0.053. F lour ............... 0.70 0.81 0.34 0.64 0.60 0.614. Cashew kernels... 2.38 2.16 2.52 2.05 0.95 1.655.6.
Beer ...............Bottled s w e e t
0.45 0.96 7-96 0.96 1.02 1.26
water ............... 0.72 0.65 0.73 0.82 1.1. 4.347. Soda water 0.09 0.43 0.43 0.23 0.29 0.688. Cotton yarn 1.37 1.11 2.34 2.03 2.53 2.929. N ylon fishnet ... 0.13 0.31 0.63 0.73 0.84 0.92
10. Sawn planks 0.13 0.04 0.04 0.04 0.04 0.2611. News papers 1.26 1.E2 1.58 1.36 1.36 1.7112.13.
Giant tyres Animal d r a w n
25.06 34.90 37.34 15.79 35.40 35.71
vehicle tyres ... 0.38 - 0.17 0.57 1.51 0.8314.15.
Camel back P.V.C. & plastic
0.21 0.22 0.24 0.08 0:16 0.12
sandals ............... 0.20 0.18 0.06 0.08 0.09 -16. P lastic bottles ... 0.12 1.38 0.93 0.12 0.20 0.2617.18.
Spectacle fram e... Potassium per
0.23 0.18 0.30 0.49 0.37 0.41
manganate J.46 3.51 2.38 1.09 2.02 0.99
60
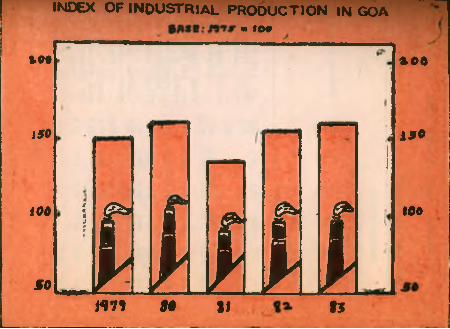
IMDeX OF in d u s t r ia l p r o d u c t io n in GOA• l e #
1.00
J50
iO O
MO M f f l l
%C6
1 5 0
1 0 0
H 7 5 5 0 SI f J
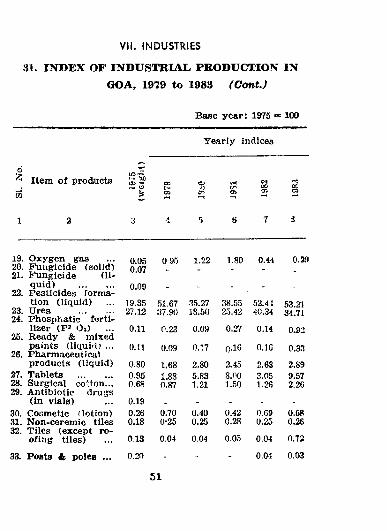
31. INBEX OF INDUSTRIAL PRODUCTION IN GOA, 1979 to 1983 (ContJ
Base year: 1975 = 100
VII. INDUSTRIES
Y early indices
Item o f products
i9. O xygen gas 0.05 0.95 1.22 1.80 0.44 0.2920. F ungicide (solid)21. Fungicide (li 0.07 -
quid) ...............22. Pesticides form a 0.09 - - - - -
tion (liquid) 19.35 51.67 •W.27 38.55 52.44 53.2123. Urea ..............24. Phosphatic ferti
27.12 37.90 18.50 25.42 40.34 34.71lizer (P* Os)
25. R eady & m ixed0.11 n.23 0.09 0.27 0.14 0.92
paints (liqui'i,' ... 26. Pharm aceutical
0.11 0.09 0.17 O .IG 0.16 0.33products (liquid) 0.80 1.68 2.80 2.45 2.63 2.89
27. Tablets .............. 0.95 1.88 5.83 8.00 3.05 9.5728. Surgical cotton...29. Antibiotic drugs
0.68 0.87 1.21 1.50 1.26 2.2G
(in vials) 0.19 - - - - -
30. Cosmetic ( lotion) 0.26 0.70 0.40 0.42 0.G9 0.5831. Non-cerem ic tiles32. T iles (except ro
0.18 0-25 0.25 0.28 0.25 0.2fi
ofing tiles) 0.13 0.04 0.04 0.05 0.04 0.72
33. Posts & poles ... 0.20 - - - 0.04 0.03
51
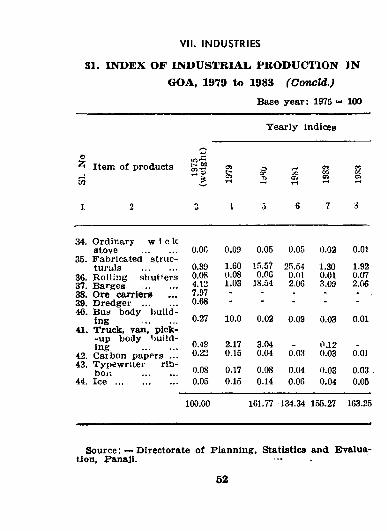
SI. INDEX OF INDUSTRIAL, PRODUCTION JN GOA, 1979 to 1983 (Concld.)
Base year: 1975 = 100
VII. INDUSTRIES
Yearly indices
o^ Item of products
34. Ordinary w i c kstove .............
35. Fabricated stn ic-turuls ..............
36. R olling shutters37. Barges ..............38. Ore carriers39. Dredger ..............40. Bu! body build
ing ..............41. Truck, van, pick-
-up body building ...............
42. Carbon papers ...43. Typewriter rib-
boi"» .........44. I c e ..........................
0.06 0.09 0.05 0.05 0.02 0.01
0.39 1.60 l.'i.57 25.54 1.30 1.920.08 0.08 0.06 O.Ol 0.01 0.074.12 1.03 18.54 2.06 3.09 2.067.97 - - - - -
0.68 - - - - -
0.27 10.0 0.02 0.09 0.03 0.01
0.48 2.17 3.04 0JL20.22 0.15 0.04 0.03 0.03 0.01
0.08 0.17 0.08 0.04 0.03 0.03 .0.05 0.15 0.14 0.06 0.04 0.05
100.00 161.77 134.34 155.27 163.25
Source: — Directorate of Planning, Statistics and EJvalua- tion, Panaji. ••
52
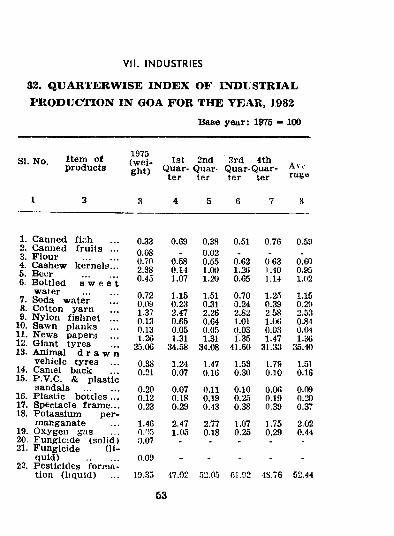
32. QUARTER WISE INDEX OF INDUSTRIAL PRODUCTION IN GOA FOR THE YEAR, 1982
Base year: 1975 = 100
VII. INDUSTRIES
1975SI. No. Item o f / 1st 2nd Srd 4thproducts Quar-Quar- Quar-Quar-
ter ter ter ter rage
1. Canned ri:;h2. Canned fru ils ...3. F lour ...............4. Cashew kernels...5. Becr ...............6. B ottled s w e e t
water ...............7. Soda water8. Cotton yarn9. N ylon fishnet ...
10. Sawn planks11. News papers12. Giant tyres13. Animal d r a w n
vehicle tyres ...14. Camel back15. P.V.C. & plastic
sandals ...............16. Plastic bottles ...17. Spectacle fram e...18. Potassium per
manganate19. Oxygen gas20. Fungicide (solid )21. Fungicide (li
quid) ...............22. Pesticides form a
tion (liquid)
3 4 5 6 7 8
0.33 0.69 0.38 0.51 0.76 0.590.08 - 0.02 . - .
0.70 0.58 0.55 0.62 0 63 0.602.38 0.14 1.00 1.26 1.40 0.950.45 1.07 1.20 0.65 1.14 1.02
0.72 1.15 1.51 0.70 1.25 1.150.09 0.23 0.31 0.24 0.39 0.291.37 2.47 2.26 2.82 2.58 2.530.13 0.65 0.64 1.01 1.06 0.840.18 0.05 0.05 0.03 0.03 0.041.2« 1.31 l.Si i:.35 1.47 1.36
25.06 34.58 34.08 41.60 31.33 35.40
0.38 1.24 1.47 1.53 1.79 1.510.21 0.07 0.16 0.30 0.10 0.16
0.20 0.07 0.11 0.10 0.06 0.090.12 0.18 0.19 0.25 0.19 0.200.23 0.29 0.43 0.38 0.39 0.37
1.46 2.47 2.77 1.07 1.75 2.02o.a-) 1.05 0.18 0.25 0.29 0.440.07 - - - - -0.09 - - - - -
19..35 47.02 •J2.05 61.92 1S.76 52,44
53
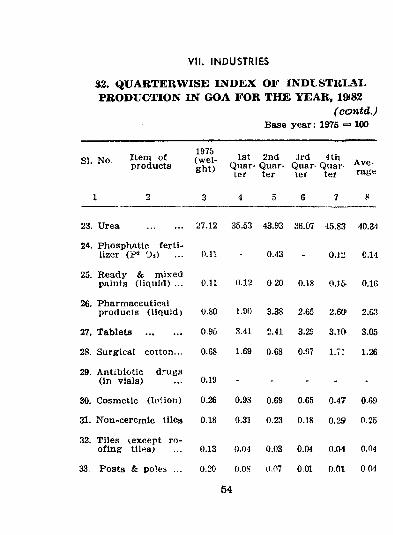
32. QUARTER WISE INDEX OF INDLSTRIAI. PRODUCTION IN GOA FOR THE YEAR, 1»82
(contd.) Base year: 1975 ^ 100
VII. INDUSTRIES
SI. No Item of products
1975(w eight)
1stQuarter
2ndQuarter
Jrd 4th Quar- Quar ter ter
Average
1 2 3 4 5 6 7 8
23. Urea .............. 27.12 35.53 43.93 36.07 45.83 40.34
24, Phosphatic fertilizer (P= Os) o .n - 0.43 - 0.J2 0.14
25. Ready & mixed paints (liquid) ... 0.11 0.12 0.20 0.18 0.15- 0.10
26. Pharmaceutical products (liquid) 0.80 1.90 3.38 2.65 2.6G> 2.63
27. Tablets ............... 0.95 3.41 2.41 3.29 3.10* 3.05
28. Surgical cotton... 0.68 1.69 0.68 0.97 1.71 1.26
29. A ntibiotic drugs (in vials) 0.19 - - - - -
30. Cosmetic (lotion) 0.26 0.98 0.69 0.65 0.47 0.69
31. Non-cerem ic tiles 0.18 0.31 0.23 0.18 0.29 0.25
32. T iles (except roofing tilths) 0.13 0.04 0.03 0.04 0.04 0.04
33. Posts & poles ... 0.20 O.OS 0.07 0.01 0.01 004
54
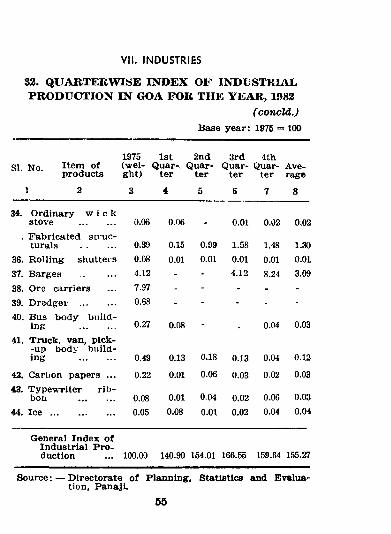
S2. QUABTERWISE INDEX OF INDUSTRIAL, PRODUCTION IN GOA FOR THE YEAR, 1982
( concld.) Base year : 1975 = 100
VII. INDUSTRIES
SI. No. Item of products
1975 1st 2nd (w ei- Quar-. Quar- ght) ter ter
3rdQuar
ter
4thQuar
terAverage
1 2 3 4 5 6 7 8
34. Ordinary w i c k stove ............... 0.06 0.06 0.01 0.02 0.02
. F abricated struc- turals ............... 0.39 0.15 0.99 1.58 1.48 1.30
36. R olling shutters 0.08 0.01 0.01 0.01 0.01 0.0137. Barges .............. 4.12 - - 4.12 8.24 3.0938. Ore carriers 7.97 - - - - -39. D redger ............... 0.68 - - - - -40. Bus bod y bu ild
ing ............... 0.Z7 0.08 - 0.04 0.0341. Truck, van, p ick-
-up body building ............... 0.49 0.13 0.18 0.13 0.04 0.12
42. Carbon paper.s ... 0.22 0.01 0.06 0.03 0.02 0.0343. Typew riter r ib
bon ............... 0.08 0.01 0.04 0.02 0.06 0.0344. I c e .......................... 0.05 0.08 O.Ol 0.02 0.04 0.04
General Index o f Industrial P ro duction 100.00 140.90 154.01 166.55 159.64 155.27
Source: — D irectorate o f Planning, StatiBtics and Evaluation, PanajL
55
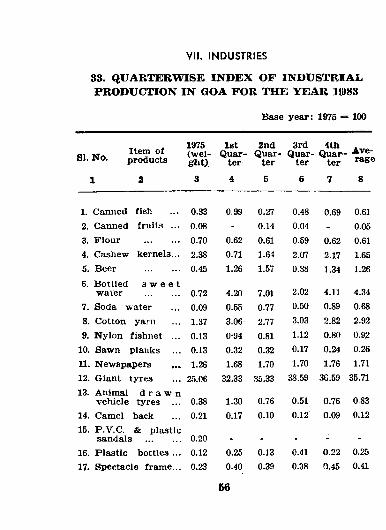
33. QUARTERWISE INDEX OF INDUSTRIAL PRODUCTION IN GOA FOR THE YEAR 18)83
Base year: 1975 ■= 100
VII. INDUSTRIES
SI.„ Item o f
products1975(w eight)
1stQuar
ter
2ndQuar
ter
3rdQuar
ter
4thQuar
ter, Ave
rage
1 2 3 4 5 6 7 8
1. Canned fish 0.33 0.99 0.27 0.48 0.69 0.612. Canned fruits ... 0.08 - 0.14 0.04 - 0.053. Flour 0.70 0.62 0.61 0.59 0.62 0.614. Cashew kernels... 2.38 0.71 1.64 2.07 2.17 1.655. Beer 0.45 1.26 1.57 0.88 1.34 1.266. Bottled
wavers w e e t
0.72 4.20 7.01 2.02 4.11 4.347. Soda water 0.09 0.55 0.77 0.50 0.89 0.688. Cotton yarn 1.37 3.06 2.77 3.03 2.82 2.929. N ylon fishnet ... 0.13 0-94 0.81 1.12 0.80 0.92
10. Sawn planks 0.13 0.32 0.32 0.17 0.24 0.2611. Newspapers 1.26 1.68 1.70 1.70 1.76 1.7112. Giant tyres 25.06 32.33 35.33 38.59 36.59 35.7113. Animal
vehicled r a w n
tyre,? ... 0.38 1.30 0.76 0.51 0.76 0.8314. Camel back 0.21 0.17 0.10 0.12 0.09 0.1215. P.V.C. & plastic
sandals .............. 0.20 . . .16. Plastic bottles ... 0.12 0.25 0.13 0.41 0.22 0.2517. Spectacle fram e... 0.23 0.40 0.39 0.38 0.45 0.41
56
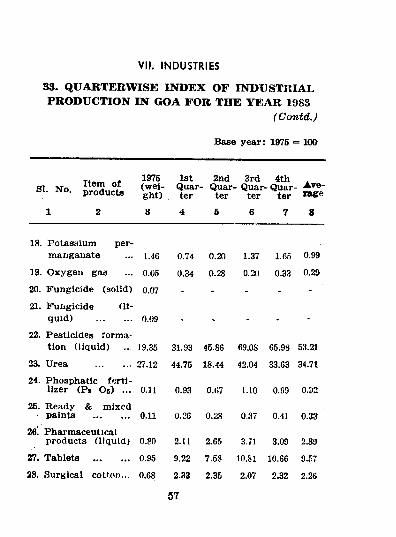
S3. QUARTER WISE INDEX OF INDUSTRIAL PRODUCTION IN GOA FOR THE YEAR 1983
(Contd.)
Base year: 1975 = 100
VII. INDUSTRIES
1st 2nd 3rd 4th .SI N o Quar- Quar- Quar- Quar-
" • products ght) ter ter ter ter rage
1 2 3 4 5 6 7 8
18. Potassium permanganate 1.46 0.74 0.20 1.37 1.65 0.99
19. O xygen gas 0.05 0.34 0.28 0.20 0.33 0.29
20. Fungicide (solid) 0.07 - - - - -21. F ungicide (li
qu id) .............. 0.09 - - - - -22. P esticides form a
tion (liquid) 19.35 31.93 45.86 69.08 65.98 53.21
23. Urea 27.12 44.75 18.44 42.04 33.63 34.71
24. Phosphatic fertilizer (P i Os) ... 0.11 0.93 0.«7 1.10 0.99 0.92
25. Ready & m ixed paints ............... 0.11 0.2G 0.28 0.37 0.11 0.33
26. Pharmaceutical products (liquid) 0.80 2.11 2.65 3.71 3.09 2.89
27. Tablets ............... 0.95 9.22 7.58 10.81 10.66 9.5728, Surgical cotfon... 0.68 2.33 2.35 2.07 2.32 2.26
57
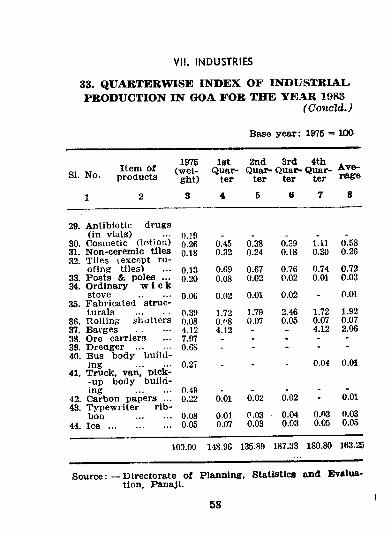
3S. QUARTERWISE INDEX OB’ INDUSTRIAL. PRODUCTION IN GOA FOR THE YEAR 1983
(ConcU.)
Base year: 1975 = 100
VII. INDUSTRIES
Item o f SI. No. products
1 2
1975(wei
ght)
3
1stQuar
ter
4
2ndQuar
ter
5
3rd 4th Quar- Quar
ter ter
e 7
A verage
8
29. A nlibiotic drugs (in vials) 0.19
30. Cosmetic (lotion) 0.26 0.45 0.38 O.o9 1.11 0.5831. Non-cerem ic tiles 0.18 0.32 0.24 0.18 0.30 0.2632. T iles (.except ro
ofing tiles) 0.13 0.69 0.67 0.76 0.74 0.7233. Posts & poles ... 0.20 0.08 0.02 0.02 0.01 0.0334. Ordinary w i c k
stove ............. O.OG 0.02 0.01 0.02 . O.Ol35. Fabricated struc-
turals 0.39 1.72 1.79 2.46 1.72 1.9236. Rolling .shatters 0.08 O.f'8 0.07 0.05 0.07 0.0737. Barges 4.12 4.12 - - 4.12 2.0638. Ore carrier:? 7.97 - - - - -39. Dredger .............. 0.68 - - - - -40. Bus body build
ing .............. 0.27 0.04 0.0141. Truck, van, p ick-
-up body building .............. 0.49
42. Carbon papers ... 0.22 0.01 0.02 0.02 - 0.0143. Typewriter r ib
bon .............. 0.08 0.01 0.03 0.04 0.03 0.0344. I c e .......................... 0.0.5 0.07 0.03 0.03 0.05 0.05
100.00 148.96 135.89 187.33 180.80 163.25
S o u rce :— Directorate o f Planning’, Statistica and Evaluation, Panaji.
58
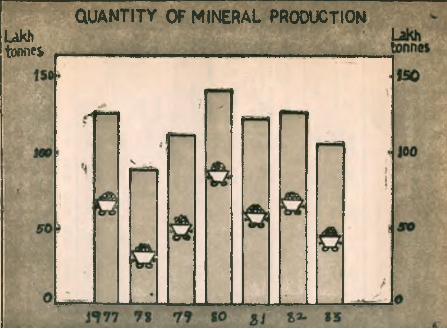
QUANTITY OF MINERAL PRODUCTIONLakhtonnes
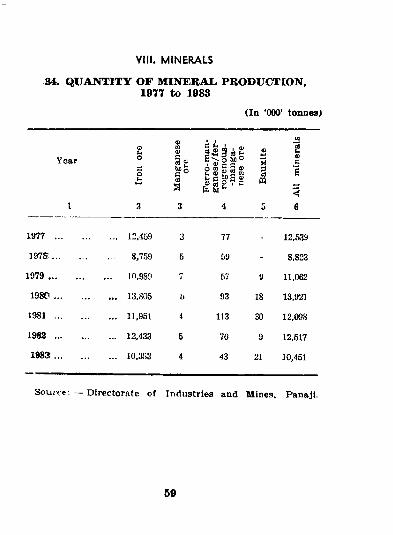
34. QUANTITY OF MINERAL PRODUCTION, 1977 to 1983
(In '000' tonnes)
VIII. MINERALS
Yearfli O OT J. .
gs|§gfa
1977 ... .............. 12.459 3 77 - 12,539
197S ... .............. 8,7!59 5 59 - 8,823
1979 ... .............. 10,980 7 57 9 11,062
1980 ... .............. 13,805 5 93 18 13,921
1981 ... .............. 11,951 4 113 30 12,098
1982 ... .............. 12,433 5 70 9 12,517
1983 ... .............. 10,3S3 4 43 21 10,451
S ou rce : — Directorate of iTidustriea and Mines, Panaj
59
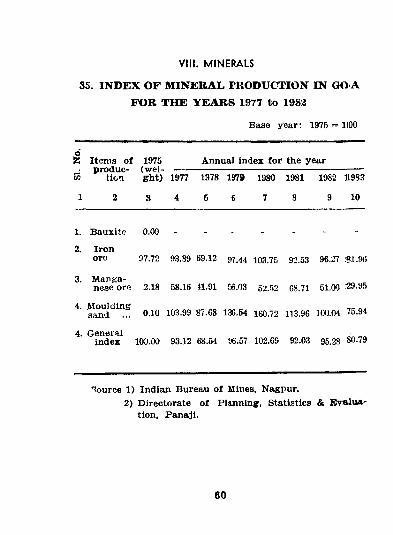
35. INDEX OF MINERAL PRODUCTION IN GO A FOR THE YEARS 1977 to 1983
Base year: 1975 - 1(00
VIII. MINERALS
1 Items o f produc
tion
1975 Annual index fo r the year
w ght) 1977 1978 1979 1980 1981 1982 1983
1 2 3 4 5 6 7 8 9 10
1. Bauxite 0.00 _ _2. Iron
ore 97.72 93.89 69.12 97.44 103.75 92.53 96.27 <51.96
3. Man^a- nese ore 2.18 58.16 41.91 56.03 52.52 68.71 51.00 •29.95
4. M ouldingsand 0.10 103.99 87.68 136.54 160.72 113.96 100.04 75.94
4. Generalindex 1(X).00 93.12 68.54 96.57 102.69 92.03 95.28 80.79
"^urce 1) Indian Bureau o f Mines, Nagpur.2) Directorate o f Planning, Statistics & Evalua
tion, Panaji.
60
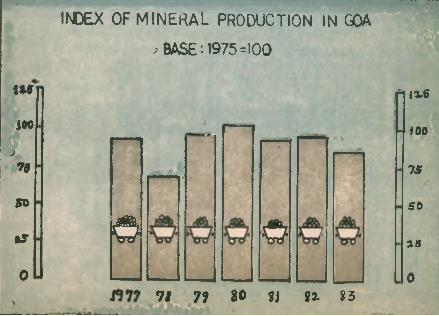
INDEX OF MINERAL PRODUCTION IN GOA
.BASE: 1975=100
Ilf
iooj
79
SO
% s
0
O O
11.6
H f o o
7if
SO
28
071 7f SO H n *3
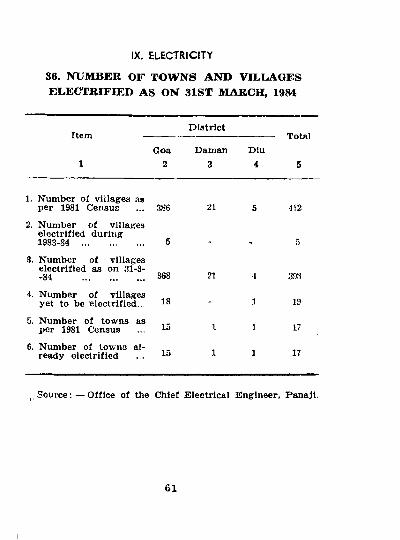
36. NUMBER OF TOWNS AND VILLAGES ELECTRIFIED AS ON 31ST MARCH, 1984
IX. ELECTRICITY
D istrictTotal
51Goa
2Daman
3Dlu
4
1. Number Oi villages as per 1981 Census 3S6 21 5 412
2. Number o f villages electrified during 1983-84 ......................... 5 . 5
3. Number o f villages electrified as on 31-3- -84 .......................... 3S8 21 4 393
4. Number o f villages yet to be electrified... 18 - 1 19
5. Number o f towns as per 1981 Census 15 I 1 17
6. Number of towns already electrified 15 1 1 17
S o u rce ;— Office o f the Chief E lectrical Engineer, Panaji.
61
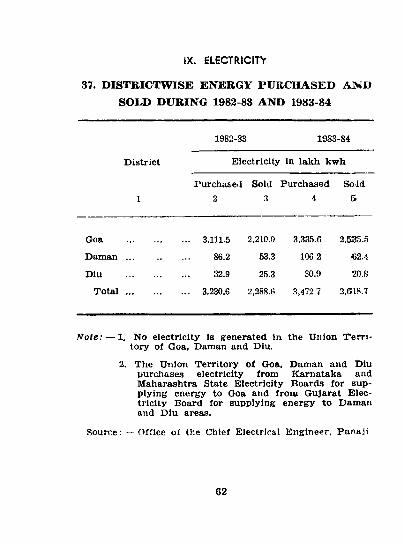
37. DISTBICTWISE ENERGY PURCHASED AMD SOLD DURING 1982-83 AND 1983-84
IX. ELECTRICITY
District
1982-83 1983-84
E lectricity in lakh kwh
Purchased Sold Purchased Sold1 2 3 4 S
Goa ... 3,111.5 2,210.0 3,335.G 2,535.5
Daman ... 86.2 53.3 10G.2 62.4
Diu 32.9 25.3 30.9
Total ... ... 3,230.6 2,288.6 3,472.7 2,6:18.7
N ote: — 1. No electricity is generated in the Union T e rr itory o f Goa, Daman and Diu.
2. The Union T erritory o f Goa, Daman and Diu purchases electricity from Karnataka and M aharashtra State Electricity Boards for supplying energy to Goa and from Gujarat E lectricity Board for supplying energy to Daman and Diu areas.
Source; — Office o f the Chief Electrical Engineer. Panaji
62
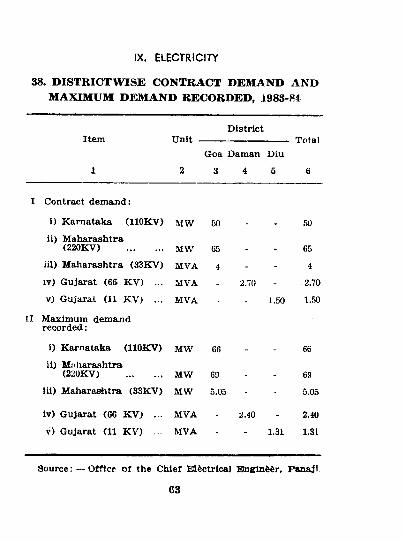
38. DISTRICTWISE CONTRACT DERLAND AND MAXIMUM DEMAND RECORDED, 1983-84
IX. ELECTRICITY
Item UnitDistrict
TotalGoa Daman Diu
1 2 3 4 5 6
I Contract dem and:
i) Karnataka (llO K V ) MW 60 - - 50ii) M aharashtra
(220KV) ............... MW G5 . 65ill) M aharashtra (33KV) MVA 4 - - 4
I V ) Gujarat (66 K V ) ... MVA - 2.70 - 2.70
v) Gujarat (11 K.VO ••• MVA - - 1.50 1.50
II Maximum dem and recorded ;
i) Karnataka (llO K V ) MW 66 - - 66ii) Maharashtra
(220KV) ............... MW 69 - . 69
iii) M aharashtra (33KV) MW 5.05 - 5.05
iv) Gujarat (66 K V ) ... MVA - 2.40 - 2.40
v) Gujarat (11 K V ) MVA - - 1.31 1.31
Source; — Office of the Chief Electrical E3ngrin&6r. Panaj!
63
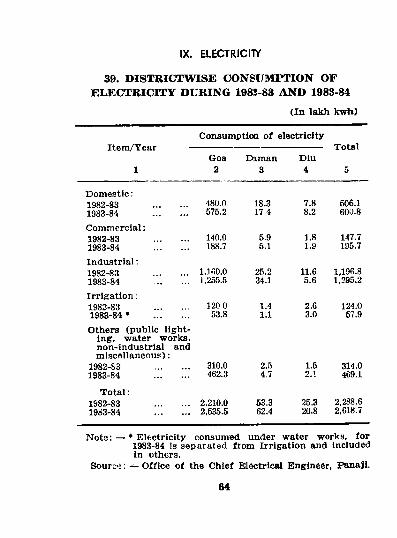
39. DISTRICTWISE CONSUMI'TION OF ELECTRICITY DURING 198S-83 AND 198S-84
(In lakh kwh)
IX. ELECTRICITY
Consumptioo o f electricityTotal
5
XI.&IX1/ I eur
1Goa
2Daman
3Diu4
D om estic:1982-83 .............. 480.0 18.3 7.8 506.11983-84 .............. 575.2 17 4 8.2 600.8Com m ercial:1982-83 .............. 140.0 5.9 1.8 147.71983-84 .............. 188.7 5.1 1.9 195.7Industria l:1982-83 .............. 1,160.0 25.2 11.6 1,196.81983-84 ............. J .255.5 34.1 5.6 1,295.2Irrig a tion ;1982-83 .............. 120 0 1.4 2.6 124.01983-84 • .............. 53.8 1.1 3.0 57.9
Others (public lighting, water works, non-industrial and m iscellaneous):
1982-83 .............. 310.0 2.5 1.5 314.01983-84 .............. 462.3 4.7 2.L 469.1
T o ta l:1982-83 .............. 2,210.0 53.3 25.3 2.288.619S3-84 .............. 2,535.5 62.4 20.8 2,618.7
N ote: — • Electricity consumed under water works, for1983-84 is separated from Irrigation and included in others.
S ource; O ffice o f the Chief Electrical Engineer, Panaji.
64
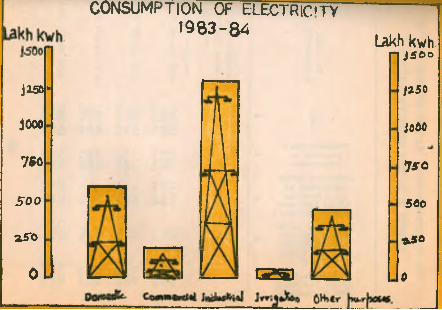
jaso*
jooo
7S0
BO O
3.5*0
0
CONSUMPTION OF ELECTRIC‘TY 19S3-84
C2SS
Lakh kwh. n J 500
1250
j e M
7 s o
500
U 5 6
0
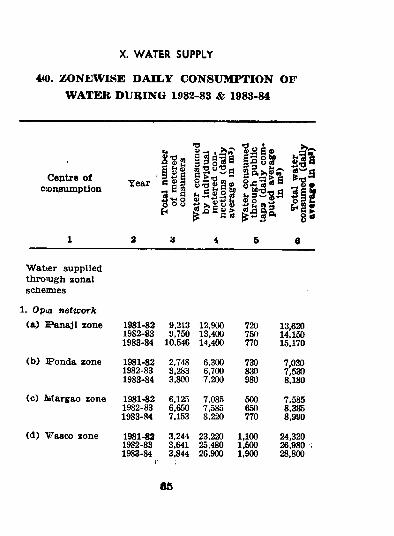
440. ZONEWISE DAILY CONSUMPTION OF WATER DURING 1982-83 & 1983-84
X. WATER SUPPLY
Centre o f ctoD3 umptlon
1 a 3 4 6 6
Walter supplied thromgh zonal schennes
1. Op<a network(a ) S^<anaji zone 1981-82
1982-831983-84
9,2139,750
10,546
12,90013.40014.400
720750770
13,62014,15015,170
(b ) S»onda zone 1981-821982-831983-84
2,7483,2833,800
6,3006,7007,200
730830980
7,0307,5308,180
(c ) M argao zone 1981-821982-831983-84
6,1256,6507,153
7,0857,5858,220
500650770
7,5858,3858,990
(d ) Waaco zone 1981-821982-831983-84
3,2443.6413,844
23,22025,48026,900
1,1001,5001,900
24,32026,98028,800
05
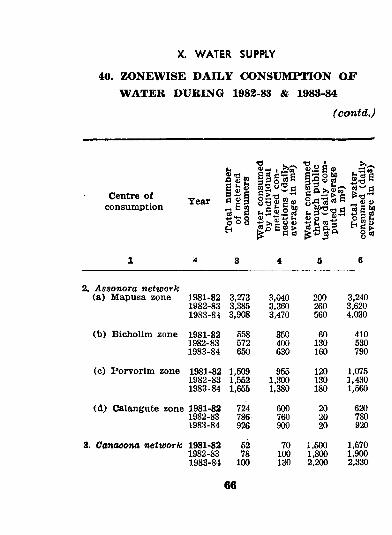
40. ZONEWISE DAILY CONSUMPTION OF WATER DURING 1982-83 & 1983-84
(contd.)
X. WATER SUPPLY
Centre o fconsumption Tear
S'S I b n ' 2-2 S ®
§|lgsuB cS - l i
SSftI g a l
1 a S 4 6 6
2. Assonora network (a) Mapusa zone 1981-82 3,273 3,040 200 3,240
1982-83 3,385 3,360 260 3,6201983-8J 3,908 3,470 560 4,030
(b ) Bicholim zone 1981-82 558 350 60 4101982-83 572 400 130 5301983-84 650 630 160 790
(c) Porvorim zone 1981-82 1,509 955 120 1,0751982-83 1,552 1,300 130 3,4301983-84 1,655 1,380 180 1,560
(d ) Calangute zone 1981-82 724 600 20 6201982-83 786 760 20 7801983-84 926 900 20 920
3. Oanaeona network 1981-82 52 70 1,500 1,5701982-83 78 100 1,800 1,9001983-8-1 100 130 2,200 2,330
66
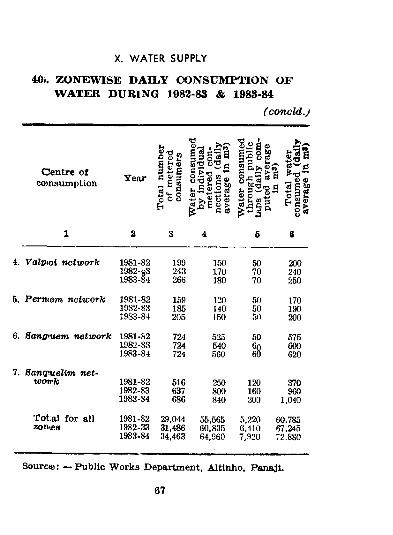
40/. ZONEWISE DAIL.Y CONSUMPTION OF WATER DURING 1982-83 & 1983-84
(concld.)
"S « g ® a S 'I'Ss i |§ |a
- -p i i f i i } i| l| !I i j
X. WATER SUPPLY
1 2 3 4 5 6
4. Valpioi netw ork 1981-82 199 150 50 2001982-83 243 170 70 2401983-84 266 180 70 250
5. Pertuem network 1981-82 159 120 50 1701982-83 185 140 50 1901983-84 205 150 50 200
6. Sang’ttem network 1981-82 724 525 50 5751982-83 724 540 6001983-84 724 560 TO 620
7. Sanqmelim net-worrk 1981-82 516 250 120 370
1982-83 637 800 160 9601983-84 686 840 200 1,040
T ota l for all 1981-82 29,044 55,565 5,220 60,785zoniea 1982-33 31,486 60,835 6,410 67,245
1983-84 34,463 64,960 7,920 72.880
Sourc®: — Public Works Department, Altinho, PanaJL
67
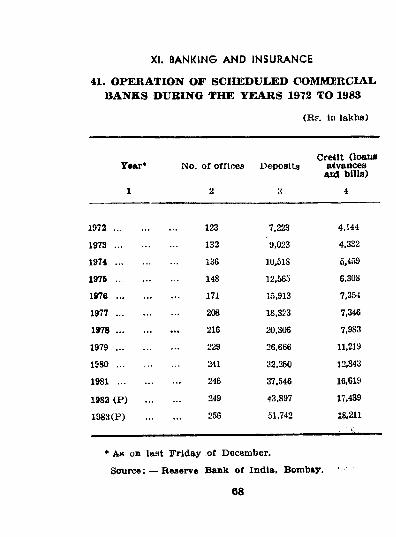
41. OPERATION OF SCHEDULED COMMERCIAL BANKS DURING THE Y^EARS 1972 TO 198S
(R f. in lakhs)
XI. BANKING AND INSURANCE
Year*
1
No. o f offices
2
Deposits
3
Cre41t (loan* aivances a id bills)
4
m a ......... 123 7,223 4,144
1973 .............. 132 9,023 4,332
1 9 7 4 .............. 136 10,518 5,459
1976 .............. 148 12,565 6,308
1976 .............. 17i 15,913 7,354
1977 .............. 208 18,323 7,346
1978 .............. 216 20,306 7,983
1979 .............. 229 26,666 11,219
1980 .............. 241 32,250 12,843
1981 .............. 246 37,546 16,619
1982 (P ) ... 249 43,897 17,439
1983(F) 256 51,742 18.211
• As on last F riday of December.
Source; — Reserve Bank o f India, Bombay.
68
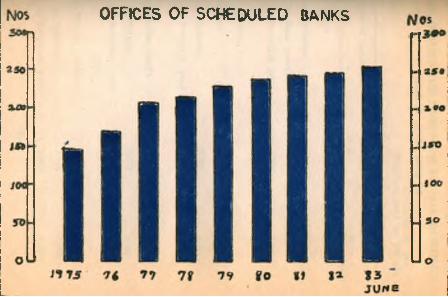
OFFICES OF SCHEDULED BANKS
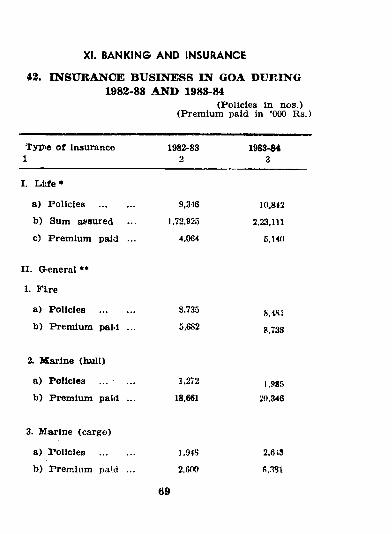
XI. BANKING AND INSURANCE
42. INSURANCE BUSINESS IN GOA DURING 1982-83 AND 1983-84
(Policies in nos.) (Premium paid in ‘(XX) Rs.)
T y p e o f insurance 1982-832
1983-843
I. L iife*
a) P olicies
b ) Sum assured
c) Prem ium paid
9,346
1.72,925
4,064
10,842
2,23,111
5,140
II. (General **
1. FLre
a) P olicies
b ) Prem ium paid
8,735
5,6828, IS I
8,738
2. Ifa rln e (hull)
a) P olicies
b) Prem ium paid
1,272
18,6611,985
20,346
3. M arine (cargo)
a) P olicies
b) Prem ium pai.d
1,948
2,600
2.6iS
6,381
69
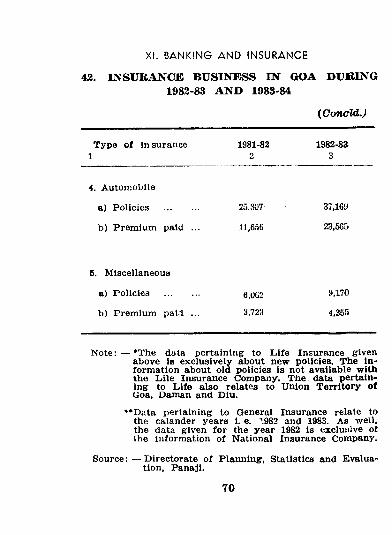
42. INSURANCE BUSINESS IN GOA DUBING 1982-83 AND 1988-84
(C o n o id . J
XI. BANKING AND INSURANCE
T ype ot Insurance 1981-82 1982-831 2 3
4. Autom obile
a) P olicies ....... 25,307 37,163
b) Prem ium paid ... 11,656 23,565
6. M iscellaneous
a) Policiea ........ 6.0G2 9,170
b) Prem ium paid ... 3.723 4,355
N ote: — *The data pertaining to L ife Insurance given above is exclusively about new policies. The inform ation about old policies is not available with the L ile Insurance Company. The data pertaining to L ife also relates to Union T erritory o f Goa, Daman and Diu.
♦♦Data pertaining to General Insurance relate to the calander years i. e. ''.982 and 1983. As weil, the data given for the year 1982 is excluiiive ot the inform ation o f National Insurance Company.
Source: — Directorate o f Planning, Statistics and Evaluation, Panaji.
70
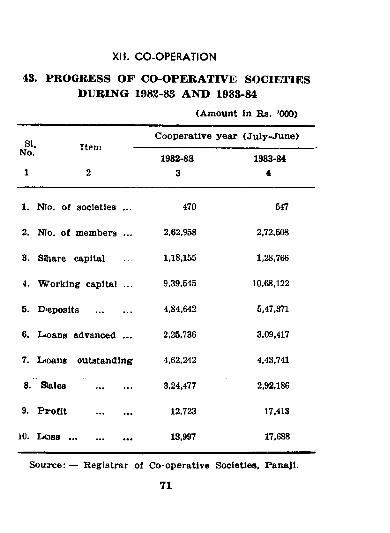
XII. CO-OPERATION
43. PROGRESS OF CO-OPERATIVE SOCIETIESD U R I N G 1982-83 A N D 1983-84
(Am ount in Rs. ’000)
■ T n wiCooperative year (July-June)
No
1 21982-83
31983-84
4
1. NTo. o f societies ... 470 547
2. NTo. o f members ... 2,62,958 2,72,508
3. Slhare capital 1,18,155 1,28,766
4. W ork in g capital ... 9,39,545 10,68,122
5. D*eposita .............. 4,84,642 5,47,371
6. Litoans advanced ... 2,25,736 3,09,417
7. Lrtoans outstandiniT 4,62,242 4,43,741
8. Sales ............... 3,24,477 2,92,186
9. P ro fit ............... 12,723 17,413
10. L o s s .......................... 13,997 17,688
S ource: — Registrar of Co-operative Societies, Panaji.
7 1
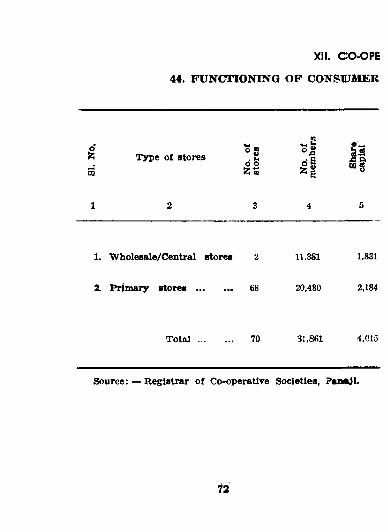
44. FUNCTIONING OF CONSUJMER
XII. CO-OPE
1
mType of stores
K af sA Pi OQg
1 2 3 4 &
1. Wholesale/Central stores 2 11,381 1,831
2. Primary stores ............ 68 20,480 2,184
Total............ 70 31,8(51 4,015
Source: — Registrar of Co-operative Societies, PanaJL
72
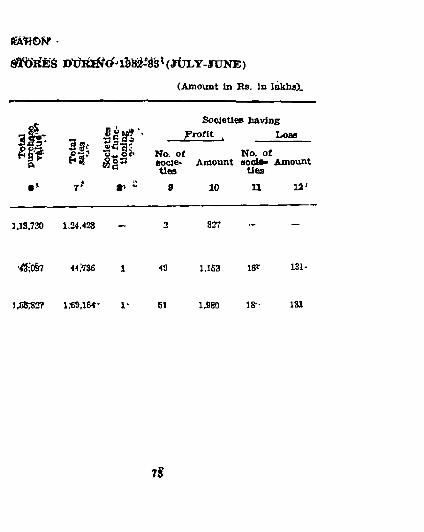
(Amount in Be. In l^hjsX
Societies having S ^ y ? ’ . P ro fit . L oss
m 3 b < mo-Sj -3^ gj, Ko. of No. offtocie- Am ount s o d » - Amount
“ ties ties7^ 11 « 9 10 U 12 ‘
1,13,730 1.24,428 - 2 827 - -
■ IKO&T 44 ,'736 1 43 1,153 IS? iSU
1458:827 1* 61 1,980 18- 131
7S
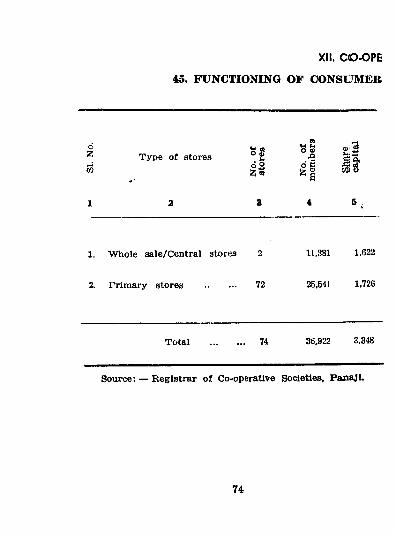
45. FUNCTIONING OF CONSUMER
XII. C(0-0PE
dZ55
Type of storesy m O go 2 Z «
01 vt ^o V .Q 0 . 3S g .Ml 8
1 2 8 4 6 .
1. W liole sale/Central stores 2 11,381 1,622
2. Prim ary stores .............. 72 25,541 1,726
Total ............. . 74 36.922 3,348
Source; — Registrar of Co-operative Societies, PtmaJL
74
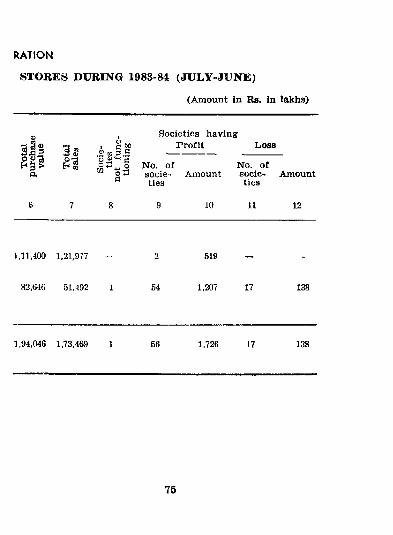
STORES DURING 1983-84 (JULY-J17NE)
(Am ount in Rs. in lakhs)
RATION
I s
7
. §!>« .2 w 3 .£
5
c
8
Societies havingP rofit Loss
p,
6
No. o f societies
9
Amount
10
No. o f societies
11
Amount
12
1,11.400 1,21,977 — 2 519 — -
82,646 51,492 1 54 1,207 17 138
1,94,046 1,73,469 1 56 1.726 17 138
75
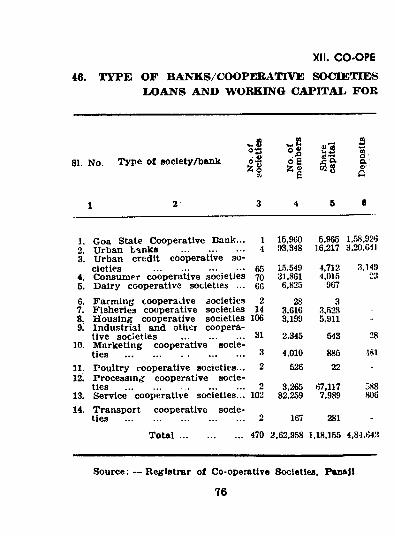
46. TYPE OF BANKS/COOPERATIVE SOCIETIES IX)ANS AND WORKING CAPITAL FOR
XII. CO-OPE
81. No. T ype o f aoclety/bank
s0 3d-2I s Mg
Cl’Q
1 2 3 4 5 8
1. Goa State Cooperative Bank... 1 15,960 5,965 1,.<58,9262. Urban b^nks .......................... 4 93.348 16,217 3,20,6113. Urban credit cdoperattve so
cieties ...................................... 65 15,549 4,712 3.1494. ConsumP? cooperative societies 70 31,861 '1,015 2i)5. Dairy cooperative societies ... 66 6,825 967
6. Farm ing cooperative societies 2 28 37. Fisheries cooperative societies 14 3.616 3,5288. H ousing cooperative societies 106 3,199 5,911 -
9; Industrial and oUier cooperative societies .......................... 31 2,345 543 28
10. Marketing cooperative societies .................................................. 3 4,010 885 -ISl
11. Poultry cooperative societies... 2 526 22 -12. Processing; cooperative socie
ties ................................................. 2 3,265 67,117 -58813. Service cooperative societies... 102 82,259 7,989 80614. Transport cooperative socie
ties ................................................. 2 167 281 -
T o t a l .......................... 470 2,62,958 1,18,155 4,84,642
Source: —Registrar of Co-oi>eratlve Societies, Paoajl.
76
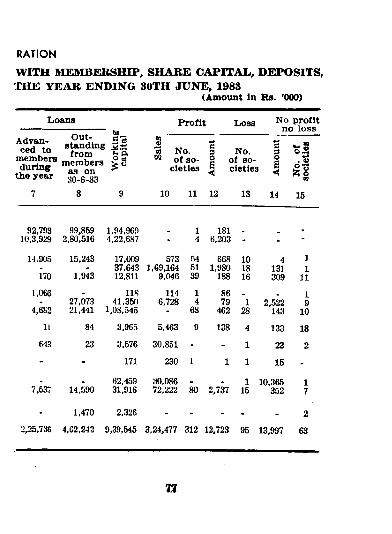
WITH M£MB£IBSHIF> SHAR£ CAPITAI^ DEPOSITS, THE YEAR ENDING 30TH JUNE, 1983
(Amount In Rs. ’000)
RATION
Lioana
the year
P rofit Losa No profitno loss
No. 3 of ao- 2
cletles 5No.
of societies "I
i o
7 8 9 10 11 12 13 14 15
92,793 99,859 1,94,96!) 1 18110,3,929 2,80,516 4,22,687 - 4 6,203 - - -
14,905 15,243 17,009 573 54 668 10 4 1- - 37,643 1,69.164 51 1,980 18 131 1170 1,943 12,811 9,046 39 188 16 309 11
1,066 _ 118 114 1 86 . 1- 27,073 41,350 6,728 4 79 1 2,522 9
4,6S2 21,441 1,03,545 - 68 462 28 143 1011 84 3,965 5,463 9 138 4 133 18
613 23 3,576 30,851 - - 1 23 2- - 171 230 1 1 1 15 -. . 62,459 30,086 1 10,365 1
7,6S7 14,590 31,916 72,222 80 2,737 15 352 7
1,470 2,326 - - - - - 22,25,736 4,62,242 9,39,545 3,24.477 312 12.723 95 13,997 63
n
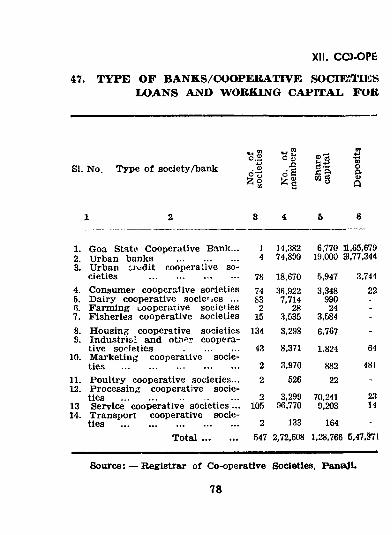
47. TYPE OF BANKS/COOPERATIVE SOC3IETIES IX>ANS AND WORKING CAPITAL. FOR
XII. CO -O PE
SI. No. Type o f society/bank SS fttag
1 2 8 4 6 6
1. Goa Static Cooperative Bank... 1 14,382 6,770 11,65,6792. Urban banks ......................... 4 74,890 19,000 3,77,3443. Urban u u dit cooperative so
cieties ..................................... 78 18,670 5,947 3,7444. Consumer cooperative societies 74 36,922 3,348 225. Dairy cooperative socieues ... 83 7,714 990 -G. Farm ing cooperative societies 2 28 247. Fisheries cooperative societies 15 3,535 3,584 -8. H ousing cooperative societies 134 3,298 6,767 -
9. Industrial and otiif^r cooperative societies ........................ 43 8,371 1,824 64
10. M arketing cooperative societies ................................................. 2 3,970 882 481
11. Poultry cooperative societies... 2 526 22 -
12. Processini-' cooperative societies .............. ........................ 2 3,299 70,241 23
13 Service cooperative societies ... 105 96,770 9,203 1414. Transport cooperative socie
ties ................................................. 2 133 164Total ... 547 2.72,508 1,28,766 5,47,3T1
Source; — Registrar of Co-operative Societies, PanajL
78
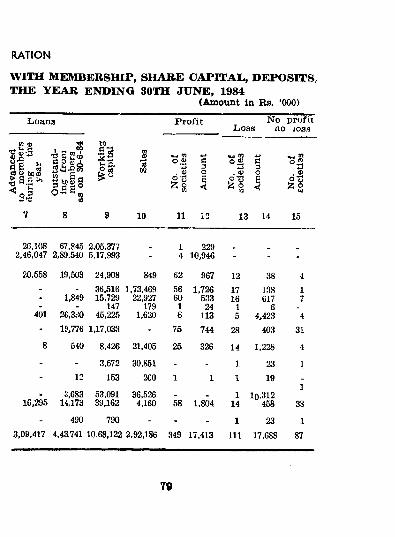
WITH MEMBERSHIP, SHARE CAPITAL,, DEPOSITS; THE YEAR ENDING SOTH JUNE, 1984
(Amount in Rs. ’000)
RATION
Lioans P rofit NoL oss no
profit1033
n o to
11% ■d S.S ^ ^ s l
m ;
2 . am® u <n
0.2 ’-3 . a> 0 3 ^ SCQ
c3Otn
0.2 • V
0-3
•Mc3O
31o® . ®
I ' i01
7 8 9 10 11 13 13 14 15
26,108 67,845 2,05,377 1 2292,46,047 2,89.540 5.17.993 - 4 10,946 - - -
20,558 19,503 24,908 849 62 967 12 38 4- - 36,516 1,73,469 56 1,726 17 m 1- 1,849 15.729 22,927 60 533 16 617 ->- - 147 179 1 24 1 6 .
401 26.3K0 45,225 1,620 6 113 5 4,423 4- 19,776 1,17,033 - 75 744 28 403 318 540 8,426 21,405 25 326 14 1,228 4
- - 3,572 30,851 - - 1 23 1- 12 153 200 1 1 1 19 -.. S.683 53,091 36,526 . _ 1 10.312
116,295 14.173 39,162 4,160 58 1,804 14 458 33
- 490 790 - - - 1 23 13,09,417 4.43.741 10,68,122 2,92,186 349 17,413 i l l 17,688 87
79
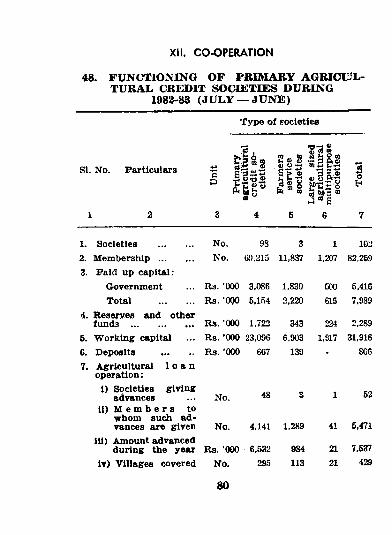
48. FUNCTIONING OF PAIMABY AGRICUJI^ TURAI. CREDIT SOCIETIES DURING
1982-83 (JULY — JUNE)
XII. CO-OPERATION
T ype o f societies
SI. No. Particulars
£ | g »
1311:3 a Sy cQ *; Cj ;
« 3 2^«S S g m-c -581 ” » 6P5 ®p®
s3 4 5 6 7
No. 98 3 1 102No. G9.215 11,837 1,207 82,259
Rs. ’000 3,086 1,830 500 5,416Ra. *000 5,1.'54 2,220 615 7,989
Rs. '000 1,722 343 224 2,289Rs. ’ 000 23,096 6,903 1,917 31,916Rs. ’ 000 667 139 • 806
No. 48 3 1 52
No. 4,141 1,289 41 5,471
Rs. '000 6,532 984 21 7,537No.
80
295 113 21 429
1. Societies2. Membership ...3. Paid up capital;
Gorermnent Total
4. Reserves and otherfunds ..............
5. W orking capital6. Deposits7. Agricultural l o a n
operation:I) Societies giving
advancesii) M e m b e r s to
whom such advances are given
iii) Amoimt advanced during the year
Iv) V illages covered
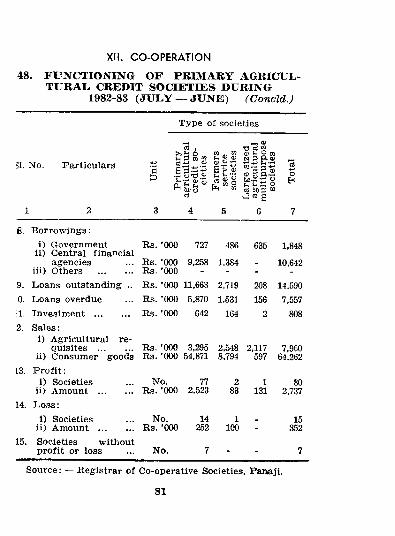
48. FUNCTIOxVING OF PRIMARY AGRICUL- TURAI. CREDIT SOCIETIES DURING
1982-83 (JULY — JUNE) (Concld.)
T ype o f societies
XII. CO-OPERATION
cS I d “
31. No. Particulars -ti ^^ .§ g S 'S gC -2 <i)go.2 O^ ^ - c 5 o ^^ “ cSbBpWCJ « g
1 2 3 4 5 6 7
e. B orrow in gs: i) Government Rs. '000 727 486 635 1,848
ii) Central financial agencies Rs. ’000 9,258 1,384 10,642
iii) Others .............. Rs. '000 - - - -9. Loan.s outstanding .. Rs. ’ 000 11,663 2,719 208 14,590.0. Loans overdue Rs. ’ 000 5,870 1,531 156 7,557LI. Investm ent .............. Rs. ’OOO 642 164 2 8082. Sales:
i) Agricultural requisites .............. Rs. ’ 000 3,295 2,548 2,117 7,960
ii) Consumer goods Rs. ’ 000 54,871 8,794 597 64,26213. P r o f it :
i) Societies No. 77 2 1 80ii) Amount .............. Rs. ’000 2,523 83 131 2,737
14. L oss:1) Societies No. 14 1 15
ii) Amount .............. Rs. ’000 252 100 - 35215. Societies without
p rofit or loss No. 7 - - 7
S ource: — R egistrar o f Co-operative Societies, Panaji.
81
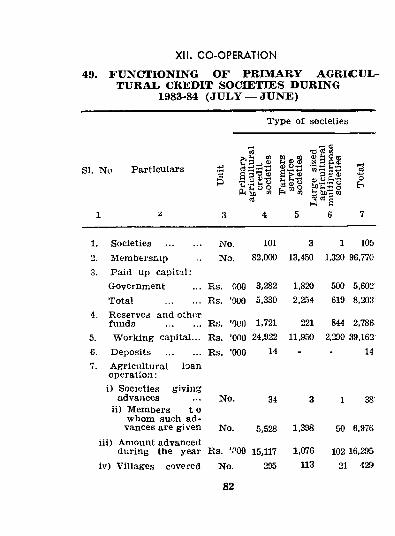
49. FUNCTIONmG OF PRIMARY AGRICULTURAL, CREDIT SOCIETIES DURING
1983-84 (JULY — JUNE)
T ype o f societies
XII. CO-OPERATION
SL No ParticularsS g ^ -2 ^ g £ |? ‘E « o g S oPL| 02 ft m ^ bxi'5 m
I ^ 4 5 6 7
1. Societies .............. No. 101 3 1 1052, M em btrsnip No. 82,000 13,450 1,320 96,7703. Paid up capital;
Government Rs. 000 3,282 1,820 500 5,602Total .............. Rs. ■000 5,330 2,254 619 8,203
4. Reserves and other funds .............. Rs. ’QUO 1,721 221 844 2,786-
5. W orking capital... Rs. ’ono 24,922 11,950 2,290 39,1626. Deposits .............. Rs. ■000 14 - - 14
"Agricultural loan operation :
i) Societies giving advaJices No. 34 3 1 38:
ii) M embers I o whom such advances are given No. 5,528 1,398 50 6,976
iii) Amount advanced during the year Rs. ’ .''00 15,117 1,076 102 16,29&
iv) V illages covered No. 295 113 21 42»
82
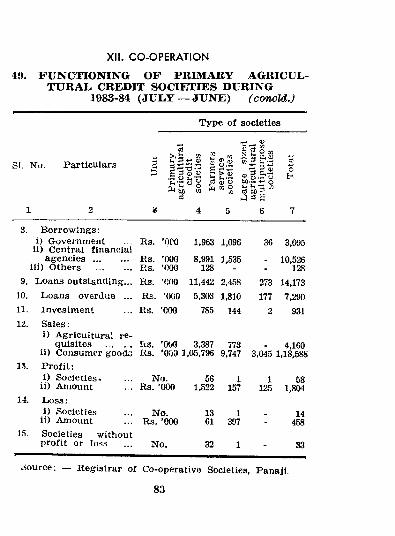
49. FUNCTIONING OF PRIMARY AGRICULTURAL CREDIT SOCIETIES DURING
1983-84 (JULY — JUNE) (concU.)
XII. CO-OPERATION
T ype o f societies
SI. Nu. Particulars
"3? ^'2 5 | |
W ^
Ho
5
ES ®
<D
9 ftiJcfO
pH bac3 ° ^ “ 5: to?
J S1 2 6 4 5 6 7
8. B orrow ings:i) Government
ii) Central financial a g e n c ie s ..............
iii) Others ..............
Rs. ’OCO
Rs. ’000 Rs. *noo
1.963
8,991128
1,096
1,535
36 3,095
10,526128
9. L oans outstanding... Rs. -ono 11,442 2,458 273 14,17310. Loans overd-.ie ... Rs. ’0<JO 5,303 1,810 177 7,290u . Investment Rs. ’000 785 144 2 93112. Sales:
i) Agricultural requisites ...........
ii) Consumer goodsRs. ’OOO 3,387 Rs. ’000 1,05,796
7739,747 3,045
4,1601,18,588
13. P ro fit:i) Societies.
ii) AmountNo.
Rs. ’00056
1,5221
1571
12558
1.80414. L o ss :
i) Societiesii) Amount
No.Rs. ’000
1361
1397
- 14458
15. Societies without profit or loss No. 32 1 - 33
aource; — Registrar o f Co-operativo Societies, Panaji.
83
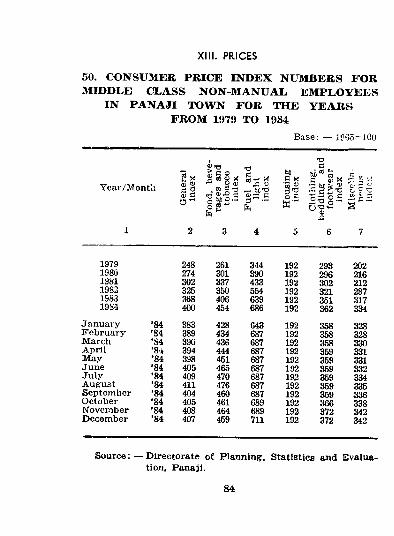
Xlll. PRICES
50. CX)NSUMER PRICE INDEX NUMBERS FOR MIDDLE CLASS NON-MANUAL. EMPLOYEES
IN PANAJI TOWN FOR THE YEARS FROM 1979 TO 1984
Base: — 1CG5-100
! § § « iYear/M ontli
gS «|f.S S=.s |.s s | | . s sO'Os-i
1 2 3 4 5 6 7
1979 248 261 344 192 293 2021980 274 301 390 192 296 2161981 302 337 433 192 302 21219S2 325 350 554 192 321 2871S83 368 406 639 192 351 31719S-1 400 454 686 192 362 334
January ’84 383 428 643 192 358 328February '84 389 434 687 192 358 328March ’S4 390 436 687 192 358 330April ’8 i 394 444 687 192 359 331May ’84 398 451 687 192 359 331June ’84 405 465 687 192 359 332Ju ly ’84 409 470 687 192 359 334August ’84 411 476 687 192 359 335September ’84 404 460 687 192 359 336October ’84 405 461 689 192 366 338November '84 408 464 689 192 372 342December ’84 407 459 711 192 372 342
Source; — Directorate o f Planning, Statistics and Evaluation, Panaji.
84
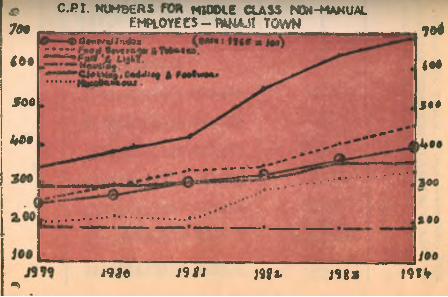
7M
l e t
5 6 6
4 ^ 9
c.Pi. wuMBeas Miooce cuss hOw-MANUAL EMPtOYEC5-ftM4AJ! TOWN
0 « rr ^ /? v d » )r10^
I t *
S t *
. i * - *
i 9 ^ 6 J 9 i i•>
j 9 « a . iSgs l 9 f V
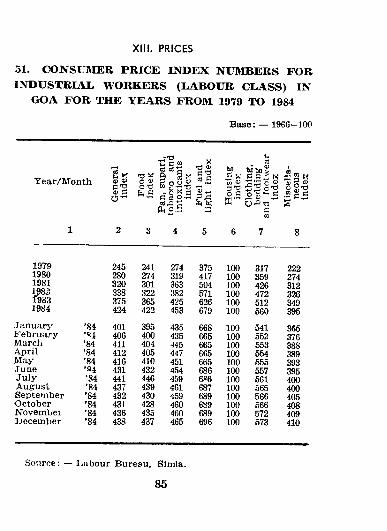
51. CONSUaiER PRICE INDEX NUMBERS FOR INDUSTRIAL WORKERS (LABOUR CLASS) IN
GOA FOR THE YEARS FROM 1979 TO 1984
B ase: — 1966=100
XIII. PRICES
Y ear/M onth | | o | g
^ c ® U-^'C Sft P--
1 2 3 4 5 6 7 8
1979 245 241 274 375 100 317 2221980 280 274 319 417 100 359 2741981 320 301 363 504 100 426 3121982 338 322 382 571 100 472 326r983 375 365 425 626 100 512 3491984 424 422 453 679 100 560 395January '84 401 395 435 668 100 541 365February 406 400 435 665 100 552 376March ’84 411 404 445 665 100 553 388April '84 412 405 447 665 100 554 389May ’84 416 410 451 665 100 555 393June ’ «4 431 432 454 686 100 557 395July •84 441 446 459 6f>6 100 561 400August ’84 437 439 461 687 100 565 400September ’84 432 430 459 689 100 566 405October ’84 431 428 460 689 100 566 408Novembei ’84 436 435 460 689 100 572 409Uecember ’84 438 437 465 696 100 573 410
Source-. — I^abour Bureau, Simla.
85
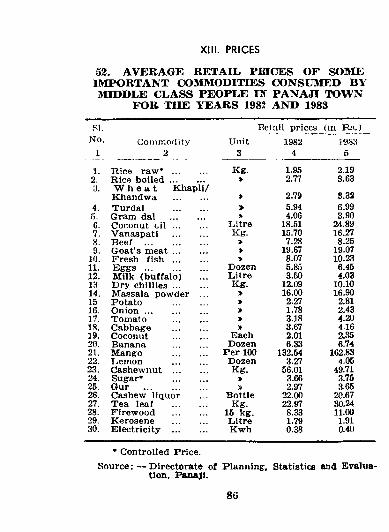
XIII. PRICES
52. AVERAGE RETAIL PRICES OF SOME IMPORTANT COMMODITIES CONSUMED BY MIDDLE CLASS PEOPLE IJT PANAJI TOWN
FOR THE YEARS 1982 AND 1983
SI. Eel ail prices (in R s.No. Coriimoflity Unit 1982 1983
1 2 3 4 5
1. R ice raw* .............. Kg. 1.95 2.192. R ice b o i l e d .............. > 2.77 3.633. W h e a t K hapli/
Khandwa .............. 2.79 8.324. Turdal .............. » 5.94 6.995. Gram dal .............. * 4.06 3.906. Coconut o i l .............. Litre 18.51 24.897. Vanaspati .............. Kg. 15.70 16.278. B eef .......................... » 7.28 8.259. G oat’s m e a t .............. > 19.67 19.07
10. Fresh f i s h .............. > 8.07 10.2311. E g g s .......................... Dozen 5.85 6.4512. M ilk (bu ffa lo) Litre 3.50 4.0313 Dry c h i l l ie s .............. Kg. 12.09 10.1014. Massala pow der ... > 16.00 16.9015 P otato .............. > 2.27 2.8116. O n io n .......................... > 1.78 2.4317. Tom ato .............. > 3.18 4.2018. Cabbage .............. » 3.67 4.1619. Coconut .............. Each 2.01 2.3520. Banana .............. Dozen 6.33 6.7421. M ango .............. P er 100 132.54 162.8322. T^emon .............. Dozen 3.27 4.0523. Cashew nut .............. Kg. 56.01 49.7124. Sugar* .............. > 3.66 3.7525. Gur .......................... » 2.97 3.6526. Cashew liquor Bottle 22.00 20.6727. Tea leaf .............. Kg. 22.97 30.2428. F irew ood .............. 15 kg. 8.33 11.0029. Kerosene .............. Litre 1.79 1.9130. E lectricity .............. Kwh 0.38 0.40
• Controlled Price.S ource; — Directorate o f Planning-, Statistics and Evalua
tion, Panajl.
86
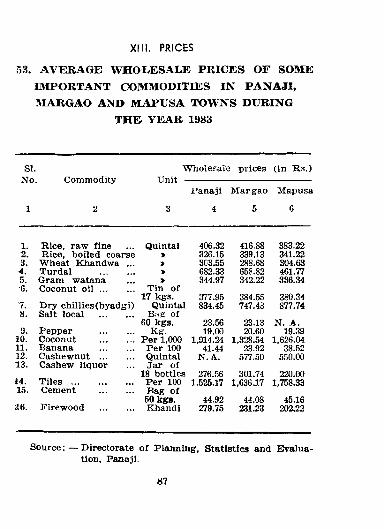
53. AVERAGE WHOLESAU: PRICES OF SOME IMPORTANT 003IM0DITIES IN PANAJI, IWABGAO AND MAPUSA TOWNS DURING
THE YEAR 1983
XIII. PRICES
SI. W holesale prices (in R b.)No. Commodity Unit -
P anaji Mar gao Mapusa
1 2 3 4 5 6
1. R ice, raw fine Quintal 406.32 416.88 383.222. Rice, boiled coarse » 326.15 339.13 341.223. W lieat Khandwa ... 3C3.55 288.68 304.634. Turdal .............. > 682.33 658.82 461.775. Gram watana > 344.97 342.22 336.346. Coconut o i l .............. Tin o f
17 kgs. 377.95 384.55 380.347. D ry chillies (byadgi) Quintal 834.45 747.43 877.748. Salt local .............. Bns of
60 kgs. 23.56 23.13 N. A.9. Pepper .............. Kg. 19.00 20.60 19.39
10. Coconut .............. Per 1,000 1,914.24 1,328.54 1,626.0411. Banana .............. Per 100 41.44 23.92 38.5212. Cashewnut .............. Quintal N .A . 577.50 5.50.0013. Cashew liquor Jar of
18 bottles 276.56 301.74 220.0044. T i l e s ......................... P er 100 1,525.17 1,636.17 1,758.3315. Cement .............. Bag of
50 kgs. 44.92 44.08 45.1636. F irew ood .............. Khandi 279.75 231.23 202.22
Source: — Directorate of Planning, Statistics and Evaluation, Panaji.
87
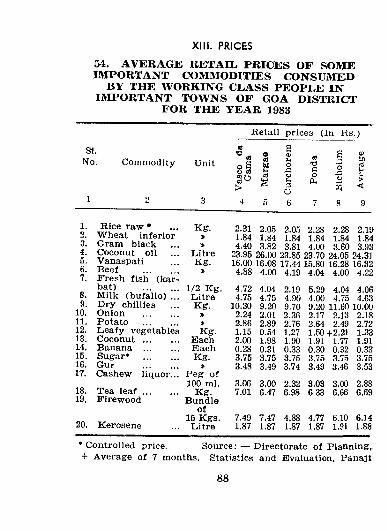
54. AVERAGE RETAIL PRICES OF SOME IMPORTANT CXJMaiODITIES CONSUMED
BY THE WORKING CLASS PEOPLE IN IMPORTANT TOWNS OF GOA DISTRICT
FOR THE YEAR 1983
XIII. PRICES
SI.No. Comm odity Unit
Retail prices (In Ks.)
9.10.11.12.13.14.15.16.17.
18. 19.
R ice raw • W heat inferior Gram black Coconut oil VanaspatiB eef .............Fresh fish (kar^bat) .............M ilk (bufallo) .. D ry chillies ..Onion .............Potato ..............L eafy vegetablesCoconut .............Banana .............Sugar* .............Gur .............Cashew liquor..
Tea l e a f .............F irew ood
K g.
20. K erosene
LitreKg.
1/2 K g. L itre Kg.
Kg.EachE achKg.
»P eg of 100 ml.
K g. Bundle
o f 15 Kgs. L itre
2.31 2.05 2.05 2.28 2.28 2.19 1.84 1.84 1.84 1.84 1.84 1.84 4.40 3.82 3.81 4.00 3.60 3.93
23.95 26.00 23.85 23.70 24.05 24,31 16.00 16.08 17.44 15.80 16.28 16.32 4.88 4.00 4.19 4.04 4.00 4.224.724.75
10.302.242.861.152.000.283.75 3.48
4.044.75 9.20 2.01 2.89 0.54 1.98 0.313.75 3.49
2.194.90 9.70 2.36 2.76 1.271.90 0.33 3.75 3.74
5.29 4.04 4.00 4.75 9.20 11.60 2.17 2.13 2.64 2.49 1.50 +2.21 1.91 1.77 0.30 0.32 3.75 3.75 3.49 3.46
4.064.63
10.002.182.721.331.910.333.753.53
3.06 3.00 2.32 3.03 3.00 2.887.01 6.47 6.98 6.33 6.66 6.69
7.49 7.47 4.88 4.77 6.10 6.141.87 1.87 1.87 1.87 1.91 1.88
•C ontrolled price. S o u r c e :— Directorate o f P lanning,+ Average o f 7 months. Statistics and Evaluation, Panaji
88
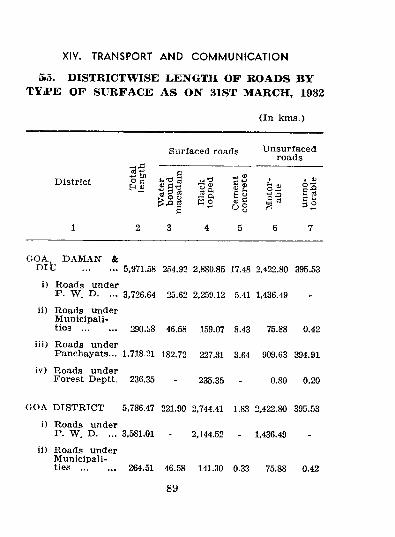
S5. DISTRICTWISE LENGTH OF ROAl>S BY TYPE OF SURFACE AS ON 31ST MARCH, 1982
(In km s.)
XIV. TRANSPORT AND COM M UN ICAT ION
Surfaced roads Unsurfaced roads
bjD £’rViaf'Tipt O C Jn'O crt M C ^D istrict h | ^ § 1 -o g I 2 | StSS®* i3o S o CcS
« o i g ! = « § S
GOA.. DAM AN & r>IU .............. 5,971.58 254.92 2.880.85 17.48 2,422.80 395.53
i) Roads underP. W . D. ... 3,726.64 25.62 2,259.12 5.41 1,436.49
ii) Roads underM unicipalities .............. 290.S8 46.58 159.07 8.43 75.88 0.42
iii) Roads underPanchayats... 1,71821 182.72 227.31 3.64 909.63 394.91
iv) R oads underForest Deptt. 236.35 - 235.35 - 0.80 0.20
GOA DISTR ICT 5,786.47 221.90 2,744.41 1.83 2,422.80 395.53
i) Roads underP. W . D. ... 3,581.01 - 2,144.52 - 1,436.49
ii) Roads under Municipalities .............. 264.51 46.58 141.30 0.33 75.88 0.42
89
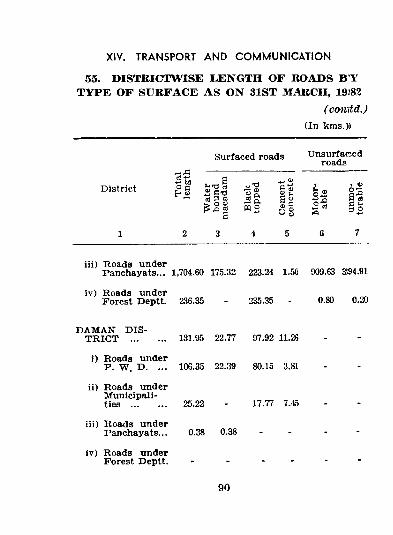
55. DISTRICTWISE LENGTH OF ROADS B'Y TYPE OF SURFACE AS ON 31ST MARCH, 19183
( comtd.)
(In kms.))
XIV. TRANSPORT AND COM M UNICATION
Surfaced roads Unsurfaced roads
SI m i i u §3 i ?S t I i l » §2
ill) R oads underPanchayats... 1,704.60 175.32 223.24 1.50 909.63 3!94.91
iv) Roads underForest Deptt. 236.35 - 235.35 - 0.80 0.20
DAM AN d i s t r i c t ............... 131.95 22.77 97.92 11.26
i) Roads underP . W . D. ... 106.35 22.39 80.15 3.81
ii) Roads underM unicipalities ............... 25.22 - 17.77 7.45
iii) R oads underPanchayats... 0.38 0.38
iv ) Roads underForest Deptt. . . . -
90
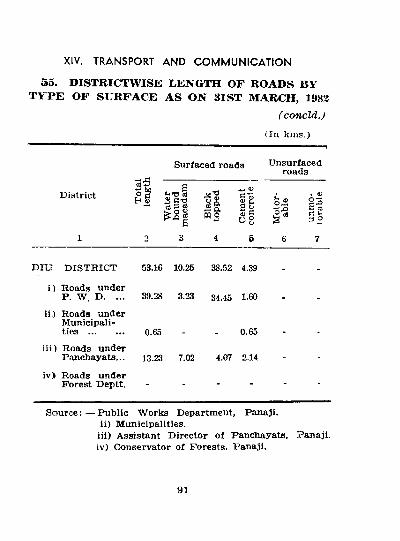
55. DISTRICTWISE LENGTH OF ROADS BY TYPE OF SURFACE AS ON 31ST MARCH, 1982
( con cld .J
(In km s.)
XIV. TRANSPORT AND CO M M UN ICAT IO N
Surfaced roads UnsurfacedYr\n o
D istrict
E11MO
U S
I 0)i l c 3 S
1 2 3 4 5 6 7
DIL7 D IST R IC T 53.16 10.25 38.52 4.39 - _
i ) Roads under P . W . D. ... 39.28 3.23 34.45 1.60 _ .
i i ) Roads under M unicipalities ............... 0.65 0.65
iii) Roads under Panchayats... 13.23 7.02 4.07 2.14 - -
iv> Roads under F orest Deptt. - - - - -
S ou rce : — P ublic W orks Department, Panaji.ii) M unicipalities.
iii) Assistant D irector o f Panchayats, Panaji.iv) Conservator o f Forests. Panaji.
91
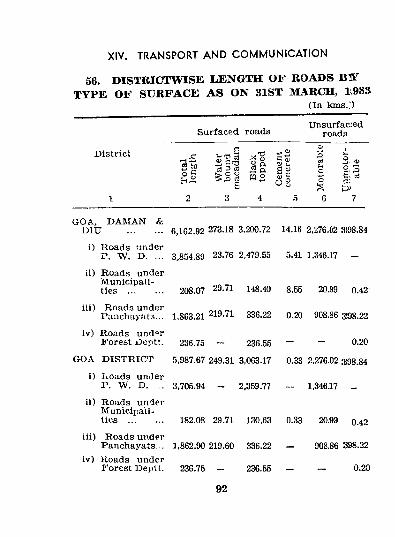
56. DISTRICTWISE LENGTH OF ROADS BU" TYPE OF SURFACE AS ON 31ST MARCH, H985
(In kms.;)
XIV. TRANSPORT AND COM M UN ICATION
Surfaced roads
District ■^5
MS | §
Unsurfac:edroads
1 2 3 4 5 6 7
GOA., DAMAN- & DIU .............. 6,162.92 273.18 3,200.72 14.16 2,276.02 3 98.84
i) lioad s -ander P. W . D. ... 3,854.89 23.76 2,479.55 5.41 1,346.17 _
ii) R oads under M unicipalities .............. 208.07 29.71 148.40 8.55 20.99 0.42
iii) R oads under Panchayata... 1,863.21 219.71 336.22 0.20 908.86 3)98.22
iv) R oads und'^r F orest Deptt. 236.75 — 236.55 - - 0.20
GOA D ISTRIC T 5,987.67 249.31 3,063.17 0.33 2,276.02 398.841) I\.oads under
P. W. D. ... 3,705.94 _ 2,359.77 — 1,346.17 _ii) Roads under
M unicipaii- tios .............. 182.08 29.71 130.63 0.33 20.99 0.42
iii) Roads under Panchayats... 1,862.90 219.60 336.22 — 908.86 398.22
iv) Hoads under Forest Deptt. 236.75 _ 236.55 _ _ 0.20
92
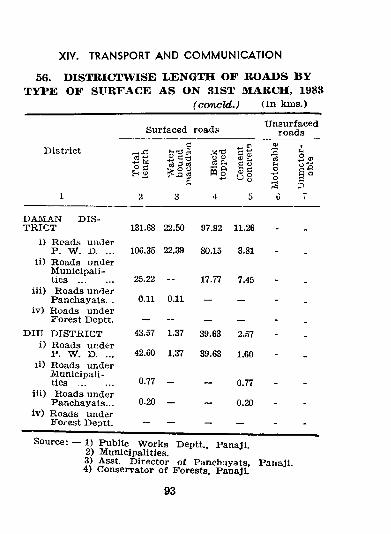
XIV. TRANSPORT AND CO M M U N ICAT IO N
56. DISTRICTWISE LENGTH OF ROADS BY TYPE OF SURFACE AS ON 31ST MARCH, 1983
(ccmcld.) (In km s.)
Surfaced roads Unsurfacedroads
D istrict
1
o c H o
2 3
O D Pim o
4
<Pp
0 8
5
412tOO
6
U4
C O
Id
7
DAM AN D IST R IC T 131.68 22.50 97.92 11.26
1) Rcadii under P. W . D. ... 106.35 22.39 80.15 3.81 .
ii) R oads under M unicipalities .............. 25.22 17.77 7.45
iii) R oads under Panchayats. . 0.11 0.11 _ _ _
iv) R oads under Forest Deptt. — - — _ - .
DIU D IST R IC T 43.57 1.37 39.63 2.57 - .i) Roads under
P. W . » . ... 42.60 1.37 39.63 1.60 _
li) Roads under M unicipalities .............. 0.77 0.77
iii) Roads under Panchayats... 0.20 _ _ 0.20 .
iv ) Roads under F o/ est Deptt. - - - - - -
Source: -1 ) Public W orks Deptt., Panaji.2 ) M unicipalities.3) Asst. D irector o f Panchuyats, Paiiaji.4) Conservator o f Forests, Panaji.
93
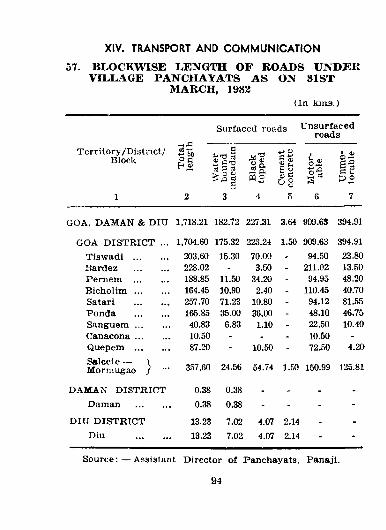
XIV. TRANSPORT AND COM M UN ICAT ION
57. BLOCKWISE LENGTH OF BOAI>S UNDER VILLAGE PANCHAYATS AS ON 31ST
MARCH, 1982(In kitis.)
Surfaced roads Unsurfacedroads
T erritory /D istrict/ Block
S bo O C! Eh § ,'C) rj
sj 3 OS > O oC
I s £ ft PQ oSI 6 ^
s-g
1 2 3 4 5 6 7
GOA, DAMAN & DIU 1,718.21 182.72 227.31 3.64 909.63 394.91
GOA DISTR ICT ... 1,704.60 175.32 223.24 1.50 909.63 394.91Tisw adi .............. 203.60 15.30 70.00 - 94.50 23.80Bardez .............. 228.02 - 3.50 - 211.02 13.50P em em .............. 188.85 11.50 34.20 - 94.95 48.20B ic h o l lm .............. 164.45 10.90 2.40 - 110.45 40.70Satari .............. 257.70 71.23 10.80 - 94.12 81.55Ponda .............. 165.85 35.00 36.00 - 48.10 46.75S a n g u em .............. 40.83 6.83 1.10 - 22.50 10.40Canacona .............. 10.50 - - - 10.50 -Quepem .............. 87.20 - 10.50 - 72.50 4.20Salcete — \ Morniugao / ■” 357.60 24.56 54.74 1.50 150.99 125.81
DAMAN DISTRICT 0.38 0.38 - - - -Daman .............. 0.38 0.38 - - - -
DIU D ISTR ICT 13.23 7.02 4.07 2.14 - -Diu .............. 13.23 7.02 4.07 2.14 - -
Source: — Assistant D irector o f Panchayats. Panaji.
94
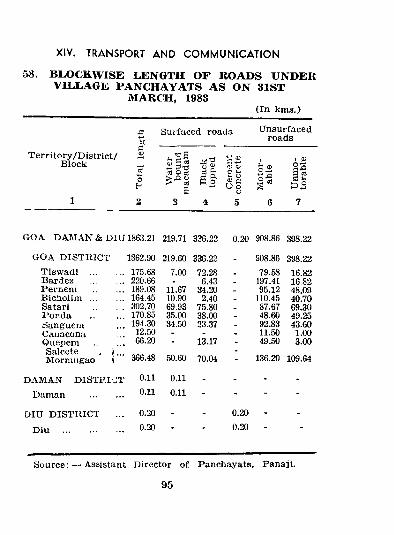
XIV. TRANSPORT AND COM M UN ICATION
58, BLO€KWlSE LENGTH OF ROADS UNDER VILLAGE PANCHAYATS AS ON 31ST
MARCH, 1983(In km s.)
aTc
Surfaced roads Unsurfacedroads
T erritory /D istrict/ B lock
1
c
oC-'2
^=1 S3-d S =3s
3
o ^■Skwo4
0) Sj <ua> c U oV
5
^2
6
I HIIIgo7
GOA DAMAN & 1)1 U 1863.21 219.71 336.22 0.20 908.86 398.22
GOA DISTRICT 1862.90 219.60 336.22 - S08.86 398.22Tisw adi .............. 175.68 7.00 72.28 . 79.58 16.82Bardez .............. 220.66 . 6.43 197.41 16.82Pei’neni .............. 189.08 11.67 34.20 _ 95.12 48,09B ic n o l im .............. 164.45 10.90 2.40 . 110.45 40.70Satari ............ 302.70 69.93 75.80 - 87.67 69.30Ponda .............. 170.85 35.00 38.00 . 48.60 49.25Sanguem 194.30 34.50 23.37 - 92.83 43.60Canacona 12.50 - - - 11.50 1.00Quepem .............Salcete , \... Morniugao )
66.20 - 13.17 : 49.50 3.00366.48 50.60 70.04 - 136.20 109.64
DAMAN DISTRI'JT 0.11 0.11 - - - -
Daman .............. 0.11 0.11 - - - -OIU DISTRICT 0.20 - - 0.20 - -
Diu .................. 0.20 0.20
S o u rce :— Assistant Director o f Panchayats, Panaji.
95
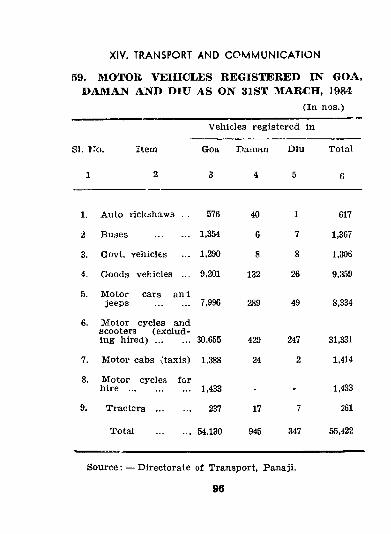
59. MOTOR VEHICLES REGISTERED IN GOA, DAMAN AND DIU AS ON 31ST MARCH, 1984
(In nos.)
XIV. TRANSPORT AND COM M UNICATION
Vehicles registered in
SI. Jt-o. item Goa Pai.nan Dlu Total
1 2 3 4 5 6
1. Auto rickshaws . . 576 40 1 617
2 Buses .............. 1,354 6 7 1,367
3. Govt, vehicles 1,290 8 8 1,306
4. Goods vehicles ... 9,201 132 26 9,359
5. M otor cars and jeeps .............. 7,996 289 49 8,334
6. M otor cycles and scooters (excluding h i r e d ) .............. 30,655 429 247 31,331
7. M otor cabs (taxis) 1,388 24 2 1,414
8. M otor cycles for hire ......................... 1,433 - - 1,433
9. Tractors .............. 237 17 7 261
Total .............. 54,130 945 347 55,422
S ou rce : — Directorate of Transport, Panaji.
96
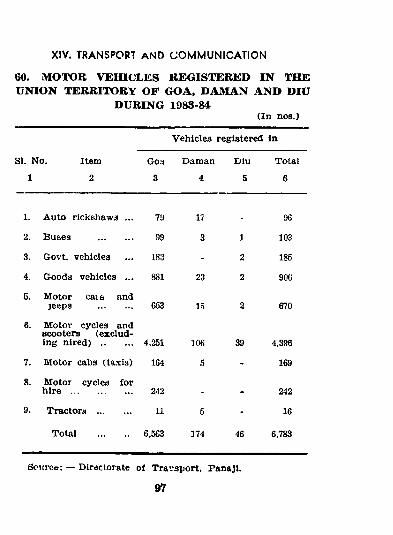
60. MOTOR VEHICLES REGISTERED IN THE UNION TERRITORY OF GOA, DAMAN AND DIU
DURING 1983-84(In nos.)
XIV. TRANSPORT AND COM M UN ICAT ION
V ehicles registered In
SI. No. Item (Joa Daman Diu Total
1 2 3 4 5 6
1. A uto rickshaws ... 79 17 . 96
2. Buses .............. 99 3 1 103
3. Govt, vehicles 183 - 2 185
4. Goods vehicles ... 881 23 2 906
5. M otor cais and jeeps .............. 653 15 2 670
6. M otor cycles and scooters (excluding n i r e d ) ............. 4,251 106 39 4,396
7. M otor cabs (taxis) 164 5 - 169
8. M otor cycles for hire .............. 242 . - 242
9. Tractors .............. 11 5 - 16
Total .............. 6,563 174 46 6,783
Soiirce: — Directorate o f Traiisport, Panaji.
97
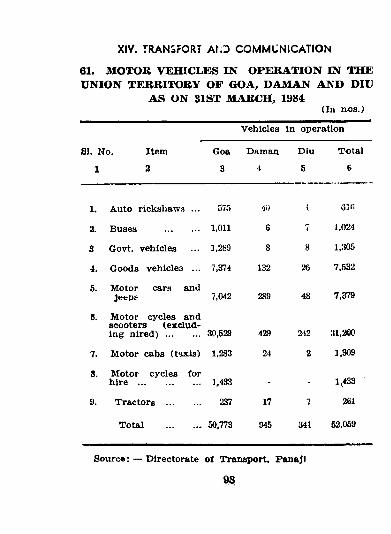
XIV. TRANSPORT AUJ COMMUNICATION
61. MOTOR VEHICLES Hi OPERATION IN THE UNION TERRITORY OF GOA, DAMAN AND DIU
AS ON 31ST MARCH, 1984(In nos.)
Vehicles in operation
31. Ho. Item Goa Daman Diu Total
1 2 3 4 5 6
1. Auto rickshaws ... 575 4i) I 61 fi
2. Buses .............. 1,011 6 7 1,024
3 Govt, vehicles 1.2S9 8 8 1,305
4. Goods vehicles ... 7,374 132 26 7,532
5. M otor cars and Jeept 7.042 289 48 7,379
6. M otor cycles and scooters (excluding n i r e d ) .............. 30,529 429 212 31,200
7. M otor cabs (tnxis) 1,283 24 2 1,309
8. M otor cycles for hire .......................... 1,433 - - 1,433
9. Tractors .............. 237 17 7 261
Total .............. 50.773 945 341 52.059
So«rc«: — Directorate of Transport, Panaji
98
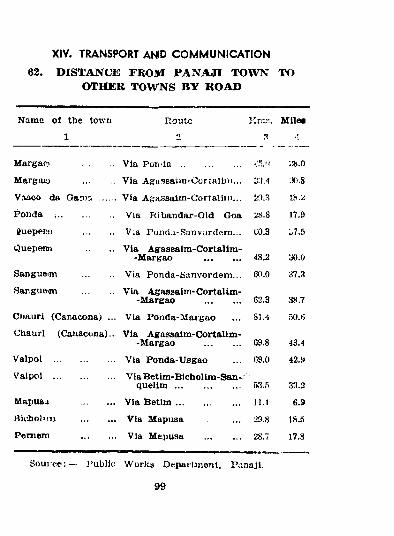
XIV. TRANSPORT AMD COMMUNICATION
62. DISTANCE FROM PANAJI TOWN TO OTHER TOWNS BY ROAD
Name o f the town Route Milea
1 2
M argao Via P o r t ia .......................... ■.'.'5.0 :;b.o
Margaio ............. Via Aga^ssaiin-Oorjalian... ;J().8
Vmco da Gatwa Via Agassaim-Gortaliin... 20.3 18.2
Ponda ......................... Via Ribandar-Old Goa 28.8 17.9Suepenn ............. Via Poncia-Sanvordem ... €0.3 o7.5
Quepeim ............. Via Agassaim-Cortalim- -Margao ............... 48.2 30.0
Sangueiin ............. Via Ponda-Sanvordem ... 6('.0 87..Sangueim .............. Via Agassaini-Cortalim -
-M areao ............... 62.3 38,7
Chauri (Canacona) ... Via Ponda-M argao 81.4 .tO.6
Chaurl (Canacona).. Via Agassaim^Cortallm--Margao ............... 69.8 43.4
Valpol ......................... Via Ponda-Usgao G9.0 42.5»Valpol ......................... V iaBetim -Bicholim -San-
q u e l im ........................... SS..*) 33.2M apusi ......... Via B e t im .......................... i l . l 6.9BlchoHmj .............. Via Mapusa ............... 29.8 18.0Pem em .............. Via Mapusa ............... 28.7 17.3
S o u r c e :— ] ’ ubllc WorJca Department. P i
99
naji.
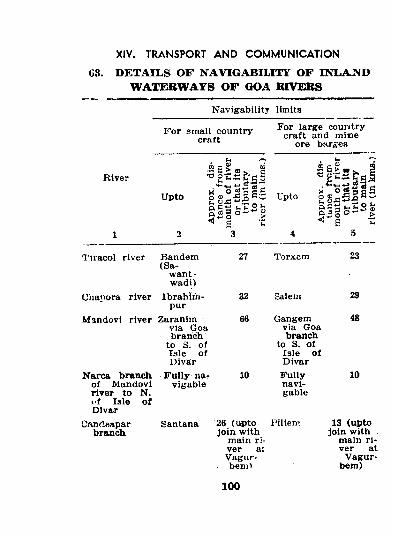
63. DETAILS OF NAVIGABILITY OF INLAND WATERWAYS OF GOA RIVEBS
XIV. TRANSPORT AND COMMUNICATION
Navigability limits
F or small country craft
For large coumtry craft and m ine
ore bs<Jgea
River
Uptoj ' S d ' s g c
S3
Upto
I'iracol river Bandem (Sa-
want - wadi)
Chat»ora river Ibrahlih- pur
Mandovi river Zaranimvia Goa branch
to S. of Isle o f Divar
Narca branchof Mandovi river to N. i f Isle o f Divar
Canrlftaparbranch
F ully navigable
27
32
66
10
Santana 26 (upto jo in with
main river a: Vagur- benil
Torxem
Salem
Gangem via Goa branch
to S. o f Isle o f DivarFullynavigable
23
29
48
10
Pilien' 13 (upto jo in with
main river at
Vagur- bem)
100
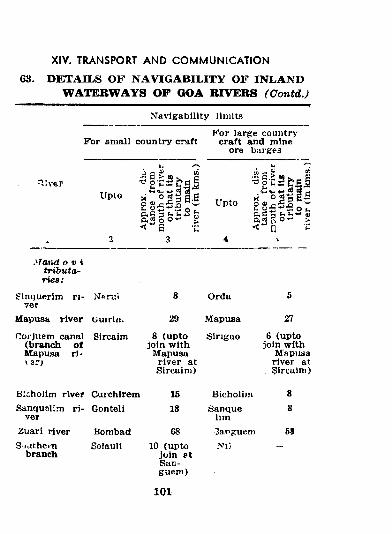
63. DETAILS OF NAVIGABILITY OF INLAND WATERWAYS OF GOA RIVERS (ContdJ
XIV. TRANSPORT AND CO M M UN ICAT ION
Navigability limits
For sm all country craftF or large country
craft and mineore barges
Upto
.■j c _ m
*J cSo 2 3 S .S
< B u
Upto
.frond o V i tributaries:
Sinquerim ri- N^trui ver
Mapusa river uuiriii.
Corjuem canal (branch o f Mapusa rl-rsc)
Sircaim
8
29
8 (upto jo in with
Mapusa river at Sircaim )
Orda
Mapusa
Sirigao
6
27
6 (upto jo in with
Mapusa river at Sircaim)
Bicholim river (JurchiremSanauol'.in ri- Gonteli
verZuari riverS jathem
branch
BombadSoIauM
1518
6810 (upto
jo in at San- guem )
BicholiniSanque
lim3anguem.VI)
88
5«
101
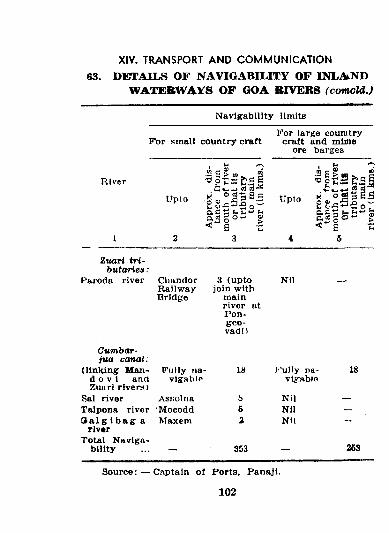
XIV. TRANSPORT AND COMMUNICATION
63. DETAILS OF NAVIGABILITY OF INLAND WATERWAYS OF GOA RIVERS (comcld.)
Navigability limits
River
For small country craft
p , c -a I - u
I
For large counitry craft and mime
ore barges
Upto
<n c S «
'Is !
5
Zuari tributaries :
Pai’oda river ChandorRailwayBridge
3 (upto jo in with
main river at Pon- geo- vadi)
Nil
Cumbar- jua canal:
(linking IVTan-d 0 V i anrt Zuari rivers >
Fully navigable
18 J-’ully na- vlgabio
18
Sal river Asfiolna 8 Nil —Talpona river M ocodd 6 Nil —G^aliribagr a rlv«r
Maxem 2 Nil ■—
Total Navigability - 353 - 263
Source: ~ Captain o f Ports, Panaji.
102
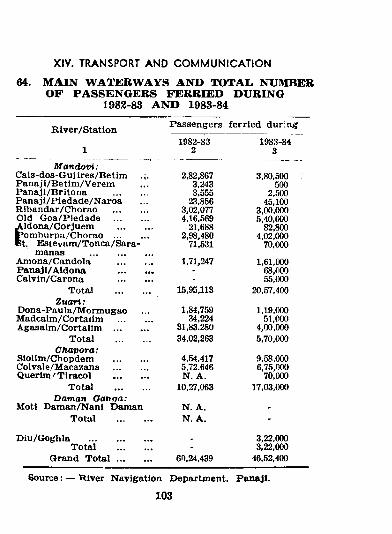
XIV. TRANSPORT AND COM M UN ICAT IO N
64. MAIN WATERWAYS AND TOTAL NUMBER OF PASSENGERS FERRIED DURING
1982-83 AND 1983-84
R iver/S tation
M andovi: Cals-dos-Guj ires/B etim .; Panaji/B etim /V eremP anaji/B ritona .............P anaji/P iedade/N aroaR ibandar/Chorao .............Old G oa/Piedade .............A ldona/C orjuemPom hurpa/C horao .............Bt. E stevam /T onca/Sara-
manas .......................Aniona/CandolaP anajl/A ldonaCalvin/Carona
Total .............Zuari:
D ona-Paula/M orm ugaoM adcaim/CortaiimAgasaim /Cortalim .............
Total .............Chapora:
Slolim /Chopdem .............Colvale/Macazana .............Q uerlm /T lracol .............
T otal .............Daman Oanaa:
Moti Daman/NanI DamanTotal
D iu/Goghla .......................Total
Grand Total ...
Passengers ferried dur;n^
1982-83 1983-842 3
2.82,867 3,80,5003,243 5003,555 2,500
23,856 45,1003,02,077 3,00,0004,16,569 5,40,000
21,688 82,8002,98,480 4,02,000
71,531 70,000
1,71,247 1,61,000- 68,000- 55,000
15,95,113 20,57,400
1,84,759 1,19,00034,224 51,000
31,83.280 4,00,00034,02,263 6,70,000
4,54,417 9,58,0005,72.646 6,75,000N. A. 70,000
10,27,063 17,03,000
N. A. .
N. A. -_ 3,22,000- 3,22,000
60,24,439 46,52,400
Source: — Tliver Navigation Department, Panaji.
103
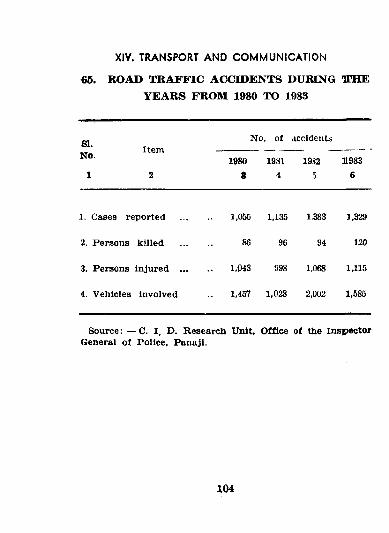
65. ROAD TRAFFIC ACCIDENTS DURING ITHE YEARS FROM 1980 TO 1983
XIV. TRANSPORT AND COMMUNICATION
SING.
1 2
No. of accidents
1980g
1981i
19325
319836
1. Cases reported 1,055 1,135 1.383 1,329
2. Persons killed 86 96 94 120
3. Persons injured ... .. 1,043 998 1,068 1,115
4. Vehicles Involved 1,457 1,028 2,002 1,585
Source: — C. I. D. Research Unit, Office of the Inspector General of Police, Panaji.
104
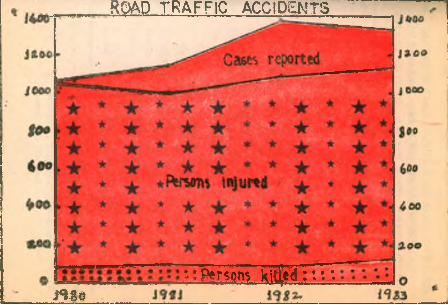
ROAD TRAFFIC ACCIDENTS
m o^FNtrsons k ^ ( ^ 6 : : : :
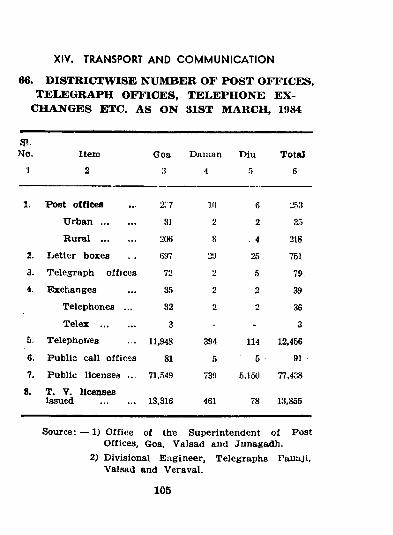
66. DISTRICTWISE NUMBER OF POST OFFICER, TELEGRAPH OFFICES, TELEPHONE EX
CHANGES ETC. AS ON SIST MARCH, 1984
XIV. TRANSPORT AND CO M M UN ICAT IO N
gi.No.
1
Item
2Goa
3Daman
4Diu
r,
Total
6
1. P ost offices 2.'7 10 6 253Urban .............. 31 2 2 35Rural .............. 206 8 . 4 218
2. Letter boxes 697 29 25 7513. Telegraph o 'ficos 72 2 5 794. Exchanges 35 2 2 39
Telephones ... 32 2 2 36
Telex .............. 3 - - 35. Telephones 11.948 394 114 12,4566. Public call offices 81 5 5 91
7. Public licenses ... 71,349 739 5,150 77,433
8. T. V. licensesissued .............. 13,316 461 78 13,855
Source: — 1) Office of the Superintendent of PostOffices, Goa, Valsad and Junagadh.
2) Divisional Engineer, Telegraphs Pauuji, Valsad and Veraval.
105
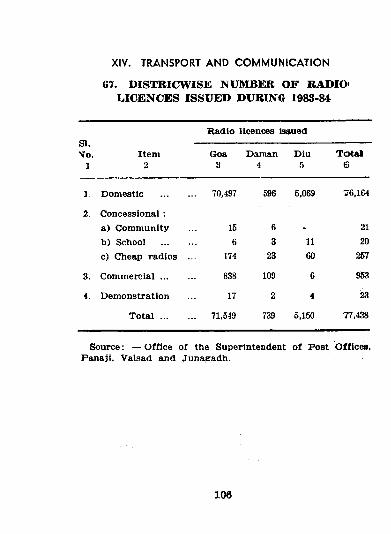
67. DISTRICWISE NUMBER OF RADIO' LICENCES ISSUED DURING 1983-84
XIV. TRANSPORT AND COMMUNICATION
R adio licences isaued
Vo.1
Item2
Goa3
Daman4
Diu5
T ota l6
1. Domestic ............... 70,497 596 5,069 76,164
2. Concessional : a) Community 15 6 . 21b) School 6 3 11 20c) Cheap radios .. 174 23 60 257
3. C om m ercia l............. 838 109 6 953
4. Demonstration 17 2 4 2S
T o t a l ............. 71,549 739 5,150 77,438
Source: — O ffice o f the Superintendent o f Post O ffices, Panajl. Valsad and Junaeadh.
106
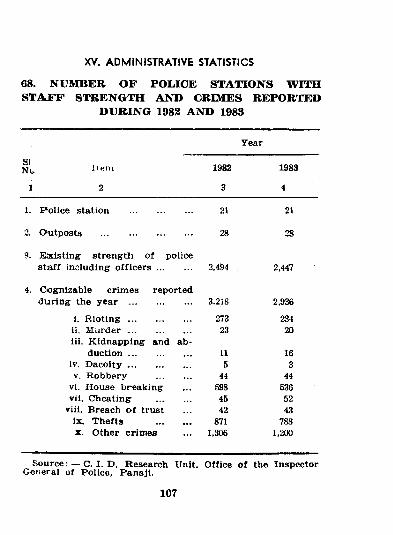
XV. ADMINISTRATIVE STATISTICS
68. NUMBER OF POLICE STATIONS WITH STAFF STRENGTH AND CRIMES REPOR'fED
DURING 1982 AND 1988
S'Nt> Item
1 2
Year
1982
3
1983
4
1. P o lice station .......................... 21 21
2. Outposts ...................................... 28 28
3. E xisting strengtli o f policesta ff including o f f i c e r s .............. 2,494 2,447
4. Cognizable crim es reportedduring the year .......................... 3,218 2,936
i. R i o t i n g .......................... 273 234il. M u r d e r .......................... 23 20iii. K idnapping and ab
duction ... 11 16iv. D a c o it y .......................... 5 3
V. R obbery .............. 44 44vi. House breaking 598 536vii. Cheating .............. 45 52
viii. Breach o f trust 42 43ix. T hefts 871 788X . Other crim es 1,306 1,200
S ource : — C. I. D. Research Unit. Office o f the Inspector General of P olice. Panajl.
107
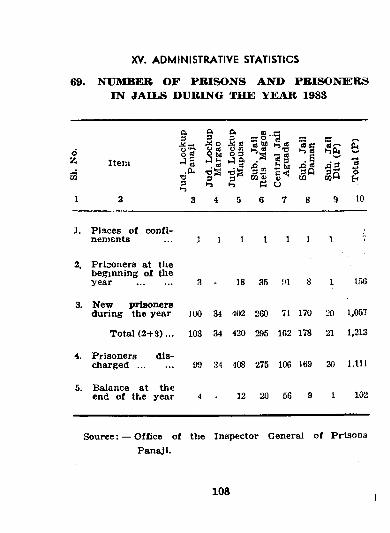
XV. ADMINISTRATIVE STATISTICS
69. NUMBER OF PRISONS AND PRISONERS IN JAILS DURING THE YEAR 198S
Itemo 5
3 • P4733
a 0< m s3 3 S o - •3 3 a ^^ 0 . ! < e 8 M U ) i - , « cSC CLs g , s s - - s " i " e j ^
*o| >0 ^ 3-S co ! sQ S o d3 ” 3*^ moi M cqQ hh) tf o
6 8 9 10
1. P laces o f con finements 1 1 1 1 1 1
2. Prisoners at tJie beginning o f the year ............... 18 35 01
4k. Prisoners d ischarged ...............
5. Balance at tlie end o f the year
156
3. New prisonersdixring the year 100 34 402 260 71 170 20 1.057
Total (2 + 3 )... 103 34 420 295 1G2 178 21 1,213
99 34 408 275 106 169 20 l.H l
4 - 12 20 56 9 1 102
Source; — O ffice o f the Inspector General o f Priaon.i. Panajl.
108
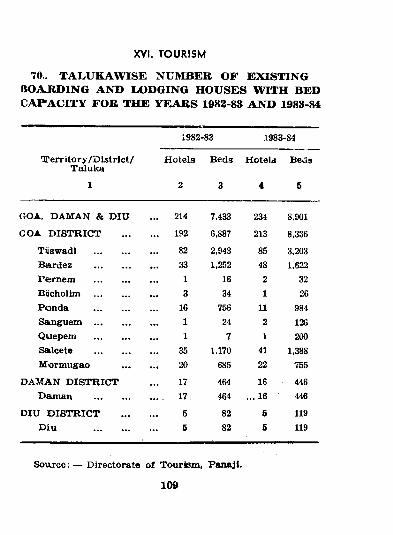
70.. TAL.UKAWISE NUMBER OF EXISTING OOARDING AND LODGING HOUSES WITH BED CAPACITY FOB THE YEARS 1983-83 AND 1983-84
XVI. TOURISM
T e rr ito ry /D is tr ict / Talulca
1982-83 .1983-84
H otels Beds H otels Beds
2 3 4 5
GOA, DAM AN & D IU
GOA D IS T R IC T
Tiiswadi Biardez P em em Biicholim P on d a Sanguem Quepem Salcete M 'ormugao
DAM AN D IST R IC T Dam an
DIU D IS T R IC T D iu
214
192
82331
31611
3520
1717.
55
7,433
6,887
2,9431,252
1634
756247
1,170685
464464
8282
234
213
8548
2
1112
141 22
16 ... 16
5 5
8,901
8.336
3,2031,622
3226
984126200
1,388755
446446
119119
Source: — Directorate of Tourisin, Panaji.
109
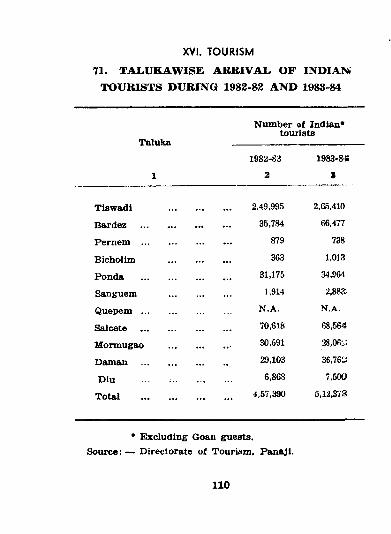
XVI. TOURISM
71. TALUKAWISE ARRIVAL OF INDIANf TOURISTS DURING 1982-82 AND 1983-M
Taluka
Num ber of Indian* tourists
1982-832
19S3-8-S
2
Tiswadi 2.49,995 2,65,410
Bardez ... ... 35,784 66,477
Pernem ... 879 738
Bicholim ... 363 1,013;
Fonda 31,175 34,964
Sanguem 1,914 2,883:
Quepem ... N.A. N.A.
Salcete ... 70,618 68,564
M orm ugao ... 30,691 28,06ii
Daman ... ... 29,103 36,76:J
Diu 6,868 7,500
Total 4,57,390 5,12,37.^
• E xcluding Goan ^ e s t s .Source: — Directorate o f Tourism , Panajl.
110
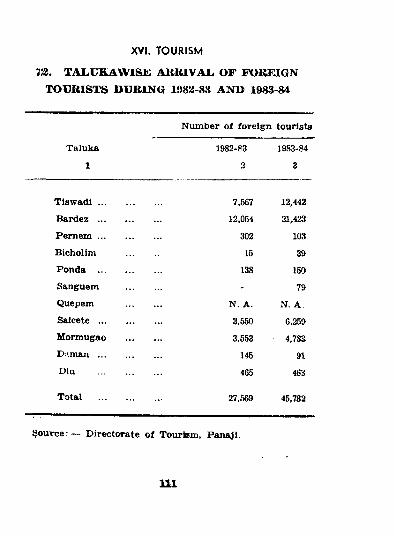
725. TAJLUKAWIS£ ABRIVAL, OF FOREIGN TOURISTS DURING 1982-83 ANTI 1983-84
XVI. TOURISM
Taluka
1
Num ber o f foreign tourists
1982-832
1983-84
T ls w a d i .......................... 7,567 12,442
Bardez .......................... 12,054 21,423
P e m e m .......................... 302 103
Bicholim ............. 15 3&Ponda .......................... 138 150Sanguem ............... - 79Quepem ............... N. A. N. A.S a l c e t e .......................... 3,550 6,259M orm ugao ............... 3,553 4,783D i m a n .......................... 145 91Diu .......................... 465 463
Total .......................... 27,569 45,782
Source: — D irectorate o f Tourfcsm, Panajl.
m
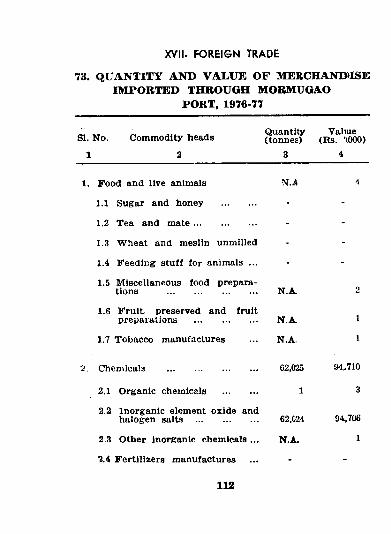
XVII. FOREIGN TRADE
73. QUANTITY AND VALUE OF 1VIERCHAND»ISEmPORTED THROUGH MOBMUGAO
PORT, 1976-77
81. No. Com m odity heads
1 2
Quantity Valuie (tonnes) (Rs. '(000)
1. F ood and live animals N.A
1.1 Sugar and honey ..............
1.2 Tea and m a te ..........................
1.3 W heat and meslin unmilled
1.4 F eeding stuff for animals ...
1.5 Miscellaneous food preparations ..................................... N.A.
1.6 F ru it preserved and fruitpreparations .......................... N.A.
1.7 T obacco manufactures ... N.A.
Chemicals .......... 62.025 94.710
2.1 Organic chemicals ..................................... 1 3
2.2 Inorganic element oxide andhalogen salts .......................... 62,024 94,706
2.3 Other inorganic chem ica ls... N.A. 1
2.4 Fertilizers manufactures
112
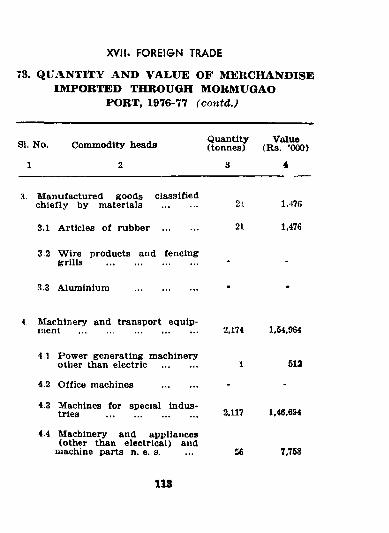
XVII. FOREIGN TRADE
73. QUANTITY AND VALUE OF MERCHANDISEIMPORTED THROUGH MORMUGAO
PORT, 1976-77 (contd.)
SI. No. Com m odity heads
1 2
Quantity Value (tonnes) (R s. ’000)
3. M anufactured goods classified ch ie fly by materials
3.1 A rticles o f rubber ...
3.2 W ire products and fencing g:rills ..........................
3.3 Aluminium
<• Machinery and transport equipment ................ ........
4.1 Pow er generating machineryother than electric .............
4.2 O ffice machines .............
4.3 Machines for special industries .....................................
21
21
2,174
1.47G
1,476
2,117
1,54,964
5ia
1,46,694
4.4 M achinery and appliances (other than electrical) and
machine parts n. e. s. 56 7,758
113
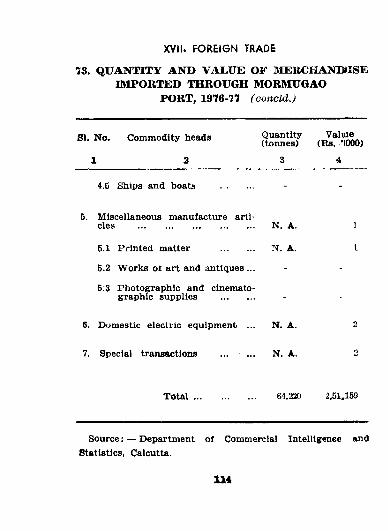
XVII. FOREIGN TRADE
73. QUANTITY AND VALUE OF »IERCHA1S1»ISEIMPORTED THROUGH MORMUGAO
PORT, 1976-77 (concld.)
SI. No. Comm odity heads Quantity(tonnes) (Rs. ’1000)
1 2 3 4
4.5 Ships and boats ..............
5. Miscellaneous manufacture articles N. A. 1
5.1 Printed matter ............... N. A. I
5.2 W orks ot art and antiques ...
5;3 Photographic and cinematographic supplies ..............
6. Domestic electric equipment ... N. A. 2
7. Special transactions ... ... N. A. 2
T o t a l .......................... 64,220 2,51,159
Source: — Department o f Commercial Intelligence andStatistics, Calcutta.
H i
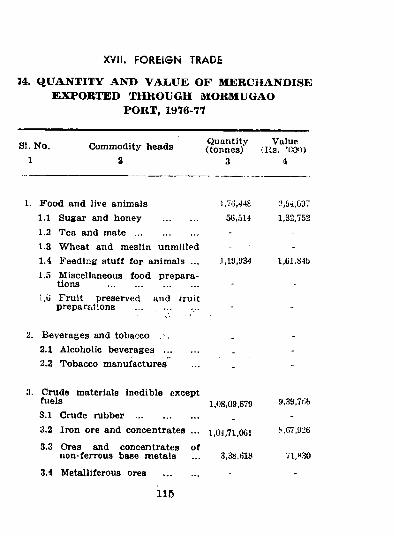
XVII. FOREIGN TRADE
74. QUANTITY AND VALUE OF MERCfiANDISEEXPORTED THROUGH MOBMUGAO
PORT, 1976-77
SI. No. 1
Commodity heads2
Quantity(tonnes)
3
Value (lis . ’OW)
4
1. F ood and live animals1.1 Sugar and honey .............. 5(5,5141.2 Tea and m a t e ...............1.3 W heat and meslin unmilled1.4 Feeding stu ff for animals ... J,19,9341.5 Miscellaneous food prepara
tions ..........................l.ti Fruit preserved
preparationsand truit
2,&4,0371,32,752
1,61,84b
2. Beverages and tobacco . ',2.1 Alcoholic beverages ..2.2 Tobacco manufactures
3. Crude materials inedible except1,08,09,679
3.1 Crude rubber ..........................3.2 Iron ore and concentrates ... ioj,710G l
o f3.3 Ores and concentrates non-ferrous base m etals
3.4 Metalliferous ores
3,38,618
9,39,7o6
8,07,926
71,830
115
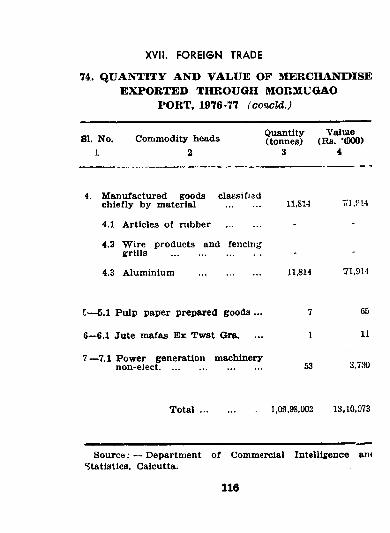
XVII. FOREIGN TRADE
74. QUANTITY AND VALUE OF MERCHANDISEEXPORTED THROUGH IMORMUGAO
PORT, 1976-77 (concld.J
j i 1. j Quantity ValiueSI. No. Comm odity heads (tonnes) (Rs. ’ (DOO)
1 2 3 4
4. M anufactured goods classifiedchiefly by material .............. 11,814 Vl.fiW
4.1 Articles o f rubber ..............
4.2 W ire products and fencinggrills .....................................
4.3 Aluminium .......................... 11,814 71,914
5— 5.1 Pulp paper prepared goods ... 7 65
6—6.1 Jute meifas Ex T w st Gra. ... 1 H
7 —7.1 P ow er generation machinerynon-elect........................................... 53 3,730
T o t a l .......................... 1,09,98,002 13.10,073
S ou rce ; — Department o f Commercial Intelligence an(Statistics, Calcutta.
116
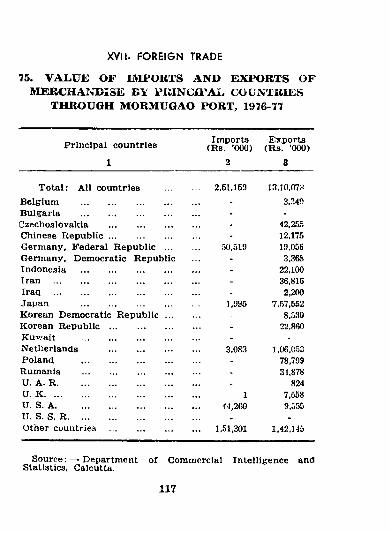
XVII. FOREIGN TRADE
75. VALUE OF IMPORTS AND EXPORTS OFMERCHAIOJISE BY PKINCIPAI. CXiUN’TRIES
THROUGH MORMUGAO PORT, 1976-77
Principal countries
1
Im ports (Rs. ’000)
2
E xports (R s. ’000)
3
T ota l: All countries ... 2,51,15!) 13.10,07XBelgium ...................................... ... 3,?.40Bulgaria ...................................... ... -Czechoslovakia .......................... ... 42,255Chinese R e p u b lic .......................... ... 12,175Germany, Federal R epublic ... 50,519 19,056Germany, Dem ocratic Republic ... 3,368Indonesia ...................................... ... 22,100Iran ................................................. ... 36,81GIraq ................................................. ... 2,200Japan ...................................... 1,995 7,57,552Korean Democratic Republic ... ... 8,530Korean R e p u b l i c .......................... ... 22.860Kuwait ..................................... ... -Netlierlands ..................... 3.0S3 1,06,053Poland ............................... ... 78,799Rumania ............................... ... 34,878U. A. R ....................................... ... 824U. K ........................................... 1 7,558U. S. A ........................................ 44,260 9,555U. S. S. R ................................... ... .Other countries ..................... ... 1,51,301 1,42,145
Source; — Department o f Commercial IntelHgence andStatistics. Calcutta.
117
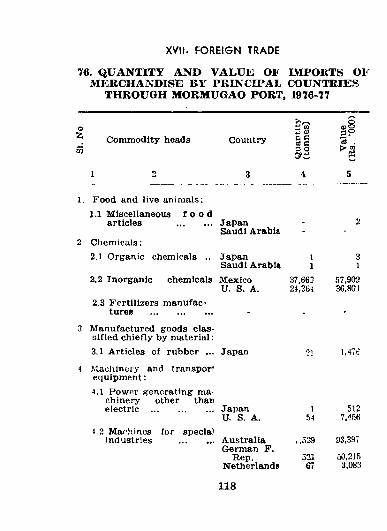
XVII. FOREIGN TRADE
76. QUANTITY AND VALUE OF IMPORTS OFMERCHANDISE BY PRINCIPAL COUNTRIES
THROUGH MORMUGAO PORT, 1976-77
C <i) S PComm odity heads Country C «0} a3 o
"3 .
1 2 3 4 5
F ood and live animals:1.1 M iscellaneous f o o d
articles .............. Japan - 2Saudi Arabia - -
Chem icals:2.1 Organic chemicals .. Japan 1 3
Saudi Arabia 1 12.2 Inorganic chemicals M exico 37,663 57,902
U. S. A. 24,364 36.80J2.3 Fertilizers manufac
tures .......................... - -
M anufactured goods classified chiefly by m aterial:3.1 A rticles o f rubber ... Japan 21 1,476
-Macliinery and transport equipm ent;4.1 Pow er generating ma
chinery other thanelectric .......................... Japan 1 512
U. S. A.1.2 Machines for specla)
Industries .............. Australia German F.
.,529 93,397
Rep. 521 50,215Netherlandg 67 3,083
118
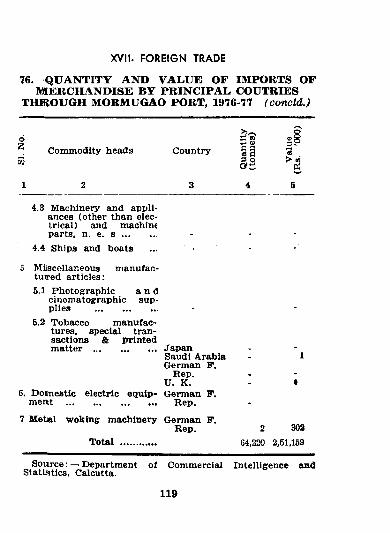
XVII. FOREIGN TRADE
76. QUANTITY AND VALUE OF OIPORTS OFMIERCHANDISE BY PRINCIPAL, COUTRIES
THROUGH MORMUGAO PORT, 1976-77 (concU.)
<D§S a ?
Comm odity heads Country 3 3 "33 0 ><n
4.3 Machinery and appliances (other than electrical) and machineparts, n. e. s .............. - - -
4.4 Ships and boats ... - - -
5 Miiscellaneous m anufactured articles:5.1 Photographic a n d
cinem atographic supplies ......................... .
5.2 T obacco m anufactures, special transactions & printed m atter ..........................Japan
Saudi Arabia - 1German P.
R ep.U. K. - «
6. D om estic electric equip- German F.m ent ...................................... Rep.
7 M etal w oking m achinery German F.R ep. 2 302
Total ............... 64,220 2,51,159
S ou rce : — Department o f Commercial Intelligence andStatistics, Calcutta.
119
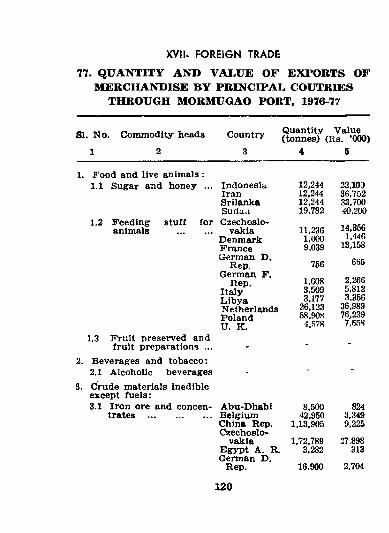
XVII. FOREIGN TRADE
77. QUANTITY AND VALUE OF EXPORTS OFMERCHANDISE BY PRINCIPAL COUTRIES
THROUGH MORMUGAO PORT, 1976-77
SI. No. Comm odity heads Country
1 2 3
Quantity Value (tonnes) (Ra. ’000)
4 6
1. F ood and live animals 1.1 Sugar and honey
1.2 Feedinganimals
stuff for
Indonesia Iran Srilanka Sudu.i Czechoslo
vakia Denmark France German D.
Rep. German F.
Rep.ItalyL ibyaNetherlands Poland U . K .
12.24412.24412.244 19,782
11,2361,0009,039
756
1,6083,5093,177
26,12358,9084,578
22,10036.75233,70040,200
14,3561,446
13,158
665
2,2665,8123,356
36,98976,2397,568
1.3 Fruit preserv'ed andfruit preparations ... -
Beverages and tobacco:2.1 A lcoholic beveragesCrude materials inedible except fuels:3.1 Iron ore and concen A bu-Dhabi 8,500 824
trates .......................... Belgitun 42,950 3,349China Rep. Czechoslo
1,13,905 9,225
vakia 1,72,789 27.898E gypt A. R, German D.
3,282 313
Rep. 16,900 2.704
120
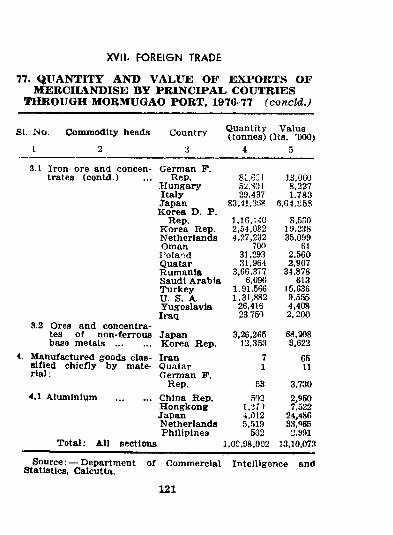
XVII. FOREIGN TRADE
77. QUANTITY ANB VALUE OF EXPORTS OFMERCHANDISE BY PRINCIPAL COUTRIES
THROUGH MORMUGAO PORT, 1976-77 (cancU.)
Si. No. Comm odity heads Country
I 2 3
Quantity Value (tonnes) (Its. ’000)
4 5
3.1 Iron ore and concentrates (contd.)
3.2 Ores and concentrates o f non-ferrous base metals ...............
4. Manufactured j sified chiefly rial;
4.1 Altuninixmi
roods clas- b y mate-
T ota l: All sections
German F.Rep.
H ungaryItalyJapanK orea D. P.
Rep.Korea Rep. Netherlands Oman
Poland Quatar Rumania Saudi Arabia Turkey U. S. A, Yugoslavia Iraq
Japan K orea Rep.IranQuatar German F.
Rep.China Rep.H ongkongJapanNetherlandsPhilipinea
s i ,g: l52,30129.437
83,41.3'o8
1,16,MO 2,54,082 4,27,232
700 31.293 31,964
3,66,377 6,096
1,91,566 1,31,882
26,416 23 750
3,26,26512,353
71
53502
1,27)4,0125,519
5021,09,98,002
13,0008,2271.783
6,64,^58
S,5S0 19,238 35,099
61 2,560 2,907
31,878 613
15,636 9,555 4,408 2, 200
68,3083,622
6511
3,7302,9507,522
24.48633,«652,991
13,10,073Source: — Department o f Commercial Intelligence and
Statistics. Calcutta.
121
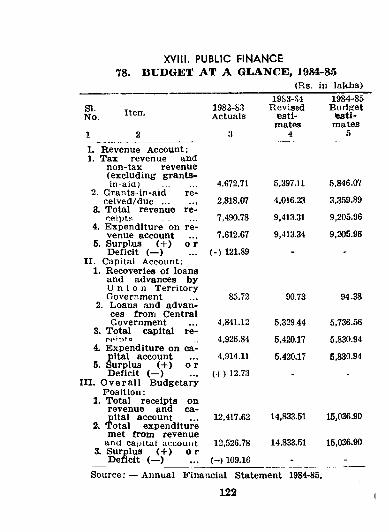
XVIII. PUBLIC FINANCE 78. BUDGET AT A GLANCE, 1984-85
(Rs. in lakhs)
SI.No. Item
2
I. Revenue Account:1. Tax revenue and
non-tax revenue (excluding grants- in-aidj ..............
2. Grants-in-ald received/due ..............
3. Total revenue receipts ..............
4. Expenditure on revenue account
5. Surplus (+ ) o r Deficit (—)
II. Capital Account:1. Recoveries o f loans
and advances by U n i o n Territory
1982-83Actuals
4,672.71
2,818.07
7,490.78
7,612.67
( - ) 121.89
19S3-S1Revised
estimates
4
5,397.11
4,01623
9,413.31
9,413.34
III. O v e r a l l Budgetary P osition :
1. Total receipts onrevenue and capital account ... 12,417.62
2. Total expenditure met from revenue
and capiLul .icuouiit 12,526.783. Surplus (+ ) o r
D eficit (— ) ... ( - ) 109.16
14.833.51
14.833.51
1984-85Budget
estimates
5
5,846.07
3,359.89
9.205.96
9.205.96
Government 85.72 90.73 94.382. Loans and advan
ces from CentralGovernment 4,841.12 5,329.44 5,736.56
3. Total capital re-rpiT>t<3 4,926.84 5,420.17 5,830.94
4. Expenditure on capital account 4,914.11 5,420.17 5,830.94
5. Surplus (+ ) o rD eficit (—) (+ ) 12.73 - - ■
15.036.90
15.036.90
Source: — Annual Financial Statement 1984-85.
122
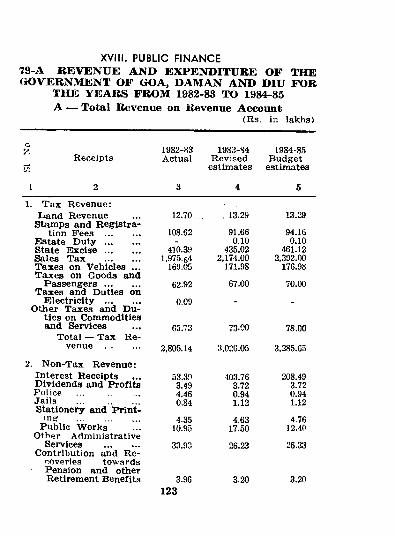
XVIII. PUBLIC FINANCE 79-A REVENUE AND EXPENDITURE OF THE GOVERNMENT OF GOA, DAMAN AND DIU FOR
THE YEARS FROM 1982-83 TO 1984-85 A — Total Revenue on Revenue Account
(Rs. in lakhs)
Receijits1982-83 1983-S4 1984-85Actual Revised Budget
estimates estimates
I
1. T a x Revenue:L and Revenue
Stamps and R egistration Fees ...............
Estate D u t y ..............State E x c i s e ...............Sales T ax ...............T axes on Vehicles ... T axes on Goods and
P a s s e n g e r s ...............Taxes and Duties on
Eilectricity ...............Other T axes and D u
ties on Comm odities and Services
Total — Tax R evenue ..............
2. N on-Tax R evenue: Interest Receipts D ividends and P rofitsPolice ... ..............Jails ..........................Stationery and P rin t
ing ..........................Public W orks
Other AdministrativeServices ...............
Contribution and R ecoveries towards Pension and other Retirement Benefits
12.70 ... . 13.29 13.29
108.62
410.39,975.04169.05
91.660.10
435.022,174.00
171.98
94.16O.IO
461.122,392.00
176.98
62.92 67.00 70.00
0.09 - -
05.73 73.00 78.00
,805.14 3,026.05 3,285.65
53.393.494.460.84
403.763.720.941.12
208.493.720.941.12
4.3510.95
4.6317.50
4.7612.40
33.93 26.23 26.33
3.96 3.20 3.20123
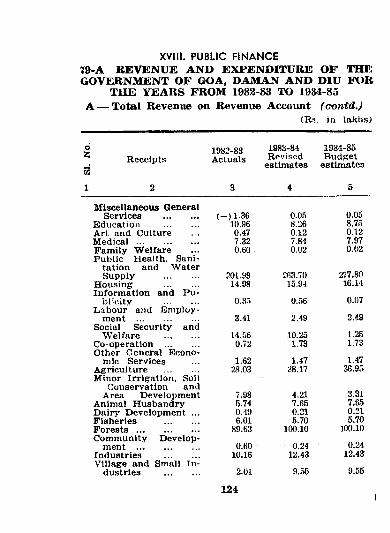
XVIll. PUBLIC FINANCE 79-A REVENUE AND EXPENDITURE OF THE GOVERNMENT OF GOA, DAMAN AND DIU FOR
THE YEARS FROM 1982-83 TO 1984-85 A — Total Revenue on Revenue Account (oontd.)
(Rs. In lakhs)
Receipts1982-83Actuals
1983-84Revised
estimates
1984-85Budget
estimates
2 3 4 5
M iscellaneous GeneralServices .............. (-)1 .3 6 0.05 0.05
Education .............. 10.96 8.26 8.75Art and Culture 0.47 0.12 0.12M e d ic a l .......................... 7.32 7.84 7.97Fam ily W elfare 0.60 0.02 0.02Public Health, Sani
tation and W ater277.80Supply .............. 201.99 263.70
H ousing .............. 14.98 15.94 16.14Inform ation and P u
b licity .............. 0.3i 0.56 0.07Labour and Em ploy
2.49ment .......................... 3.41 2.49Social Security and
1.25W elfare .............. 14.06 10.25Co-operation .............. 0.72 1.73 1.73Other General Econo
mic Services 1.62 1.47 1.47Agriculture .............. 28.03 38.17 36.95Minor Irrigation, Soil
Conservation and3.31Area Development 7.98 4.21
Animal Husbandry .’5.74 7.65 7.65Dairy Development ... 0.49 0.21 0.21Fisheries .............. 6.01 5.70 5.70F o r e s t s .......................... 89.63 100.10 100.10Community Develop
•0.24 0.24ment .......................... 0.60Industries .............. 10.16 12.43 12.43Village and Small In
9.55dustries .............. 2.01 9.55
124
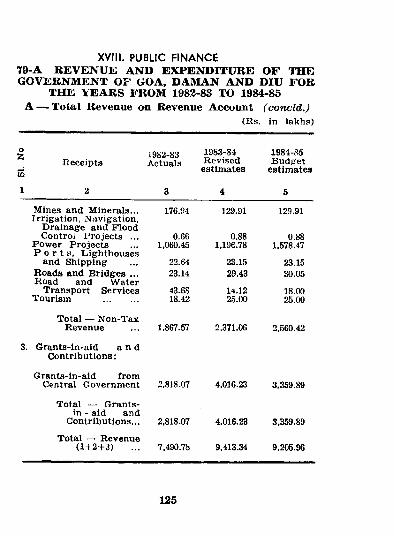
XVill. PUBLIC FINANCE 79-A REVENUE AND EXPENDITURE OF THE GOVERNMENT OF UOA, DAMAN AND DIU FOR
THE YEARS FROM 1982-83 TO 1984-85 A — Total Revenue an Revenue Account (concld.)
(Rs. in lakhs)
6R eceipts
m
1982-83Actuals
1983-84Revisedestimates
1984-85Budget
estimates
1 2 3 4 6
Mines and M inerals... Irrigation, Navigation,
Drainage and F lood Control P rojects ...
Power P rojects P o r t s , L ighthoiises
and Shipping R oads and Bridires ... Road and W ater
Transport Services Tourism ..............
176.94
0.661,060.45
22M23.14
43.6818.42
129.91
0.881,196.78
23.1529.43
14.1225.00
129.91
0.881,578.47
23.1530.05
18.0025.00
Total — N on-Tax Revenue 1,867.57 2,371.06 2,560.42
3. Grants-in-aid a n d C ontributions:
Grants-in-aid from Central Government 2,818.07 4,016.23 3,359.89
Total — Grants- in - aid and
Contributions... 2,818.07 4,016.23 3.359.89
Total — Revenue(1-12+3) 7,490.78 9,413.34 9,205.96
125
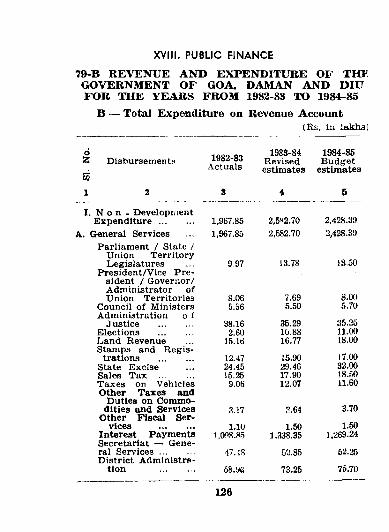
XVIII. PUBLIC FINANCE
79-B REVENUE AND EXPENDITURE OF THE GOVERNMENT OF GOA, DAMAN AND DIU FOR THE YEARS FROM 1982-83 TO 1984-85
B — Total Expenditure on Revenue Account(Rs. iu iakha]
Disbursements 1982-83Actuals
1983-84 1984-85Revised Budg^etestimates estimates
2 3 4 5
N o n - DevelopmentE x p e n d itu r e .............. 1,967.85 2,5«2.70 2,428.39
General Services 1,967.85 2,582.70 2,428.39Parliament / Stale /
Union TerritoryLegislatures 9.97 13.78 13.50
President/V ice P resident / G overnor/Adm inistrator of
8.00Union Territories 8.06 7.69Council o f Ministers 5.S6 5.50 5.70Administration o f
Justice .............. 38.16 35.29 35.25Elections .............. 2.60 10.88 11.00Land Revenue 15.16 16.77 18.00Stamps and R egis
17.00trations .............. 12.47 15.90State Excise 24.45 29.46 32.00Sales Tax .............. 15.25 17.90 18.60Taxes on Vehicles 9.06 12.07 11.60Other Taxes and
Duties on Commodities and Services 3.17 3.64 3.70
Other Fiscal Ser1.50vices ............... 1.10 1.50
Interest Payments 1,098.85 1.338.35 1,269.24Secretariat — General S e rv ice s .............. ■17.4S 02.85 62.25D istrict Adm inistro-
tion .............. 58.a6 73.25 76.70
126
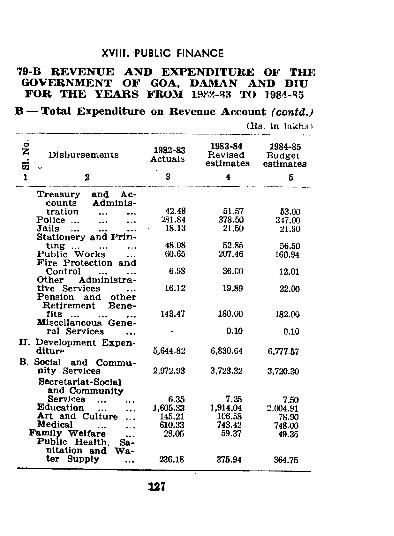
79-B REVENUE AND EXPENDITURE OF THE GOVERNMENT OF GOA, DAMAN AND DIU FOB THE YEARS FROM TO 1984 «5
B — Total Expenditure on Revenue Account (contd.J(Rs. in lakh.s)
XVIII. PUBLIC FINANCE
1982-83Actuals
1983-84 1984-85Revised Budgetestimates estimates
Treasury and A c counts A dm inistration ............... 42.48 51.57 53.00
P o l i c e .......................... 281.84 378.50 347.00Jails ........................... 18.13 21.50 21.90Stationery and P rin
ting .......................... 48.08 52.85 56.50P ublic W orks 60.65 207.46 160.94Fire P rotection and
Control ............... 6.98 36.00 12.01Other A dm inistrative Services 16.12 19.89 22.00Pension and other
Retirem ent B enefits .......................... 143.47 180.00 182.00
Miscellaneous G eneral Services - 0.10 o.ia
II. Development E xpen diture 5,644.82 6,830.64 6,777.57
B. Social and Com m unity Services 2,972.93 3,723.32 3,720.30Secretariat-Social
and CommunityServJces ............... 6.35 7.25 7.50
Education ............... J.605.33 1,914.04 2,004.91Art and Culture ... 145.21 106.58 78.90Medical ............... 610.33 743.42 748.00
Fam ily W elfare 28.05 59.37 49.35P ublic Health, Sa
nitation and W ater Supply 236.18 375.94 364.75
127
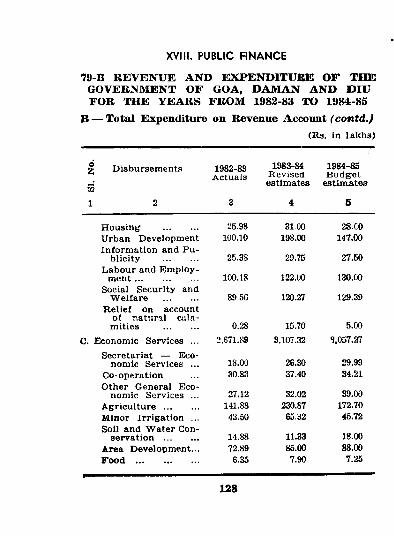
79-B REVENUE AND EXPENDITURE OF THE GOVERNMENT OF GOA, DAMAN AND UIU FOR THE YEARS FROM 1982-83 TO 1984-85
B — Total Expenditure on Revenue Account (contd.)(Rs. in lakhs)
XVIII. PUBLIC FINANCE
^ Disbursements
ra
1982-83Actuals
1983-84Revisedestimates
1984-85Budget
estimates
1 2 3 4 6
H ousing .............. 25.98 3100 28.C0Urban Development 100.10 198.00 147.00Inform ation and P u
b licity .............. 25.38 29.75 27.50Labour and Em ploy
ment .......................... 100.18 122.00 130.00Social Security and
W elfare .............. 89.50 120.27 129.39R elie f on account
o f natural c^ila- m ities .............. 0.28 15.70 5.00
C. Econom ic Services ... 2,671.89 3.107.32 3,057.27Secretariat — E co
nom ic Services ... 18.00 26.30 29.99Co-operation 30.83 37.40 34.21Other General E co
nom ic Services ... 27.12 32.02 39.00A g r ic u lt u r e .............. 141.88 230.87 172.70M inor Irrigation ... 43.50 65.32 45.72Soil and W ater Con
servation .............. 14.88 11.33 18.00Area Development... 72.89 86.00 88.00F ood .......................... 6.35 7.90 7.25
128
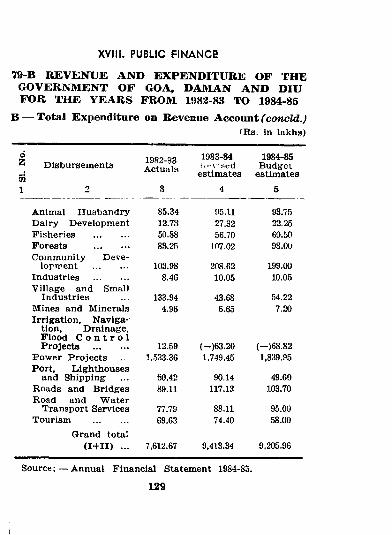
XVIII. PUBLIC FINANCE
79-B REVENUE AND EXPENDITURE OF THEGOVERNMENT OF FOR THE YEARS
B — Total Expenditure
GOA, DAMAN AND DIU FROM 1982-83 TO 1984-85on Revenue Account (concld.)
(R s. in lakhs)
d^ Disbursements
1 2
1982-83Actuals
3
1983-84ht-vised
estimates4
1984-85Budget
estimates5
Animal Husbandry 85.34 95.11 93.75Dairy Development 12.73 27.32 22.25Fisheries ............... 50.88 56.70 60.50F orests .............. 83.25 107.02 98.00Community Deve
lopment .............. 103.98 208.62 199.00Industries .............. 8.46 10.05 10.05Village and Small
Industries 133.94 43.68 54.22Mines and Minerals 4.96 6.65 7.20Irrigation, Naviga
tion, Drainage, F lood C o n t r o l P rojects .............. 12.59 (-)63.20 (—)68.82
Pow er P rojects 1,533.36 1,749.45 1,839.95Port, L ighthouses
and Shipping 60.42 90.14 49.60Roads and Bridges 89.11 117.13 103.70Road and W ater
Transport Services 77.78 88.11 95.00Tourism .............. 69.63 74.40 58.00
Grand total ( I + I I ) ... 7,612.67 9,413.34 9,205.96
Source; — Annual Financial Statement 1984-85.
129
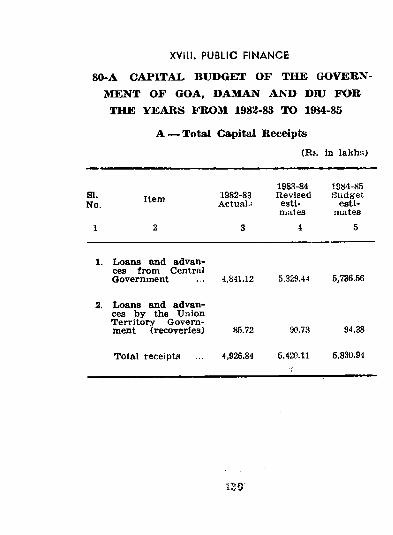
80-A CAPITAL, BUDGET OF THE GOVERNMENT OF GOA, DAMAN AND DIU FOR THE YEARS FROM 1982-83 TO 1954-85
A — Total Capital Receipts(Rs. In lakhs)
XVIll. PUBLIC FINANCE
SI.No. Item 1982-83
Actual.s
1983-84Revised
estimates
1984-X5Budget
estimates
1 2 3 i 5
1. Loans and advances from Central Government 4,841.12 5.329.44 5,736.56
2. lioans and advances by the Union Territory Governm ent (recoveries) 85.72 90.73 94.38
Total receipts 4,926.84 5,420.11 5,830.94
ISC'
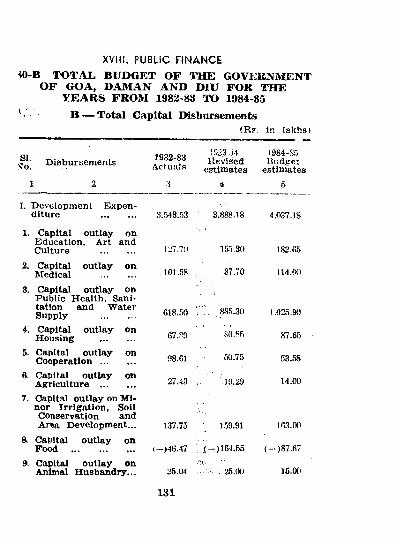
iO-B TOTAL BUDGET OF THE GOVERNMENT OF GOA, DAMAN AND DIU FOR THE
YEARS FROM 1982-83 TO 1984-85V. B — Total Capital Disbursements
(Rs. In lakhs)
XVili. PUBLiC FINANCE
SI.^0. Disbursem ents
1 2
!.033.54 1984-85lievised Budge:,
Acruaia estimates estimates1982-88
tu;
I. Developm ent Expenditure ............... S.543.53 3.888.18
7. CJapltal outlay on M inor Irrigation, Soil Conservation and Area Development...
a Capital outlay onFood ..........................
9. Capital outlay onAnimal Husbandry...
4,037.18
1. Capital outlay onEducation, Art andCulture .............. l'J7.7(l 15T).30 182.65
2. Capital outlay on Medical .............. 101.58 , .87.70 I14.0(.>
3. Capital outlay onPublic Health, Sanitation and W ater Supply .............. 618.50 ’ ■ , 885.30 1.025.90
4. Capital outlay on H ousing .............. 67.P0 fiO.Sr, 87.65
5. Capital outlay on 98.61 50.75 53.58C o o p e r a t io n ..............8. Capital outlay on V.43 ' JS.29 14.00A griculture ..............
137.76 ir,9.91 Ifi-TOO
(-)46.47 64.55 (-)87.67
25.1)4 . •.•25.00 15.00
131
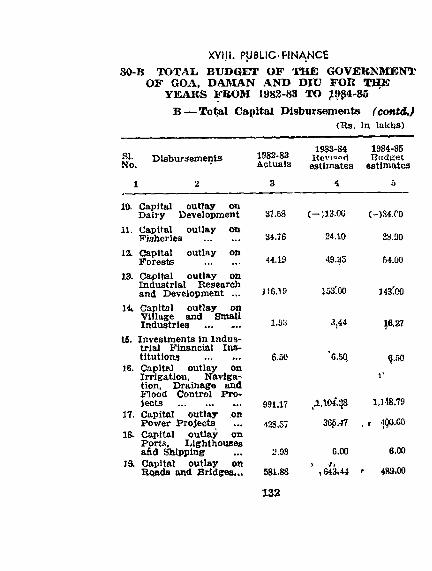
80-B TOTAL BUDGET OF THE GOVERNMENT OF GOA, DARIAN ANI> DIU FOR THE
YEARS FROM 1982-83 TO 19g4-*86B — T o ^ Capital Disbursements (contd.)
XVIII. PUBLIC-FINANCE
<Rs. in lakhs)
Disbursem ents 1982-83 1983-84Reviof'rt
1984-85BudRet
No. Actuals estimates estimates
1 2 3 4 5
10. Capital outlay on Dairy Developm ent 3T.58 (-)13 .06 (-)S4,C0
11. Capital outlay on Fisheries ............. . 34.76 24.10 38.90
12. Capital outlay on Forests .............. 44.19 49.^5 64.00
13. Capital outlay on Industrial Research
156.19 153'.00and Development ... 143'00
Hv Capitol outlay on V illage and Small Industries 1.93 .K.44 16.27
16. Investments In Industrial Financial Institutions ............... 6.60 '6.5Q
16. CapltsJ outlay on Irrigation, Navigation, Drainage and F lood Control P ro jects .......................... 991.17 A.104’.28
1’
1.148.7917. Capital outlay on
P ow er P rojects 42S.57 365,47 , r 4Q0.C0IS- Capital outlay on
Ports, Lighthouses and Shlpping^ 2.9S 6.00 6.00
13. Capital outlay oa R t^ds and B ridges... 581.88 ’ ,64^44 r 489,00
132
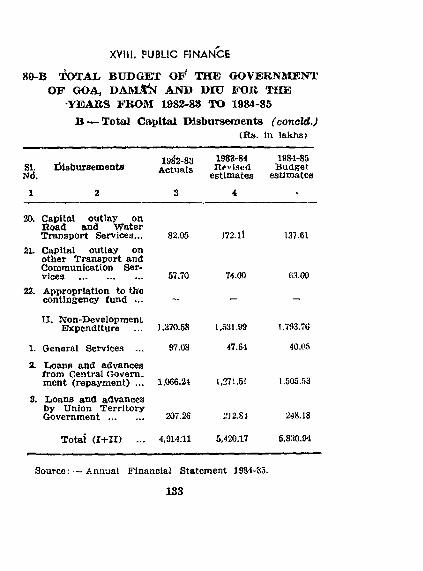
80-B TOTAL BUDGET OF' THE GOVERNatENT OF GOA, DAIMirk AND 1>IU FOlt THE
YEABS FROM 1982-88 TO 1984-85 B — Total Capital IMsbursements (concld.)
(R s. in lakhs)
XVill. PUBLIC FINANCE
SI. d isbiirsem ents Nd,
1982-83Actuals
1983-84Rpvi.<;ed
estimates
1984-85Budget
estimates
1 2 3 4 >
30. Capital outlay on R oad and W ater Transport Services... 82.05 172.ll 137.61
21. Capital outlay on other Transport and Communication Services .......................... 57.70 74.00 «3.00
22. Appropriation to the contingency fund ... - - -
II. rfon-Developm ent Expenditure 1,370.58 1,531.99 1,793.76
1. General Services ... 97.08 47.61 40.('5
2. Loans and advances from Central Govern, m ent (repaym ent) ... 1,066.24 1,271.51 1,505.53
8. Loans and advances by Union T erritory G o v e r n m e n t .............. 207.26 212.81 248.18
Total ( I + I I ) ... 4,914.11 5,420.17 5.830.94
Sourcc: — Annual Financial Statement 1984-S5.
133
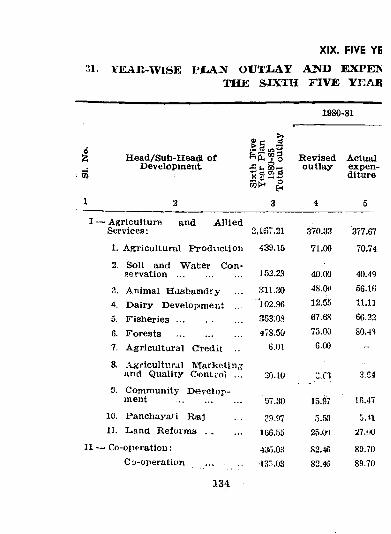
XIX. FIVE YE
YEAK-WISE P ]L A N O U T 3L A Y AISTD EXPE2NT H E S I X T H FIVE YI]AIi
1980-81
1
■ 3
H ead/S u b-H ead o f D evelopm ent
1^ 00--
R evisedoutlay
Actualexpenditure
1 2 3 4 5
I — Agriculture and A llied Services: 2 ,is :.2 i 3/0.33 377.67
1. A gricultural P rod u ction 439.15 71.00 70.74
2. Soil and W ater Conservation ............... 152.29 40.00 40.49
3. Animal H usbandry 311.30 48.00 56.1G
4. Dairy Developm ent ... 102.96 12.55 11.11
5. F is h e r ie s ........................... 353.08 67.68 66.22
6. Forests ........................... 478.50 i o.OO S0.4”.
7. Agricultural C redit .. 6.01 6.00 -
8. Agricultural M arketing and Quality O ontioi ... 30.10 z .n 3 64
9. Community D evelop ment .......................... 97.30 15.97 16.47
10. Panchayari R a j 5.50 5.4111. Land R e f o r m s ............... 1G6.55 25.0') 27.00
11 — C o-operation: -i3r,.o;5 82.46 89.70Co-operation ■i3.".03 82.46 89.70
134
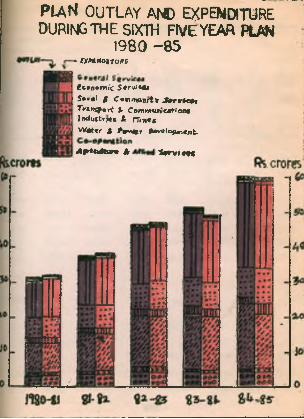
p l a n outlay and EXPENDtTUREDURING-TOE SIXTH FIVE YEAR PUW
1980 -85- <ywm>tro/r£
ifommic S*r«it*My » * 4 l t C * » irn a it f t lr JS » r tr « c * tf * ’t n ^ r t t, Com m UficaHoMinduttrytt A fTin««VVat*^ 4 #9 W K r t tf^ lo p m e n t.
Ap^«i4bin» it 1«rvi««t
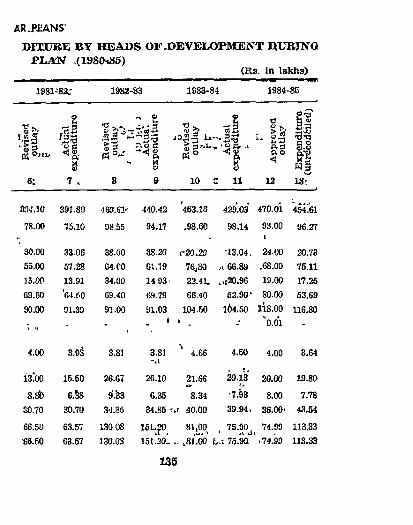
AR.PMNS-
D ITU B E B Y H E A D S O F4>E V E LO P M E N T H U B IK Q P L A N ^198(h85)
(R s. In lakhs)
1981- 1982-83 1883-84 1984-■8G
•^so
.rt2
f -
'S >>‘ ; -
S'S
tT ,'«3
ill■o ^V 2
iO.2^ U*'.d l
■3^ 1 ^ 0 .^Pi^
2'S 'a•O-flg-SftjOjtt,
S** g
^ P .S
p**2
6; 7 . 8 9 10 C 11 12 i s r
m .w 391.80 -153.61' 440.42 463.16 429.03 47g.01 454.6178.00 75.10 98.55 94.17 ,98.60 98.14 93.00
i96.27
*30.00 33.06 38.00 33.20 r20.29 '13.04. 24.00 20,7355,00 B7.28 64.C0 61.19 76 30 ..< 66.89 ,68.00 75.1136.00 13.91 34.00 14 93. 22,41. ,,,r20.96 19,00 17.2569.60 64.^0 69.40 69.79 66.40 62.90 ‘ 80.00 53.6990.00 01.39 91.00 91.03 104.50 164.50 118.00 116.80
:: , - - i * - - ' 0,01 -
4.00 3.81 3.81 4.66 4,60 4.00 S.64
isloo 15.50 26.67 26.10 21.66 20.13 20.00 19.80
8.8b 6.S8 9'.h 6.35 8.34 •7.93 8.00 7.78S0.70 30.70 34.85 34.85 ::.i 40.00 39.94^ 36.00- 43.54
66.50 63.57 130.08 151.^ 81,00 , 75.90^ 74.99 113,33•66.50 63.57 13a.0S 15t'20l o ,81.00 L.I 75.M '.74-99 113.33
135
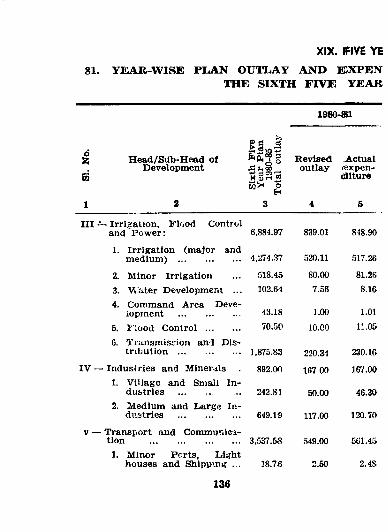
XIX. FIVE YE
81. YEAR-WISE PLAN OUTLAY AND EIXPEN THE SIXTH FIVE YEAK
1980-81
1
E5H ead/Stlb-H ead o f
Developm entt ' p ' s
R evisedoutlay
.Actualexpen-ia itu re
1 2 3 4 5
i i i ^ - Irrigration, F lood Control and P ow er: 6,884.97 839.01 848.90
1. Irrigation (m ajor and m edium ) .......................... 4,274.37 520.11 517.26
2. M inor Irrigation 518.45 80.00 81.263. V /ater Development ... 102.64 7.56 8.164. Command Area Deve
lopment ......................... 43.18 1.00 1.015. F lood Control .............. 70.50 10.00 11.066. Transm ission and Dis
tribution .......................... 1,875.83 220.34 230.16I V - • Industries and Miner ils 892.00 167 00 167.00
1. V illage and Small Industries .......................... 242.81 50.00 46.30
2. Medium and Largt? Industries .......................... 649.19 117.00 120.70
V — Transport and Comm unici- tion ..................................... 3,537.58 549.00 561.45
1. M inor Ports, Liijht houses and Shippxm? ... 18.76 2.60 2.48
136
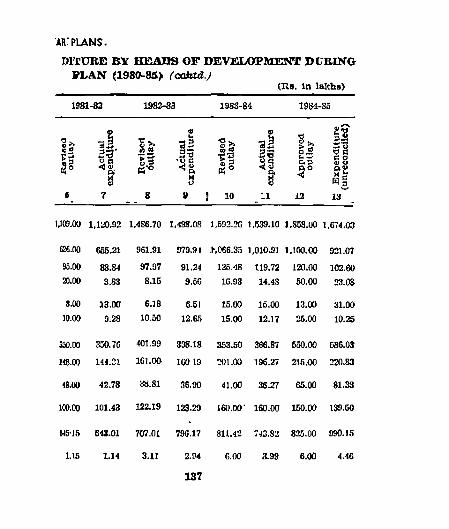
DrrURE BY HEADS OF DEVKIXXPMENT DURING V IA N (1980-85> (cabtd.J
AR: PLANS.
(Rb. in lakhs)1981-82 1982-83 1983-84 1984-85
2 ®
-SIf'1 '
It«h
<K•ca
| i■ 2g
SSh WC.S&0
i f5 Sc o o w
l |6 7 8 9 ! 10 11 12 13
1,109.00 1.11J0.92 1,486.70 1,498.08 1,593.26 1,539.10 1,858.00 1,674.03
626.00 655.21 961.31 979.91 >,066.35 1,010.91 1,100.00 921.0795.00 88.84 97.97 91.24 125.48 119.72 120.00 102.60».oo 3.83 8,15 9.56 1G.93 14.43 60.00 23.08
8.00 13,00 6.18 6.51 IS.OO 15.00 13.00 31.0010.00 9.28 10.50 12.6,'i 15.00 12.17 26.00 10.25
350.00 350.7G 401.99 33S.18 353.50 366.87 650.00 586.03
lffi.00 141.21 1C 1.00 leo 19 201.00 196.27 216.00 220.83
48.00 42.78 »i.81 3B.90 41.00 36.27 65.00 81.33
100.00 101.43 122.19 123.29 J 60.00' 160.00 150.00 139.50
H5-15 643.01 707.01 796.17 811.42 743.82 825.00 990.15
1.15 U 4 3.11 2.94
137
6.00 3.99 6.00 4.46
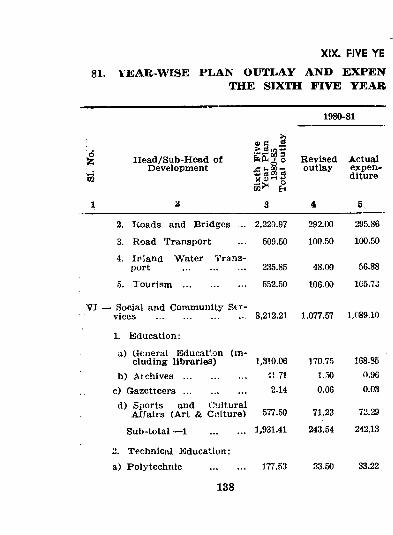
XIX. FIVE YE
81. VEAK-WISE PLAN OUTLAY AND EXPENTHE SIXTH FIVE YEAR
1980-81
H ead/Sub-H ead o f Development
® 13 ^
Revisedoutlay
Actualexpenditure
3 4 5
2. Koads and Bridges ... 2,220.97 292.00 295.86
3. R oad Transport 509.50 100.50 100.50
4. Irland W ater Transport .......................... 235.85 48.00 56.88
5. Tourism .......................... 552.50 106.00 105.73
• Social and Community Services ..................................... 8,212.21 1,077.57 1,089.10
1. Education:
a) (ieneral Educatvan (including libraries) 1,310.06 170.75 168.85
b) Ai c h i v e s .......................... 4171 1.50 0.96c) G a z e tte e rs .......................... 2.14 0.06 0.03d) Sports and Cultural
A ffa irs (Art & Culture) 577.50 71.23 72.29
Sub-total —1 .............. 1,931.41 243.54 242.13
2. Technical Education:a) Polytechnic 177.53 . 3.50 33.22
138
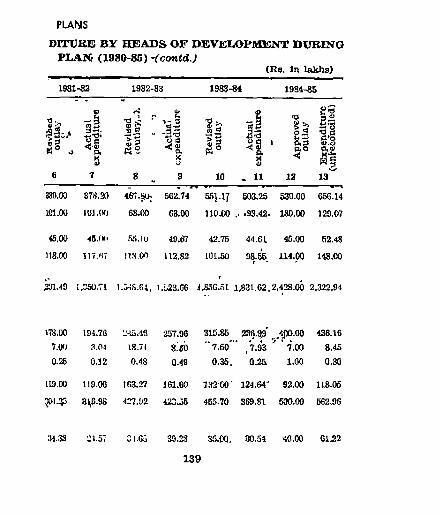
DITUBE B Y HEABS OF DEVEIX>PMENT DUBINO PLAN (1980-86) - ( c o n t d j
PLANS
(Ra. In lakhs)1981-82 1982-83 1983-84 1984-85
| L .■5^
•4-ojOis
r i
H “
t^ -3
O 0
g
. 2 s « ^ i l
-<1
•tJS jS
1 ftSi l1:1
I I6 7 8 9 10 * 11 12 is'^
380.00 378.30 467.8W; 562.74 66;.X7 503.25 530.00 656.14
101.00 lOi.OO 68.00 63.00 110.00 .93.42. 130.00 129.07
<6.00 45,(M. 55. lU 49.IJ7 42.75 44.61 46.00 52.48H8.00 117.f)T its.co 112.S2 iOL.50 98.K 114.00 148.00
.OT.49 i.aao.Ti 1.34S.G1, 1.023.C6 1,S5C.51 1,831.62.2,428.00 2.322.94
178.00 191.76 257.96 315.85 236.119' 436.161.01) ?.04 18.71 3.'^ "7.50 ,7.93 ' ‘ 7*.00 8.450.25 0.32 0.48 0.49 0.35. 0.2& 1.00 0.30
119.00 110.06 1G3.27 161.60 132 00 ’ 124.64" 92.00 118.05
3^6.9S 427.92 420.35 455.70 369.81 500.00 5G2.96
34.3S U 1,57 C1.6G 30.2S 35.00. 30.54 40.00 Gi.22
139
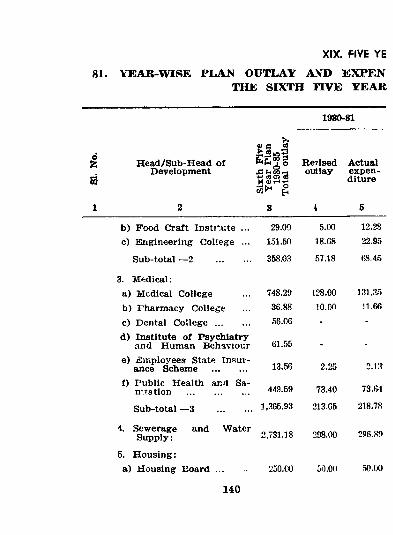
1980-81
xrx. FIVE YE
81. YEAR-WISE PLAN OUTLAY AXD EXPENTHE SIXTH nVE YEAll
1
o3
H ead/Sub-H ead o f Development
£ 6 5
X <UrH-MS t" g
Rerisedoutlay
Actualexpenditure
1 2 3 I 6
b ) Food Craft Insti*.ute ... 29.09 5.00 12.28c) EJngineering College ... 151.50 18.68 22.95
Sub-total —2 .............. 3.58.03 57.18 68,45
3. M edical:a) Medical College 748.29 128.00 131,35
b) Pharm acy College 36.88 10.00 11.^
c) Dental C o l l e g e .............. 56.06 - -d ) Institute o f Psychiatry
and Human Behaviour 61.55 - -e) Em ployees State Tn.sur-
ance Scheme .............. 13.56 2.25 2.13
f) P ublic Health ar.rl Sanitation .......................... 449.59 73.40 73.64
Sub-total —3 .............. 1,365.93 213.65 218.78
4. Sewerage and Water Supply : 2,731.18 298.00 296.89
5. H ou sing :a) M ousing B o a r d .............. 250.00 50.00 50.00
140
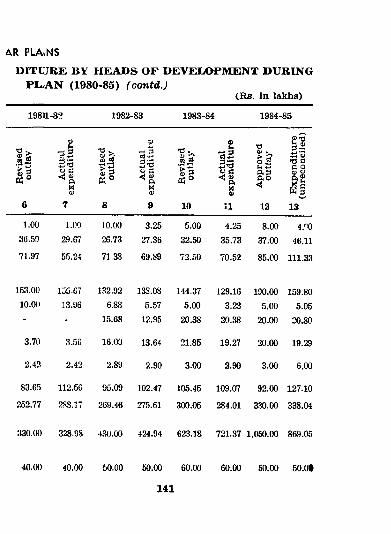
DITUKE BY HEADS OF DEVELOPMENT DURING PL.AN (1980-85) (contd.)
(Rs. in lakhs)
AR PLA.NS
198H-8:’ 1982--83 1983-84 1984-85
■o ^<s> £.“ 5 s s'S ■35
£•52 § 5(h .<-> c 0
® 5 q S <! a> ^ a «0)
“ n 0 c ^ <0 ^ p.0-'
« 3 0 fl
g
P.3p,oV 0
6 7 8 9 10 u 12 13
1.00 1.00 10.00 3.25 5.00 4.25 8.00 4. 1036.50 29.67 26.73 27.36 32.50 35.73 37.00 46.1171.97 5.'5.24 71.38 69.89 72.50 70.52 85.00 111.33
153.00 1 35.67 132.92 138.08 144.37 129.16 190.00 159.8010.00 13.96 6.88 5.57 5.00 3.23 5.00 5.05- - 15.68 12.95 20.38 20.38 20.00 20.80
3.70 3.56 16.00 13.64 21.85 19.27 20.00 19.29
2.42 2.42 2.89 2.90 3.00 2.90 3.00 6.00
83.6. ) 112.56 95.09 102.47 105.45 109.07 92.00 127.10252.77 288.17 269.46 275.61 300.05 284.01 3.30.00 338.04
330.00 328.98 4.%.0() 424.94 623.18 721.37 1,050.00 869.05
40.00 40.00 50.00 50.00 60.00 60.00 50.00 so.ot
141
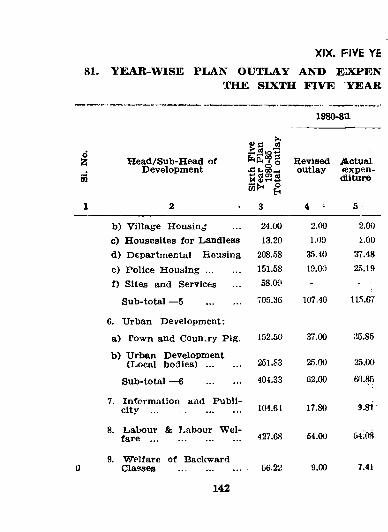
XIX. FIVE YE
OUTLAY AND EJXPEN81. YEAR-WISE PLANTHE SIXTH FIVE YEAB
1980-81
1
n
H ead/Sub-H ead o f Development
>>
51- g
Revisedoutlay
A ctu a l♦expen-(fliturei
1 2 3 4 • 5
b ) V illage HousintJ 24.00 2.00 2.00c) H ousesites for Landless 13.20 1.00 1.00d ) Departm ental Housing 208.58 35.40 37.48e) P olice H o u s in g .............. 151.58 19.00 2.'i.l9f) Sites and Services 58.0C' - - ■
Sub-total —5 .............. 705.36 107.40 115.67
6. Urban Development:
a) Town and Country Pig. J 52.50 37.00 ;55.85
b ) Urban Development (L ocal b o d i e s ) .............. 251.83 25.00 25.00
Sub-total — 6 .............. 404.33 62.00 60.^
7. Inform ation and Publicity ..................................... 104.64 17.80 9.81
8. Labour & Labour "Welfare ...................................... 427.68 54.00 r>4.08
09. W elfare o f Backward
Classes 66.22 9.00 7.41
142
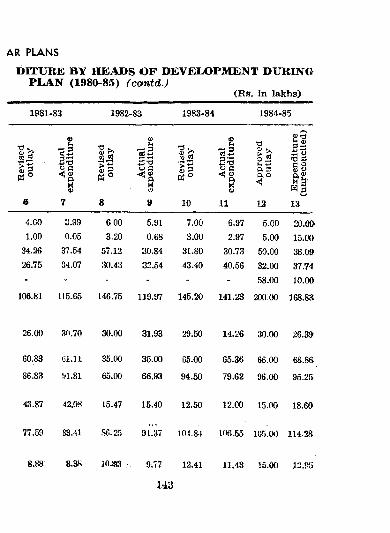
DITURE BY HEADS OF DEVELOPMENT DURING PLAN (1980-85) (contd.)
(Rs. in lakhs)
AR PLANS
1981--82 1982-■83; 1983-84 1984-85
VI 03 1 g
£■35o a
& «
•C05
^ 3S t!5 ’o
o
<u
■ 1
£•3S
•d
Ih ■!->a 3 a o C
s ain U*0 ca o
6 7 8 V 10 n 12 13
4.00 3.39 6 00 5.91 7.00 6.97 5.00 20.001.00 0.05 3.20 0.68 3.00 2.97 5.00 15.00
34.26 37.54 57.12 30.84 31.80 30.73 50.00 36.0926.75 34.07 30.43 32.54 43.40 40.56 32.00 37.74- - - - - - 58.00 10.00
106.81 115.65 146.75 119.97 145.20 141.23 200.00 168.8S
26.00 3f).70 30.00 31.93 29.50 14.26 30.00 26.39
60.83 Gl.n 35.00 35.00 65.00 65.36 66.00 68.86
86.83 91.81 65.00 66.93 94.50 79.62 96.00 95.25
43.87 42.08 15.47 15.40 12.50 12.00 15.00 18.60
77.59 83.41 S6.25 91.37 101.84 106.55 la^.oo 114,28
8.88 8.3K 10.!83 , 9.77 12.41 11,43 15.00 . 12.95
143
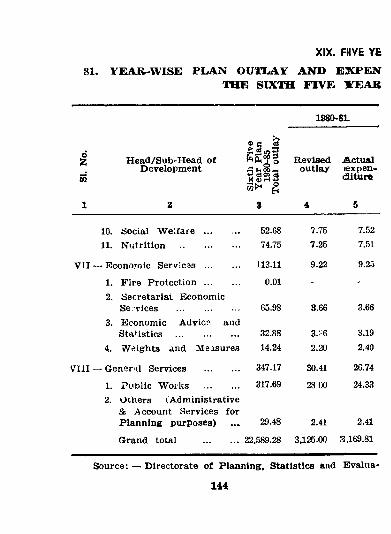
XIX. FlIVE Y£
81. YEAB-WISE PLAN OUl!LAY AND EXPENTHE SlXra FIVE YEAR
1
1
H ead/Sub-H ead o f Developm ent
h E f g
sSs|wH O
8
1980-811
Revised A ctu al outlay ex p en -
<aiture
4 5
10. Social W e l f a r e ............... 52.68 7.75 7.5211. N utrition ......................... 74.75 7.25 7.51
V II-— Econom ic Servicas .............. 113.11 9.22 9.25
1. F ire P r o t e c t io n ..............2. Secretarial Econom ic
0.01 - -
Se -vices ..........................3. Econom ic Advic? and
65.98 3.66 3.66
StaUstics .......................... 32.88 3.:-6 3.194. W eights and Measure.g 14.24 2.20 2.40
VIII-- Genernl Services .............. 347.17 30.41 26.74
1. Public W orks ..............2. Others ^Administrative
& Account Services for
317.69 28 00 24.33
Planning purposes) 29.48 2.41 2.41
Grand total .............. 22,589.28 3,125.00 3,169.81
Source: — Directorate o f Planning, Statistics and Bvaliia-
144
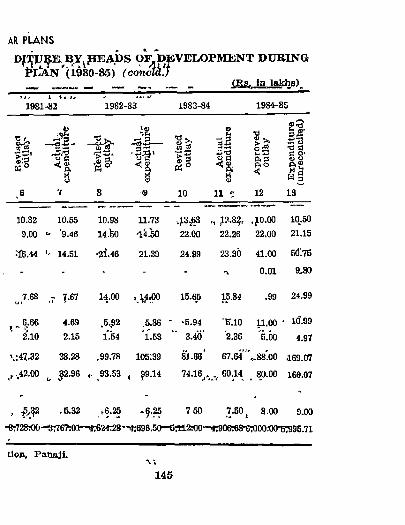
AR PLANS
BY^HEABS O^DEVELOPJVIENT DURING V l i m '(1980-85) (concld!f _ ________ ___________ ^
i 9 11981-83 1982-83 1983-84 1984-85
i f | l
d
1?;'rt®
I®
aV
Of ^
l | Pi °
ouis2
1XJ>>■
•*->A 3p«o<!
If-o a a 0 ‘ o u D.’U M S
6 1 8 10 11 c 12 13
10.32 10.55 10.98 11.73 43.,^ , ;?.8?r .JO.OO 10.509.00 '9.46 14.fe0 '14.50 22.00 22.26 22.00 21.15
116.44 14.51 -2f.46 21.39 24.99 23.30 41.00 G()‘.75
- - - - - “I. 0.01 9.80
^7.68 .7 7-67 14.00 ,1 4 ^ 15.® 15.84 .99 24.99
2J04.69 .5^92 .5.86 ' ‘ B.94 'B'.IO 11.00 - 10".992.15 1.54 'l.53 3.40’ 2.36 ^6.00 4.97
\J47.32 38.28 .99.78 105:39 s i .gg' 67.64“ ' cSs'.OO 169.07•.42-00 . ^2.96 93.53 , ?9.14 74.16j,^.V . SO-00 160.07
.5.32 r6.25 -.§.25 750 7.50_ 8.00 9.00-9;^2&fl0--3r?G7:01~*624:28-^':696.50-*“&:M,2;00'^90e:68^'S300.WB::995.71
tlon, P an a jt ^
145
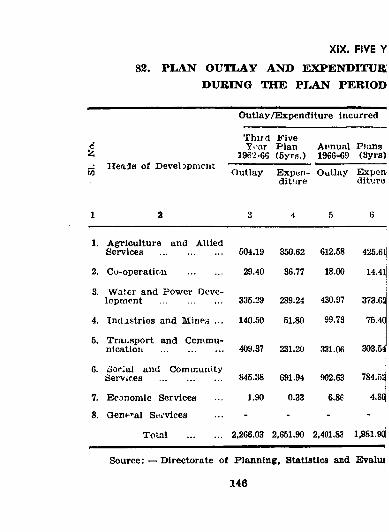
82. PLAN OUTLAY ANB EXPENBITUR DURING THE PLAN PERIOD
XIX. FIVE Y
Outlay/Expenditure incurred
c%
H ea is o f Develjpm ciit
ThirdY-.-ar
196.2-66
FivePlan(5yr.^.)
Annual1966-69
Plans(3yrs)
m Outlay Expenditure
Outlay Expcnditvre
1 2 g 4 5 6
1. A griculture and Allied Services .......................... 504.19 350.62 612.58 425.6lj
2. Co-operation .............. 29.40 36.77 18.00 14.4lj
3. Water and Pow er Development .......................... 335.29 289.24 430.97 373.6S
4. In d jstries and Mines ... 140.50 51.80 99.73 75.40
5. Trai..sport and Ccmmu- nicatioii .......................... 409.37 231.20 331.06 303.54
6. iioolal and Community Services .......................... 845.38 691.94 902.63 784.52
7. Econom ic Services 1.90 0.33 6.86 4.80
8. Gent-’-al S«i vices - - - -
Total .............. 2,266.03 2,651.90 2,401.83 l,981.90j
Source: — Directorate o f P lanning, Statistics and Bvalu]
146
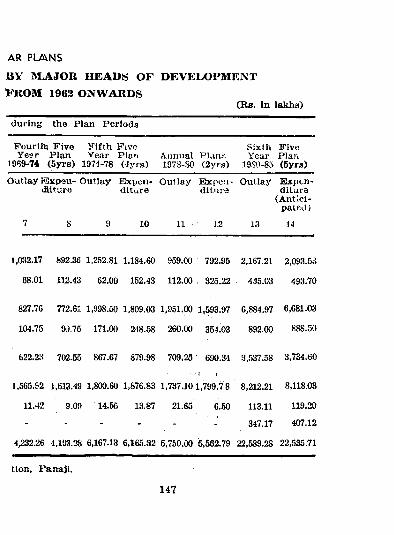
BY MAJOR HEADS OF DEVELOPMENT ^ROM 1963 ONWARDS
AR PLANS
(Hs. In lakhs)
during the Plan Periods
Fourthi F ive F ifth Five Yei?r Plan Year Pto’ i
1969-74 (5yrs) 1971-78 (4yrs)Annual197S-S0
Plans(2yr3)
SixthYear
1980-85
FivePlan(5yrs)
Outlay E xpeu - Outlay Bxpen- iSifuro diture
Outlay E xpenditure
Outlay E xpenditure
(Antlcl- paieil)
7 S 9 10 11 12 13 14
1,032.17 892.36 1,252.81 1,184.60 959.00 792.95 2,167.21 2,093.53
68.01 112.43 62.00 152.43 112.00 . 325.22 435.03 493.70
827.76 772.61 1,998.50 1,809.03 1,951.00 1,593.97 6,884.97 6,681.03
104.75 90.75 171.00 248.58 260.00 354.03 892.00 888.50
622.23 702.55 867.67 879.98 709.28 690.34 3,537.58 3,734.60
1,565.92 1,613.49 1,800.60 1,876.83 1,737.101,799.7 8 8,212.21 8,118.03
11.42 9.09 14.55 13.87 21.65 6.50 113.11 119.20
- - - 347.17 407.12
4,232.‘26 4,193.28 6,167.13 6.165.32 5,750.00 5,562.79 22,589.28 22,535.71
lion, P&naji.
147
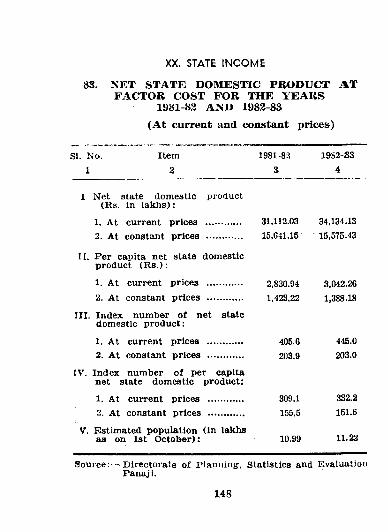
S3. NET STATE DOMESTIC PRODUCT AT FACTOR COST FOR THE YEARS
1981-83 AND 1982-83(At current and constant prices)
XX. STATE INCOME
SI. No. Item 1981-82 19S2-S31 2 3 4
I Net state dom estic product (Rs. in lakh s):
1. At current prices .............. 31.112.03 34,134.132. At constant prices .............. 15,641.15 15,575.43
II. P er capita net state domestic product (R s .) :
1. At current prices .............. 2,830.94 3,042.262. At constant prices .............. 1,423.22 1,388.18
III . Index num ber o f net state dom estic product:
1. At current prices .............. 405.6 445.02. A t constant prices .............. 203.9 203.0
IV. Index number o f per capita net state dom estic product:
1. At current prices ............... 309.1 332.22. At constant prices .............. 155.5 151.6
V. Estimated population (In lakhsas on 1st O ctob er): 10.99 11-22
Source:— Directorate o f planning. Statistics and EvaluationPanaji.
148
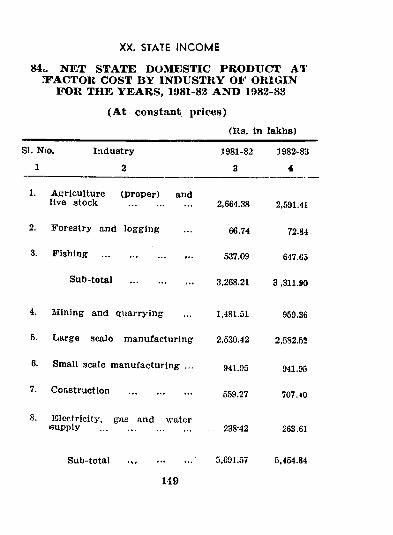
XX. STATE INCOM E
84.. NET STATE DOMESTIC PRODUCT A1 3FACTOR COST BY INDUSTRY OF ORIGIN
FOR THE YEARS, 1981-82 AND 1982-83
(At constant prices)(R s. in lakhB)
SI. N<o.
1Industry
2
1. A griculture (proper) and live stock ...............
2. Forestry and logg ing
3. F ishing ..........................
Sub-total ............
4. Mining and quarrying
5. Large scale m anufacturing
6. Small scale m anufacturing ...
7. Construction ............................
8. Electricity, gas and water supply ......................................
1981-82 1982-83
3 4
2,664.38 2,591.41
66.74 72.84
537.09 647.65
3,268.21 3,311.90
1,481.51
2,530.42
941.95
559.27
238-42
959.36
2,582.52
941.95
707.10
263.61
Sub-total 5.G91.57 5,454.84
149
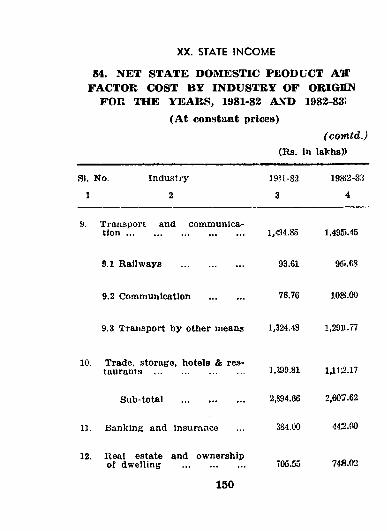
XX. STATE INCOME
84. NET STATE DOMESTIC PEODUCT AOT FACTOR COST BY INDUSTRY OF ORIGSN
FOR THE YEARS, 1981-82 AXD 1982-835 (At constant prices)
(c o m td .) (Rs. In lakhs))
SI. No. Industry
1 2
19U-82
3
398J2-8.'!
4
9. Transport and communication ................................................. 1,494.85 1,495.45
9.1 Railways .......................... 93.61 95i.68
9.2 Communication .............. 76.76 108.00
9.3 Transport by other means 1,324.48 1,291.77
10. Trade, storage, hotels & restaurants .....................................
Sub-total ..........................
13. Banking and insurance
12. Real estate and ownership o f dwelling ..........................
1,399.81 1,112.17
2,894.66 2,607.62
384.00
705.55
<142.00
748.02
150
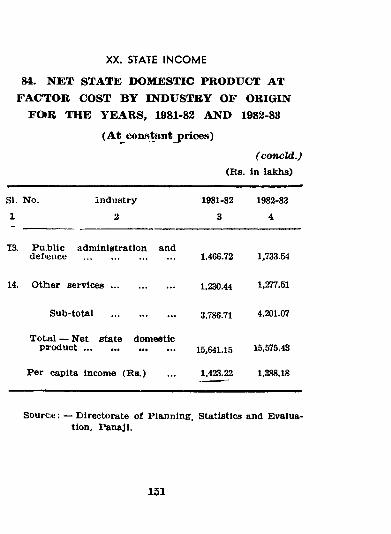
XX. STATE INCOME
84. NET STATE DOMESTIC PRODUCT ATf a c t :o r c o s t b y in d u s t r y o f o r ig in
F0»R THE YEARS, 1981-82 AND 1982-83
(At constant prices)
(con cld .J (R s. in laMis)
SI No. Industry 1981-82 1982-831 2 3 4
T3. P u b lic adm inistration and deftence ...................................... 1,466.72 1,733.54
14. O ther s e r v ic e s .......................... 1,230.44 l,2n.51
Sub-total ............. . 3,786.71 4,201.07
T ota l — Net state dom estic p r o d u c t ...................................... 15,641.15 15,575.43
Per capita income (R s.) 1,423.22 1,388.18
S ou rce : — Directorate o f Planning, Statistics and EJvalua- tion, Panaji.
151
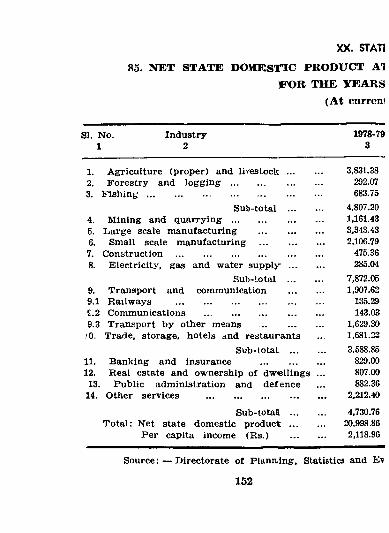
XX. STATI
85. NET STATE DOJkCESTIC PRODUCT A 1
FOR THE YEARS (At ciirreni
SI. No. Industry 1978-791 2 3
1. A griculture (proper) and lirestock ... 3,831.382. F orestry and l o g g i n g .......................... 292.073. F i s h i n g ......................... .................................... 683.75
Sub-total ... 4,807.204. M ining and q u a r r y in g .......................... 1,161.435. L arge scale m anufacturing ............... 3,343.436. Small scale m anufacturing ............... 2,106.797. Construction .................................................. 475.368. E lectricity, gas and water su pp ly ... 285.04
Sub-total ... 7,872.059. Transport and communication 1,907.629.1 Railw ays .................................................. 135.29£.2 Comm unications ...................................... 143.039.3 Transport by other means .............. 1,629.30)0. Trade, storage, hotels and restaurants 1,681.23
Sub-total ... 3,588.8511. Banking and insurance ............... 829.0012. Real estate and ownership o f dw ellings 807.0013. P ublic adm inistration and defence 882.36
14. Other services ...................................... 2,212.40
Sub-lotali ... 4,730.76T ota l: Net state dom estic product ... 20,998,86
P er capita incom e (R s.) 2,118.96
Source: — Directorate o f P lanalng, Statistics and Ev
152
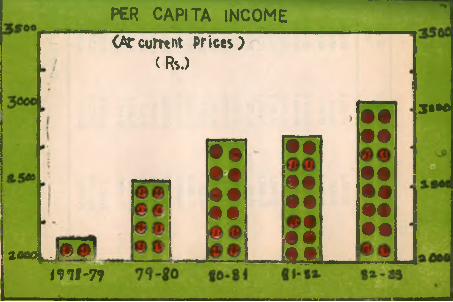
PER CAPITA INCOME(Arcurrtnt prices)
( R s . )
ma a s o ^
m i ‘ 7 9
• •
• •
• •• •
• •
» • • •
• Sf t j i
• •
• •
• •
• •
• •
• •
3t»«!
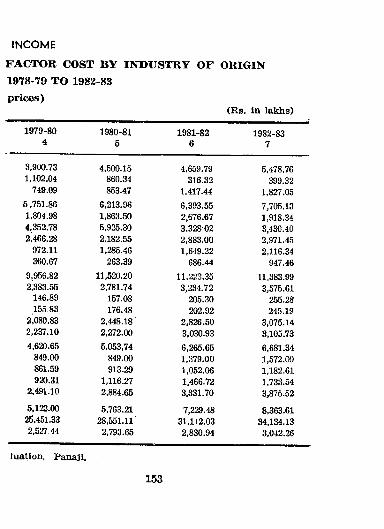
INCOME FACTOR COST BY INDUSTRY OF ORIGIN1978-79 TO 1982-83 p r ic e s )
(R s. in lakhs)
1979-80 1980-81 1981-82 1982-834 5 6 7
3.900.73 4,500.15 4,659.79 5,478.761,102.04 860.34 316.32 399.32
749.09 853.47 1,417.44 1.827.055.751.86 6,213.96 6,393.55 7,705.131,804.98 1,863.50 2,676.67 1,918.344,352.78 5,925.30 3,328 02 3,430.402;466.28 2,182.55 2,883.00 2,971.45
972.11 1,285.46 1,649.22 2,116.34360.67 263.39 686.44 947.46
9,956.82 11,5^.20 11,223.35 11,383.992.383.55 2,781.74 3,234.72 3,575.61
146.89 157.08 205.30 255.28155.83 176.48 202.92 245.19
2,080.83 2,448.18 2,826.50 3,075.142,237.10 2,272.00 3,030.93 3,105.734,620.65 5.053,74 6,265.65 6,681.34
849.00 849.00 1,379.00 1,572.00861.59 913.29 1,052.06 1,182.61920.31 1,116.27 1,466.72 1,733.54
2,491.10 2,884.65 3,331.70 3,875.525,122.00 5,763.21 7,229.48 8,363.61
26,451.33 28,551.11 31,112.03 34,134.132,527 44 2,793.65 2,830.94 3,042.26
luation, Panaji.
153
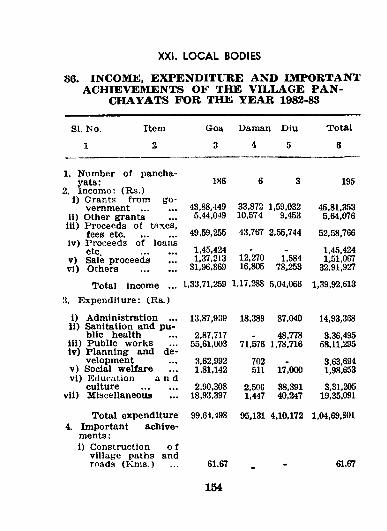
86. INCOME, EXPENDITURE AND IMPORTANl^' ACHIEVEMENTS OF THE VILLAGE PAN-
CHAYATS FOB THE YEAR 1982-83
XXI. LOCAL BODIES
SI. No.
1
Item
2
Goa
3
Daman Diu 4 5
T ota l
6
1. Number o f pancha- yats:
2. Incom e; (R s.)1) Grants from g o
vernment ...............ii) Other grantsiii) Proceeds o f taxes,
fees etc......................iv) Proceeds of loans
etc. ...............v) Sale proceedsV i ) Others ...............
Total incom e ...3. Expenditure: (R s.)
i) Administration ... li) Sanitation and pu
blic healthiii) Public worksiv) Planning and de
velopmentV) Social welfarevi) Education a n d
culture ...............vil) Miscellaneous
Total expenditure4. Important achive-
ments:i) Construction o f
village paths and road3 (K m s.)
186 6 3 195
43,88.4495,44,049
33,872 1,59,032 10,574 9,453
45,81,3535,64,076
49,59,255 43,767 2,55,744 52,58,766
1,45,4241,37,213
31,96,86912,27016,805
l',58478,253
1,45,4241,51,067
32,91,927
L,33,71,259 1,17,288 5.04,066 1,39,92,613
13,87,939 18,389 87,040 14,93,368
2,87,71755,61,003
48,778 71,576 1,78,716
3,36,49558,11,295
3,62,9921,81,142
702511 17,000
3.63,6941,98,653
2,90,30818,93,397
2,5061,447
38,39140,247
3,31,20519,35,091
99,64,498 95,131 4,10,172 1,04,69,801
61.67 61.67
154
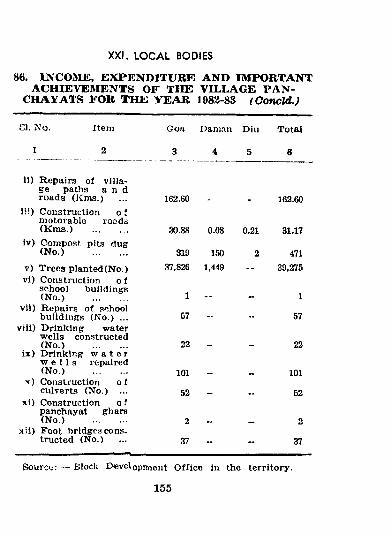
86. INCOJIE, EXPENDITURE AND IMPORTANT ACHIEVEMENTS OF THE VILLAGE PAN-
CHAYATS FOR THE YEAR 1983-83 (Concld.)
81. No. Item Goa Daman Diu Total
1 2 3 4 5 6
XX!. LOCAL BODIES
il) R epairs o f village paths a n d roads (Km s.) 162.60 162.60
iii) Construction o f m otorable rocds (K m s.) .............. 30.88 0.08 0.21 31.17
' Iv) Compost pits dug (N o.) .............. 319 150 2 471
V ) T rees planted (N o.) 37,826 1,449 — 39,275vi) Construction o f
school buildings (N o.) .............. 1 1
vli) Repairs o f school buildings (N o.) ... 67 — 57
viii) D rinking water wells constructed (N o.) .............. 22 22
ix ) D rinking w a t e r w e l l s repaired (N o.) .............. 101 101
x ) Construction o £ culverts (N o.) ... 52 52
xi) Construction o f panchayat ghars (N o.) .............. 2 2
x ii) Foot bridges constructed (No.) 37 „ _ 37
Sourcu: — Block Developm ent O ffice in the territory.
155
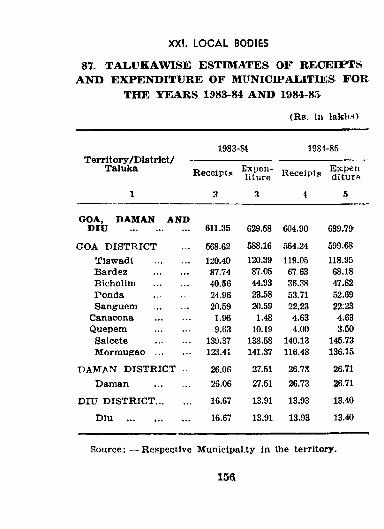
87. TA1.UKAWISE ESTIMATES OF RECEIPTS AND EXPENDITURE OF MUNICIPALITIES FOR
THE YEARS 1983-84 AND 1984-85
(R s. in laklis)
XXI. LOCAL BODIES
1983-8t 1984-85T e r r i t o r y /D i s t r i c t / ---------------------------- -------------------------------
Taluka Expeii- „ ■ . BjcpenReceipts Receipts,
1 3 3 4 5
GOA, DAMAN AND D IU ........................ 611.35 629.58 604.90 639.79
GOA D ISTRIC T 568.62 588.16 564.24 599.68T isw adl .............. 120.40 120.39 119.05 118.95Bardez .............. 87.74 87.05 67.63 68.18Bicholim .............. 40.56 44.93 36.38 47.62P onda .............. 24.96 23.58 53.71 52.69Sanguem .............. 20.59 20.59 22.23 22.23
Canacona .............. 1.96 1.48 4.63 4.63Quepem .............. 9.63 10.19 4.00 3.50
Salcete .............. 139.37 138.58 140.13 145.73M orm ugao .............. 123.41 141.37 116.48 136.15
DAM AN D IST R IC T ... 26.06 27.51 26.78 26.71Daman .............. 26.06 27.51 26.73 26.71
DIU D IS T R IC T .............. 16.67 13.91 13.93 13.40
D iu .......................... 16.67 13.91 13.93 13.40
Source: — Respective MunicipaLty in the territory.
15a
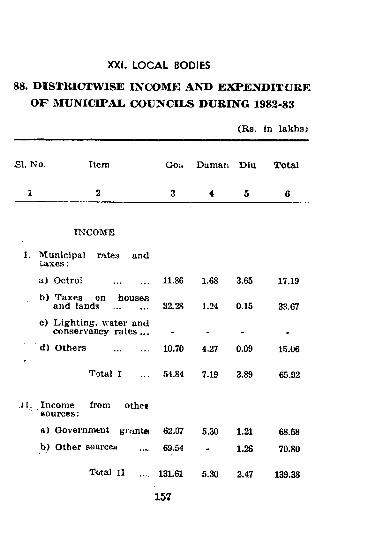
88. DISTRICTWISE INCOME AND EXPENDITURE OF MUNICIPAL COUNCILS DURING 1983-83
(R s. in lakhs;
SI. No Item Goa Daman Diu Total
1 2 3 4 5 6
INCOME
I. Municipal rates and taxes;
a) Octroi .............. 11.86 1.68 3.65 17.19
b ) Taxes on housesand lands .............. 32.28 1.24 0.15 33.67
c ) L ighting, water andconserv'ancy rates ... -
d) Others .............. 10.70 4.27 0.09 15.06
Total I ... 54.84 7.19 3.89 65.92
it I. Incom e from othersou rces:
a) Governmfcnt grant® 62.07 5.30 1.21 68.58
b) Other source^ .... 69.54 - 1.26 70.80
T<ital II 131.61 5.30 2.47 139.38
XXI. LOCAL BODIES
157
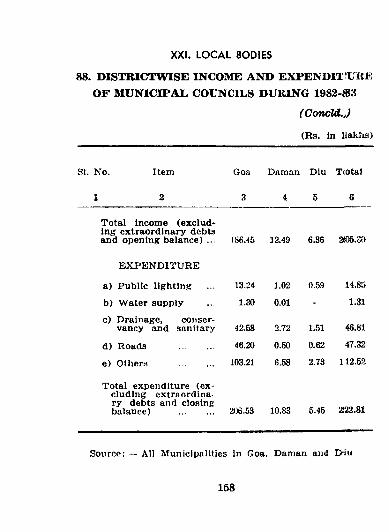
88. DISTBICTWISE INCOME AND EXPENDITX KK OF »IUNICIPAI. COUNCILS DURING 1982-J83
(Concld.J
(R3. In liaklia)
XXI. LOCAL BODIES
SI. No. Item Goa Daman Diu T ota l
1 2 3 4 5 6
Total incom e (exclud ing extraordinary debts and opening balance) ... 186.45 12.49 6.36 2#)5.S0
E X P E N D IT U R E
a) Public lighting 13.24 1.02 0.59 14.85
b ) W ater supply 1.30 0.01 - 1.31
c) Drainage, conservancy and sanitary 42.58 2.72 1.51 46.81
d) R oads .............. 46.20 0.50 0.62 47.32
e) Other-s .............. 103.21 6.58 2.73 112.52
Total expenditure (ex cluding extraordinary debts and closing balance) .............. 206.53 10.83 6.45 222.81
Source: — All M unicipalities in Goa, Daman and I>iu
158
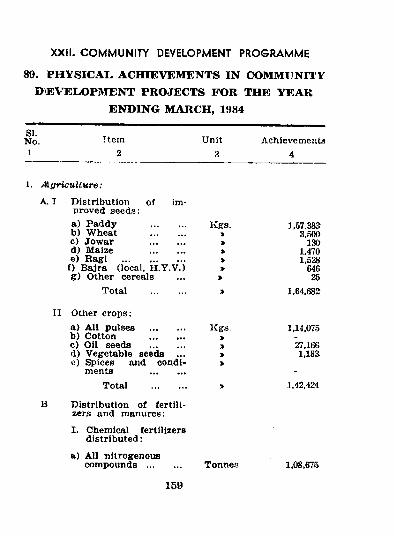
XXII. COMMUNITY DEVELOPMENT PROGRAMME
89. PHYSICAL ACHIEVEMENTS IN COMMUNH’Y D)E\^LOPMENT PROJECTS FOR THE YEAR
ENDING MARCH, 1984
SI.No.1
Item2
Unit3
Achievements4
1. ALgricultvre:A. I D istribution of
proved seeds:im-
II
a) P addy ..............b ) W heat ...............c ) Jow ar ..............d) Maize ..............e) R agi ..........................
f) B ajra (local, H .Y .V .) g ) Other cereals
Kgs.»>>»»
»
J,57.38a 3,500
130 1,470 1,528
646 25
Total .............. > 1,64,682
Other crops:a ) A ll pulses ...............b ) Cotton ..............c ) Oil seeds ..............d) Vegetable seeds ... c) Spices and condi
m ents ..............
Kgs,»>»»
1,14,075
27,1661,18S
Total .............. > 1,42,424
D istribution o f fertilizers and manures:
I. Chemical fertilizers d istribu ted :
a) A ll nitrogenous com pounds .............. Tonnes 1,08,675
159
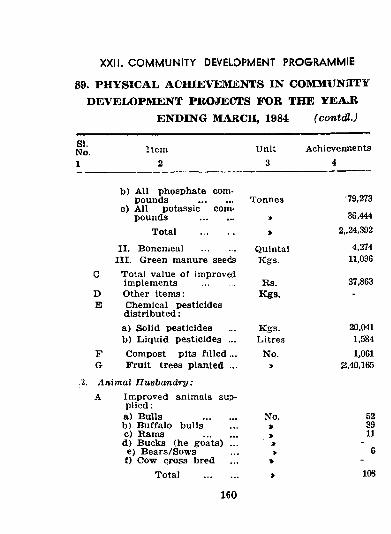
89. PHYSICAL ACHIEVEMENTS IN COMMUNIITY DEVELOPMENT PROJECTS FOR THE YEAJl
ENDING MARCH, 1984 (contdl.J
XXII. COM MUNITY DEVELOPMENT PROGRAMMIE
SI.No.1
Item2
Unit3
Achicvennenta4
DE
b) All phosphate com pounds ..............
c) All potassic com pounds ..............
Total
II. Bonemeal ..............III . Green manure see(Js
Total value o f improvedimplements .............Other item s:Chemical pesticides d istribu ted :a) Solid pesticidesb ) L iquid pesticides ... Compost pits f i l le d ... Fruit trees planted ...
Animal H usbandry:A Im proved animals sup
plied ;a) Bulls ..............b ) B uffalo bullsc) Ram s ..............d) Bucks (he goats) ...e) Bears/Sow sf) Cow cross bred
Total ..............
Tonnes
QuintalKgs.
Rs.Kga.
Kgs.Litres
No.
No.
•79,273
36,4442„24,392
4,27411,096
37,863
20,0411,5841,061
2,40,165
523911
6
108
160
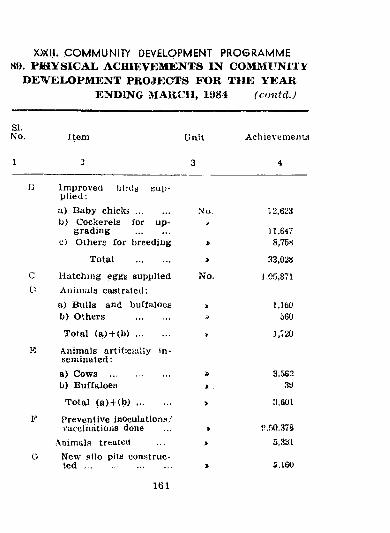
X)XI:I, COMMUNITY DEVELOPMENT PROGRAMME «9. P H Y S I C A L ACHIEVEMENTS IN COMMItNITY
DETVELOPMENT PROJECTS FOR TH E Y E A R ENDING MAItCH, 1984 (contd.)
SI.No. Item
a) Cows .........................b) Buffaloes
Total ( a ) + ( b ) ...............
Preventive inoculations/ vaccinations done
Animals treatedNew pilo pits conntruc- t e d .......................................
UnU
B Im proved bird^ supplied;a) Baby c h i c l c ..............b) Cockerels for up
grading ..............c) Others for breeding
Total ..............C Hatching eggs suppliedI- Animals castrated;
a) Bulls and buffaloes b> Others ..............
Total (a ) - t - (b ) ..............
K Animals artificially inseminated ;
No,
No.
Achievementa
4
12,623
11,6478,758
33,028
1.05,871
1,160560
1,720
3,56239
3,601
?,r)0,3785,331
S. 160
IB l
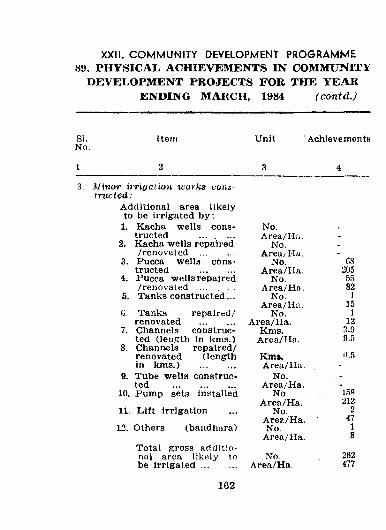
XXII. COMMUNITY DEVELOPMENT PROGRAMME 89. PHYSICAL ACHIEVEMENTS IN COMMUNITY
DEVEI.OPMENT PROJECTS FOR THE YE.AK ENDING MARCH, 1984 (contil.)
SI.No.
lleni Unit A.chlevement8
3 4
3. Minor i T r i y a t i o n w orks constru cted :
Additional area likelyto be irrigated b y :
1. Kacha wells cons No, .tructed Area/H;v .
2. Kacha wells repaired No. -/renovated .............. Area/Ha. -
3. Pucca w ells cons No. G8tructed .............. Area/IIa. 205
4. Pucca wells repaired No. 55/renovated Area/Ha. 82
5. Tanks constructed ... No. 1Area/Ha. 15
6. Tanks repaired/ No. 1renovated .............. Area/H a. 12
7. Channels construc Kms. 3.9ted (length In km s.) A rea/IIa. 9.5
8. Channels repaired/renovated (length Kms. 11.5in km s.) .............. Area/Hu. -
9. Tube wells construc No. -ted .......................... Area/Ha. -
10. Pum p sets installed No. 159Area/Ha. 212
H. L ift irrigation No. 2Arest/Ha. 41
12. Others (bandhara) No. 1A rea/IIa. 8
Total gross ariditio-aal area likely to No 262be ir r ig a t e d .............. Area/Ha. 477
162
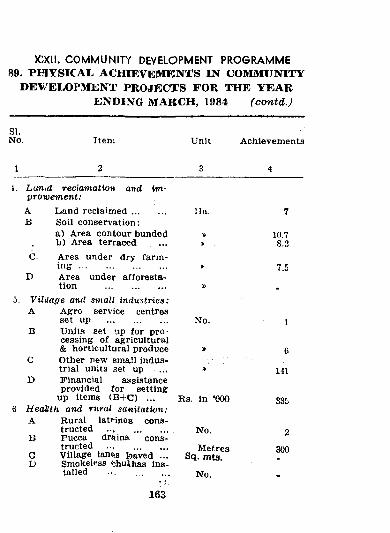
XJXII. COMMUNITY DEVELOPMENT PROGRAMME89. PHYSICAL ACHIEVEMENTS IN COMMUNITY
DEVELOPMENT PROJECTS FOR THE YEAR ENDING MARCH, 1984 (contd.)
SI.No. Item Unit Achievements
Lun<.d reclamation and im- profuement:
A Land recla im ed ...................B Soil conservation:
a) Area contour bundedb) Area terraced
C. Area..under dry farming
D Area.... under afforestation .................... ..
VUllage and small industries: A Agro service centres
set up .........................B Units set up for p ro
cessing of agricultural& horticultural produce
C Other new small industrial units set up ...
D Financial assistanceprovided tor setting:
up items (B +C ) ... HeaMth and rural sanitation: A Rural lati-ines cons
tructed .., ..............B Pucca drains cons
tructed ..I ..............G Village lane,s Ibaved ...D Smokeless fchulihas ins
talled .......................
Ha.
No.
Rs. in ‘000
No.
Metres Sq. mts.
No.
10.78.2
7.5
1
6
141
335
2
300
163
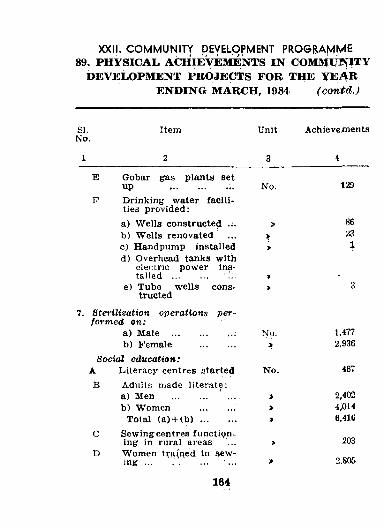
XXII. COMMUNITY DEyELOPMENT PROGBAMIylE89. PHYSICAL ACHIEVEBfENTS IN COMMlTIfIT¥
DEVELOPMENT PROJECTS FOB THE YEAR ENDING MARCH, 1984 (contd.)
SI. Item Unit AchieveinentsNo.
E Gobar gas plants setup ......................... No. 129
F Drinking w ater facilities provided:a) W ells constructed ... » 86b) W ells renovated ... > ^c) Handpump installed > 1d) Overhead tanks with
elecLric pow er installed ............... »
e) Tube w ells cons- » 3tructed
Stet'ilization operations p erform ed on :
a) Male ......................... ; No. 1,477b) Female .............. > 2,936
Social education:A Literacy centres started No. 467B Adults made literate;
a) Men ............................ > 2,402b) W omen ............. . > 4,014
Total (a) + ( b ) ............... » 6,416
C Sewing centres functioning in rural areas ... > 203
D W omen traiined in sewing ..........................
164
» 2.805
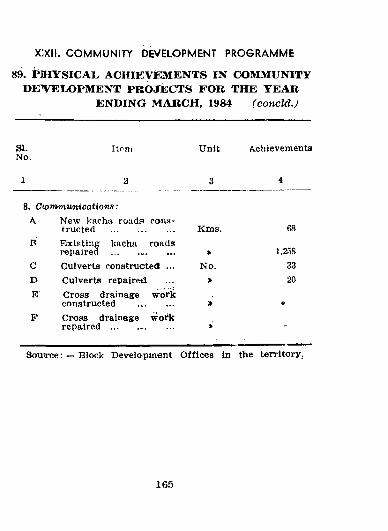
89. i*IHYSICAL ACHIEVEMENTS IN COMMUNITY DE^^ELOPMENT PKOefECTS FOR THE YEAR
ENDING MARCH, 1984 (concld.)
X:XI1. COMMUNITY DEVELOPMENT PROGRAMME
SI.No.
Item Unit A.chievementa
1 2 3 4
8. Ciommiunications:K New kacha roads cons
tructed Knis. 68rt E xisting kacha roads
repaired .......................... > 1.258c Culverts constructed ... No. 3.3D Culverts repaired » 20E Cross drainage w"ork
constructed ............... •F Cross drainage w ork
repaired .......................... » -
Souirce: — Block Development O ffices in the territory.
165
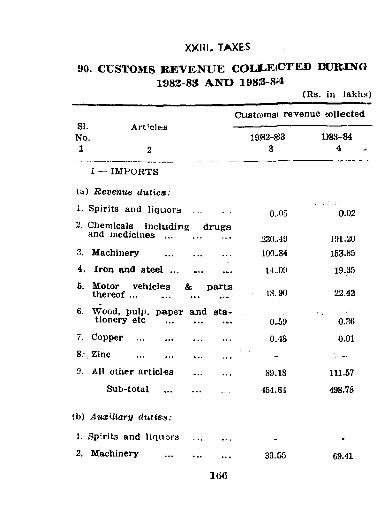
XXIII. TAXES
90. CUSTOMS REVENUE COLJJEiCTED DURING 1982-83 AND 198S-»4
(Rs. in lakhs)
Custom si re-^enue {ollectedSI.No.1
Art’clea
2
1 — IMPORTS
(a) Revenue d u ties:
1. Spirits and liquors
"2. Chemicals including and medicines ...
3. Machinery
4, Iron and steel ...
6. Motor vehicles i thereof .................
6. W ood, pulp, paper and sta tionery etc
7. Copper ...............
8. Zinc
9. All otiier articles
Sub-total
drugs
parts
19S2-S33
0..05
:230..49100,84
14..09
18.90
0.59
0.48
89.1S
•154.61
1)83-844
0.02
J91.20153.85
19,35
22.42
0.36
0.01
111.57
498.78
(b) AuxiUary clutie:s:
1. Spirits and liqmor»
2. Machinery 33.55 69.41
166
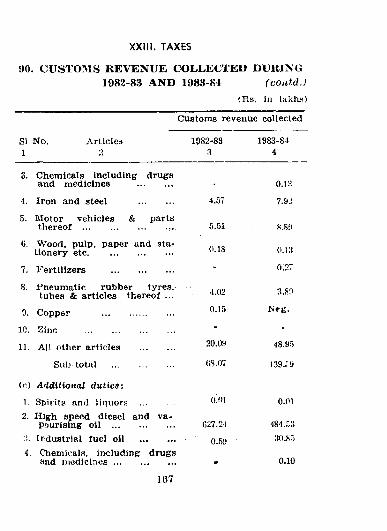
XXlll. TAXES
90. CUSTOMS REVENUE COL-LECTED DURING 1982-83 AND 1983-84: (coatd.)
(R s. in lakh.s)
SI No. 1
Customs revenue collected
Articles 1982-833
1983-844
Chemicals including drugs and medicines ..............
Iron and steel
M otor vehicles thereof ...............
& parts
W ood, pulp, paper and stationery etc....................................
G.
7. Fertilizers
Pneumatic rubber tyres, tubes & articles thereof ...
0. Copper
10. 2inc ..............
11. All other articles
Sub-total
(c) Additional duties:
1. Spirits and liquorsHigh speed diesel and va- Pourising oil ...Industrial fuel oilChemicals, including and medicines ...
drugs
167
4.C7
. r>.5i
0.18
4.02
0.15
20.01)
G8.07
o!oi
627.21
0.59
0.1 H
7.9J
8.80
0.13
0.27
3.89
iS>g.
48.95
139.:, 9
0.01
484.r>330.85
0.10
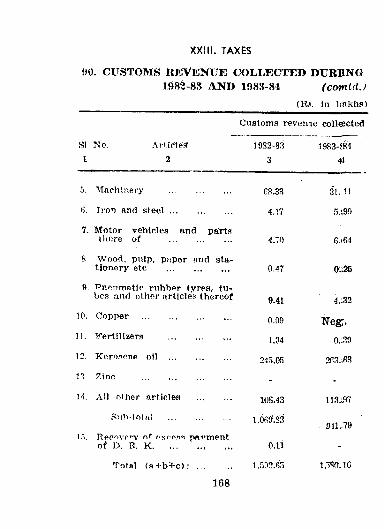
XXill. TAXES
!>0. CUSTOMS REVENUE COLI.ECTED DUBHNG 1982-8S AND 1983-84 (comtd.)
(Rs. in Ifakhs)
SI No. I
ArlJclepf2
Customs revenie collfficted
1983-J844t
5. Machinery ........................
(i. Iron and s t e e l ..........................
7. Motor vehicles and partsthere of ..........................
8 W ood. pnlp. paper nnd stationery etc ..........................
9. Pneumatic rnhber tyres, tubes and other nrticlea thereof
10. Copper .....................................
11. Fertilizers ..........................
12. Kerosene oil ..........................
n . 71m; .....................................
n . All other articles ..............
Siih-totnl ..........................
I."!. Recovery oT pnymentof D. B. K .................................
Total {a 4 -b ^ c): ...
PR.33
4.17
4.70
0.47
9.41
0.09
1.34
245.05
108.43
,069.S'3
O.li
,5r)2.(r.
31. 11
5.i9f)
G.ir>4
0.;25
4.;32
^Tegr.
o.;39
113.;97
911 ..79
i . m i c
168
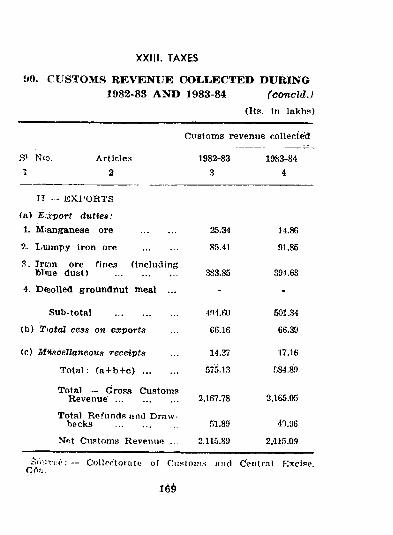
XXIil. TAXES
90. CUSTOMS REVENUE COLLECTED DURING 1982-83 AND 1983-84 (concld.)
(Rs. In lakhs)
Customs revenue collected
S' N(o. Articles 1982-83 1983-841 2 3 4
II - - L2XI‘ORTS(a) Eixport du ties:1. Mianganese ore .............. 25.34 14.8G2. Luimpy iron ore 8f).41 91.853. Iro n ore fines (including
bliue dust) .......................... 383.85 394.634. D eolled groundnut meal ... - -
Sub-total .......................... 501.34
(b ) Tiotal cess on exports 6G.16 66.39
(c) M'iscellaneous receipts 14.37 17.16
T ota l; ( a + b + c ) .............. 575.13 rj^.89
Total — Gro.ss Customs Revenue .......................... 2,167.78 2,165.05
Total Refunds nnd Drawbacks .......................... in.89 40.96
Net Customs Revenue ... 2,115.89 2yll5.09
; — Collectoratf of Ciistoin.s and Ceittrni Excise.
16^
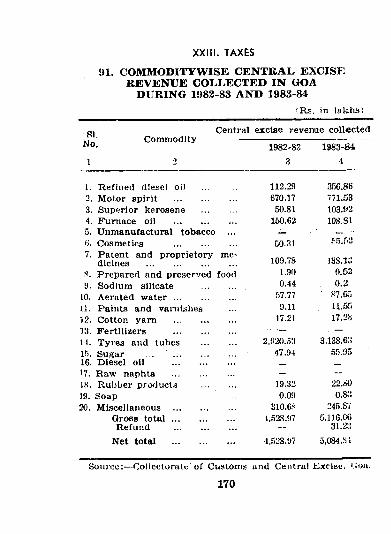
91. COMMODITYWISE CENTRAL EXCISE REVENUE COLLECTED IN GOA
DURING 1982-83 AND 1983-84
XXII!. TAXES
^Rs. in lakhs)
SI. Central excise revenue collectedCommodity ------------------------------------------
1982-83 1983-841 2 3 4
I. Refined diesel oi) .............. 112.29 356.862 M otor spirit .......................... 670.17 771.533. Superior kerosene .............. 50.81 103.924. Furnace oil .......................... 150.62 108.815. Unmanufactural tobacco ... —6. Cosmetics .......................... 50.317. Patent and proprietory me
dicines ..................................... 109.78 138.1;:Prepared and preserved food 1.90 0.52
9. Sodium silicate .............. 0.44 0.210. Aerated w a t e r .......................... 57.77 S7.6511. Paints and varnishe.s 9.11 11.5512. Cotton yam .......................... 17.21 17.2813. Fertilizers .......................... ■ — — ■14. T yres and lubes .............. 2.920..53 3,138.6:;15. Sugar ... .......................... 47.94 55.9516. Diesel oil .......................... _ _17. Raw naphta .......................... — —18. Rubber product.s .............. 19.32 22.6019. Soap 0.09 0.8.‘!20. Miscellaneous .......................... 310.6S 245.87
Gross t o t a l .......................... 4,528.97 5,116.06Refund .......................... — 31.2:3
Net total .......................... 4,528.97 5,0S4.Si
170
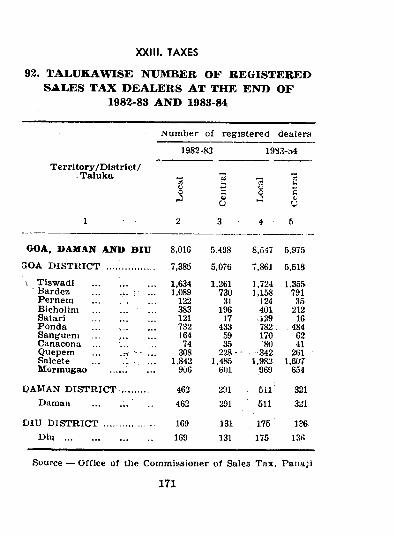
XXIII. TAXES
92. TALUKAWISE NUMBER OF REGISTEREO SALES TAX DEALERS AT THE END OF
1982-83 AND 1983-84
T erritory /D istr ict / . Taluka
1
IN umber of registered dealers
1982-83 198.1-;t4
g0
2
3O
3
03yo
,, 4 ...
”31-c4.V
5
OOA, DAMAN AND BIU 8.01G 5.498 8,547 5,975GOA D ISTR IC T ............. 7,385 5,076 7,861 5,518I Tiswadl 1,634 1,261 1,724 1,355
Bardez ... .w. ^ 1,089 730 1,158 791Pernem .............. 122 31 124 35Bicholim .............. 383 196 401 212Satari ... ... 121 17 329 16Ponda 732 433 782 . . 484Sangueni ... 164 59 170 62Canacona ... ............. 74 35 80 41Quepem ............. . 308 228 ' • 342 261Salcete ... , .. 1,842 1,485 1,982 1,607Mormugao 906 601 969 654
DAMAN DISTRIC T ............. 462 291 511' 321Daraau 462 291 511 321
DIU D ISTRICT ..................... 169 131 ,175 126D i u .................................... 169 131 175 13«
Source — Office o f the Commissioner of Sales Tax, Panajl
171
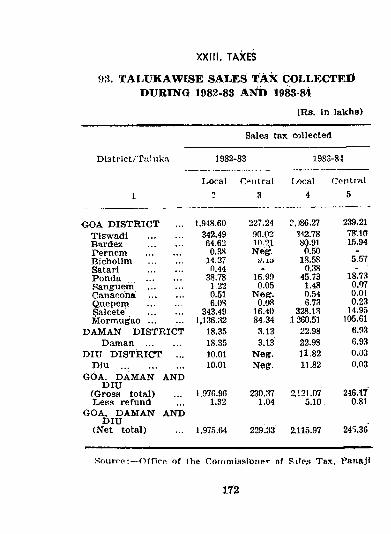
93. t A l u k a w is e s a l e s t A x coll,e c t e i* DURING 1982-83 AI»rt> 19^-84
XXIII. ta xes
(Rs. in lakhs)
Sales tax collected
Dl3trict/Tn1uka 1982-83 1983-84
I^ocal C c T i t r a l
1 ? 3 4 5
<JOA D ISTRIC T ... 1,948.60 227.24 2,)86.27 239.21Tiswadi .............. 342.49 90.02 H2.78 78.1CrBardez .............. 64.62 in .21 80.91 15.94Pernem .............. 0.38 Negr. 0.50 -Bicholim .............. 14.27 y.io 18.58 5.57Satarl .............. 0.44 - 0.38 -Ponda .............. 38.78 16.99 45.73 18.73Sanguem .............. 1.22 0.05 1.48 0.07Canacohai .............. 0.51 Neff. 0.54 0.01Quepem .............. 6.08 0.08 6.73 0.23$alcete .............. 343.49 16.40 328.13 14.95M o rm u g a o .............. 1,136.32 84.34 1260.51 105.61
DAMAN DISTRICT 18.35 3,13 22.98 6.93Daman .............. 18.35 3.13 22.98 6.93
DIU D ISTR ICT ... 10.01 Neg. 11.82 0.03Diu .......................... 10.01 Neg. 11.82 0.03
GOA. DAMAN ANDDIU
(Gross total) 1,976.98 230.37 2,121.07 246.17'Less refund 1.32 1.04 5.10 0.81
GOA. DAMAN ANDDIU ,
(Net total) 1,975.64 229.33 2.115.97 24').3S’
Sourre:--Offirn of the Coiiimiasiorier of Riles Tax. Panaji
172
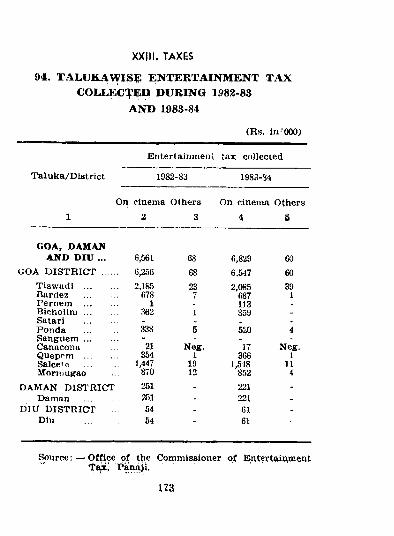
1)4. TALUKAWI^i: ENTERTAINMENT TAX COLLEC'^^ED d u r in g 1982-83
AND 1983-84
(Rs. in'000>
Entertainmenl tax collected
XXIII. TAXES
Taluka/D istrict 1982-83 1983-S4
On1
cinema Others 2 3
On cinema Others 4 5
GOA, DAMAJV AND DIU ... (!,56l 68 6,829 60
t;OA DISTR IC T 6 ^ 6 68 6.547 60Tiswadi .............. 2,18.5 23 2,085 39Bardez .............. 678 7 687 1Periiein ... 1 . 113B ich o lira .............. 362 1 359 _Satari - - -Ponda .............. 338 5 520 4Sanguem .............. - - - -Canacona 21 Neg. 17 Neg.Quep'^m ........ 364 1 366 1
........ 1,447 19 ],548 uMonnugao 870 12 852 4
DAMAN DISTRICT 251 - 221 -Daman .............. 2T)1 - 221 -
DIU D lS T R IC r 54 - 61 -Diu .............. 54 - 61 -
^ u r c e : — Office o f the Commissioner o f ©utertaiAment Panaji.
U3
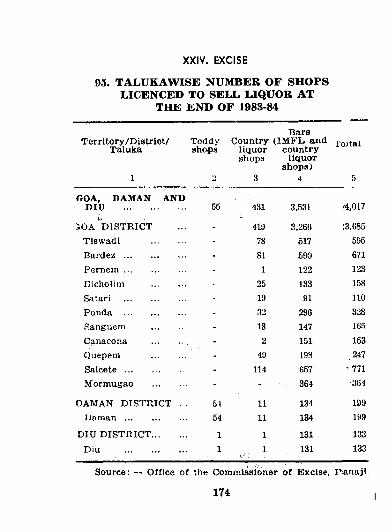
XXIV. EXCISE
95. TALUKAWISE NUMBER OF SHOPS LICENCED TO SELL LIQUOR AT
THE END OF 1988-84
T erritory /D istrict/ Taluka
Toddyshops
BarsCountry (IM F L and
liquor country shops liquoT
shops)
ro>tai
1 3 4 5
GOA, DAMAN AND DIU .......................... 55 431 3,531 4,017
Is>30A D ISTRICT - 419 3,260 :3,685
T is wadi .............. - 78 517 595Bardez .......................... - 81 590 671P e m e m ......................... - 1 122 123Bicholini .............. * 25 133 158Satari .......................... - 19 91 110Fonda ......................... - 32 296 328Sanguem .............. - 18 147 165Canacona .............. , - 2 151 153Quepem .............. - 49 193 247S a lc e t e .......................... - 114 657 ' 771Mormugao .............. - - 364 ■3G4
DAMAN DISTRICT . . 5» 11 134 199Daman .......................... 54 11 134 199
DIU D IST R IC T.............. 1 1 131 133Diu .......................... 1 1 131 133
S o u rce :— Office o f the Commissioner o f Excise. P anajl
174
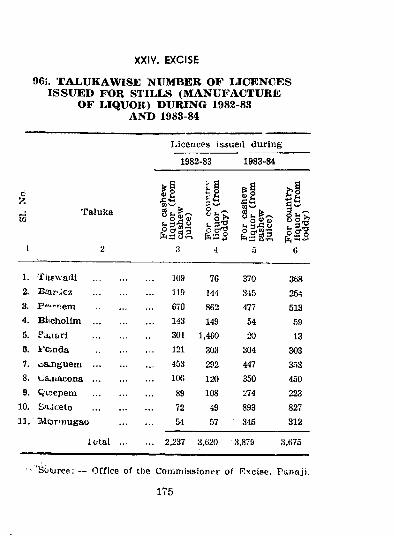
961. TALUKAWISE NUMBER OF LICENCES ISSUED FOR Sl'ILLS (MANUFACTURE
OF LIQUOR) DURING 1982-83 AND 1983-84
XXIV. EXCISE
Taluka
W cences issued during
1982-83 1983-84
U hIlia3
l lCQ W^ 2
4 5 6
1. Tiiew'adi ......... 109 76 370 3682. Btar-jez .............. 119 144 345 2543. P"*r*:em ......... 670 862 477 5134. Bltcholim .............. 143 149 54 595. Faitari ......... 301 1,460 20 136. P e n da ............. 121 303 304 3037. oa.nguem .............. 453 292 447 3538. ca.iiacona .............. 106 120 350 4509. <5u;epem .............. 89 108 274 223
10. Sa,i(.ete .............. 72 49 893 82711. iVlof’Tiugao 54 57 345 312
lota l ... ... 2,237 3,620 3,879 3,675
' 'Soiuree: — Office of the Commissioner of Excise, Pitnaji.
175
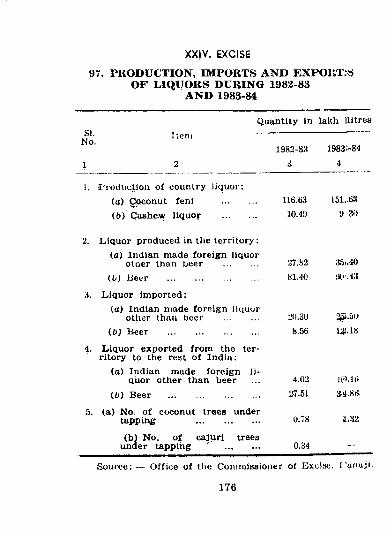
97. PRODUCTION, IMPORTS AND EXPOIlTr8 OF LIQUORS DURING 1982-83
AND 1983-84
Quantity in lakh llitreaSI. Item
No.1982-83 1983;-84
1 2 3 4
XXjV. EXCISE
1. Prociuciion o f country liquor;(o) gpconut feni .............. 116.63 151..63(6 ) Cashew liquor .............. 10.4‘J 9 30
2. L iquor produced in the territory ;(a) Indian made foreign liquor
other than beer ................ 27.82 35i.40(b) lieer ...................................... 81.40 !«.».4;i
a. L iquor im ported :(a) Indian made foreign liquor
other than beer ................ 2(J.30lb) Beer ...................................... 8.56 132.18
4. L iquor exported from the territory to the rest o f India;
(o ) Indian made foreign liquor other than beer ... 4.02 l0.lt;
(b) Beer ... ... ... ... 27.51 34.86
5. (a) No. o f coconut trees undertappiAg ... ... ... 0.78
(b ) No. o f cajuri treesunder tapping ............... 0.34 --
Source: — O ffice o f the Commissioner of lilxci.'se, I ’uruxjl.
176
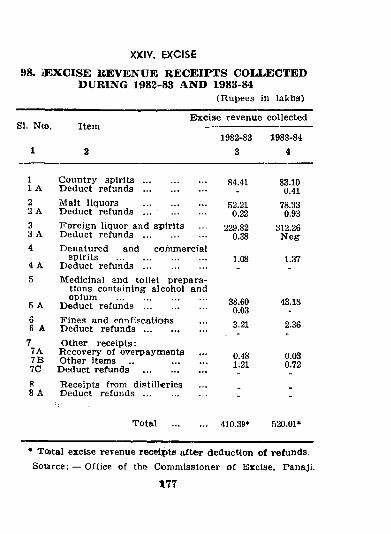
98. lEXCISE REVENUE RECEIPTS COLLECTED DURING 1982-88 AND 1983-84
(Rupees in lakhs)
XXIV. EXCISE
SI. Nco.E xcise revenue collected
1982-83 1983-841 2 3 4
11 A
Country s p i r i t s ..........................Deduct r e f u n d s ..........................
84.41 83.100.41
22 A
Malt liquors ... ..............Deduct refunds ... ..............
52.210.22
78.330.93
33 A
Foreign liquor and spirits Deduct r e f u n d s ..........................
229.820.38
312.26N eg
4
4 A
Denatured and comm ercialspirits .....................................
Deduct r e f u n d s ..........................1.08 1.37
5
5 A66 A
Medicinal and toilet preparations containing alcohol andopium .....................................
Deduct r e f u n d s ..........................Fines and confiscations Deduct r e fu n d s ..........................
38.600.033.21
43.18
2.36
77A7B7C
Other receipts:Recovery of overpaymentsOther items ... ..............
Deduct refunds ..........................0.481.21
0.030.72
88 A
Receipts from distilleries Deduct r e fu n d s ............. . - -
Total .............. 410.39* 520.01*
• To>tal excise revenue receipts a fter deduction o f refunds, Somrce: — Office of the Commissioner o f Excise, Panaji.
177
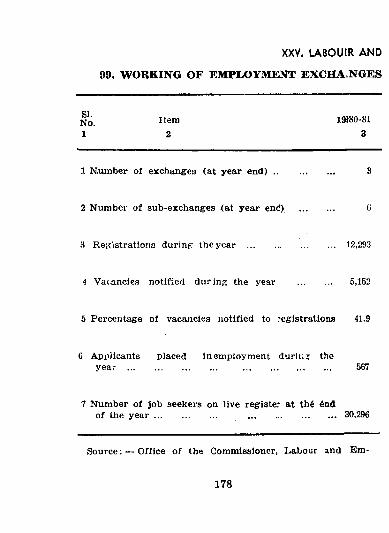
XXV. LABOUIR AND
99. WORKING OF EMPLOYMENT EXCHA.NGES
No. Item laSO-Sl1 2 3
1 Num ber o f exchan&es (at year e n d ) ........................ 3
2 Number o f sub-exchanges <at year end) ............. 6
3 Reyistrationc during: the year .................................... 32,293
4 Vacancies notified d uring the year ............. 5,152
5 Percentage of vacancies notified to registrations 41.9
C Applicants placed in employment d u rlr.' theyear ..................................... ..................................... 557
7 Num ber o f job seekers on live register at th6 6ndo f the y e a r .......................... ... ........................ 30,296
Source; — Office o f the Commissioner, Labour and Em-
178
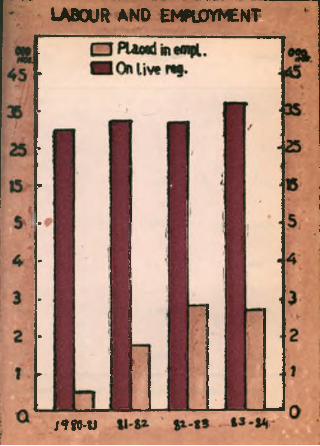
LABOUR AND EMPU3YMENT
H W - U
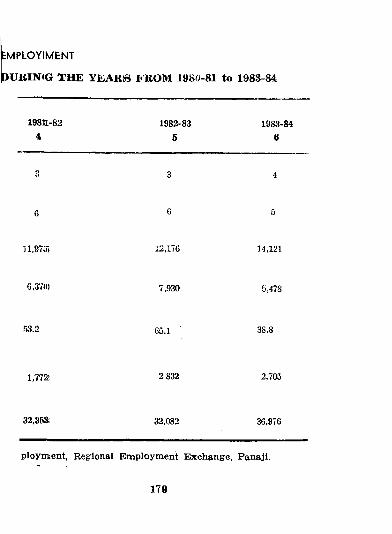
DUBINtG THE YEAKiS FROM 1980-81 to 1983-84
EMPLOYfMENT
198H-824
1982-835
1983-84tf
3 3 4
6 6 6
11,9705 12,176 14,121
6,370) 7,930 5,478
m.2 65.1 3S.8
1,772! 2,832 2,705
32,353: 32,082 36,976
ploym ent. Regional Employment Exchange, Panaji.
179
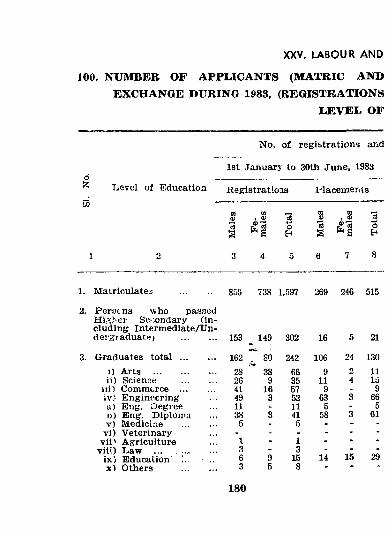
XXV. LABOUR AND
100. NUMBER OF APPLICANTS (MATRIC AND EXCHANGE DURING 1988, (REGISTRATIONS
L E V E I . O F
No. o f registrations and
1st January to 30th June, 1983
Licvel o f Education fiegistratioas P lacem enis
r r CO o ”3 o
1. M airiculates .............
2. Persens who passedHipcbcr Se--.ondary (in cluding Interm ediate/U n- dergraduat^) > .........
3. Graduates t o t a l ..............1) Arts ..........................ii) Science .............
iii) Commerce ..............iv ; Engineering a) Eng. Degree0 ) Eng. Diplomav) M edici.le ..............
vi) Veterinaryvii^ Agriculture
vii\) Law ... ...is.) Education ..x ) Others ..............
859 738 1,597 269 246 515
153 _ 149 302 16 5 21
162 ” ’ 80 242 106 24 13028 * 38 66 9 2 1126 9 35 11 4 1541 16 57 9 - 949 3 52 63 3 6611 - 11 5 - 538 3 41 58 3 615 - 5 - - -
- - _ - - -
1 - 1 - - -
3 - 3 - - -
6 9 15 14 15 293
180
5 8
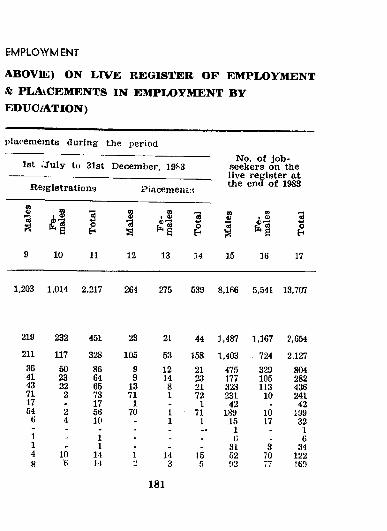
ABO VIE) ON LIVE REGISTER OF EMPLOYMENT& PLAvCEMENTS IN EMPLOYMENT BY EDUCiATION)
EMPLOWMENT
plaremeints during the period
1st .Ju ly to 31st December, 19^3
Re>giatration3
’ •3 I
10 11
Placemen 115
12 13
No. o f jo b seekers on the live register at the end o f 1983
3om£"3S
m t o 5o
34 15 16 17
1.203 1,014 2,217 264 275 539 8,lfi6 5,541 13,707
219 232 451 23 21 44 1,487 1,167 2,654211 117 328 105 53 158 1.403 724 2,12736 50 86 9 12 21 475 329 80441 23 64 9 14 23 177 105 28243 22 65 13 8 21 323 113 43671 2 73 71 1 72 231 10 24117 - 17 1 . 1 42 _ 4254 2 56 70 1 71 189 10 1996 4 10 - 1 1 15 17 32
- - - - - .. 1 . 11 - 1 . - . (i . 61 - 1 - - . 31 3 344 10 14 1 14 15 52 70 1228 (! ]•» 2 3 n 02 77 169
181
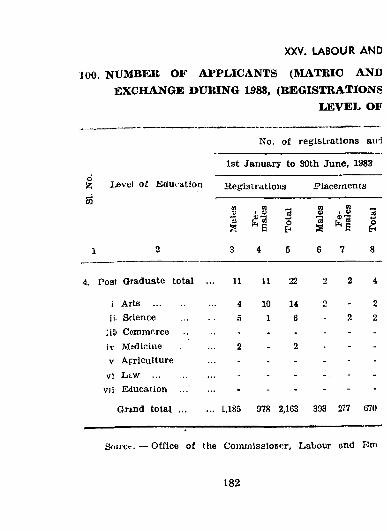
XXV. LABOUR AND
100. NUMBER OF APPLICANTS (MATRIO AND EXCHANGE DURING 198S, (REGISTRATIONS
LEVEI^ OF
No. of registrations and
1st January to 30th June, 1983o Ijevei o f Education Regis trcitioiia PlacementsCQ OJ0)
da
1 <i) 5h
s . s 3h
1 2 3 4 5 6 7 8
4. Post Graduate total .. 11 11 22 2 2 4
i Arts ............. 4 10 14 o - 2ii. Science 5 1 6 - 2 2
;1D Commerce .. - - - - - -jv Msdicine 2 - 2 - - -V Apriculture . .... - - - - -vi L>£W ........................ . - - - -
v)i Education . - - - - -
Grind t o t a l ............. . 1,185 978 2,163 393 277 670
S cu ic t ; — Office o f the Commissioner, Labour and E m
182
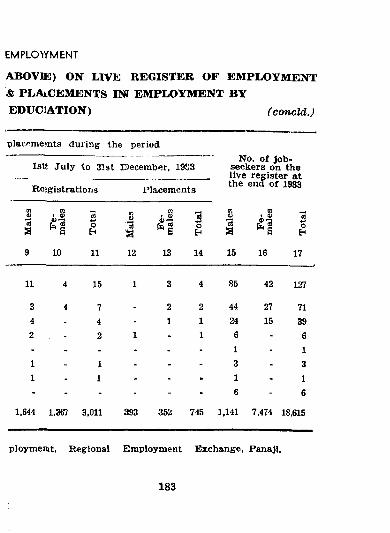
ABOVIE) ON LIVE KEGISTER OF EMPLOYMENl’ & PLAiCEMENTS INT EMPLOYMENT BYEDU C' ATION) f concld.)
EMPLOYMENT
placftmemts during the period
Istt Ju ly to 31st Decem ber, 1983No. o f jo b
seekers on the live register at
Rejgistratlons Placements the end o f 1983
01
ain
S ’S sn
"3OJ 1 4> 3o
H
01
a. s 5o
Eh
9 10 11 12 13 14 15 16 17
11 4 15 1 3 4 85 42 127
3 4 7 - 2 2 44 27 714 - 4 - 1 1 24 15 392 - 2 1 - 1 6 - 6- - - - - - 1 - 11 - 1 - - - 3 - 31 - 1 - - . 1 - 1- - - ■ - - 6 - 6
1,644 1,367 3,011 3S3 352 745 1.141 7,474 18,615
ploymenit, Regional Employment Exchange, Panaji.
183
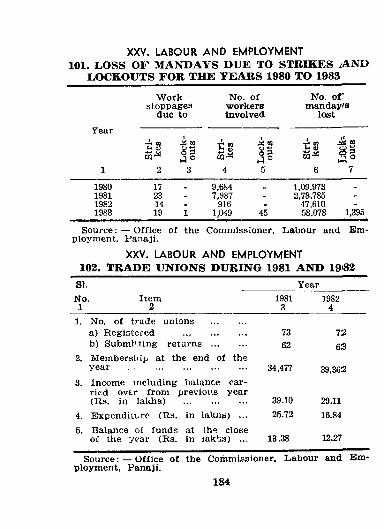
XXV. LABOUR AND EMPLOYMENT101. LOSS OF MANDAYS DUE TO STRIKES iAND
LOCKOUTS FOR THE YEARS 1980 TO 1983
Year
1
W ork stoppages
due to
No. o f workers involved
No. o f! nnanday^s
lost
-H m ai
2 3
s s02
4 5
•r» m
6
# 2S s
7
1980 17 9,684 _ 1,09,973 .
1981 23 7,987 - 2,78,785 -
1982 14 916 - 47,610 -
1983 19 1 1,049 45 58,078 1,395
S ource : — O ffice o f the Commissioner, Labour and Em ploym ent, Panaji.
XXV. LABOUR AND EMPLOYMENT102. TRADE UNIONS DURING 1981 AND 19i82
SI. YearNo. Item 1 2
19813
19824
]. No. o f trade unions ...............a) Registered .......................... 73 72b) Subm itting returns ............... 62 63
2. Memberstiip at the end o f the year 34,477 39,362
3. Incom e m cluding balance carried over from previous year (R s. in lakhs) .......................... 39.10 29.11
4. Expenditure (Rs. in laloijj) ... 25.72 16.845. Balance o f funds at the close
of tile year (Rs. in lakhs) ... 13.38 12.27
S ource: — O ffice o f the Cbihmissioner, Labour and Employm ent, Panaji.
184
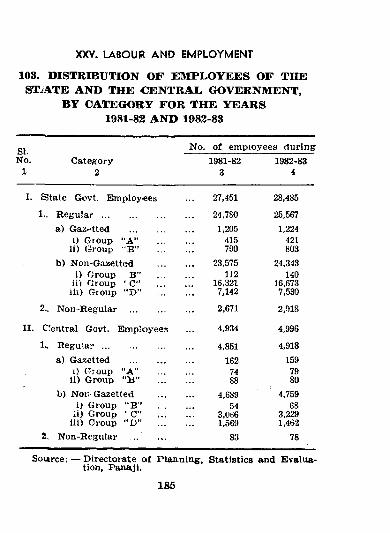
103. DISTRIBUTION OF EMPLOYEES OF THE STiATE AND THE CENTRAL, GOVERNMENT,
BY CATEGORY FOR THE YEARS 1981-82 AND 1982-83
XXV. LABOUR AND EMPLOYMENT
SI.No.
No. o f em ployees duringCategory 1981-82 1982-83
2 3 4
£3tate Govt. Employees 27,451 28,485
1.. R e g u la r .......................... 24,780 25,567a) Gazr>tted .............. 1,205 1,224
i) Group “ A ” 415 421ii) Group "B ” 790 803
b) Non-Gazetted 23,575 24,343i) Group B ” 112 140
ii) Group ‘ C” 16,321 16,673iii) Group ‘*D” 7,142 7,530
2.. Non-Regular ............... 2,671 2,918
Central Govt. Em ployees 4,934 4,996
1.. R e g u !a r .......................... 4,851 4,918a) Ga'?ctted ............... 162 159
1) Group “A ” 74 79ii) Group “ B ” 88 80
b) Nor. Gazetted 4,689 4,759i) Group “ B" . . 54 68
:i) Group ‘ C” 3,066 3,229iii) Group “ D” 1,569 1,462
2.. Non-Regular 83 78
II.
Source: — Directorate o f P lanning, Statistics and Evaluation, Panaji.
185
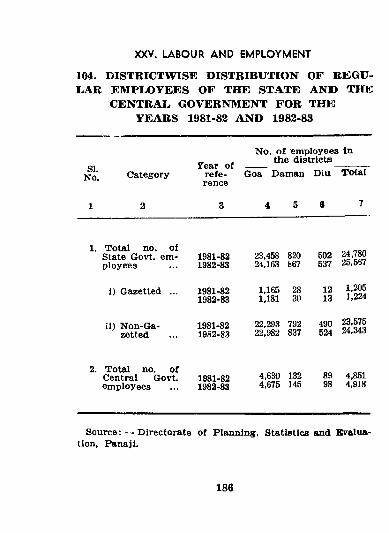
104. DISTRICTWISE DISTRIBUTION OF REGULAR EMPLOYEES OF THE STATE AND THE
CENTRAL, GOVERNMENT FOR THK YEARS 1981-82 AND 1982-83
XXV. LABOUR AND EMPLOYMENT
SI.No.
No. o f em ployees in _ , the districtsTear of ------- ----- - ;
refe- Goa Daman Diu Total rence
Category
2
1, Total no. o fState Govt, em - 1981-82ployees ... 1982-83
i) Gazetted ... 1981-821982-83
ii) Non-Ga- 1981-82zetted ... 1982-83
2. Total no. o fCentral Govt. 1981-82em ployees ... 1982-83
4 5 6 7
23,458 820 502 24,78024,163 867 537 25,567
1,165 28 12 1,2051,181 30 13 1,224
22,293 792 490 23,57522,982 837 524 34,343
4,630 132 89 4,8514,675 145 98 4,918
Source: — Directorate o f Planning, Statistics and Bvalua- lion, Panaji.
186
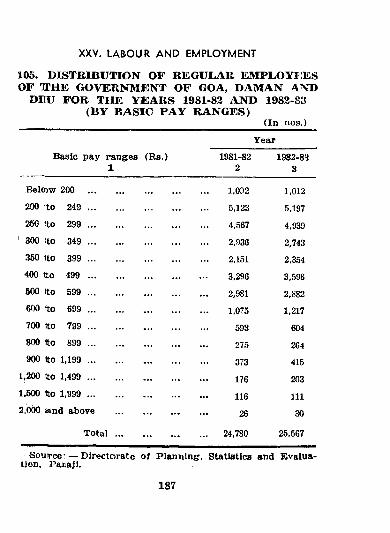
105. DISTRIBUTION OF REGULAR EMPLOYEES OF OrHE GOVERNMENT OF GOA, DAMAN AND
DEU FOR THE YEARS 1981-82 AND 1982-S3 (BY BASIC PAY RANGES)
(In nos.)
XXV. LABOUR AND EMPLOYMENT
Basic pay ranges (R s.)
Year
1981-822
1982-8‘i3
B elow 200 .......................... ............... 1,092 1,012200 <to 249 ........................... ............... 5,123 5,197250 ito 299 .......................... ............... 4,567 4,939
> 300 to 349 ........................... ............... 2,936 2,743350 tto 399 ........................... ............... 2,151 2,354400 tto 499 .......................... .............. 3,296 3,596500 tto 599 .......................... ............... 2,981 2,882600 tto 699 .......................... ............... 1,075 1,217700 tto 799 .......................... ............... 593 604800 Ito 899 ........................... ............... 275 264900 tto 1 ,199 .......................... ............... 373 415
1,200 tto 1,499 .......................... ............... 176 2031,500 Ito 1,999 ........................... ............... 116 1112,000 an d above ............... 26 30
T o t a l ............... ............... 24,780 25,567
Souirce: — Directorate of P lanning, Statistics and Evaluation, Panaji.
187
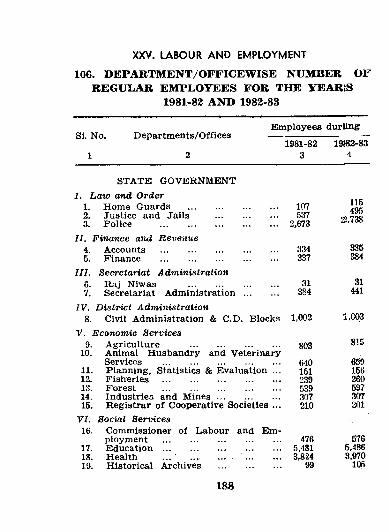
XXV. LABOUR AND EMPLOYMENT
106, DEPARTMENT/OFFICEWISE NUMBER OF REGULAR EMPLOYEES FOR THE YEARJS
1981-82 AND 1982-83
Si. No. Departm ents/O ffices
1 2
Em ployees durllng
1981-823
19f82-834
STATE GOVERNM ENTI. Law and Order
1. Home Guards ..............2. Justice and Jails3. Police ..........................
II. Finance and R evenue4. Accounts ..........................5. Finance ..........................
III. Secretariat AdministrationR aj Niwas ..............Secretariat Administration7.
IV. D istrict Adm inistration8. Civil Adm inistration & C.D. Blocks
V. Econom ic Services9. Agriculture
10.11.12.13.14.15.
VI. Social Services16. Commissioner o f Labour and Em
ploym ent .................................................17. E d u c a t io n .................................................18. Health ... ............... ...............19. H istorical Archives ..........................
Animal H usbandry and VeterinaryServices .................................................Planning, Statistics & Evaluation ...Fisheries .................................................Forest .................................................Industries and M in e s ..........................Registrar o f Cooperative Societies ...
107537
2,673
334337
31384
1.002
803
640151239539307210
4765,4813,824
99
115495
22,738
335
31441
1,003
815
659156260597307201
5765,4863,970
105
188
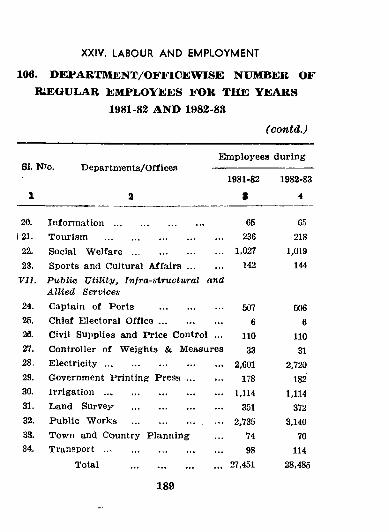
106. DEPARTMENT/OFFICEWISE NUMBER OF ICEGULAB EMPLOYEES FOR THE YEARS
1981-82 AND 1982-8S
(contd.)
XXIV. LABOUR AND EMPLOYMENT
Si. NTo. Departm ents/Offices
1 2
Em ployees during
1981-82 1982-83
8 4
20.
I 21. 22.
23.
Inform ation ... Touri-sm Social W elfareSports and Cultural A f fa i r s ...............
V ll. Public Utility, In fra stru ctu ra l and Allied Services
65236
1,027142
er,218
1,019144
24. Captain of Ports .......................... 507 50625. Chief Electoral O f f i c e .......................... 6 626. Civil Supplies and P rice C ontrol ... 110 11027. Controller o f W eights & Measures 33 3128. E le c tr ic ity ................................................. 2,601 2,72029. Government Printing P r e s s ............... 178 18230. I r r ig a t io n ................................................. 1,114 1,11431. Land Survejr ...................................... 351 37232. Public W orks .......................... 2,735 3,14033. Town and Country Planning 74 7034. Transport .................................................. 98 114
Total ......................................
189
27,451 28,485
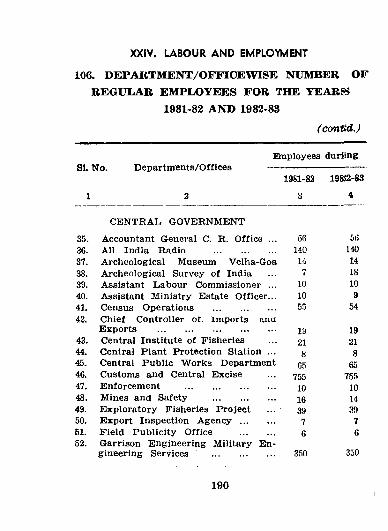
106. DEPARTMENT/OFFICEWISE NUMBER OF REGULAR EMPLOYEES FOR THE YEARSS
1981-82 AND 1982-83(conlAd.)
XXIV. LABOUR AND EMPLOYMENT
SI. No. Departm ents/O ffices
1 3
Ehiployees durling
19S1-82 198J2-83
a 4
CENTRAL. GOVERNMENT
35. Accountant General C. R. O ffice ... 56 5636. All India R adio .......................... 140 14037. A rcheological Museum Velha-Goa 14 1438. A rcheological Survey of India 7 1839. Assistant Labour Commissioner ... 10 1040. Assistant M inistry Estate O fficer... 10 941. Census Operations .......................... 55 5442. Chief Controller or. im ports ana
Exports ................................................. 19 1943. Central Institute o f Fisheries 21 2144. Central Plant Protection Station ... 8 845. Central P ublic W orks Department 65 6546. Customs and Central Excise 755 75547. Enforcem ent ..................................... 10 1048. M ines and Safety .......................... 16 1449. E xploratory Fisheries P roject ... 39 3950. Export Inspection A g e n c y .............. 7 751. F ield P ublicity O ffice .............. 6 652. Garrison Engineering M ilitary En
gineering Services .......................... 350 350
190
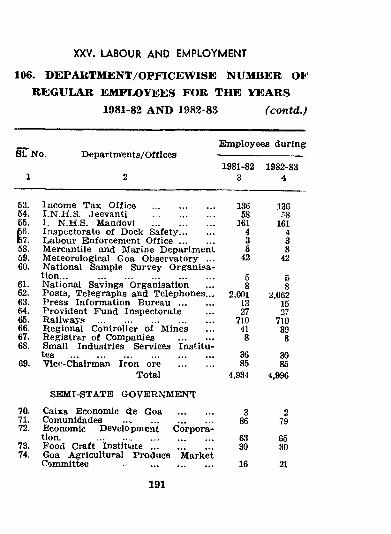
106. DEPARTMENT/OPFICEWISE NUMBER Ol REGULAR EMPLOYEES FOR THE YEARS
1981-82 AND 1983-83 (contd.J
XXV. LABOUR AND EMPLOYMENT
SL No. Departm ents/Offices
1 2
Em ployees during
1981-82 1982-833 4
53. Incom e T ax Office ..........................54. I.N.H.S. Jeevanti ..........................55. 1. N.H.S. Mandovi ..........................156. Inspectorate of Dock Safety..............|B7. Labour Enforcement O f f i c e ..............58. Mercantile and Marine Department59. M eteorological Goa Observatory ...60. National Sample Survey Organisa
tion... ................................................61. National Savings Organisation62. Posts, Telegraphs and Telephones...63. Press Information B u r e a u ..............64. Provident Fund Inspectorate65. Railways ................................................66. Regional Controller of Mines67. Registrar of Companies ................68. Small Industries Services Institu
tes ...........................................................69. Vice-Chairman Iron ore ..............
13658
1614 3 8
42
5 8
2,0011327
710418
3685
136ns
161438
42
2,0621527
71039
3085
Total 4,934 4,996
SEMI-STATE GOVERNMENT
70. Caixa Economic 3e Goa ............... 3 271. Comunidades ......................... 86 7972. Economic Development Corpora
tion. ................................................ 63 6573. Food Craft I n s t it u t e .......................... 30 3074. Goa Agricultural Produce Market
Committee .......................... 16 21
191
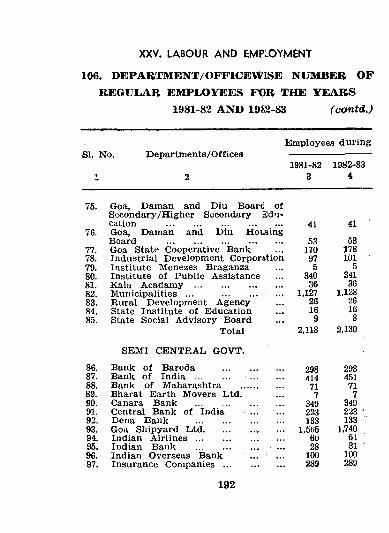
106. DEPABTMENT/OFFICEWISE NUMBER OF REGULAR EMPLOYEES FOR THE YEARS
1981-82 AND 1983-83 (contd.)
XXV. LABOUR AND EMPLOYMENT
Employees duringSI. No. D e p a r t m e n t s / O f f i c e s ---------------------------- -
1981-82 1982-831 2 3 4
75. Goa, Daman and Diu Boarc of Secondary/H igher Secondary 3du- cation ................................................ 41 41
76. Goa, Daman and Diu Housing Board ................................................ 53 53
77. Goa State Cooperative Bank 170 17878. Industrial Development Corporation 97 10179. Institute Menezes Braganza 5 580. Institute of Public Assistance 340 34181. Kala Acadamy ..................................... 36 3682. Municipalities ... ............. . 1,127 1,12883. Rural Development A gency 26 2684. State Institute of Education 16 1685. State Social Advisory Board 9 8
Total 2,118 2,130
86.
SEMI CENTRAL GOVT.
Bank o f Baroda ......................... 298 29887. Bank o f India .............. 414 45188. Bank o f Maharashtra ................. 71 7189. Bharat Earth Movers Ltd. . ... 7 790. Canara Bank ..................................... 349 34991. Central Bank of India 223 22392. Dena Bank ..................................... 133 13393. Goa Shipyard L td ..................... . 1,565 1.74094. Indian A i r l in e s ..................................... 6U 6195. Indian Bank ... .............. 28 3196. Indian Overseas Bank ... 100 10097. Insurance C o m p a n ie s ......................... 289 289
192
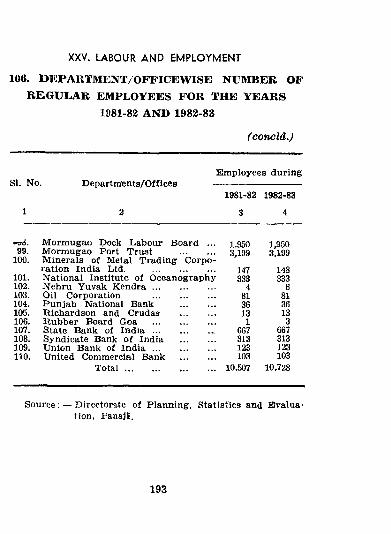
106. DEPARTMENT/OFFICEWISE NUMBER OF REGULAR EMPLOYEES FOR THE YEARS
1981-82 AND 1982-83
(concld.)
XXV. LABOUR AND EMPLOYMENT
SI. No. Departments/OfficesEmployees during
1981-82 1982-83
1 2 3 4
M orm ugao Dock Labour Board ... 1,950 1,95099. M orm ugao Port Trust .............. 3,199 3,199
100. M inerals o f Metal Trading Corporation India Ltd. .......................... 147 148
101. National Institute of Oceanography 333 333102. Nehru Yuvak K e n d r a .......................... 4 6103. Oil Corporation .......................... 81 81104. P unjab National Bank ............... 36 36105. Richardson and Crudas ............... 13 13106. R ubber Board Goa .......................... 1 3107. State Bank of I n d i a ......................... 667 667108. Syndicate Bank o f India .............. 313 313109. Union Bank of I n d i a .......................... 123 123110. United Commercial Bank ............... 103 103
T o t a l ..................................... 10,507 10.728
S o u r c e D ir e c t o r a t e of Planning, Statistics and Evaluation, Panajt.
193
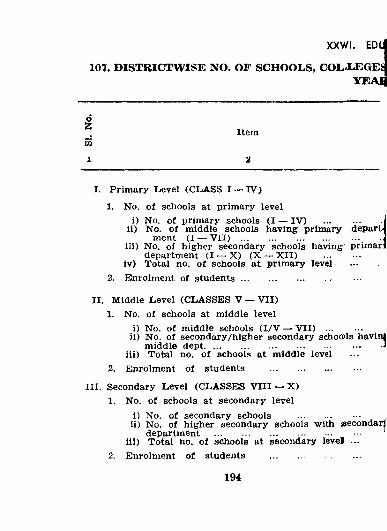
107. DISTRICTWISE NO. OF SCHOOLS, COL.L.EGEaYEAlj
XXWI. edJ
I Itemt o
X 2
I, Prim ary Level (CLASS I — IV )
1. No. o f schools at prim ary leveli) No. o f prim ary schools (I — IV ) ......................
ii) No. o f m iddle schools having prim ary departm ent (I — V I I ) ..........................................................
iii) No. o f higher secondary schools having prim ardepartment (I — X ) ( X X I I ) ...............
iv) Total no. o f schools at prim ary level..................2. Enrolm ent o f s tu d e n ts ..................................................
II. M iddle Level (CLASSES V — V II)1. No. o f schools at m iddle level
i) No. o f m iddle schools ( I /V — V II) .........................ii) No. o f secondary/higher secondary schools havini
m iddle dept..........................................................................Jiii) T otal no. o f schools at m iddle level
2. Enrolm ent o f students ......................................
III. Secondary Level (CLASSES V III — X )1. No. o f schools at secondary level
i) No. o f secondary schools .................................... ,ii) No. o f higher secondary schools with secondarj
department .............................................................iii) Total no. o f schools at secondary level ...
2. Enrolm ent o f students ......................................
194
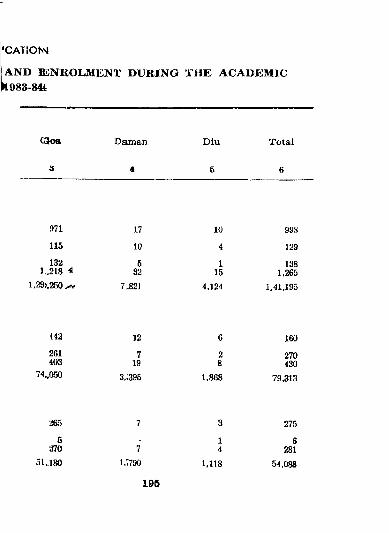
AND BUmiOLMKNT DURING THE ACADEMIC N983-84i
‘CA T IO N
Gloa Daman D iu Total
3 4 5 6
H71 17 10 998
116 10 4 129
132 5 1 1381..218 ^ 32 15 1,265
1.29),250>v 7..821 4,124 1,41,195
142 12 G ISO
261 7 2 270403 19 8 430
' ‘*••050 3,;395 1,868 79,313
265 7 3 275
5 - 1 6‘m i 4 281
olaso 1,7790 1,118 54,088
196
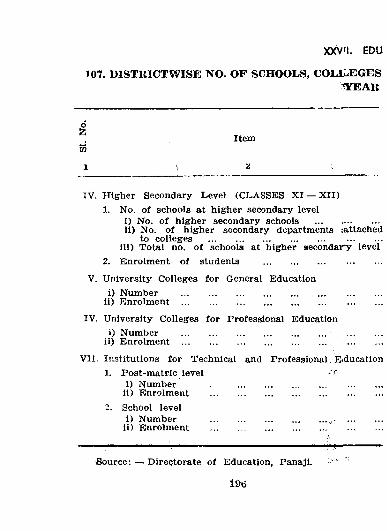
XXVM. EDU
107. DISTKICTWISE NO. OF SCHOOLS, COLIi^EGES" Y E A R
Item53
1 ^
IV. H igher Secondary Level (CLASSES X I — X II)1. No. o f schools at higher secondary level
I) No. o f higher secondary schools ...........................II) No. o f higher secondary departments jattached
to colleges ........................................................................Ill) Total no. o f schools at higher secondary level
2. Enrolm ent o f students .................................................
V. University Colleges for General Educationi) Number ....................................................................................
ii) Enrolment ...................................................................................
IV. University Colleges for Professional Educationi) Number ............................................................ ..............
ii) Enrolm ent ...................................................................................
V II. Institutions for Technical and Professional Eiduc^tion1. P ost-m atrlc level
i) Number ..............ii) Enrolment ..............
2. School levelI) Num ber ..............
II) Enrolm ent ..............
Source; — D irectorate o f Education, Panaji.
196
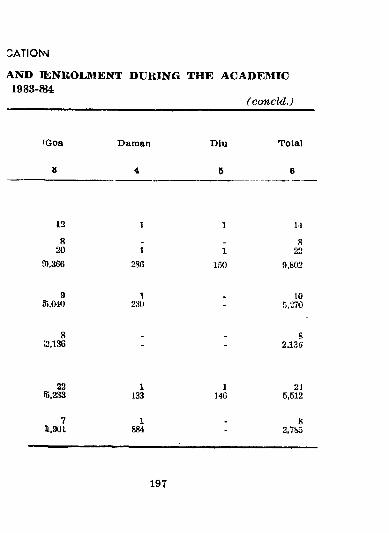
AND lENROLSTENT DURING THE ACADEMIC1983-884
CATION
( concld.J
<Goa Daman DIu Total
» 4 6 6
12 1 1 14
8 - - 820 I 1 22
9),366 286 150 9,802
9 1 - 1055,010 230 - 5,270
8 - “ 82,136 - - 2.136
22 1 1 245,233 133 140 5,512
7 1 - 8a.901 884 - 2,785
197
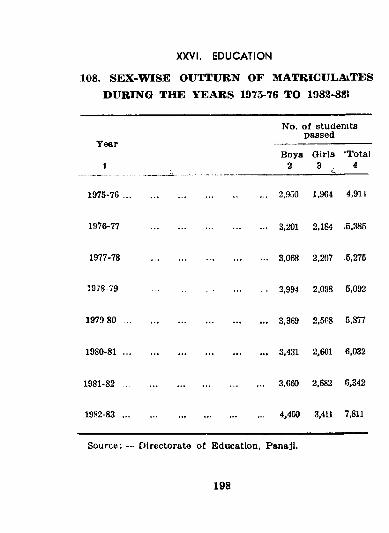
108. SEX-WISE OUTTURN OF MATRICULAlTES DURING THE YEARS 1975-76 TO 1982-88$
XXVI. EDUCATION
No. o f studenits passed
I
1Boys
2Girls3
■Total4
1975-76 ... ................................................ 2,950 1,964 4,911
1976-77 ................................................ 3,201 2,184 .'5,385
1977-78 ................................................ 3,068 2,207 5,275
1978-79 ................................................ 2,994 2,098 5,092
1979 80 ................................................ 3,369 2,508 5,877
1980-81 ... ................................................ 3,431 2,601 6,032
1981-82 ... ............................................... 3,660 2,682 6,342
1982-83 ... ............................................... 4,400 3,411 7,811
Source: — Directorate o f Education, Panajl.
198
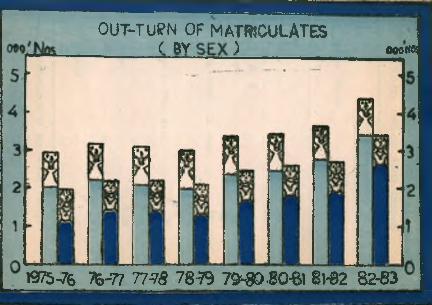
OUT-TUPN OF MATRJCULATES( BY ) ««g««
W%-716 f&-77 V ^8 78-79 7 9 ^ .8 0 € J §1-02 82^3
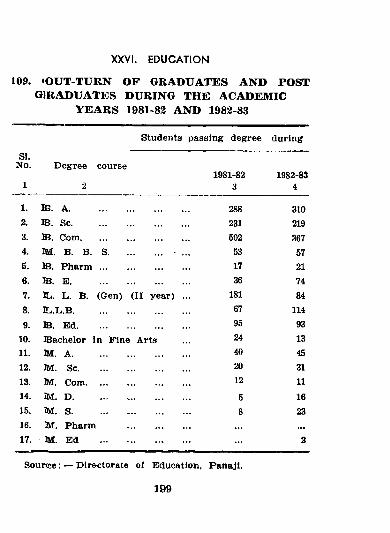
XXVI. EDUCATION
L09. ‘OUT-TURN OF GRADUATES AND POST GIRADUATES DURING THE ACADEMIC
YEARS 1981-82 AND 1982-83
Students passing degree during
SI.No. Degree course
1981-82 1982-831 2 3 4
1. A. ..................... 288 3102. B . Sc...................................... 231 2193. B . Com.................................. 502 3674. M. B. B. S...................... 53 575. B . P h a r m .......................... 17 216. B . E...................................... 36 747. IL. L. B. (Gen) (II year) 181 848. IL.L.B..................................... 67 1149. B . E d.................................... 95 93
10. B achelor In Pine Arts 24 1311. M . A ...................................... 40 4512. uvr. Sc................................... 20 3113. M . Com................................ 12 1114. M . D ...................................... 5 1615. 3M. S...................................... 8 2316. M . Pharm ............... ...17. M . Ed .......................... 2
S ou rce : — Directorate of Education, Panaji.
199
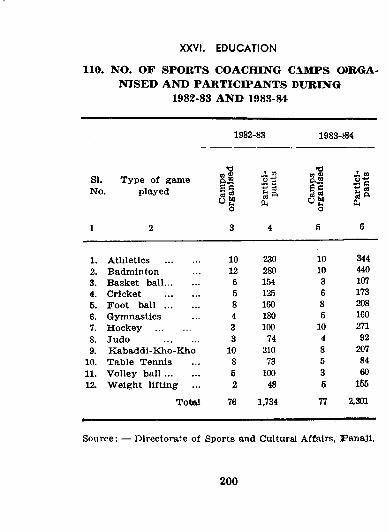
110. NO. OF SPORTS COACHING C.4MPS 0)RGA- NISED AND PARTICIPANTS DURING
1982-83 AND 1983-84
XXVI. EDUCATION
SI.No
1
1982-83 1983-«4
T ype o f game played
2
A.J3s sce si
o
3
■ii “■t:
4
"0“ S exJS 6 ca s
o
5
i stL nl a ft
6
1. Atliletlcs .............. 10 230 10 3442. Badminton 12 280 10 4403. Basket ball.............. 6 154 3 1074. Cricket .............. 5 125 6 1735. F oot b a l l .............. 8 160 8 2086. Gym nastics 4 180 5 1607. H ockey .............. 3 100 10 2718. Judo .............. 3 74 4 929. K abaddi-K ho-K ho 10 210 8 207
10. Table Tennis 8 73 5 8411. V olley b a l l .............. 5 100 3 6012. W eigh t lifting 2 48 5 165
Totel 76 1,734 77 2,301
Source: — Directorate o f Sports and Cultural Affairs, Panaji.
200
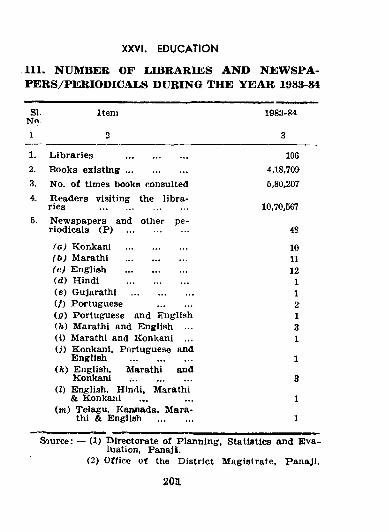
111. NUMBER OF LIBRABmS AND NEWSPAPERS/PERIODICALS DURING THE YEAR 1983-84
XXVI. EDUCATION
SI.Nrt.
Itenj 1983-84
1 2 3
1. Libraries ......................... 1062. B ooks e x is t in g ......................... 4,18,70»3. No. o f times books consulted 5,80,2074. Readers visiting the libra
ries ... ......................... 10,70,5675. Newspapers and other pe
riodicals (P ) ......................... 48
( G ) Konkani ......................... 10(h ) Marathi ......................... 11(c ) English ......................... 12(d) Hindi ......................... 1(e) Gujarathi .......................... 1( /) Portuguese .............. 2(fir) Portuguese and English 1(h) Marathi and English ... 3« ) Marathi and Konkani ... 1(j) Konkani, Portuguese and
English .......................... 1(fc) English, Marathi and
Konkani 3(I) English, Hindi. Marathi
& Konkani 1(m ) Telagu, Kannada, Mara
thi & English .............. 1
Source: — (1) Directorate o f Planning, Statistics and E3va-luation, Panaji.
(2) Office o f the D istrict M agistrate, P anaji.
201
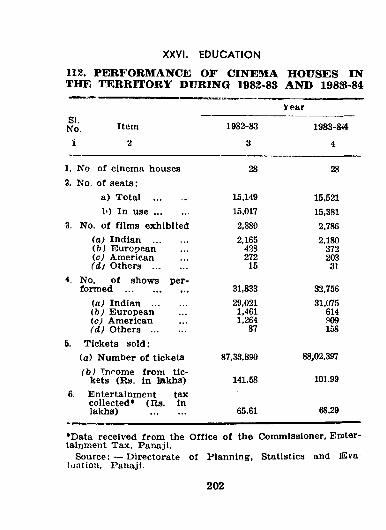
112. PERFORMANCE OF CINEMA HOUSES IN THE TERRITORY DURING 1982-83 AND 198^-84
Vear
XXVI. EDUCATION
ro. Item i 2
1982-83
3
1983-8<4
4
No. o f cinem a houses 28 28No. o f seats:
a) Total ............. 15,149 15,5211') In u s e .............. 15,017 15,381
, No. o f film s exhibited 2,880 2,786(a) Indian .............. 2,165 2,180(b ) European 428 372(c) American 272 203fd ) Others .............. 15 31
No. o f shows perform ed .......................... 31,833 32,756
{a j Indian .............. 29,021 31,075(b j European 1,461 614(c) American 1,264 909(d ) Others .............. 87 158
Tickets so ld :(a) Num ber o f tickets 87,33,890 88,02,397(h ) Tnnome from tic
kets (Ra. in liakhs) 141.58 101.99i. Entertainment tax
collected* (R s. inlakhs) ............... 65.61 68.29
•Data received from the O ffice o f the Commissioner, Eniter- lainment Tax, Panaji.
Source: — Directorate o f Planning, Statistics and IE valuation, Panaji.
202
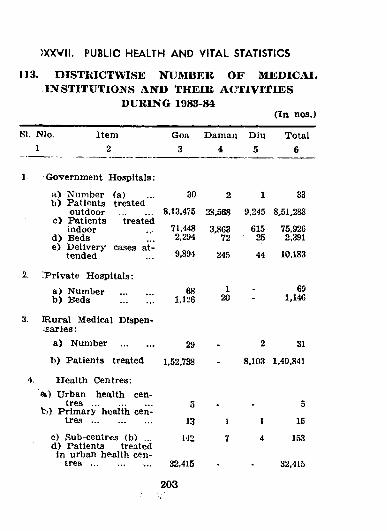
113. DISTRICTWISE NUMBER OF MEBICAI. INSTITUTIONS AND THEIK ACTIVITIES
DURING 1983-84 (In nos.)
SI. NJo. Item Goa Daman Diu Total1 2 3 4 5 6
)XXVII. PUBLIC HEALTH AND VITAL STATISTICS
1 Government Hospitals:
a ) Number (a) ... 30 2 1 33b ) Patients treated
outdoor .............. 8,13,475 28,568 9,245 8,51,288c ) Patients treated
indoor ... 71.448 3,863 615 75,926d ) Beds ... 2,294 72 25 2,391e) Delivery cases at-
tended ... 9,894 245 44 10,183
2. ;private Hospitals:a ) Number .............. 68 1 * 69b ) Beds .............. 1,126 20 - 1,146
3. iRural Medical Dlspen- isaries:
a ) Number .................................. 29 - 2 31
b ) Patients treated 1,52,738 - 8,103 1,40,841
4. Health Centres:ai) Urban health cen
tres ......................... 5 . . 5b ) Prim ary health cen
tres .............................................. 13 1 1 15
c) Sub-centres (b) ... 142 7 4 153d) Patients treatedin urban health cen
tres ......................... 32,415 - - 32,415
203
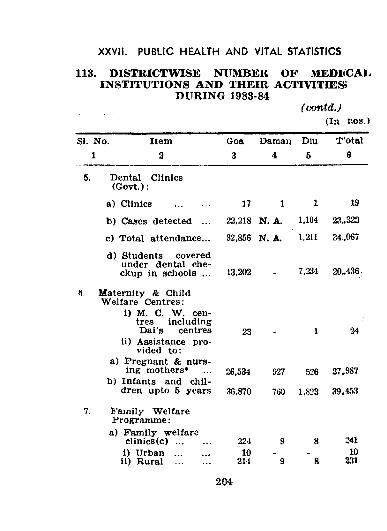
XXVIi. PUBLIC HEALTH AND VITAL STATISTICS
113. DISTBICTWISE NUMBER OF MEDIiCAI. INSTITUTIONS AND THEIR ACTFVITIESi
DURING 1983-84(contd.)
(In nos.)
SI. No. 1
Item2
Goa3
Daman Diu 4 5
T 'otal8
Dental Clinics (G ovt.):
a) Clinics .............
b ) Cases detected ..
c ) Total attendance..
d ) Students covered under dental che ckup in schools ..
M aternity & Child W elfare Centres:
i) M. C. W . centres including D ai’s centres
ii) Assistance provided to :
a) Pregnant & nursing mothers*
b) Infants and children upto 5 years
Fam ily W elfare Program m e:
a) Fam ily welfareclinics ( c ) ..............
1) Urban ..............ii) Rural ..............
17 1
22,218 N. A.
32,856 N. A.
13,202
23
26,534
36,870
22410
214
927
760
1
1,104
1,211
19
23.,322
34 ,,067
7,234 20„436
24
526
1,823
27,987
39,453
24110
231
204
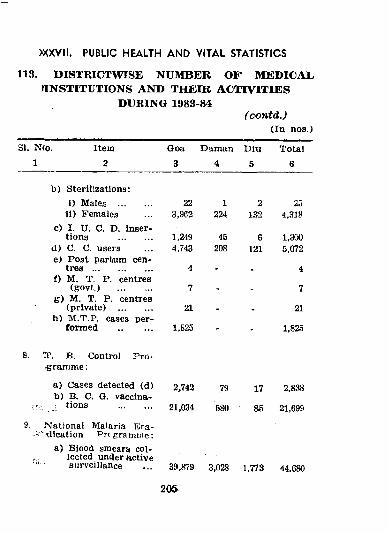
>XXVII. PUBLIC HEALTH AND VITAL STATISTICS
113. DISTRICTWISE NUMBER OF MEDICAI. ITNSTITTJTIONS AND THEIR ACTIVITIES
DURING 1983-84 (contd.)
(In noa.)SI. N(o. Item
1 2Goa
3Daman
4Diu
5Total
6
b ) Sterilizations: i) Males .............. 22 1 2 25
ii) Females 3,962 224 132 4,318c) I. U. C. D. inser
tions .............. 1,249 45 6 1,300d) C. C. users 4,743 208 121 5,072e> P ost partum cen
tres ......................... 4 4f) M. T. P. centres
(govt.) .............. 7 . 7g ) M. T. P. centres
(private) .............. 21 21h) M .T.P. cases per
form ed .............. 1,825 - - 1,825
8. 'IT. B. Control Pro- igranime;
a) Cases detected (d) 2,742 79 17 2,838b) B. C. G. vaccina-
tions .............. 21,034 580 85 21,699
9. National Malaria Era- 'dication Pri gramme:
a) Biood smears col- , l ected under active ” * surveillance 39,879 3,028 1,773 44,680
20&
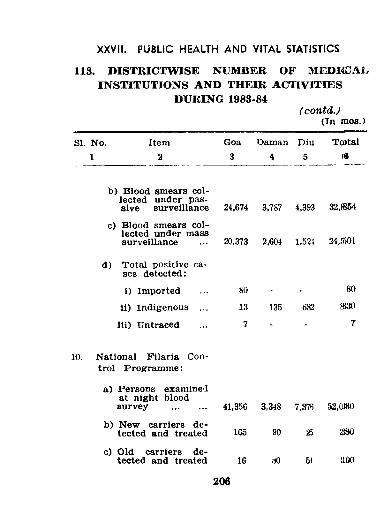
113. DISTRICTWISE NUMBER OF MJED«DA1> INSTITUTIONS AND THEIK ACTIVITIES
DURING 1983-84(contdj
(In m os.)
XXVil. PUBLIC HEALTH AND VITAL STATISTICS
SI. No. 1
Item2
Goa3
Daman Diu T o ta l4 5 ffi
b ) B lood smears collected under passive surveillance
c) B lood smears collected under mass surveillance
24,674 3,787 4,393 32.S54
20,373 2,604 1,521
d) Total positive cases detected:
i) Im ported ... 80ii) Indigenous ... 13
lii) Untraced ... 7
135 682
80
»30
T
10. National Filaria Control P rogram m e:
a) Persons examined at night bloodsurvey ............ 41,356 3,348 7,37S 52,0)80
b) New carriers detected and treated 165 90 25 280
c) Old carriers detected and treated 16 aO 54 1100
206
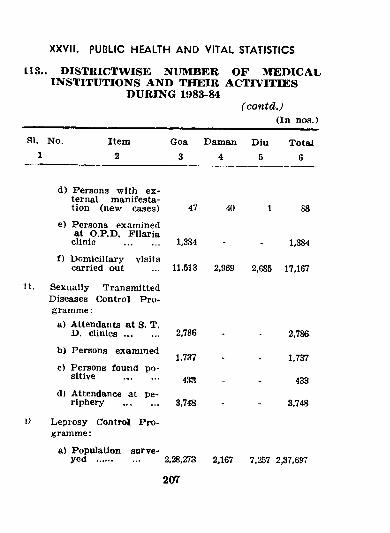
113.. DISTRICTWISE NUMBER OF MEDICAL INSTITUTIONS AND THEIR ACTIVITIES
DURING 1983-84( c o n td .)
______________ (In no3. >
No. Item Goa Daman Diu Total1 2 3 4 5 6
XXVII. PUBLIC HEALTH AND VITAL STATISTICS
d) Persons with external manifestation (new cases) 47 40 1 88
e) Persons examined at O.P.D. Filaria
clinic .............. 1,384 - - 1,384
f) Domiciliary visitscarried out ... 11,513 2,969 2,685 17,167
11. Sexually TransmittedDiseases Control P ro gramme :
a) Attendants at S. T,D. c l in ic s .............. 2,786 - - 2,786
b) Persons examined
c) Persons found positive ........................ 4 3 3
d) Attendance at periphery ............... 3,748 - - 3,748
V Leprosy Control P ro gramme :
a) Population surveyed .................. 2,28,273 2,167 7,257 2,37,697
1,737 - - 1,737
43»
2OT
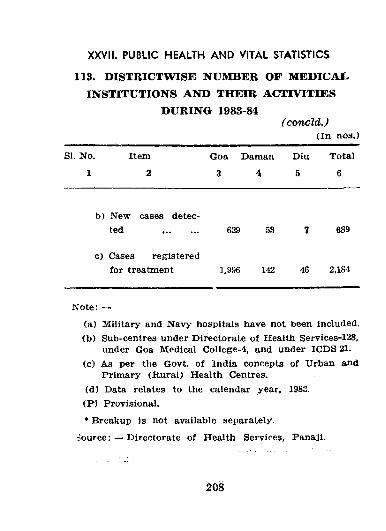
113. DISTRICTWISE NUMBER OF MEDICAL INSTITUTIONS AND THEIIl ACTIVITIES
DURING 1983-84( concld.)
(In no3.)
XXVII. PUBLIC HEALTH AND VITAL STATISTICS
SI. No. Item
1 2
Goa Daman
3 4
Diu
5
Total
6
b) New cases detected ............... 629 53 7 689
c) Cases registeredfor treatment ],996 142 46 2,184
N ote: —
(a) M ilitary and Navy hospitals have not been included.(b ) Sub-centres under D irectorate o f Health Services-128,
under Goa M edical College-4, and under ICDS 21.<c) As per tlie Govt, o f India concepts o f Urban And
Prim ary (R ural) Health Centres.(d ) Data relates to the calendar year, 1983.
(P ) Provisional.
* Breakup is not available separately,
sou rce : — Directorate o f Health Services, Panaji.
208
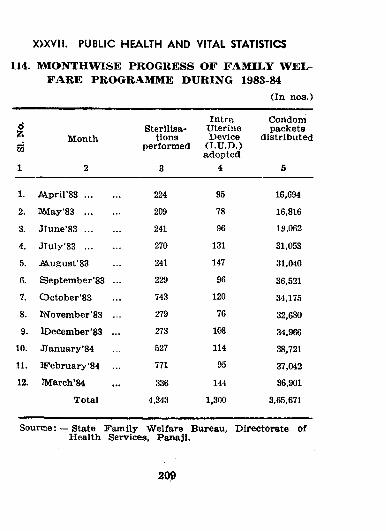
X>XYI1. PUBLIC HEALTH AND VITAL STATISTICS
114. MIONTHWISE PROGRESS OF FAMILY WEI^ FARE PROGRAMME DURING 1983-84
(In nos.)
M onth
2
Sterilisations
performed
IntraUterineDevice
(I.U .D .)adopted
4
Condompackets
distributed
1. A!Lpril’83 ...
2. M a y ’83 ...
JIune’83 ...
JIuly ’83 ...
i*A.ugust’83
S eptem ber ’83
7. O cto b e r ’83
8. Rsrovember’83
lDecember’83
JTanuary’84
11. IFebruary’84
12. lMarch’84
Total
9.
10.
224
209
241
270
241
229
743
279
273
527
771
336
4,343
95
78
96
131
147
96
120
76
108
114
95
144
1,300
16,694
16,816
19,062
31,053
31,040
36,521
34,175
32,680
34,966
38,721
37,042
36,901
3,65,671
Sou rce : — State F am ily W elfare Bureau, D irectorate o fHealth Services, Panaji.
209
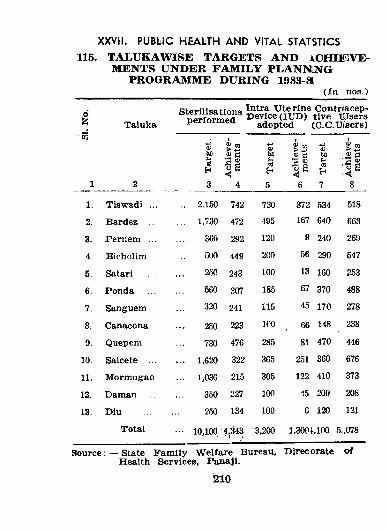
115. TALUKAWISE TARGETS AND ACHIEVEMENTS UNDER FAMILY PLANMNG
PROGRAMME DURING 1983-a(In nos.)
XXVll. PUBLIC HEALTH AND VITAL STATSTICS
i■ m
1
Taluka
2
Sterilisationsperform ed
Intra U terine Contrfacep- D ev ice (lU D ) live THsers
adopted (C.C.U/sers)
9tuoucSh3 4
<vbeucS
5
> 2 S 0)
6
<uhoSiOSy7
.s. C
8
1. Tiswadi ... ... 2,150 742 730 372 534 518
2. Bardez ... ... 1,730 472 495 167 640 663
3. Periiem ... 360 292 120 9 240 269
4. Bicholim noo 449 200 56 290 547
5. Satari 250 243 100 13 160 253
6. Ponda 560 307 185 67 370 488
7. Sanguem 320 241 115 45 170 278
8. Canacona 250 223 100 66 148 238
9. Quepem 730 476 285 81 470 446
10. Salcete ... ... 1,620 322 365 251 360 676
11. Mormugao ... 1,030 215 305 122 410 373
12. Daman ... 360 227 100 ■15 200 208
13. Diu 250 134 100 6 120 121
Total ••• lO.lW 4,343 3,200 1,3001,100 5„078
Source: — State F am ily W elfare Bureau. Direcorate o fHealth Services, Panaji.
i2l6
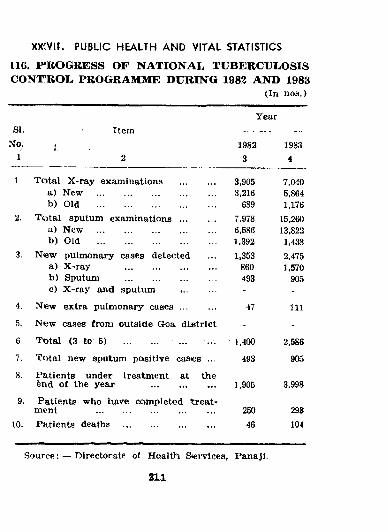
XX(Vlt. PUBLIC HEALTH AND VITAL STATISTICS
116. P*ROGRESS OF NATIONAL TUBERCULOSIS CONT’ROL PROGRAMME DURING 1982 AND 1988
(In nos.)
SI.r^o.
1
Item
2
Year
19823
19&{4
1 T ota l X -ray examinations ............... 3,905 7,040a) New ..................................... 3,216 5,864b) Old ................................................. 6S9 1,176
2. T ota l sputum ex a m in a tio n s ............... 7,978 15,260a) New ................................................. 6,586 13,822b) Old ................................................. 1,392 1,438
3. N ew pulmonary cases detected 1,353 2,475a) X -ray ...................................... 860 1,570b) Sputum ...................................... 493 905c) X -ray and sputum - -
4. New extra pulmonary c a s e s ............... 47 I l l5. New cases from outside Goa district - -G. T otal (3 to 5) 1,400 2,5867. Total new sputum poisitive cas<es ... 493 905
8. Patients under treatment at the 6nd o f the yeax ........................... 1,906 3,998
9. Patients who have completed treat- mo,nt ................................................. 250 29S
10. Patients deaths ...................................... 46 104
Source: — Directorate of Healtti S<ervices, Panaji.
21.1

XXVII. PUFLIC HIEALTH
117. MONTHWISE AND AGE-GXOUP’WISE
Age groupIPersona
April Mai' June July UlgllSt Sept
1 2 3 4 5 6 T
Below 1 year , 1,071 865 1,163 1,780 .651 1,267
1 — 2 years .............. 244 107 1G6 426 363 348
3 years and above.. . 177 100 145 378 153 183
Total 1,492 1,072 1,474 2,584 J.167 1,798
S o u r c e D ir e c t o r a t e o f Health Services, ?aitaji.
212
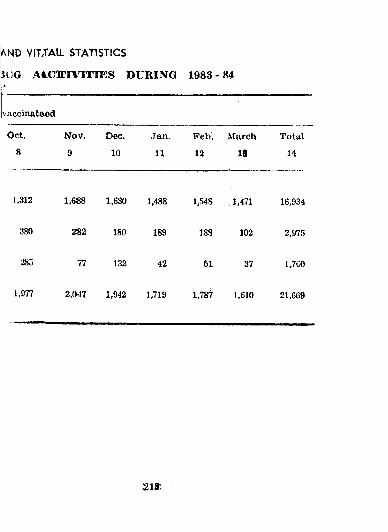
liiG A«LCiri\TTrES DURING 1983-84
vaccinate ed
Oct. Nov. Dec. Jan. Feb. March Total
8 9 10 H 12 la 14
1,312 1,688 1,630 1,488 1,.548 .1,471 16,934
380 282 180 189 188 102 2,975
285 77 132 42 51 37 1.7G0
1.977 2,047 1,942 1.719 1,787 1,610 21,069
AND VILTAIL STATISTICS
2 1 »
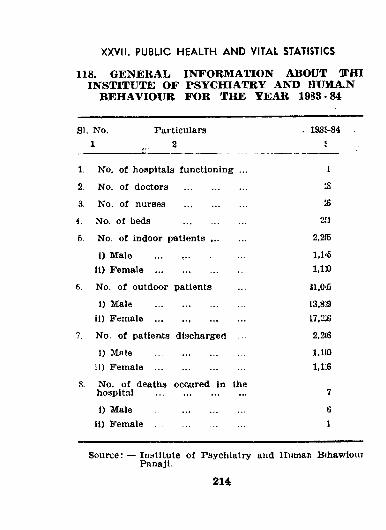
118. GENERAL. INFORMATION ABOUT TTHI INSTITUTE OF PSYCIHATRY AND HUHAN
BEHAVIOUR FOR THE YEAR 1988-84
XXVII. PUBLIC HEALTH AND VITAL STATISTICS
SI No. Particulars . 198J-841 2 S
1. No. o f hospitals functioning ... 1
2. No. o f doctors .......................... IS
3. No. o f nurses .......................... -£
4. No. o f beds .......................... m
5. No. o f indoor p a t ie n ts .............. 2.215
1) Male 1.K511) Female ..................................... 1 ,1»
6. No. o f outdoor patients 31,0‘5
1) Male ..................................... 13,839ii) Female ..................................... n.2iB
7. No. o f patients discharged ... 2,2(6
i) Male ..................................... 1,110ii) Female ..................................... 1,1.6
8. No. o f deaths occured In the hospital ..................................... 7
1) Male ..................................... G11) Female ..................................... 1
Source: — Institute o f Psychiatry and Human BthawiourPanaji.
214
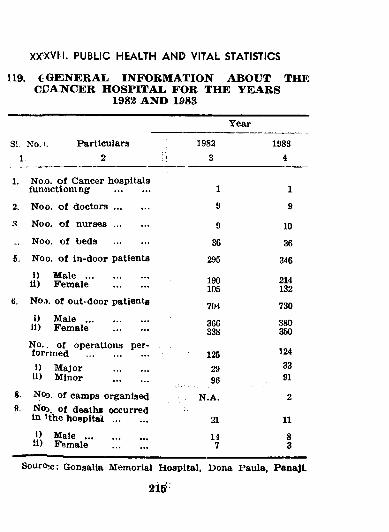
XX'XVIil. PUBLIC HEALTH AND VITAL STATISTICS
119. C GENERAL INFORMATION ABOUT THECCAJVCER HOSPITAL. FOR THE YEARS
1982 AND 1983
Year
SI, N o.). Particulars 1982 19831 2 i; 3 4
1. No.o. o f Cancer hospitals funnctiom ng ............... 1 1
2. Noo. o f d o c t o r s ............... 9 9X Noo. o f n u r s e s .............. 9 10- Noo. o f beds .............. 36 365. Noo. o f in -door patients 295 346
i) M a l e ..........................11) Fem ale .............. 190
105214132
6. No.>. o f out-door patients 704 730i) M a l e ..........................
li) Fem ale .............. 366338
380350
N o .. o f operations per- forrmed .......................... 125 124
I) M ajor ..............II) M inor ..............
2996
3391
Nqj. o f camps Organised N.A. 29, NO)_ o f deaths occurred
in Ithe h o s p i t a l .............. 21 111) M a l e ..........................1 ) Female ..............
147
83
Sourc:e: Gonsalia Memorial Hospital, Dona Paula, PanajL
2l5‘
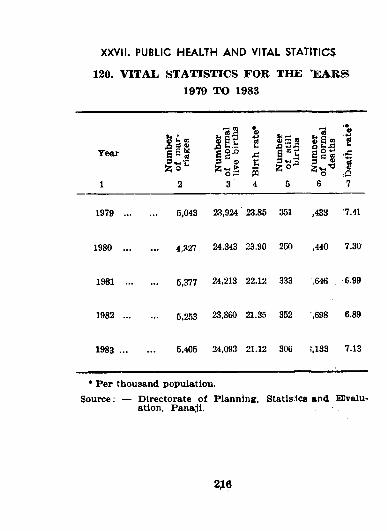
120. VITAL STATISTICS FOR THE 'EARS1979 TO 1983
XXVII. PUBLIC HEALTH AND VITAL STATITICS
^ b o;C® <D ,§E .?
#
t J 2 .S^■3 'S
tc O JSS c «
i
Year 6 g-“ XIt,S
1 2 3 4 5 6 7
1979 ............. 5,043 23,924 23.85 351 .433 '7.41
1980 .............. 4.327 24.343 23.90 250 ,440 7.30
1981 ............. 5,377 24.213 22.12 333 ,646 '6.99
1982 .............. 5,253 23,860 21.35 352 '.698 '6.89
1983 .............. 5,405 24.093 21.12 306 !,133 7.13
— ■ ^• P er thousand population.
Source; — Directorate o f Planning, Statislcs and EJvalu- ation, Panaji.
2J6
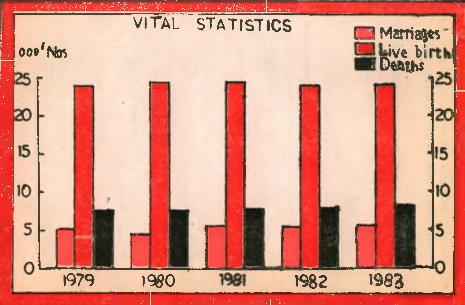
oo® 'N os
1979
VITAL s t a t i s t i c sQ M arriage
ive h\ W h sD«
1 9 ^ 0 m 2 1983
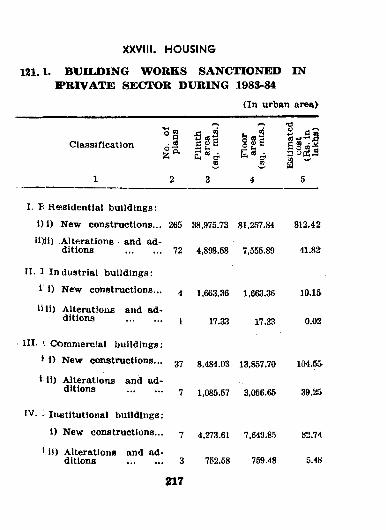
121.1. BUILDING WORKS SANCTIONED IN IPRIVATE SECTOR DURING 1983-84
(In urban area>
XXVIII. HOUSING
Classification . C <L> B 0 Q, IS b ^ O'
CQ
§ s l
m
•a
i m
1 2 3 4 5
I. F. R esidentia l bu ild in gs:
1)1) New constructions... 265 38,975.73 81,257.84 812.42
ii)il) Alterations and additions ............... 72 4,898.58 7,555.89 41.8^
II. I Industrial buildings:
i i) New constructions... 4 i,663.36 1,663.36 10.1&
liii) Alterations and ad-............... 1 17.33 17.^ 0.02
III. Commercial buildings:
1 1) New canstrucUons... gy 8 ,434.03 13,857.70 104.5&
i ii) Alterations and ad-............... 7 1,085.57 3,056.65 39.25
IV. ; Institutional bu ildings;
i) New constructions... 7 4,273.61 7,649.85 82.74
* ii) Alterations and additions ............... 3 752.58 759.48 5.48
217
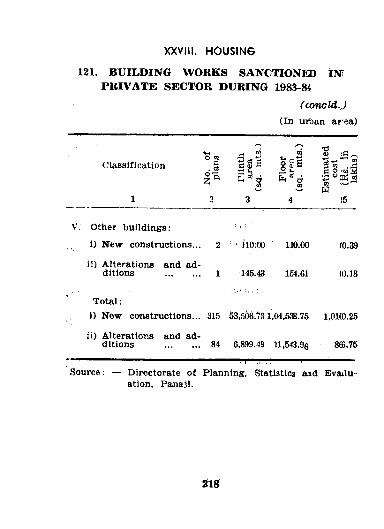
121. BUILDING WORKS SANCTIONED IM PRIVATE SECTOR DURING 1983-84
C concld.,) (In urijan ar ea)
XXVIII. HOUSING
Classification . §
1 2
ai3
11^03
4
_4> iC ~
g 03w
!5
V. Other buildings:
i) New constructions... 2 ' i l0;00 110.00 (0.39
ii) Alterations and additions .............. 1 145.43 1M.61 (0.18
Total:1) New constructions... 315 53,506. tS 1,04,538.75 1,01(0.25
ii) Alterations and additions .............. 84 6,899.49 11,543.96 866.75
Source; — Directorate o f Planning, Statistics and Evailu- atlon, Panaji.
21g
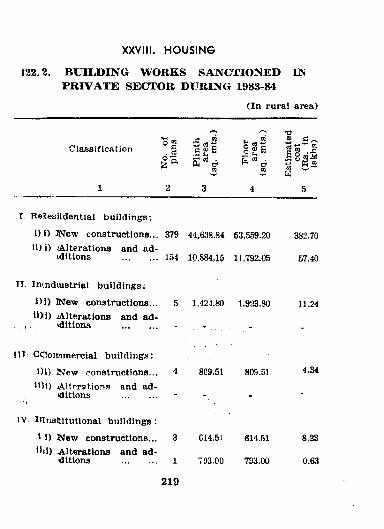
122,3. BUILDING WORKS SANCTIONED IN PRIVATE SECTOR DURING 1983-84
(In rural area)
XXVIII. HOUSING
O OJClassifies t ion §
S '* !?m
o £ S
TO
>a
S01K
m
K «
1 2 3 4 5
r Re^esHdential buildings:
1) 1) INew constructions... 379 44,638.84 53,559.20 382.70H) i) iAlterations and ad-
(ditions .............. ]54 10.884,15 11,792.05 57.40
II Intndiustrial bu ildings;
1)1) BSTew constructions... 5 1,424.80 1,923.80 11.24
■ *11) 1) A lterations and ad-
iditions . *.... -
n i . CCoirnmercial bu ildings:
i)i) N ew constnictlons... 4 809.51 809.51 4.34
, •IHi) A ltorations and ad-
tditions .............. - -
IV iTIiistitutlonal buildings :
*1) N ew constructions... 3 614.51 614.51 8.235Hi) Alterations and ad
ditions .............. 1 793.00 793.00 0.63
219
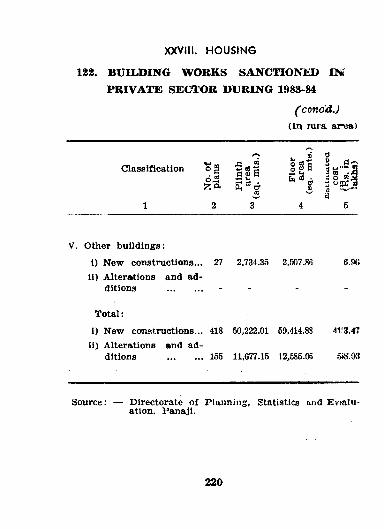
122. BUILDING WORKS SANCTIONED IM PRIVATE SECTOR DURING 1983-84
(concd.)(In rural area)
XXVIII. HOUSING
Classification o g 6 ^
1 2
c9 ^ C 4> 2
n3
I* ® 0 g g 0 2 K
a
4
9
3 g ^ -a
5
V. Other bu ildings;
t) New constructions... 27 2.734.35 2,507.86 6.9Cii) Alterations and ad
ditions .............. - -
T ota l:
i) New conf?tructions... 418 50,222.01 59,414.88 4113.47ii) Alterations and ad
ditions ...............155 11,677.15 12,585.05 5S8.03
Source; — Directorate o f Planning, Statistics and Evmlu- ation, Panaji.
220
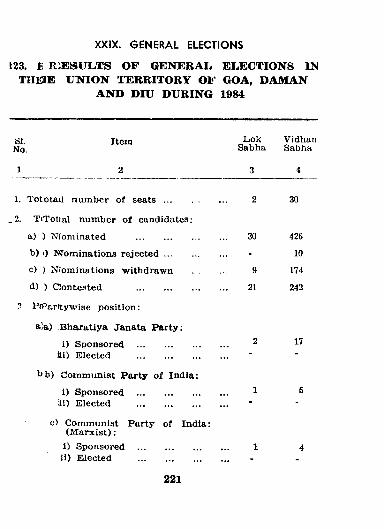
123. F RIESULTS OF GENERAL, ELECTIONS IN THEIE UNION I ’ERBITORY OF GOA, DAMAN
AND DIU DURING 1984
XXIX. GENERAL ELECTIONS
81.No.
I t G n ]
2
L ok Vidhari Sabha Sabha
1. Tototail num ber o f s e a t s .............
_2. TcToUal num ber o f candidates:
a) ) Nfom inated ..........................
b) i) NIominations r e je c te d ..............
c) ) Nrominations withdrawn
d) ) C ontested ..........................
? PfParltywise p osition :
a)a) B haratiya Janata P arty ;
i) Sponsored ..........................Si) E lected ..........................
b b ) Com m unist P arty o f Ind ia :
i) Sponsored ...........................ii) E lected ..........................
c) Communist P arty of India: (M a rx ist):
i) Sponsored ..........................ii) E lected ..........................
30
9
21
30
426
10
174
242
17
221
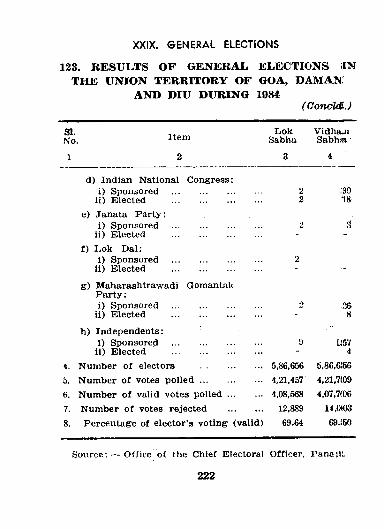
XXIX. GENERAL ELECTIONS
123. RESULTS OF GENERAL ELECTIONS IN THE UNION TERRITORY OF GOA, DAMANT
AND DIU DURING 1984( GoncM.)
No.
1 2
L.okSabha
3
VidhainSabhfa
4
d) Indian National Congress:i) Sponsored ..................................... 2 :30
ii) Elected ..................................... 2 fl8e) Janata P arty :
i) Sponsored .......................... 2ii) Elected ..................................... - -
f) Lok D al:i) Sponsored ..................................... 2
ii) E lected ..................................... - -
g ) M aharashtrawadi Gomantak P arty :i) Sponsored ..................................... 2 26
ii) Elected ..................................... - 8
h) Independents:i) Sponsored ..................................... 9 1157
ii) Elected ..................................... - 44. Numtoer o f electors .......................... 5.86,656 5,86,«565. Num ber o f votes p o l l e d .............. 4,21,457 4,21,7(096. Num ber o f valid votes p o l le d .............. 4,08,568 4,07,7(067. Num ber o f votes rejected .............. 12,889 14,0W38 . P ercentage of elector’s voting (valid) 69.64 69.!50
Source: — Office o f the Chief Electoral O fficer, Panajti,
222
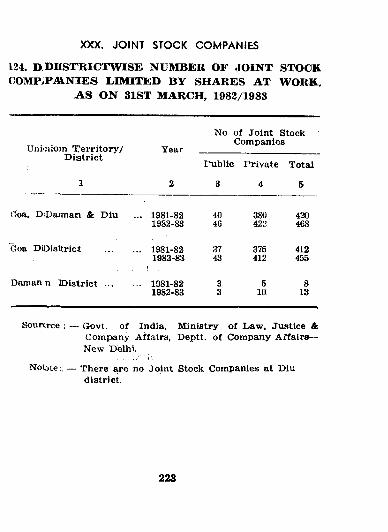
XXX, JOINT STOCK COMPANIES
124. D DKSTRICTWISE NUMBER OF JOINT STOCK COMP^PANIES LIMITED BY SHARES AT WORK,
A S ON 31ST MARCH, 1982/1983
YearNo o f Join t Stock
CompaniesD istr ict
1 2
Public
3
Private
4
T otal
5
(lea, DiDaiman & Dlu ... 1981-82 40 380 4201982-83 46 422 468
Goa DiOisttrict ... .. 1981-82 37 375 4121982-83
543 412 455
Daman n D is tr ic t ... .. 1981-82 3 5 81982-83 3 10 13
Sonnrce ; — Govt, o f India, M inistry o f Law, Justice & Com pany Affairs, Deptt. o f Company A ffa irs—New Delhi.
Nolote:. — There are no Joint Stock Companies at Diu district.
223
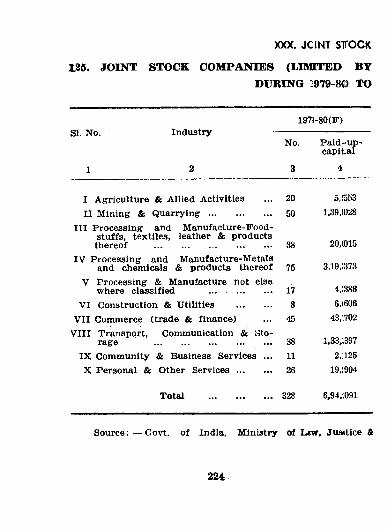
IH5. JOINT STOCK COMPANIES (LIMITED BY DURING 1979-8© TO
XXX. JOINT STOCK
SI. No. Industry197)-80(F)
No. P aid -up -capital
I Agriculture & A llied Activities ... 20 5,{553II M ining & Q u a r r y in g ........................ 50 1.39,(028
III Processing and M anufacture-Food-stuffs, textiles, leather & productsthereof ............................................... 38 20,(015
IV Processing and Manufacture-Metalsand chemicals & products thereof 75 3,19,:373
V Processing & Manufacture not elsewhere classified ... ............. 17 4,:388
VI Construction & Utilities ............. 8 6,(606V II Commerce (trade & finance) ... 45 43,^02
V III Transport, Communication & oto-rage ............................................... 38 1,33,;387
IX Community & Business Services ... 11 2,;125X Personal & Other S e r v ic e s ............. 26 19,!904
Total ... 328 6,94,1091
Source: — Govt, o f India, M inistry of Lrw, Juaitice &
224
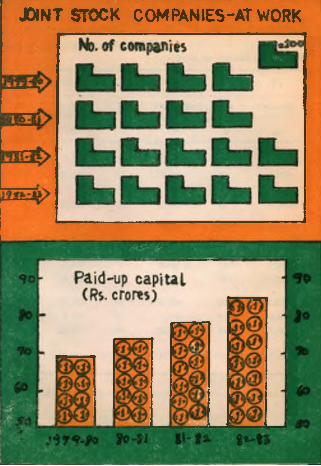
JOINT STOCK COMPANIES-AT WORK
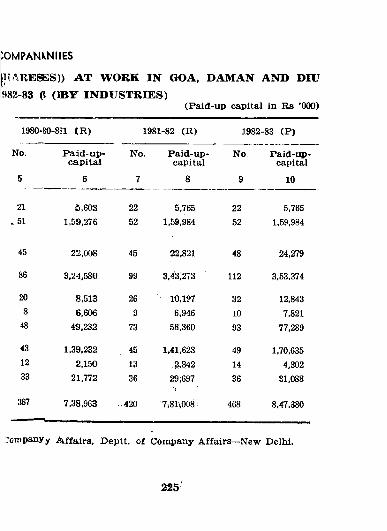
J5ARESES)) AT WORK IN GOA, DAMAN AND DIU 982-83 (? (IBTT INDUSTRIES)
(Paid-up capital in R s ’000)
:0MPANKNIIES
1980-80-831 CR) 1981-82 (R ) 1982-83 (P )
No. P a id -u p -cap ita l
No. Paid-up-capital
No Paid-up-capital
5 6 7 8 9 10
21 5,603 22 5,765 22 5,765.51 1,59,276 52 1,59,984 52 1,59,984
45 22,008 45 22,821 48 24,279
86 3,24,580 99 3,43,273 112 3,53,374
20 8,513 26 10,197 32 12,8438 6,606 9 6,946 10 7,821
48 49,232 73 58,360 93 77,289
43 1,39,232 45 1,41,623 49 1,70,63512 2,150 13 2,342 14 4,30233 21,772 36 29;697 36 31,088
367 7,38,963 420 7i81i00S; 468 8,47,380
:oinpanyy A ifa irs , Deptt. o f Company A ffa irs—New Delhi.
226
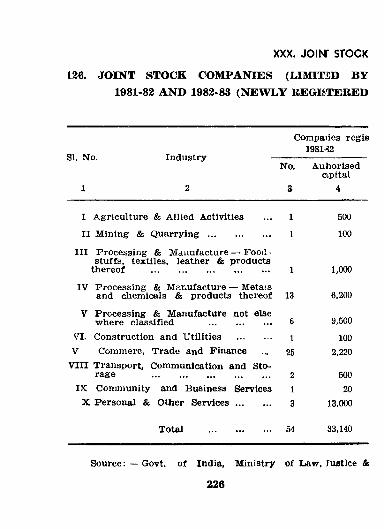
126. JOINT STOCK COMPANIES (LIMITSD BY1981-82 AND 1982-83 (NEWLY REGISTERED
XXX. JOINT STOCK
SI. No. Industry
Oompaiies regis 1981^2
N a
3
Auhorisedapital
I Agriculture & A llied Activities ... 1 500
II M ining & Q u a r r y in g ........................ 1 100
III Processing & M anufacture — Food ■ stuffs, textiles, leather & products
thereof ................................................ 1 1,000
IV Processing & Manufacture — Metaisand chemicals & products thereof 13 6,200
V P rocessing & Manufacture not elsewhere classified ........................ 6 9,500
VI. Construction and Utilities ............. i lOOV Commere, Trade and Finance 25 2,220
V III Transport, Communication and Storage ................................................ 2 500
IX Community and Business Services i 20X Personal & Other S e r v ic e s .......... 3 13,000
Total 54 33,140
S o u r c e G o v t , o f India, M inistry of Law, Jufltlce &
226
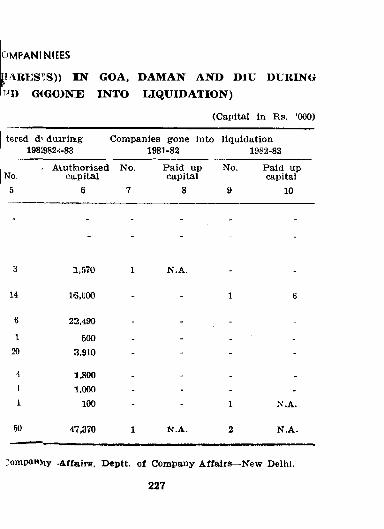
OMPANINIEES
SiARES'JS)) IN GOA, DAMAN AND DIU DURING 11) G<GO>NE INTO LIQUIDATION)
(Capital in Rs. ‘000)
tered d’ duirimg Companies gone into 198aS2.<-83 1981-82
liquidation1982-83
No,5
A\.utlnorisedca,pital
6
No.
7
Paid up capital
8
No.
9
Paid up capital
10
3 1,570 1 N.A.
- -
14 16,000 - - 1 6
6 22,490 - - - -
1 500 - - - -
20 3,910 - - - -
4 1,800 - - - -
1 1,000 - - - -
1 100 - - 1 N.A.
50 47,370 1 N.A. 2 N.A.
:ompaBMy .A.ffairs, Deptt- o f Company A ffa irs—New Delhi.
227
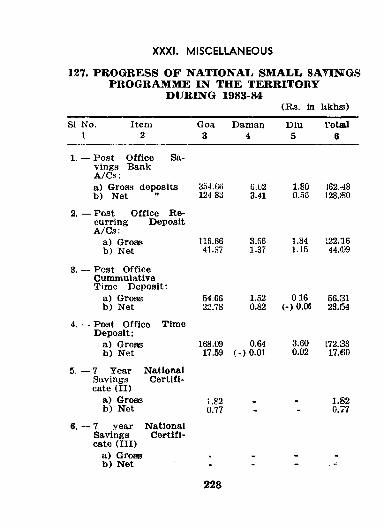
XXXI. MISCELLANEOUS
127. PROGRESS OF NATIONAL SMALL SAYINTGS PROGRAMME IN THE TERRITORY
DURING 1983-84(Rs. In hkhs)
SI No. 1
Item2
Goa3
Daman4
Diu5
Total6
1. — P ost O ffice Savings Bank A /C s:a) Gross deposits 354.66 G.02 1.80 i62.48b) Net " 124 83 3.41 0.58 128.80
2, — Post O ffice R ecurring Deposit A /C s:
a) Gross 116.66 3.66 1.84 122.16b) Net 41.37 1.37 1.15 44.(09
3. — Post O fficeCummulative Time D eposit;
a) Gross 54.66b ) Net 22.78
4. — P ost O ffice TimeD eposit:
a) Groaa 168.09b ) Net 17.59
5 . - 7 Tear National Savings C ertificate (II)
a) Gross i.g2b ) Net 0.77
6. ■ 7 year Savings cate (III )
a) Grossb ) Net
NationalCertifi-
1.520.82
0.64 ( - ) 0.01
016 (-) 0 .0«
3.600.02
56.3123.54
172.3317.60
1.820.77
228
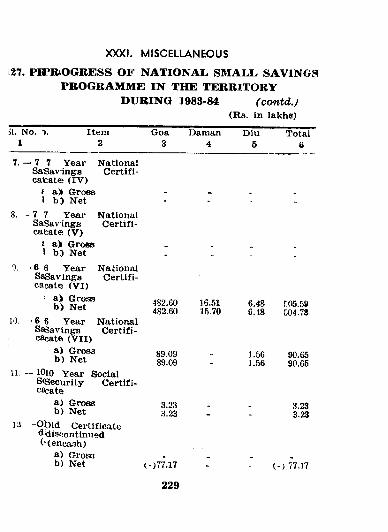
l27. PH»RiOGRESS OF NATIONAL. SMALL, SAVINGS PROGRAMME IN THE TERRITORY
DURING 1983-84 (contd.j (R s. in lakhs)
XXXI. MISCELLANEOUS
5l. No. 1
Item2
Goa3
Daman4
Diu5
TotalS
7. — 7 7 Year NationalSaSavings Certifi-cateate (IV )
* a)) Gross \ b ) Net
8 . — 7 7 Year NationalSaSavings Certifi-cabate (V )
I a> Gross > b> Net
0. — 6 6 Year NationalSaSavings C ertifi-oaoate (V I)
a ) Grossb ) Net
10 — 6 6 Year NationalSaSavings Certifi-cacat© (V II)
a ) Grossb ) Net
U. — lOio Year SocialS«Security Certifi-cacates
a) Grossb ) Net
rx -Ol^id Certificate d<iist'.cntlntied ('(encash)
a) Grossb) Net (-)77.17
482.60482.60
89.0989.09
3.233.23
16.5115.70
6.486.48
1.56l..>i6
r05.59504.78
90.6590.65
3.233.23
( - ) 77.17
229
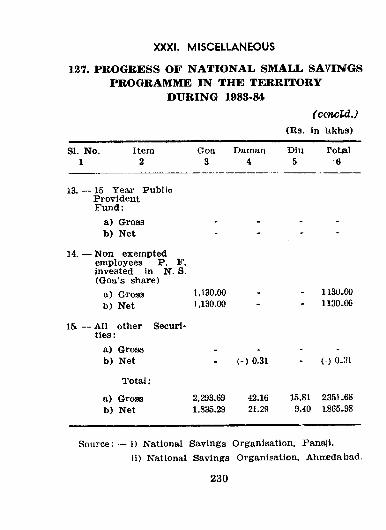
XXXI. MISCELLANEOUS
127. PROGRESS OF NATIONAL SMALL SAVINGS PROGRAMME IN THE TERRITORY
DURING 1988-84(ccncld.)
(Rs. in lakhis)
SI. No. 1
Item2
Goa3
Daman4
Diu5
Total6
13. — 15 Year PublicProvidentFund:
a) Grossb ) Net
14. — Non exemptedem ployees P. E'. invested in N. S. (Goa’s share)
a) Grossb) Net
All other Securities :
a) Groaab) Net
T ota l:
a) Grossb ) Net
1.130.001.130.00
IS
2,293.691,835.29
(-) 0.31
42.1621.29
1130.001130.00
(•) 0.:31
15.81 2351.689.40 1865-98
S ou rce ;-— !) National Savings Organisation, Panaji.ii) National Savings Organisation, Ahirjedabad.
230
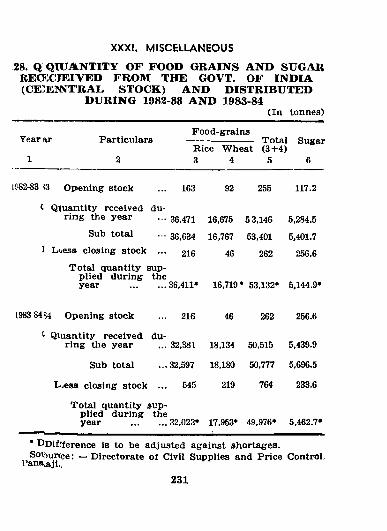
XXXI. MISCELLANEOUS
28. Q QIUANTITY OF FOOD GRAINS AND SUGAR RECECIEI'VED FROM THE GOVT. OF INDIA (CE^E^NTRAL STOCK) AND DISTRIBUTED
DURING 1982-88 AND 1983-84(In tonnes)
Year ar Particulars
1 2
F ood-grains----------------------- Total
R ice W heat (3+4) 3 4 5
Sugar
6
1982-83 3 Opening stock 163 92 255 117.2
t Q^uantity received dur ing the year 36,471 16,675 53,146 5,284.5
Sub total 36,634 16,767 53,401 5,401.71 L«jes» closing stock ... 216 46 262 256.6
T ota l quantity supplied during the year ............... 36,411* 16,719* 53,132* 5,144.9*
1983 84 S4 Opening stock 216 46 262 256.6
t Qiuaiitity received during the year 32,381 18,134 50,515 5,439.9
Sub total 32,597 18,180 50,777 5,696.5
L^ess closing stock ... 545 219 764 233.6
T otal quantity supplied during the year ............... 32,023* 17,953* 49,976* 5,462.7*
* DDifiference is to be adjusted against shortages.Soijurcce: — Directorate ot Civil Supplies and P rice Control,
V'anajajl..
231
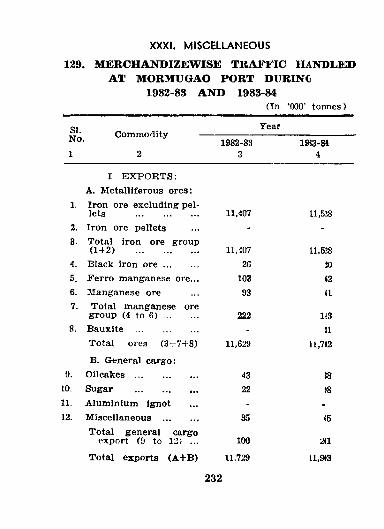
129. MERCHANDIZEWISE TRAFFIC HANDUSD AT MORMUGAO PORT DURING
1982-83 AND 1983-84(In ‘000’ tonnes)
XXXI. MISCELLANEOUS
qiComm odity
Year
1982-83 19J3-843 4
I E X P O R T S :A. M etalliferous ores:
1. Iron ore excluding pellets .......................... 11,407 11,528
2. Iron ore pellets3. Total iron ore group
(1+2) .......................... 11,407 11,5384. Black iron o r e .............. 26 20
5. F erro manganese ore... 103 <26 . Manganese ore ... 93 <17. Total manganese ore
group (4 to 6 ) .............. 222 1438 . Bauxite ......................... - Jl
T otal ores (3+7+8) 11,629 ll,7«2
B. General cargo:9. Oilcakes ......................... 43 J8
10. Sugar ......................... 22 }8
11. Alum inium ignot12. M iscellaneous ............. 35 <5
Total general cargo export (9 to 12) ... 100 m
Total exports (A + B ) 11,729 1.1,9«3
232
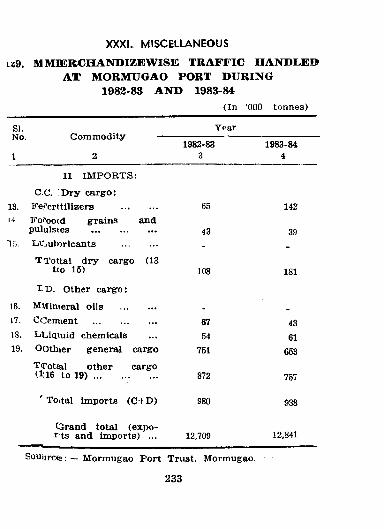
1X9. MMBERCHANDIZEWISE TRAFFIC HANDLED AT MORMUGAO PORT DURING
1982-83 AND 1983-84(In ‘000 tonnes)
XXXI. MISCELLANEOUS
SI.No.
Year
1982-83 1983-841 2 3 4
II IM P O R T S:
C.C. 'D r y ca rg o :13. Fererttilizers ............... 65 14214 Fofoocd grains and
pululstes ........................... 43 39Tf). Ltliubirlcants ... ... - .
TTottal d ry cargo (13 tco 15) 108 181
t D. Other ca rg o :
16. Mviimeral oi]s ...............17. CCeiment .......................... 67 4318. LLiqiuid chem icals 54 6119. Oothier general cargo 751 653
T cotia l other cargo (1(16 to 1 9 ) .......................... 872 757
To.tal im ports (C + D ) 980 938
CGrrand total (expor ts and im ports) ... 12,709 12,841
Souurcfe: — M orm ugao P ort Trust, Mormugao.
233
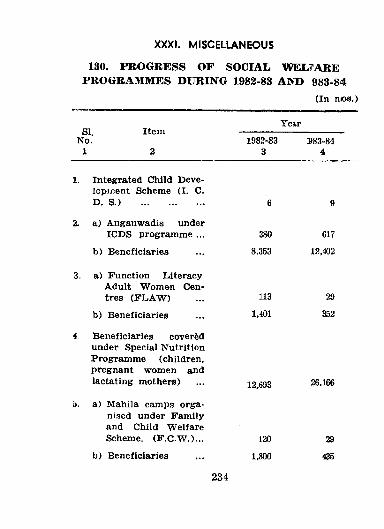
ISO. PROGRESS OF SOCIAL WELFARE PROGRAMMES DURING 1982-88 AKD 983-84
(In n©s.)
XXXI. MISCELLANEOUS
YearSI. Item —
No. 1982-83 B83-841 2 3 4
1. Integrated Child Development Scheme (I. C.D. S.) .......................... 6 9
2. a) Anganwadis underICDS program me ... 380 617
b) Beneficiaries ... 8.353 12,402
3. a) Function LiteracyAdult W om en Centres (F L A W ) ... 113 29
b) Beneficiaries ... 1.401 352
4 Beneficiaries covered under Special Nutrition Program m e (children, pregnant wom en andlactating m others) ... 12 693 26,166
o. a) Mahila camp.s organised under Fam ily and Child W elfareScheme. (F .C .W .)... 120 29
b) Beneficiaries ... 1,800 435
234
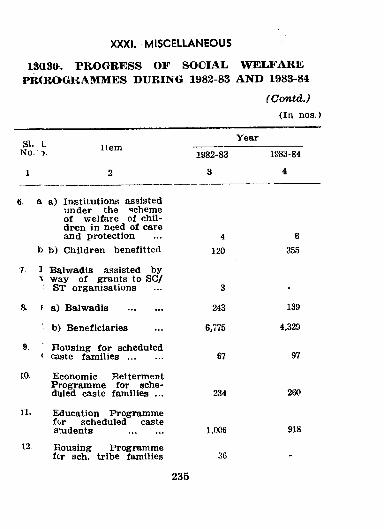
XXXI. MISCELLANEOUS
ISttSO. PROGRESS OF SOCIAL WELFARE PRCROGRAMMES DURING 1982-83 AND 1983-84
(Contd.)(In nos.)
SI. I.No. ■>.
YearItem
1982-83 1983-84
1 2 3 4
6 , a a) Institutions assistedunder the scheme o f w elfare o f children in need o f care and protection ... 4
to b) Children benefitted 120
7. I Balwadis assisted by\ way o f grants to SC/
St organisations ... 3
S. f a) Balwadis ................ 243
' b) B eneficiaries ... 6,775
9. H ousing fo r scheduled< caste fam ilies ................ 67
10. Economic BettermentProgramme for scheduled caste families ... 234
11. Education Programme for scheduled castestudents .............. 1,006
12 Housing Programmefcr sch. tribe families 3G
6355
139
4,329
97
260
918
235
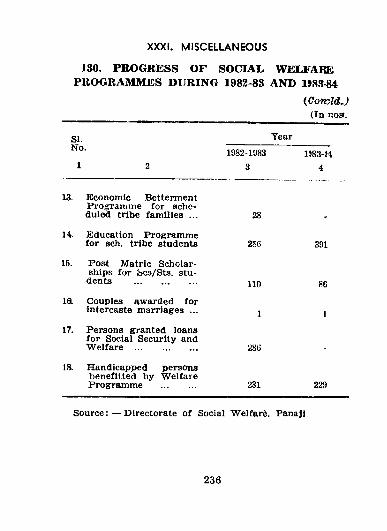
130. PROGRESS OF SOCIAL, WELFARE PROGRAMMES DURING 1982-83 AND 1I83-84
(ComJdJ (In nos.
XXXI. MISCELLANEOUS
SI.No.
Year
1982-1983 1J83-M3 4
13. Econom ic BettermentProgramir.e for scheduled tribe families ... 28
14. Education Program mefor sch. tribe students 286 391
110 86
15. P ost Matric Scholarships fo r bcs/Sts. students ..........................
l a Couples awarded forintercaste marriages ... j
17. Persons granted loans for Social Security andW elfare .......................... 286
18. Handicapped persons benefitted by W elfareProgram me .............. 231 229
S o u rce :— Directorate o f Social W elfare, PanaJJ.
236
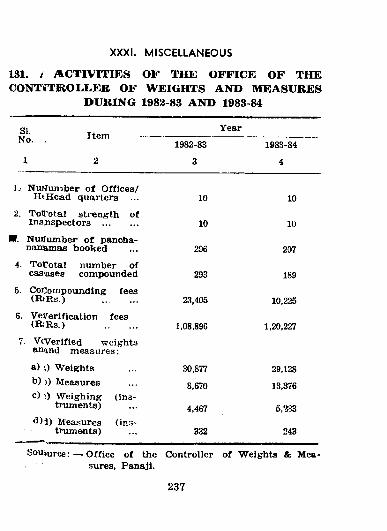
131. i ACTIVITIES OF THE OFFICE OF THE CONTITROLLER OF WEIGHTS AND MEASURES
DURING 1982-83 AND 1983-84
XXXI. MISCELLANEOUS
SINo. Item
2
Year
1982-83
3
1983-84
4
1., NufJumber o f O ffices / H*Head quarters
2 . TolTotal strength o f Insnspectors ...............
■ . NuiTumber o f panoha- nanHmas booked
4. T o fo ta l num ber of
10
10
296
10
10
207
cas'ases com pounded 293 1895. Conom pouiiding
(R fR s.)fees
23,405 10,2256 . VeVerification
( R ; R s . )fees
1,08,896 1,20,2277. VrVerlfied weights
anand m easures:
a) v) W eights 30,877 29,128b ) )) Measures 8,670 13,376c) ’ ) W eigh ing
tT-uments)(ins-
4,467 5,‘iS3•i)i) Measures
truments)(ins-
332 243
S om u rce ;— O ffice o f the Controller o f W eights & Mea-sures, Panaji.
237
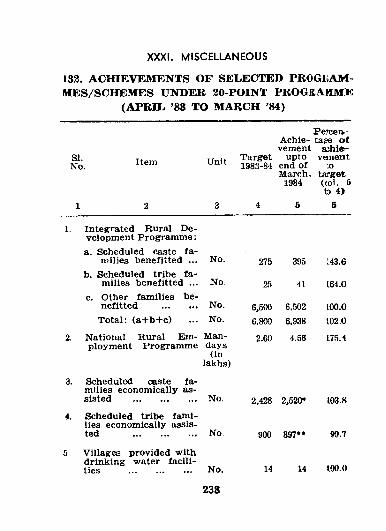
Percerv- Achle- tage o f vement a;hie>-
XXXI. M ISCELUNEO US
132. ACHIEVEMENTS OF SELECTED PROGIiAM-MES/SCHEMES UNDER 20-POINT PROGRAHMJ:
(APRIL. ’88 TO MARCH 84)
No. Unit Target1983-84
upto end o f March,
1984
veaient :o
target (<ol. 8 to 4>
1 2 3 4 6 6
1. Integrated Rural D evelopm ent P rogram m e:a. Scheduled caste fa
m ilies benefitted ... No. 275 395 143.6b. Scheduled tribe fa
m ilies benefitted ... No 2.'’. 41 L64.0c. Other families be
nefitted .............. No. 6,500 6.502 lOO.OT ota l: (a + b + c ) No. 6.800 6,938 102.0
2. National Rural Employm ent Program m e
Man-days(in
lakhs)
2.60 4.56 175. i
3. Scheduled caste fa milies econom ically assisted .......................... No. 2,428 2,520* 103.8
4. Scheduled tribe fam ilies econom ically assisted .......................... No 900 897** 99.7
5 Villages provided with drinliing water facilities .......................... No. 14 14 lOO.O
238
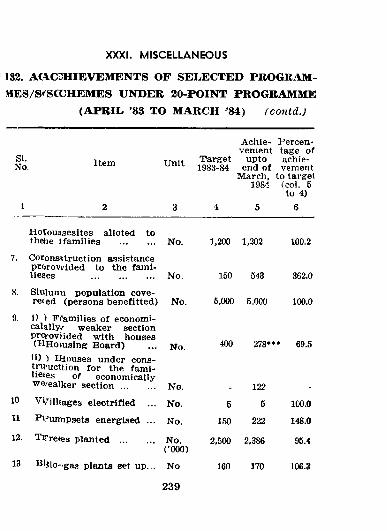
XXXI. MISCELLANEOUS
133. AGlCDHIEVEMENTS OF SELECTED PROGRAM-MGES/St'SCCHEMES UNDER 20-POINT PROGRAMME
(APRIL. ’83 TO MARCH "84) (contd.)
No. Unit Target1983-84
Achievement
upto end o f
March, 1984
Percentage of achievement
to target (col. 5 to 4)
1 2 3 1 5 6
Hotouasesites alloted to thehe l fam ilies No. 1,200 1,202 100.2
7. Coronsstruction assistance prorow ided to the fami- lieses .......................... No. 150 543 362.0
8 . Sluiunji population cove- reced (persons benefitted) No. 6,000 5,000 100.0
9. i) ) Fi'atnilies o f economi- calally/ weaker section prcrovHded w ith houses (H Hoiusing Board) No. 400 278* »• 69.5ti) ) M ouses under cons- tru’ucttion for the fam i- liejes o f econom ically w^eal'ker s e c t io n .............. No. 122
10 Vi/^illiages electrified ... No. 5 5 100.0
11 Pi^mmpsets energised ... No. 150 222 148.0
12. TiTre«83 planted .............. No.( ’000)
2,500 2,886 95.4
13 Kiiio-ga.<) plants set up... No
239
160 170 106.3
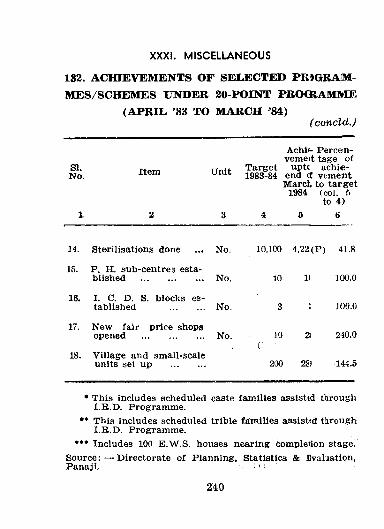
( con cld .J
XXXI. MISCELLANEOUS
132. ACHIEVEMENTS OF SEI.ECTED PKiGRAM-MES/SCHEMES UNDER 20-POINT PROCBAMME
(APRIL. '83 TO MARCH "84)
SI.No. Item Unit
Achit- Percen- vemeit tage of
T arget uptc achie- 1983-84 end (f vement
March to target 1984 (col. 5
to 4)4 6 i>
14. Sterilisations done ... No.
15. P. H. sub-centres established .......................... No.
16. I. C. D. S. blocks established .............. No.
17. New fair price shopsopened .......................... No.
18. Village and small-scaleunits set up ..............
10,100 4,22(P) 41.8
10 11 100.0
3 : ]00.0
10 a 240.0(;
200 2S) 144.5
• This includes scheduled caste fam ilies assisttd tirough I.R .D . Program me.
•* This includes scheduled trible fam ilies assisttd throughI.R .D . Program me.
»*♦ Includes 100 E.W .S. houses nearing compleiion stage!Source: — D irectorate of Planning, Statistics & Evalaation,Panaji.
240
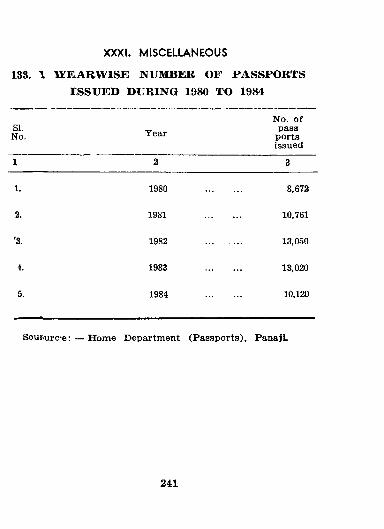
133. 1 WE.ABWISE NUMBER OF PASSPORTS ISSUED DURING 1980 TO 1984
XXXI. MISCELLANEOUS
SI.No. Year
No. o f pass
ports Issued
1 2 3
1. 1980 8,672
2. 1981 10,761
'3. 1982 13,050
4. 1983 13,020
5. 1984 10,120
Soui>urc;e: — H om e Departm ent (P assports), Panaji.
241
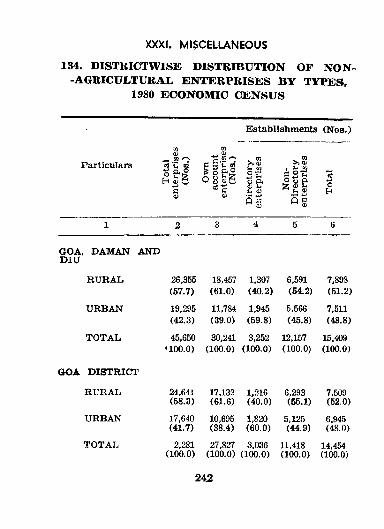
XXXI. MISCELLANEOUS
134. DISTRICTWISE DISTRIBUTION OF NON- -AGRICULTUBAL. ENTERPRISES BY TYPES,
1980 ECONOMIC CENSUS
Establishments (Noa.)
Particulars
TO<L>
| l |Eh « Sa<0
m
H (n tQo 8 s g
0)
. n >> 0) (i mB uU Q<5) Pt-. <D
1 hi IQd o'E^ <u ET
s ^ " 0)
soH
1 2 3 4 5 6
GOA. DAMAN AND DIU
RURAL. 26.355(57.7)
18,457(61.0)
1,307(40.2)
6,591(54.2)
7,898(51.2)
URBAN 19,295(42.3)
11,784(39.0)
1,945(59.8)
5,566(45.8)
7,511(48.8)
TOTAL 45,650’ 1(X).0)
30,241(100 .0 )
3,252(100 .0 )
12,157( 100 .0)
15,409(100.0 )
GOA D ISTRICT
RURAL 24,641(58.3)
17,132(61.6)
1,216(40.0)
6,293(55.1)
7,509(52.0)
URBAN 17,640(41.7)
10,695(38.4)
1,820(60.0)
5,125(44.9)
6,945(48.0)
TOTAL 2,281(100 .0 )
27,827(100.0 )
3,036(100 .0 )
11,418(100 .0 )
14,454(100.0)
242
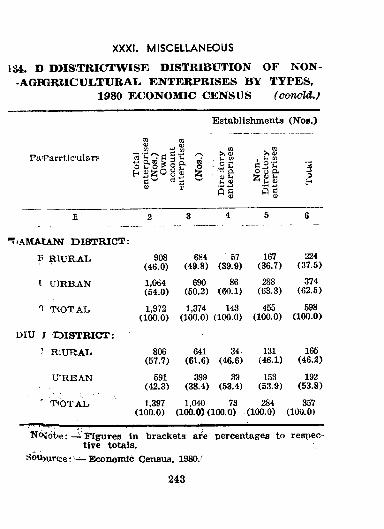
XXXI. MISCELLANEOUS134. D d >is ;t r i c t w i s e d is t r ib u t io n o f n o n -
-AGFGRIICULTURAL ENTERPRISES BY TYPES, 1980 ECONOMIC CENSUS (concld.)
Pa'Parrtic;ulan<
m<oa
O S o p OC3
4)
ifi<DU1 ss &a1'
Establishments (N os.)
>1 ® >> <u. u <D , s-i m■ 34■ g a e - o' -fa ® .is 2 ^ S c S c
1 2 3 4 5 6
TfA M AtA W D IS T R IC T ;
f RIURAL. 908(46.0)
684(49.8)
67(39.9)
167(36.7)
224(37.5)
I U]RB.AN 1,064(54.0)
690(50.2)
86( 6o ;i)
288(63.3)
374(62.6)
T TCOTAL. 1,972( 100 .0 )
1,374(100 .0 )
143(100 .0)
455(100.0 )
598(100 .0 )
DIU J E 3IST R IC T :
' R .U R A L 806(57.7)
641(61.6)
34(46.6)
131(46.1)
165(46.2)
UrRBAN 591(42.3)
399(38.4)
39(53.4)
153(53.9)
192(53.8)
' T^OTAL, 1,397 (100 .0 ) 1
1,040 73 (100.0) (100.0 )
284(100.0 )
357(100.0 )
"Nofotie: — Figures in brackets are percentages to respective totals.
Sbiijurcse; Econom ic Cenatis, 19807
243
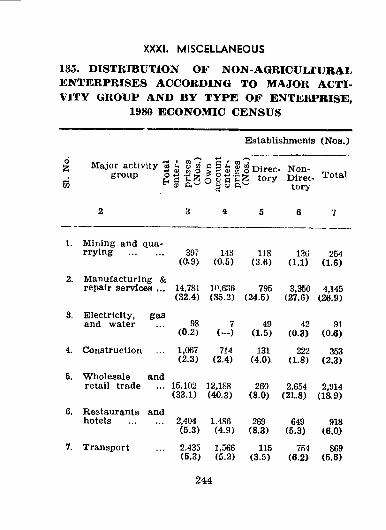
185. DISTRIBUTION OF NON-AGRICUUURAL ENTERPRISES ACCORDING TO MAJOR ACTIVITY GROUP AND BY TYPE OF ENTERPRISE,
1980 ECONOMIC CENSUS
Establishmenis (Noa.)
XXXI. MISCELLANEOUS
I M ajor activity 3 S 3 g § i f ' i o i r e c Non- ^ ,^ group Totalta <1) ft '- ' y O' lory
2 3 5 6 7
1. M ining and quarrying .............. 397
(a 9 )143
(0.5)118
(3.6)13(j
(1 .1 )254
(1.6 )2 . Manufacturing &
repair services ... 14.781(32.4)
10,636(35.2)
795(24.5)
3,350(27.6)
4,145(26.9)
3. Electricity, and water
gas98
(0 .2 )7
( - )49
(1.5)42
(0.3)91
(0 .6 )
4. Construction 1,067(2.3)
714(2.4)
131(4.0X
223(1.8 )
353(2.3)
5. W holesale retail trade
and15,102(33.1)
12,188(40.3)
260(8 .0 )
2,654(21 .8 )
2,914(18.9)
6. Restaurantshotels
and2,404(5.3)
1.486(4.9)
269(8.3)
649(5.3)
918(6 .0)
7. Transport 2,435(5.3)
1,566(5.2)
115(3.5)
754(6 .2 )
869(5.6)
244
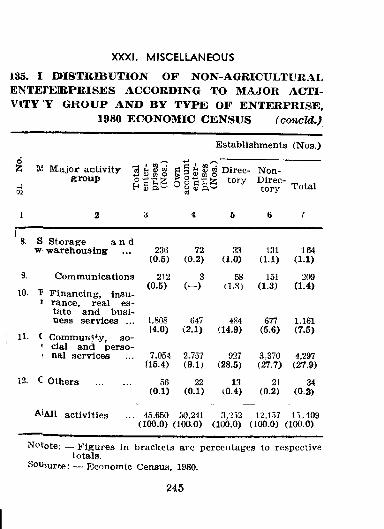
i35. I DISTRIBUTION OF NON-AGRICULTURAI. ENTEFEIRPRISES ACCORDING TO MAJOR ACTIVITY’¥ GROUP AND BY TYPE OF ENTERPRISE,
1980 ECONOMIC CENSUS (concTd.)
Establishments (N os.)
XXXI. MISCELLANEOUS
K M a jor activity grou p
Direc- Non-Totalt-i <D p,'^ O' tory iotai
1 2 3 4 5 6 7
* 8. S Storage a n dw w arehousing 236 72 33 131 164
(0.5) (0 .2 ) (1.0) (1.1 ) (1 .1)9. Com m unications 212 3 58 151 209
(0.5) ( - ) (1.8 ) (1.3) (1.4)10. I F inancing, insu-
J ranee, real estate and business services ... 1,808 647 484 677 1.161
(4.0) (2 .1) (14.9) (5.6) (7.5)ll . C Com m urijV, so-
' cial and perso-• nal services 7,054 2.757 927 3,370 4,297
(15.4) (9.1) (28.5) (27.7) (27.9)12. C Others .............. 56 22 13 21 34
(0 .1) (0 .1 ) (0.4) (0 .2 ) (0 .2 )
AiAll activities 45,650 S0.241 3.‘2 32 12.157 l i ,409( 100 .0) (100 .0 ) (100.0 ) (100.0 ) (100 .0 )
Notote; — Figures in brackets are percentages to respective totals.
Soiiiurce: — Econom ic Census, 1980.
245
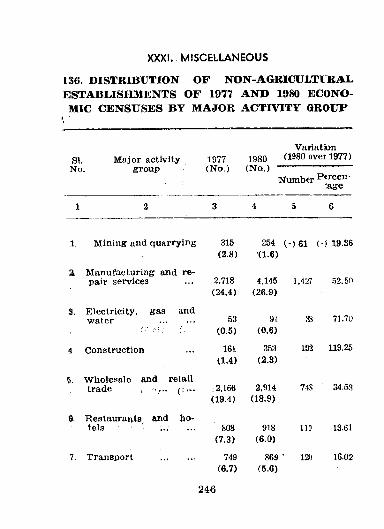
IS6. DISTRIBUTION OF NON-AGRICULTIRAL ESTABLISHMENTS OF 1977 AND 1980 ECONOMIC CENSUSES BY MAJOR ACTIVITY GROUP
XXXI. MISCELLANEOUS
SI. M ajor activity No. group
1977(N o.)
Variation 1980 (1980 over 1977) (N o.)
Number P«rcen- lage
1 2 3 4 5 6
1 Mining etnd quarrying 315(2 .8 )
254(1 .6 )
(- )6 1 (-j 19.36
Z Manufacturing and repair services ... 2,718
(24.4)4,145
(26.9)1,427 .'52.50
3. Electricity, gaa and water .............. .53
(0.5)91
(0 .6 )38 71.70
4 Construction 161(1.4)
353(2.3)
192 119.25
6 . W holesale and retail trade ( ! . , . 2,166
(19.4)2,914
(18.9)74S 34.53
6 Restaurants, and hotels ' ... 808
(7.3)918
(6 .0 )110 13.61
7. Transport .............. 749(6.7)
246
869(5.6)
m 16.02
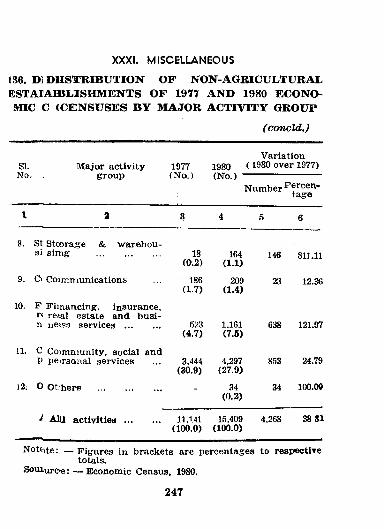
136. D3 DIIS'ITRIBUTION OF NON-AGRICULTURAL ESTAIAffiLISHMENTS OF 1977 AND 1980 ECONOMIC C <CE1NSUSES BY MAJOR ACTIVITY GROUP
(concld,)
XXXI. MISCELLANEOUS
SI.No.
M ajor activity group
1977(N o.)
Variation 1980 ( 1980 over 1977) (N o.) ■■ -
Number ventage
\ 2 8 4 5 6
8. St Stcorage & warehou- si sim g .......................... 18
(0 .2 )164
(1 .1)146 811.11
9. C' Co>mniunication& 186(1.7)
209(1.4)
23 12.36
10. F Fiinancing, insurance, r< ratal estate and busi- n ne>.sis services ... 523
(4.7)1.161(7.5)
638 121.97
11. C C om m unity, social and P pe-rsonal services 3,444
(30.9)4,297
(27.9)853 24.79
) 2; O Ot hers - 34(0 .2 )
34 100.00
i AUi a c t iv i t ie s ............... 11,1.41( 100.0 )
15,409(100.0 )
4,268 38 Si
Notf)te: — Figures in brackets are percentages to respectiTe totals.
Souiurcre: — Econom ic Census, 1980.
247
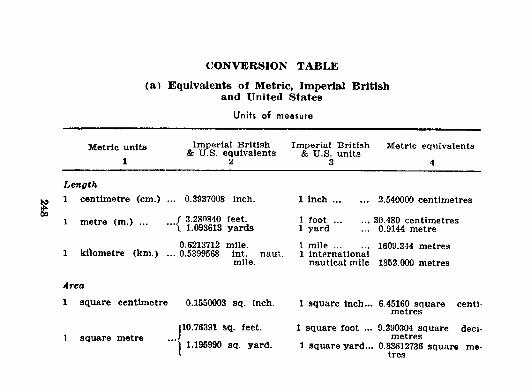
(a) Equivalents of Metric, Impeiial British and United States
Units of measure
CONVERSION TABLE
M etric units 1
Imperial British & U.S. equivalents
2
Imperial British & U.S. units
3
Metric equivalents
Length1 centimetre (cm .)
1 metre (m .) ...
1 kilometre (km .)
O.S937008 inch.
280840 feet. 093613 yards
0.6213712 mile. 0.5399568 int. naut.
mile.
1 I n c h ............. 2.540000 centimetres
1 f o o t .............. 30.480 centimetres1 yard ... 0.9144 metre
1 m i l e .............. 1609.344 metres1 international
nautical mile 1862.000 metres
Area
1 square centimetre 0.1550003 sq. Inch.
I square metre110.76391 sq. feet.
1.195990 sq. yard.
1 square inch... 6.45160 square centimetres
1 square foot ... 9.290304 square decimetres
1 square yard... 0.83612736 square metres
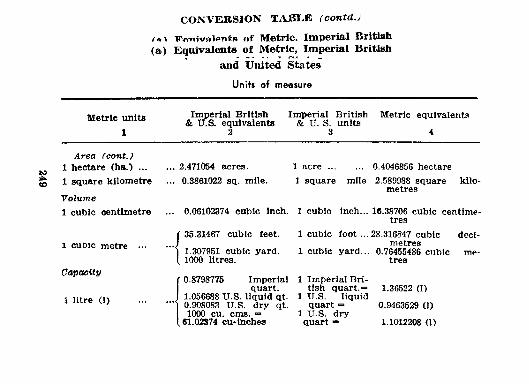
TT«niv»lPTit,B nf Metric. Imperial British (a) Equivalents of Metric, Imperial British
and United States Units of measure
CONVERSION TAB LE (co n td j
M etric units 1
Im perial British Im perial British Metric equivalents & U.S. equivalents & U. S. units
2 3 4
Area (con t.)1 hectare (ha.) ...1 square kilom etre
Volume1 cubic centimetre
1 cuDic metre •••
Oapaoity
1 litre (1)
2.471(®4 acres.0.3861022 sq. mile.
0.06102374 cubic Inch.
35.31467 cubic feet.
1.307951 cubic yard. 1000 litres.
0.8798775 Imperial quart.
1.056688 U.S. liquid qt. 0.908083 U.S. dry qt. 1000 cu. cms. =
61.02S74 eu*tnchea
1 a c r e ............... 0.4046856 hectare1 square mile 2.589988 square
metreskllo-
1 cubic inch... 16.38706 cubic centimetres
1 cubic foot ...28.316847 cubic metres
1 cubic yard... 0.76455486 cubic tres
1 Imperial British quart. = 1.36522 (1)
1 U.S. liquidquart = 0.9463529 (1)
1 U.S. dryquart « 1.1012208 (1)
deci-
me-
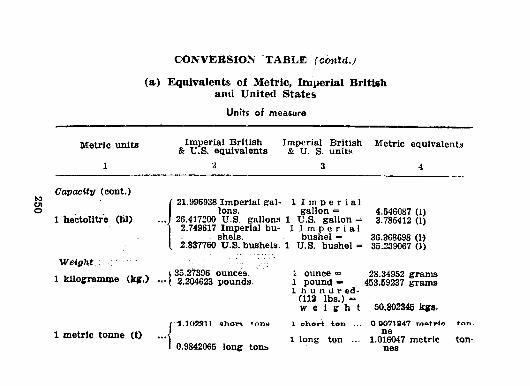
(a) Equivalents of Metric, Imperial British and United States
Unih of measure
CONVERSION 'TABLE- (contd.)
Metric units
1
Imperial British & U.S. equivalents
Imperial British & U. S. units
Metric equivalents
Capacity (cont.)
1 hectolitre (hi)
Weight :1 kilosTramme (KgO
1 metric tonne (t)
21.996938 Im perial gal- 1 I m p e r i a lIons. gallon = 4.546087 (1)
26.417200 U.S. gallons 1 U.S. gallon = 3.785412 (1)2.749617 Im perial bu- 1 I m p e r i a l
shels. bushel = 36.368698 (1)2.837760 U.S. bushels. 1 U.S. bushel = 35.239067 (J)
i 35.27396 ounces. 2.204623 pounds.
1 ounce ■= 28.34952 grams1 pound - 453.59237 grams1 h u n d r ed-
(112 lbs.) “w e i g h t 50,802345 kgs.
■l.Kiaan ohorx tons
9842065 long tont>
1 ohort ton
1 long ton
0 D071&d7 motrio ne
1.016047 metric nes
ton -
ton-
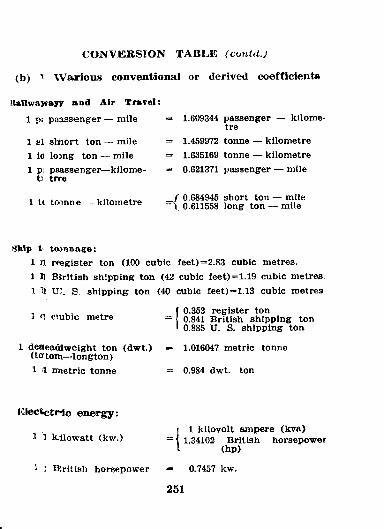
C O N VER SIO N TA B LE (contd.J
(b) W ariou s conventional or derived coefficients
IlailwaKayy and A ir T ravel:1 pi paassenger — m ile
1 Bl sKiont ton — mile1 ic loDng ton m ile1 pi paassenger—kilom e-
ti trre
1 tt tronne — kilom etre
1.609344 passenger — kilom etre
1.459972 tonne — kilom etre 1.635169 tonne — kilom etre 0.621371 passenger — mile
0.684945 short ton — mile 0.611558 long ton — mile
iihip t toinnagre:1 n reegister ton (100 cubic fee t)=2.83 cubic metres.1 11 BJrltish shipping ton (42 cubic fe e t )=1.19 cubic metres.1 ^ UT. S. sh ipping ton (40 cubic fe e t)=1.13 cubic m etres
1 n ciubic metre
1 deaea<aweight ton (dw t.) ( to tom—lon gton )1 1 mietric tonne
_ f 0.353 register ton— 0.841 British sh ipping ton
' 0.885 U. S. shipping ton
— 1.016047 m etric tonne
= 0.984 dwt. ton
Ktectctrio energy;
1 1 fcilow att (kw .)1 k ilovolt am pere (kva)
1.34102 British horsepower (hp)
1 1 Bjritish horsepower - 0.7457 kw.
251
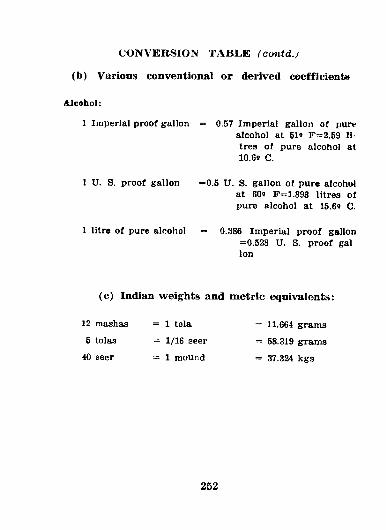
CONVERSION TABLE (contd.J
(b) Various conventional or derived coefficiente
Alcohol:
1 Imperial proof gallon 0.57 Imperial g-allon of pure alcohol at 51e F=2.69 litres o f pure alcohol at 10.69 C.
1 U. S. proof gallon =0.5 U. S. gallon o f pure alcohol at 60s P=1.893 litres of pure alcohol at 15.6s C.
1 litre o f pure alcohol 0.386 Im perial proof gallon =0.528 U. S. proof gal Ion
(c) Indian weights and metric equivalents:
12 mashas
5 tolas
40 seer
= 1 tola
= 1/16 seer
= 1 mound
= 11.664 grama
= 58.319 grams
= 37.324 kgs
252
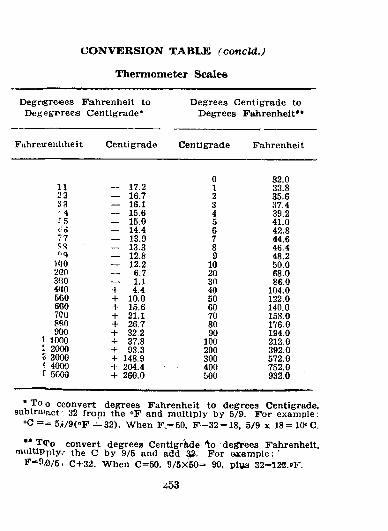
CO NVERSIO N TABIJE (concld.)
Thermometer Scales
D egrgreees Fahrenheit to Degrees Centigrade toD eg«gr(rees Centigrade* Degrees Fahrenheit**
Fiihrerenhheit Centigrade Centigrade Fahrenheit
0 32.0n — 17.2 1 33.822 — 16.7 2 35.6S3 — 16.1 3 37.4' 4 — 15.6 4 39.2f 5 — 15.0 5 41.0d d — 14.4 6 42.877 — 13.9 7 44.6SS — 13.3 8 46.4
— 12.8 9 48.2100 — 12.2 10 50.02G0 — 6.7 20 68.0•300 — 1.1 30 86.04(i0 + 4.4 40 104.0560 + 10.0 50 122.0660 + 15.6 60 140.07C0 + 21.1 70 158.0BRO + 26.7 80 176.0900 + 32.2 90 194.0
1 1000 + 37.8 100 212.0i 2000 + 93.3 200 392.0S 3000 + 148.9 300 572.0 4000 + 204.4 400 752.0
f 5000 + 260.0 500 932.0
• To o cconvert degrees Fahrenheit to degrees Centigrade, 3UDtra<act' 32 froni the “F and m ultiply by 5/9. F or example:
" C = = 5,»/9(oF — 32). W hen F ,= 50, F —32 = 18, 5/9 x 18=10” C.
** T'To convert degrees C entigride l o deg^rees Fahrenheit, m ultippiy/ the C by 9/5 and add F or exam ple: '
F = 9 /9 /5 i C+32. W hen C=50, 9/5X50= 90, plys 32=122.«F.
^53