Embed Size (px)
Citation preview
Close to you worldwide
RAK Ceramics. Copyright 2015.
CONTENTS
2
ABOUT RAK CERAMICS
‣ Brief Corporate History
‣Global Capacity by Segment
‣Market Positioning: 4th in Tiles & 11th in Sanitaryware by Output
‣ Focus Markets: UAE, KSA, India & Bangladesh
2015 RESULTS
‣ A Year of Investment and Divestment: Operational Highlights
‣ Progression against Value Creation Plan
‣ Financial Performance
‣ Focus Markets Sales Trends
‣ Segment Margins and Trends
STRATEGY AND OUTLOOK
‣ 2016 Priorities
‣ Capacity Expansion: Costs and Timelines
‣GCC Building Environment Remains Supportive
‣Non Core Asset Sales to Continue
RAKCEC STOCK
‣ Shareholder Composition and Stock Performance
‣ Valuation vs. Peers
‣ Analyst Coverage and Consensus Estimates
This information contained in the enclosed presentation summarizes preliminary and introductory information on RAK Ceramics PSC (the Company). This presentation has been prepared for information purposes only and is not and does not form part of or constitute any prospectus, offering memorandum or offering circular or offer for sale or solicitation of any offer to subscribe for or purchase or sell any securities nor shall it or any part of it form the basis of or be relied on in connection with any credit evaluation or third party evaluation of any securities or any offerings or contract or commitment whatsoever.
The information contained herein has been prepared by the Company. Some of the information relied on by the Company is obtained from sources believed to be reliable but does not guarantee its accuracy or completeness. All potential recipients of the enclosed presentation are expected to be aware that the information contained herein is preliminary as of the date hereof, supersedes any previous such information delivered and will be superseded by any such information subsequently delivered. The information contained herein is subject to change without notice. The Company is under no obligation to update or keep current the information contained herein. No person shall have any right of action (except in case of fraud) against the Company or any other person in relation to the accuracy or completeness of the information contained herein.
Some of the information in this presentation may contain projections or other forward-looking statements regarding future events or the future financial performance of The Company. These forward-looking statements include all matters that are not historical facts. The inclusion of such forward-looking information shall not be regarded as a representation by the Company or any other person that the objectives or plans of the Company will be achieved. Future events are subject to various risks which cannot be accurately predicted, forecasted or assessed. No assurance can be given that future events will occur or that the company’s assumptions are correct. Actual results may differ materially from those projected and past performance is not indicative of future results. The Company undertakes no obligation to publicly update or publicly revise any forward-looking statement, whether as a result of new information, future events or otherwise. Accordingly all potential recipients are expected to conduct their own due diligence on the information provided.
These materials are confidential and are being submitted to selected recipients only for the purpose described above. They may not be taken away, reproduced (in whole or in part), distributed or transmitted to any other person without the prior written consent of the Company. These materials are not intended for distribution to, or use by any person or entity in any jurisdiction or country where such distribution or use would be contrary to local law or regulation and must not be acted on or relied on by persons who are not relevant persons. If this presentation has been received in error it must be returned immediately to the Company.
Disclaimer

ABOUT RAK CERAMICS
RAK Ceramics. Copyright 2015.
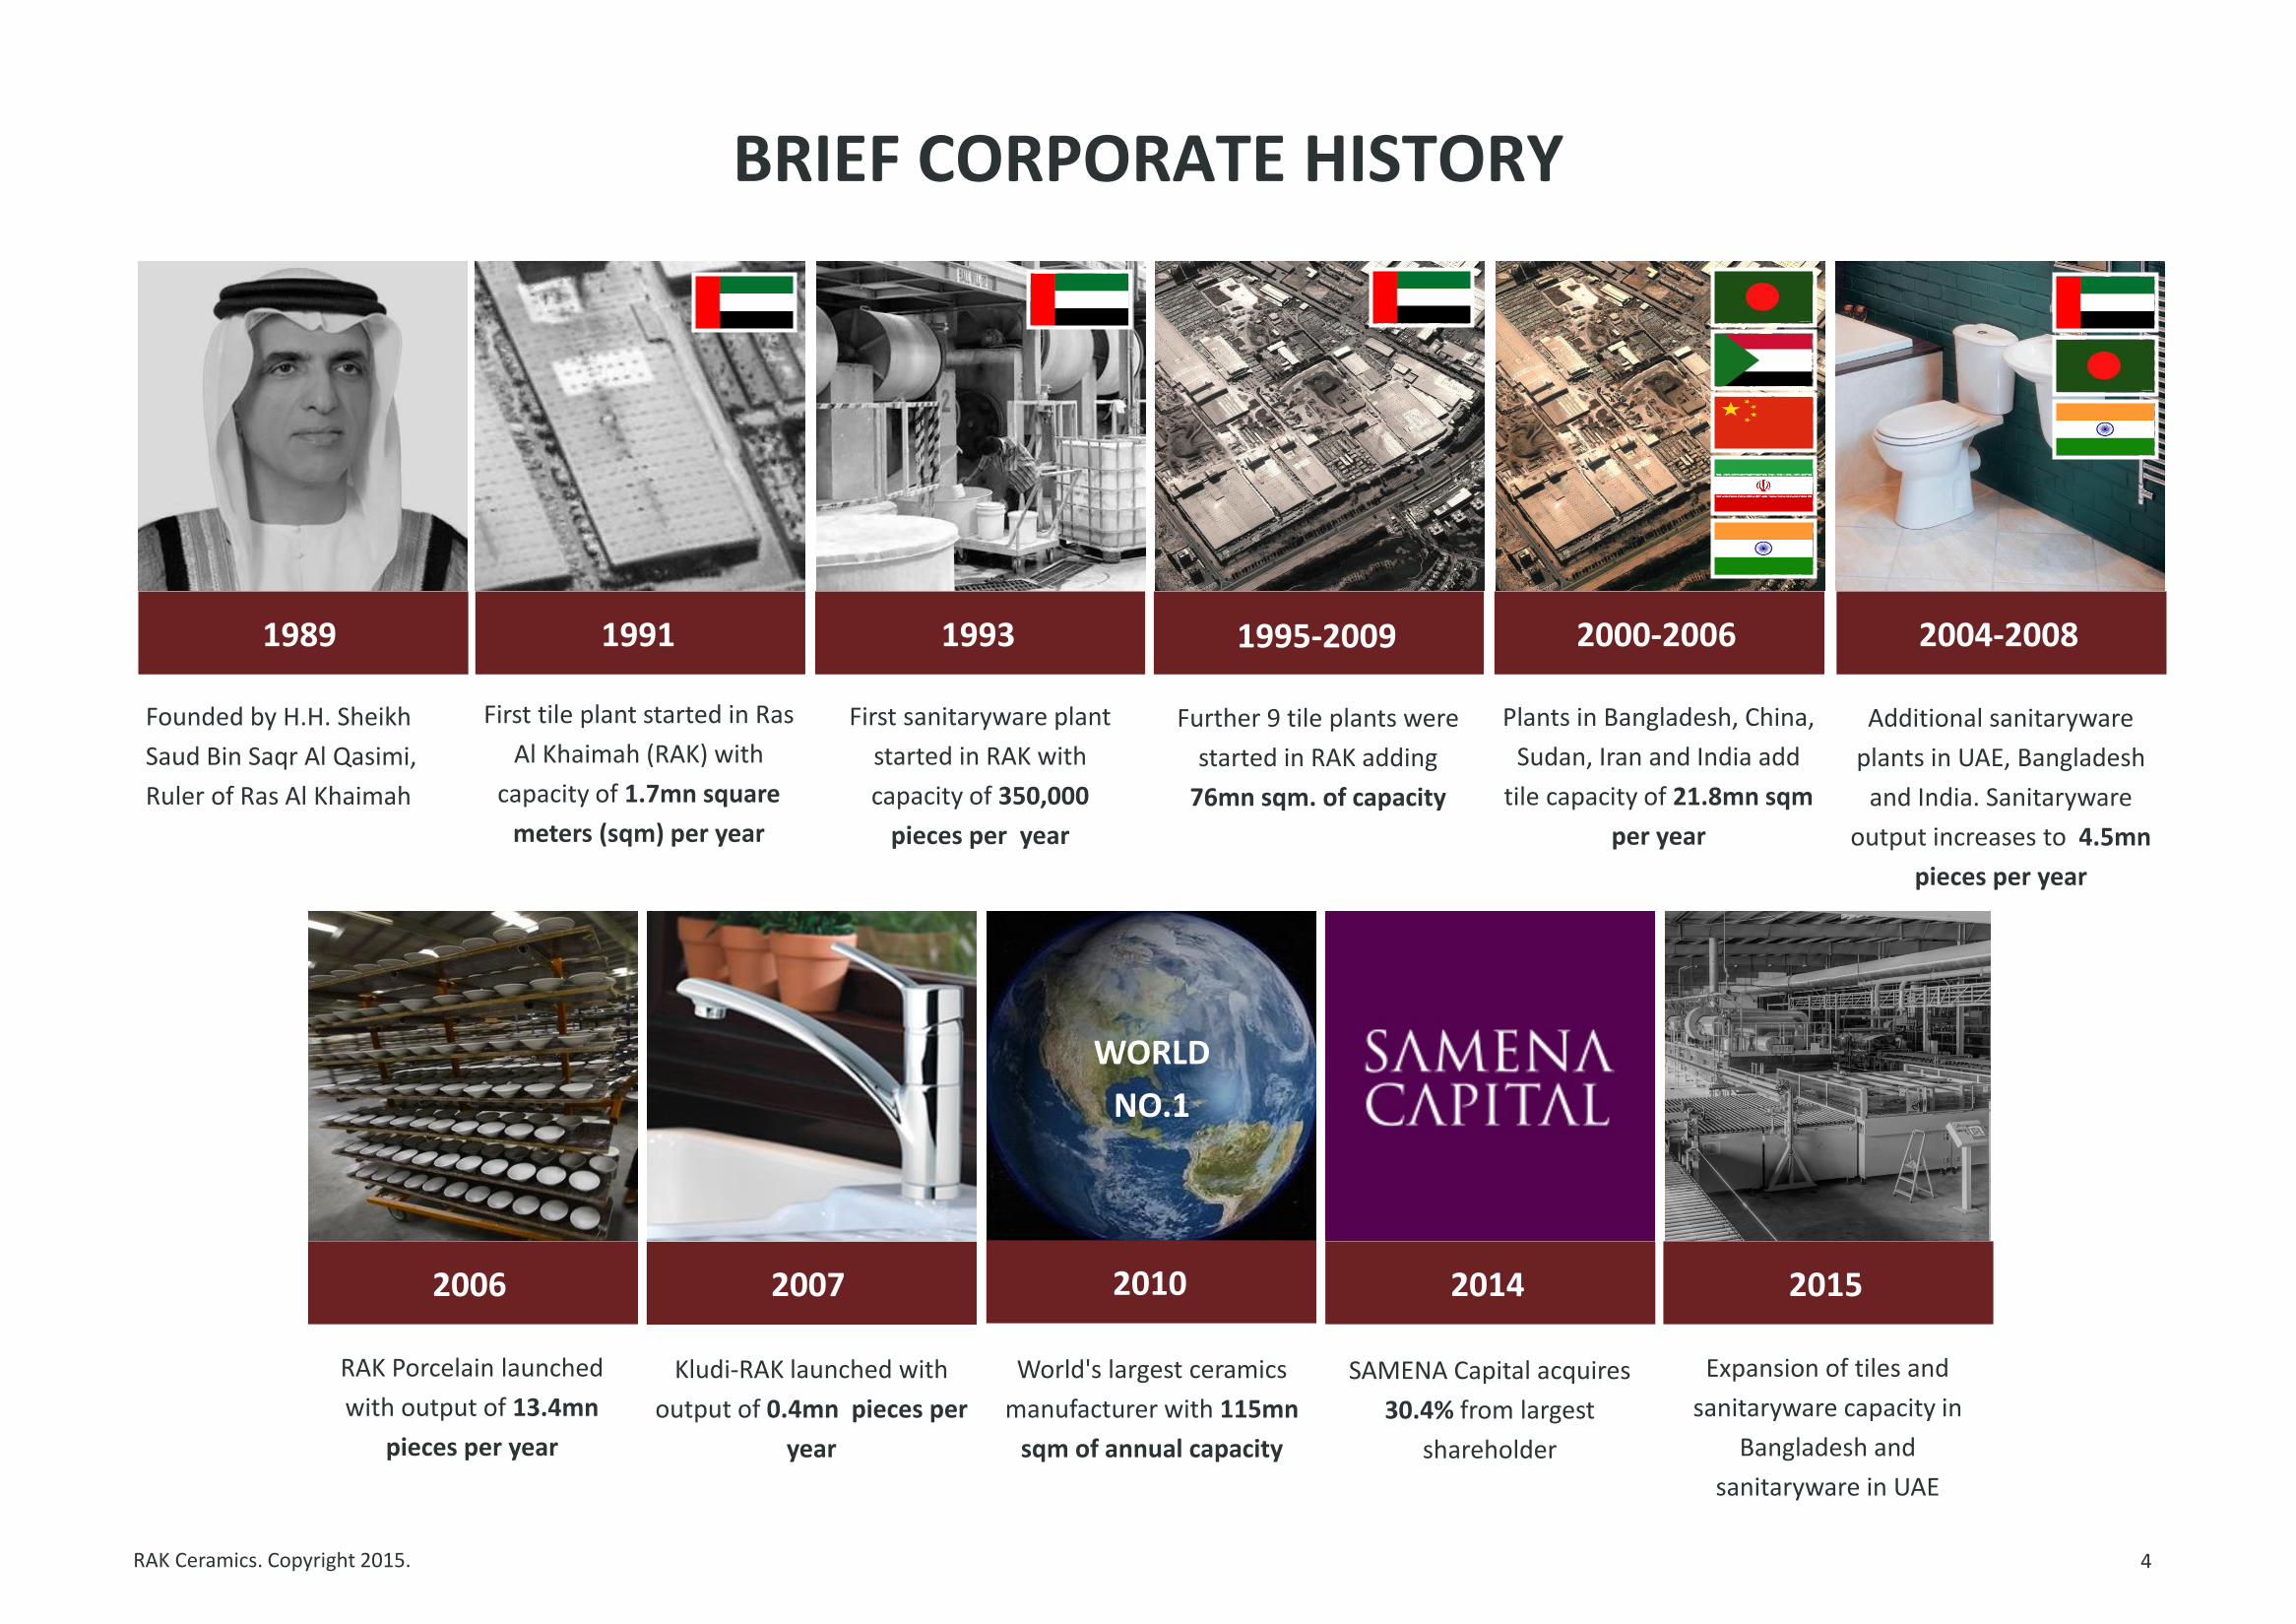
BRIEF CORPORATE HISTORY
4
Founded by H.H. Sheikh
Saud Bin Saqr Al Qasimi,
Ruler of Ras Al Khaimah
1989
RAK Porcelain launched
with output of 13.4mn
pieces per year
2006
First tile plant started in Ras
Al Khaimah (RAK) with
capacity of 1.7mn square
meters (sqm) per year
Kludi-RAK launched with
output of 0.4mn pieces per
year
2007
First sanitaryware plant
started in RAK with
capacity of 350,000
pieces per year
Further 9 tile plants were
started in RAK adding
76mn sqm. of capacity
WORLD
NO.1
1991 1993 1995-2009
Additional sanitaryware
plants in UAE, Bangladesh
and India. Sanitaryware
output increases to 4.5mn
pieces per year
2004-2008
Plants in Bangladesh, China,
Sudan, Iran and India add
tile capacity of 21.8mn sqm
per year
2000-2006
SAMENA Capital acquires
30.4% from largest
shareholder
2014
World's largest ceramics
manufacturer with 115mn
sqm of annual capacity
2010
Expansion of tiles and
sanitaryware capacity in
Bangladesh and
sanitaryware in UAE
2015
RAK Ceramics. Copyright 2015.
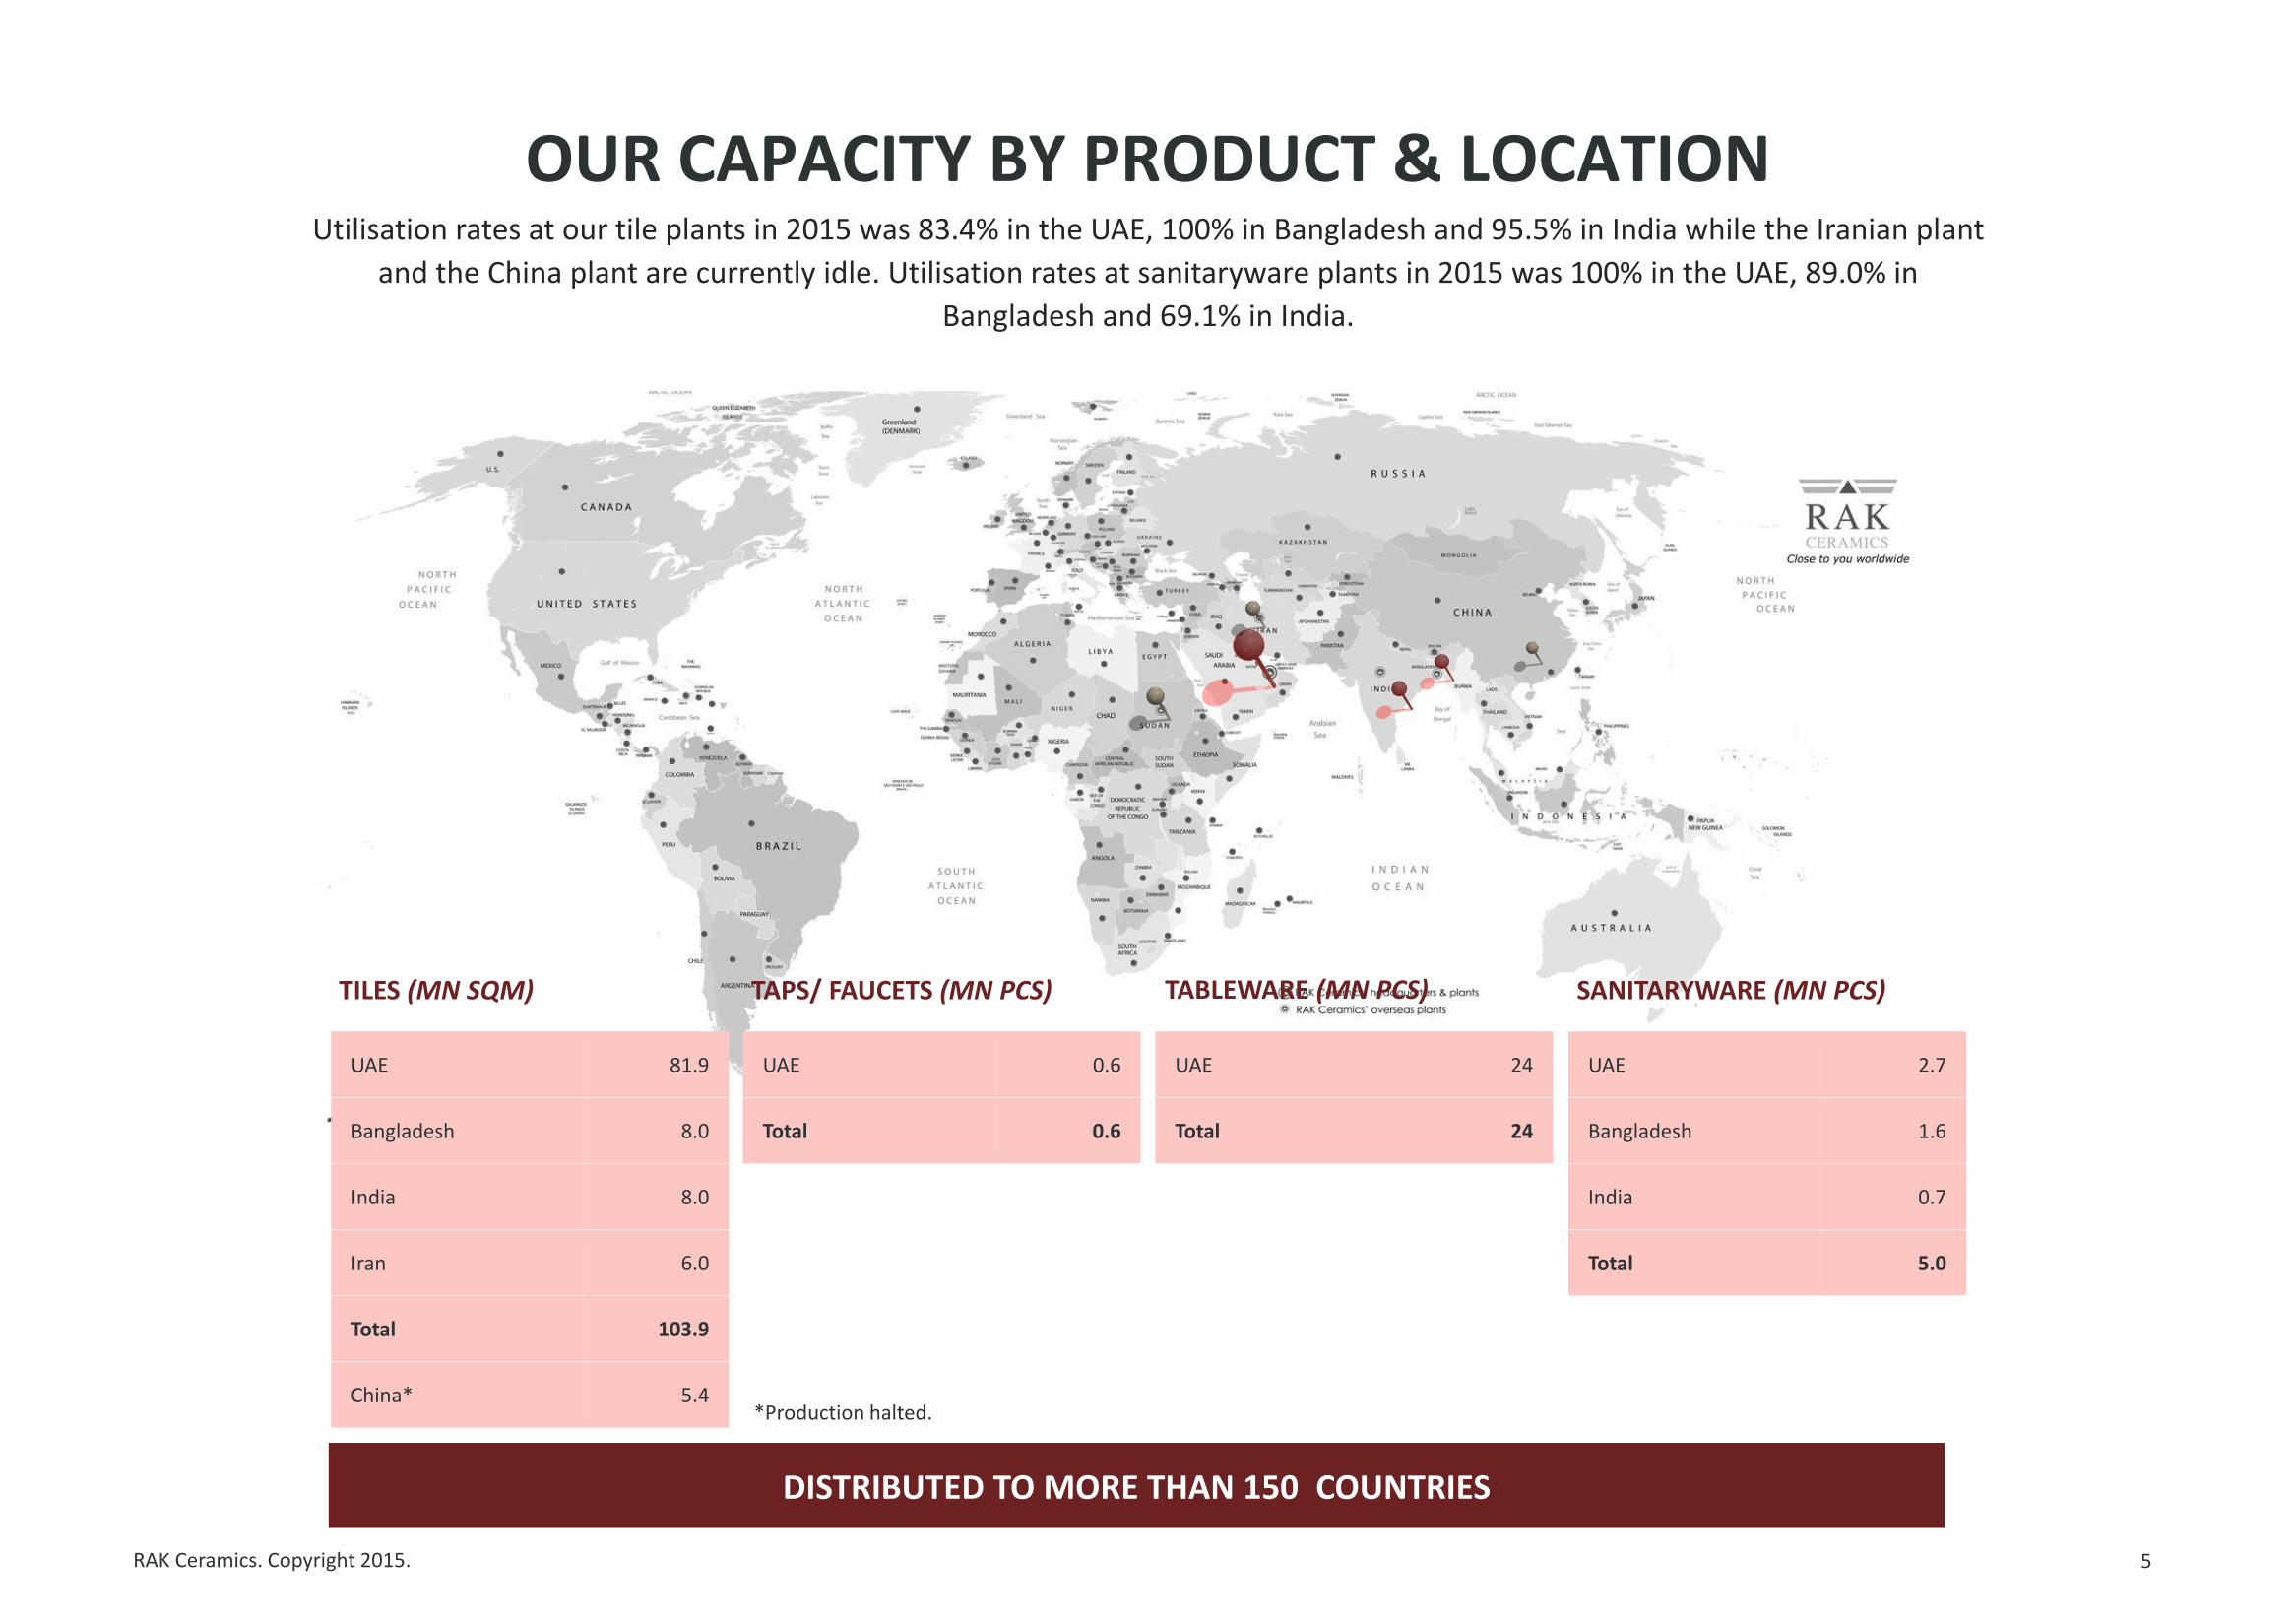
OUR CAPACITY BY PRODUCT & LOCATION
5
DISTRIBUTED TO MORE THAN 150 COUNTRIES
UAE 81.9
Bangladesh 8.0
India 8.0
Iran 6.0
Total 103.9
China* 5.4
TILES (MN SQM)
UAE 0.6
Total 0.6
TAPS/ FAUCETS (MN PCS)
UAE 24
Total 24
TABLEWARE (MN PCS)
UAE 2.7
Bangladesh 1.6
India 0.7
Total 5.0
SANITARYWARE (MN PCS)
*Production halted.
Utilisation rates at our tile plants in 2015 was 83.4% in the UAE, 100% in Bangladesh and 95.5% in India while the Iranian plant
and the China plant are currently idle. Utilisation rates at sanitaryware plants in 2015 was 100% in the UAE, 89.0% in
Bangladesh and 69.1% in India.
RAK Ceramics. Copyright 2015.
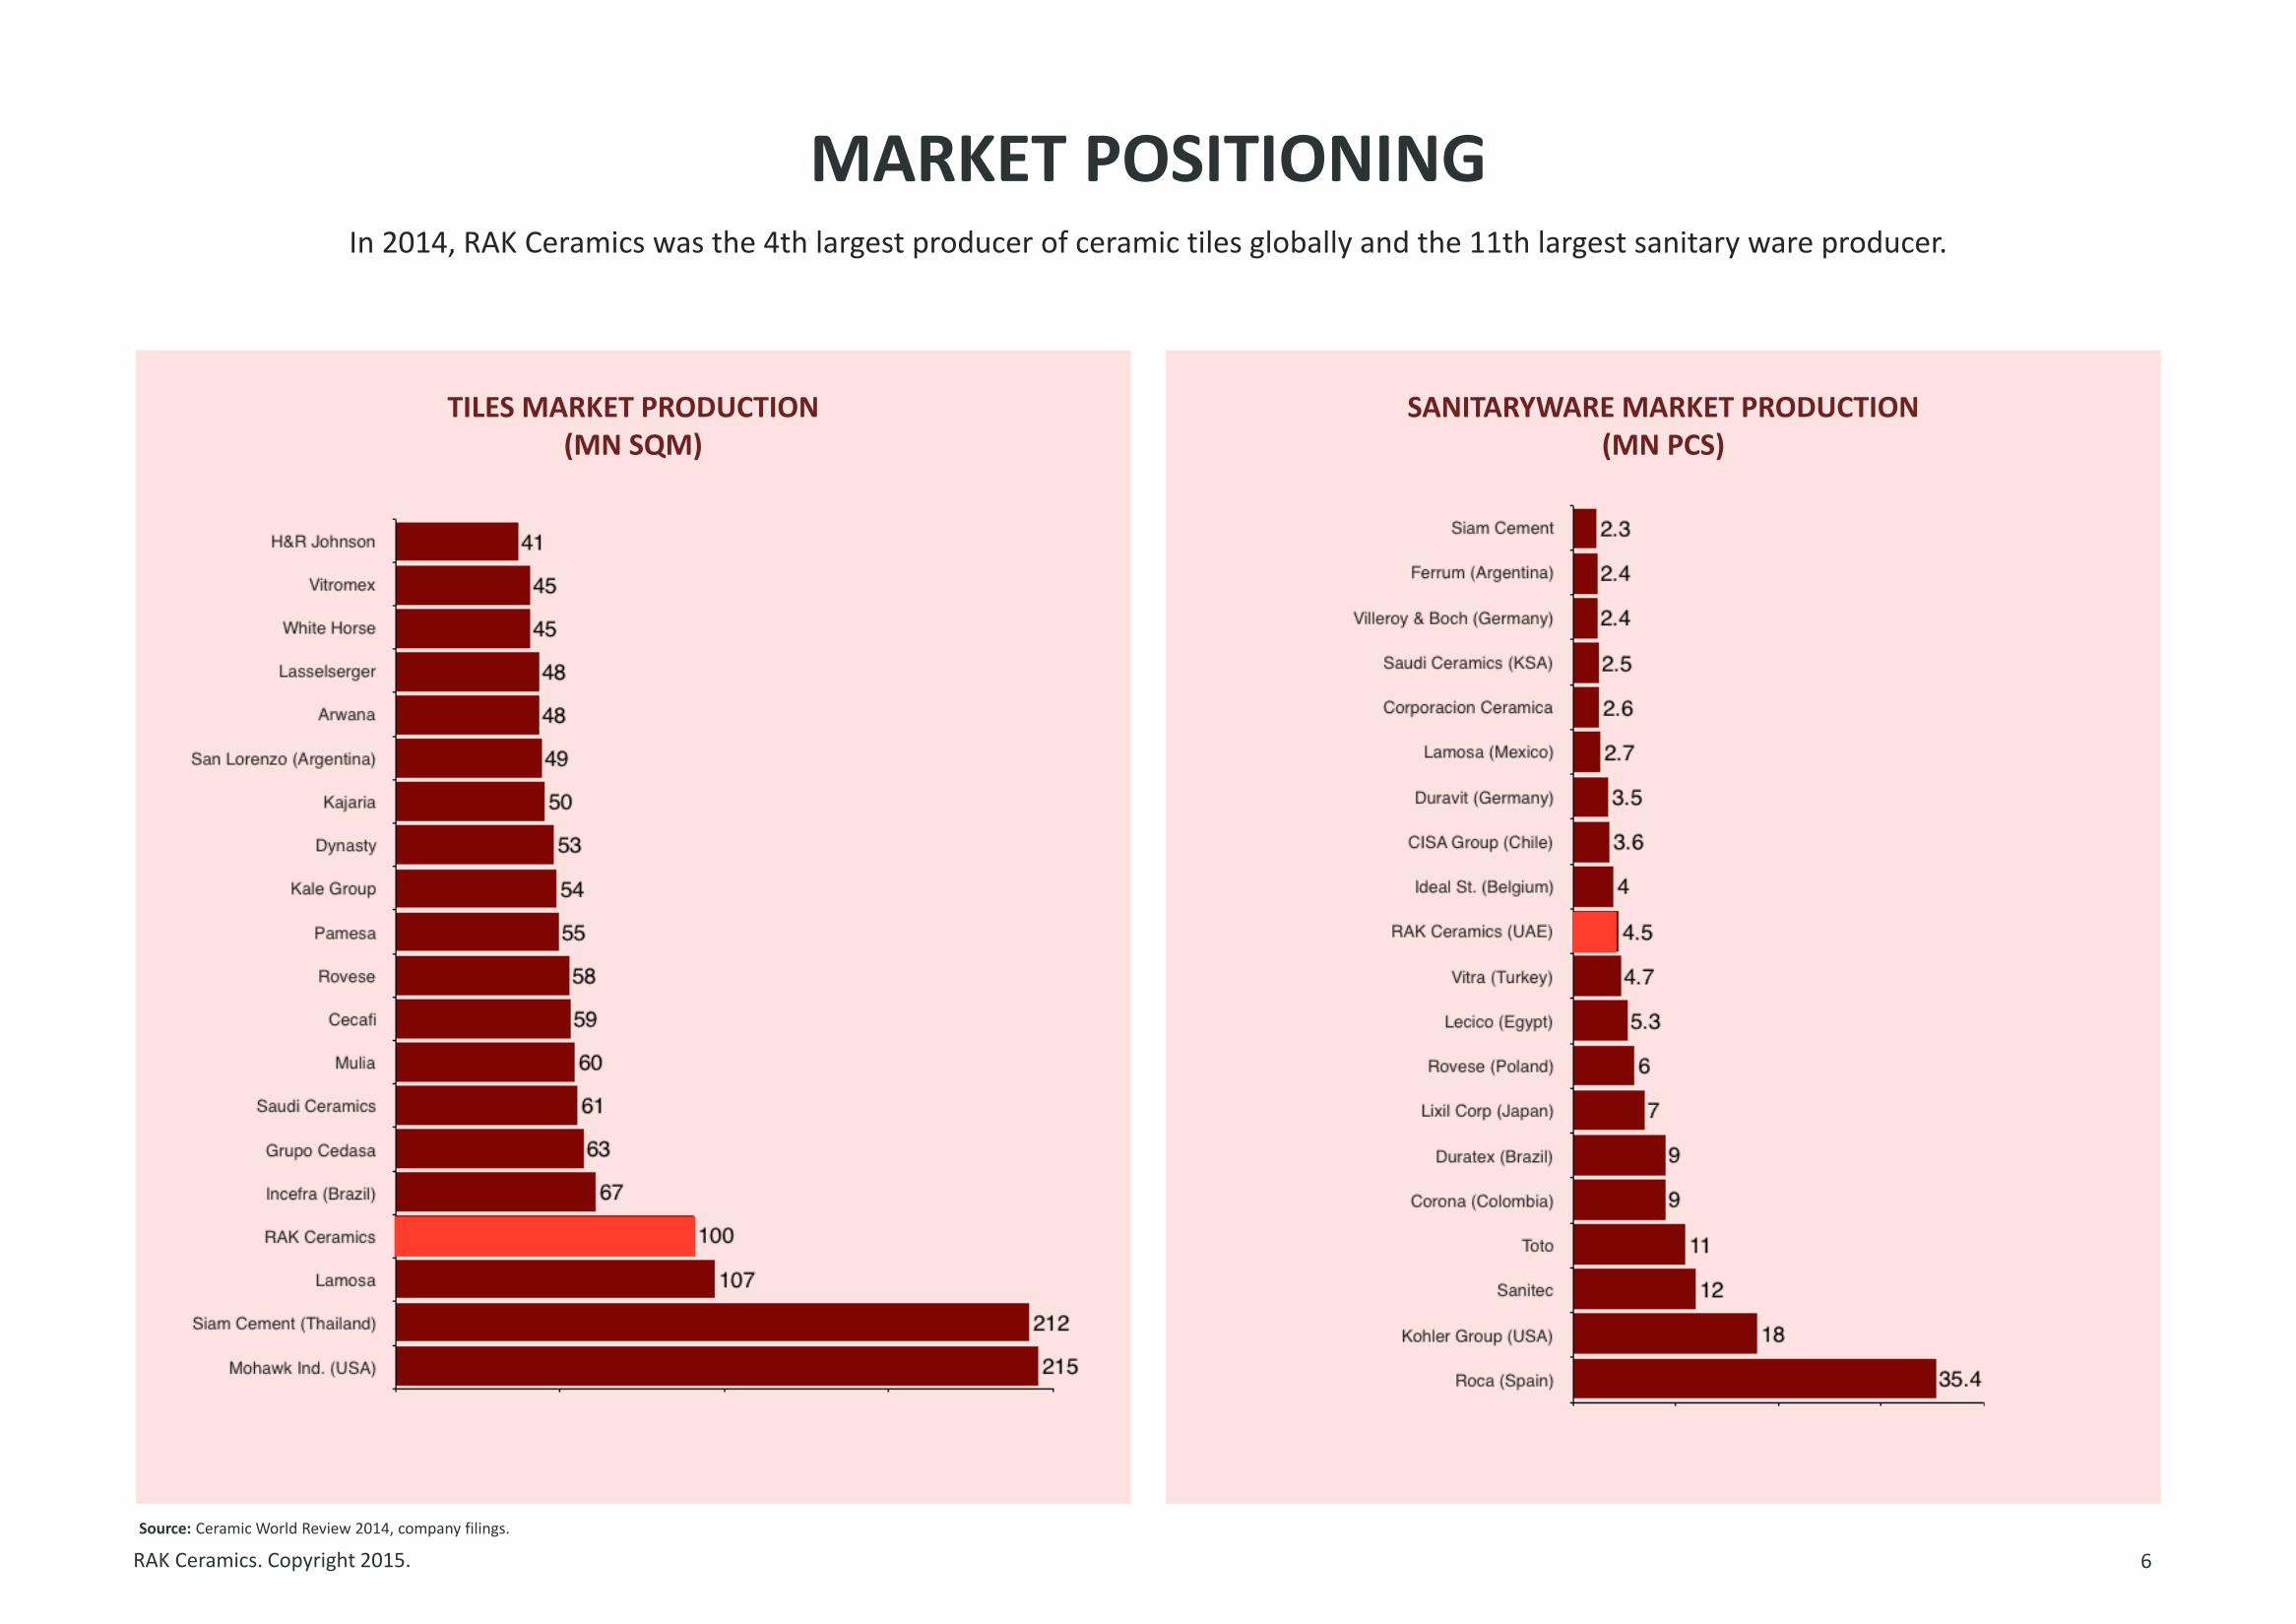
MARKET POSITIONING
6
TILES MARKET PRODUCTION (MN SQM)
SANITARYWARE MARKET PRODUCTION (MN PCS)
Source: Ceramic World Review 2014, company filings.
In 2014, RAK Ceramics was the 4th largest producer of ceramic tiles globally and the 11th largest sanitary ware producer.
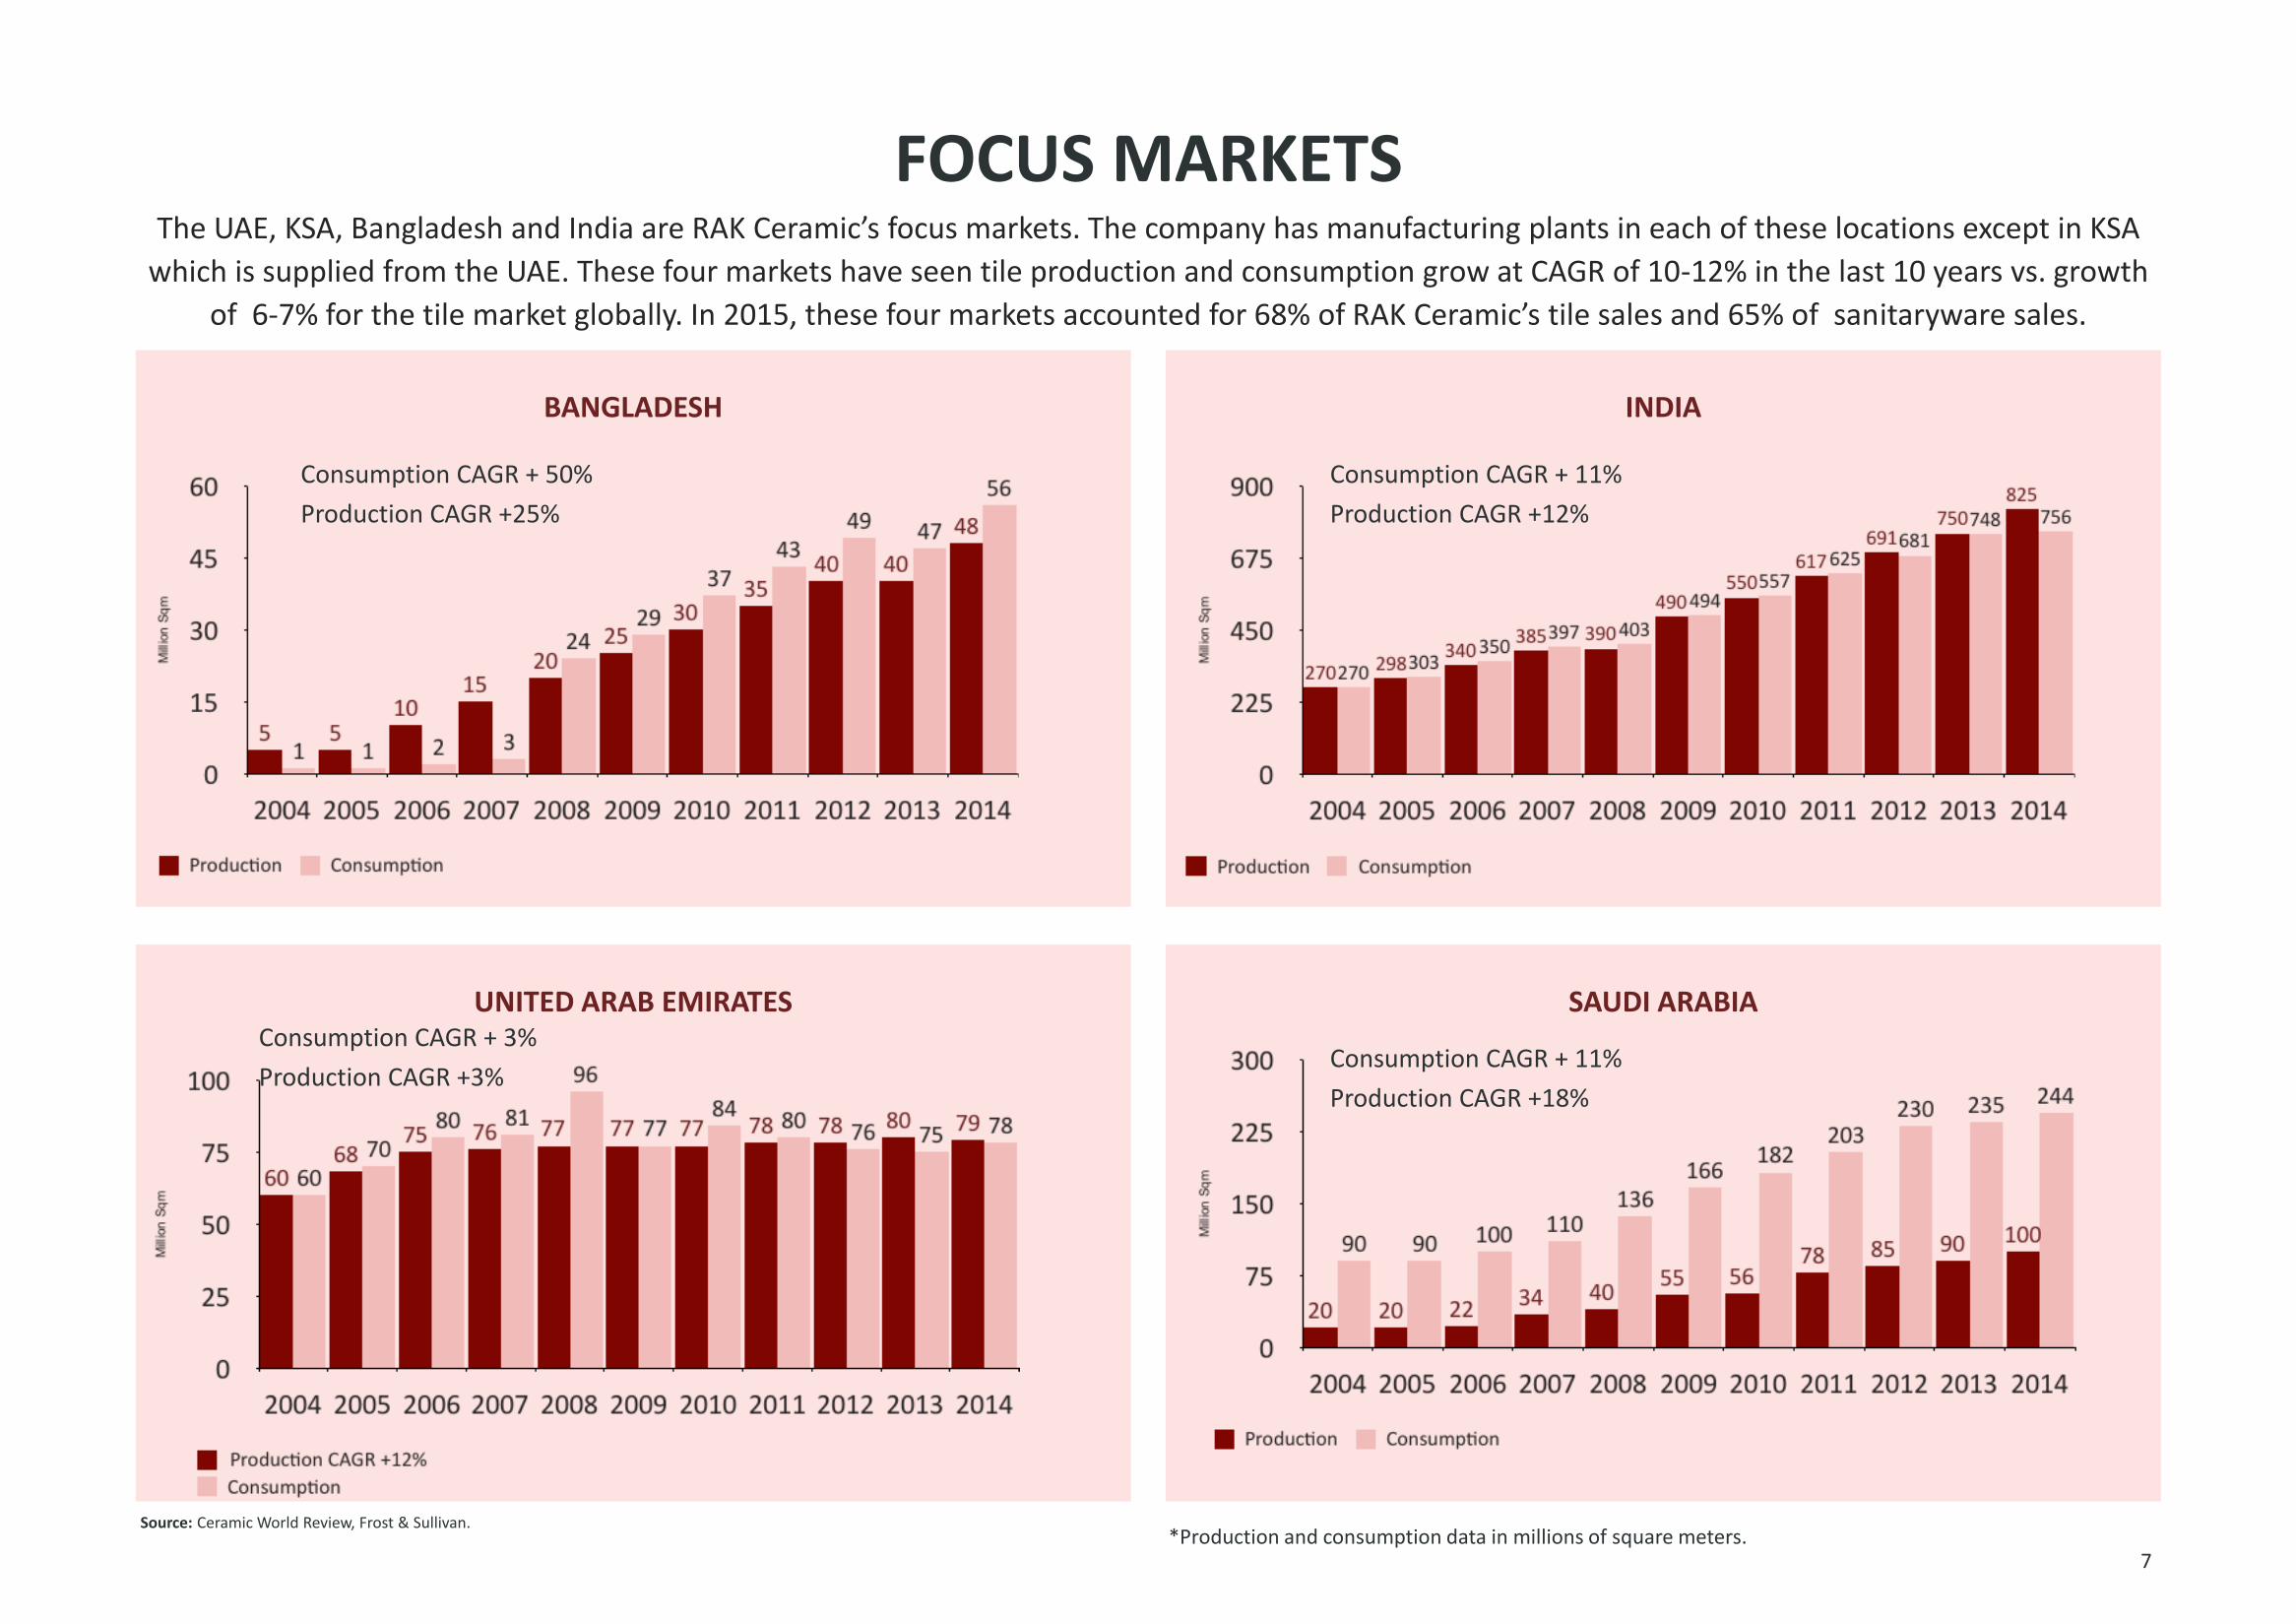
FOCUS MARKETS
7
BANGLADESH INDIA
UNITED ARAB EMIRATES SAUDI ARABIA
The UAE, KSA, Bangladesh and India are RAK Ceramic’s focus markets. The company has manufacturing plants in each of these locations except in KSA
which is supplied from the UAE. These four markets have seen tile production and consumption grow at CAGR of 10-12% in the last 10 years vs. growth
of 6-7% for the tile market globally. In 2015, these four markets accounted for 68% of RAK Ceramic’s tile sales and 65% of sanitaryware sales.
Source: Ceramic World Review, Frost & Sullivan.
Consumption CAGR + 50%
Production CAGR +25%
Consumption CAGR + 11%
Production CAGR +12%
Consumption CAGR + 3%
Production CAGR +3% Consumption CAGR + 11%
Production CAGR +18%
*Production and consumption data in millions of square meters.
2015 RESULTS
RAK Ceramics. Copyright 2015.
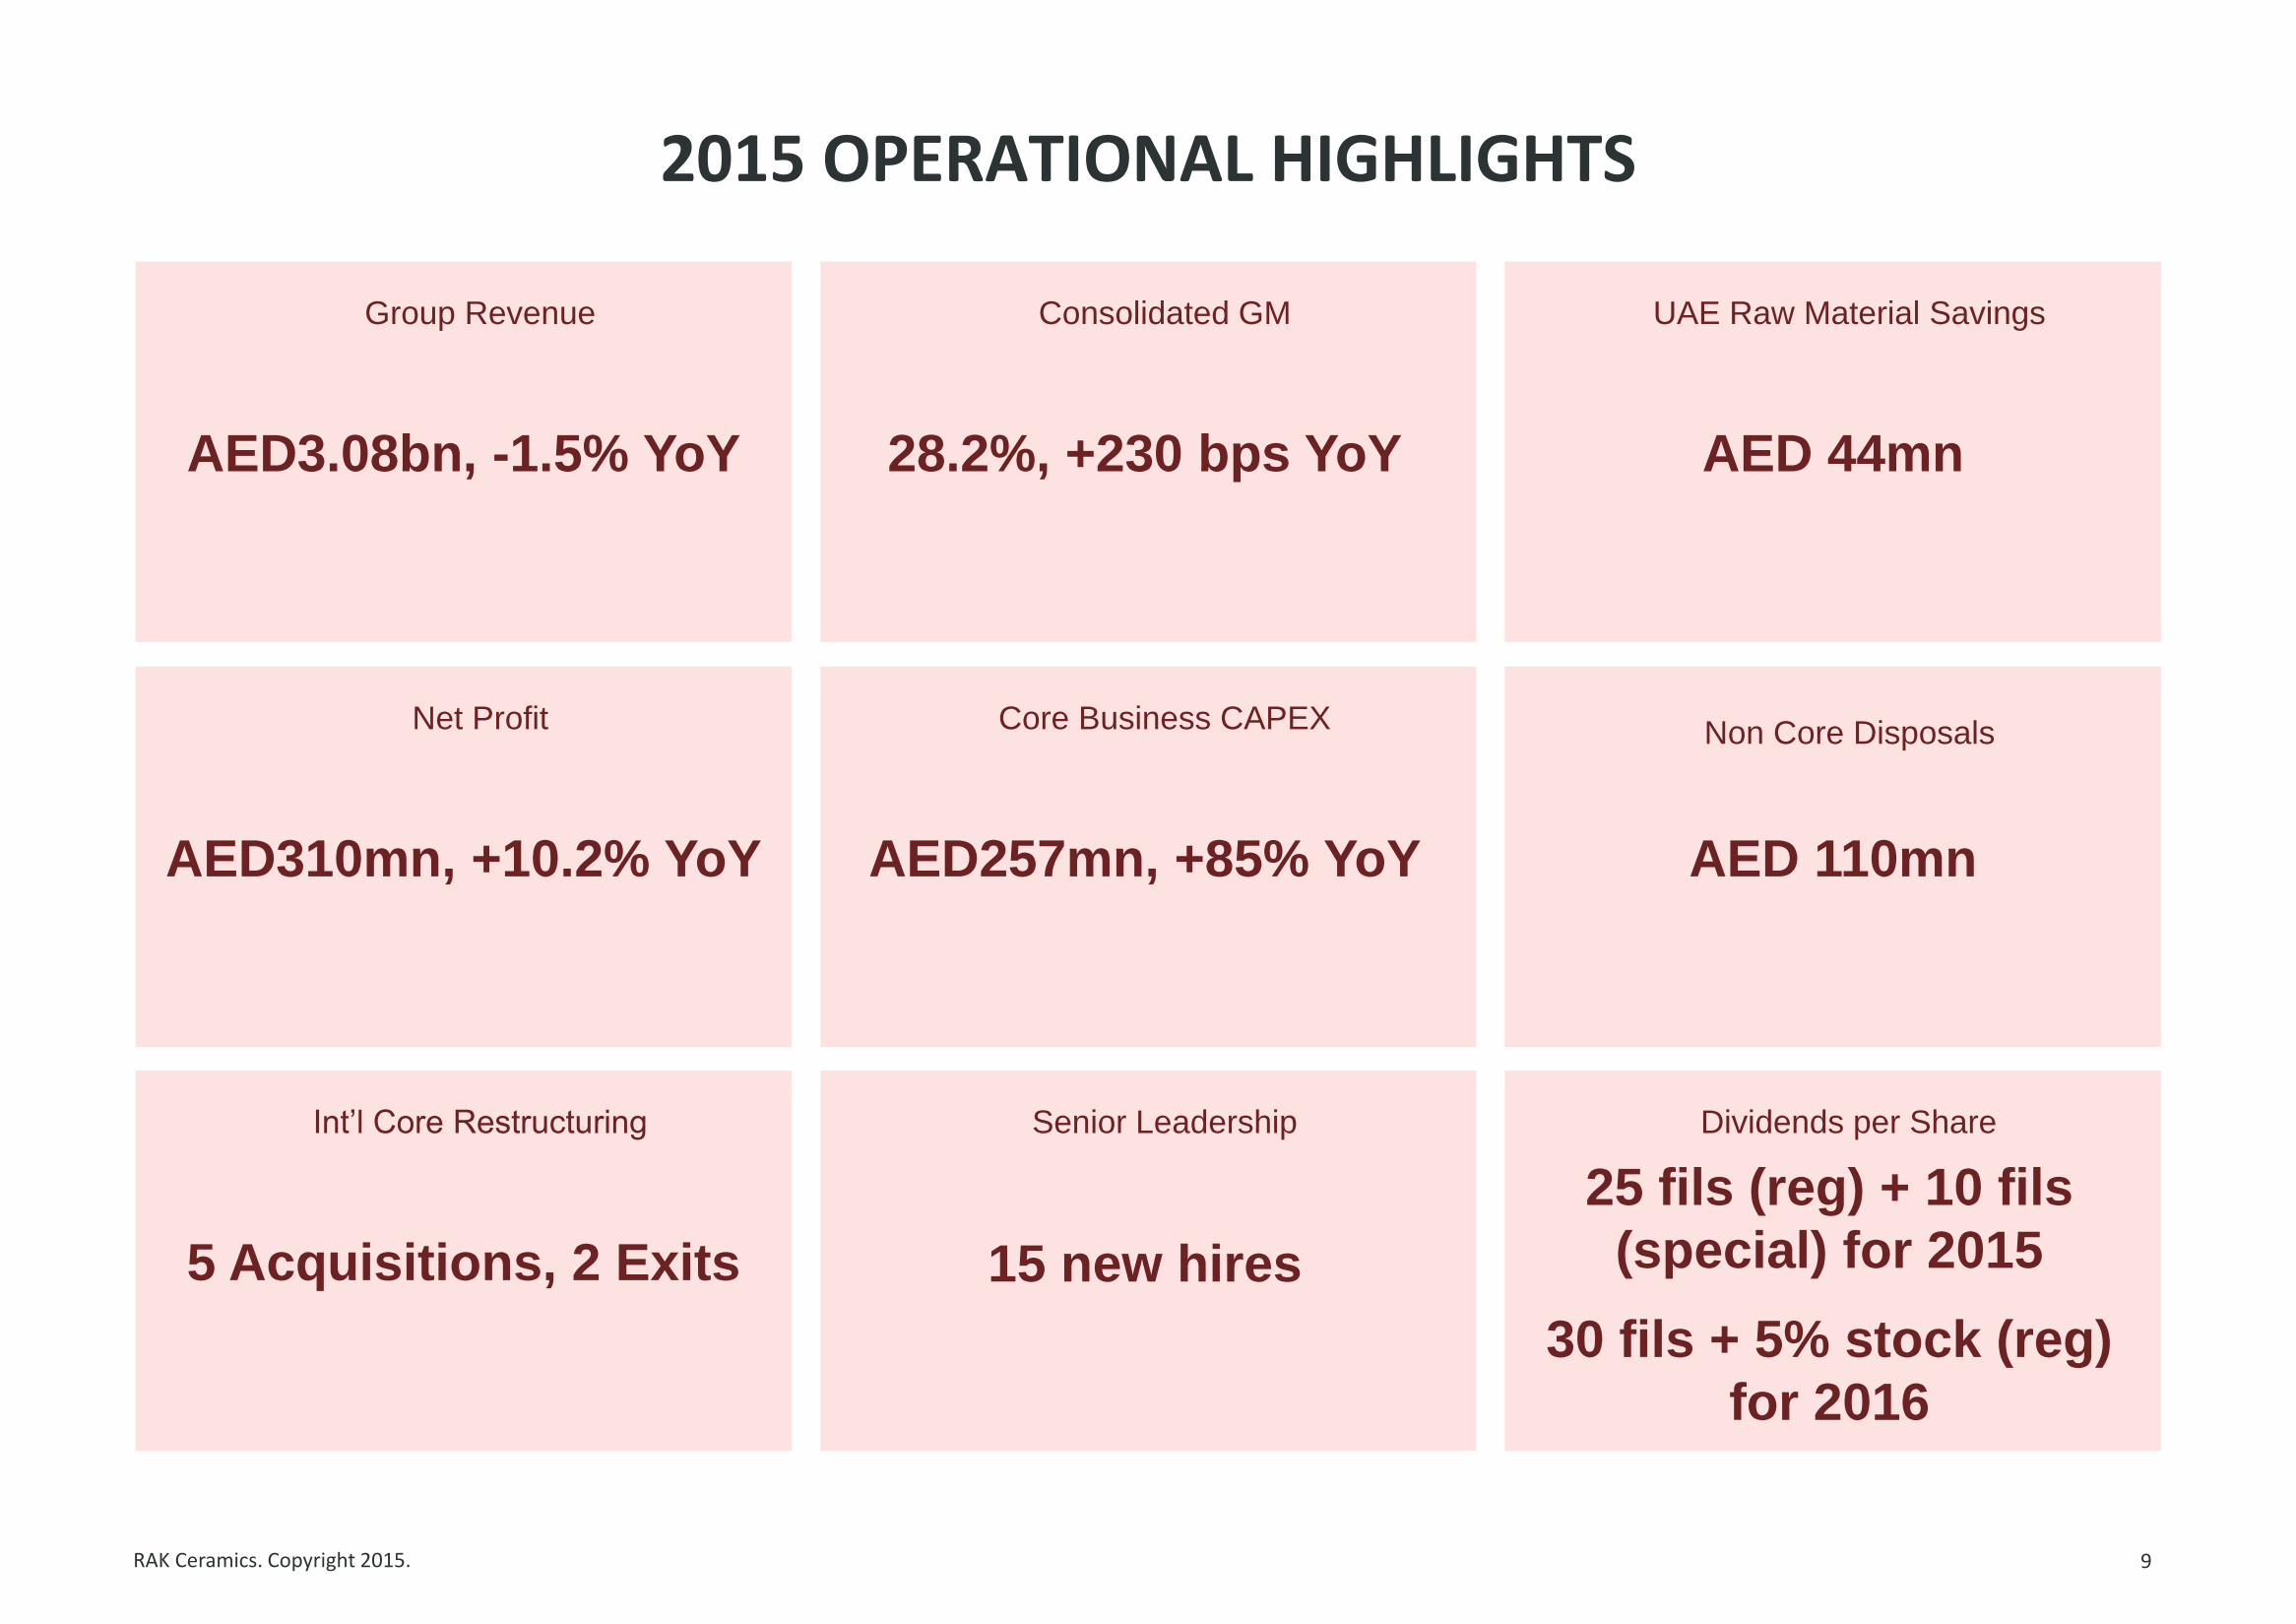
2015 OPERATIONAL HIGHLIGHTS
9
Group Revenue
Consolidated GM
UAE Raw Material Savings
Net Profit
Core Business CAPEX
Non Core Disposals
Int’l Core Restructuring
Senior Leadership
Dividends per Share
AED3.08bn, -1.5% YoY 28.2%, +230 bps YoY AED 44mn
AED310mn, +10.2% YoY AED257mn, +85% YoY AED 110mn
5 Acquisitions, 2 Exits 15 new hires
25 fils (reg) + 10 fils
(special) for 2015
30 fils + 5% stock (reg)
for 2016
RAK Ceramics. Copyright 2015.
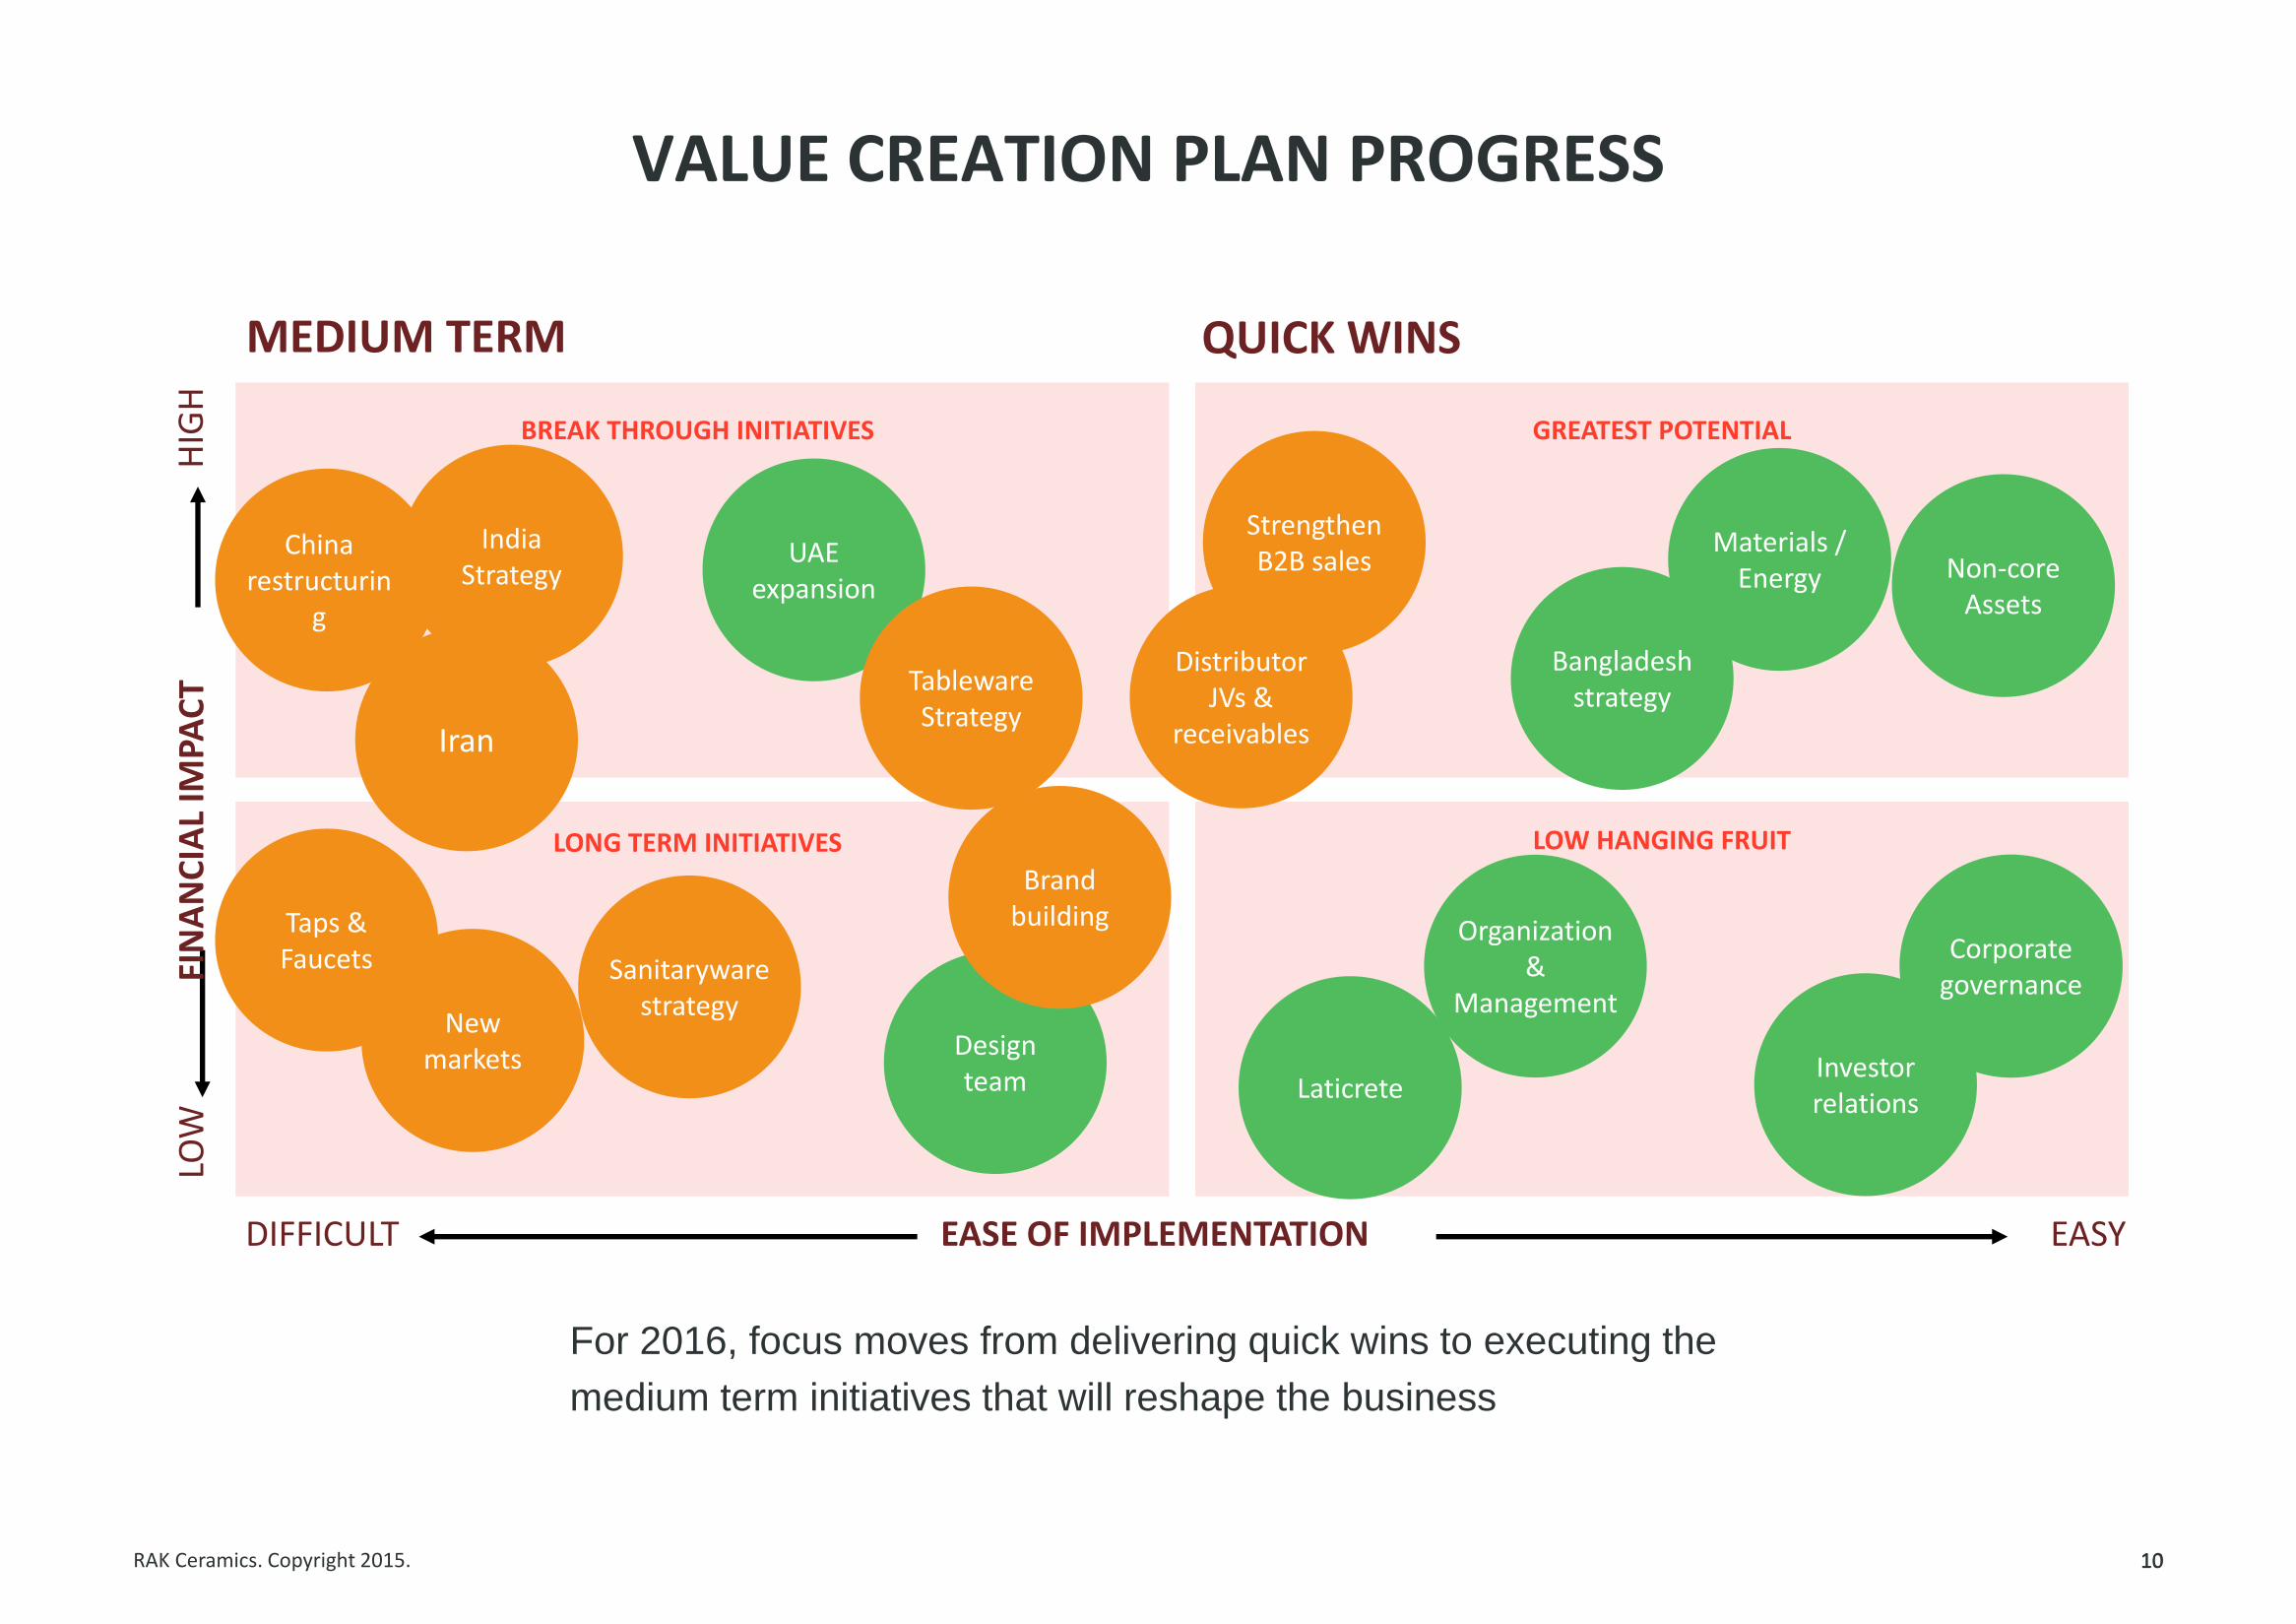
VALUE CREATION PLAN PROGRESS
10
MEDIUM TERM QUICK WINS
BREAK THROUGH INITIATIVES
LONG TERM INITIATIVES
GREATEST POTENTIAL
LOW HANGING FRUIT
Strengthen B2B sales Non-core
Assets
Materials / Energy
Bangladesh strategy
Distributor JVs &
receivables
UAE expansion
Tableware Strategy
Iran
China restructurin
g
India Strategy
Taps & Faucets
New markets
Sanitaryware strategy
Design team
Brand building Organization
& Management
Laticrete Investor relations
Corporate governance
DIFFICULT EASY EASE OF IMPLEMENTATION
LOW
H
IGH
FI
NA
NC
IAL
IMPA
CT
For 2016, focus moves from delivering quick wins to executing the
medium term initiatives that will reshape the business
10
RAK Ceramics. Copyright 2015.
2015 RESULTS
11
2014 2015 Variance
AED Mn Q1 Q2 Q3 Q4 Total Q1 Q2 Q3 Q4 Total Q4 /15 vs.
Q4/14 2015 vs.
2014
Revenue (Net)
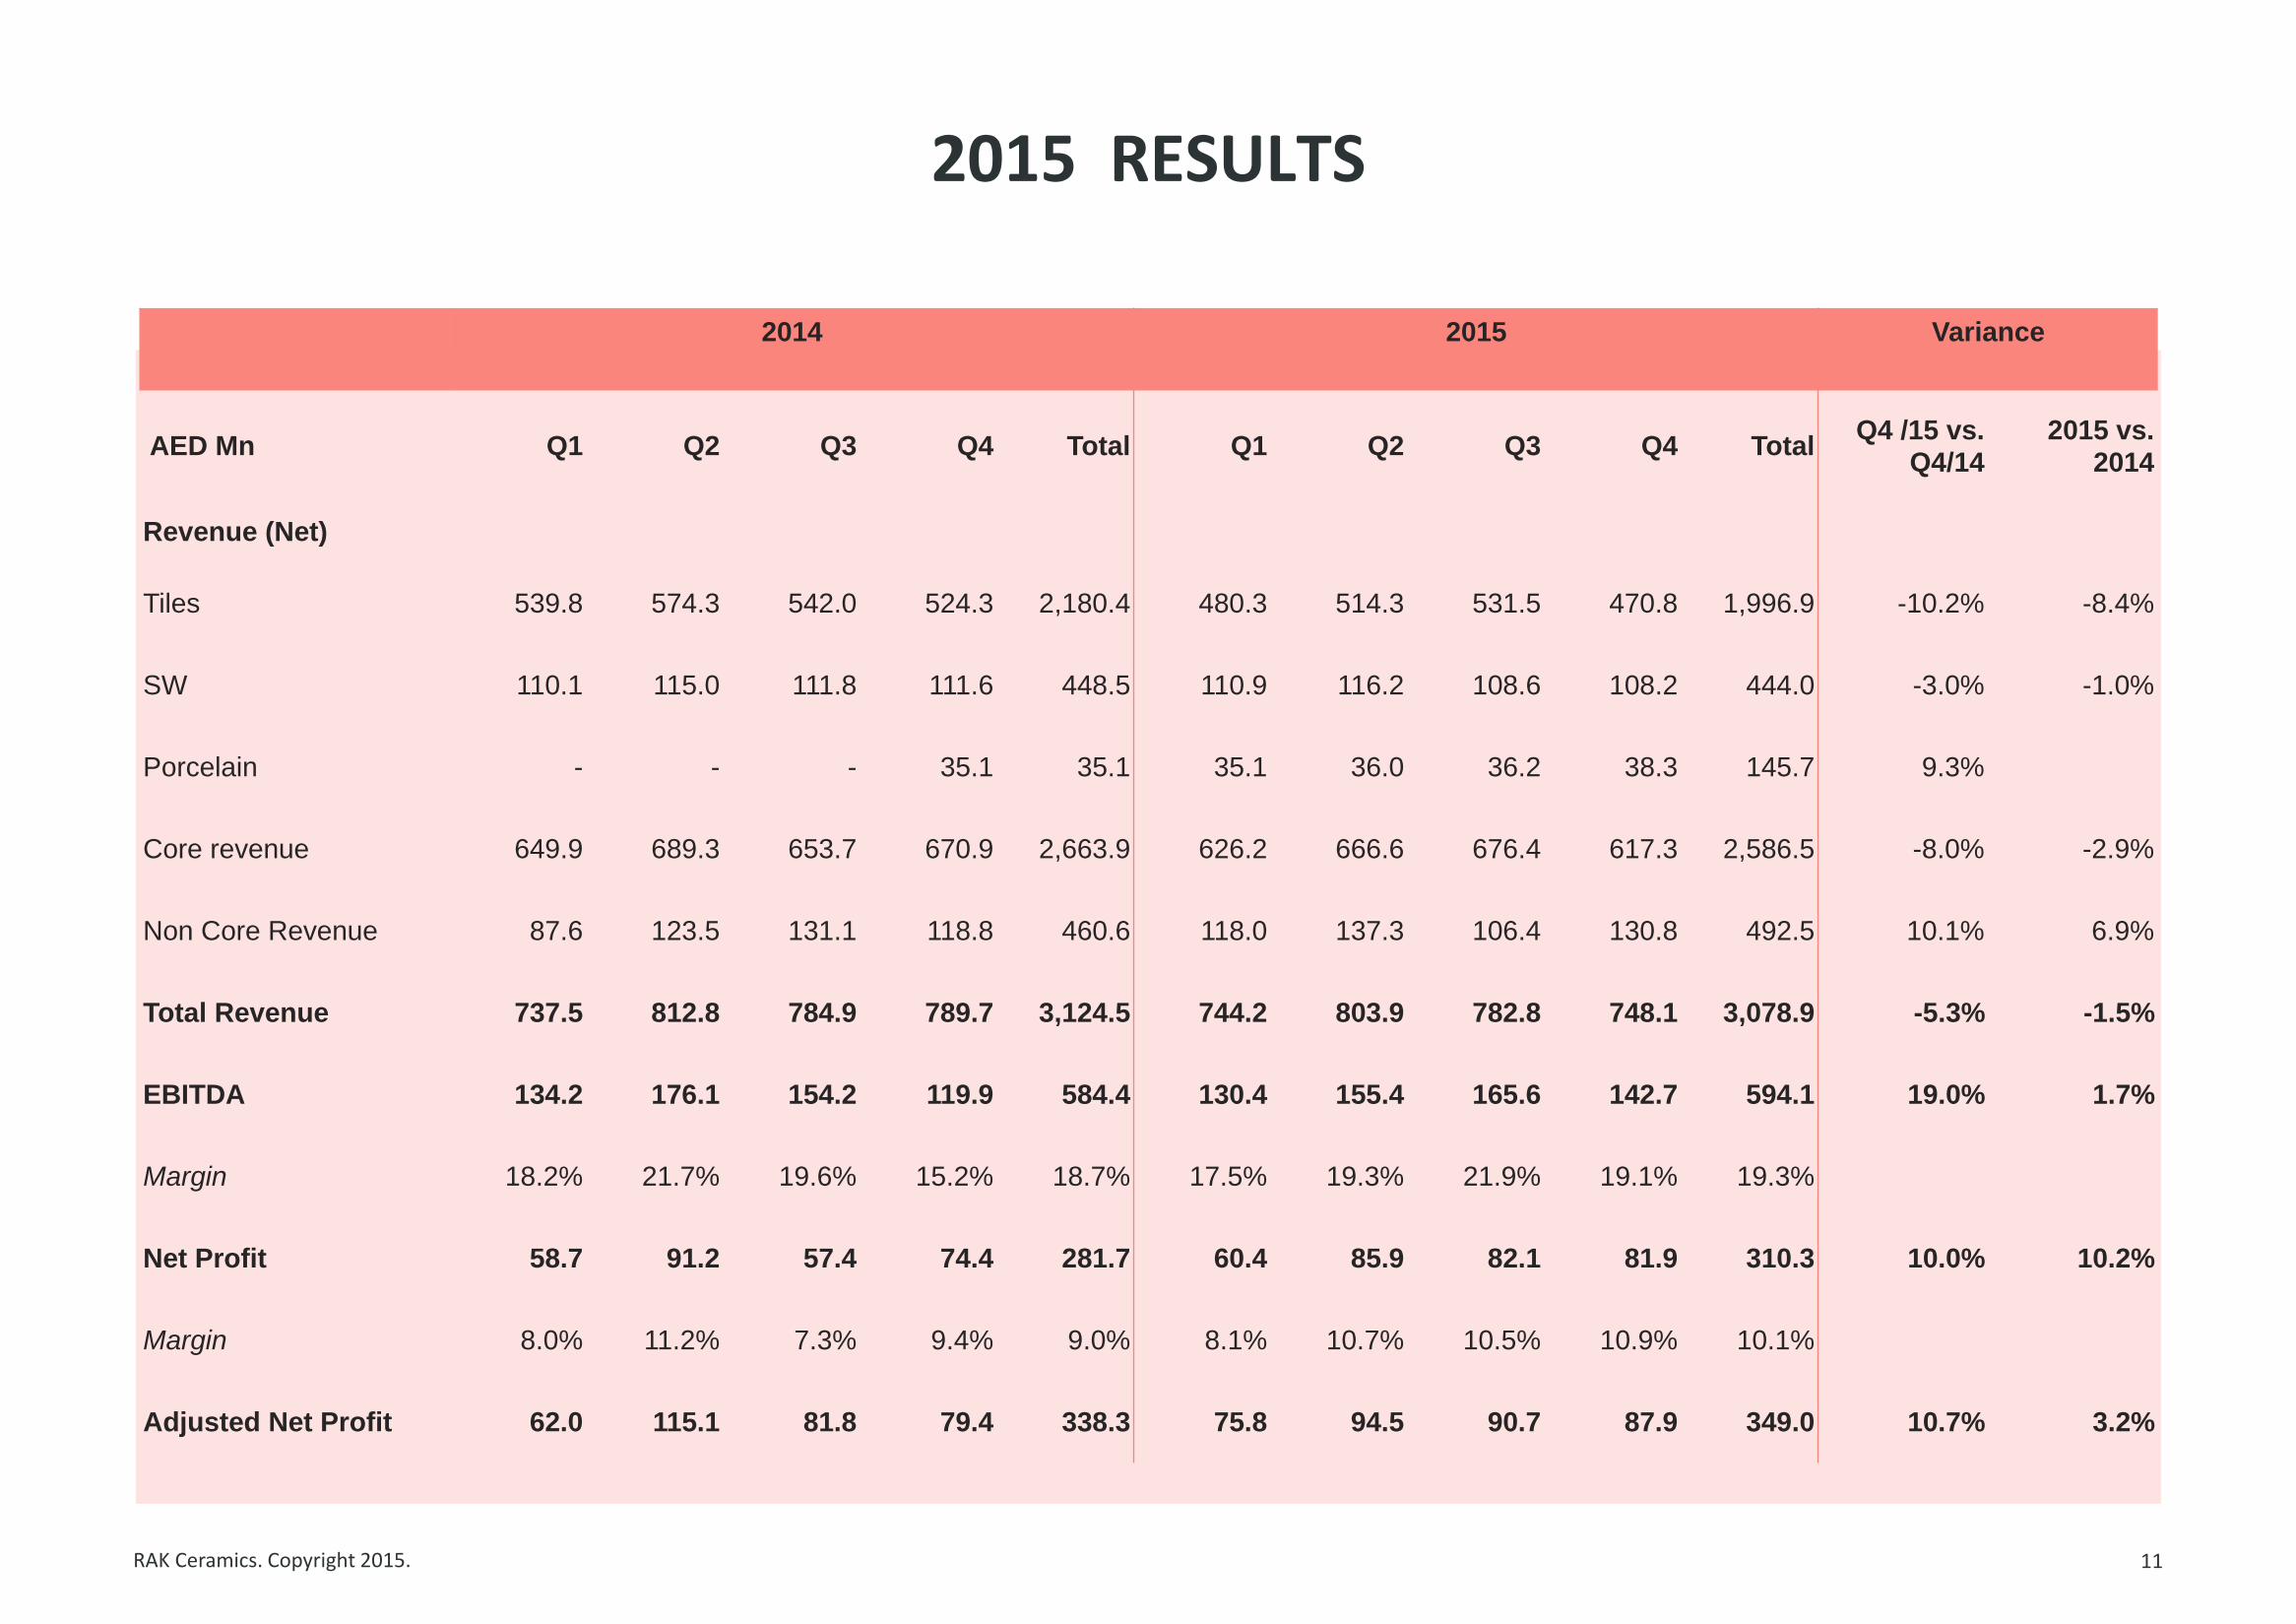
Tiles 539.8 574.3 542.0 524.3 2,180.4 480.3 514.3 531.5 470.8 1,996.9 -10.2% -8.4%
SW 110.1 115.0 111.8 111.6 448.5 110.9 116.2 108.6 108.2 444.0 -3.0% -1.0%
Porcelain - - - 35.1 35.1 35.1 36.0 36.2 38.3 145.7 9.3%
Core revenue 649.9 689.3 653.7 670.9 2,663.9 626.2 666.6 676.4 617.3 2,586.5 -8.0% -2.9%
Non Core Revenue 87.6 123.5 131.1 118.8 460.6 118.0 137.3 106.4 130.8 492.5 10.1% 6.9%
Total Revenue 737.5 812.8 784.9 789.7 3,124.5 744.2 803.9 782.8 748.1 3,078.9 -5.3% -1.5%
EBITDA 134.2 176.1 154.2 119.9 584.4 130.4 155.4 165.6 142.7 594.1 19.0% 1.7%
Margin 18.2% 21.7% 19.6% 15.2% 18.7% 17.5% 19.3% 21.9% 19.1% 19.3%
Net Profit 58.7 91.2 57.4 74.4 281.7 60.4 85.9 82.1 81.9 310.3 10.0% 10.2%
Margin 8.0% 11.2% 7.3% 9.4% 9.0% 8.1% 10.7% 10.5% 10.9% 10.1%
Adjusted Net Profit 62.0 115.1 81.8 79.4 338.3 75.8 94.5 90.7 87.9 349.0 10.7% 3.2%
2015 RESULTS OVERVIEW
12
2015 GROSS MARGIN
2015 REVENUES (AED MN) REPORTED NET PROFIT (AED MN)
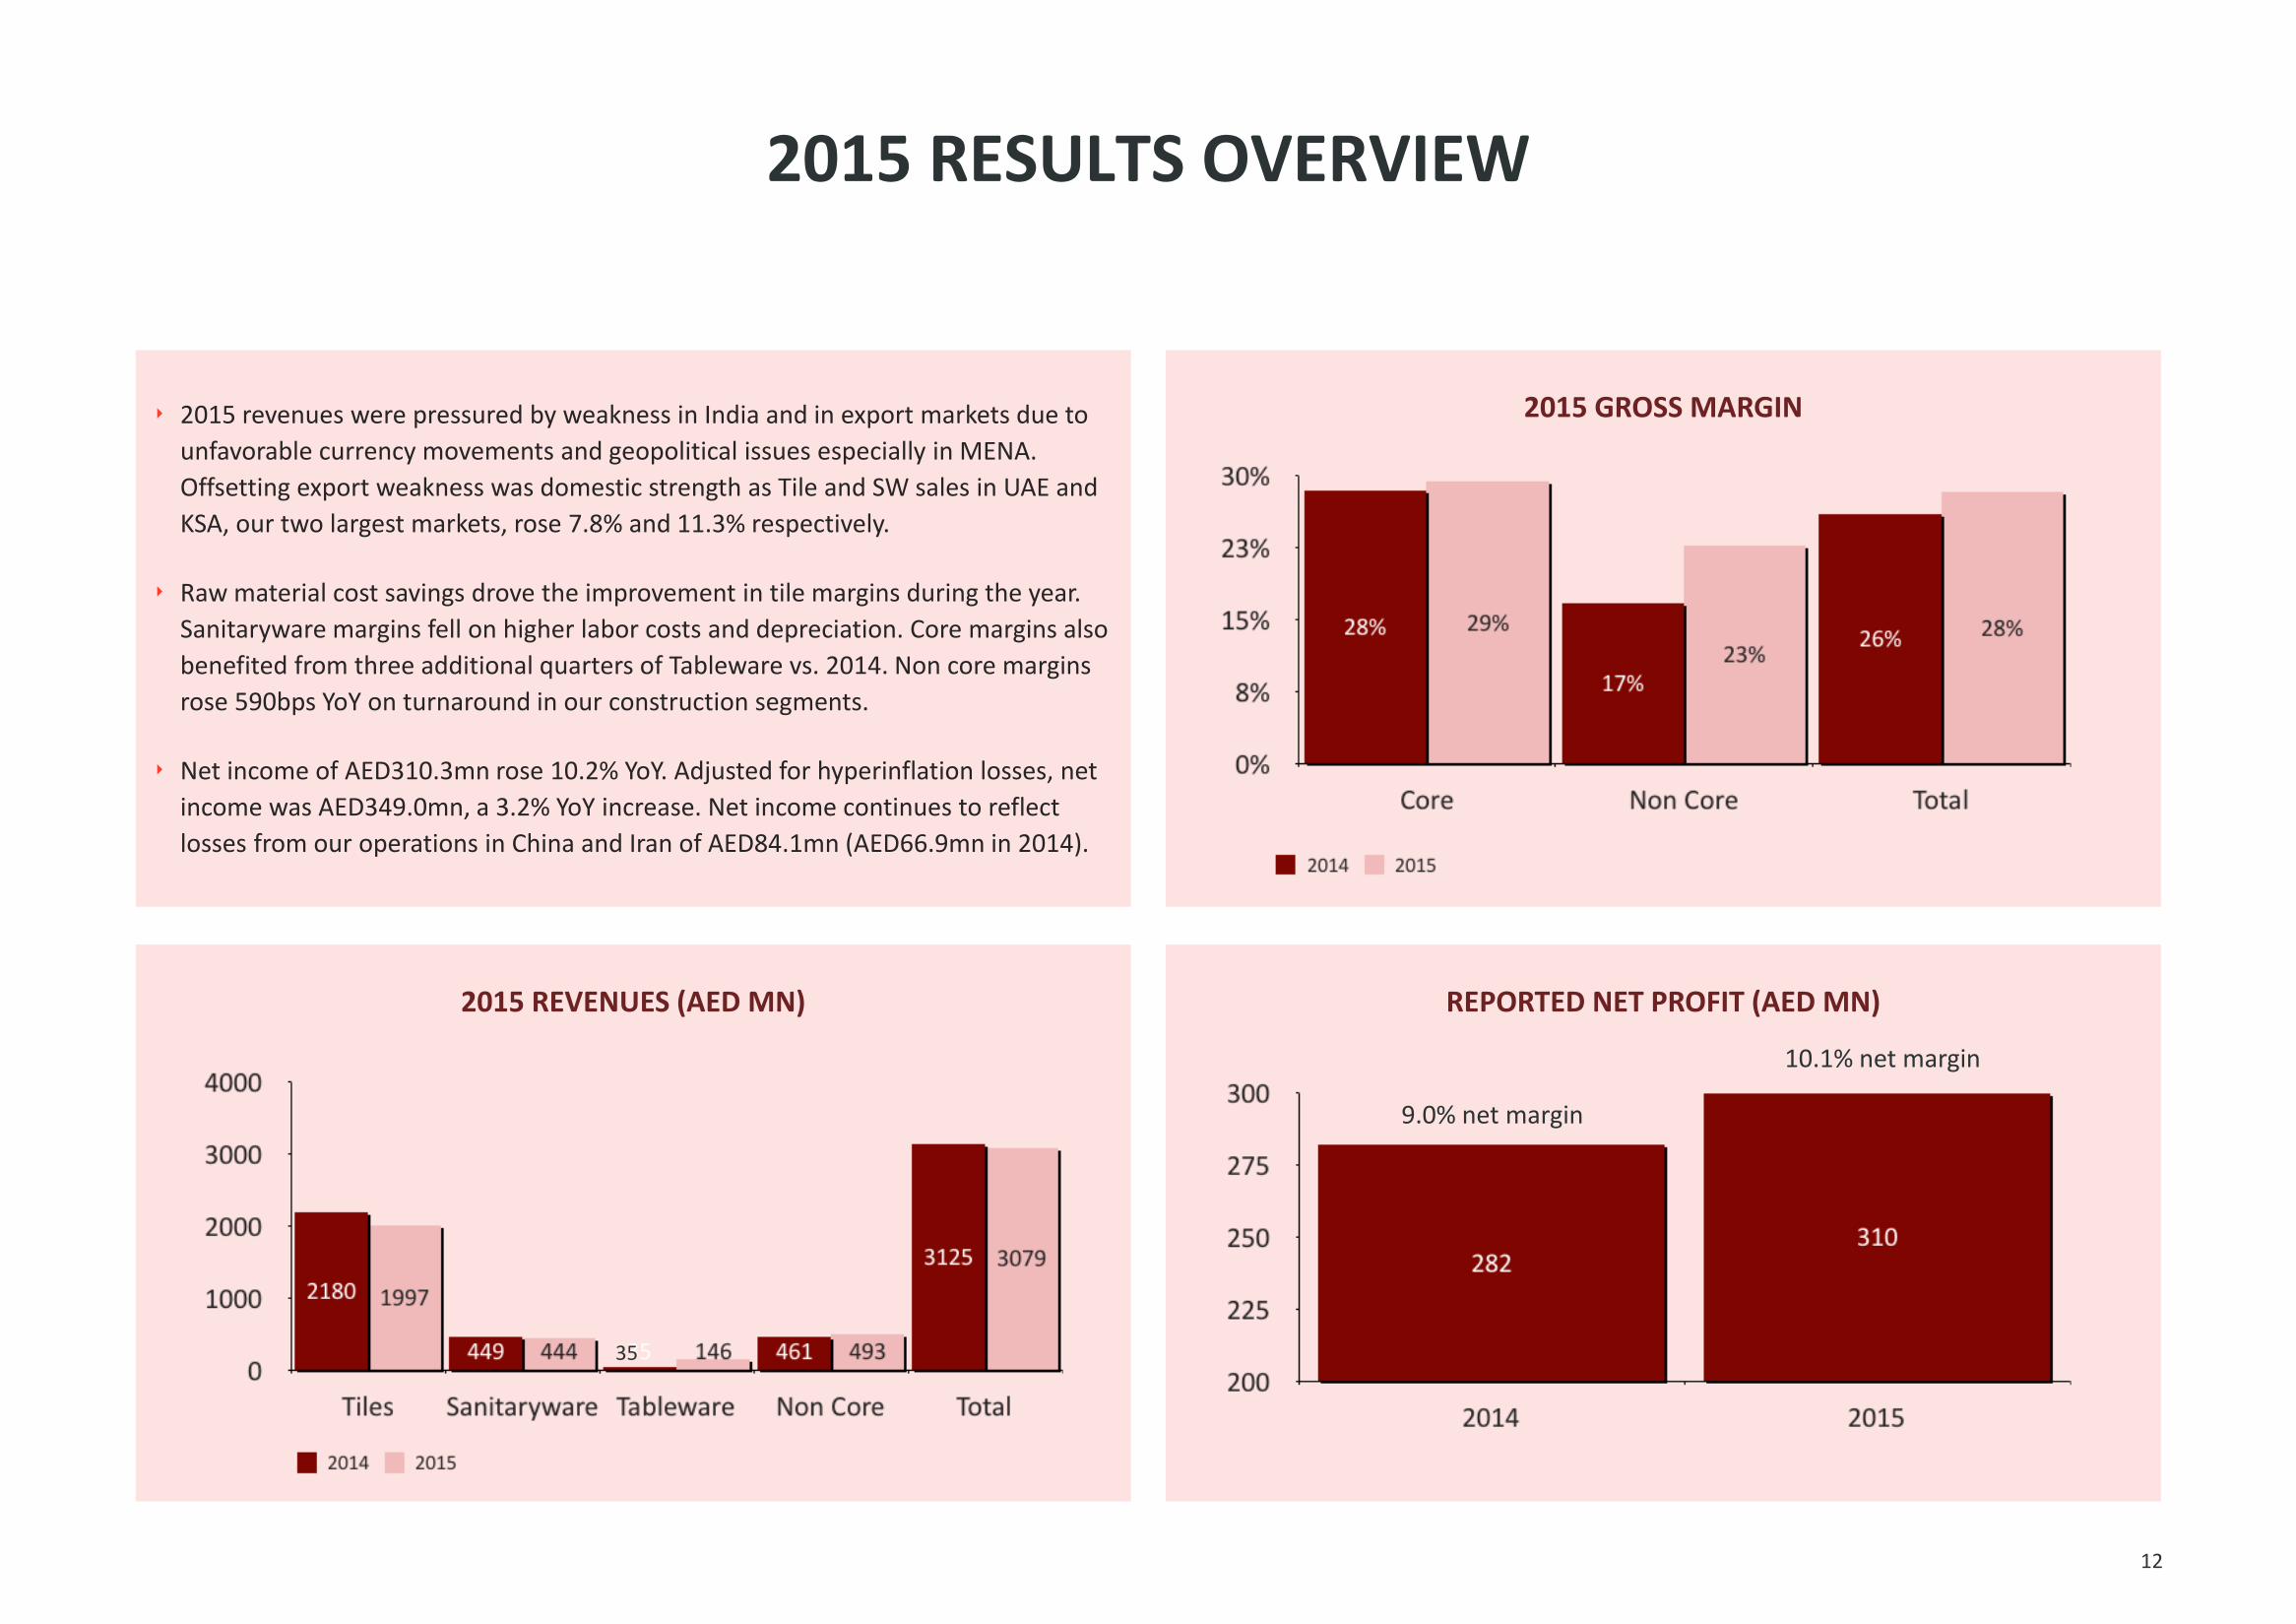
‣ 2015 revenues were pressured by weakness in India and in export markets due to
unfavorable currency movements and geopolitical issues especially in MENA.
Offsetting export weakness was domestic strength as Tile and SW sales in UAE and
KSA, our two largest markets, rose 7.8% and 11.3% respectively.
‣ Raw material cost savings drove the improvement in tile margins during the year.
Sanitaryware margins fell on higher labor costs and depreciation. Core margins also
benefited from three additional quarters of Tableware vs. 2014. Non core margins
rose 590bps YoY on turnaround in our construction segments.
‣ Net income of AED310.3mn rose 10.2% YoY. Adjusted for hyperinflation losses, net
income was AED349.0mn, a 3.2% YoY increase. Net income continues to reflect
losses from our operations in China and Iran of AED84.1mn (AED66.9mn in 2014).
9.0% net margin
10.1% net margin
35
FOCUS MARKETS SALES TRENDS
13
UNITED ARAB EMIRATES INDIA
SAUDI ARABIA BANGLADESH
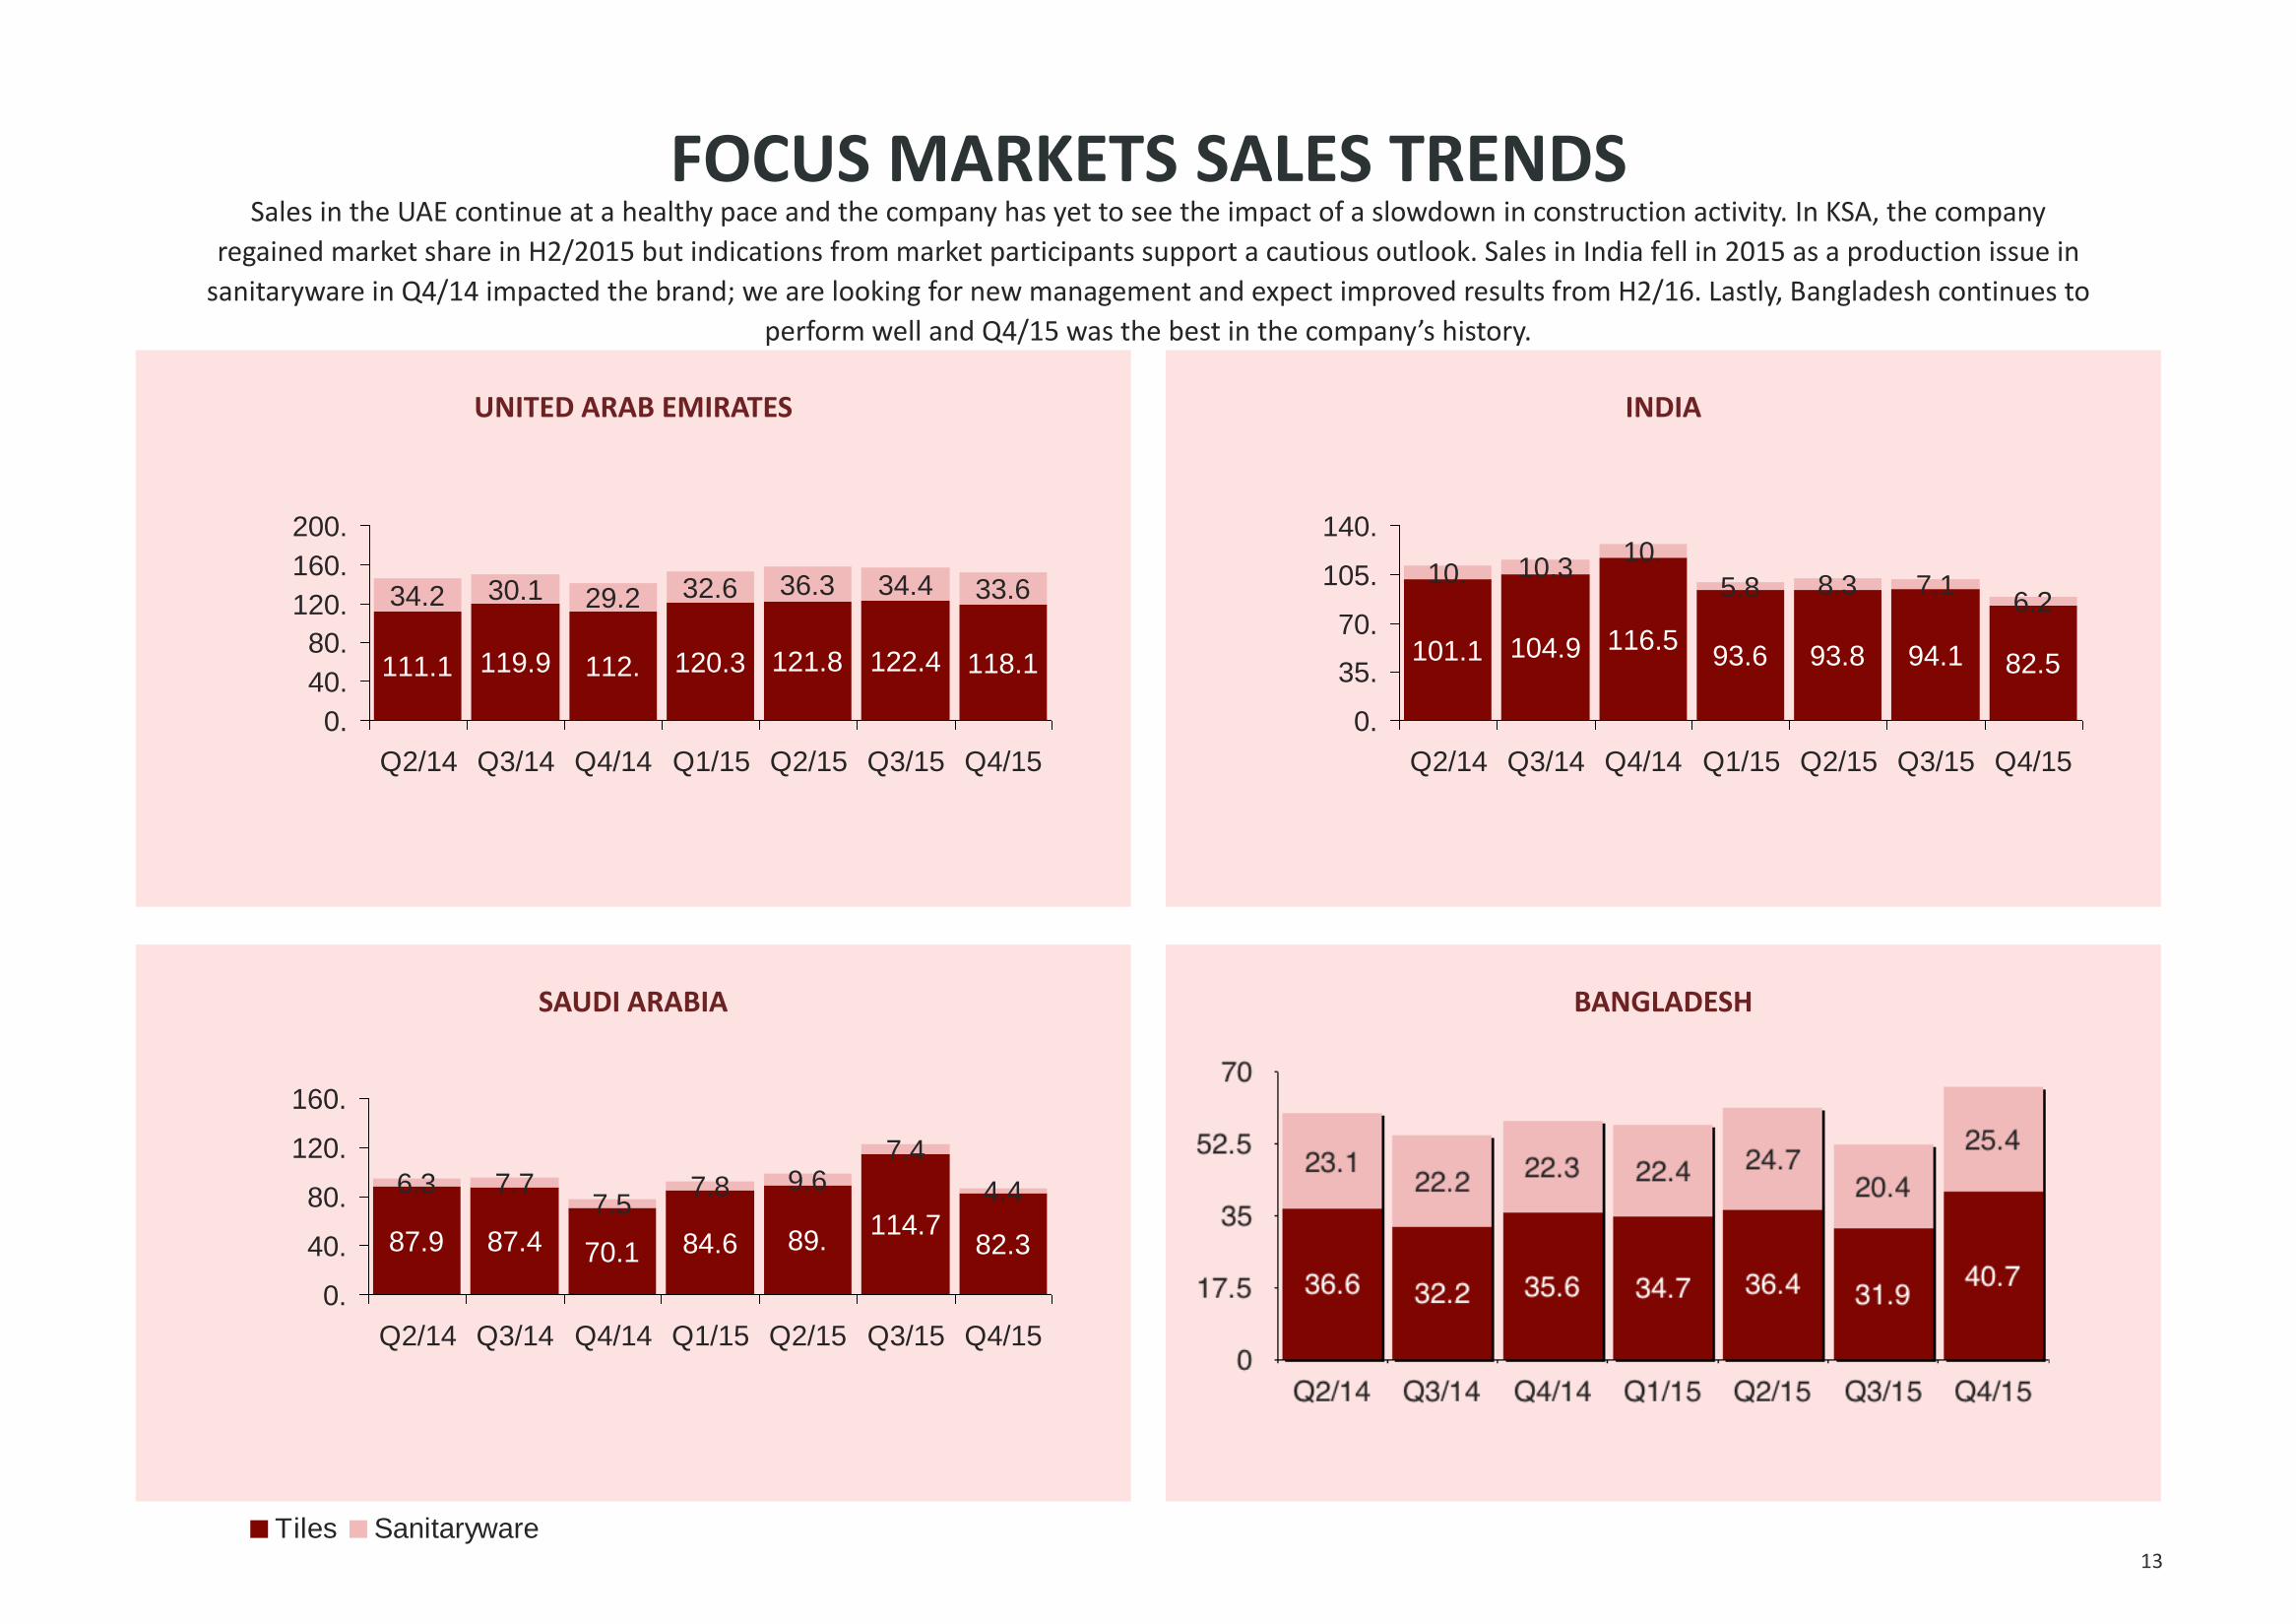
Sales in the UAE continue at a healthy pace and the company has yet to see the impact of a slowdown in construction activity. In KSA, the company
regained market share in H2/2015 but indications from market participants support a cautious outlook. Sales in India fell in 2015 as a production issue in
sanitaryware in Q4/14 impacted the brand; we are looking for new management and expect improved results from H2/16. Lastly, Bangladesh continues to
perform well and Q4/15 was the best in the company’s history.
111.1 119.9 112. 120.3 121.8 122.4 118.1
34.2 30.1 29.2 32.6 36.3 34.4 33.6
0.
40.
80.
120.
160.
200.
Q2/14 Q3/14 Q4/14 Q1/15 Q2/15 Q3/15 Q4/15
101.1 104.9 116.593.6 93.8 94.1 82.5
10. 10.310.
5.8 8.3 7.16.2
0.
35.
70.
105.
140.
Q2/14 Q3/14 Q4/14 Q1/15 Q2/15 Q3/15 Q4/15
87.9 87.4 70.1 84.6 89.114.7
82.3
6.3 7.77.5
7.8 9.67.4
4.4
0.
40.
80.
120.
160.
Q2/14 Q3/14 Q4/14 Q1/15 Q2/15 Q3/15 Q4/15
Tiles Sanitaryware
RAK Ceramics. Copyright 2015.
TILE MARGINS TREND
14
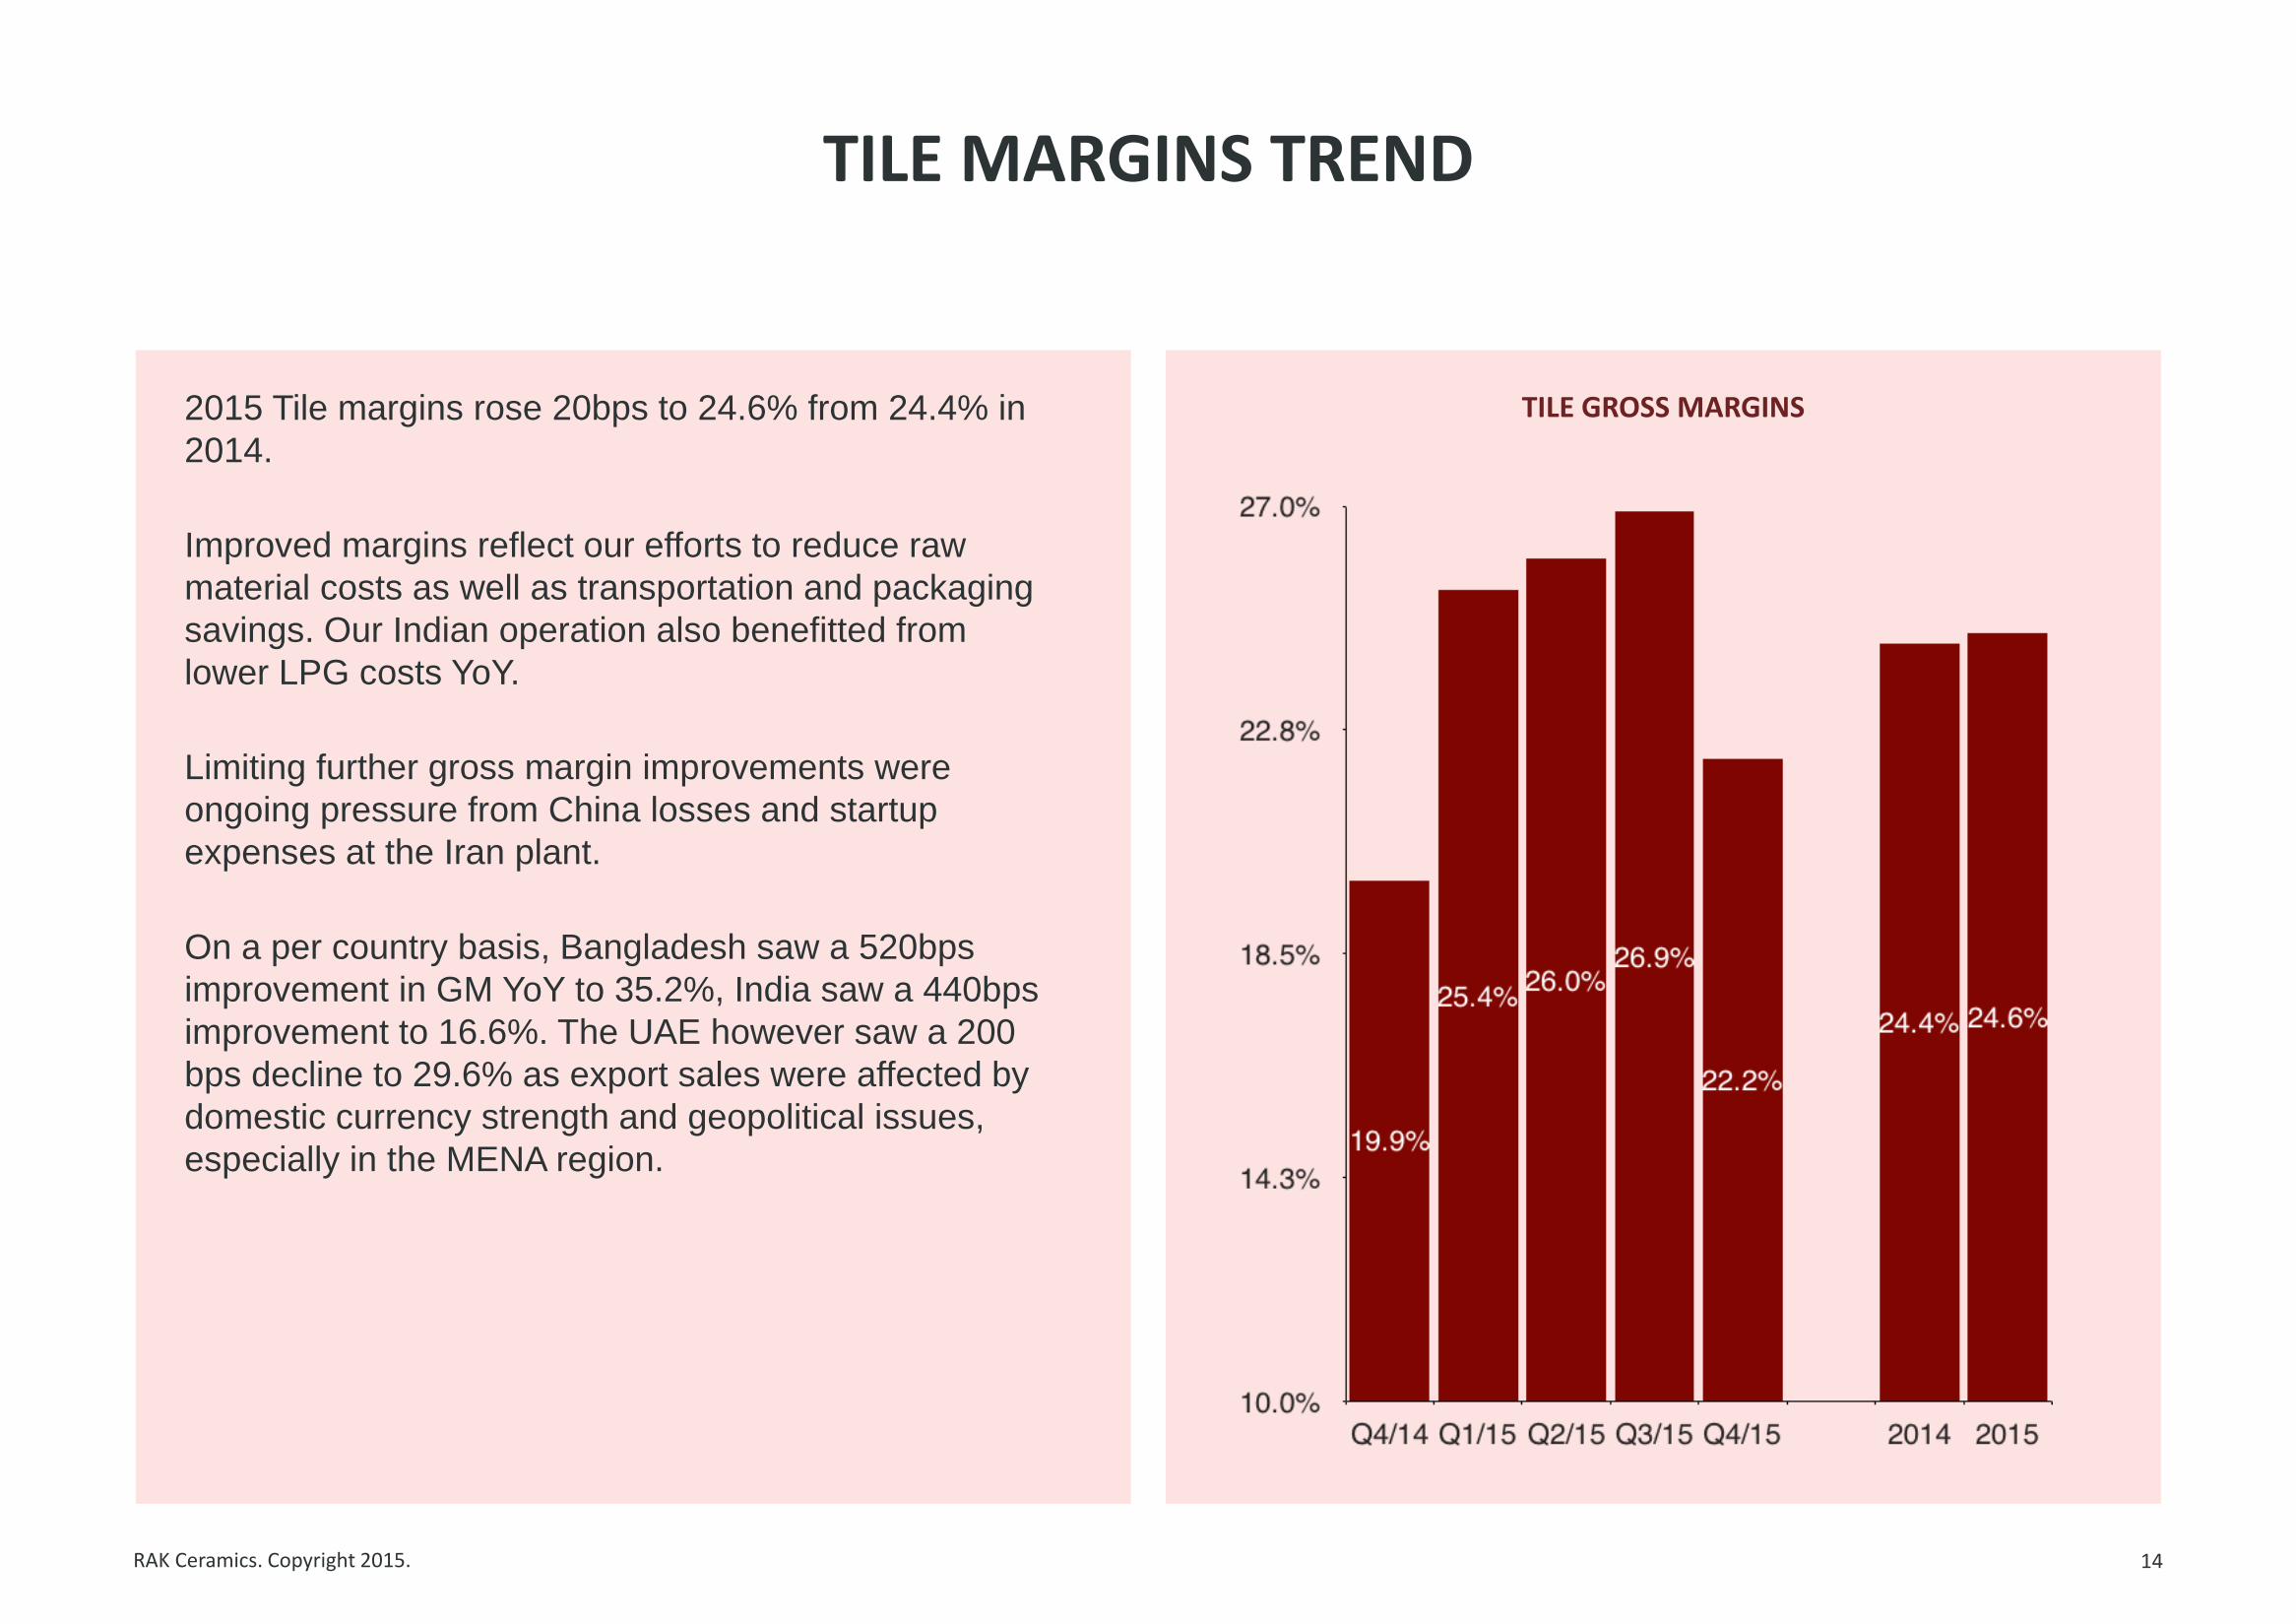
TILE GROSS MARGINS 2015 Tile margins rose 20bps to 24.6% from 24.4% in
2014.
Improved margins reflect our efforts to reduce raw
material costs as well as transportation and packaging
savings. Our Indian operation also benefitted from
lower LPG costs YoY.
Limiting further gross margin improvements were
ongoing pressure from China losses and startup
expenses at the Iran plant.
On a per country basis, Bangladesh saw a 520bps
improvement in GM YoY to 35.2%, India saw a 440bps
improvement to 16.6%. The UAE however saw a 200
bps decline to 29.6% as export sales were affected by
domestic currency strength and geopolitical issues,
especially in the MENA region.
RAK Ceramics. Copyright 2015.
SANITARYWARE MARGINS TREND
15
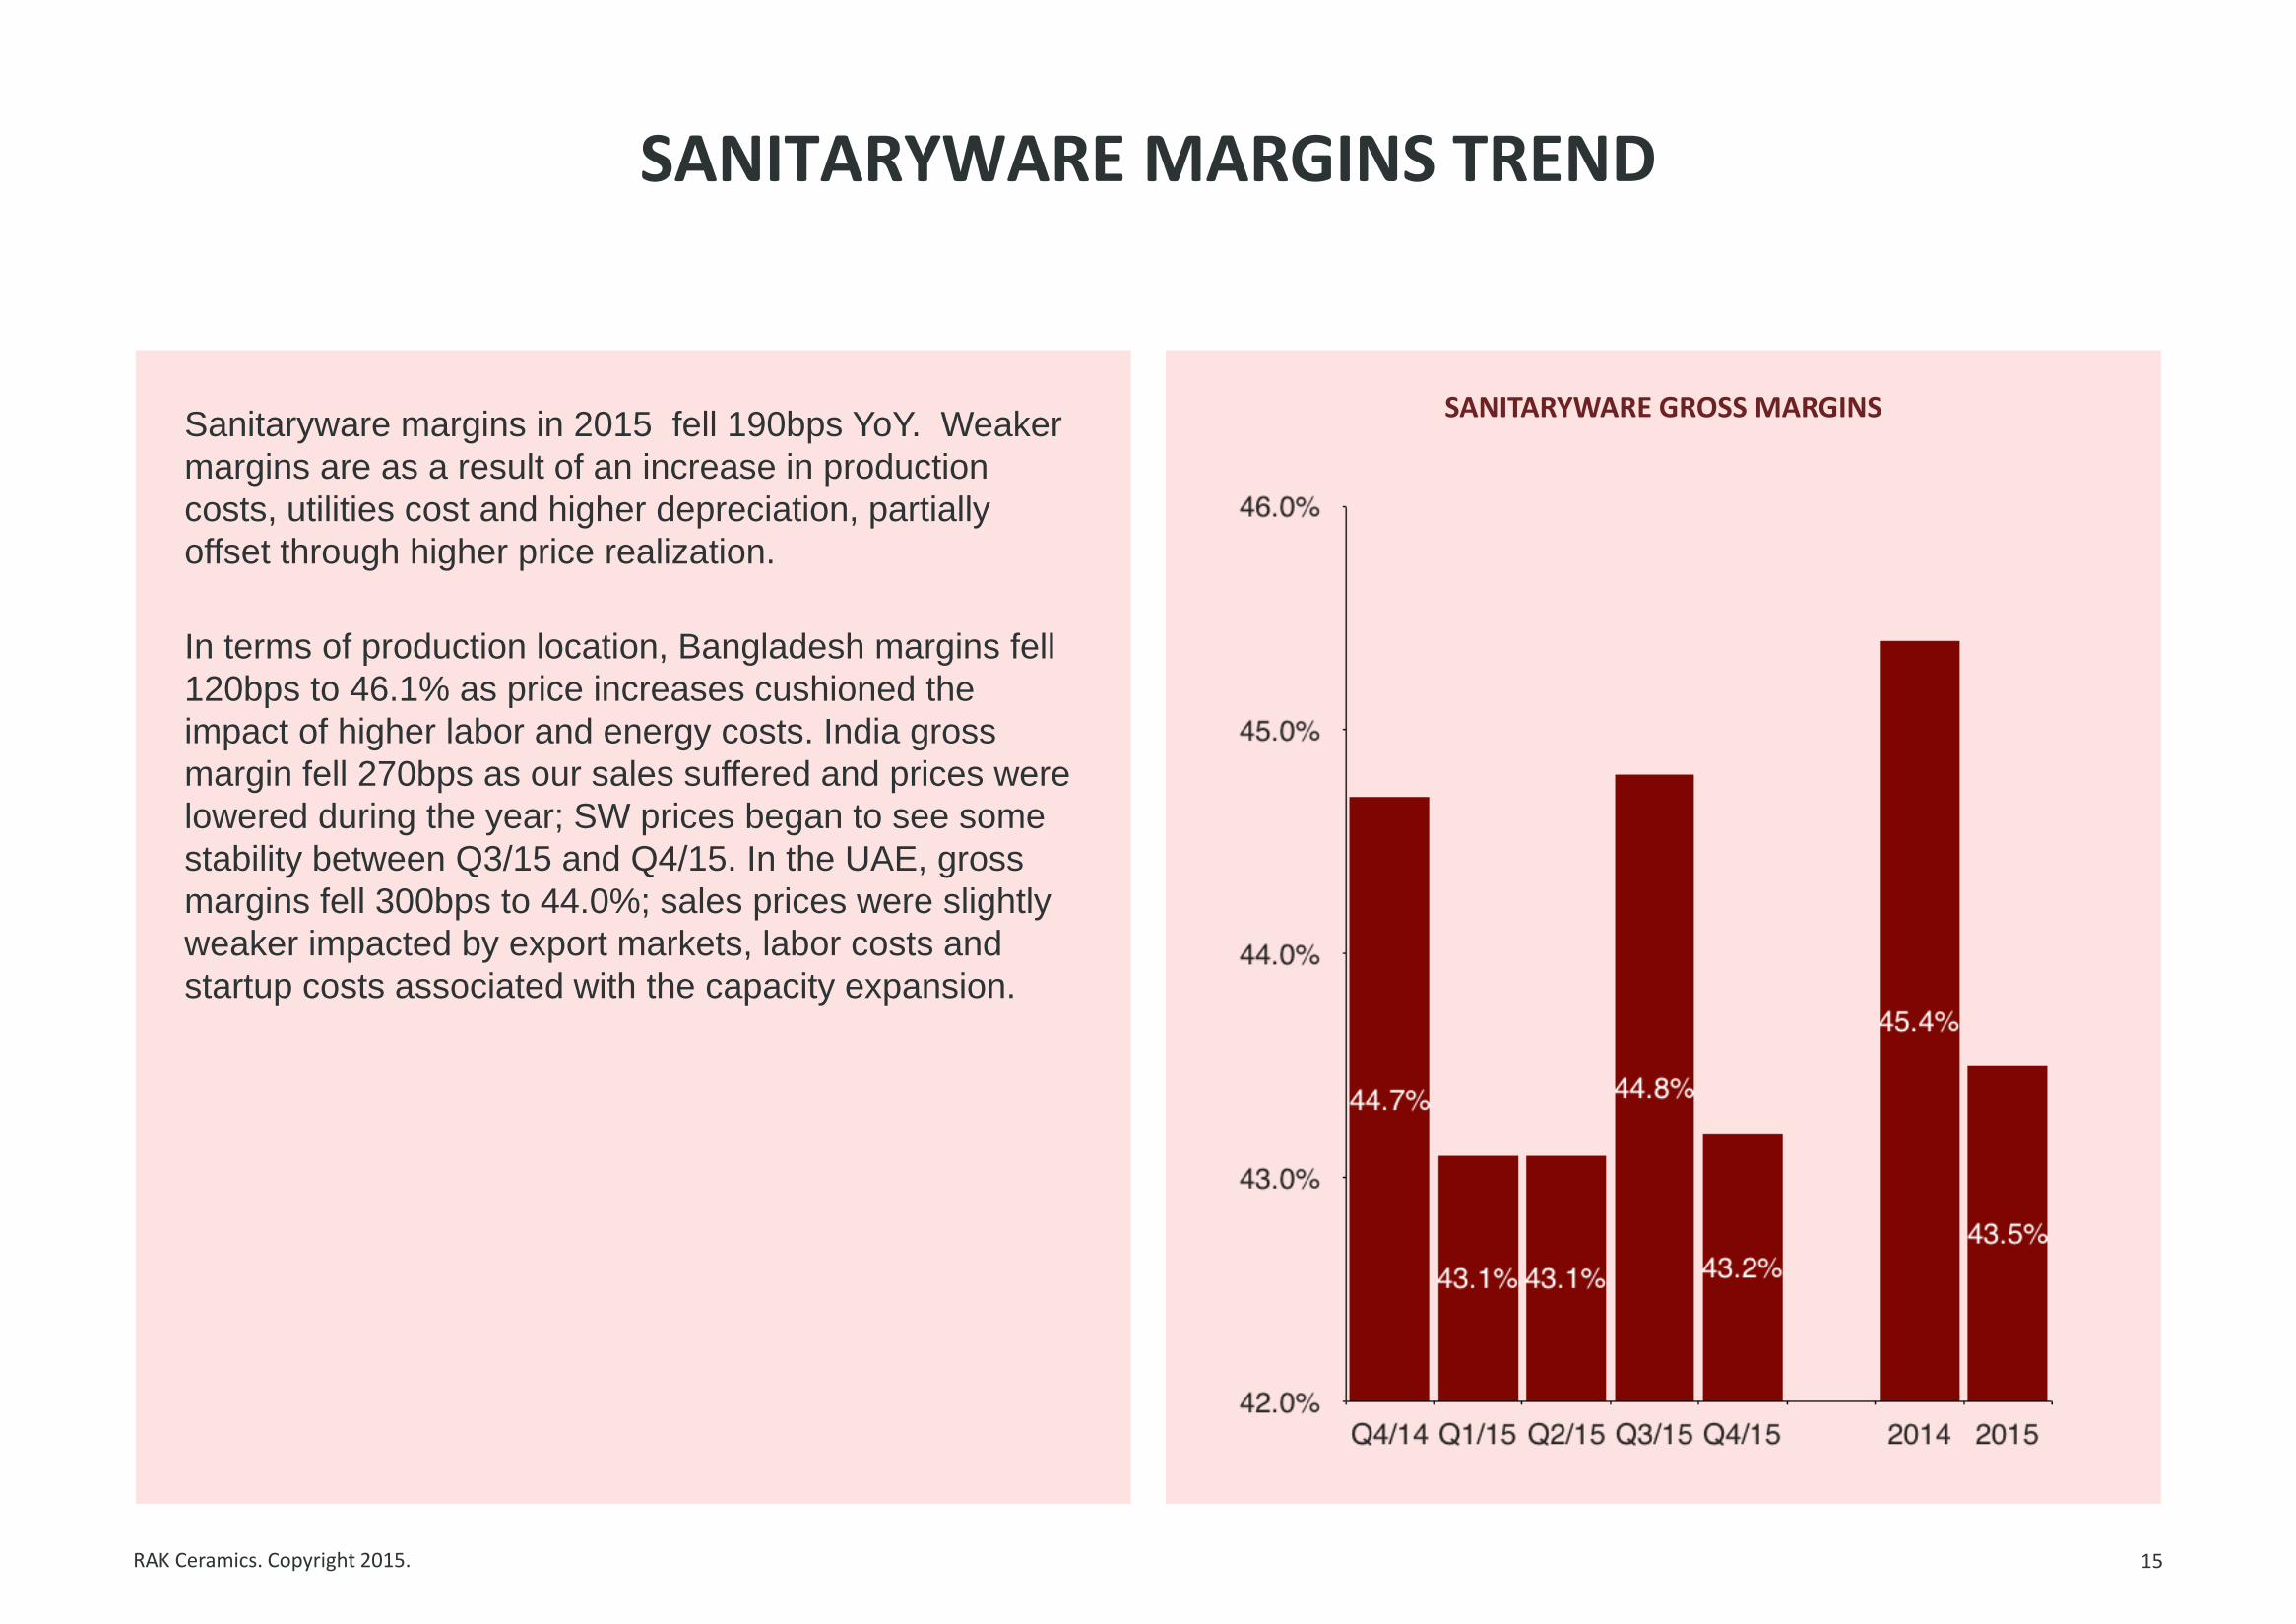
SANITARYWARE GROSS MARGINS Sanitaryware margins in 2015 fell 190bps YoY. Weaker
margins are as a result of an increase in production
costs, utilities cost and higher depreciation, partially
offset through higher price realization.
In terms of production location, Bangladesh margins fell
120bps to 46.1% as price increases cushioned the
impact of higher labor and energy costs. India gross
margin fell 270bps as our sales suffered and prices were
lowered during the year; SW prices began to see some
stability between Q3/15 and Q4/15. In the UAE, gross
margins fell 300bps to 44.0%; sales prices were slightly
weaker impacted by export markets, labor costs and
startup costs associated with the capacity expansion.
RAK Ceramics. Copyright 2015.
TABLEWARE MARGINS TREND
16
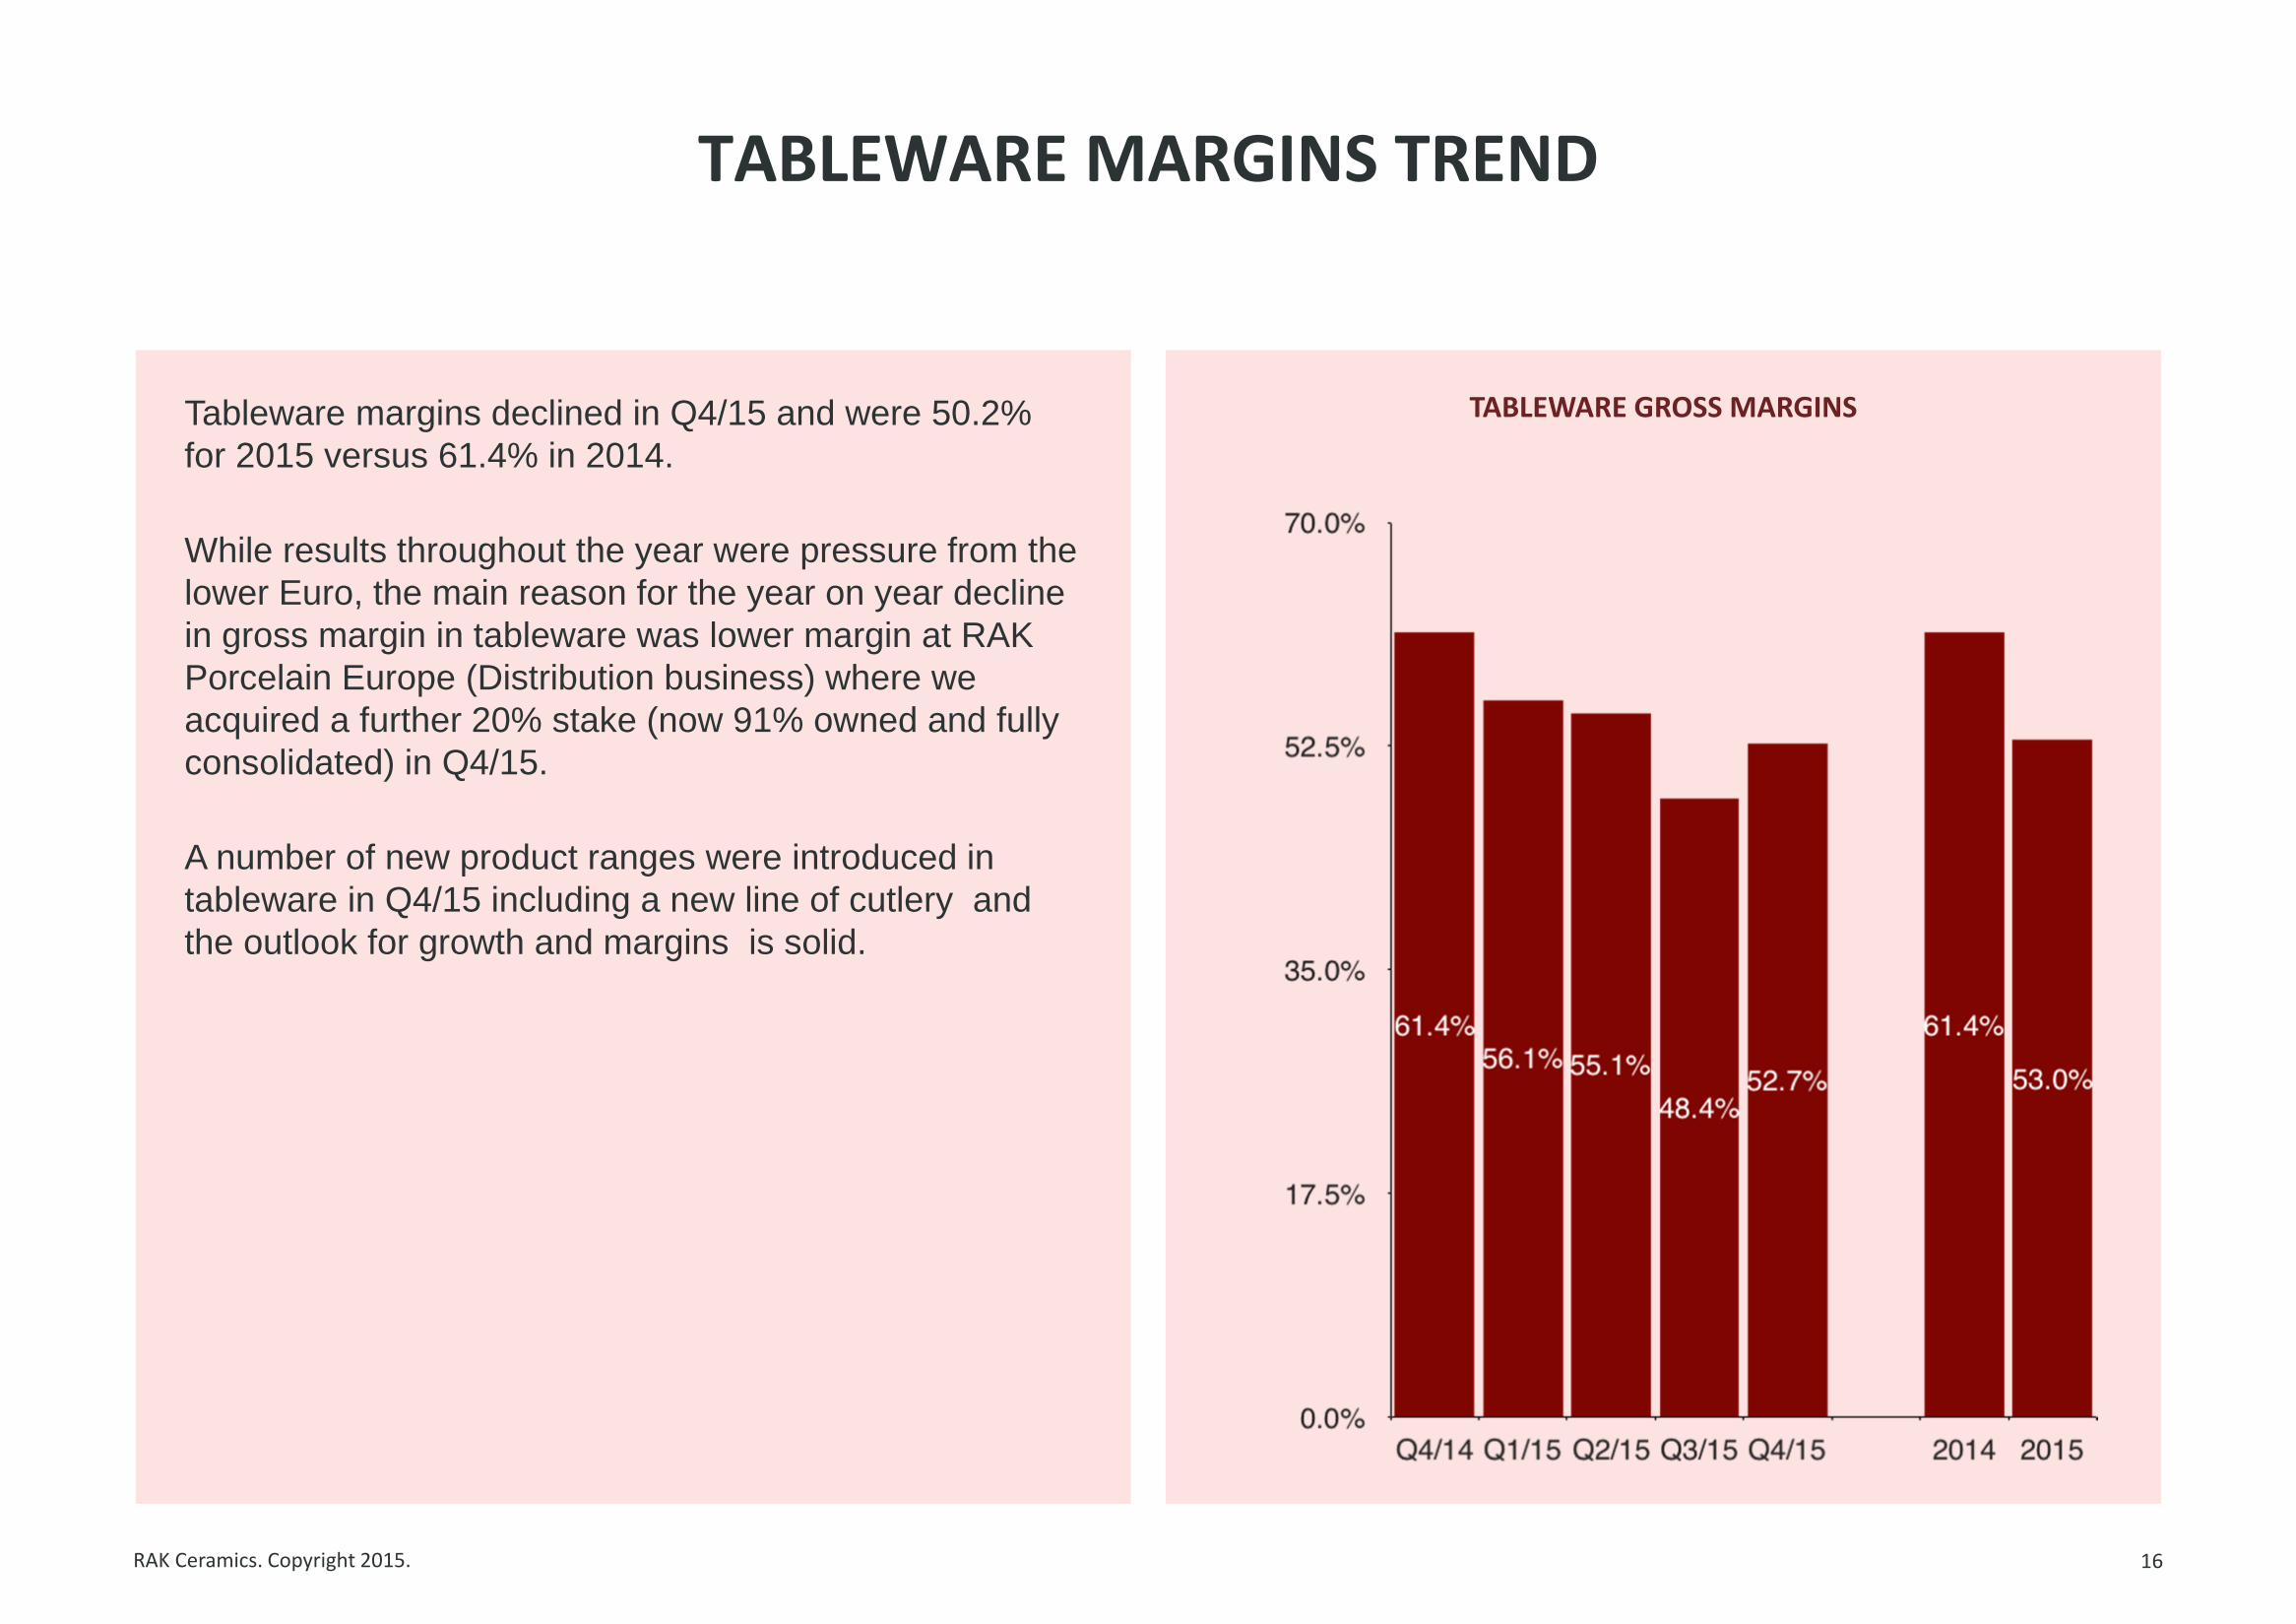
TABLEWARE GROSS MARGINS Tableware margins declined in Q4/15 and were 50.2%
for 2015 versus 61.4% in 2014.
While results throughout the year were pressure from the
lower Euro, the main reason for the year on year decline
in gross margin in tableware was lower margin at RAK
Porcelain Europe (Distribution business) where we
acquired a further 20% stake (now 91% owned and fully
consolidated) in Q4/15.
A number of new product ranges were introduced in
tableware in Q4/15 including a new line of cutlery and
the outlook for growth and margins is solid.
RAK Ceramics. Copyright 2015. Shown in (AED) Millions
WORKING CAPITAL HIGHLIGHTS
17
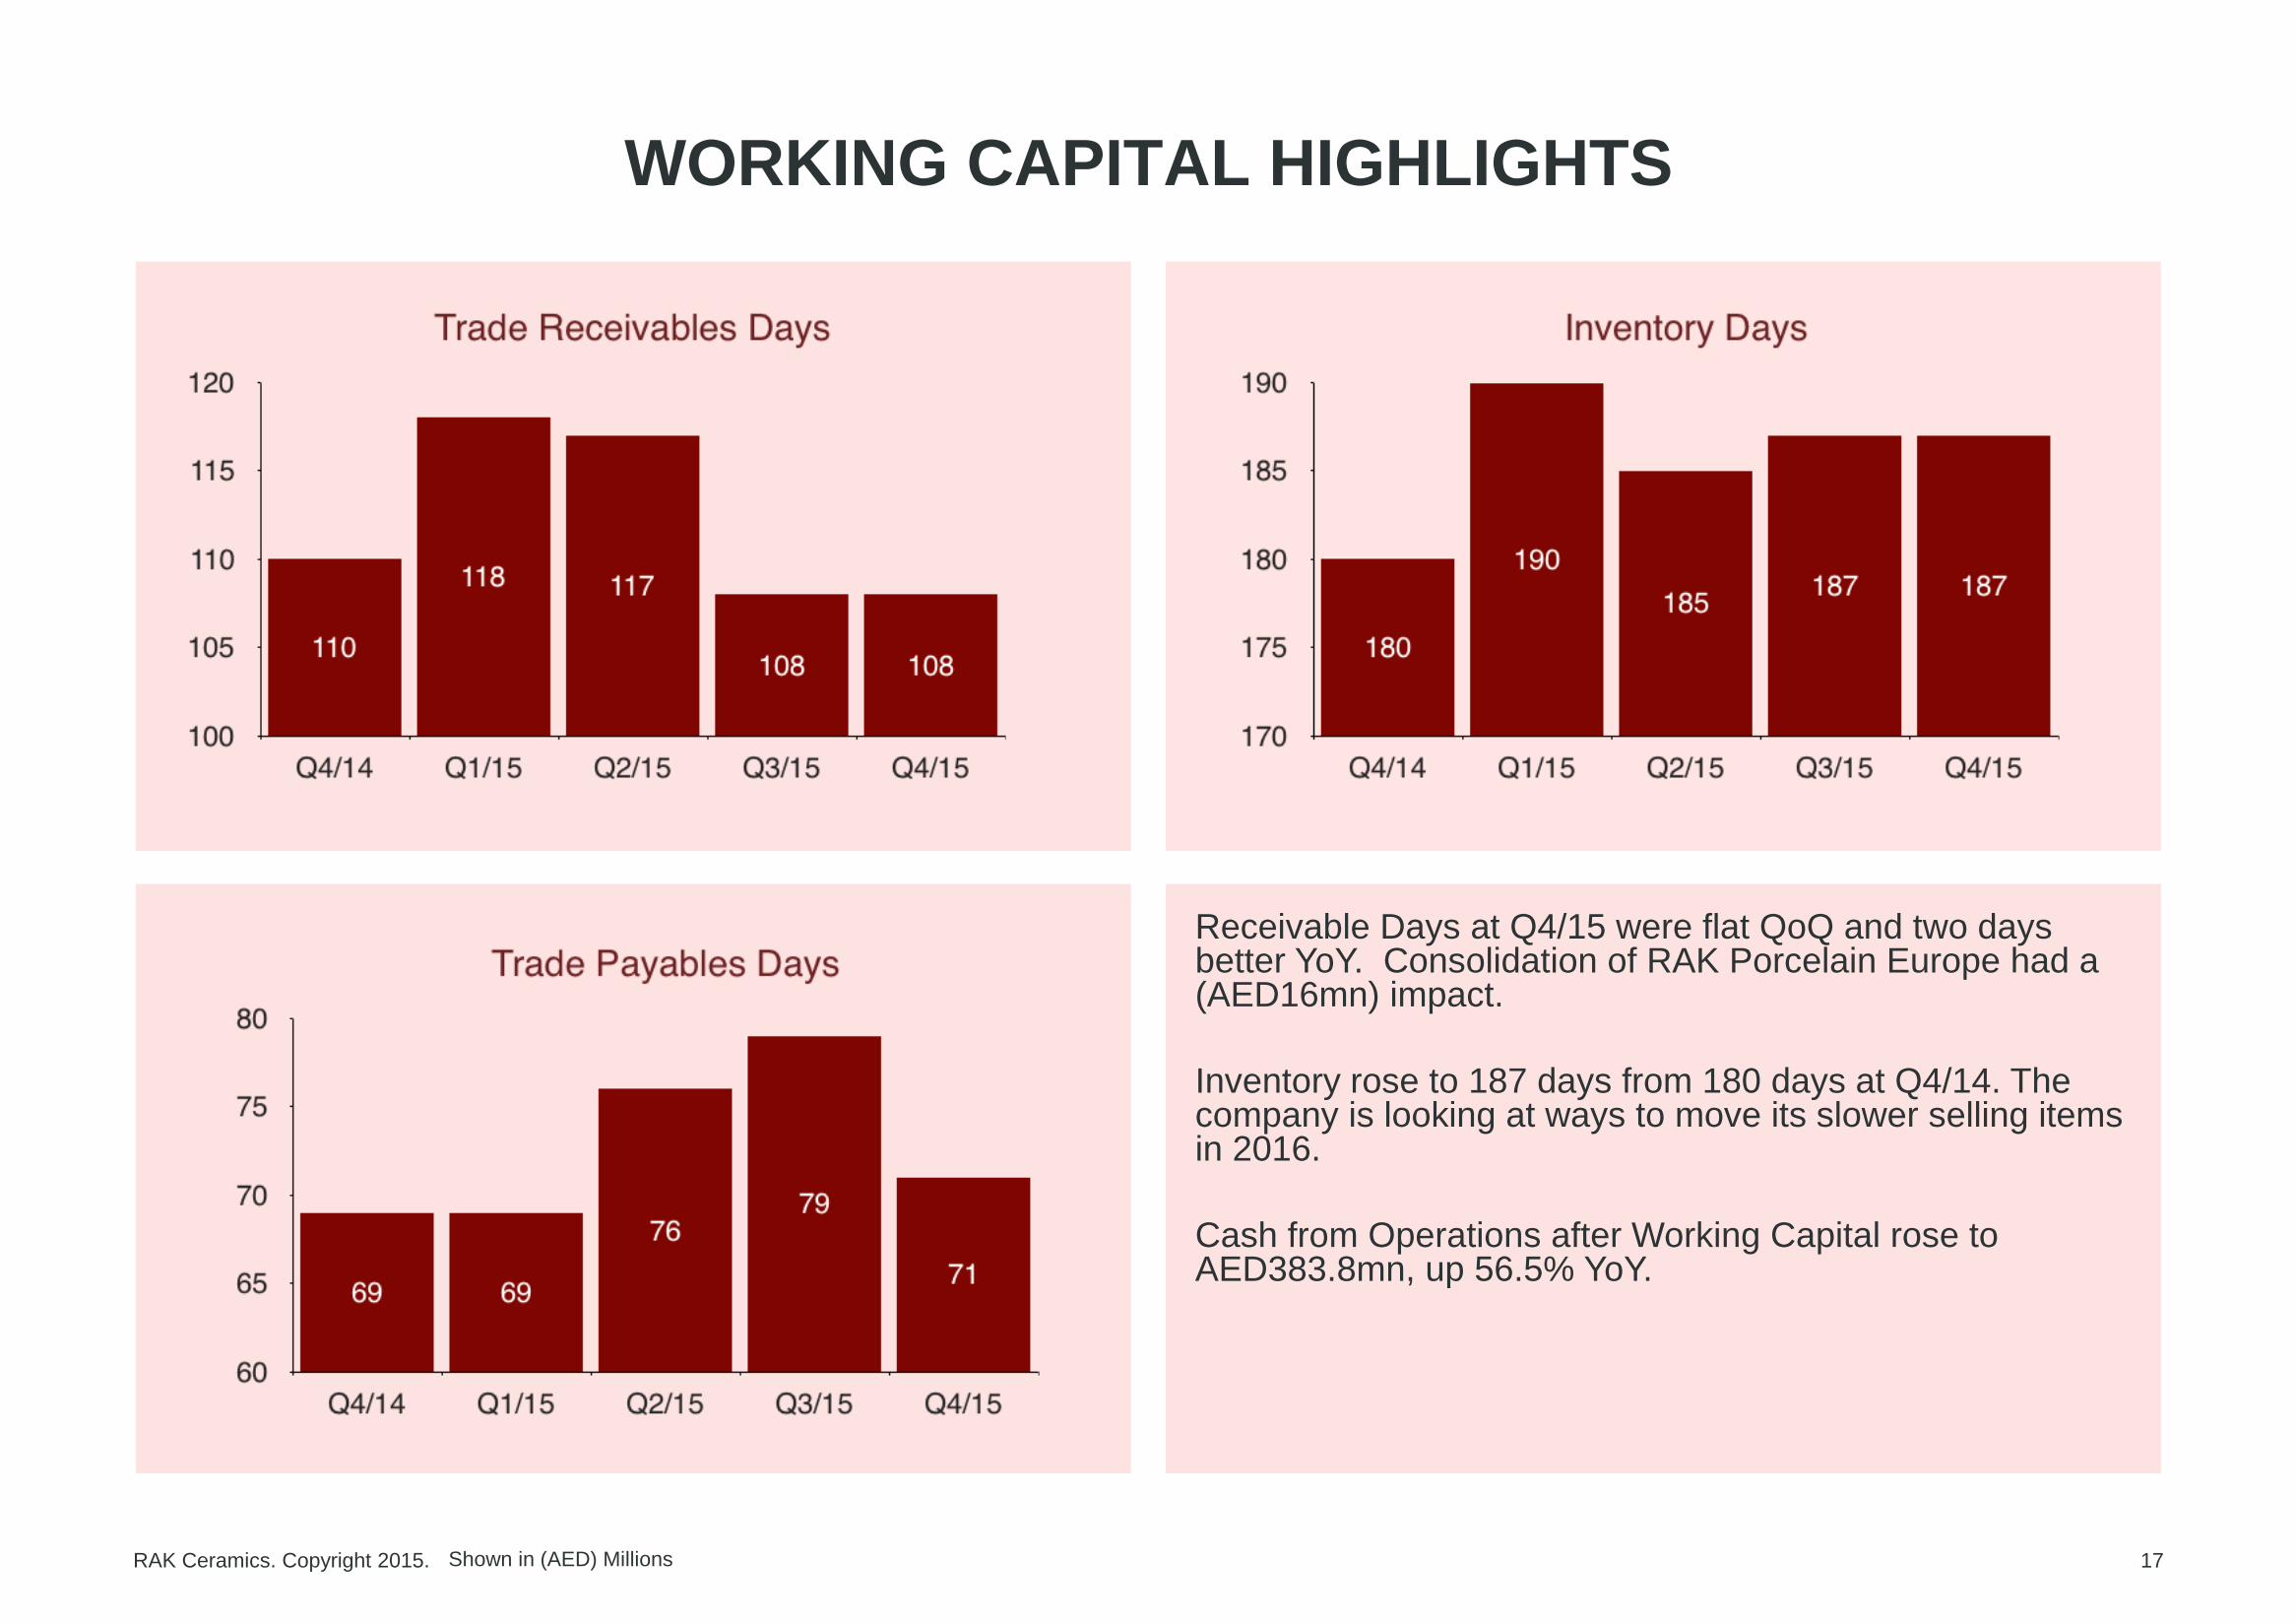
Receivable Days at Q4/15 were flat QoQ and two days better YoY. Consolidation of RAK Porcelain Europe had a (AED16mn) impact.
Inventory rose to 187 days from 180 days at Q4/14. The company is looking at ways to move its slower selling items in 2016.
Cash from Operations after Working Capital rose to AED383.8mn, up 56.5% YoY.
RAK Ceramics. Copyright 2015.
NET DEBT & CAPEX HIGHLIGHTS
18
NET DEBT
CAPEX
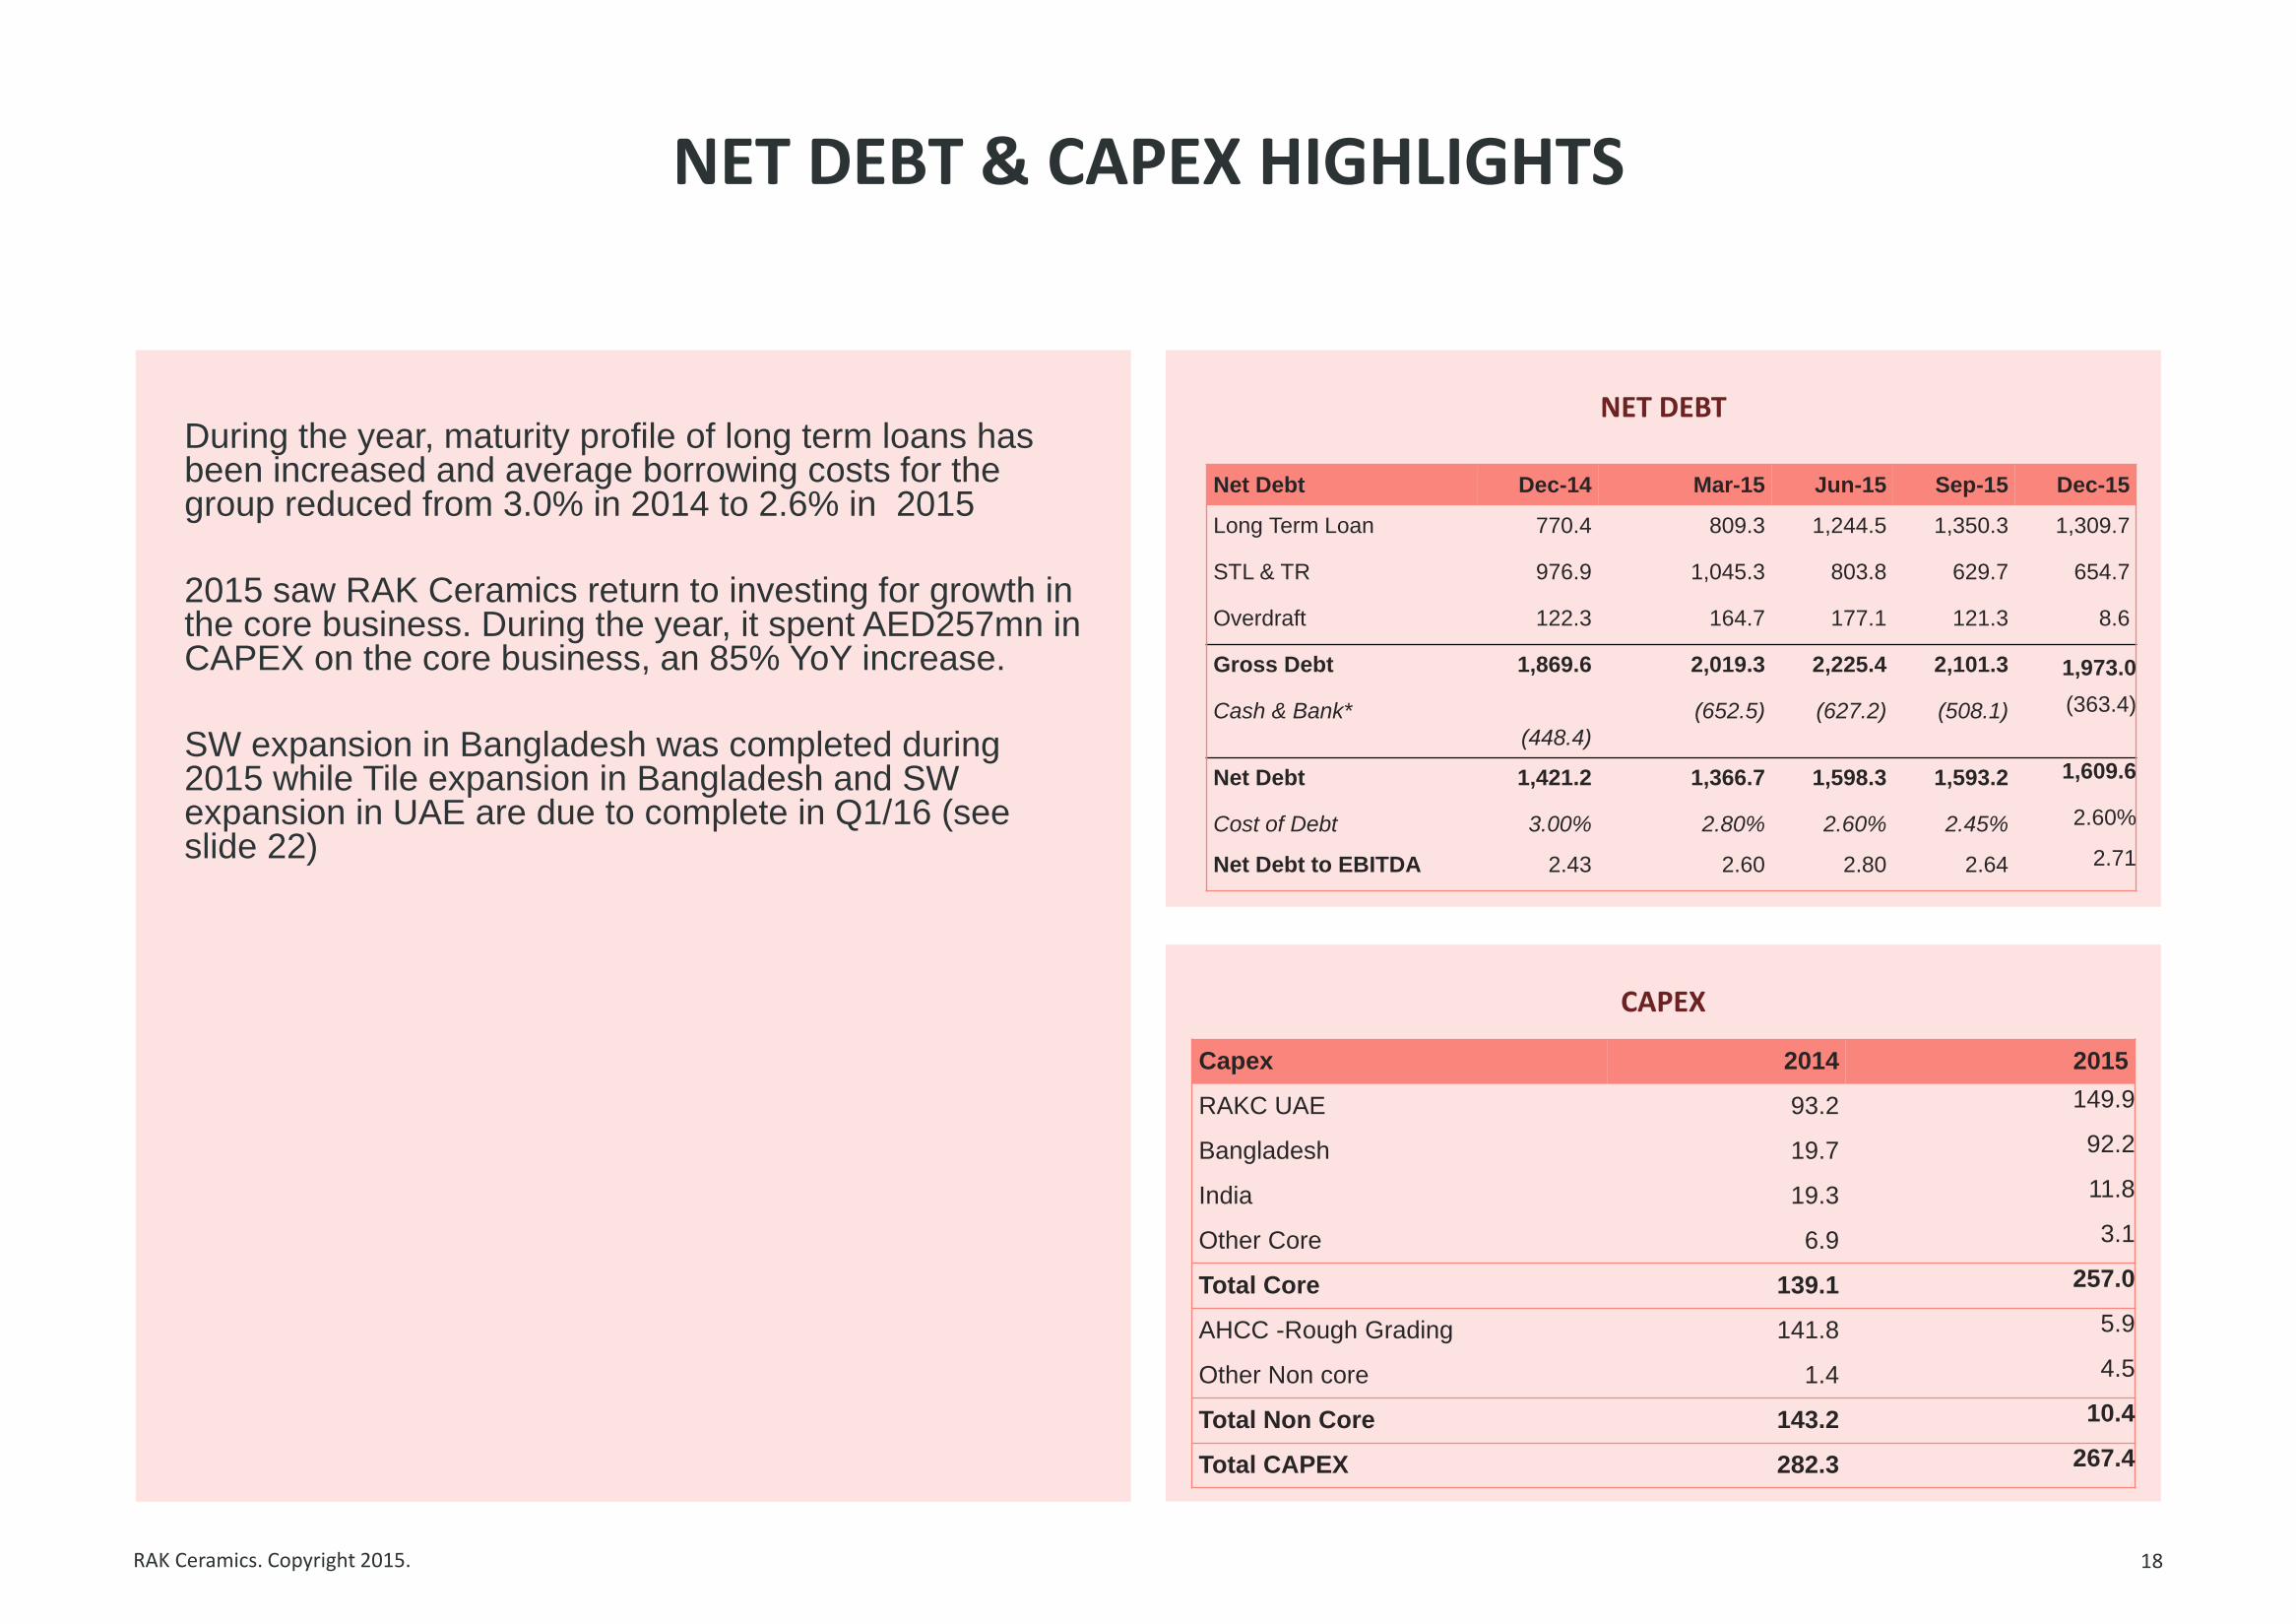
Net Debt Dec-14 Mar-15 Jun-15 Sep-15 Dec-15
Long Term Loan 770.4 809.3 1,244.5 1,350.3 1,309.7
STL & TR 976.9 1,045.3 803.8 629.7 654.7
Overdraft 122.3 164.7 177.1 121.3 8.6
Gross Debt 1,869.6 2,019.3 2,225.4 2,101.3 1,973.0
Cash & Bank* (448.4)
(652.5) (627.2) (508.1) (363.4)
Net Debt 1,421.2 1,366.7 1,598.3 1,593.2 1,609.6
Cost of Debt 3.00% 2.80% 2.60% 2.45% 2.60%
Net Debt to EBITDA 2.43 2.60 2.80 2.64 2.71
Capex 2014 2015
RAKC UAE 93.2 149.9
Bangladesh 19.7 92.2
India 19.3 11.8
Other Core 6.9 3.1
Total Core 139.1 257.0
AHCC -Rough Grading 141.8 5.9
Other Non core 1.4 4.5
Total Non Core 143.2 10.4
Total CAPEX 282.3 267.4
During the year, maturity profile of long term loans has been increased and average borrowing costs for the group reduced from 3.0% in 2014 to 2.6% in 2015
2015 saw RAK Ceramics return to investing for growth in the core business. During the year, it spent AED257mn in CAPEX on the core business, an 85% YoY increase.
SW expansion in Bangladesh was completed during 2015 while Tile expansion in Bangladesh and SW expansion in UAE are due to complete in Q1/16 (see slide 22)
RAK Ceramics. Copyright 2015.
DIVIDEND HIGHLIGHTS
19
5-YR DIVIDEND HISTORY
2010 2011 2012 2013 2014* 2015
Cash Dividend (AED per share)
0 0 0.20 0.15 0.25 0.30
Extraordinary
Cash Dividend (AED per share)
0 0 0 0 0.10 0
Stock Dividend 0% 0% 0% 10% 0% 5%
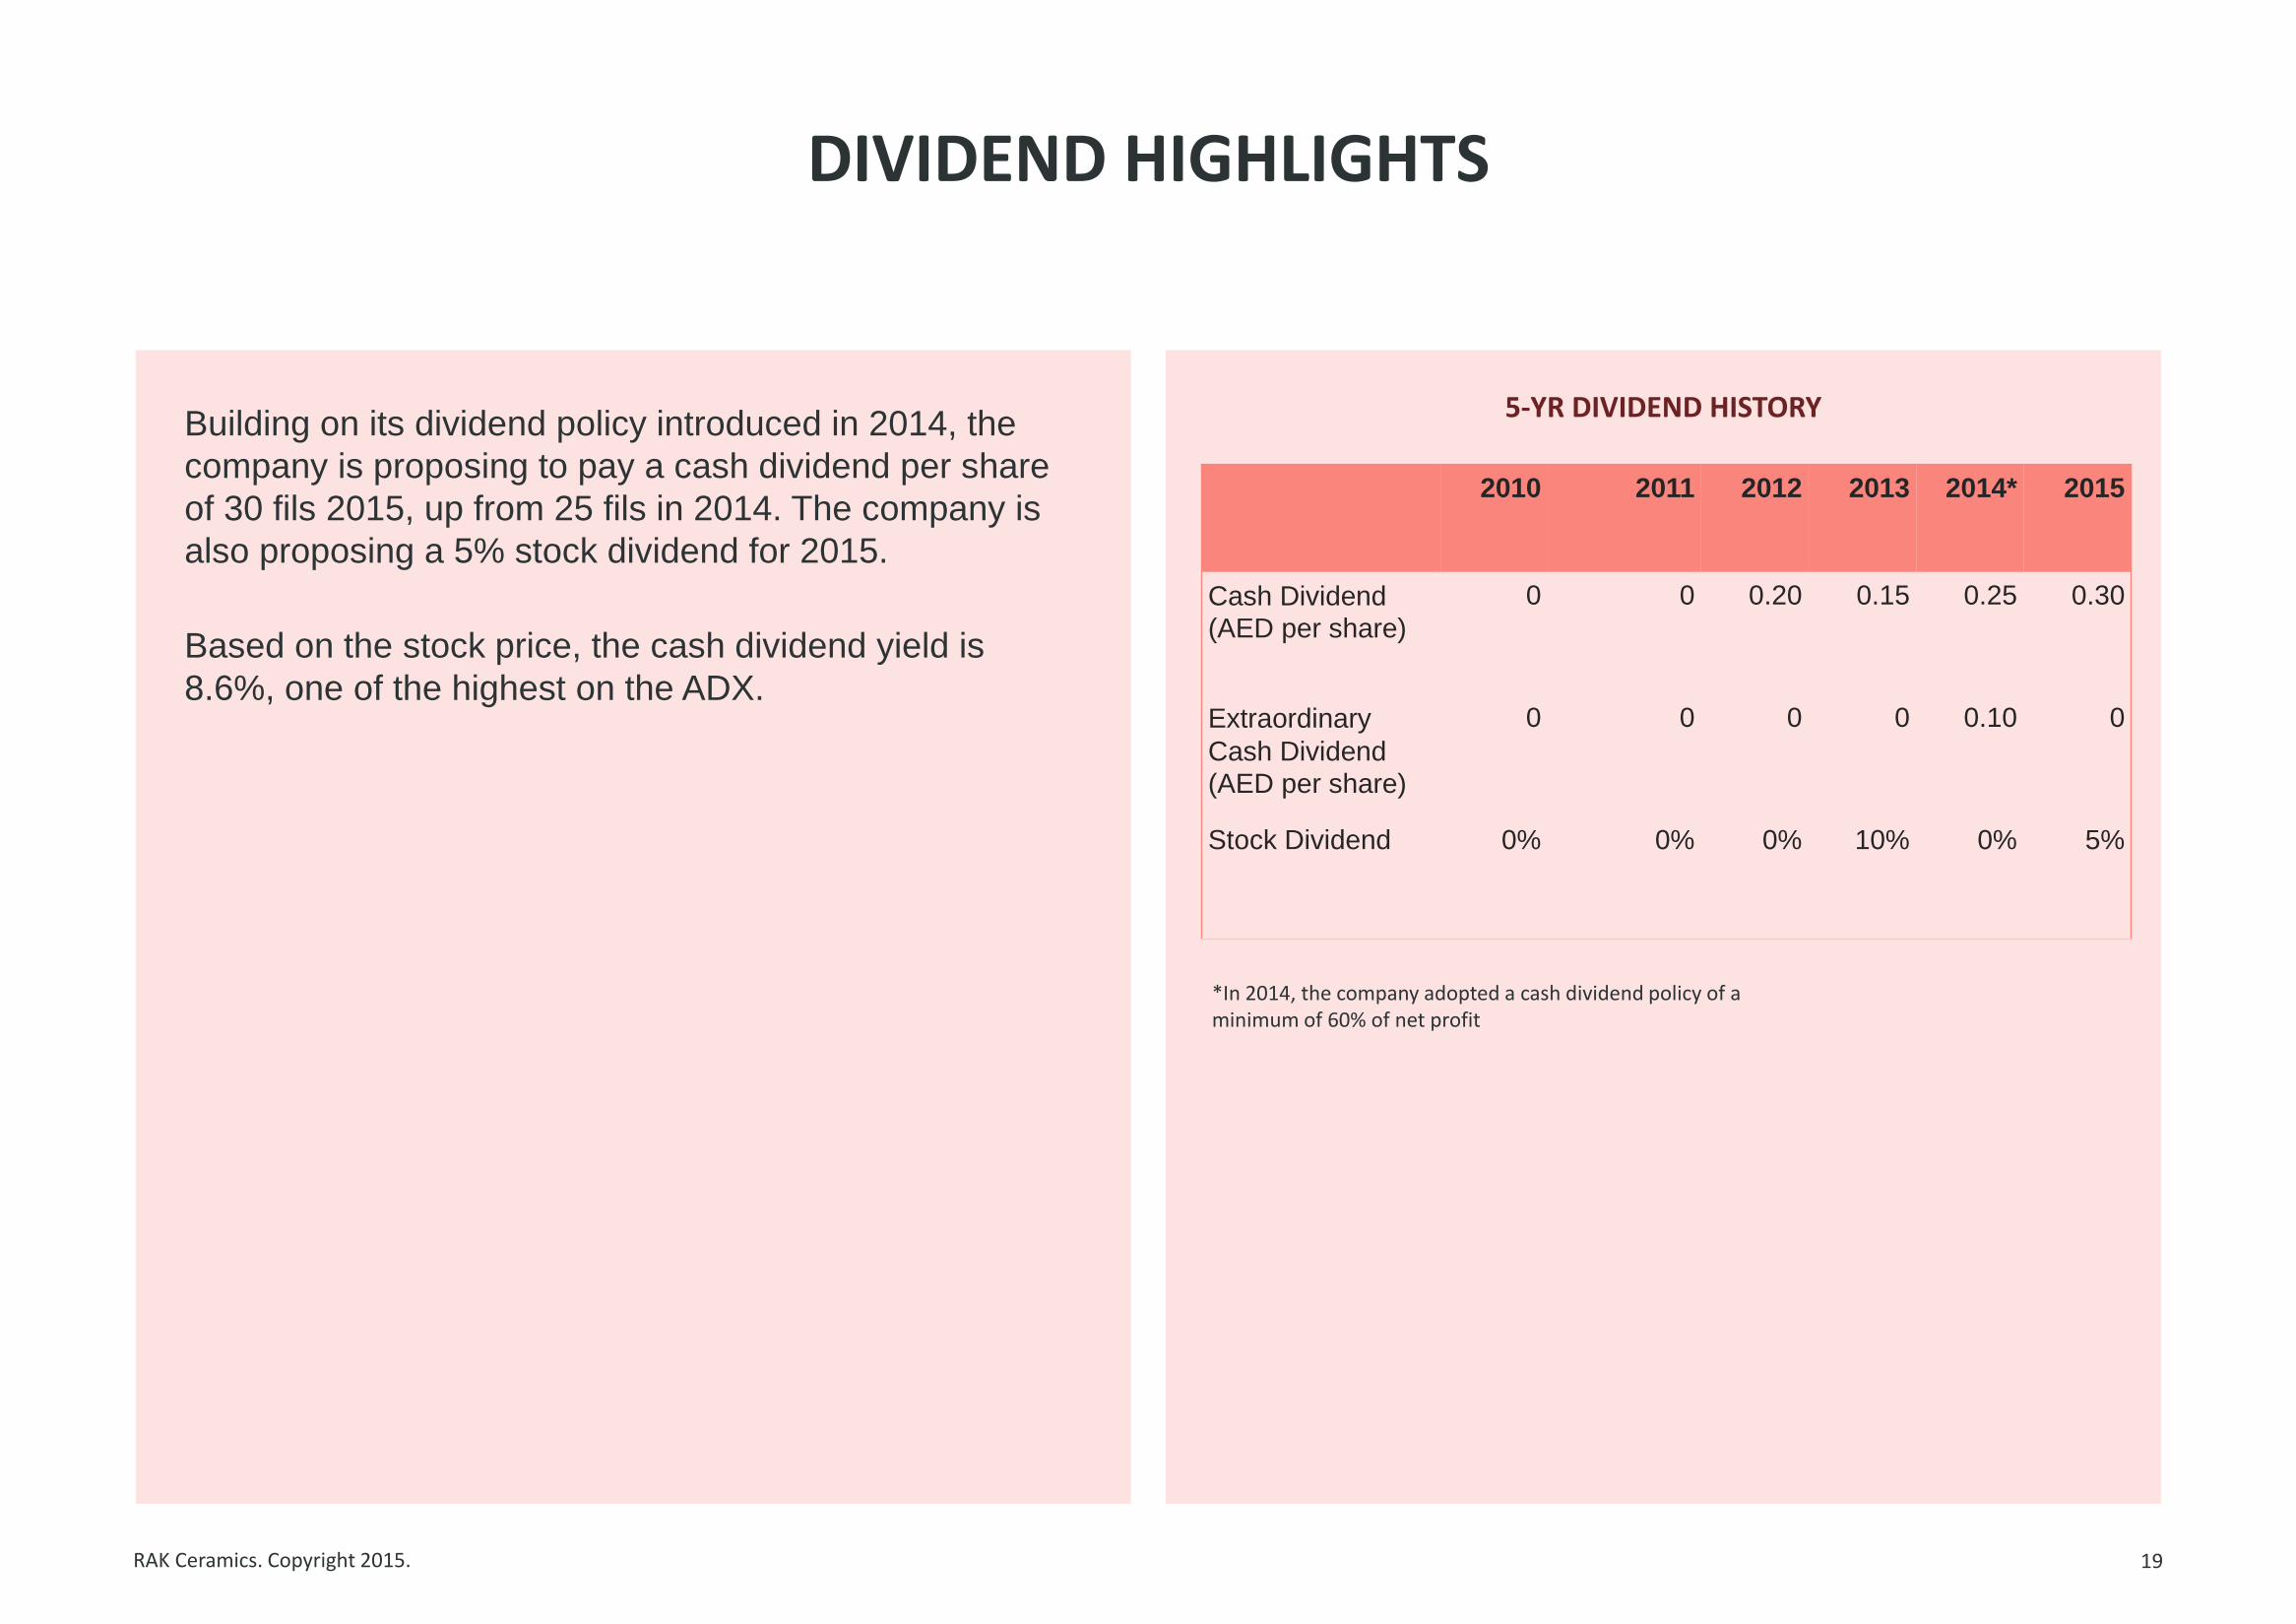
Building on its dividend policy introduced in 2014, the
company is proposing to pay a cash dividend per share
of 30 fils 2015, up from 25 fils in 2014. The company is
also proposing a 5% stock dividend for 2015.
Based on the stock price, the cash dividend yield is
8.6%, one of the highest on the ADX.
*In 2014, the company adopted a cash dividend policy of a minimum of 60% of net profit
STRATEGY & OUTLOOK
RAK Ceramics. Copyright 2015.
2016 FOCUS
21
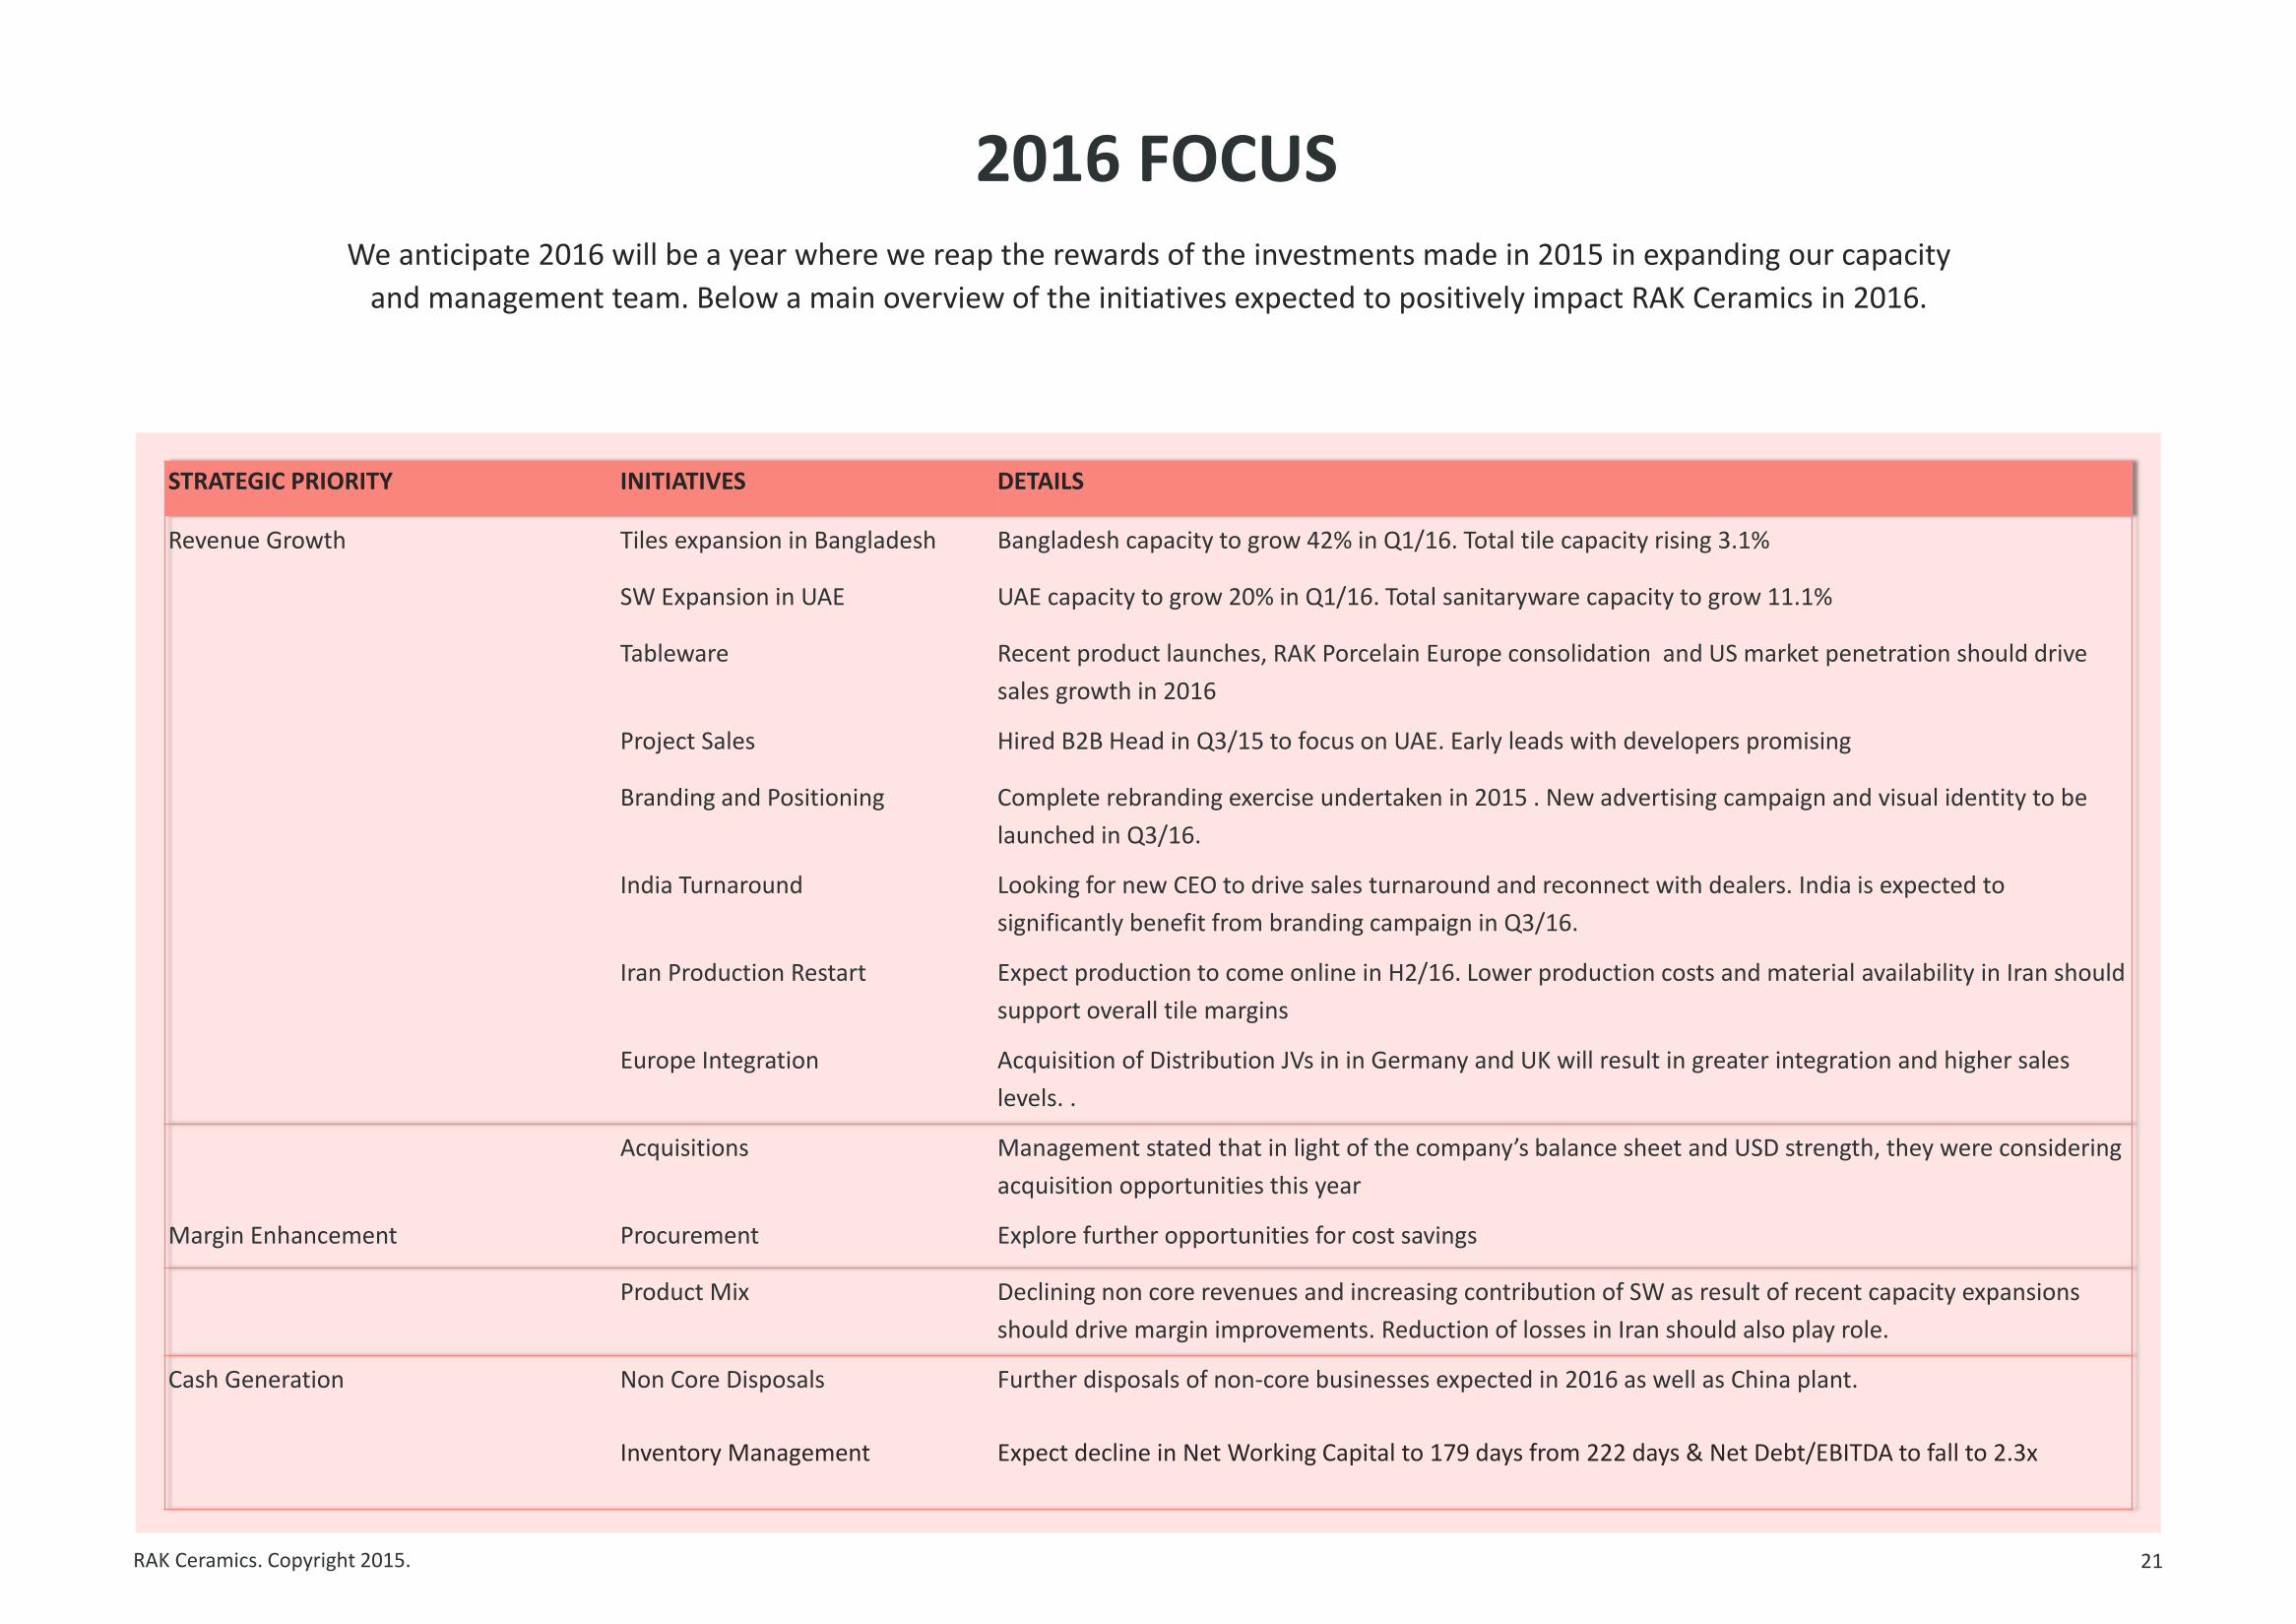
STRATEGIC PRIORITY INITIATIVES DETAILS
Revenue Growth Tiles expansion in Bangladesh Bangladesh capacity to grow 42% in Q1/16. Total tile capacity rising 3.1%
SW Expansion in UAE UAE capacity to grow 20% in Q1/16. Total sanitaryware capacity to grow 11.1%
Tableware Recent product launches, RAK Porcelain Europe consolidation and US market penetration should drive
sales growth in 2016
Project Sales Hired B2B Head in Q3/15 to focus on UAE. Early leads with developers promising
Branding and Positioning Complete rebranding exercise undertaken in 2015 . New advertising campaign and visual identity to be
launched in Q3/16.
India Turnaround Looking for new CEO to drive sales turnaround and reconnect with dealers. India is expected to
significantly benefit from branding campaign in Q3/16.
Iran Production Restart Expect production to come online in H2/16. Lower production costs and material availability in Iran should
support overall tile margins
Europe Integration Acquisition of Distribution JVs in in Germany and UK will result in greater integration and higher sales
levels. .
Acquisitions Management stated that in light of the company’s balance sheet and USD strength, they were considering
acquisition opportunities this year
Margin Enhancement Procurement Explore further opportunities for cost savings
Product Mix Declining non core revenues and increasing contribution of SW as result of recent capacity expansions
should drive margin improvements. Reduction of losses in Iran should also play role.
Cash Generation Non Core Disposals Further disposals of non-core businesses expected in 2016 as well as China plant.
Inventory Management Expect decline in Net Working Capital to 179 days from 222 days & Net Debt/EBITDA to fall to 2.3x
We anticipate 2016 will be a year where we reap the rewards of the investments made in 2015 in expanding our capacity
and management team. Below a main overview of the initiatives expected to positively impact RAK Ceramics in 2016.
RAK Ceramics. Copyright 2015.
CAPACITY GROWTH RESUMES
22
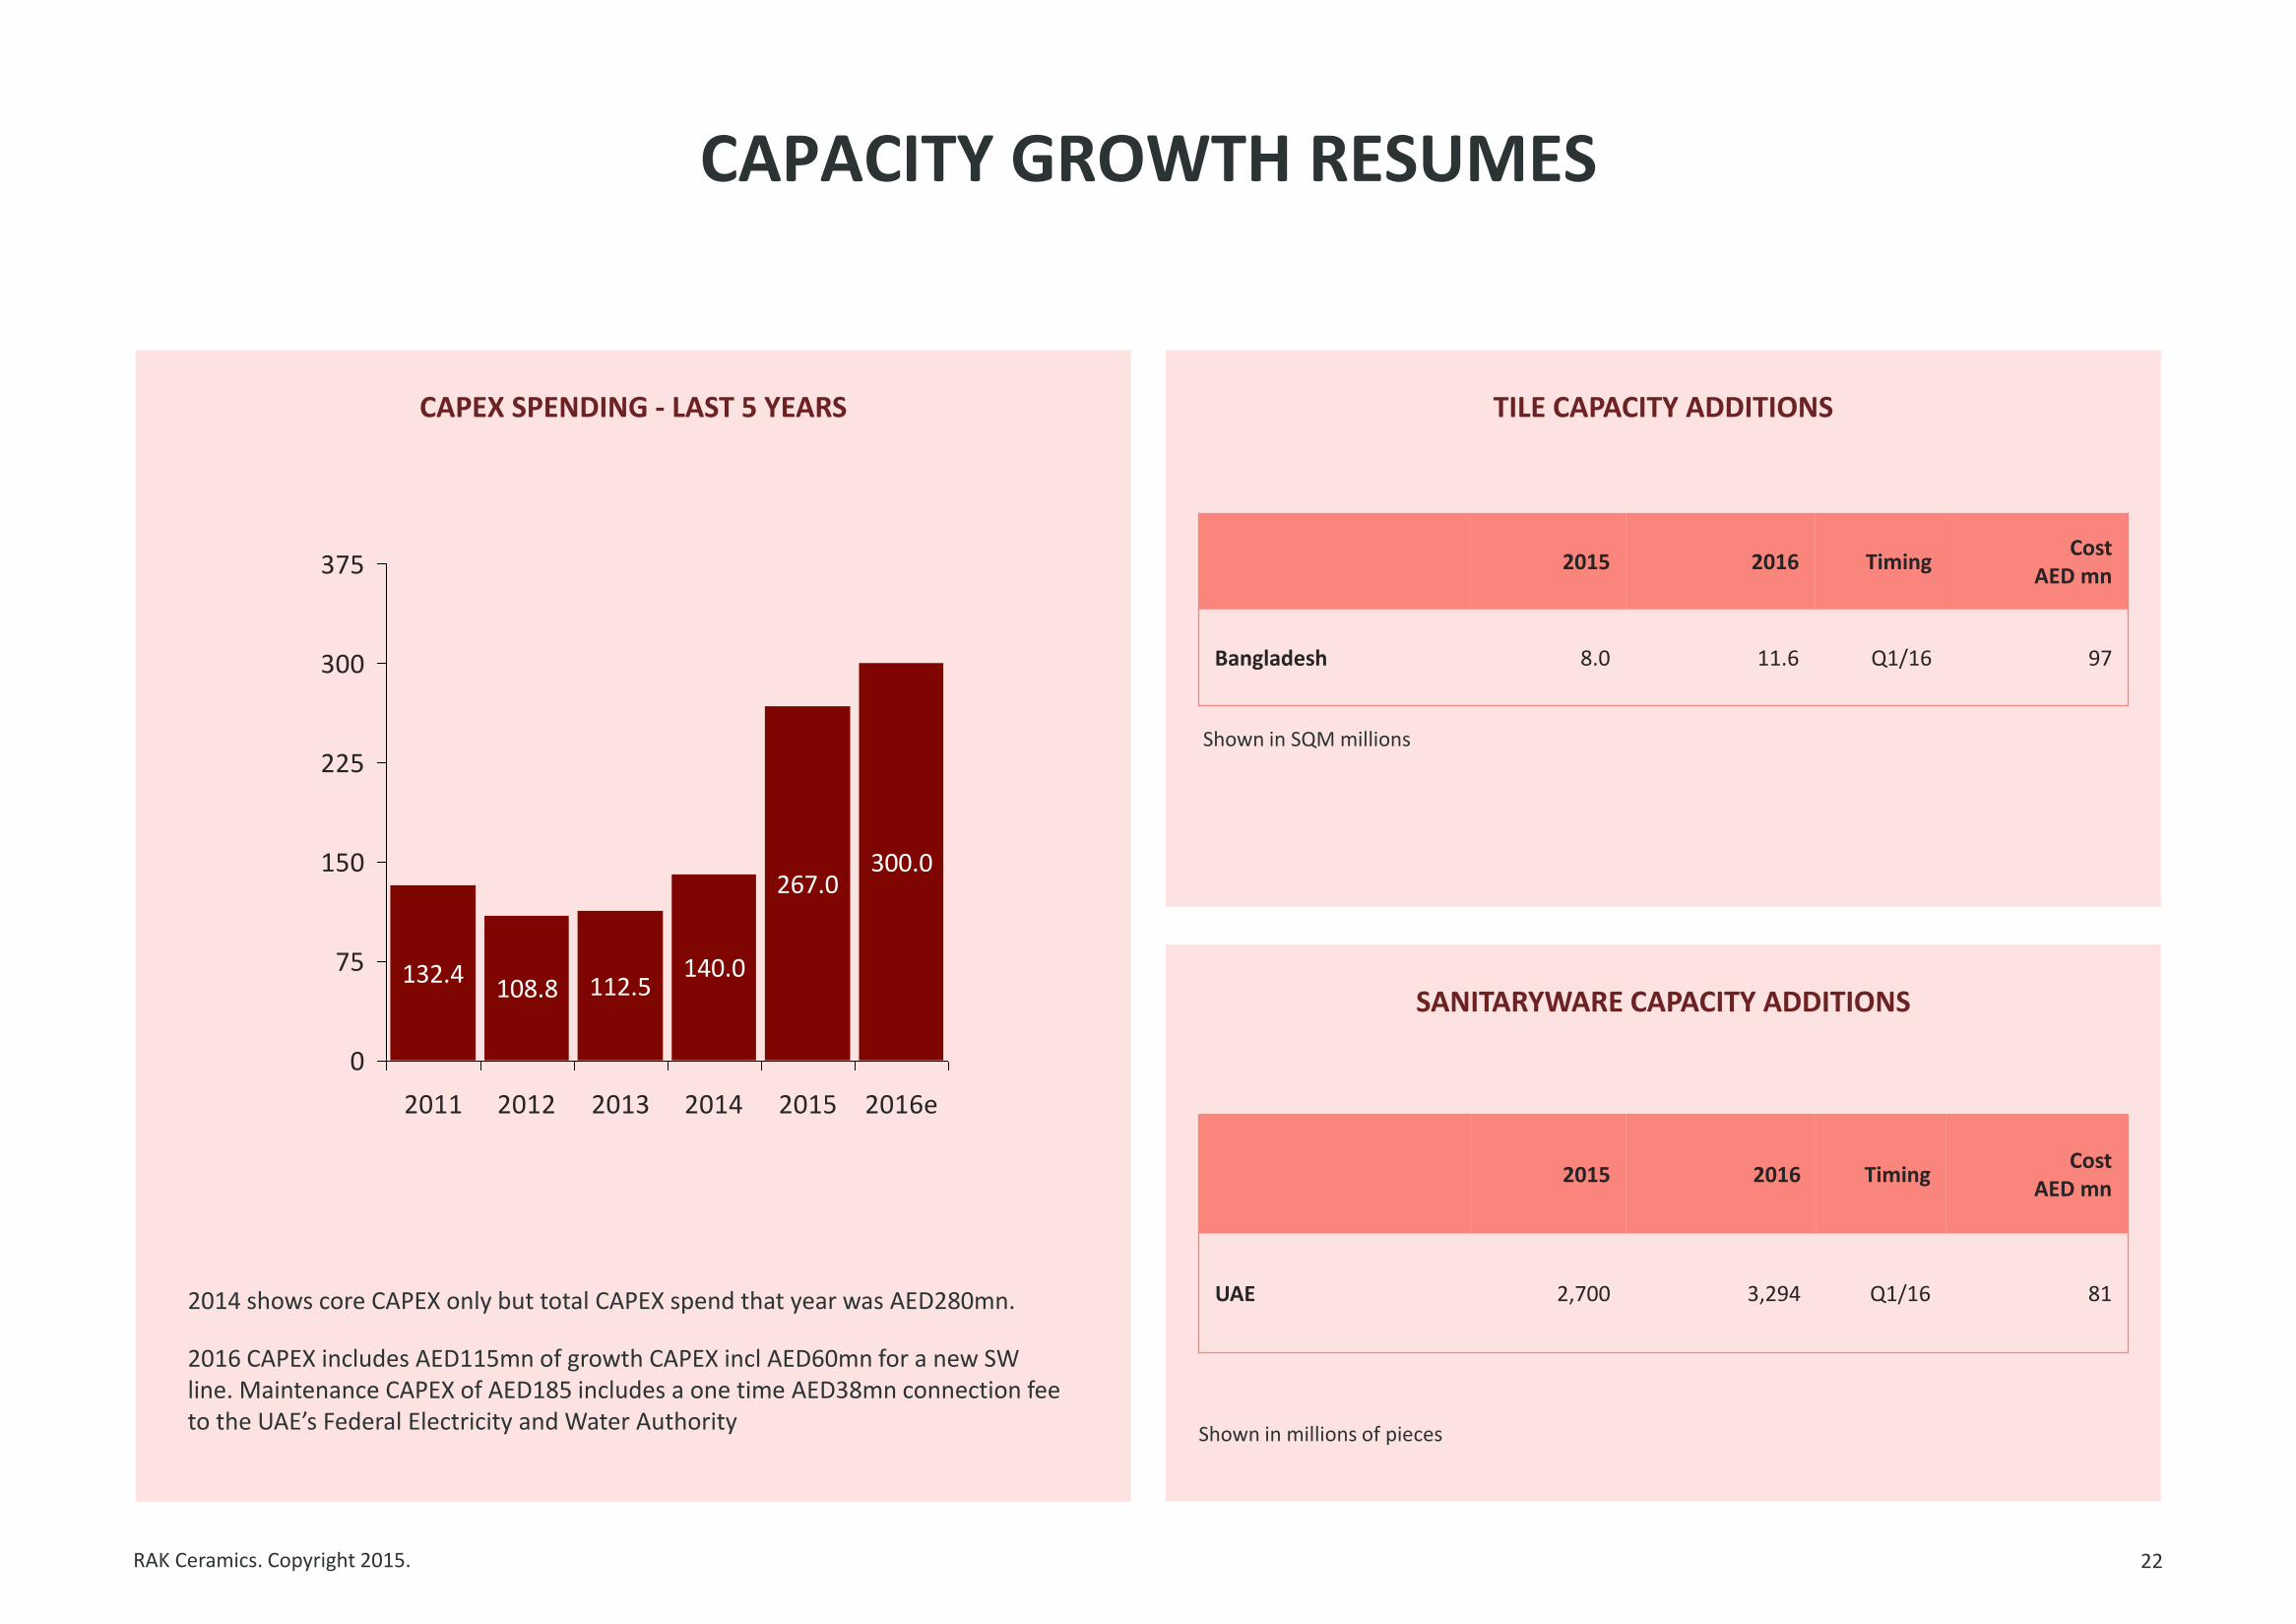
CAPEX SPENDING - LAST 5 YEARS TILE CAPACITY ADDITIONS
SANITARYWARE CAPACITY ADDITIONS 132.4
108.8 112.5140.0
267.0300.0
0
75
150
225
300
375
2011 2012 2013 2014 2015 2016e
2015 2016 Timing Cost
AED mn
UAE 2,700 3,294 Q1/16 81
2015 2016 Timing Cost
AED mn
Bangladesh 8.0 11.6 Q1/16 97
Shown in SQM millions
Shown in millions of pieces
2014 shows core CAPEX only but total CAPEX spend that year was AED280mn.
2016 CAPEX includes AED115mn of growth CAPEX incl AED60mn for a new SW line. Maintenance CAPEX of AED185 includes a one time AED38mn connection fee to the UAE’s Federal Electricity and Water Authority
RAK Ceramics. Copyright 2015.
GCC BUILDING ENVIRONMENT REMAINS SUPPORTIVE
23
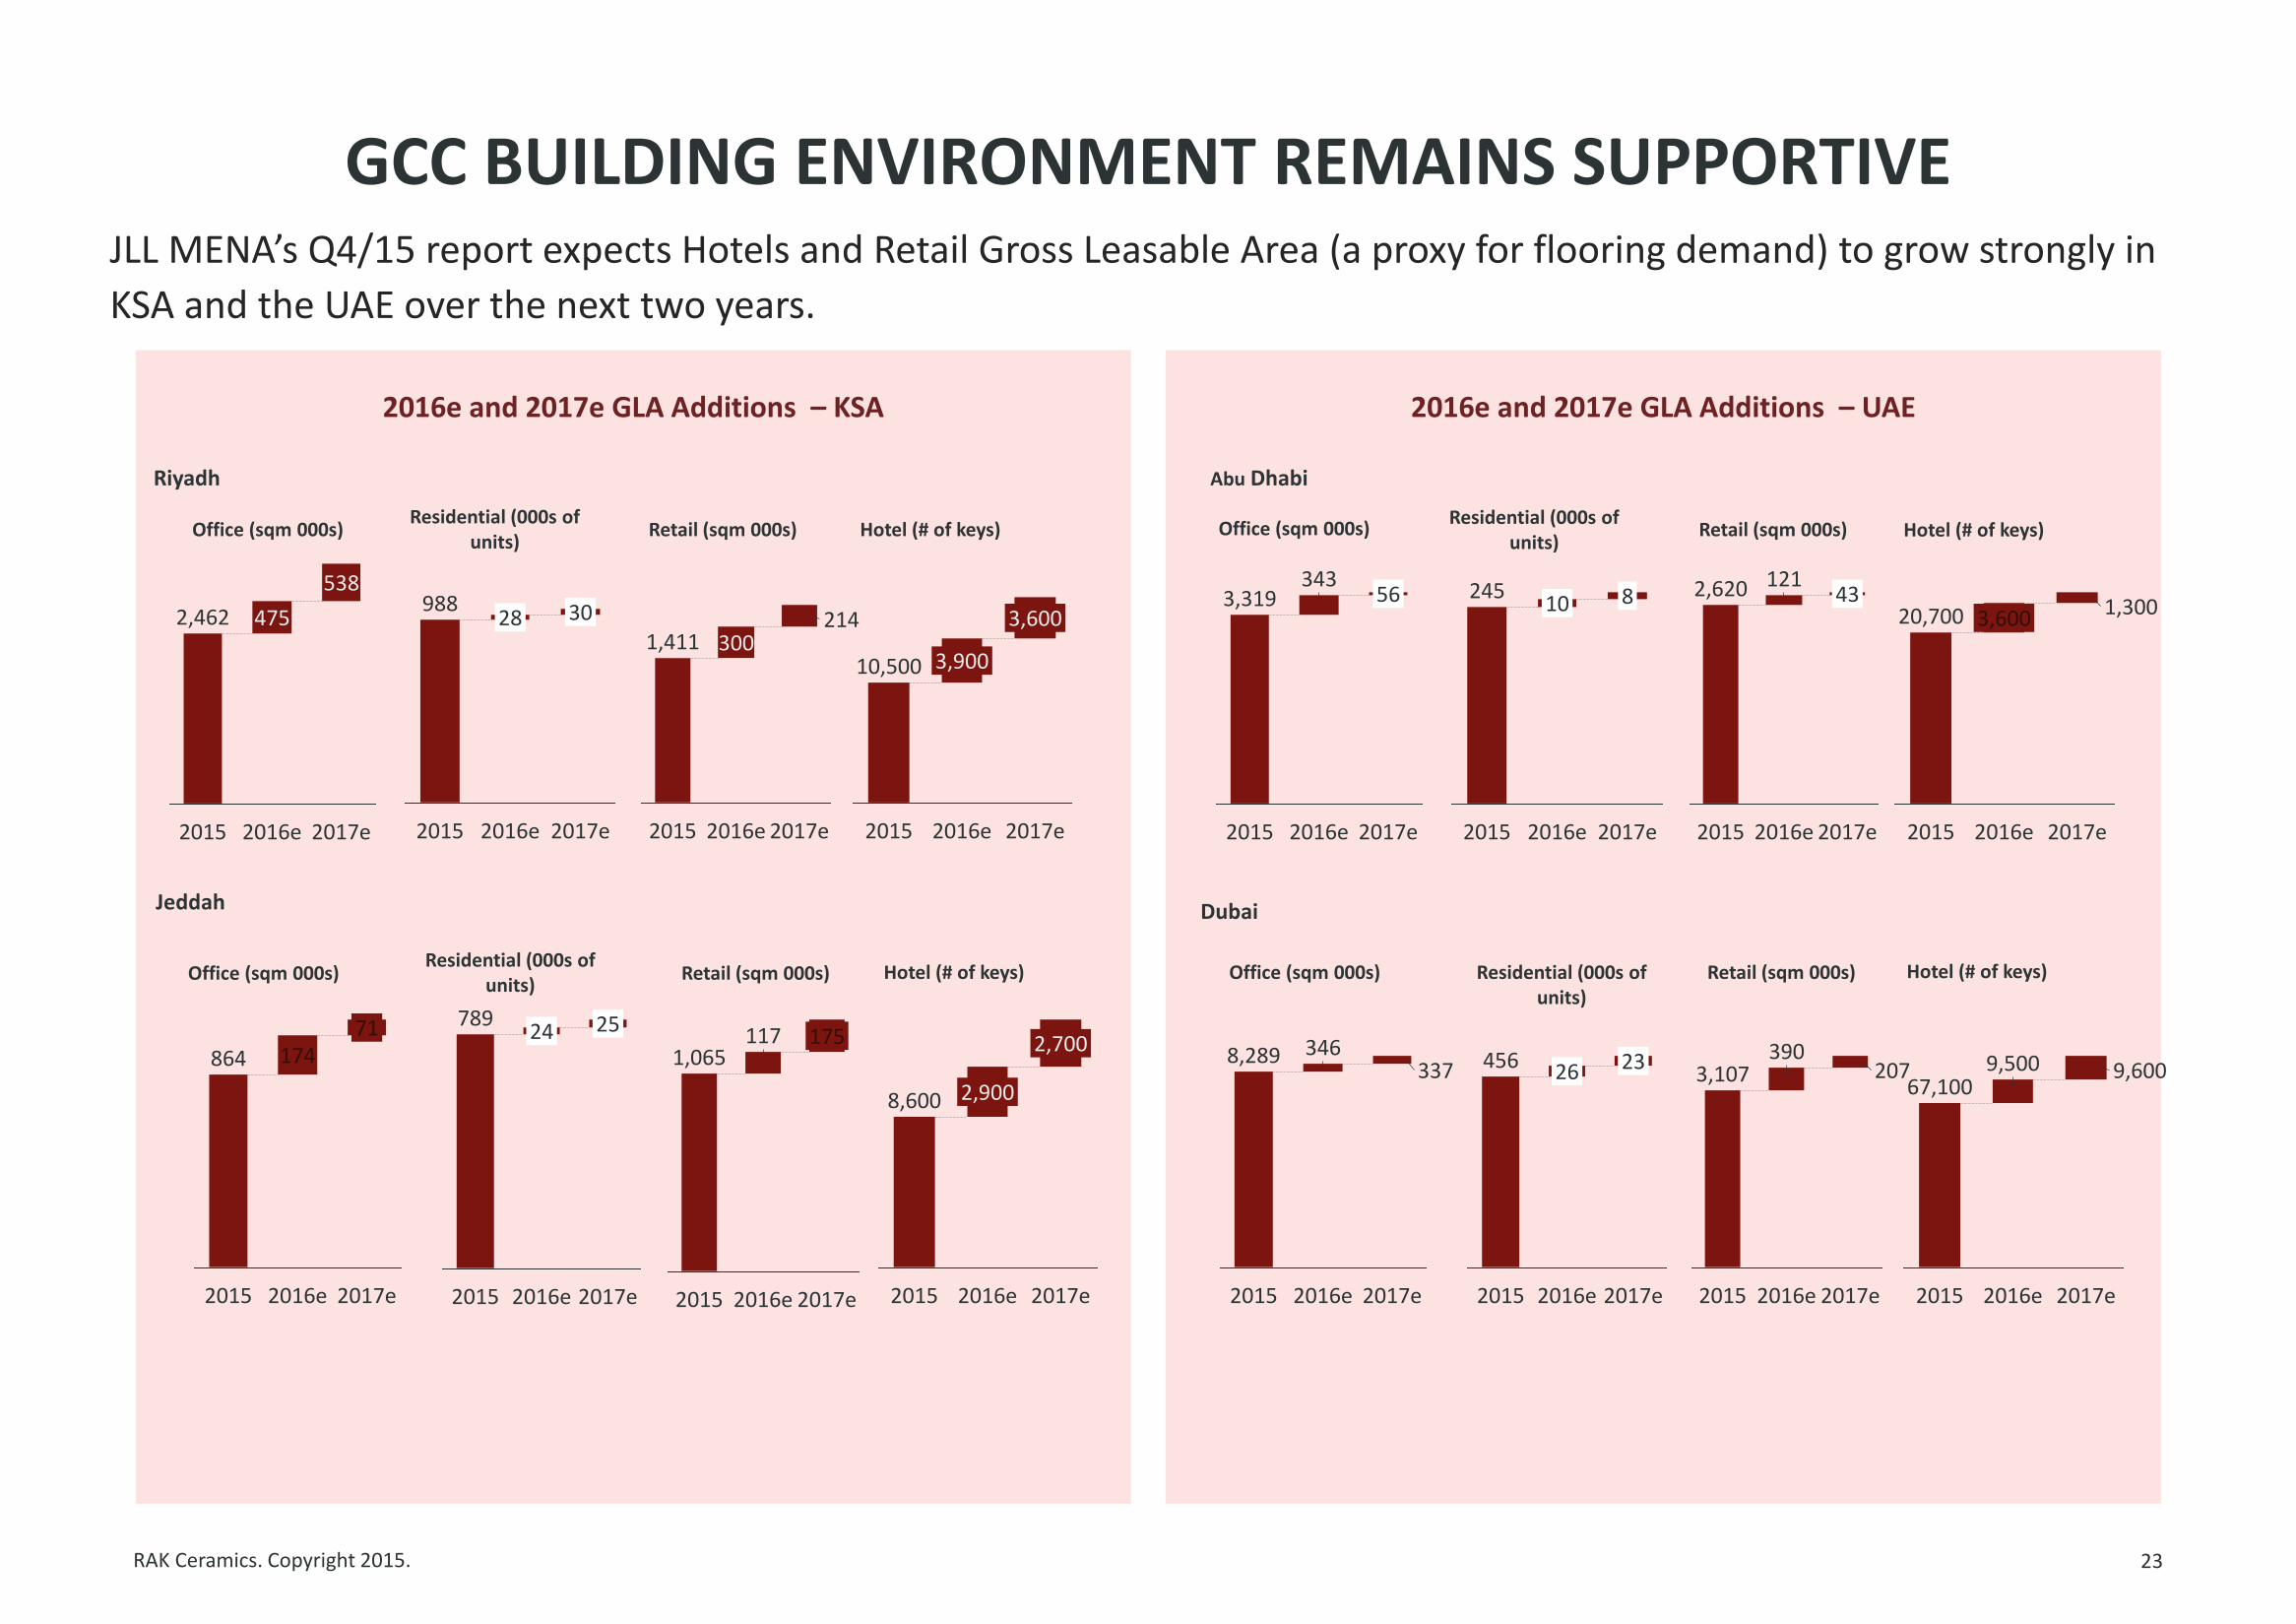
2016e and 2017e GLA Additions – KSA 2016e and 2017e GLA Additions – UAE
JLL MENA’s Q4/15 report expects Hotels and Retail Gross Leasable Area (a proxy for flooring demand) to grow strongly in
KSA and the UAE over the next two years.
2017e
538
2016e
475
2015
2,462
2017e
30
2016e
28
2015
988
2017e
214
2016e
300
2015
1,411
2017e
3,600
2016e
3,900
2015
10,500
Riyadh
Residential (000s of units)
Retail (sqm 000s) Office (sqm 000s) Hotel (# of keys)
864
2017e
71
2016e
174
2015 2017e
25
2016e
24
2015
789
2017e
175
2016e
117
2015
1,065
2017e
2,700
2016e
2,900
2015
8,600
Jeddah
Residential (000s of units)
Retail (sqm 000s) Office (sqm 000s) Hotel (# of keys)
2017e
56
2016e
343
2015
3,319
2016e
10
2015
245
2017e
8
2017e
43
2016e
121
2015
2,620
3,600
2015
20,700 1,300
2016e 2017e
Abu Dhabi
Residential (000s of units)
Retail (sqm 000s) Office (sqm 000s) Hotel (# of keys)
2017e
337
2016e
346 8,289
2015
23
2017e
26
2015 2016e
456
2015
3,107 390
2017e 2016e
207 9,500
2016e 2017e
9,600 67,100
2015
Dubai
Residential (000s of units)
Retail (sqm 000s) Office (sqm 000s) Hotel (# of keys)
RAK Ceramics. Copyright 2015.
ASSET DISPOSAL CYCLE HAS ROOM TO GO
24
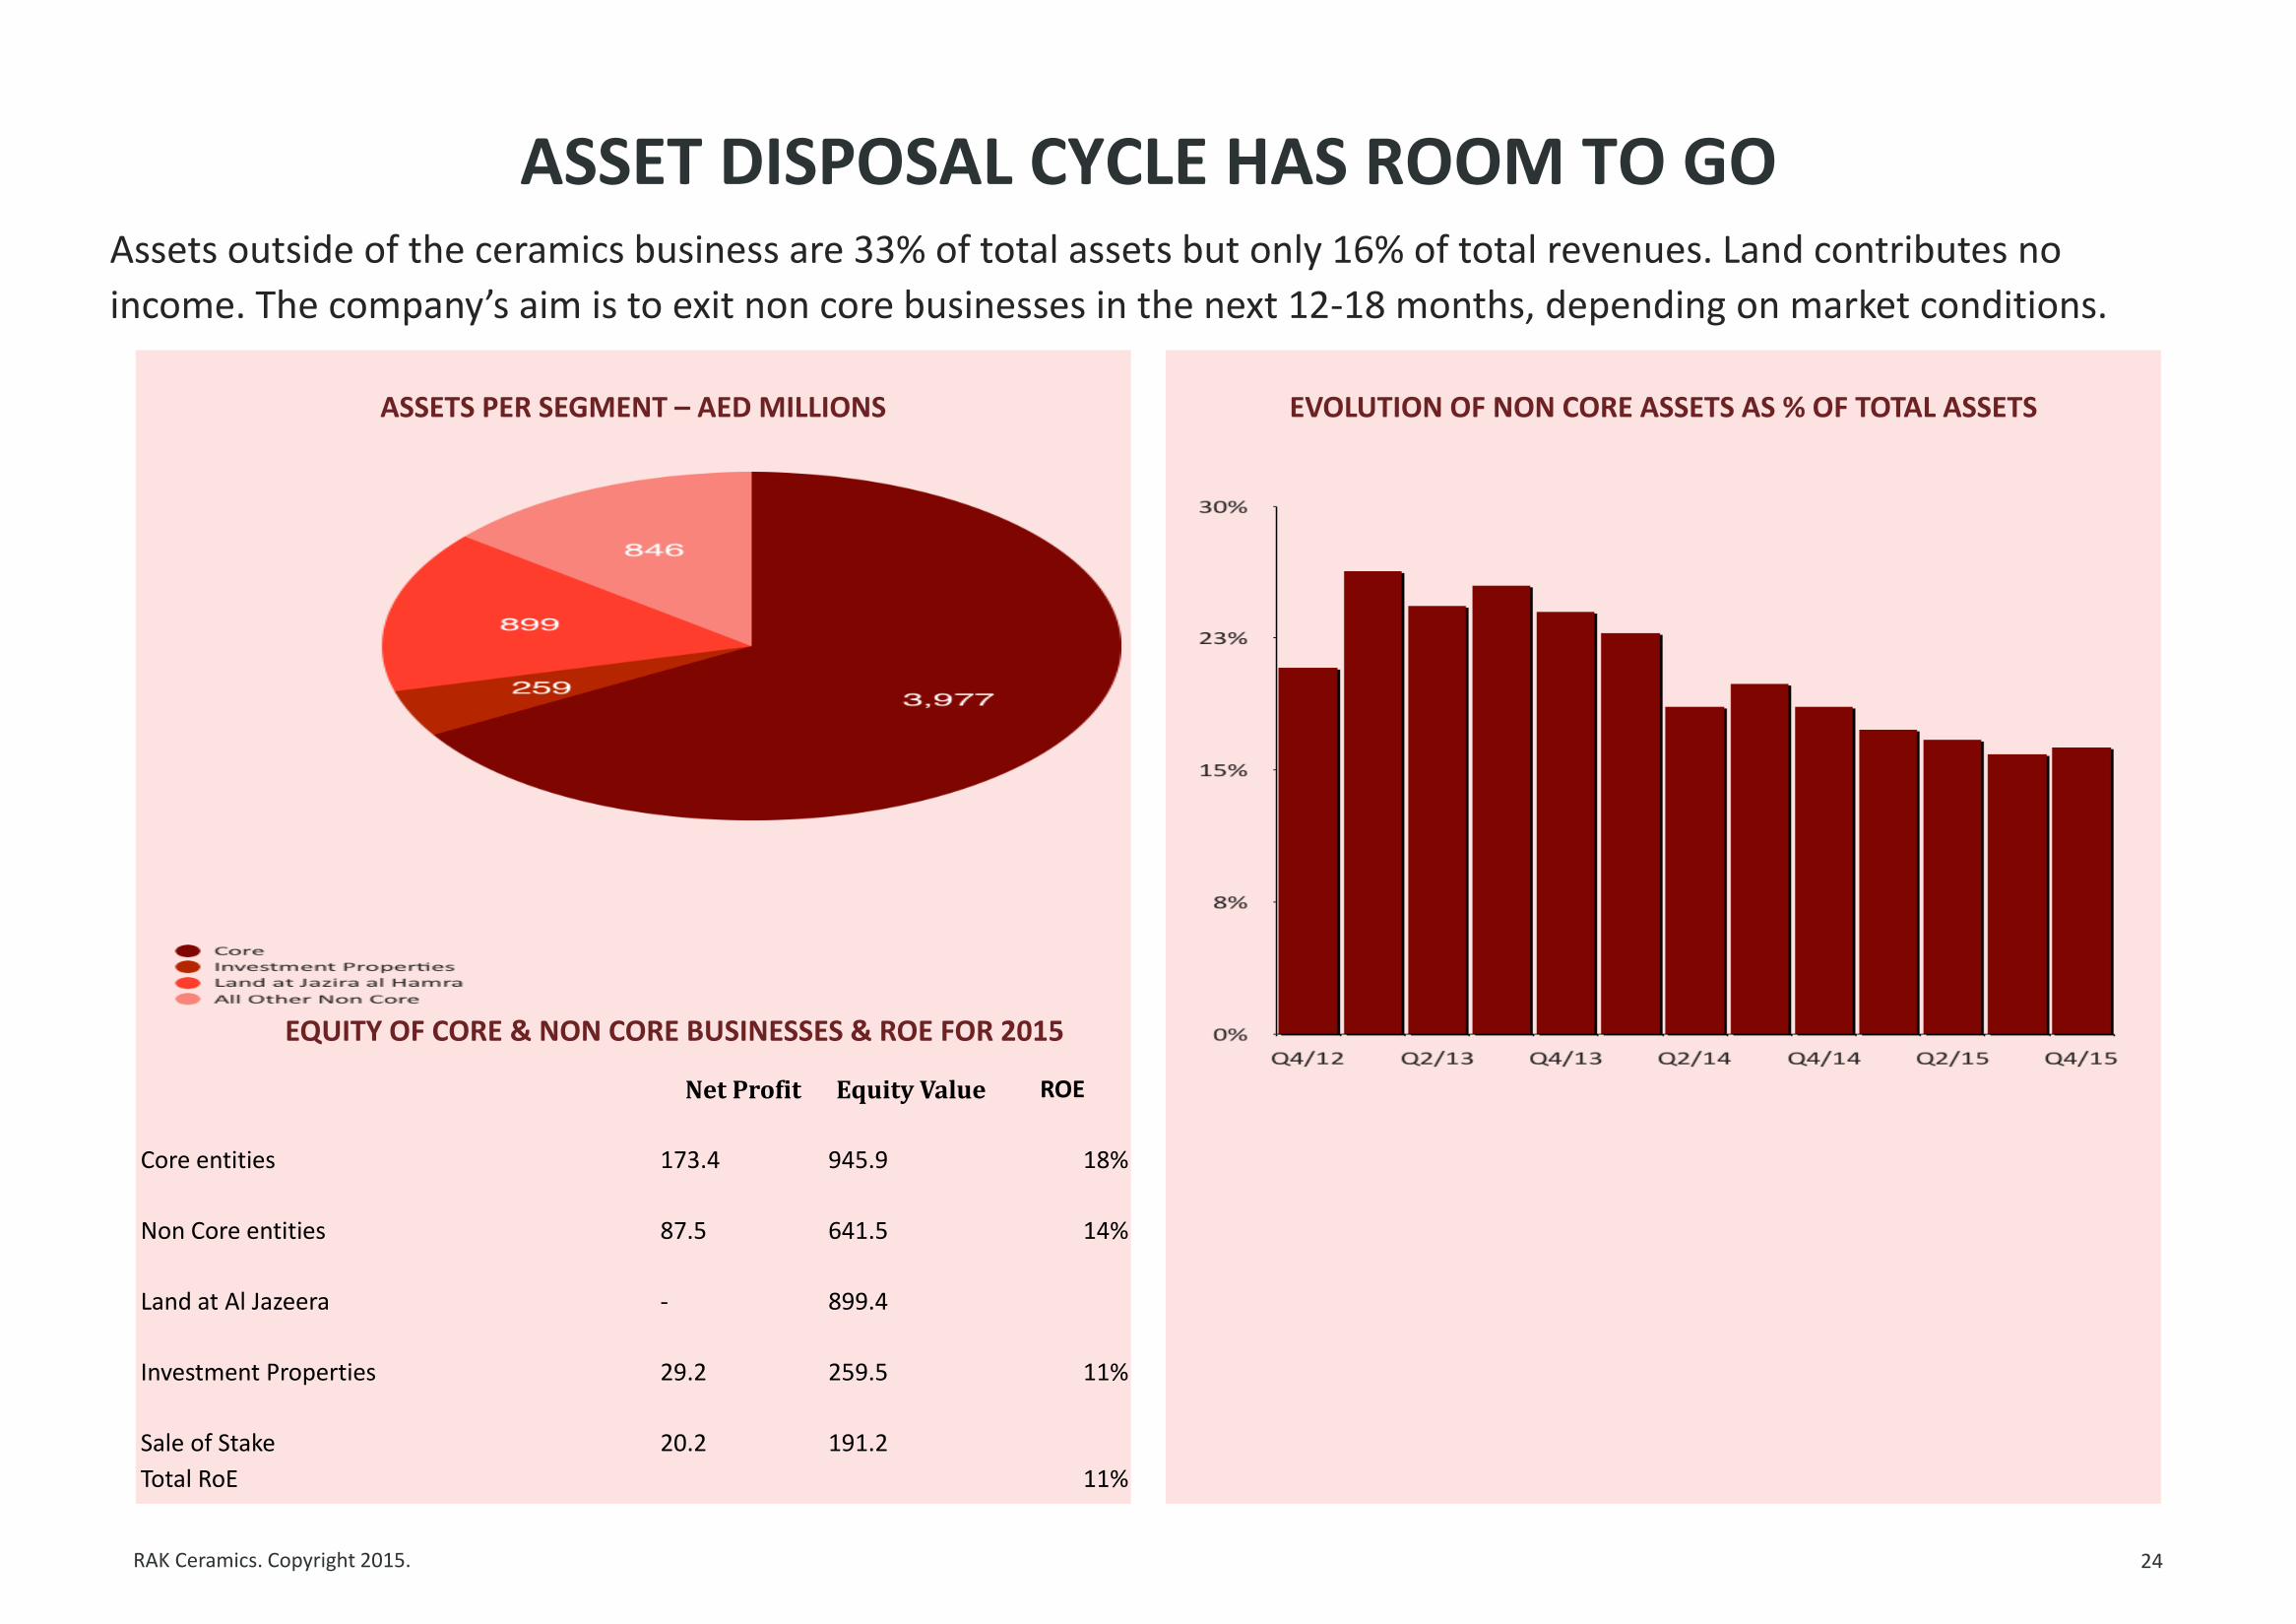
ASSETS PER SEGMENT – AED MILLIONS EVOLUTION OF NON CORE ASSETS AS % OF TOTAL ASSETS
Assets outside of the ceramics business are 33% of total assets but only 16% of total revenues. Land contributes no
income. The company’s aim is to exit non core businesses in the next 12-18 months, depending on market conditions.
EQUITY OF CORE & NON CORE BUSINESSES & ROE FOR 2015
Net Profit Equity Value ROE
Core entities 173.4
945.9 18%
Non Core entities 87.5
641.5 14%
Land at Al Jazeera -
899.4
Investment Properties 29.2
259.5 11%
Sale of Stake 20.2
191.2
Total RoE 11%

STOCK PROFILE
RAK Ceramics. Copyright 2015.
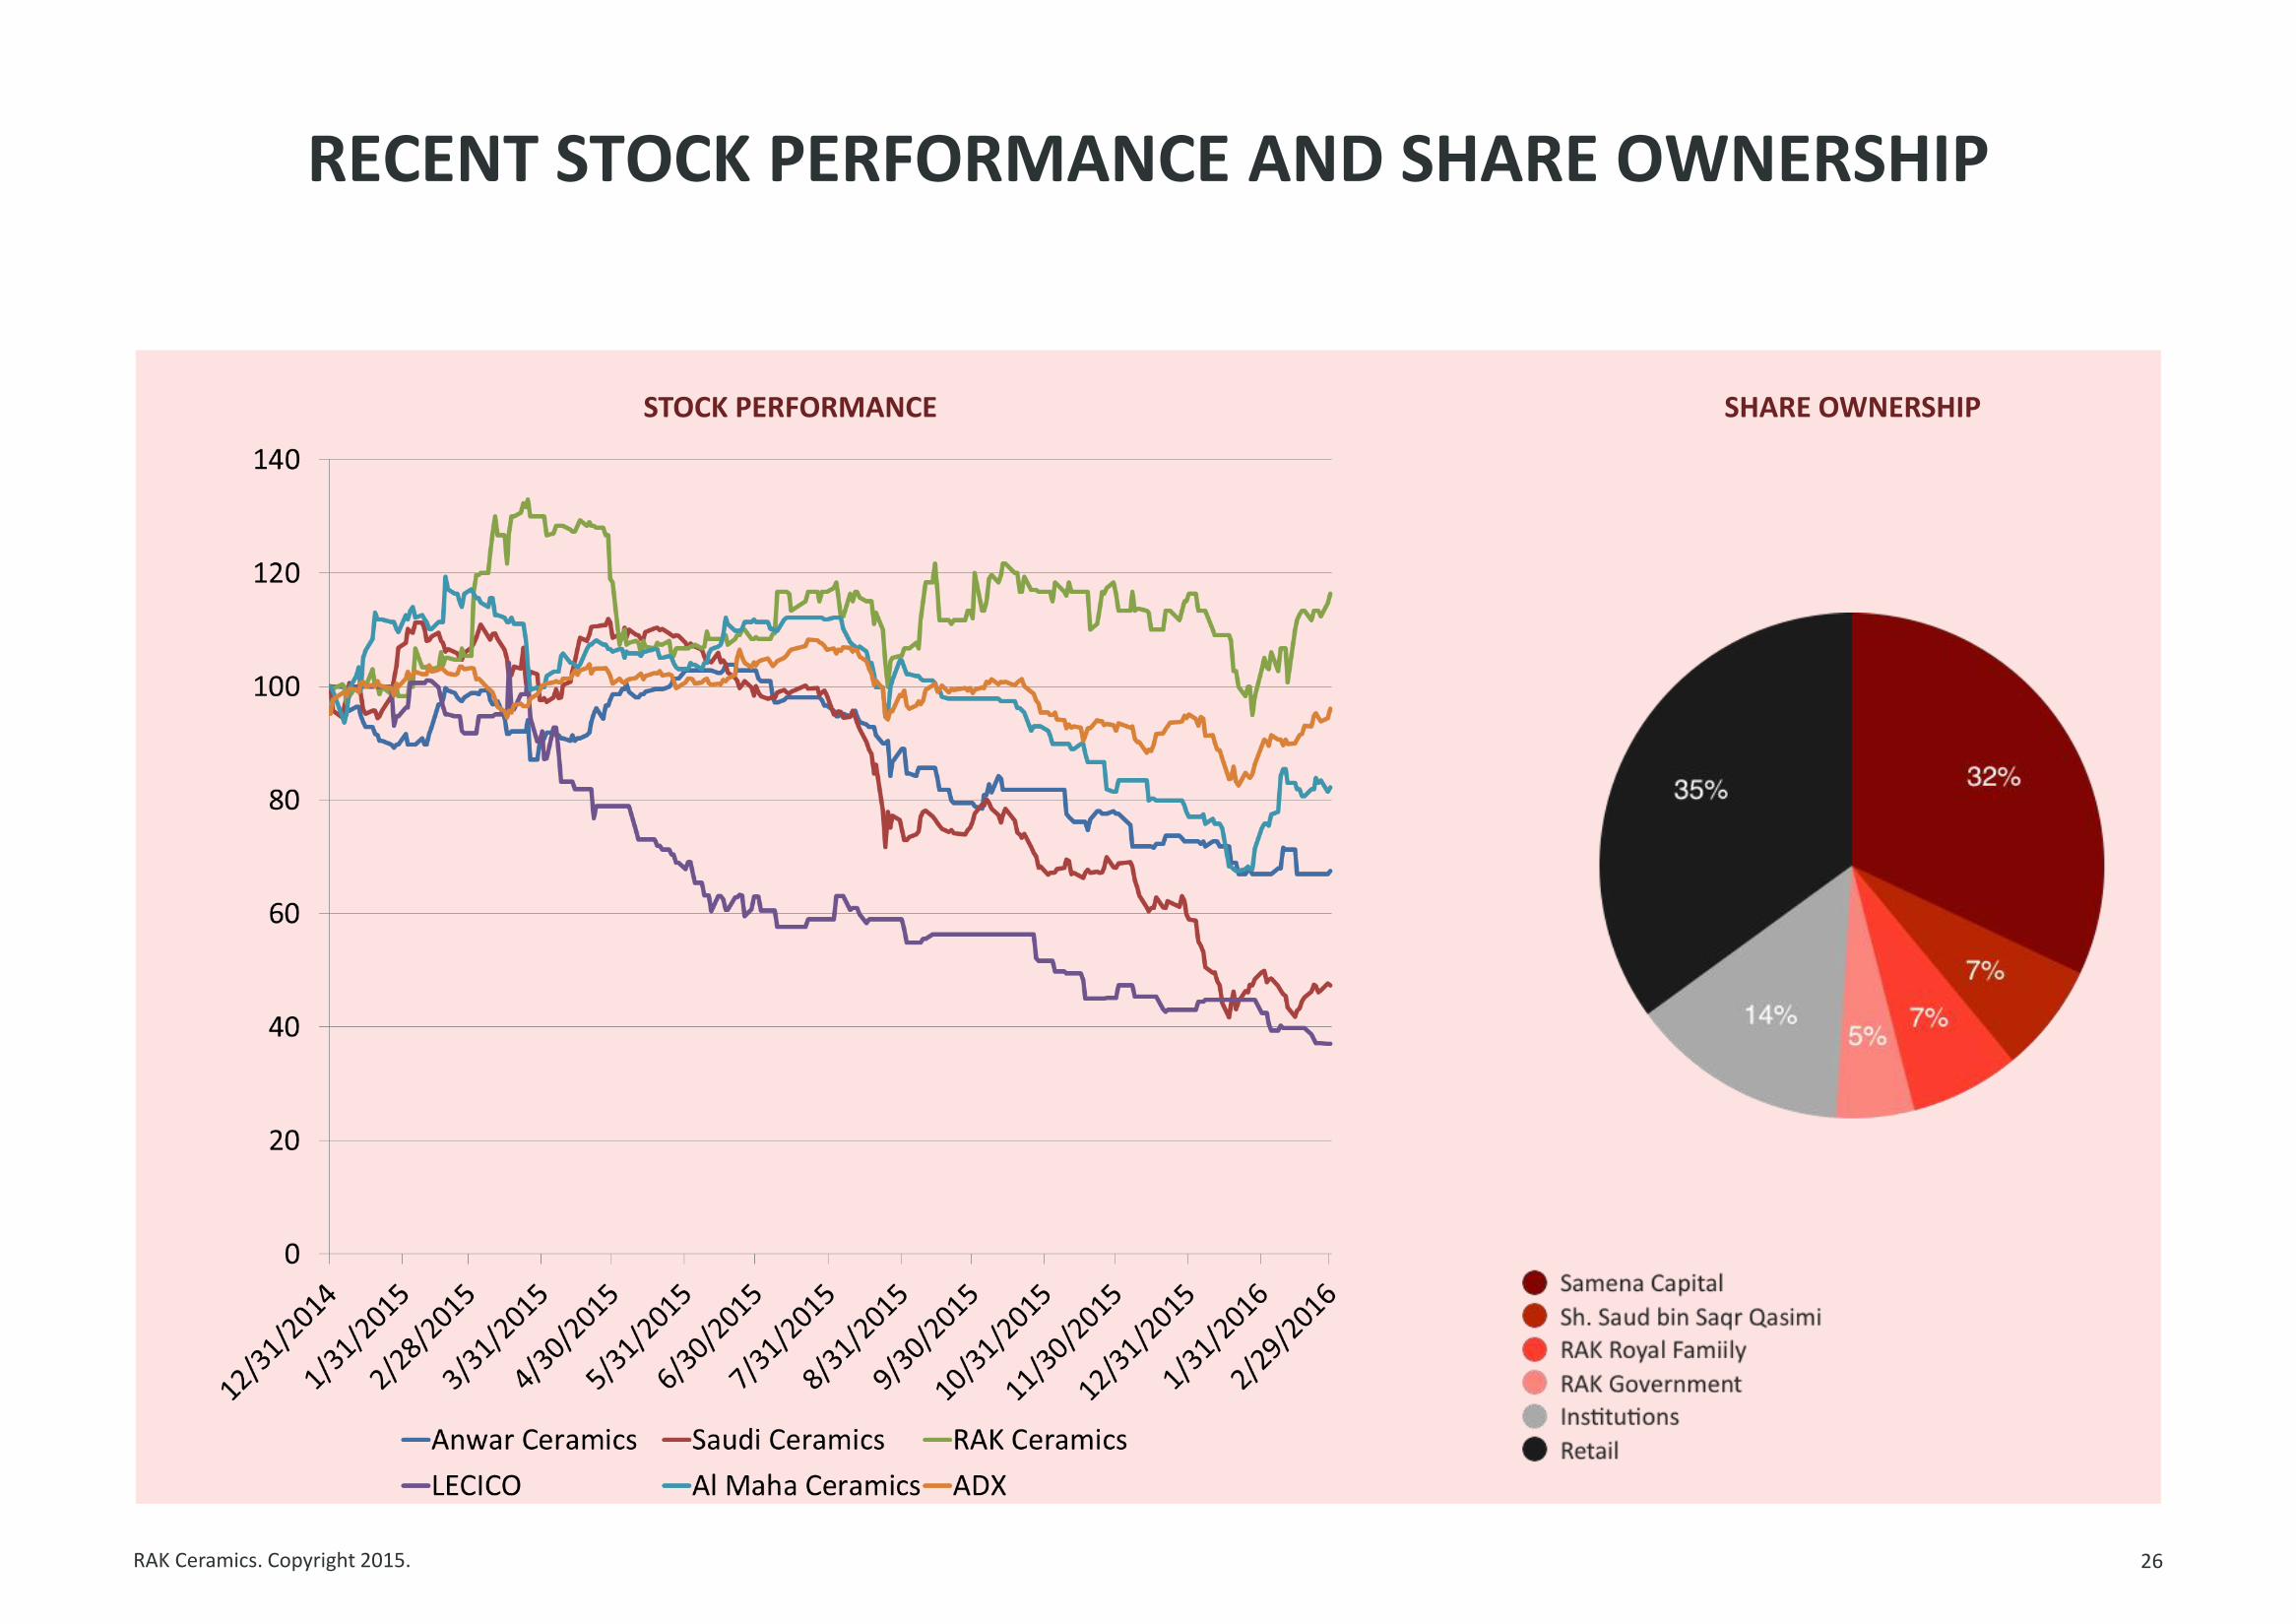
RECENT STOCK PERFORMANCE AND SHARE OWNERSHIP
26
STOCK PERFORMANCE SHARE OWNERSHIP
RAK Ceramics. Copyright 2015.
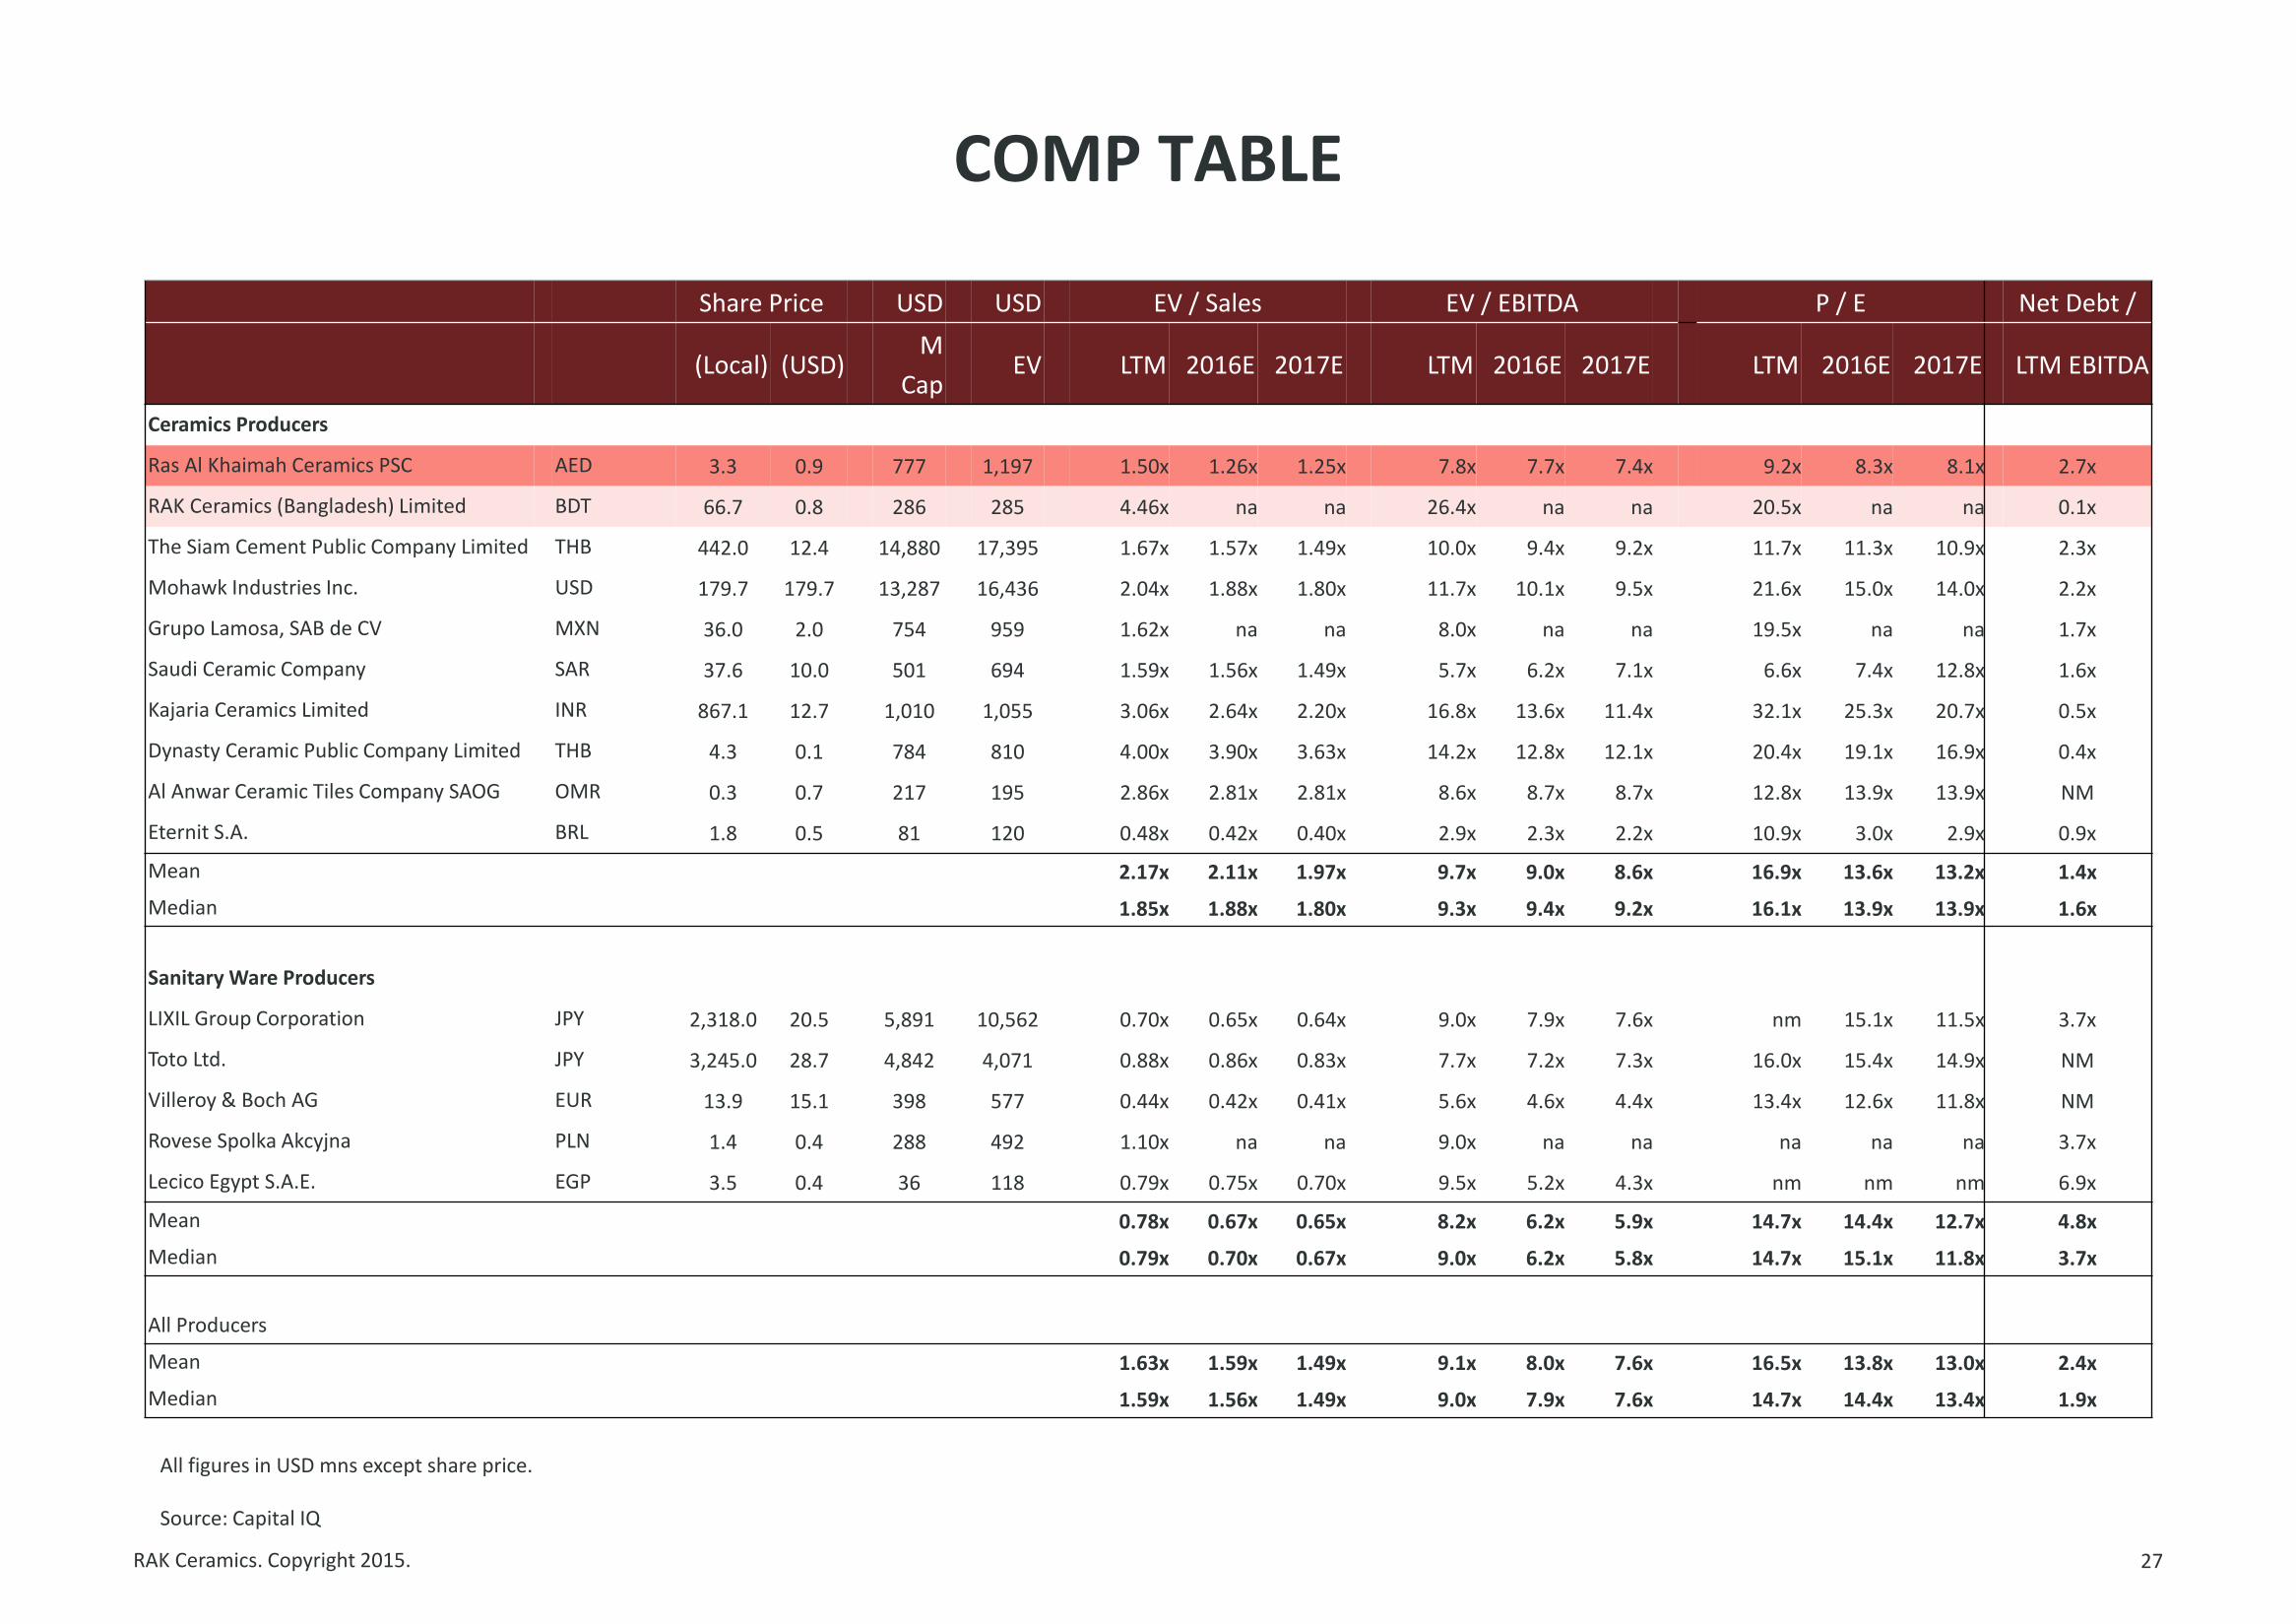
COMP TABLE
27
Share Price USD USD EV / Sales EV / EBITDA P / E Net Debt /
(Local) (USD) M
Cap EV LTM 2016E 2017E LTM 2016E 2017E LTM 2016E 2017E LTM EBITDA
Ceramics Producers
Ras Al Khaimah Ceramics PSC AED 3.3 0.9 777 1,197 1.50x 1.26x 1.25x 7.8x 7.7x 7.4x 9.2x 8.3x 8.1x 2.7x
RAK Ceramics (Bangladesh) Limited BDT 66.7 0.8 286 285 4.46x na na 26.4x na na 20.5x na na 0.1x
The Siam Cement Public Company Limited THB 442.0 12.4 14,880 17,395 1.67x 1.57x 1.49x 10.0x 9.4x 9.2x 11.7x 11.3x 10.9x 2.3x
Mohawk Industries Inc. USD 179.7 179.7 13,287 16,436 2.04x 1.88x 1.80x 11.7x 10.1x 9.5x 21.6x 15.0x 14.0x 2.2x
Grupo Lamosa, SAB de CV MXN 36.0 2.0 754 959 1.62x na na 8.0x na na 19.5x na na 1.7x
Saudi Ceramic Company SAR 37.6 10.0 501 694 1.59x 1.56x 1.49x 5.7x 6.2x 7.1x 6.6x 7.4x 12.8x 1.6x
Kajaria Ceramics Limited INR 867.1 12.7 1,010 1,055 3.06x 2.64x 2.20x 16.8x 13.6x 11.4x 32.1x 25.3x 20.7x 0.5x
Dynasty Ceramic Public Company Limited THB 4.3 0.1 784 810 4.00x 3.90x 3.63x 14.2x 12.8x 12.1x 20.4x 19.1x 16.9x 0.4x
Al Anwar Ceramic Tiles Company SAOG OMR 0.3 0.7 217 195 2.86x 2.81x 2.81x 8.6x 8.7x 8.7x 12.8x 13.9x 13.9x NM
Eternit S.A. BRL 1.8 0.5 81 120 0.48x 0.42x 0.40x 2.9x 2.3x 2.2x 10.9x 3.0x 2.9x 0.9x
Mean 2.17x 2.11x 1.97x 9.7x 9.0x 8.6x 16.9x 13.6x 13.2x 1.4x
Median 1.85x 1.88x 1.80x 9.3x 9.4x 9.2x 16.1x 13.9x 13.9x 1.6x
Sanitary Ware Producers
LIXIL Group Corporation JPY 2,318.0 20.5 5,891 10,562 0.70x 0.65x 0.64x 9.0x 7.9x 7.6x nm 15.1x 11.5x 3.7x
Toto Ltd. JPY 3,245.0 28.7 4,842 4,071 0.88x 0.86x 0.83x 7.7x 7.2x 7.3x 16.0x 15.4x 14.9x NM
Villeroy & Boch AG EUR 13.9 15.1 398 577 0.44x 0.42x 0.41x 5.6x 4.6x 4.4x 13.4x 12.6x 11.8x NM
Rovese Spolka Akcyjna PLN 1.4 0.4 288 492 1.10x na na 9.0x na na na na na 3.7x
Lecico Egypt S.A.E. EGP 3.5 0.4 36 118 0.79x 0.75x 0.70x 9.5x 5.2x 4.3x nm nm nm 6.9x
Mean 0.78x 0.67x 0.65x 8.2x 6.2x 5.9x 14.7x 14.4x 12.7x 4.8x
Median 0.79x 0.70x 0.67x 9.0x 6.2x 5.8x 14.7x 15.1x 11.8x 3.7x
All Producers
Mean 1.63x 1.59x 1.49x 9.1x 8.0x 7.6x 16.5x 13.8x 13.0x 2.4x
Median 1.59x 1.56x 1.49x 9.0x 7.9x 7.6x 14.7x 14.4x 13.4x 1.9x
All figures in USD mns except share price.
Source: Capital IQ
RAK Ceramics. Copyright 2015.
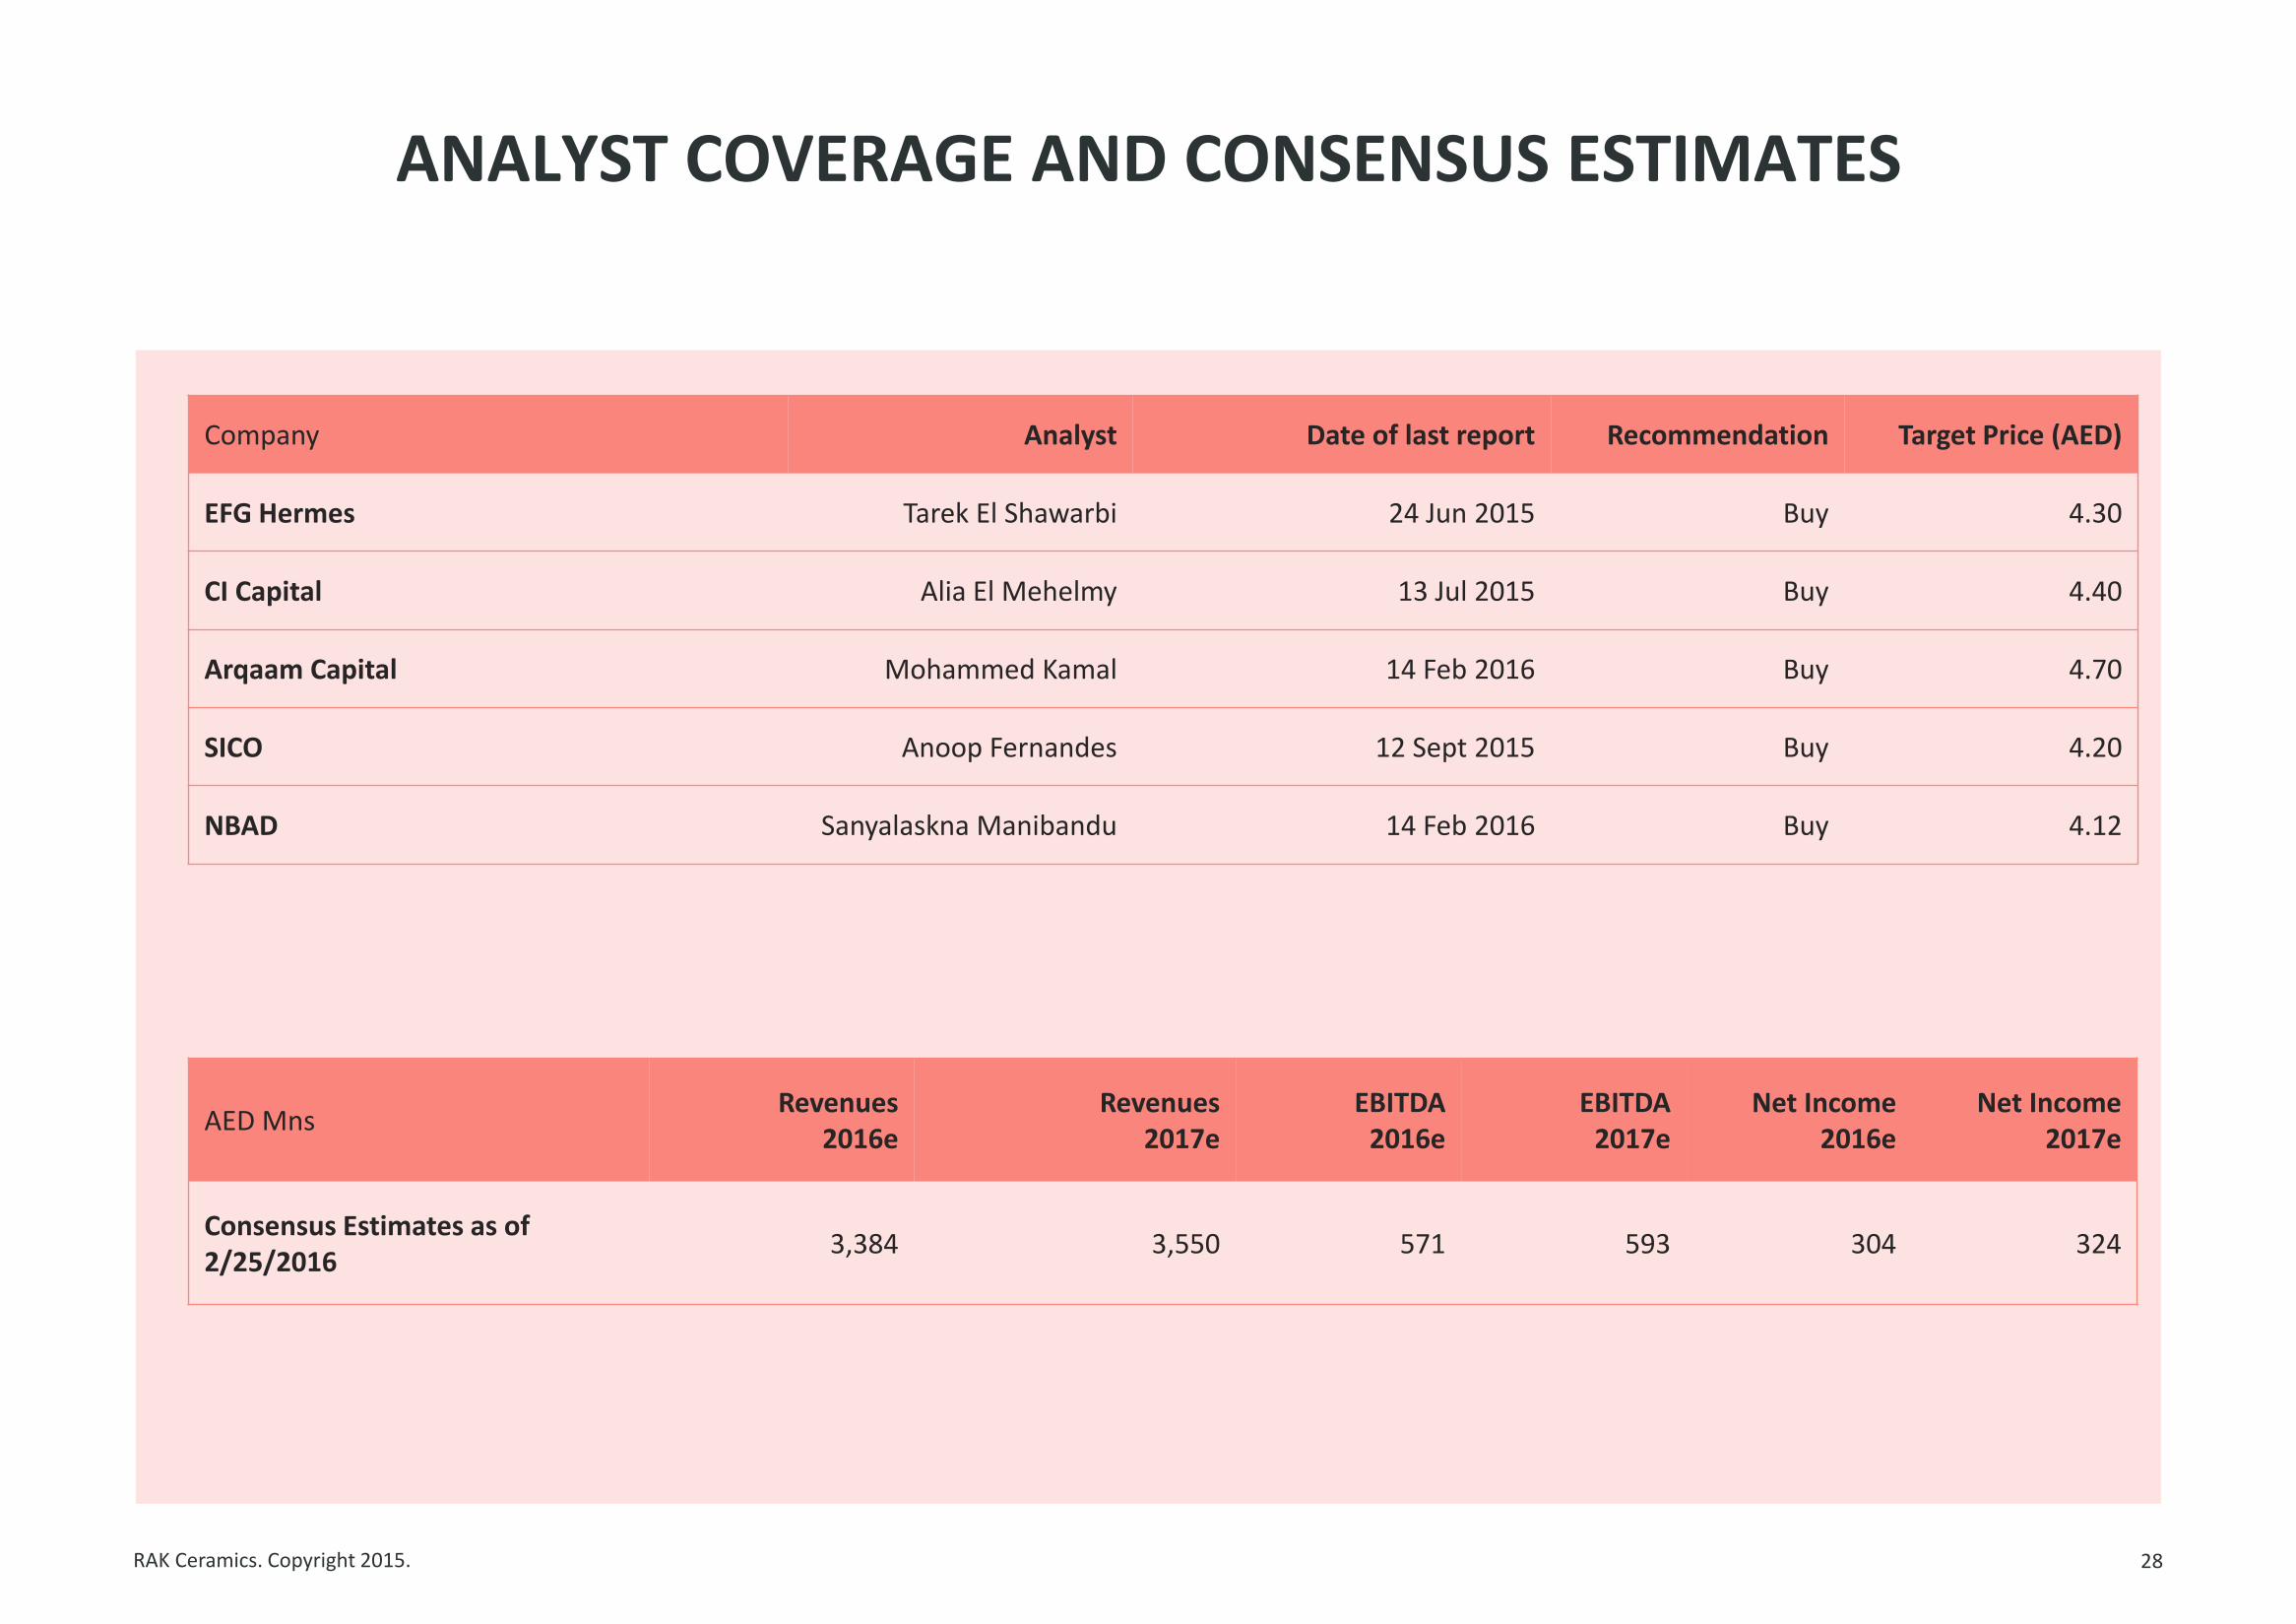
ANALYST COVERAGE AND CONSENSUS ESTIMATES
28
Company Analyst Date of last report Recommendation Target Price (AED)
EFG Hermes Tarek El Shawarbi 24 Jun 2015 Buy 4.30
CI Capital Alia El Mehelmy 13 Jul 2015 Buy 4.40
Arqaam Capital Mohammed Kamal 14 Feb 2016 Buy 4.70
SICO Anoop Fernandes 12 Sept 2015 Buy 4.20
NBAD Sanyalaskna Manibandu 14 Feb 2016 Buy 4.12
AED Mns Revenues
2016e Revenues
2017e EBITDA
2016e EBITDA
2017e Net Income
2016e Net Income
2017e
Consensus Estimates as of 2/25/2016
3,384 3,550 571 593 304 324
RAK Ceramics. Copyright 2015.
REFERENCE AND CONTACT INFORMATION
29
Investor Relations Contact:
Philippe Habeichi, CFA – Head of Investor Relations: [email protected]