Embed Size (px)
Citation preview
Close to you worldwide
Private & Confiden4al. RAK Ceramics. Copyright 2015.
CONTENTS
2
OUR BUSINESS
‣ CORPORATE HISTORY
‣ CURRENT PRODUCTION CAPACITY
‣ GLOBAL/REGIONAL POSITION
‣ ICONIC PROJECTS
‣ FINANCIAL PERFORMANCE
2014 - CHANGE OF CONTROL AND NEW STRATEGIC VISION
‣ NEW CORPORATE VISION
‣ VALUE CREATION PLAN
‣ H1/15 ACHIEVEMENTS AND H2/15 FOCUS
‣ OPTIONALITY OF OUR IRANIAN INVESTMENT
OUR STOCK
‣ IMPROVED LIQUIDITY AND ANALYST COVERAGE
‣ PEER PERFORMANCE AND VALUATION TABLES
‣ FACTORS TO CONSIDER WHEN EVALUATING OUR STOCK
APPENDIX
This informa4on contained in the enclosed presenta4on summarizes preliminary and introductory informa4on on RAK Ceramics PSC (the Company). This presenta4on has been prepared for informa4on purposes only and is not and does not form part of or cons4tute any prospectus, offering memorandum or offering circular or offer for sale or solicita4on of any offer to subscribe for or purchase or sell any securi4es nor shall it or any part of it form the basis of or be relied on in connec4on with any credit evalua4on or third party evalua4on of any securi4es or any offerings or contract or commitment whatsoever.
The informa4on contained herein has been prepared by the Company. Some of the informa4on relied on by the Company is obtained from sources believed to be reliable but does not guarantee its accuracy or completeness. All poten4al recipients of the enclosed presenta4on are expected to be aware that the informa4on contained herein is preliminary as of the date hereof, supersedes any previous such informa4on delivered and will be superseded by any such informa4on subsequently delivered. The informa4on contained herein is subject to change without no4ce. The Company is under no obliga4on to update or keep current the informa4on contained herein. No person shall have any right of ac4on (except in case of fraud) against the Company or any other person in rela4on to the accuracy or completeness of the informa4on contained herein.
Some of the informa4on in this presenta4on may contain projec4ons or other forward-‐looking statements regarding future events or the future financial performance of The Company. These forward-‐looking statements include all maQers that are not historical facts. The inclusion of such forward-‐looking informa4on shall not be regarded as a representa4on by the Company or any other person that the objec4ves or plans of the Company will be achieved. Future events are subject to various risks which cannot be accurately predicted, forecasted or assessed. No assurance can be given that future events will occur or that the company’s assump4ons are correct. Actual results may differ materially from those projected and past performance is not indica4ve of future results. The Company undertakes no obliga4on to publicly update or publicly revise any forward-‐looking statement, whether as a result of new informa4on, future events or otherwise. Accordingly all poten4al recipients are expected to conduct their own due diligence on the informa4on provided.
These materials are confiden4al and are being submiQed to selected recipients only for the purpose described above. They may not be taken away, reproduced (in whole or in part), distributed or transmiQed to any other person without the prior wriQen consent of the Company. These materials are not intended for distribu4on to, or use by any person or en4ty in any jurisdic4on or country where such distribu4on or use would be contrary to local law or regula4on and must not be acted on or relied on by persons who are not relevant persons. If this presenta4on has been received in error it must be returned immediately to the Company.
Disclaimer

OUR BUSINESS
Private & Confiden4al. RAK Ceramics. Copyright 2015.
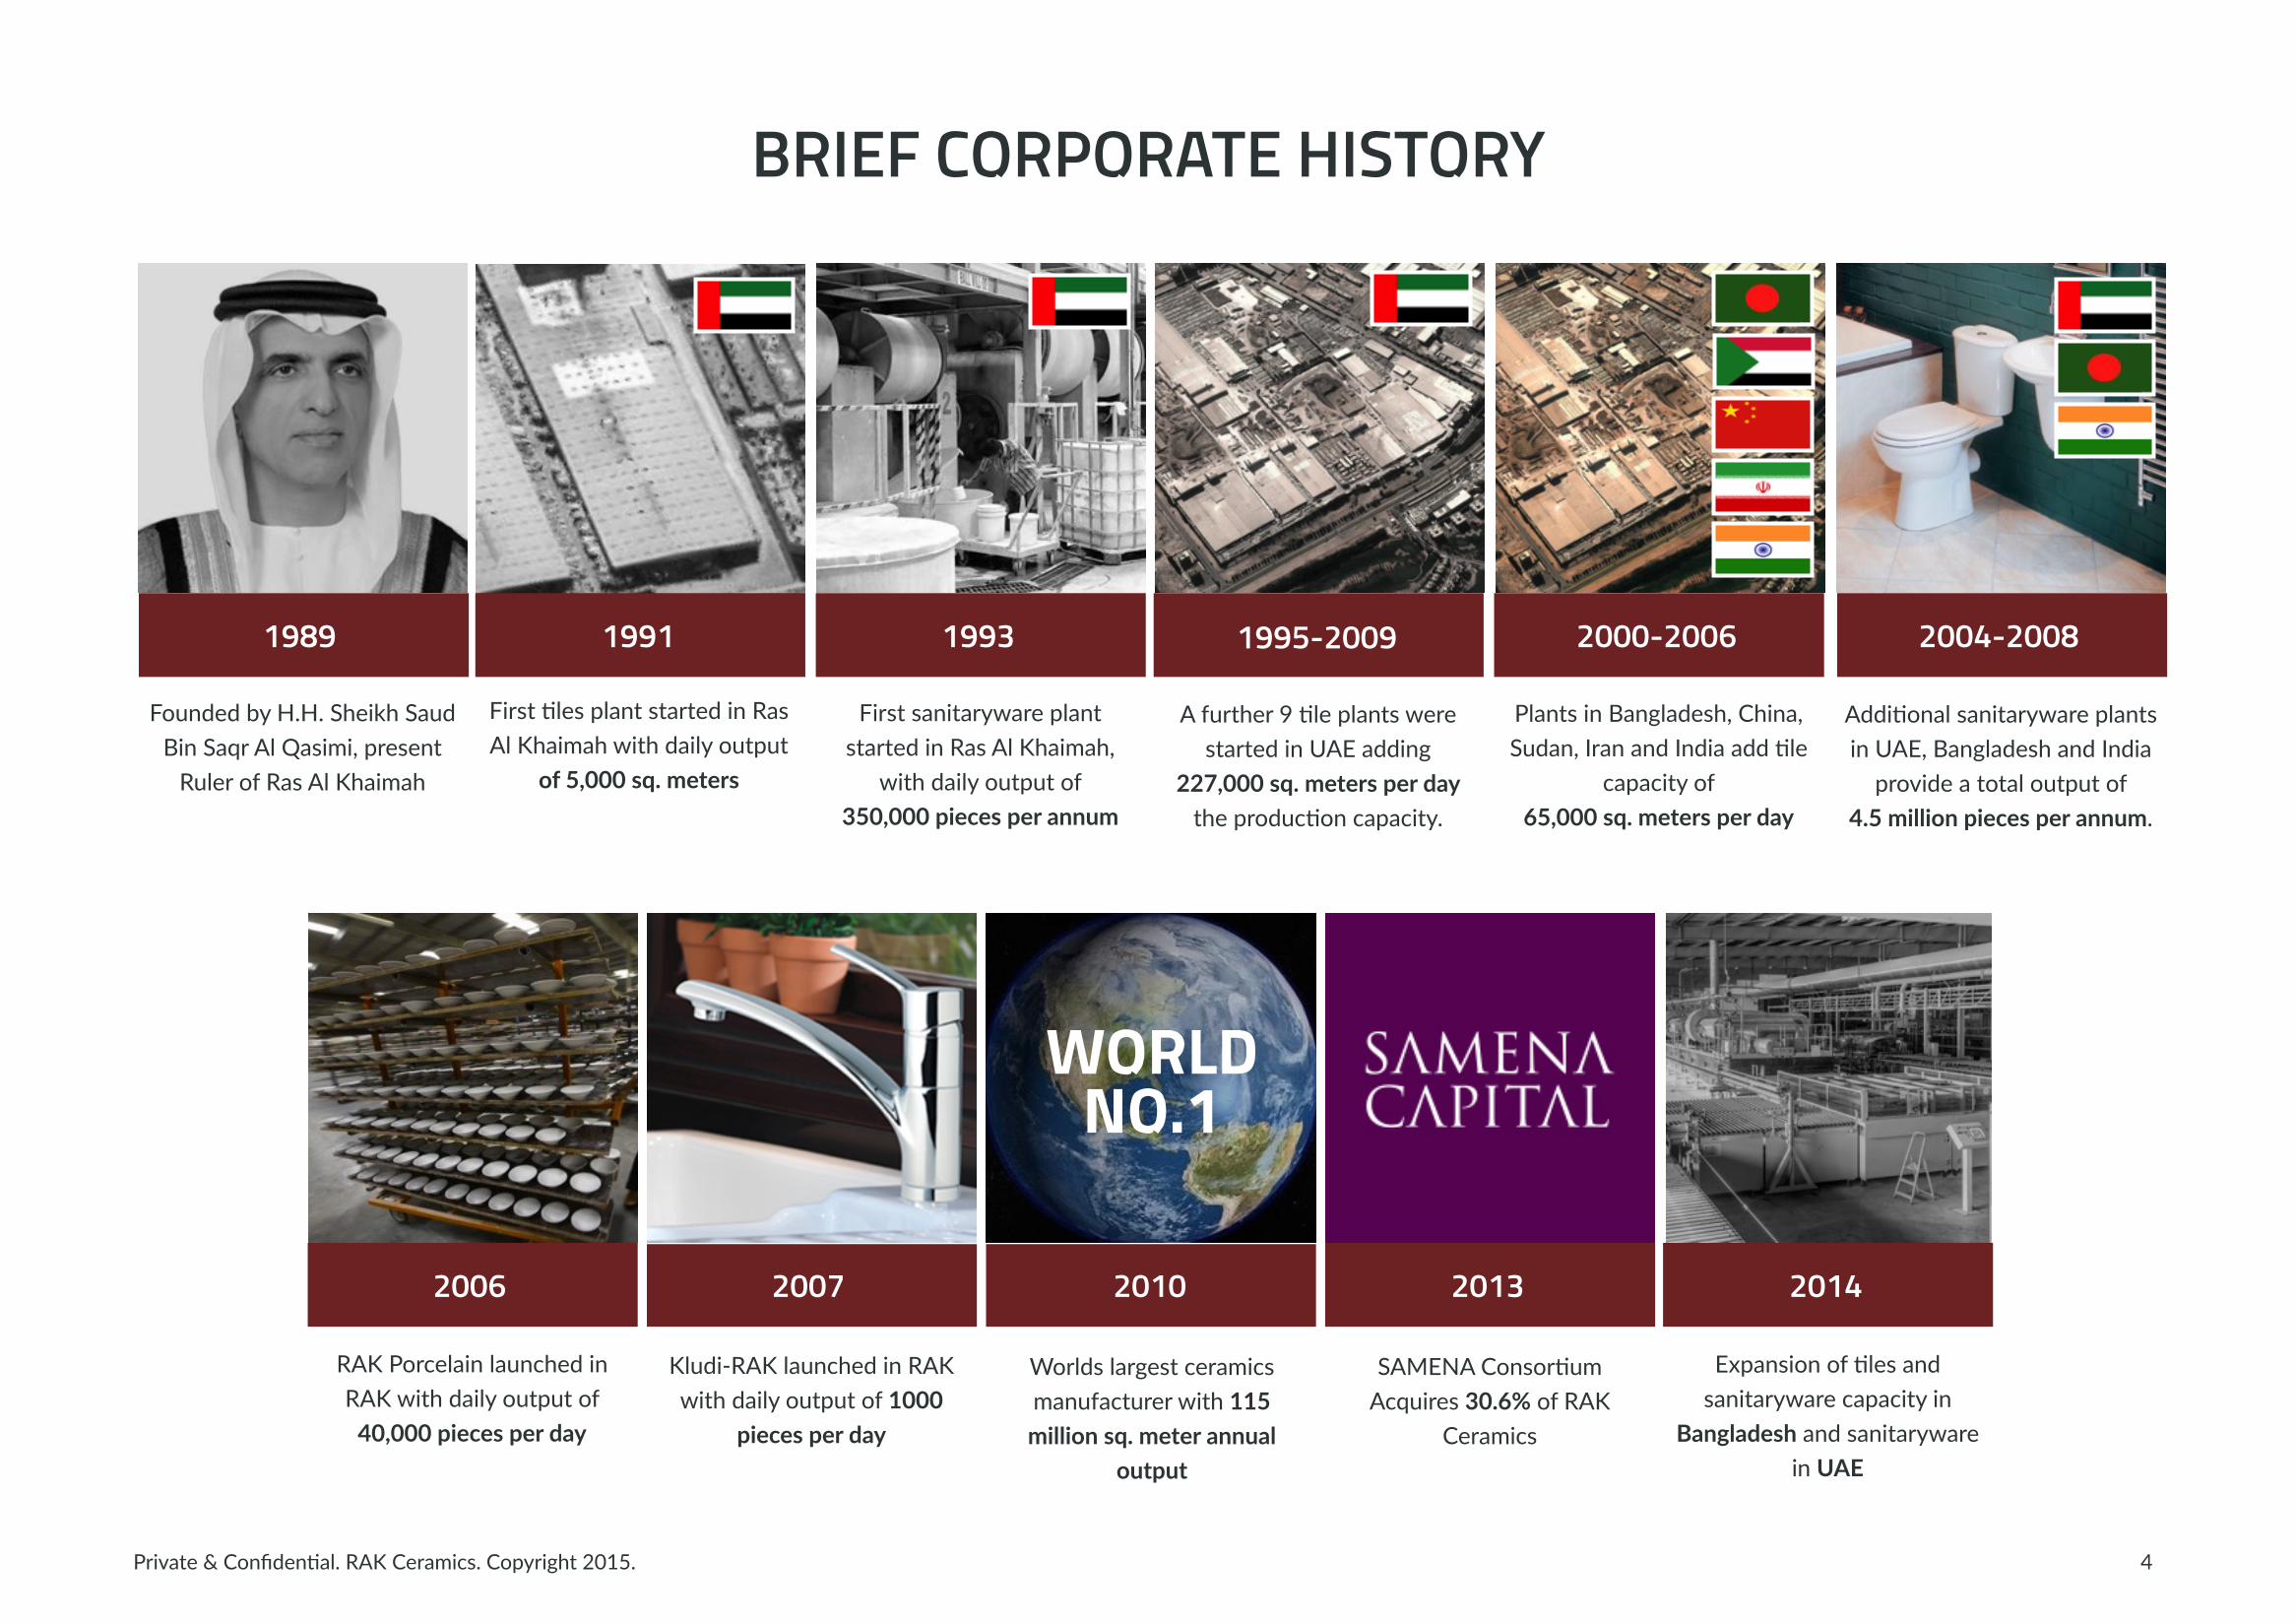
BRIEF CORPORATE HISTORY
4
Founded by H.H. Sheikh Saud Bin Saqr Al Qasimi, present Ruler of Ras Al Khaimah
1989
RAK Porcelain launched in RAK with daily output of 40,000 pieces per day
2006
First 4les plant started in Ras Al Khaimah with daily output
of 5,000 sq. meters
Kludi-‐RAK launched in RAK with daily output of 1000
pieces per day
2007
First sanitaryware plant started in Ras Al Khaimah,
with daily output of 350,000 pieces per annum
A further 9 4le plants were started in UAE adding
227,000 sq. meters per day the produc4on capacity.
WORLDNO.1
1991 1993 1995-2009
Addi4onal sanitaryware plants in UAE, Bangladesh and India provide a total output of
4.5 million pieces per annum.
2004-2008
Plants in Bangladesh, China, Sudan, Iran and India add 4le
capacity of 65,000 sq. meters per day
2000-2006
SAMENA Consor4um Acquires 30.6% of RAK
Ceramics
2013
Worlds largest ceramics manufacturer with 115 million sq. meter annual
output
2010
Expansion of 4les and sanitaryware capacity in
Bangladesh and sanitaryware in UAE
2014
Private & Confiden4al. RAK Ceramics. Copyright 2015.
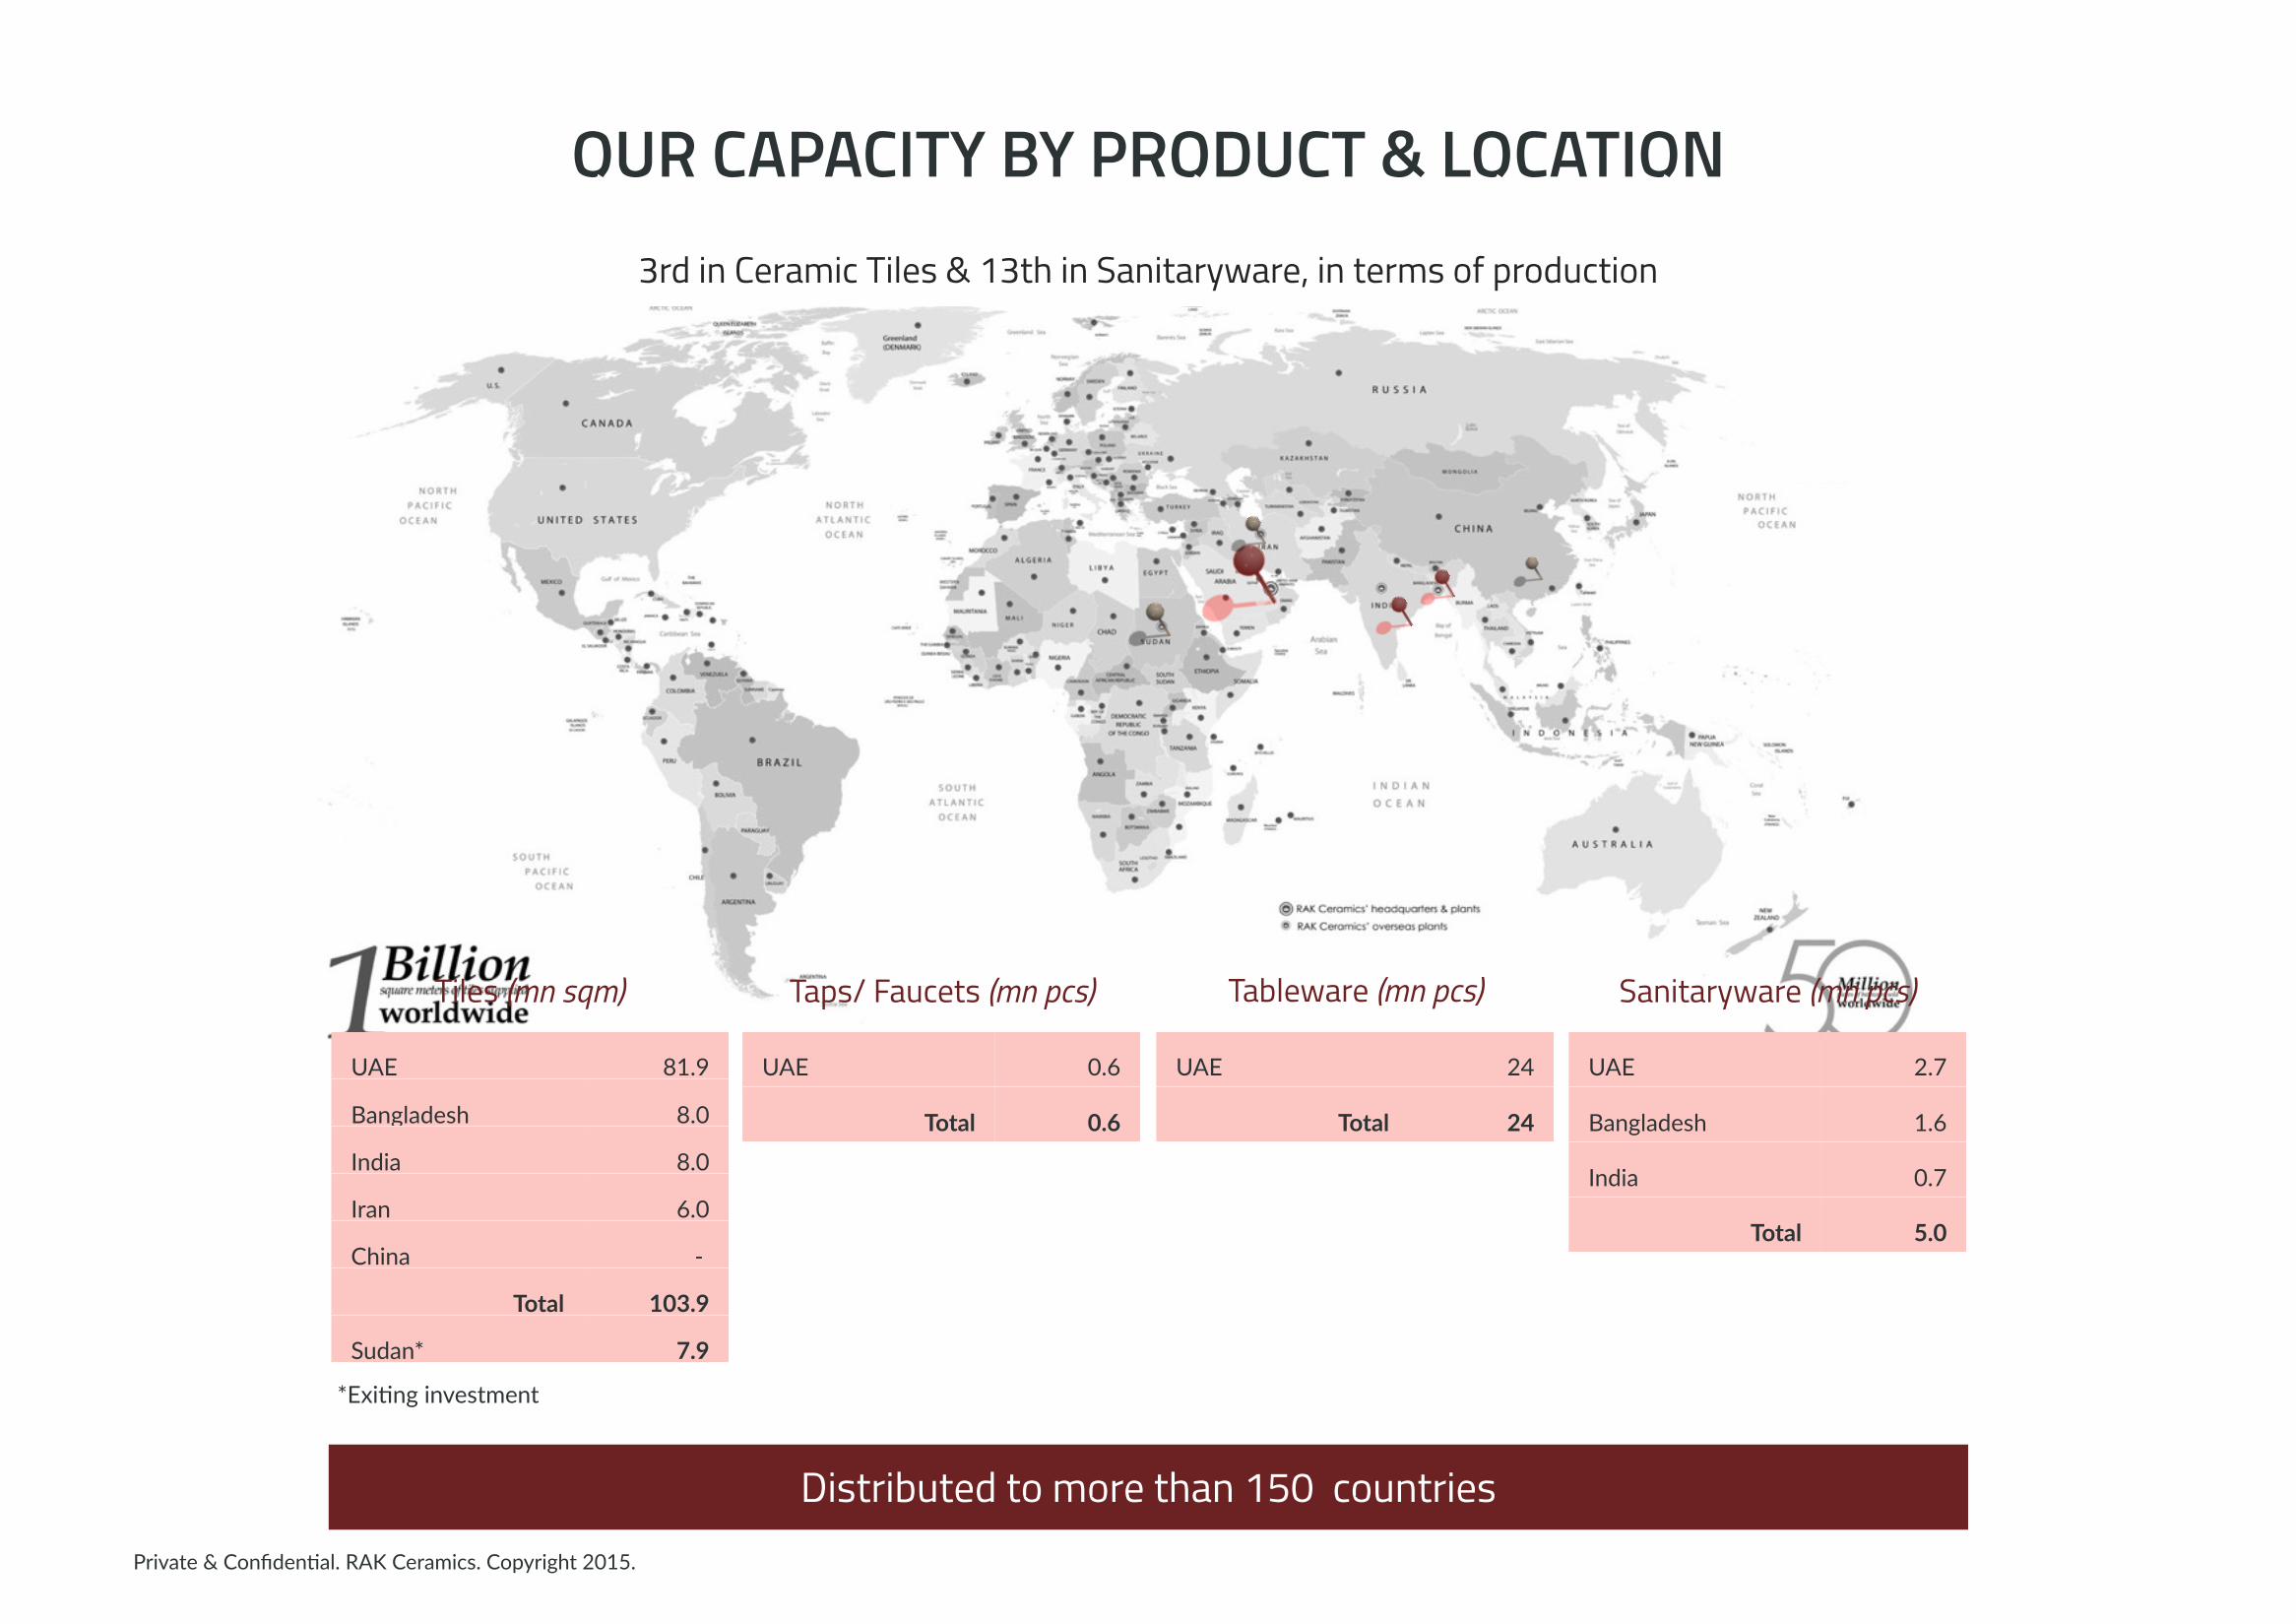
OUR CAPACITY BY PRODUCT & LOCATION
5
UAE 81.9
Bangladesh 8.0
India 8.0
Iran 6.0
China -‐
Total 103.9
Sudan* 7.9
Tiles (mn sqm)
UAE 0.6
Total 0.6
Taps/ Faucets (mn pcs)
UAE 24
Total 24
Tableware (mn pcs)
UAE 2.7
Bangladesh 1.6
India 0.7
Total 5.0
Sanitaryware (mn pcs)
3rd in Ceramic Tiles & 13th in Sanitaryware, in terms of production
Distributed to more than 150 countries
*Exi4ng investment
Private & Confiden4al. RAK Ceramics. Copyright 2015.
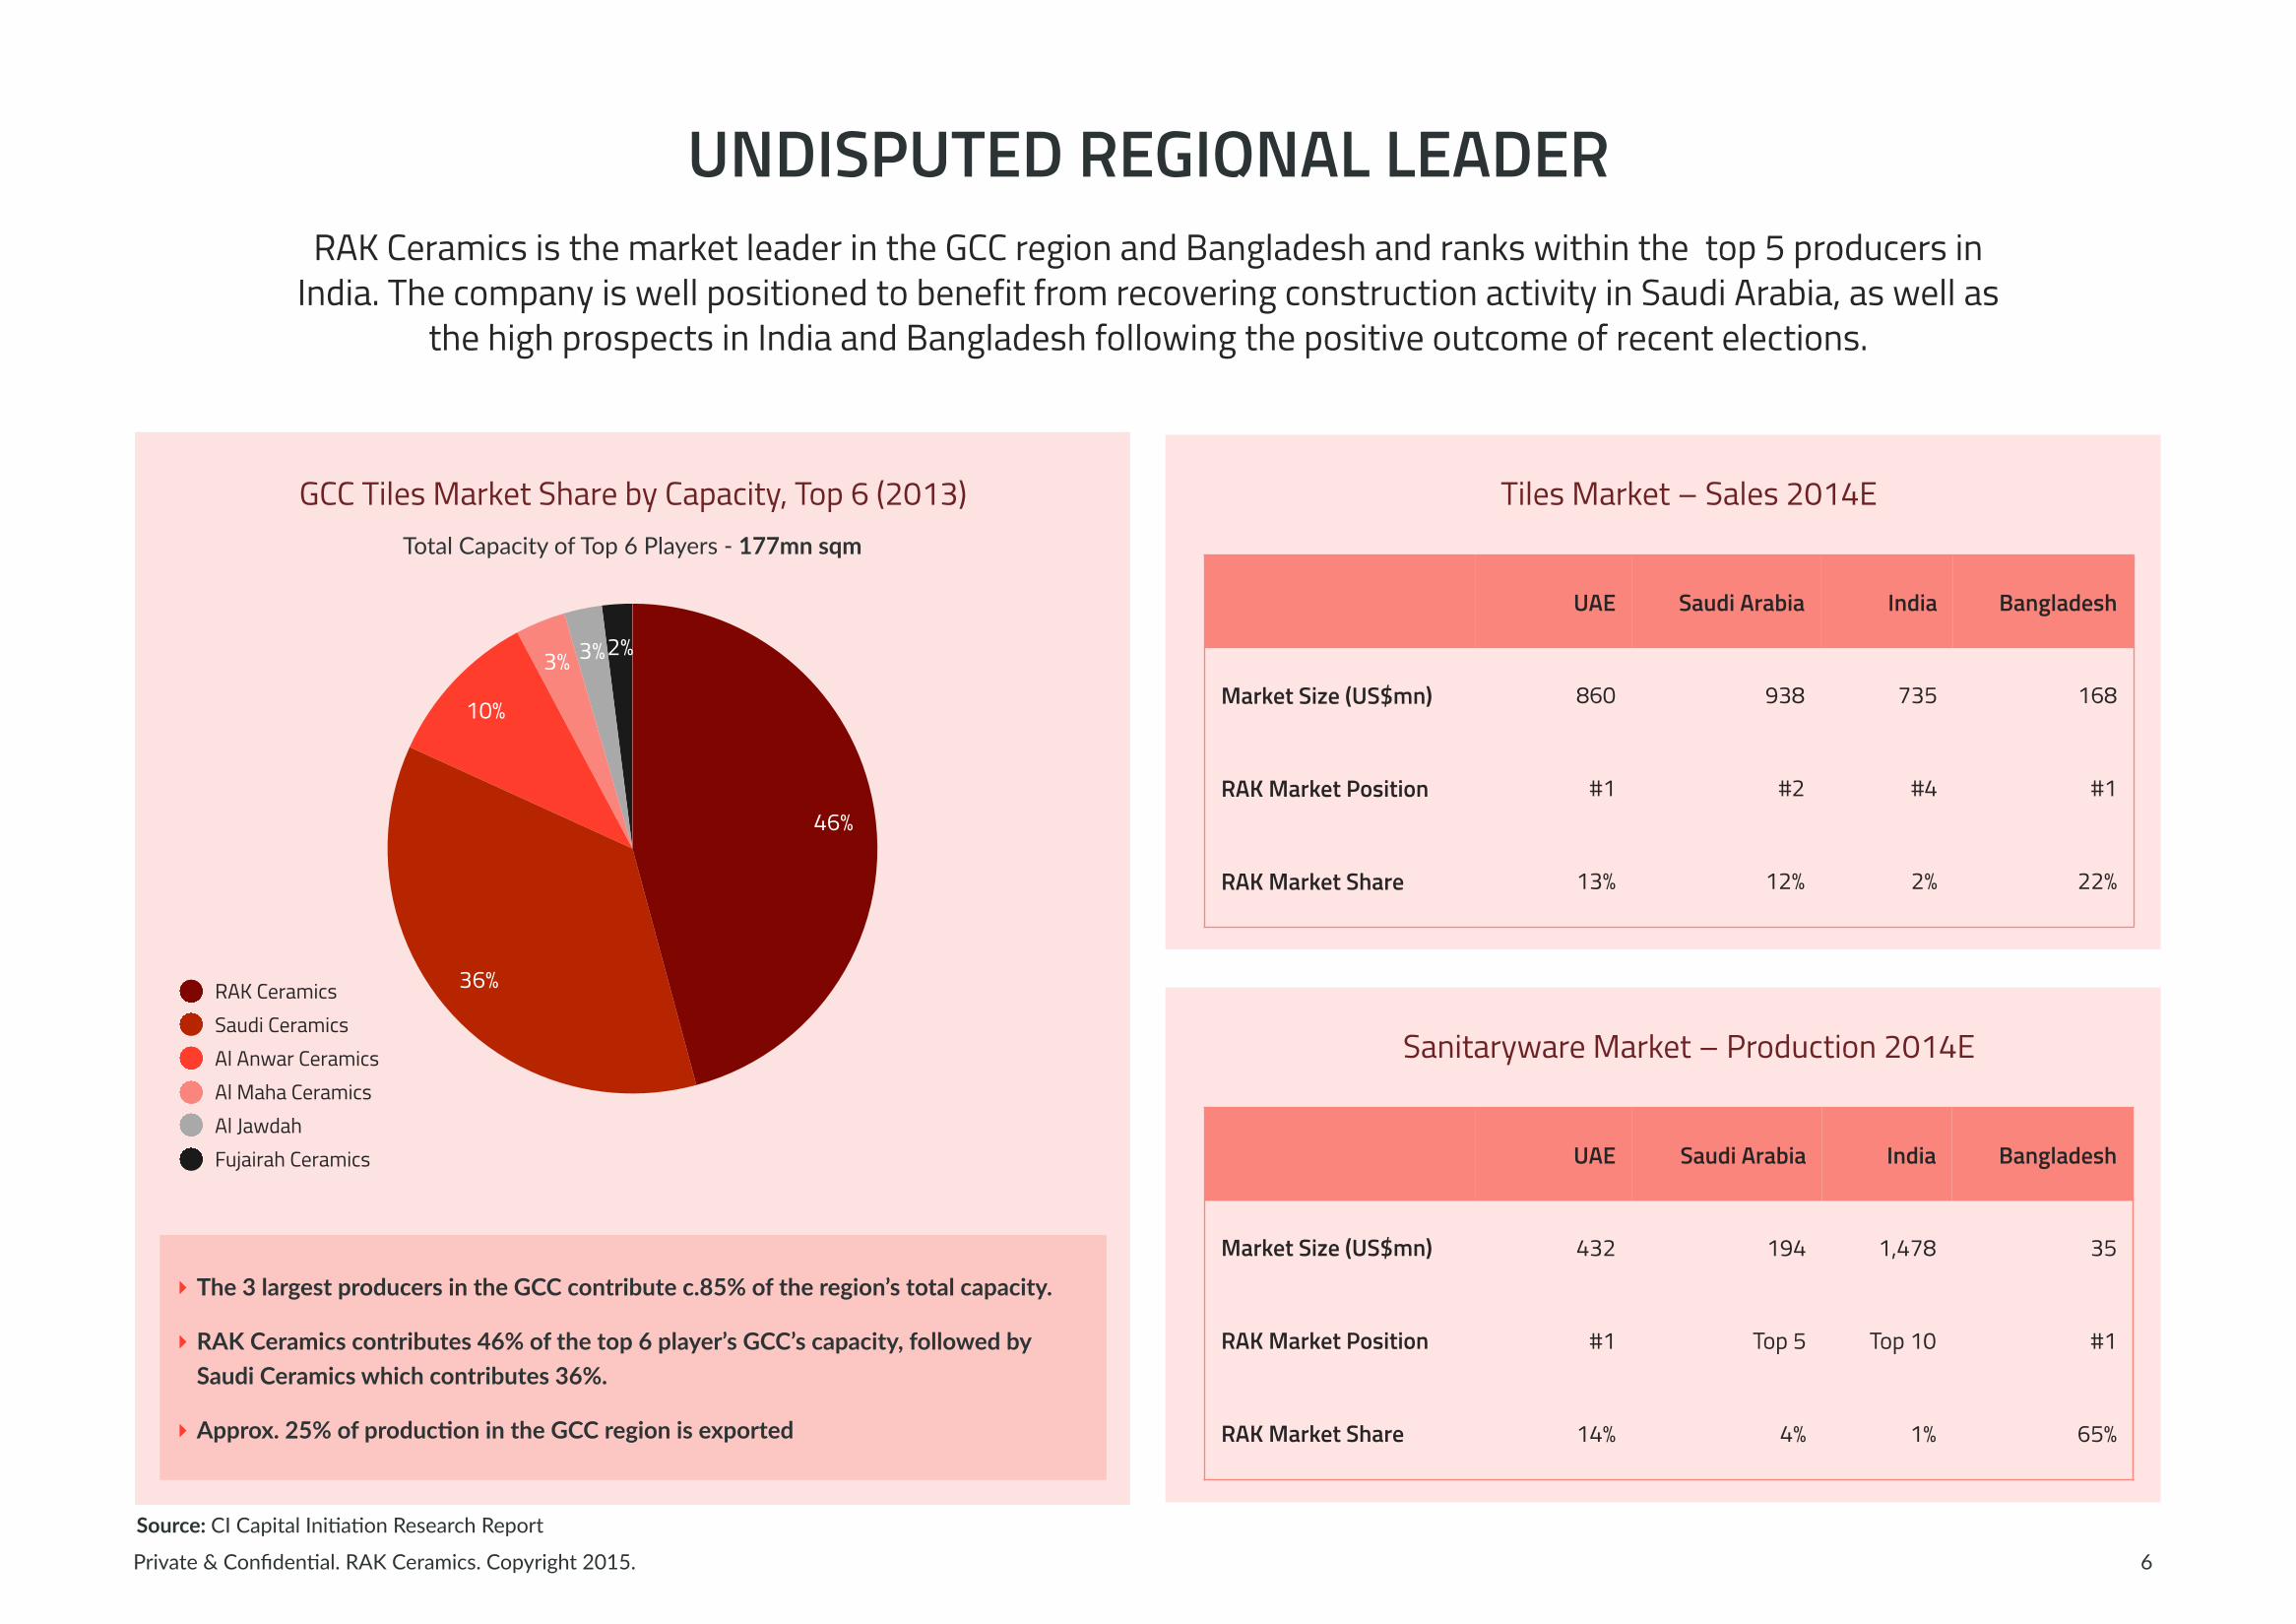
UNDISPUTED REGIONAL LEADER
6
RAK Ceramics is the market leader in the GCC region and Bangladesh and ranks within the top 5 producers in India. The company is well positioned to benefit from recovering construction activity in Saudi Arabia, as well as
the high prospects in India and Bangladesh following the positive outcome of recent elections.
UAE Saudi Arabia India Bangladesh
Market Size (US$mn) 432 194 1,478 35
RAK Market Position #1 Top 5 Top 10 #1
RAK Market Share 14% 4% 1% 65%
Sanitaryware Market – Production 2014E
UAE Saudi Arabia India Bangladesh
Market Size (US$mn) 860 938 735 168
RAK Market Position #1 #2 #4 #1
RAK Market Share 13% 12% 2% 22%
Tiles Market – Sales 2014E
2%3%3%
10%
36%
46%
RAK CeramicsSaudi CeramicsAl Anwar CeramicsAl Maha CeramicsAl JawdahFujairah Ceramics
GCC Tiles Market Share by Capacity, Top 6 (2013)Total Capacity of Top 6 Players -‐ 177mn sqm
‣ The 3 largest producers in the GCC contribute c.85% of the region’s total capacity.
‣ RAK Ceramics contributes 46% of the top 6 player’s GCC’s capacity, followed by Saudi Ceramics which contributes 36%.
‣ Approx. 25% of producPon in the GCC region is exported
Source: CI Capital Ini4a4on Research Report
Private & Confiden4al. RAK Ceramics. Copyright 2015.
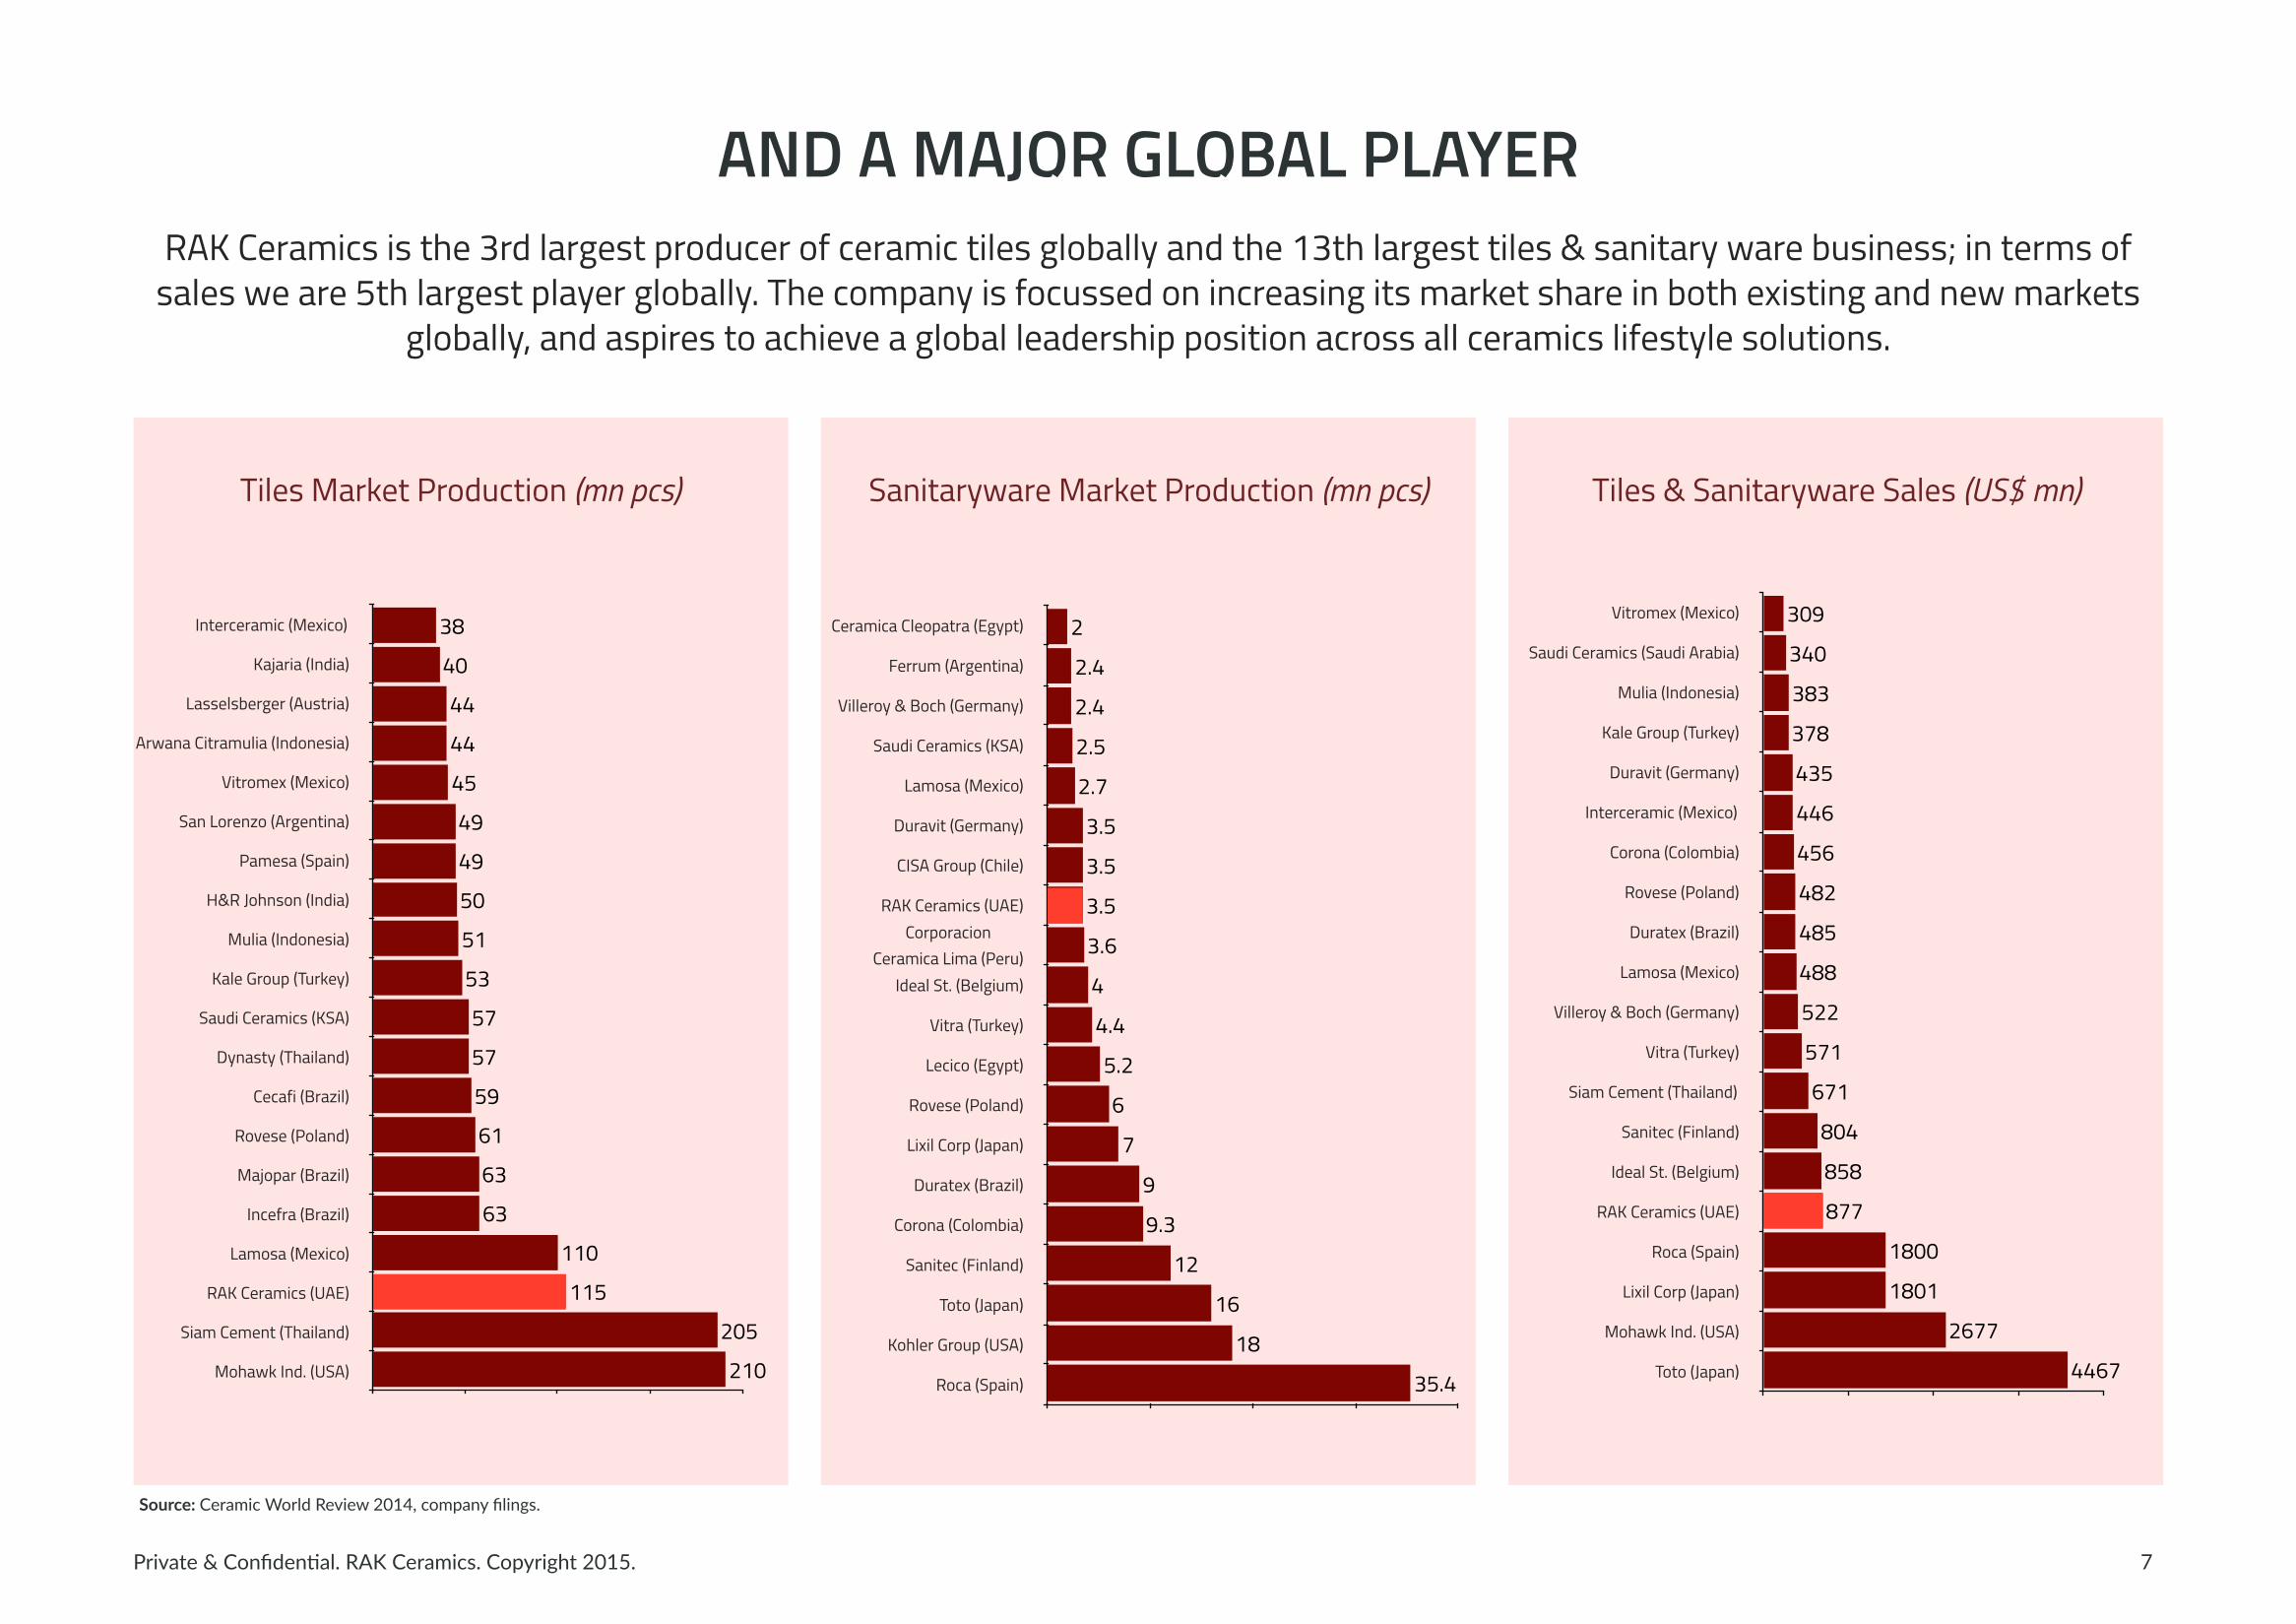
AND A MAJOR GLOBAL PLAYER
7
Interceramic (Mexico)
Kajaria (India)
Lasselsberger (Austria)
Arwana Citramulia (Indonesia)
Vitromex (Mexico)
San Lorenzo (Argentina)
Pamesa (Spain)
H&R Johnson (India)
Mulia (Indonesia)
Kale Group (Turkey)
Saudi Ceramics (KSA)
Dynasty (Thailand)
Cecafi (Brazil)
Rovese (Poland)
Majopar (Brazil)
Incefra (Brazil)
Lamosa (Mexico)
RAK Ceramics (UAE)
Siam Cement (Thailand)
Mohawk Ind. (USA) 210
205
115
110
63
63
61
59
57
57
53
51
50
49
49
45
44
44
40
38 Ceramica Cleopatra (Egypt)
Ferrum (Argentina)
Villeroy & Boch (Germany)
Saudi Ceramics (KSA)
Lamosa (Mexico)
Duravit (Germany)
CISA Group (Chile)
RAK Ceramics (UAE)Corporacion
Ceramica Lima (Peru)Ideal St. (Belgium)
Vitra (Turkey)
Lecico (Egypt)
Rovese (Poland)
Lixil Corp (Japan)
Duratex (Brazil)
Corona (Colombia)
Sanitec (Finland)
Toto (Japan)
Kohler Group (USA)
Roca (Spain) 35.4
18
16
12
9.3
9
7
6
5.2
4.4
4
3.6
3.5
3.5
3.5
2.7
2.5
2.4
2.4
2Vitromex (Mexico)
Saudi Ceramics (Saudi Arabia)
Mulia (Indonesia)
Kale Group (Turkey)
Duravit (Germany)
Interceramic (Mexico)
Corona (Colombia)
Rovese (Poland)
Duratex (Brazil)
Lamosa (Mexico)
Villeroy & Boch (Germany)
Vitra (Turkey)
Siam Cement (Thailand)
Sanitec (Finland)
Ideal St. (Belgium)
RAK Ceramics (UAE)
Roca (Spain)
Lixil Corp (Japan)
Mohawk Ind. (USA)
Toto (Japan) 4467
2677
1801
1800
877
858
804
671
571
522
488
485
482
456
446
435
378
383
340
309
Tiles Market Production (mn pcs) Sanitaryware Market Production (mn pcs) Tiles & Sanitaryware Sales (US$ mn)
Source: Ceramic World Review 2014, company filings.
RAK Ceramics is the 3rd largest producer of ceramic tiles globally and the 13th largest tiles & sanitary ware business; in terms of sales we are 5th largest player globally. The company is focussed on increasing its market share in both existing and new markets
globally, and aspires to achieve a global leadership position across all ceramics lifestyle solutions.
Private & Confiden4al. RAK Ceramics. Copyright 2015.
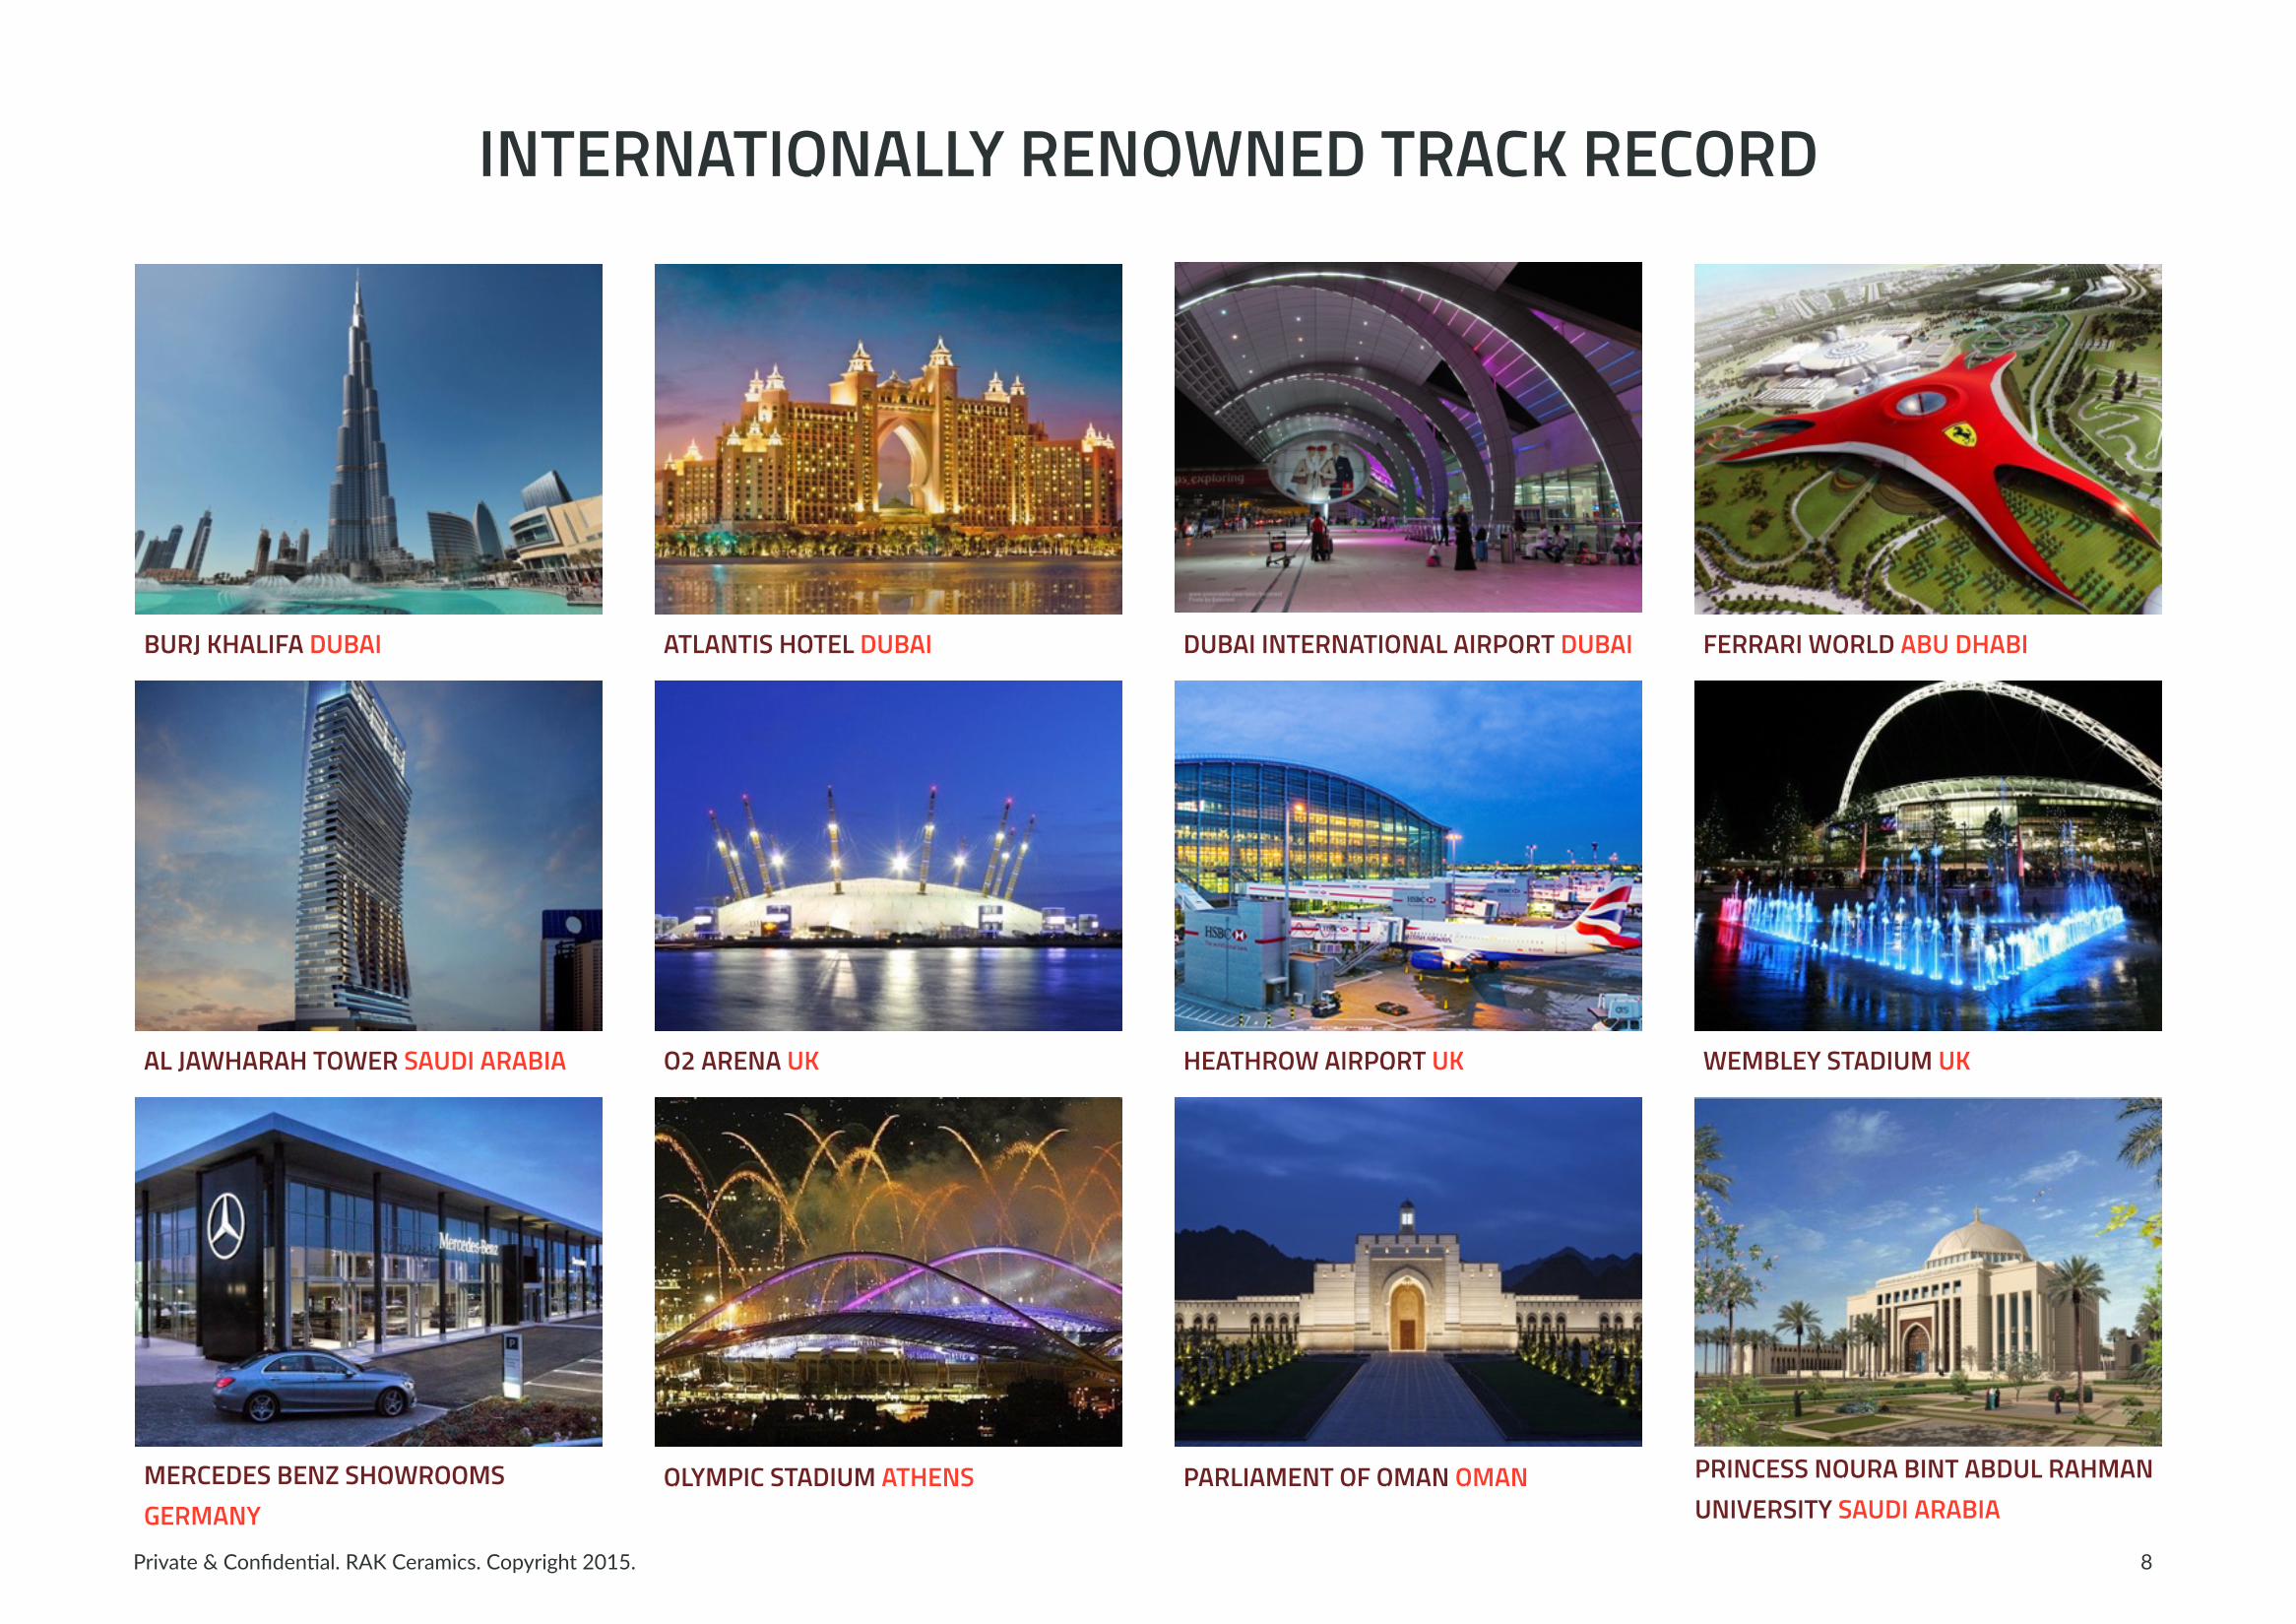
INTERNATIONALLY RENOWNED TRACK RECORD
8
BURJ KHALIFA DUBAI
AL JAWHARAH TOWER SAUDI ARABIA
MERCEDES BENZ SHOWROOMS GERMANY
ATLANTIS HOTEL DUBAI
O2 ARENA UK
OLYMPIC STADIUM ATHENS
DUBAI INTERNATIONAL AIRPORT DUBAI
HEATHROW AIRPORT UK
PARLIAMENT OF OMAN OMAN
FERRARI WORLD ABU DHABI
WEMBLEY STADIUM UK
PRINCESS NOURA BINT ABDUL RAHMAN UNIVERSITY SAUDI ARABIA
Private & Confiden4al. RAK Ceramics. Copyright 2015.
Show in United Arab Emirates Dirhams (AED) Millions
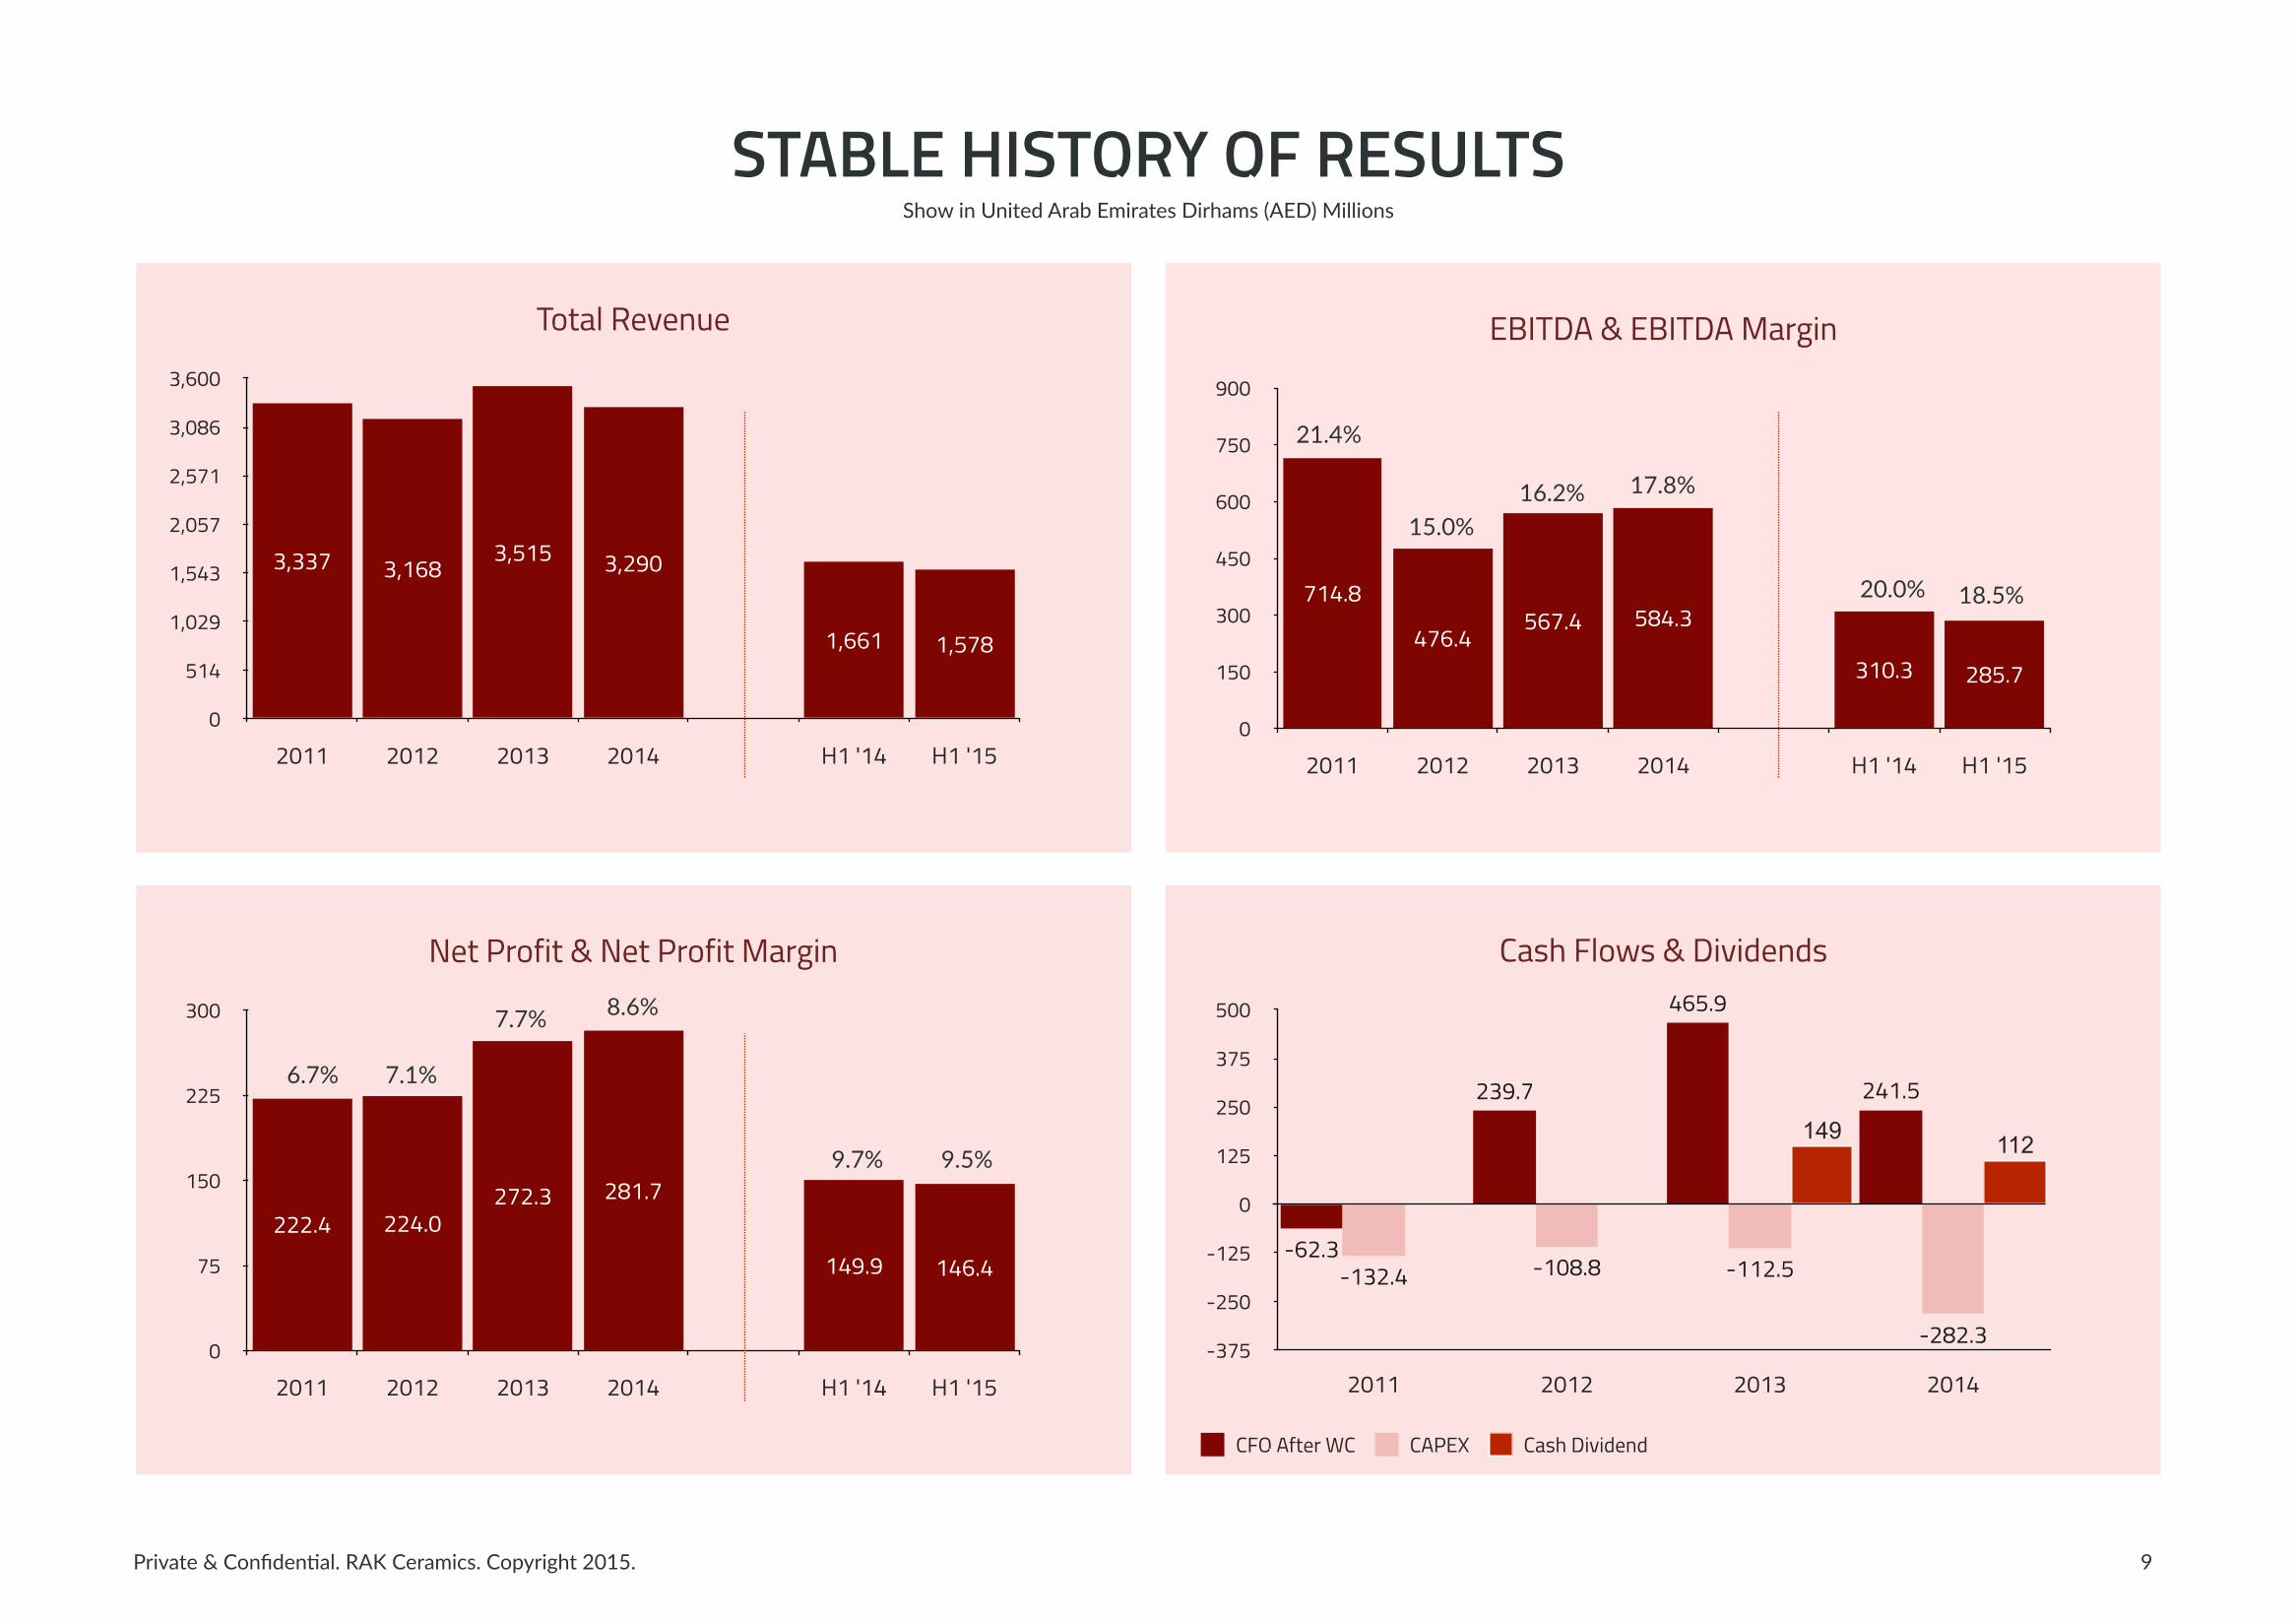
STABLE HISTORY OF RESULTS
9
Total Revenue
0
514
1,029
1,543
2,057
2,571
3,086
3,600
2011 2012 2013 2014 H1 '14 H1 '15
1,5781,661
3,2903,5153,1683,337
EBITDA & EBITDA Margin
0
150
300
450
600
750
900
2011 2012 2013 2014 H1 '14 H1 '15
285.7310.3
584.3567.4476.4
714.8
Net Profit & Net Profit Margin
0
75
150
225
300
2011 2012 2013 2014 H1 '14 H1 '15
146.4149.9
281.7272.3224.0222.4
6.7% 7.1%
7.7% 8.6%
9.7% 9.5%
21.4%
15.0%16.2% 17.8%
20.0% 18.5%
Cash Flows & Dividends
-375
-250
-125
0
125
250
375
500
2011 2012 2013 2014
112149
-282.3
-112.5-108.8-132.4
241.5
465.9
239.7
-62.3
CFO After WC CAPEX Cash Dividend
Private & Confiden4al. RAK Ceramics. Copyright 2015.
Show in United Arab Emirates Dirhams (AED) Millions
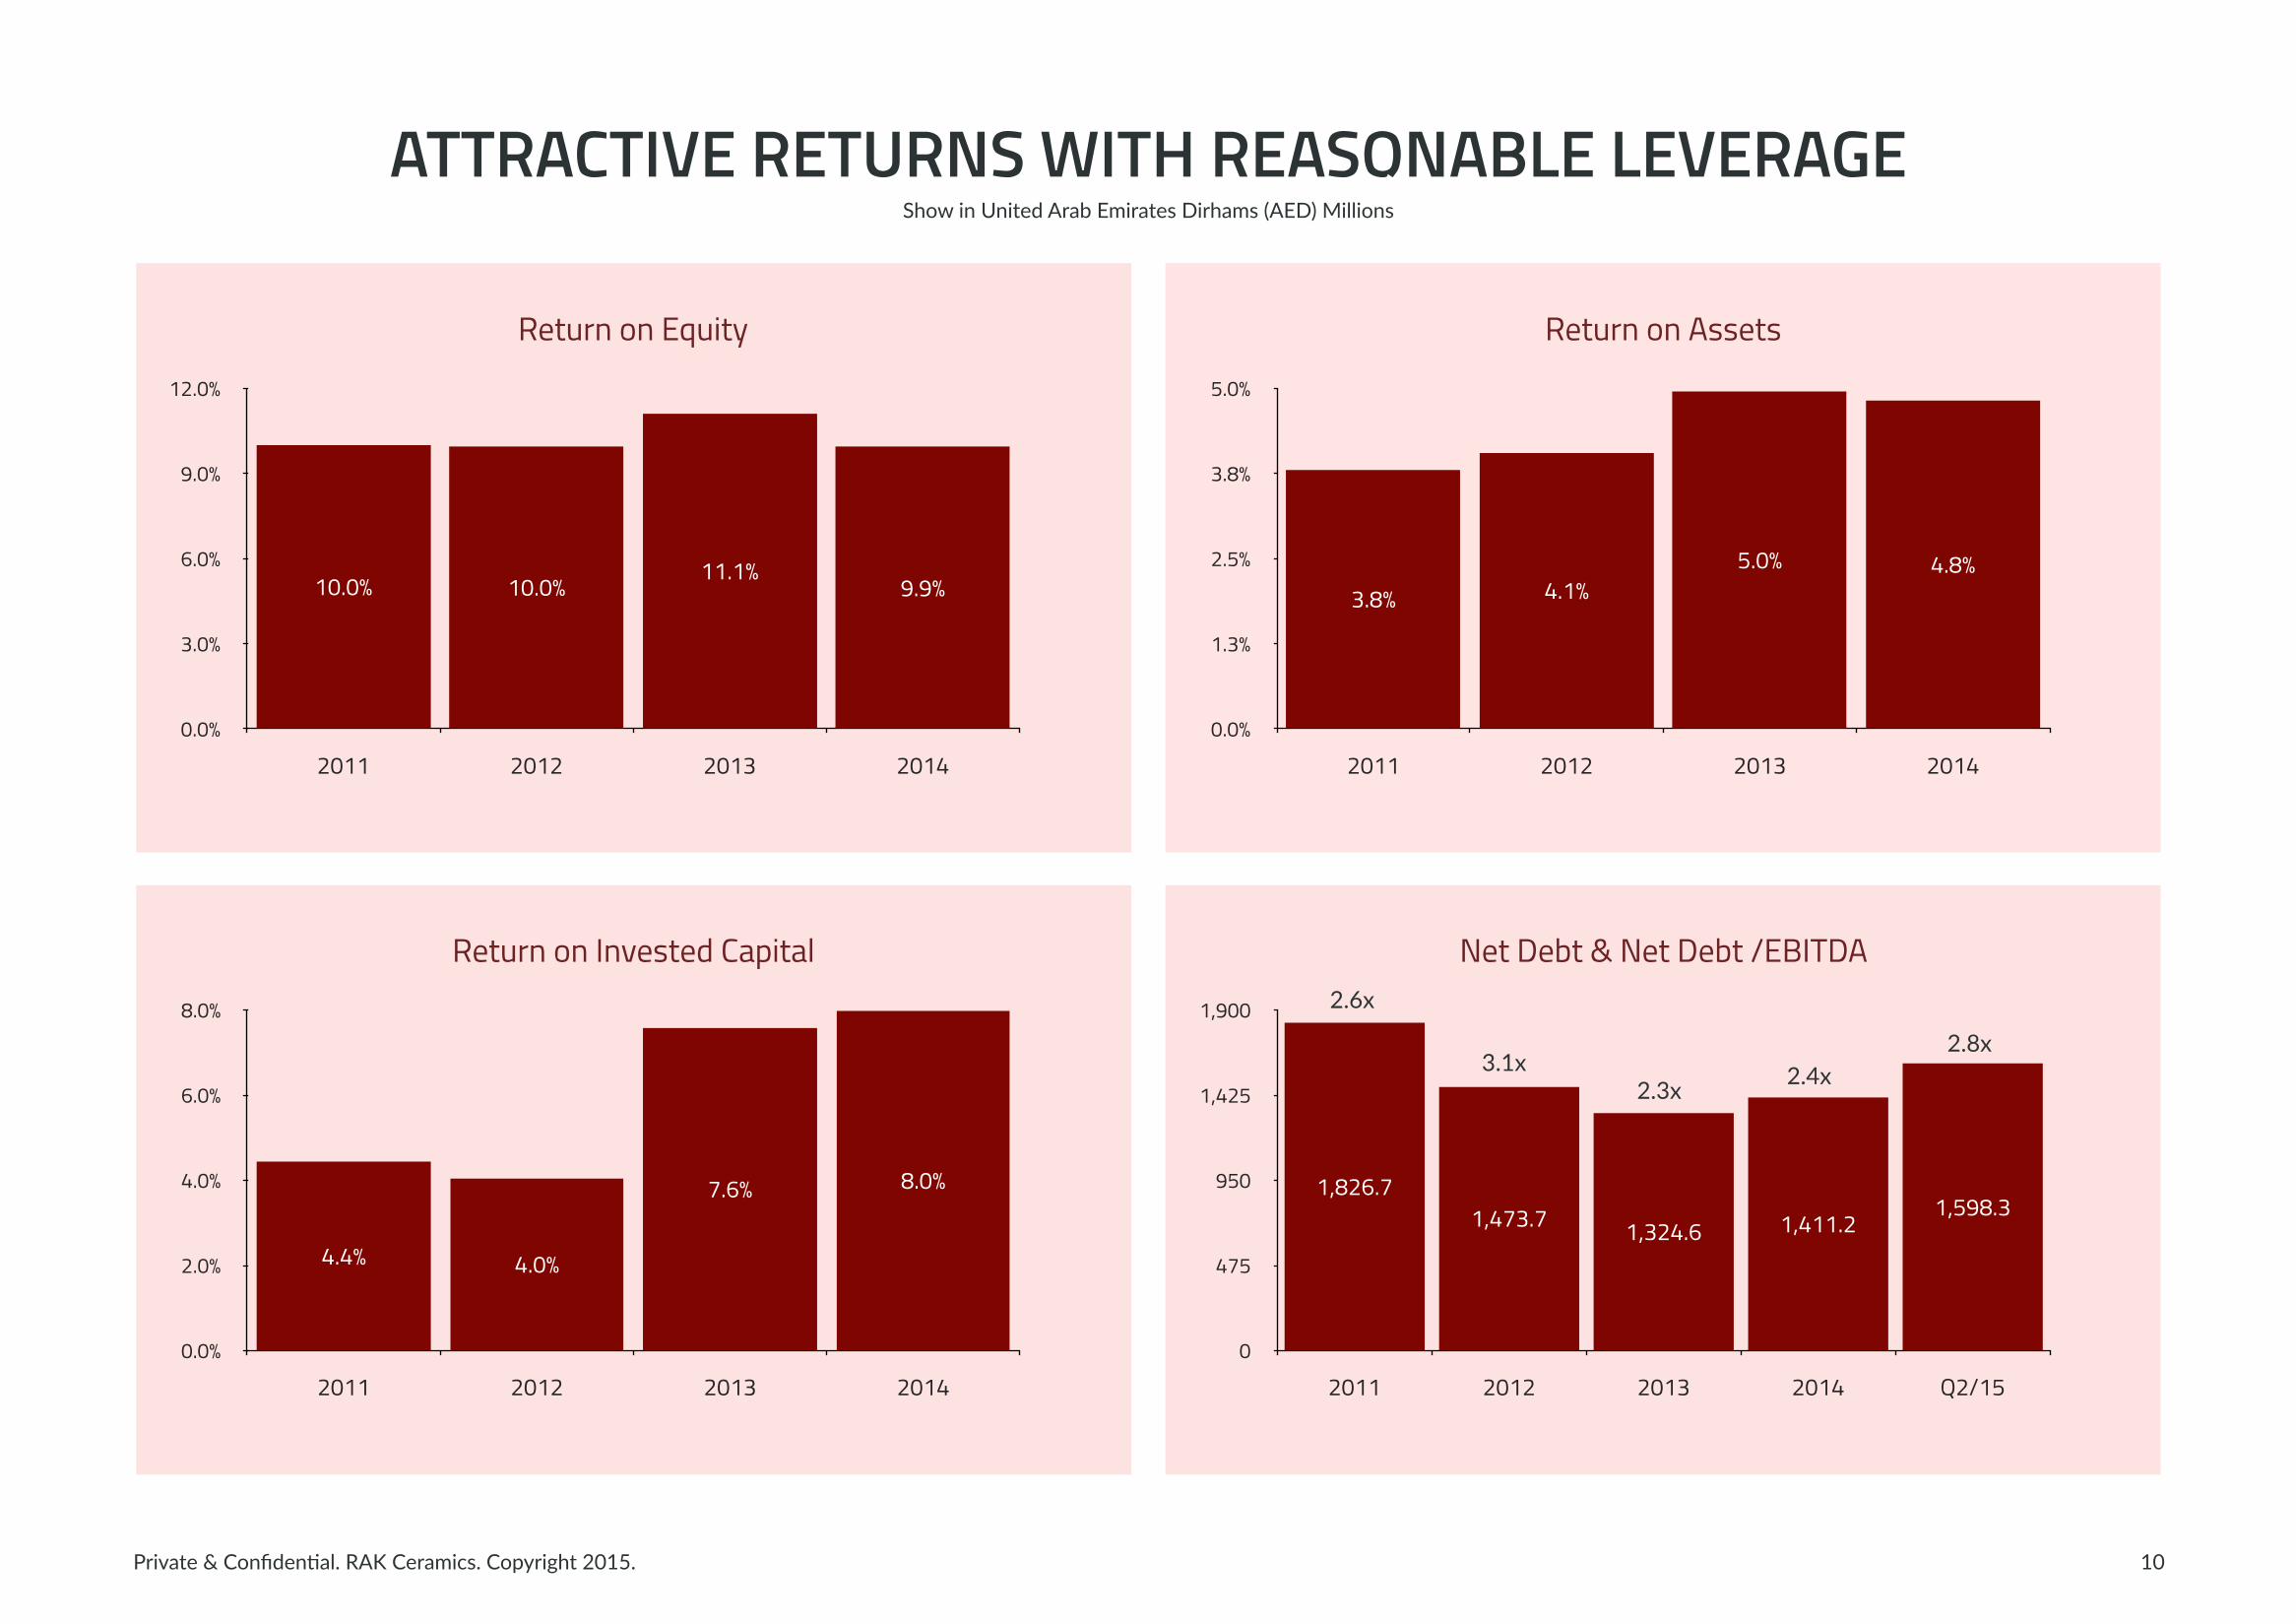
ATTRACTIVE RETURNS WITH REASONABLE LEVERAGE
10
Return on Equity
0.0%
3.0%
6.0%
9.0%
12.0%
2011 2012 2013 2014
9.9%11.1%
10.0%10.0%
Return on Assets
0.0%
1.3%
2.5%
3.8%
5.0%
2011 2012 2013 2014
4.8%5.0%4.1%3.8%
Return on Invested Capital
0.0%
2.0%
4.0%
6.0%
8.0%
2011 2012 2013 2014
8.0%7.6%
4.0%4.4%
Net Debt & Net Debt /EBITDA
0
475
950
1,425
1,900
2011 2012 2013 2014 Q2/15
1,598.31,411.21,324.61,473.7
1,826.7
2.6x
3.1x2.3x 2.4x
2.8x
2014 ONWARDS – REFOCUSED STRATEGY
Private & Confiden4al. RAK Ceramics. Copyright 2015.
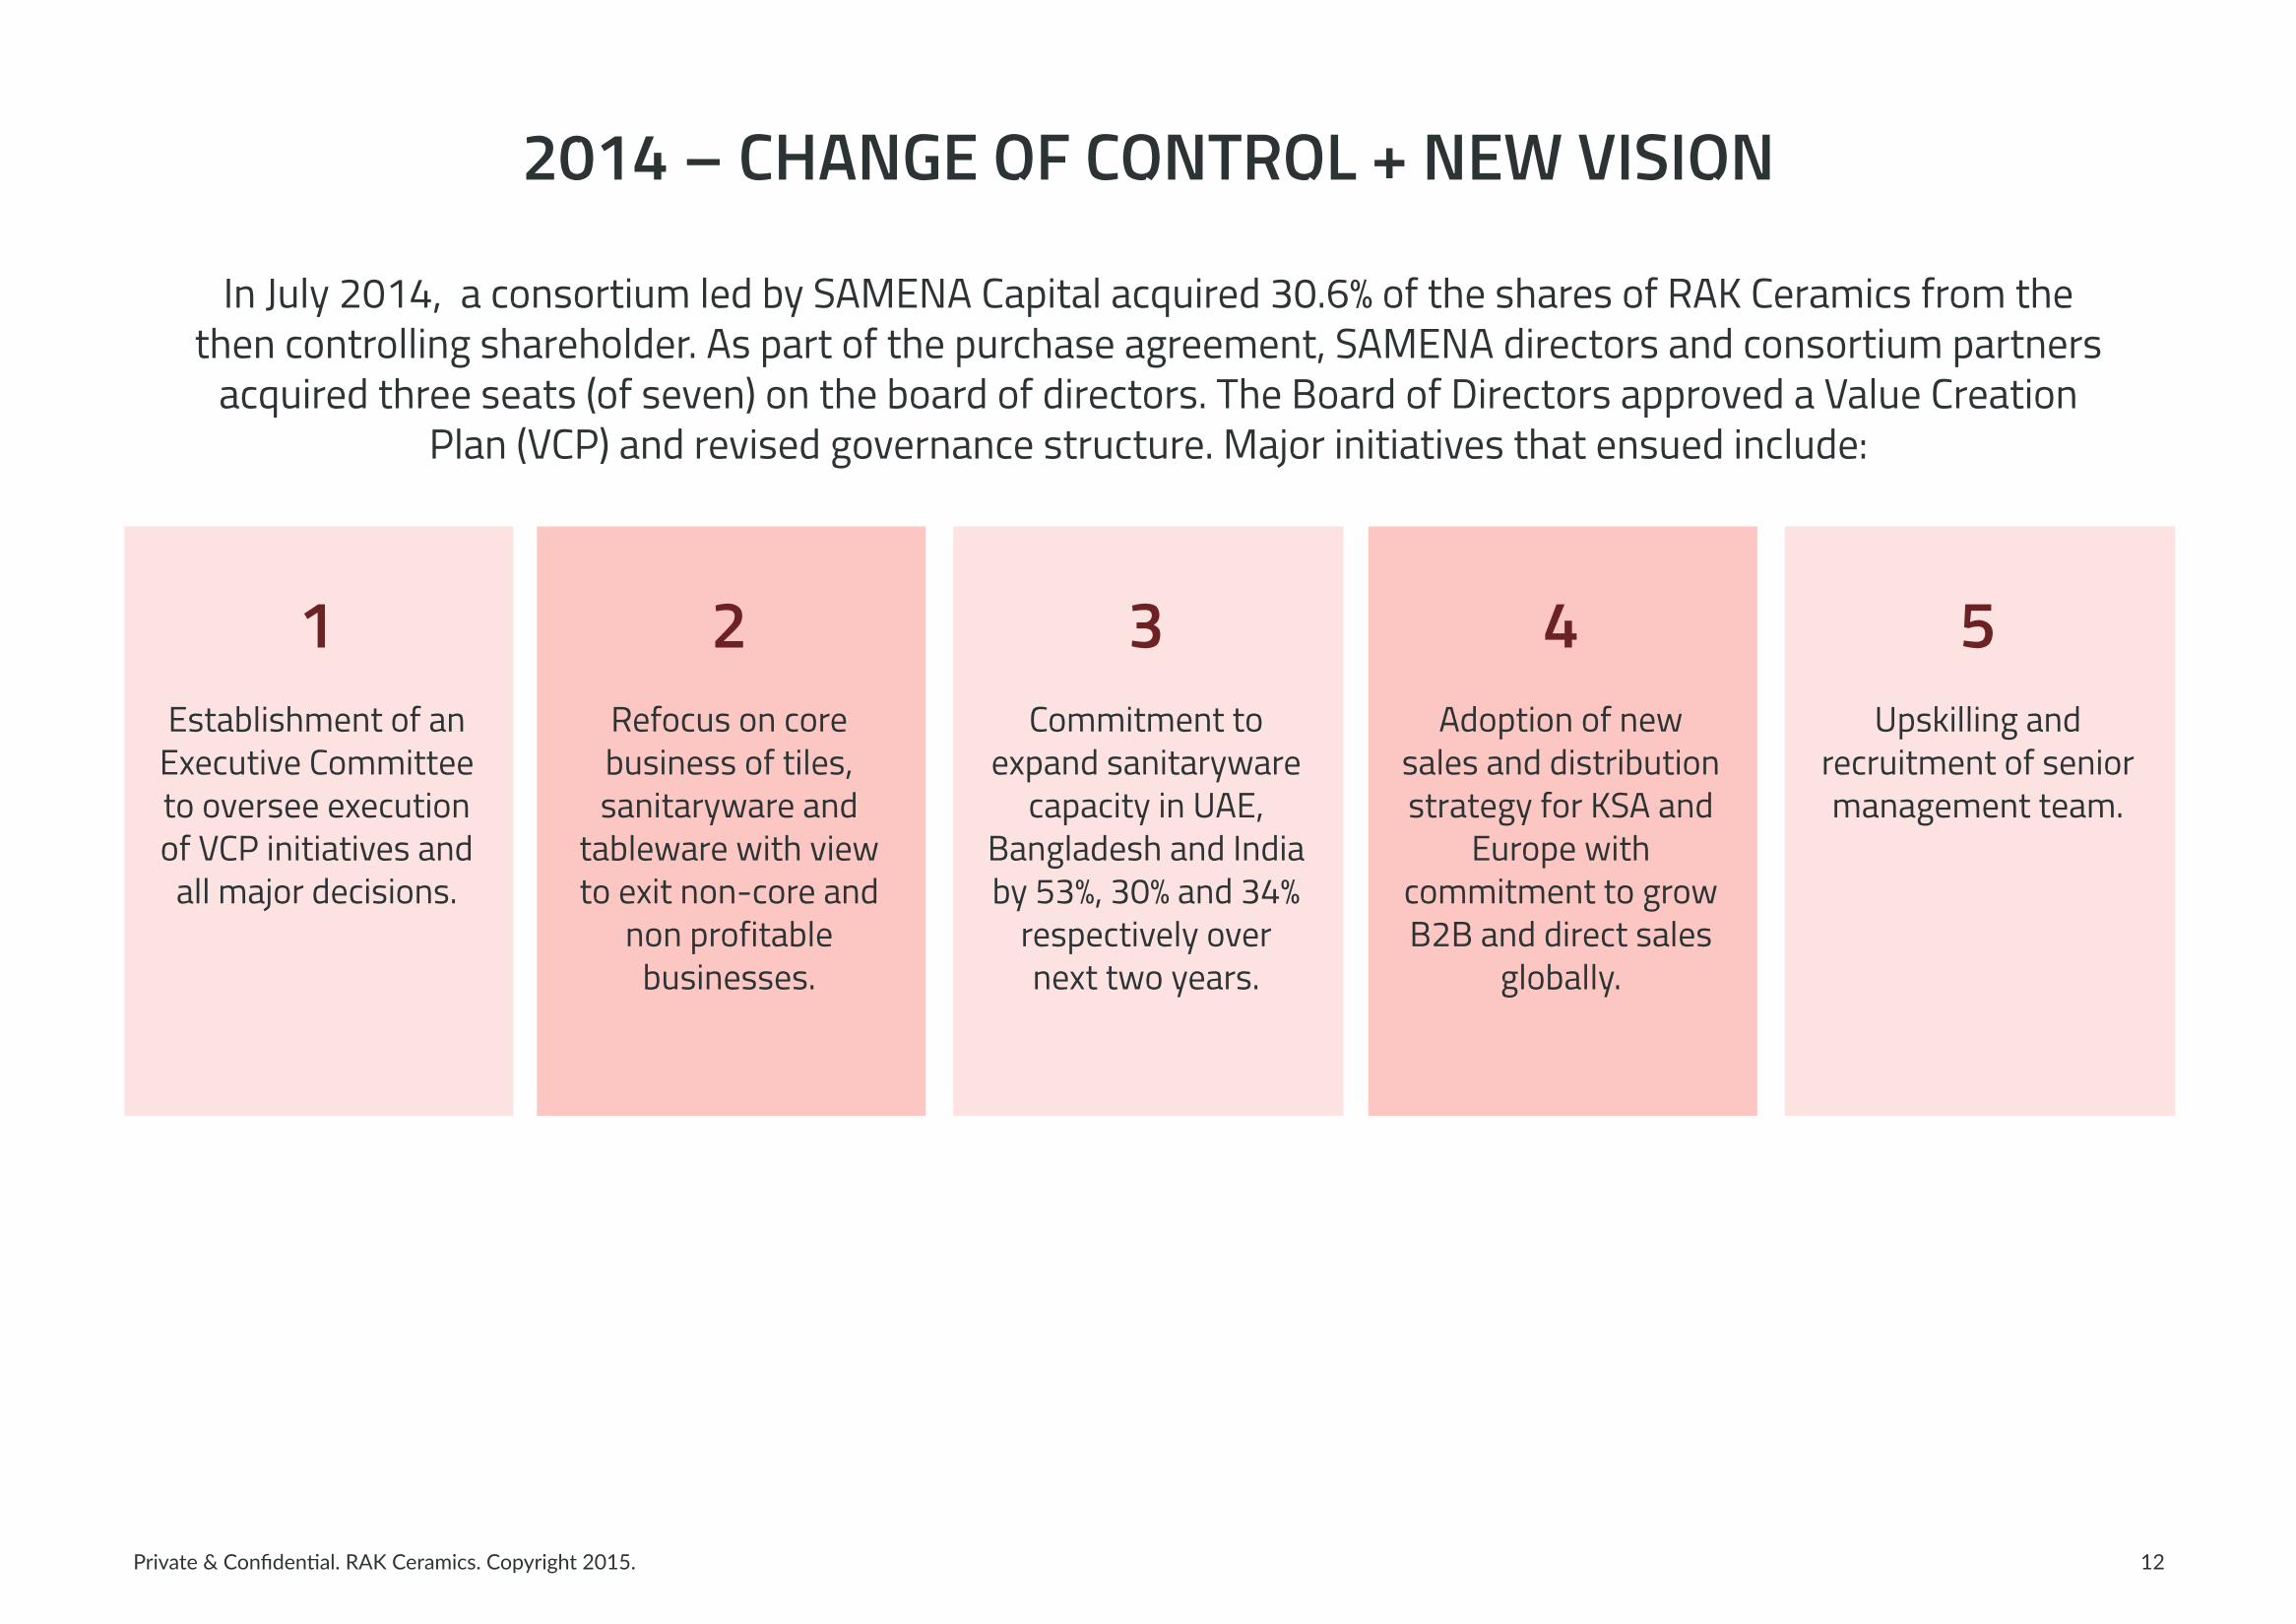
2014 – CHANGE OF CONTROL + NEW VISION
12
In July 2014, a consortium led by SAMENA Capital acquired 30.6% of the shares of RAK Ceramics from the then controlling shareholder. As part of the purchase agreement, SAMENA directors and consortium partners
acquired three seats (of seven) on the board of directors. The Board of Directors approved a Value Creation Plan (VCP) and revised governance structure. Major initiatives that ensued include:
1Establishment of an
Executive Committee to oversee execution of VCP initiatives and
all major decisions.
2Refocus on core business of tiles, sanitaryware and
tableware with view to exit non-core and
non profitable businesses.
3Commitment to
expand sanitaryware capacity in UAE,
Bangladesh and India by 53%, 30% and 34%
respectively over next two years.
4Adoption of new
sales and distribution strategy for KSA and
Europe with commitment to grow B2B and direct sales
globally.
5Upskilling and
recruitment of senior management team.
Private & Confiden4al. RAK Ceramics. Copyright 2015.
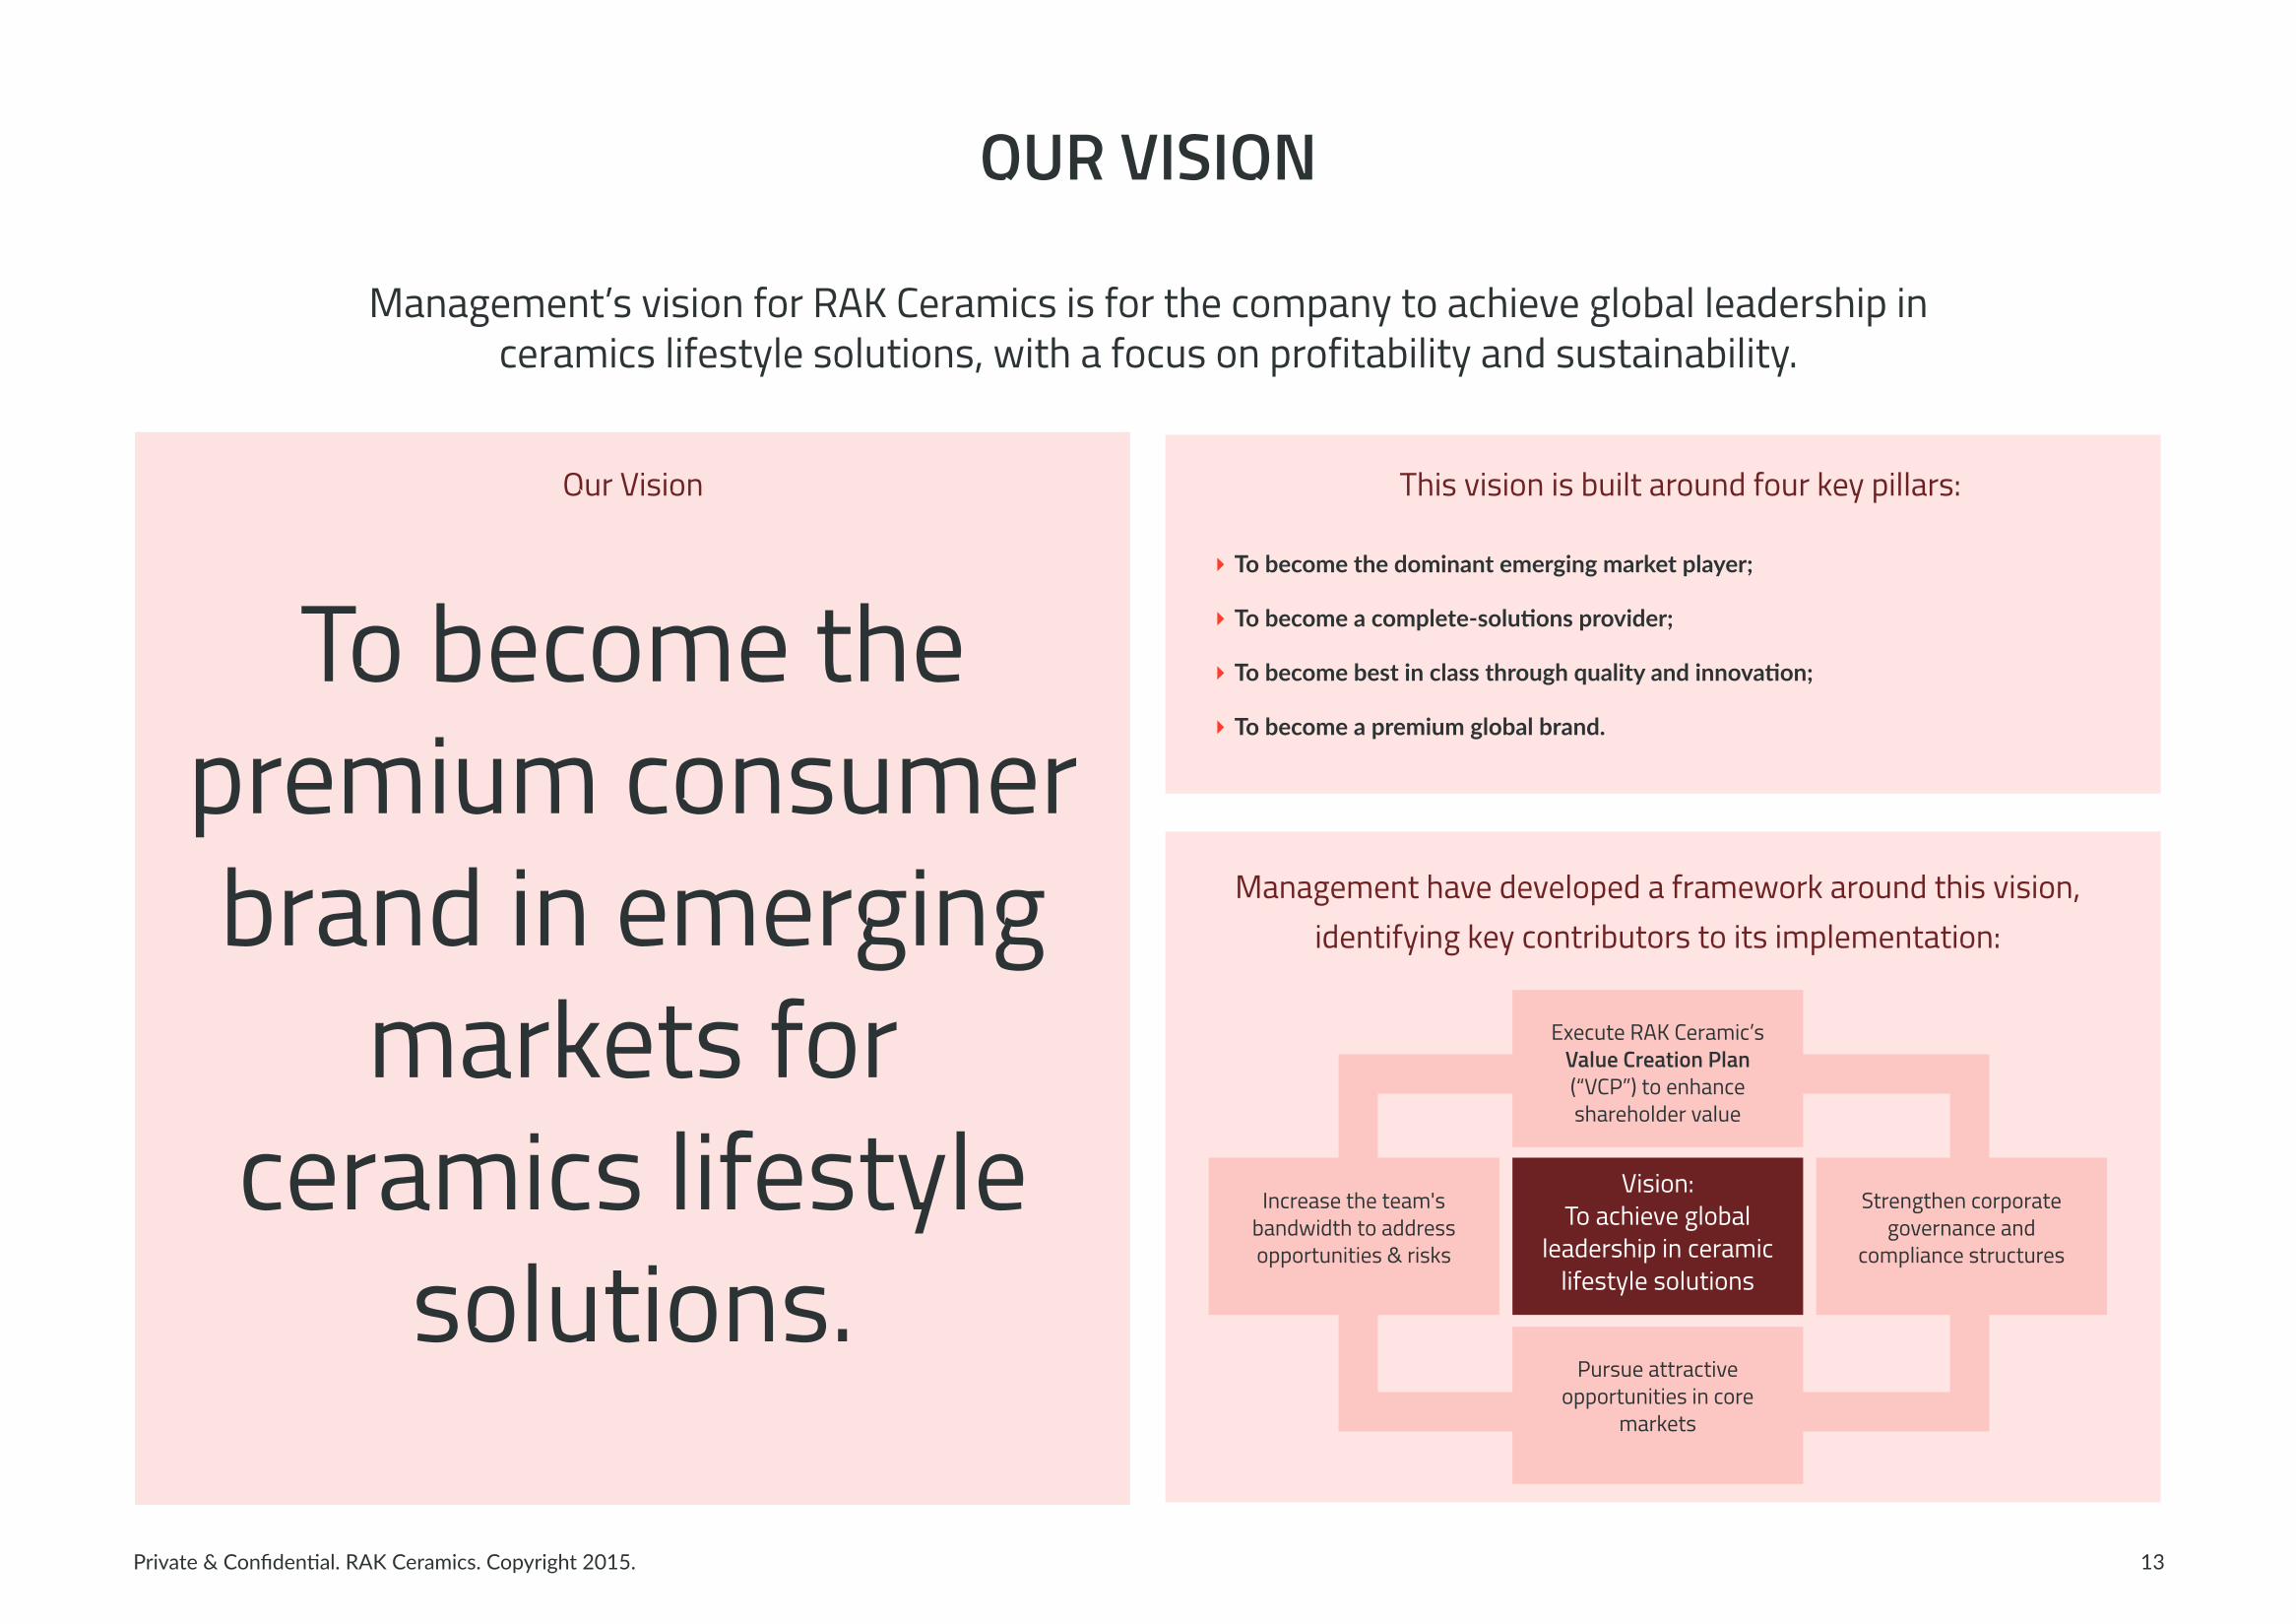
OUR VISION
13
Management have developed a framework around this vision, identifying key contributors to its implementation:
This vision is built around four key pillars:Our Vision
To become the premium consumer brand in emerging
markets for ceramics lifestyle
solutions.
Management’s vision for RAK Ceramics is for the company to achieve global leadership in ceramics lifestyle solutions, with a focus on profitability and sustainability.
‣ To become the dominant emerging market player;
‣ To become a complete-‐soluPons provider;
‣ To become best in class through quality and innovaPon;
‣ To become a premium global brand.
Execute RAK Ceramic’s Value Creation Plan (“VCP”) to enhance shareholder value
Increase the team's bandwidth to address opportunities & risks
Strengthen corporate governance and
compliance structures
Pursue attractive opportunities in core
markets
Vision:To achieve global
leadership in ceramic lifestyle solutions
Private & Confiden4al. RAK Ceramics. Copyright 2015.
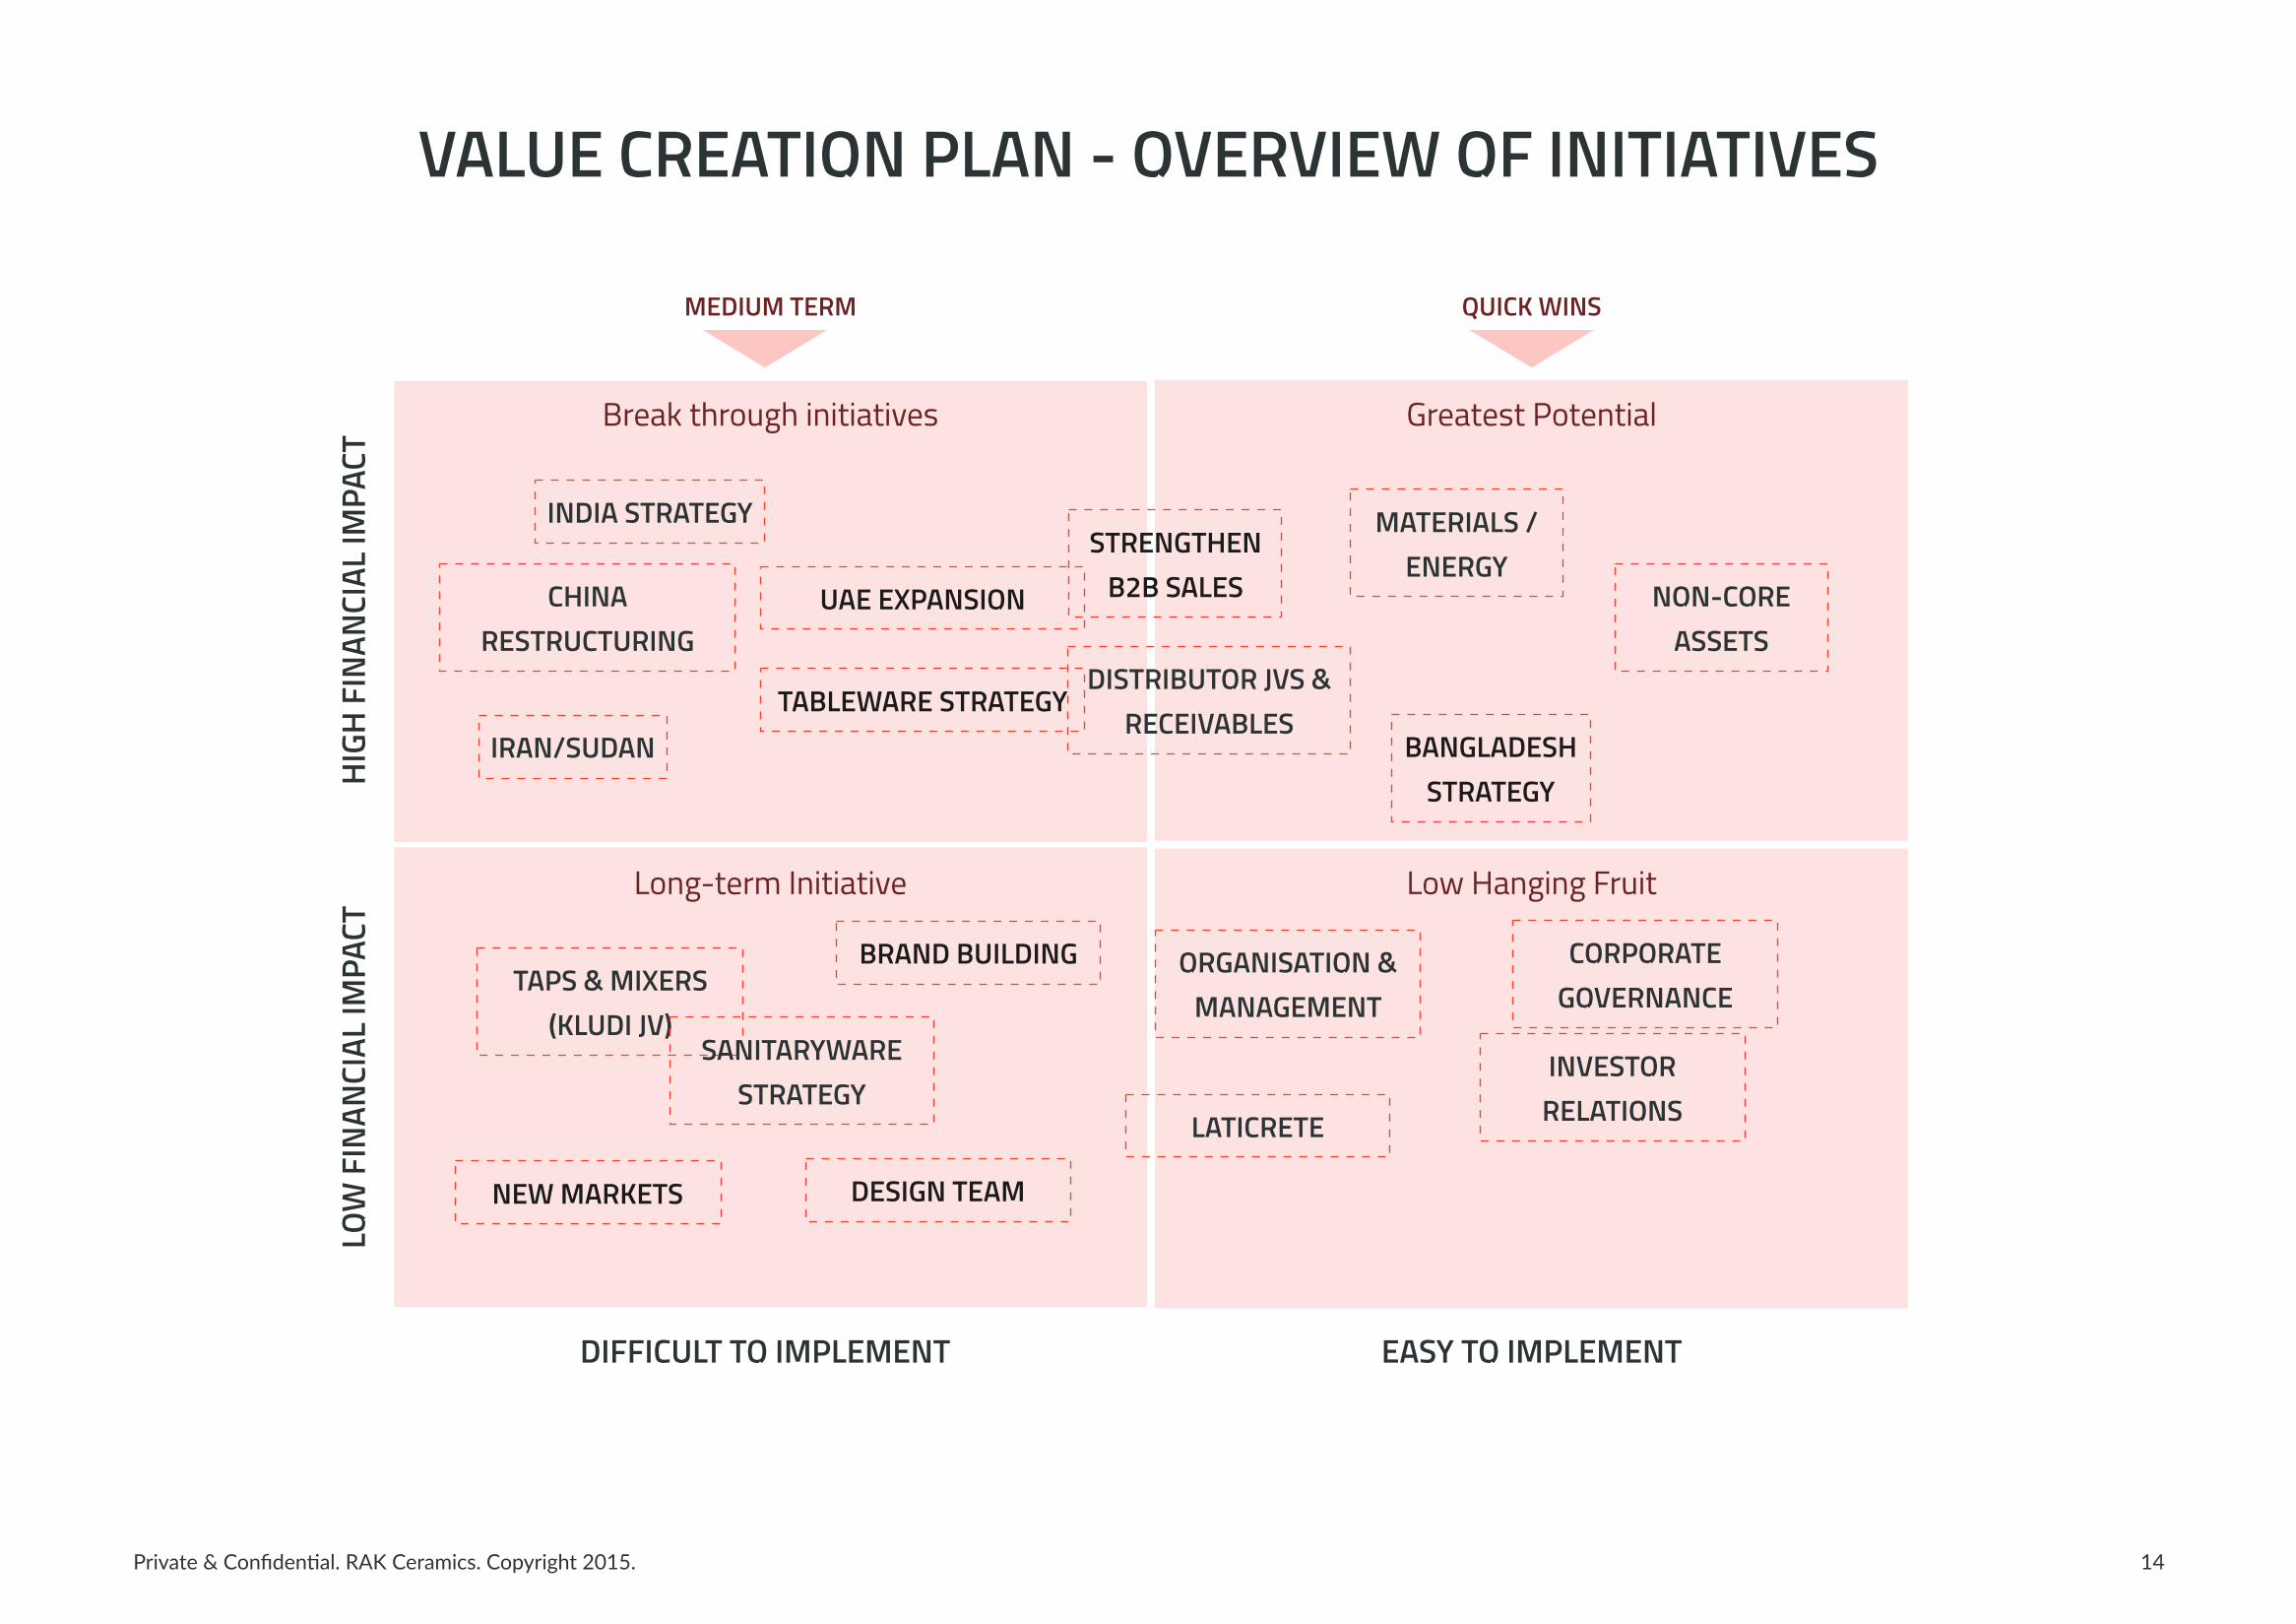
VALUE CREATION PLAN - OVERVIEW OF INITIATIVES
14
LOW
FIN
ANCI
AL IM
PACT
Greatest Potential
HIGH
FIN
ANCI
AL IM
PACT
Break through initiatives
Low Hanging FruitLong-term Initiative
DIFFICULT TO IMPLEMENT EASY TO IMPLEMENT
MEDIUM TERM QUICK WINS
INDIA STRATEGY
CHINA RESTRUCTURING
IRAN/SUDAN
UAE EXPANSION
TABLEWARE STRATEGY
STRENGTHEN B2B SALES
DISTRIBUTOR JVS & RECEIVABLES
MATERIALS / ENERGY
NON-CORE ASSETS
BANGLADESH STRATEGY
BRAND BUILDINGTAPS & MIXERS
(KLUDI JV)SANITARYWARE
STRATEGY
NEW MARKETS DESIGN TEAM
LATICRETE
ORGANISATION & MANAGEMENT
CORPORATE GOVERNANCE
INVESTOR RELATIONS
Private & Confiden4al. RAK Ceramics. Copyright 2015.
VALUE CREATION PLAN – H1/15 REVIEW AND H2/15 FOCUS
15
REVENUE GROWTH
TILES EXPANSION
SW EXPANSION
TABLEWARE STRATEGY
SALES & DISTRIBUTION STRATEGY
BRANDING & POSITIONING
INTEGRATED SALES
MARGIN ENHANCEMENT
PROCUREMENT
ENERGY REDUCTION
EXIT UNDERPERFORMING ASSETS*
SCALING DOWN NON-CORE OPERATIONS
CASH GENERATION NON-CORE DISPOSALS
RECEIVABLES MANAGEMENT
ENHANCED CONTROL & GOVERNANCE
JV RESTRUCTURING
CORPORATE GOVERNANCE & CONTROL
INVESTOR RELATIONS
Bangladesh expansion
SW strategy and expansion plan
INTERNATIONAL EXPANSION PLAN
Branding Project kicked-‐off
Category savings. Raw material inventory reduc4on
Sudan SPA signed
AHCC turnaround
Sales of La4crete, RAK paints Bangladesh, Aluminium & Gypsum, 15 townhouses
*Sudan & China Plants.
SW strategy and expansion plan
Strategy and business plan
Distributor management
Project design phase complete
Faucets and accessory strategy defined
Category savings & Raw material inventory reducPon
Sudan complete. China strategic opPons
RAK WL, RAK LogisPcs
Europe restructuring
Interna4onal expansion plan
STRATEGIC PRIORITY INITIATIVES PROGRESS IN 2015 H1 FOCUS FOR 2015 H2
Regional sales offices defined
Private & Confiden4al. RAK Ceramics. Copyright 2015.
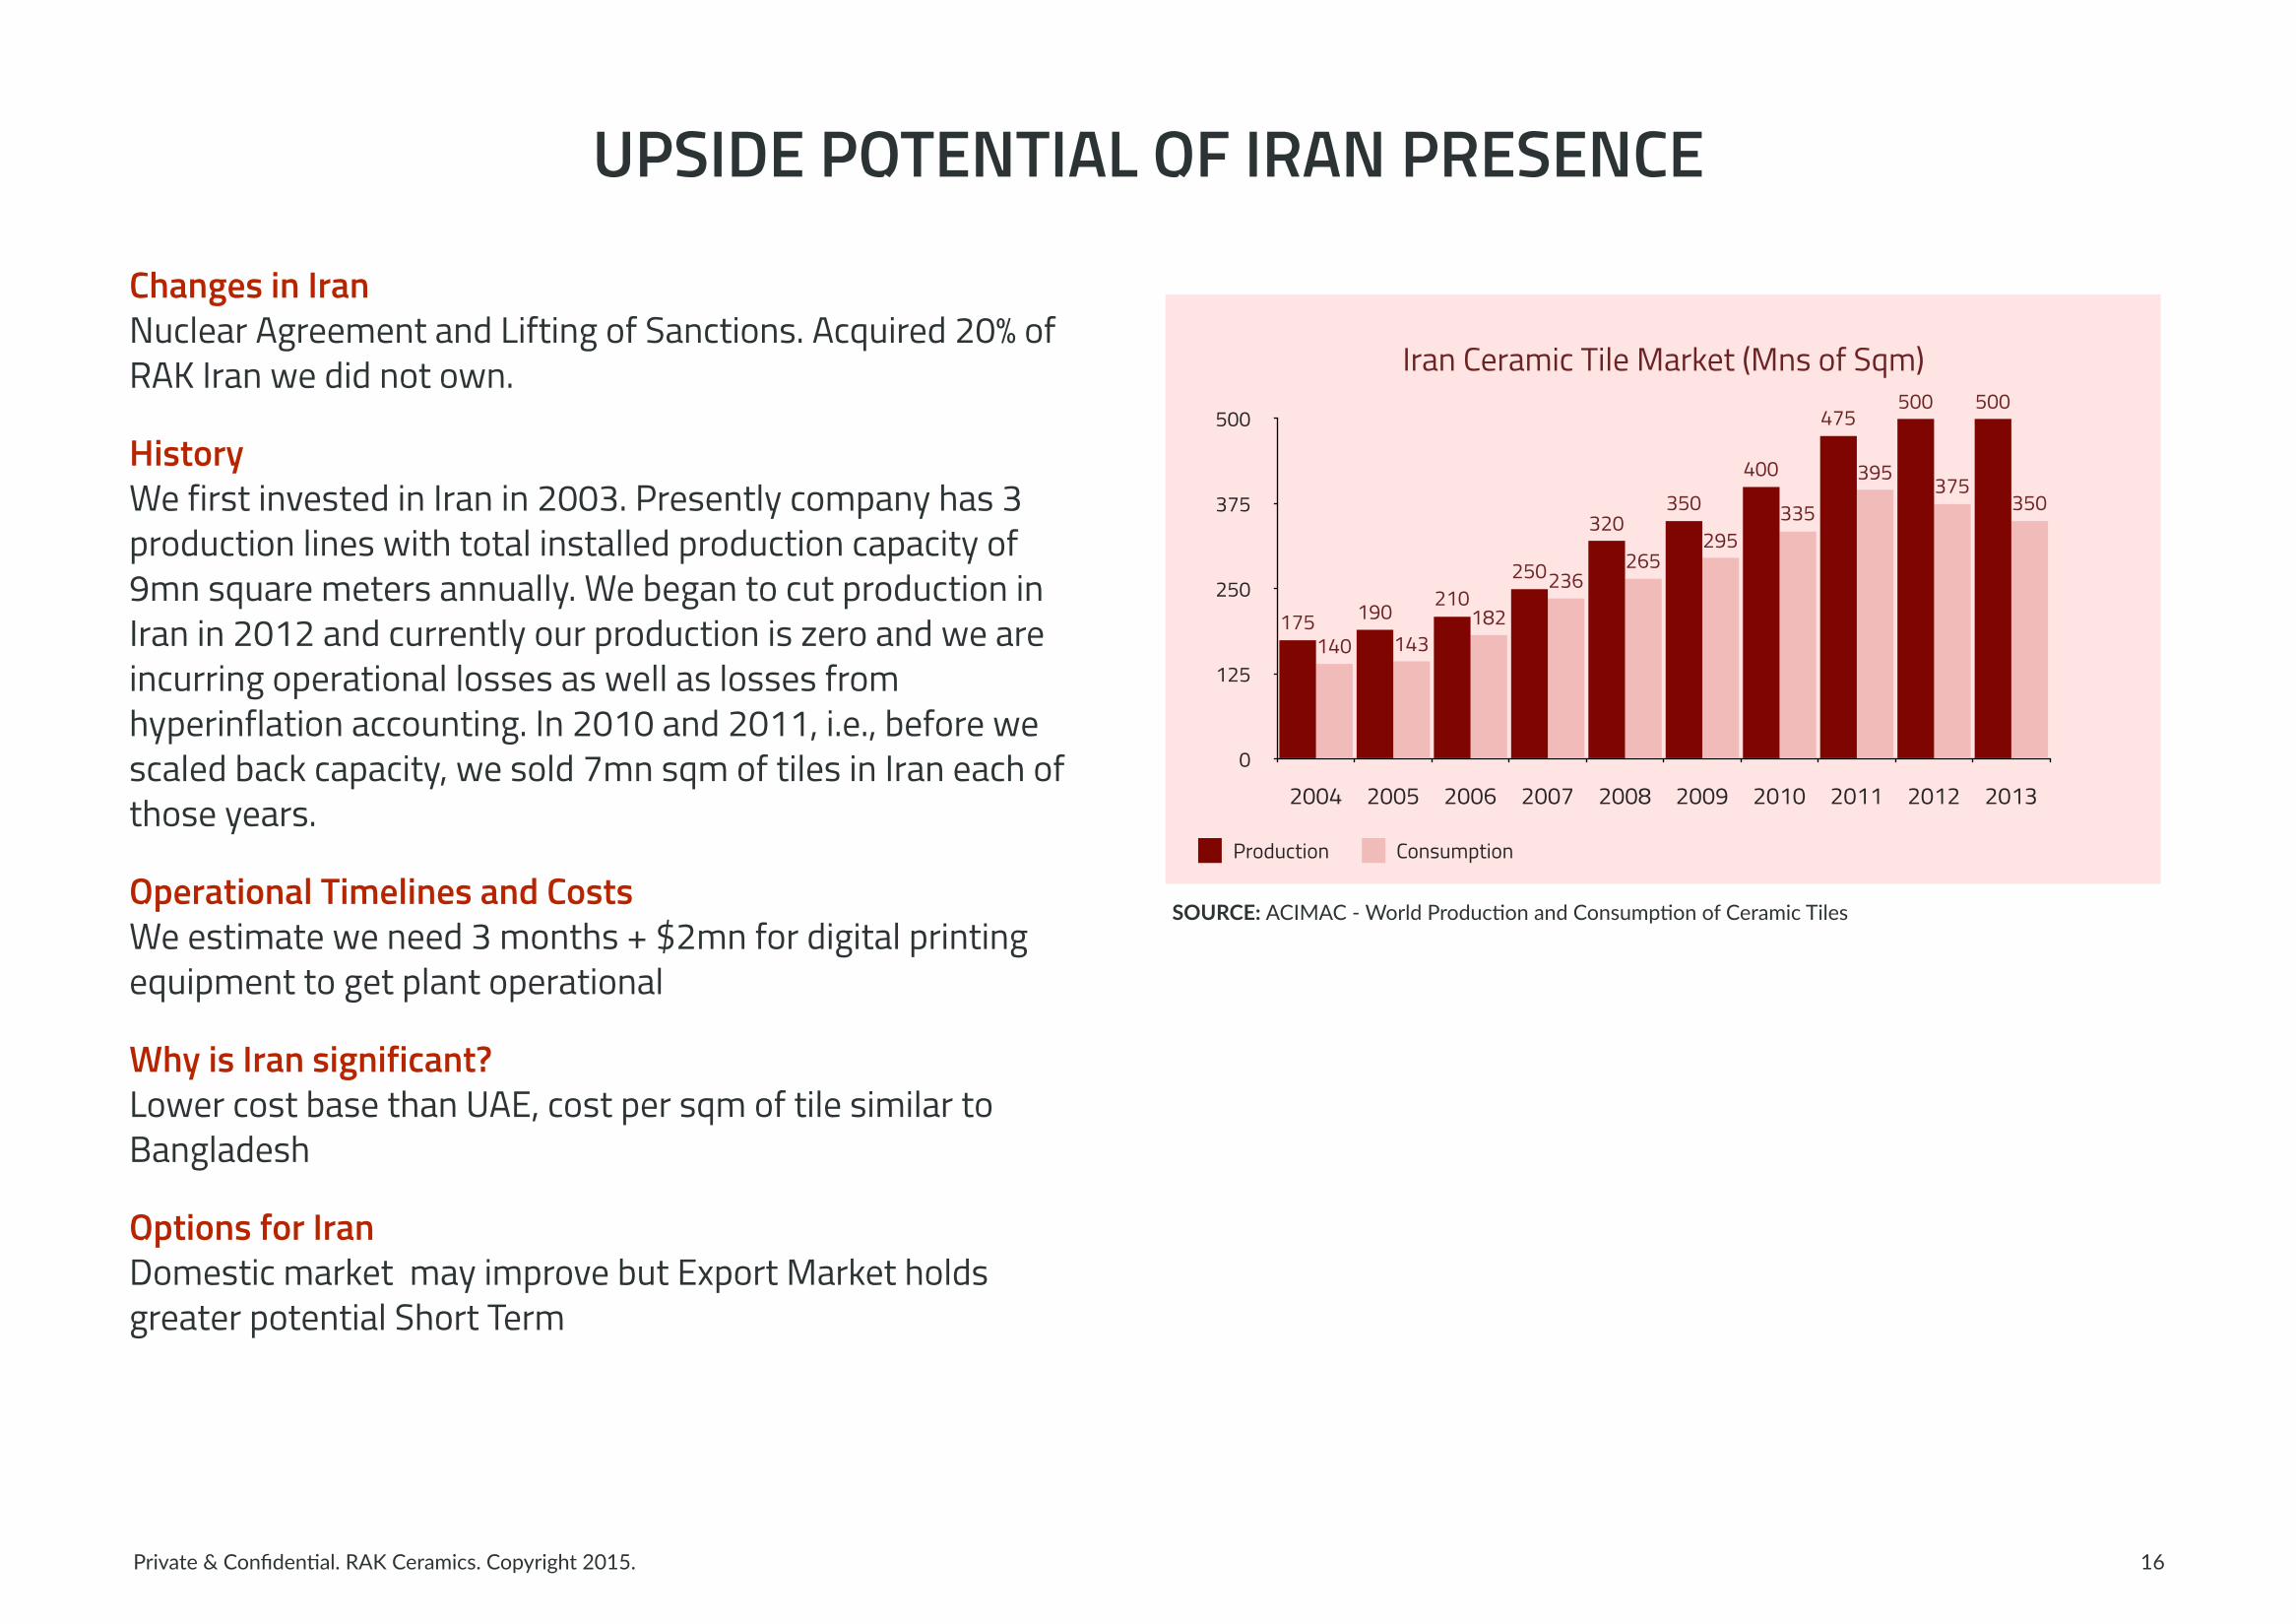
UPSIDE POTENTIAL OF IRAN PRESENCE
16
Changes in IranNuclear Agreement and Lifting of Sanctions. Acquired 20% of RAK Iran we did not own.
HistoryWe first invested in Iran in 2003. Presently company has 3 production lines with total installed production capacity of 9mn square meters annually. We began to cut production in Iran in 2012 and currently our production is zero and we are incurring operational losses as well as losses from hyperinflation accounting. In 2010 and 2011, i.e., before we scaled back capacity, we sold 7mn sqm of tiles in Iran each of those years.
Operational Timelines and Costs We estimate we need 3 months + $2mn for digital printing equipment to get plant operational
Why is Iran significant? Lower cost base than UAE, cost per sqm of tile similar to Bangladesh
Options for IranDomestic market may improve but Export Market holds greater potential Short Term
Iran Ceramic Tile Market (Mns of Sqm)
0
125
250
375
500
2004 2005 2006 2007 2008 2009 2010 2011 2012 2013
350375395
335295
265236
182143140
500500475
400350
320
250210190175
Production Consumption
SOURCE: ACIMAC -‐ World Produc4on and Consump4on of Ceramic Tiles

STOCK PROFILE
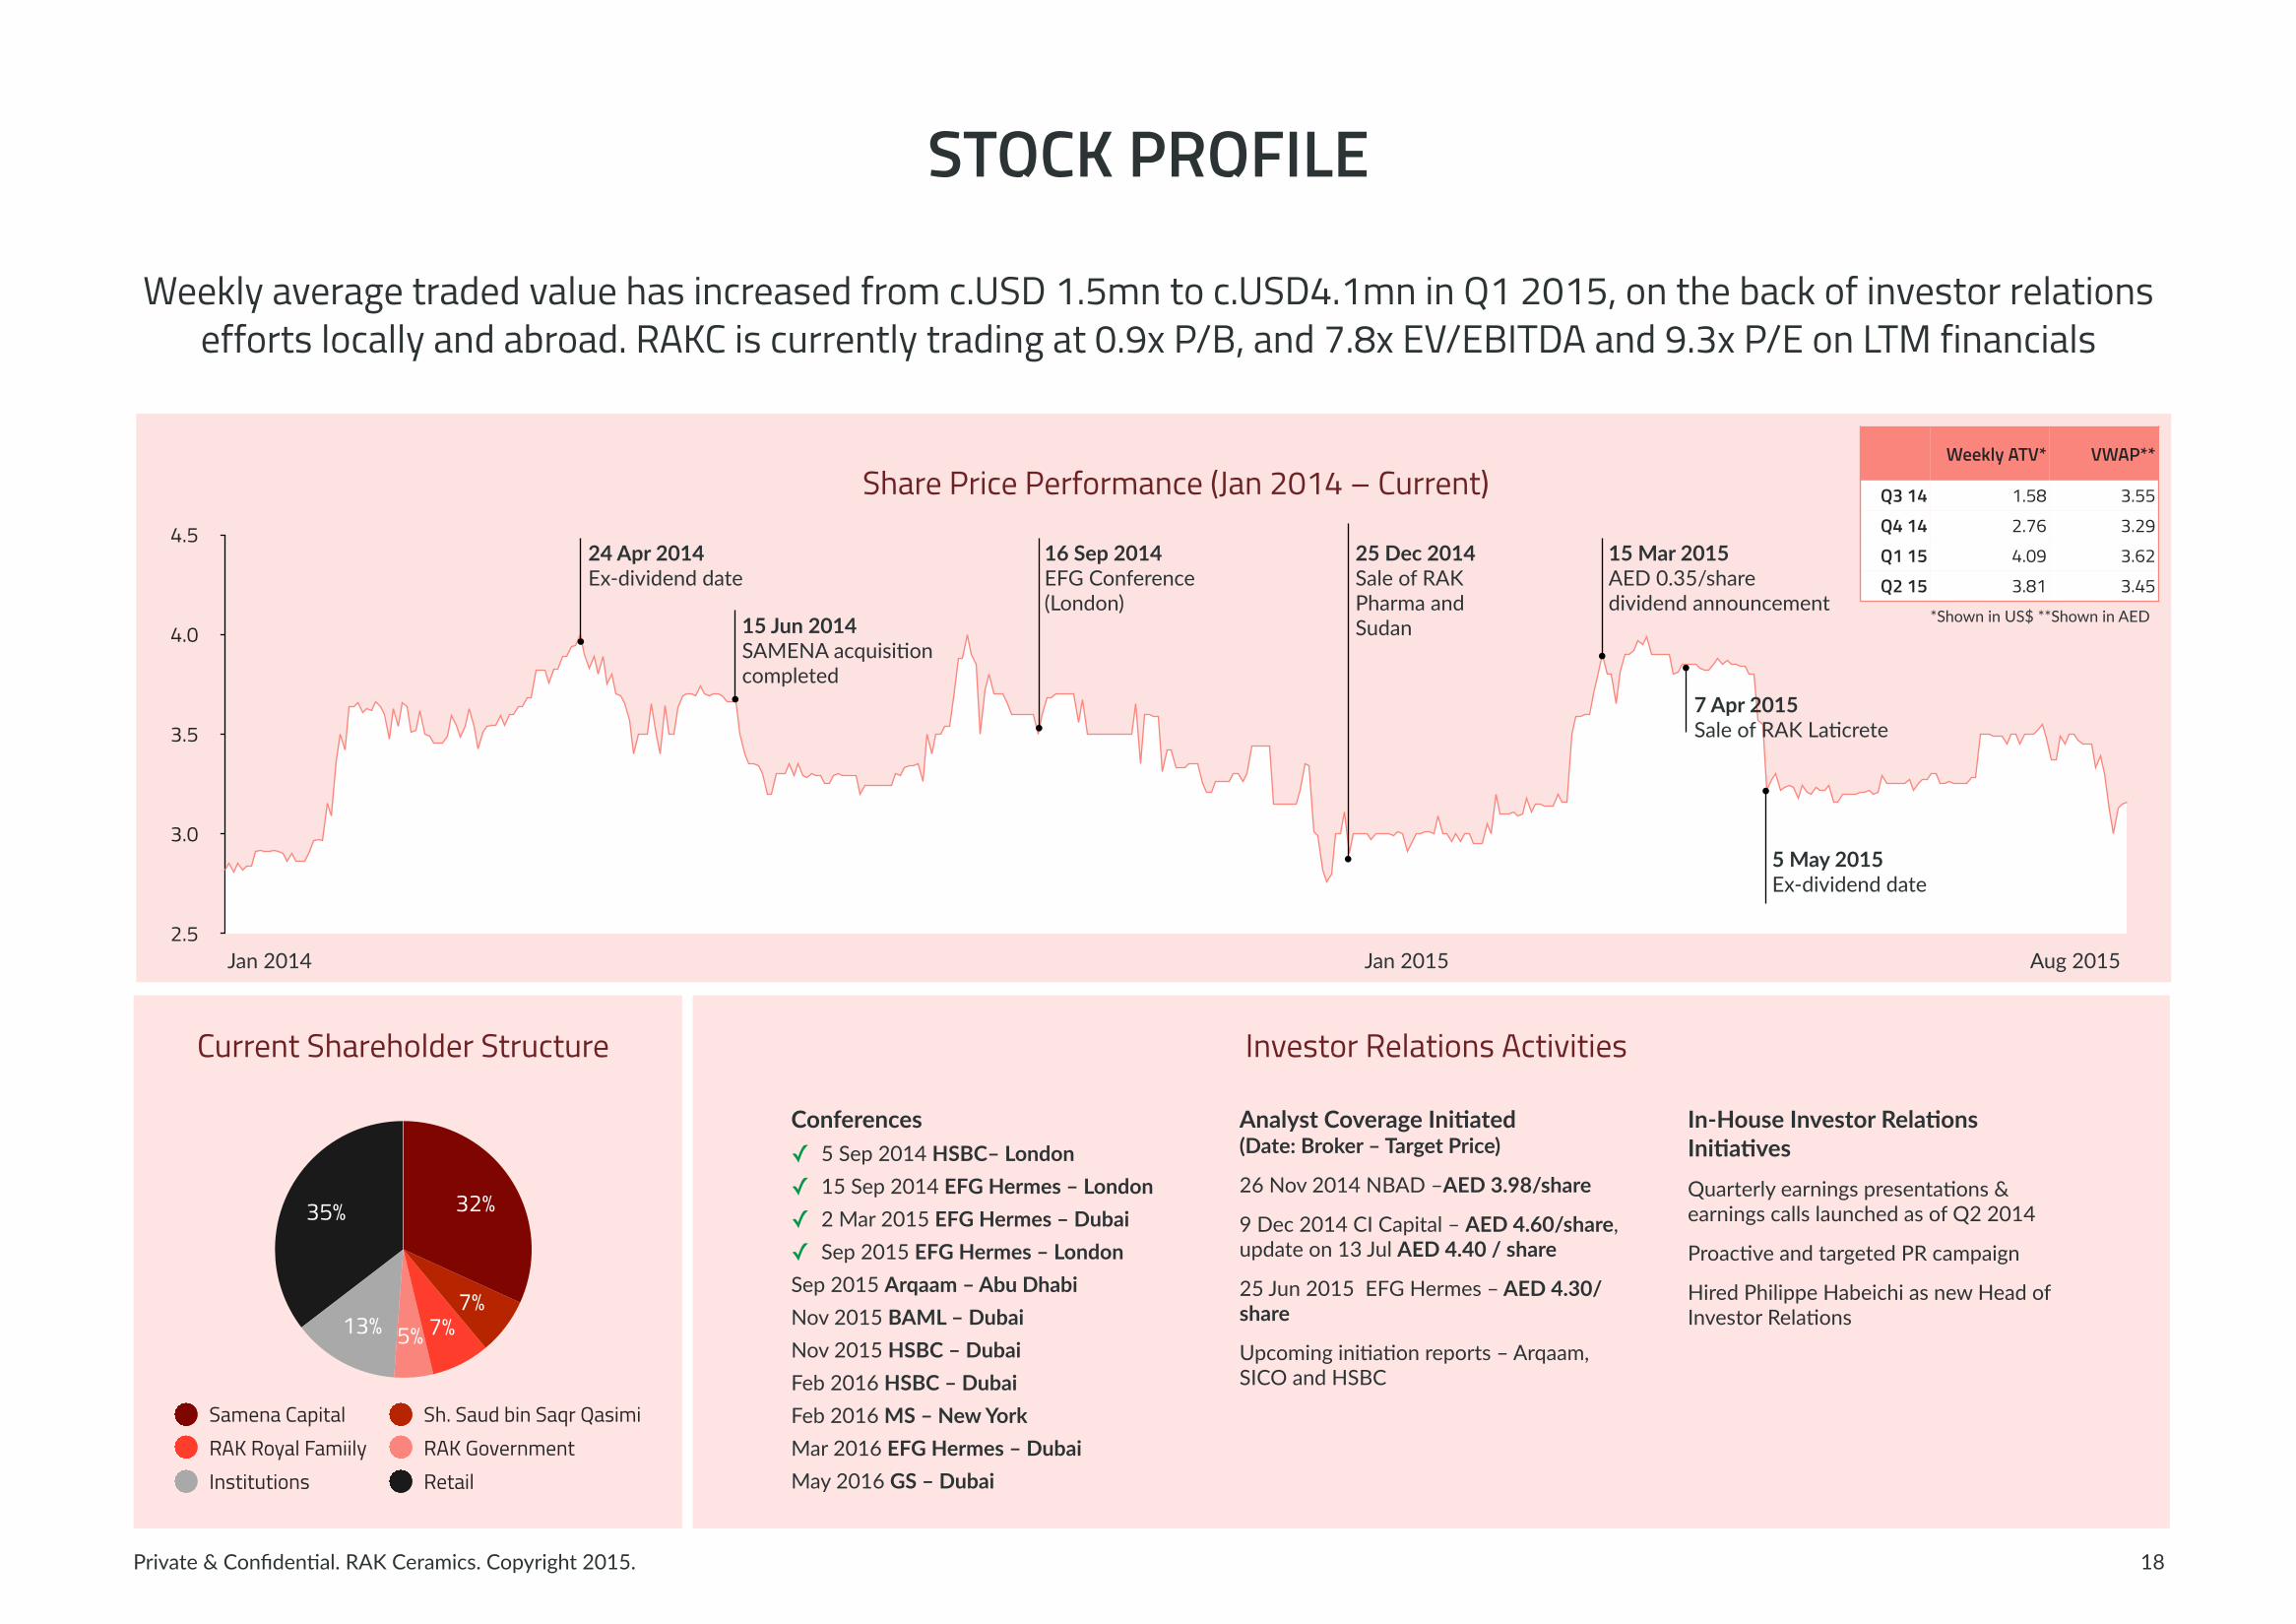
Private & Confiden4al. RAK Ceramics. Copyright 2015.
Share Price Performance (Jan 2014 – Current)
2.5
3.0
3.5
4.0
4.5
STOCK PROFILE
18
24 Apr 2014 Ex-‐dividend date
15 Jun 2014SAMENA acquisi4on completed
16 Sep 2014EFG Conference (London)
25 Dec 2014Sale of RAK Pharma and Sudan
15 Mar 2015AED 0.35/share dividend announcement
7 Apr 2015Sale of RAK La4crete
5 May 2015Ex-‐dividend date
Jan 2014 Aug 2015Jan 2015
Weekly ATV* VWAP**
Q3 14 1.58 3.55 Q4 14 2.76 3.29 Q1 15 4.09 3.62 Q2 15 3.81 3.45
*Shown in US$ **Shown in AED
35%
13% 5% 7%7%
32%
Samena Capital Sh. Saud bin Saqr QasimiRAK Royal Famiily RAK GovernmentInstitutions Retail
Current Shareholder Structure
Conferences ✓ 5 Sep 2014 HSBC– London ✓ 15 Sep 2014 EFG Hermes – London ✓ 2 Mar 2015 EFG Hermes – Dubai ✓ Sep 2015 EFG Hermes – London Sep 2015 Arqaam – Abu Dhabi Nov 2015 BAML – Dubai Nov 2015 HSBC – Dubai Feb 2016 HSBC – Dubai Feb 2016 MS – New York Mar 2016 EFG Hermes – Dubai May 2016 GS – Dubai
Analyst Coverage IniPated(Date: Broker – Target Price)
26 Nov 2014 NBAD –AED 3.98/share
9 Dec 2014 CI Capital – AED 4.60/share, update on 13 Jul AED 4.40 / share
25 Jun 2015 EFG Hermes – AED 4.30/share
Upcoming ini4a4on reports – Arqaam, SICO and HSBC
In-‐House Investor RelaPons IniPaPves Quarterly earnings presenta4ons & earnings calls launched as of Q2 2014
Proac4ve and targeted PR campaign
Hired Philippe Habeichi as new Head of Investor Rela4ons
Investor Relations Activities
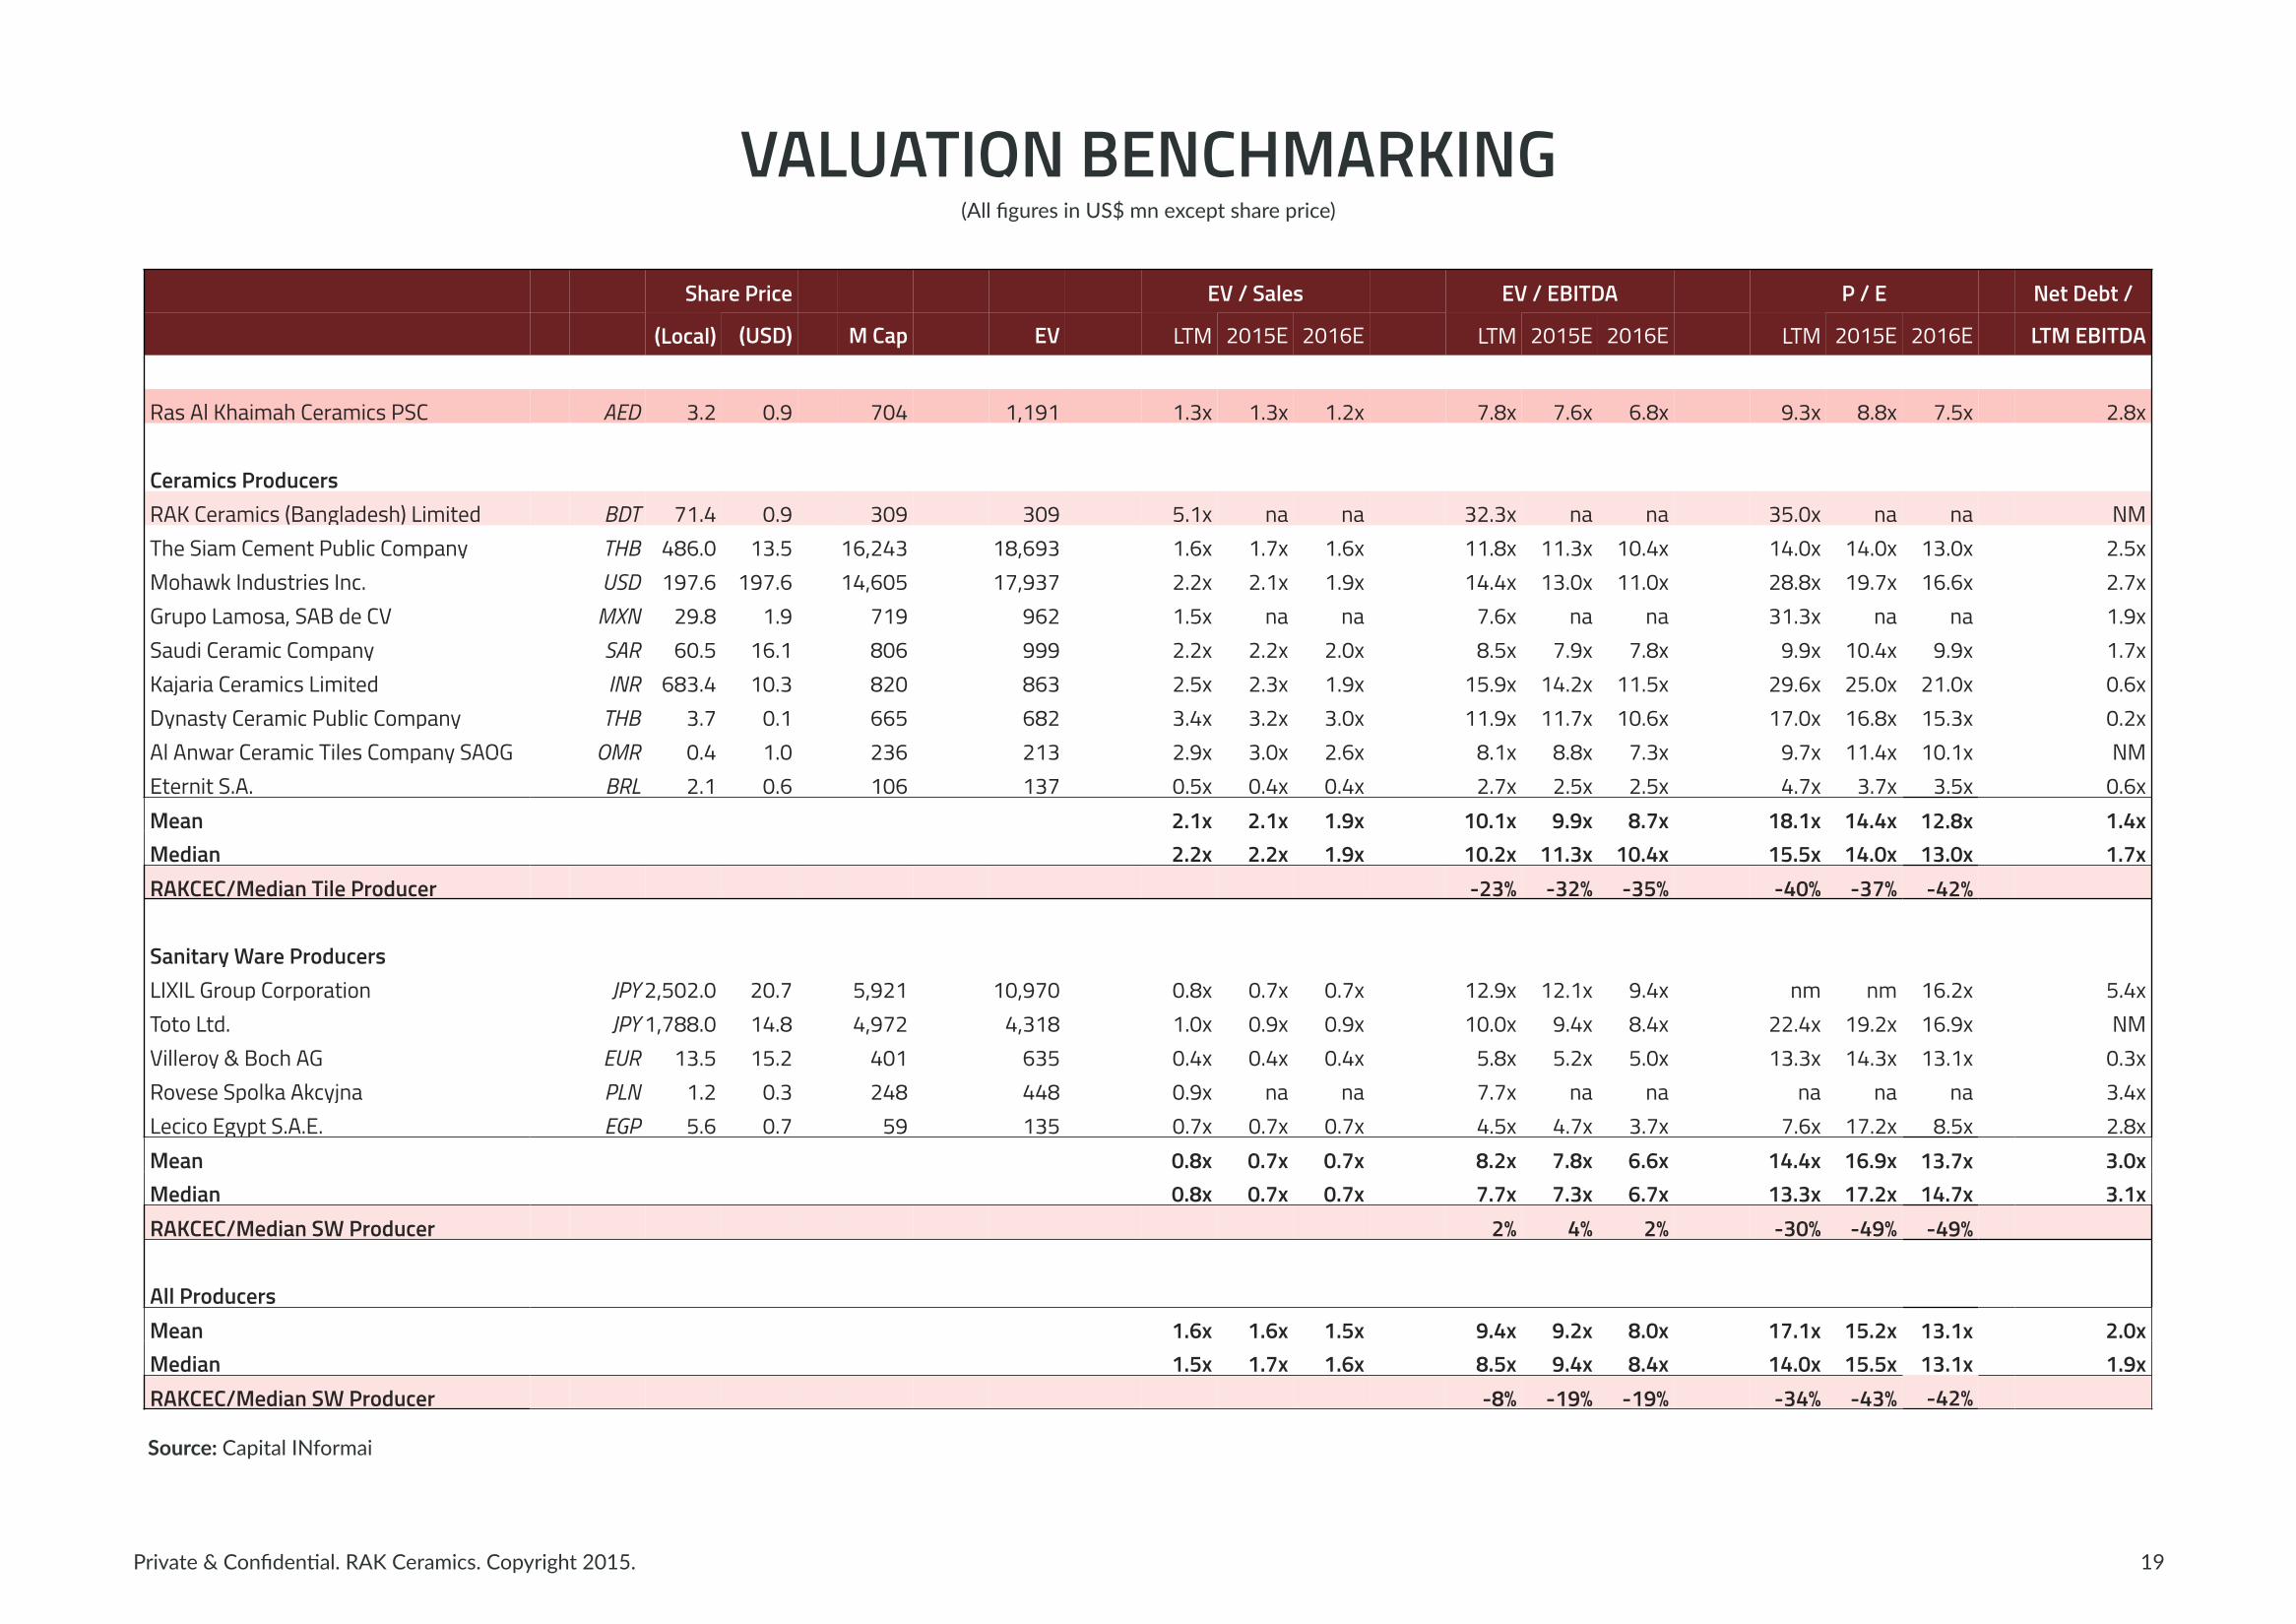
Weekly average traded value has increased from c.USD 1.5mn to c.USD4.1mn in Q1 2015, on the back of investor relations efforts locally and abroad. RAKC is currently trading at 0.9x P/B, and 7.8x EV/EBITDA and 9.3x P/E on LTM financials
Private & Confiden4al. RAK Ceramics. Copyright 2015.
VALUATION BENCHMARKING
19
Share Price EV / Sales EV / EBITDA P / E Net Debt /
(Local) (USD) M Cap EV LTM 2015E 2016E LTM 2015E 2016E LTM 2015E 2016E LTM EBITDA
Ras Al Khaimah Ceramics PSC AED 3.2 0.9 704 1,191 1.3x 1.3x 1.2x 7.8x 7.6x 6.8x 9.3x 8.8x 7.5x 2.8x
Ceramics ProducersRAK Ceramics (Bangladesh) Limited BDT 71.4 0.9 309 309 5.1x na na 32.3x na na 35.0x na na NMThe Siam Cement Public Company THB 486.0 13.5 16,243 18,693 1.6x 1.7x 1.6x 11.8x 11.3x 10.4x 14.0x 14.0x 13.0x 2.5x Mohawk Industries Inc. USD 197.6 197.6 14,605 17,937 2.2x 2.1x 1.9x 14.4x 13.0x 11.0x 28.8x 19.7x 16.6x 2.7x Grupo Lamosa, SAB de CV MXN 29.8 1.9 719 962 1.5x na na 7.6x na na 31.3x na na 1.9x Saudi Ceramic Company SAR 60.5 16.1 806 999 2.2x 2.2x 2.0x 8.5x 7.9x 7.8x 9.9x 10.4x 9.9x 1.7x Kajaria Ceramics Limited INR 683.4 10.3 820 863 2.5x 2.3x 1.9x 15.9x 14.2x 11.5x 29.6x 25.0x 21.0x 0.6x Dynasty Ceramic Public Company THB 3.7 0.1 665 682 3.4x 3.2x 3.0x 11.9x 11.7x 10.6x 17.0x 16.8x 15.3x 0.2x Al Anwar Ceramic Tiles Company SAOG OMR 0.4 1.0 236 213 2.9x 3.0x 2.6x 8.1x 8.8x 7.3x 9.7x 11.4x 10.1x NMEternit S.A. BRL 2.1 0.6 106 137 0.5x 0.4x 0.4x 2.7x 2.5x 2.5x 4.7x 3.7x 3.5x 0.6x Mean 2.1x 2.1x 1.9x 10.1x 9.9x 8.7x 18.1x 14.4x 12.8x 1.4x Median 2.2x 2.2x 1.9x 10.2x 11.3x 10.4x 15.5x 14.0x 13.0x 1.7x RAKCEC/Median Tile Producer -23% -32% -35% -40% -37% -42%
Sanitary Ware ProducersLIXIL Group Corporation JPY 2,502.0 20.7 5,921 10,970 0.8x 0.7x 0.7x 12.9x 12.1x 9.4x nm nm 16.2x 5.4x Toto Ltd. JPY 1,788.0 14.8 4,972 4,318 1.0x 0.9x 0.9x 10.0x 9.4x 8.4x 22.4x 19.2x 16.9x NMVilleroy & Boch AG EUR 13.5 15.2 401 635 0.4x 0.4x 0.4x 5.8x 5.2x 5.0x 13.3x 14.3x 13.1x 0.3x Rovese Spolka Akcyjna PLN 1.2 0.3 248 448 0.9x na na 7.7x na na na na na 3.4x Lecico Egypt S.A.E. EGP 5.6 0.7 59 135 0.7x 0.7x 0.7x 4.5x 4.7x 3.7x 7.6x 17.2x 8.5x 2.8x Mean 0.8x 0.7x 0.7x 8.2x 7.8x 6.6x 14.4x 16.9x 13.7x 3.0x Median 0.8x 0.7x 0.7x 7.7x 7.3x 6.7x 13.3x 17.2x 14.7x 3.1x RAKCEC/Median SW Producer 2% 4% 2% -30% -49% -49%
All ProducersMean 1.6x 1.6x 1.5x 9.4x 9.2x 8.0x 17.1x 15.2x 13.1x 2.0x Median 1.5x 1.7x 1.6x 8.5x 9.4x 8.4x 14.0x 15.5x 13.1x 1.9x RAKCEC/Median SW Producer -8% -19% -19% -34% -43% -42%
(All figures in US$ mn except share price)
Source: Capital INformai
Private & Confiden4al. RAK Ceramics. Copyright 2015.
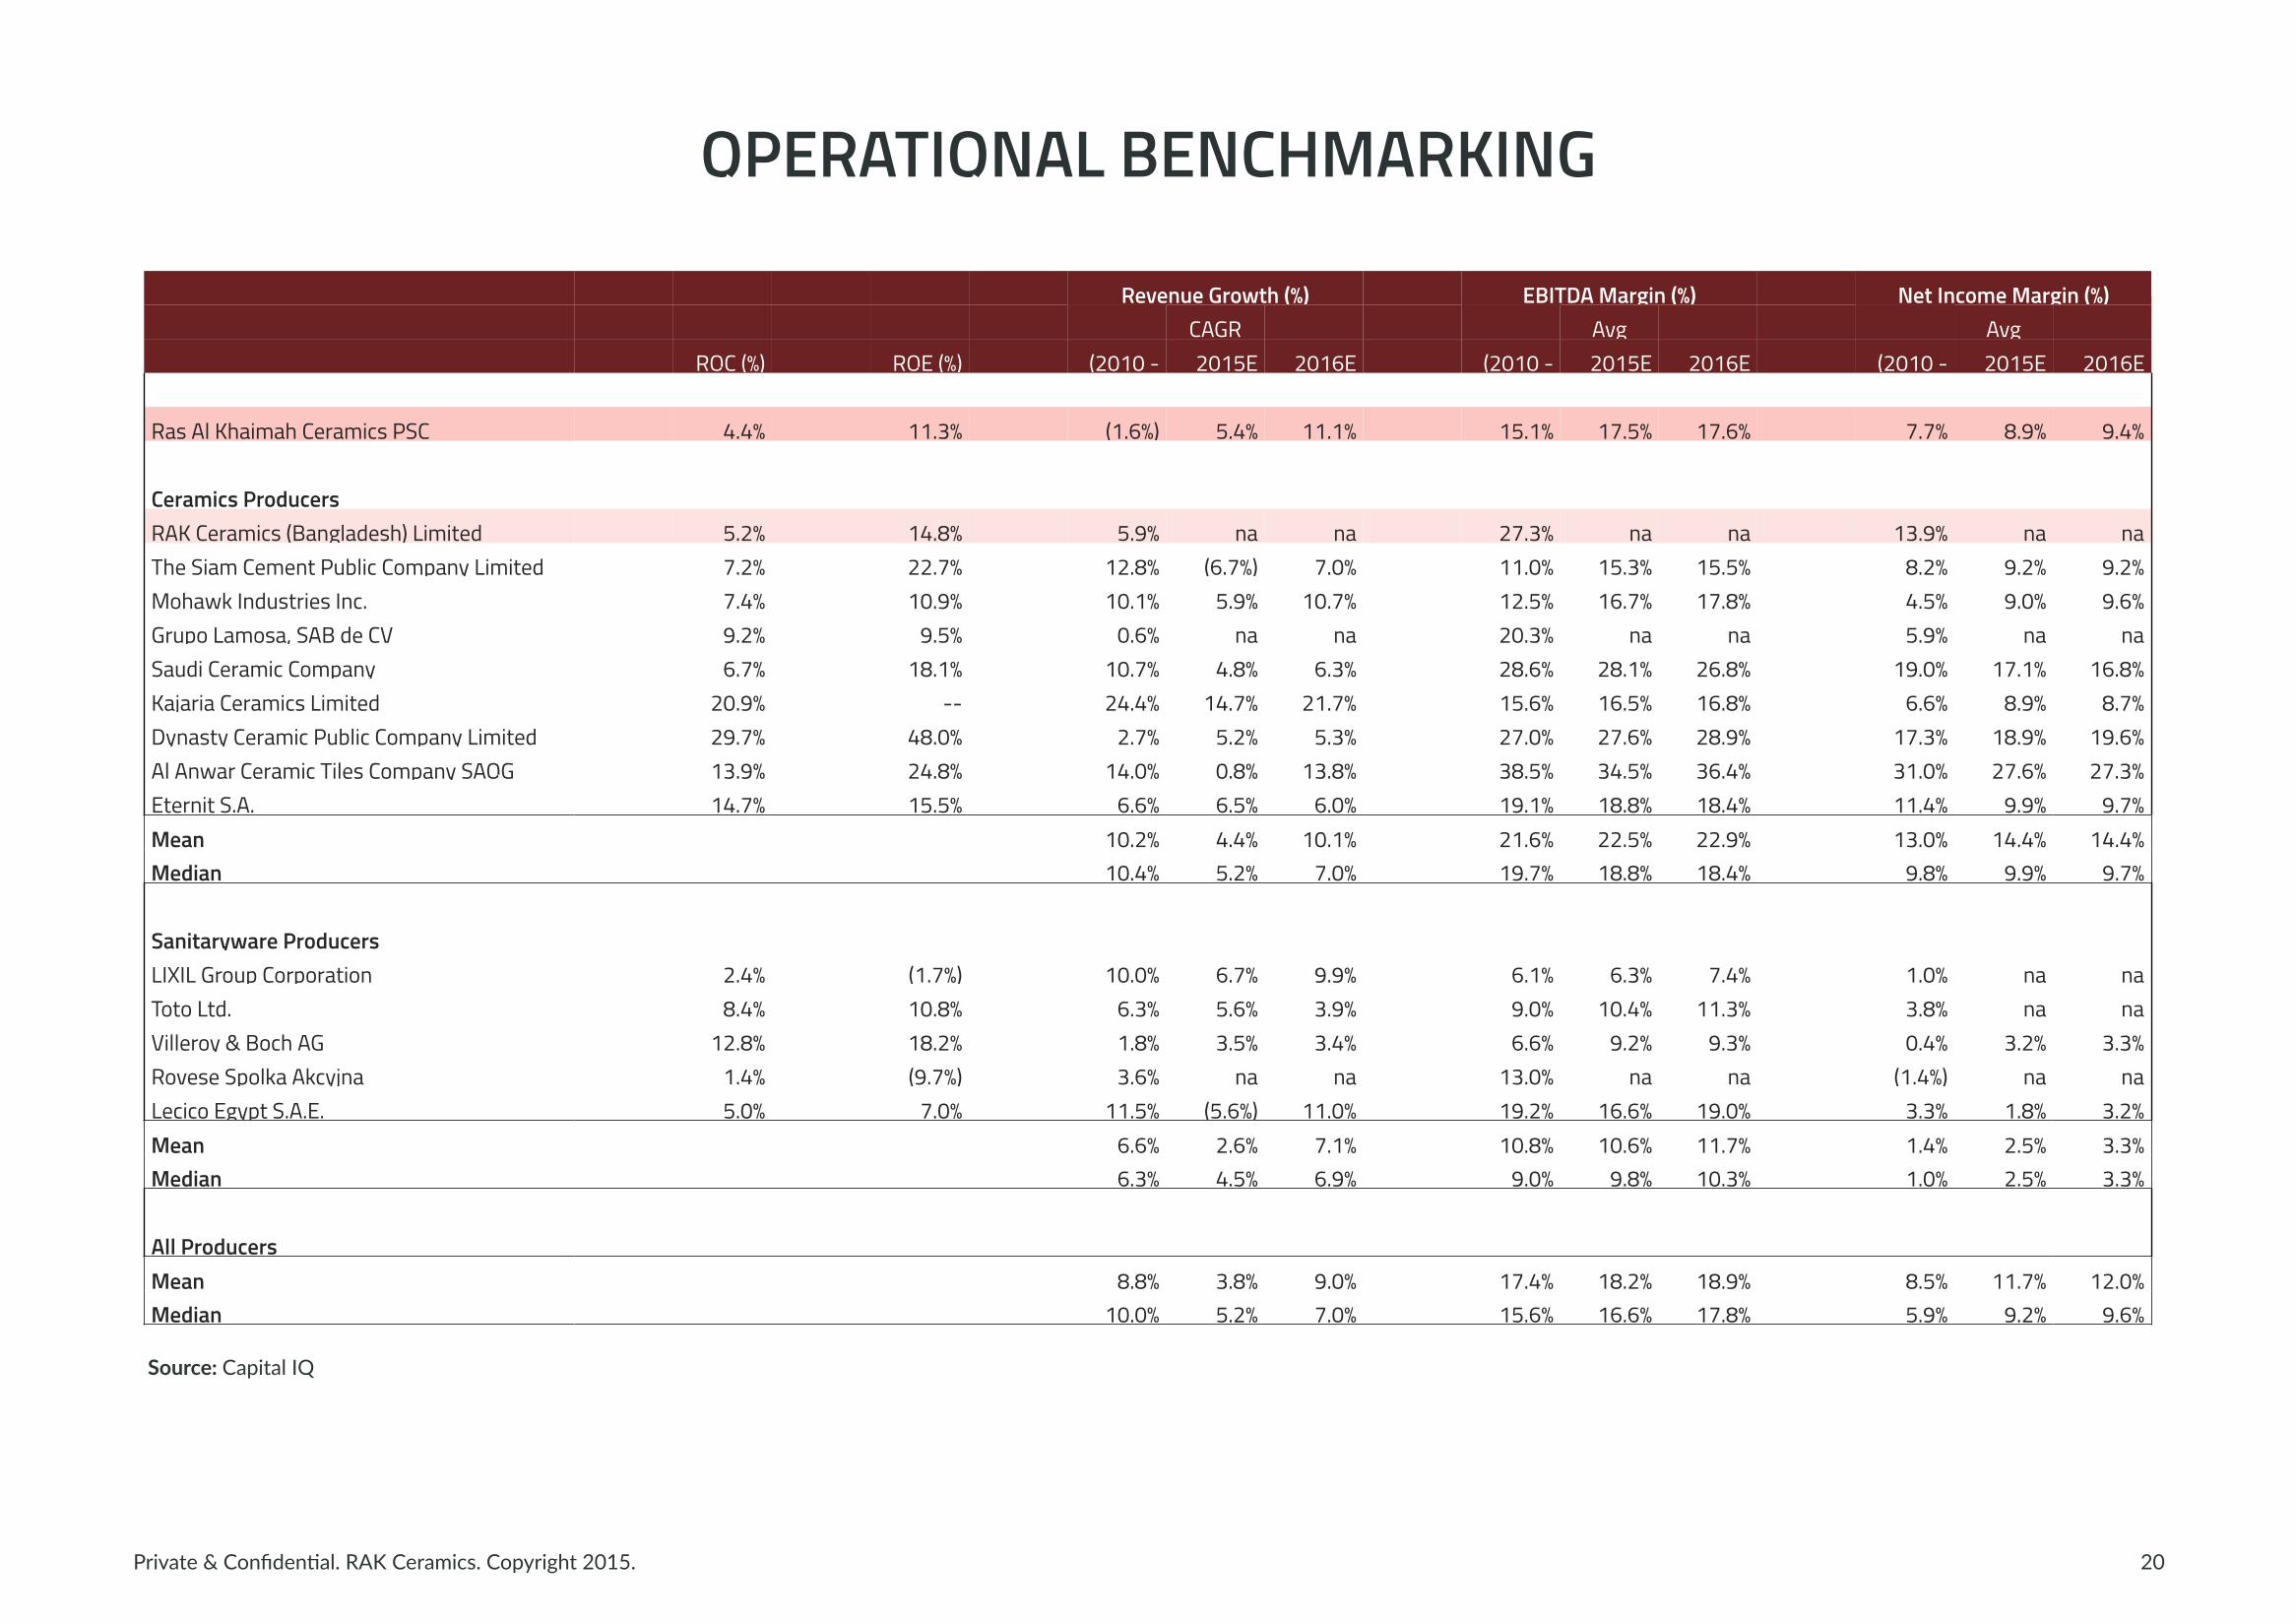
OPERATIONAL BENCHMARKING
20
Revenue Growth (%) EBITDA Margin (%) Net Income Margin (%)CAGR Avg Avg
ROC (%) ROE (%) (2010 - 2015E 2016E (2010 - 2015E 2016E (2010 - 2015E 2016E
Ras Al Khaimah Ceramics PSC 4.4% 11.3% (1.6%) 5.4% 11.1% 15.1% 17.5% 17.6% 7.7% 8.9% 9.4%
Ceramics ProducersRAK Ceramics (Bangladesh) Limited 5.2% 14.8% 5.9% na na 27.3% na na 13.9% na naThe Siam Cement Public Company Limited 7.2% 22.7% 12.8% (6.7%) 7.0% 11.0% 15.3% 15.5% 8.2% 9.2% 9.2%Mohawk Industries Inc. 7.4% 10.9% 10.1% 5.9% 10.7% 12.5% 16.7% 17.8% 4.5% 9.0% 9.6%Grupo Lamosa, SAB de CV 9.2% 9.5% 0.6% na na 20.3% na na 5.9% na naSaudi Ceramic Company 6.7% 18.1% 10.7% 4.8% 6.3% 28.6% 28.1% 26.8% 19.0% 17.1% 16.8%Kajaria Ceramics Limited 20.9% -- 24.4% 14.7% 21.7% 15.6% 16.5% 16.8% 6.6% 8.9% 8.7%Dynasty Ceramic Public Company Limited 29.7% 48.0% 2.7% 5.2% 5.3% 27.0% 27.6% 28.9% 17.3% 18.9% 19.6%Al Anwar Ceramic Tiles Company SAOG 13.9% 24.8% 14.0% 0.8% 13.8% 38.5% 34.5% 36.4% 31.0% 27.6% 27.3%Eternit S.A. 14.7% 15.5% 6.6% 6.5% 6.0% 19.1% 18.8% 18.4% 11.4% 9.9% 9.7%Mean 10.2% 4.4% 10.1% 21.6% 22.5% 22.9% 13.0% 14.4% 14.4%Median 10.4% 5.2% 7.0% 19.7% 18.8% 18.4% 9.8% 9.9% 9.7%
Sanitaryware ProducersLIXIL Group Corporation 2.4% (1.7%) 10.0% 6.7% 9.9% 6.1% 6.3% 7.4% 1.0% na naToto Ltd. 8.4% 10.8% 6.3% 5.6% 3.9% 9.0% 10.4% 11.3% 3.8% na naVilleroy & Boch AG 12.8% 18.2% 1.8% 3.5% 3.4% 6.6% 9.2% 9.3% 0.4% 3.2% 3.3%Rovese Spolka Akcyjna 1.4% (9.7%) 3.6% na na 13.0% na na (1.4%) na naLecico Egypt S.A.E. 5.0% 7.0% 11.5% (5.6%) 11.0% 19.2% 16.6% 19.0% 3.3% 1.8% 3.2%Mean 6.6% 2.6% 7.1% 10.8% 10.6% 11.7% 1.4% 2.5% 3.3%Median 6.3% 4.5% 6.9% 9.0% 9.8% 10.3% 1.0% 2.5% 3.3%
All ProducersMean 8.8% 3.8% 9.0% 17.4% 18.2% 18.9% 8.5% 11.7% 12.0%Median 10.0% 5.2% 7.0% 15.6% 16.6% 17.8% 5.9% 9.2% 9.6%
Source: Capital IQ
Private & Confiden4al. RAK Ceramics. Copyright 2015.
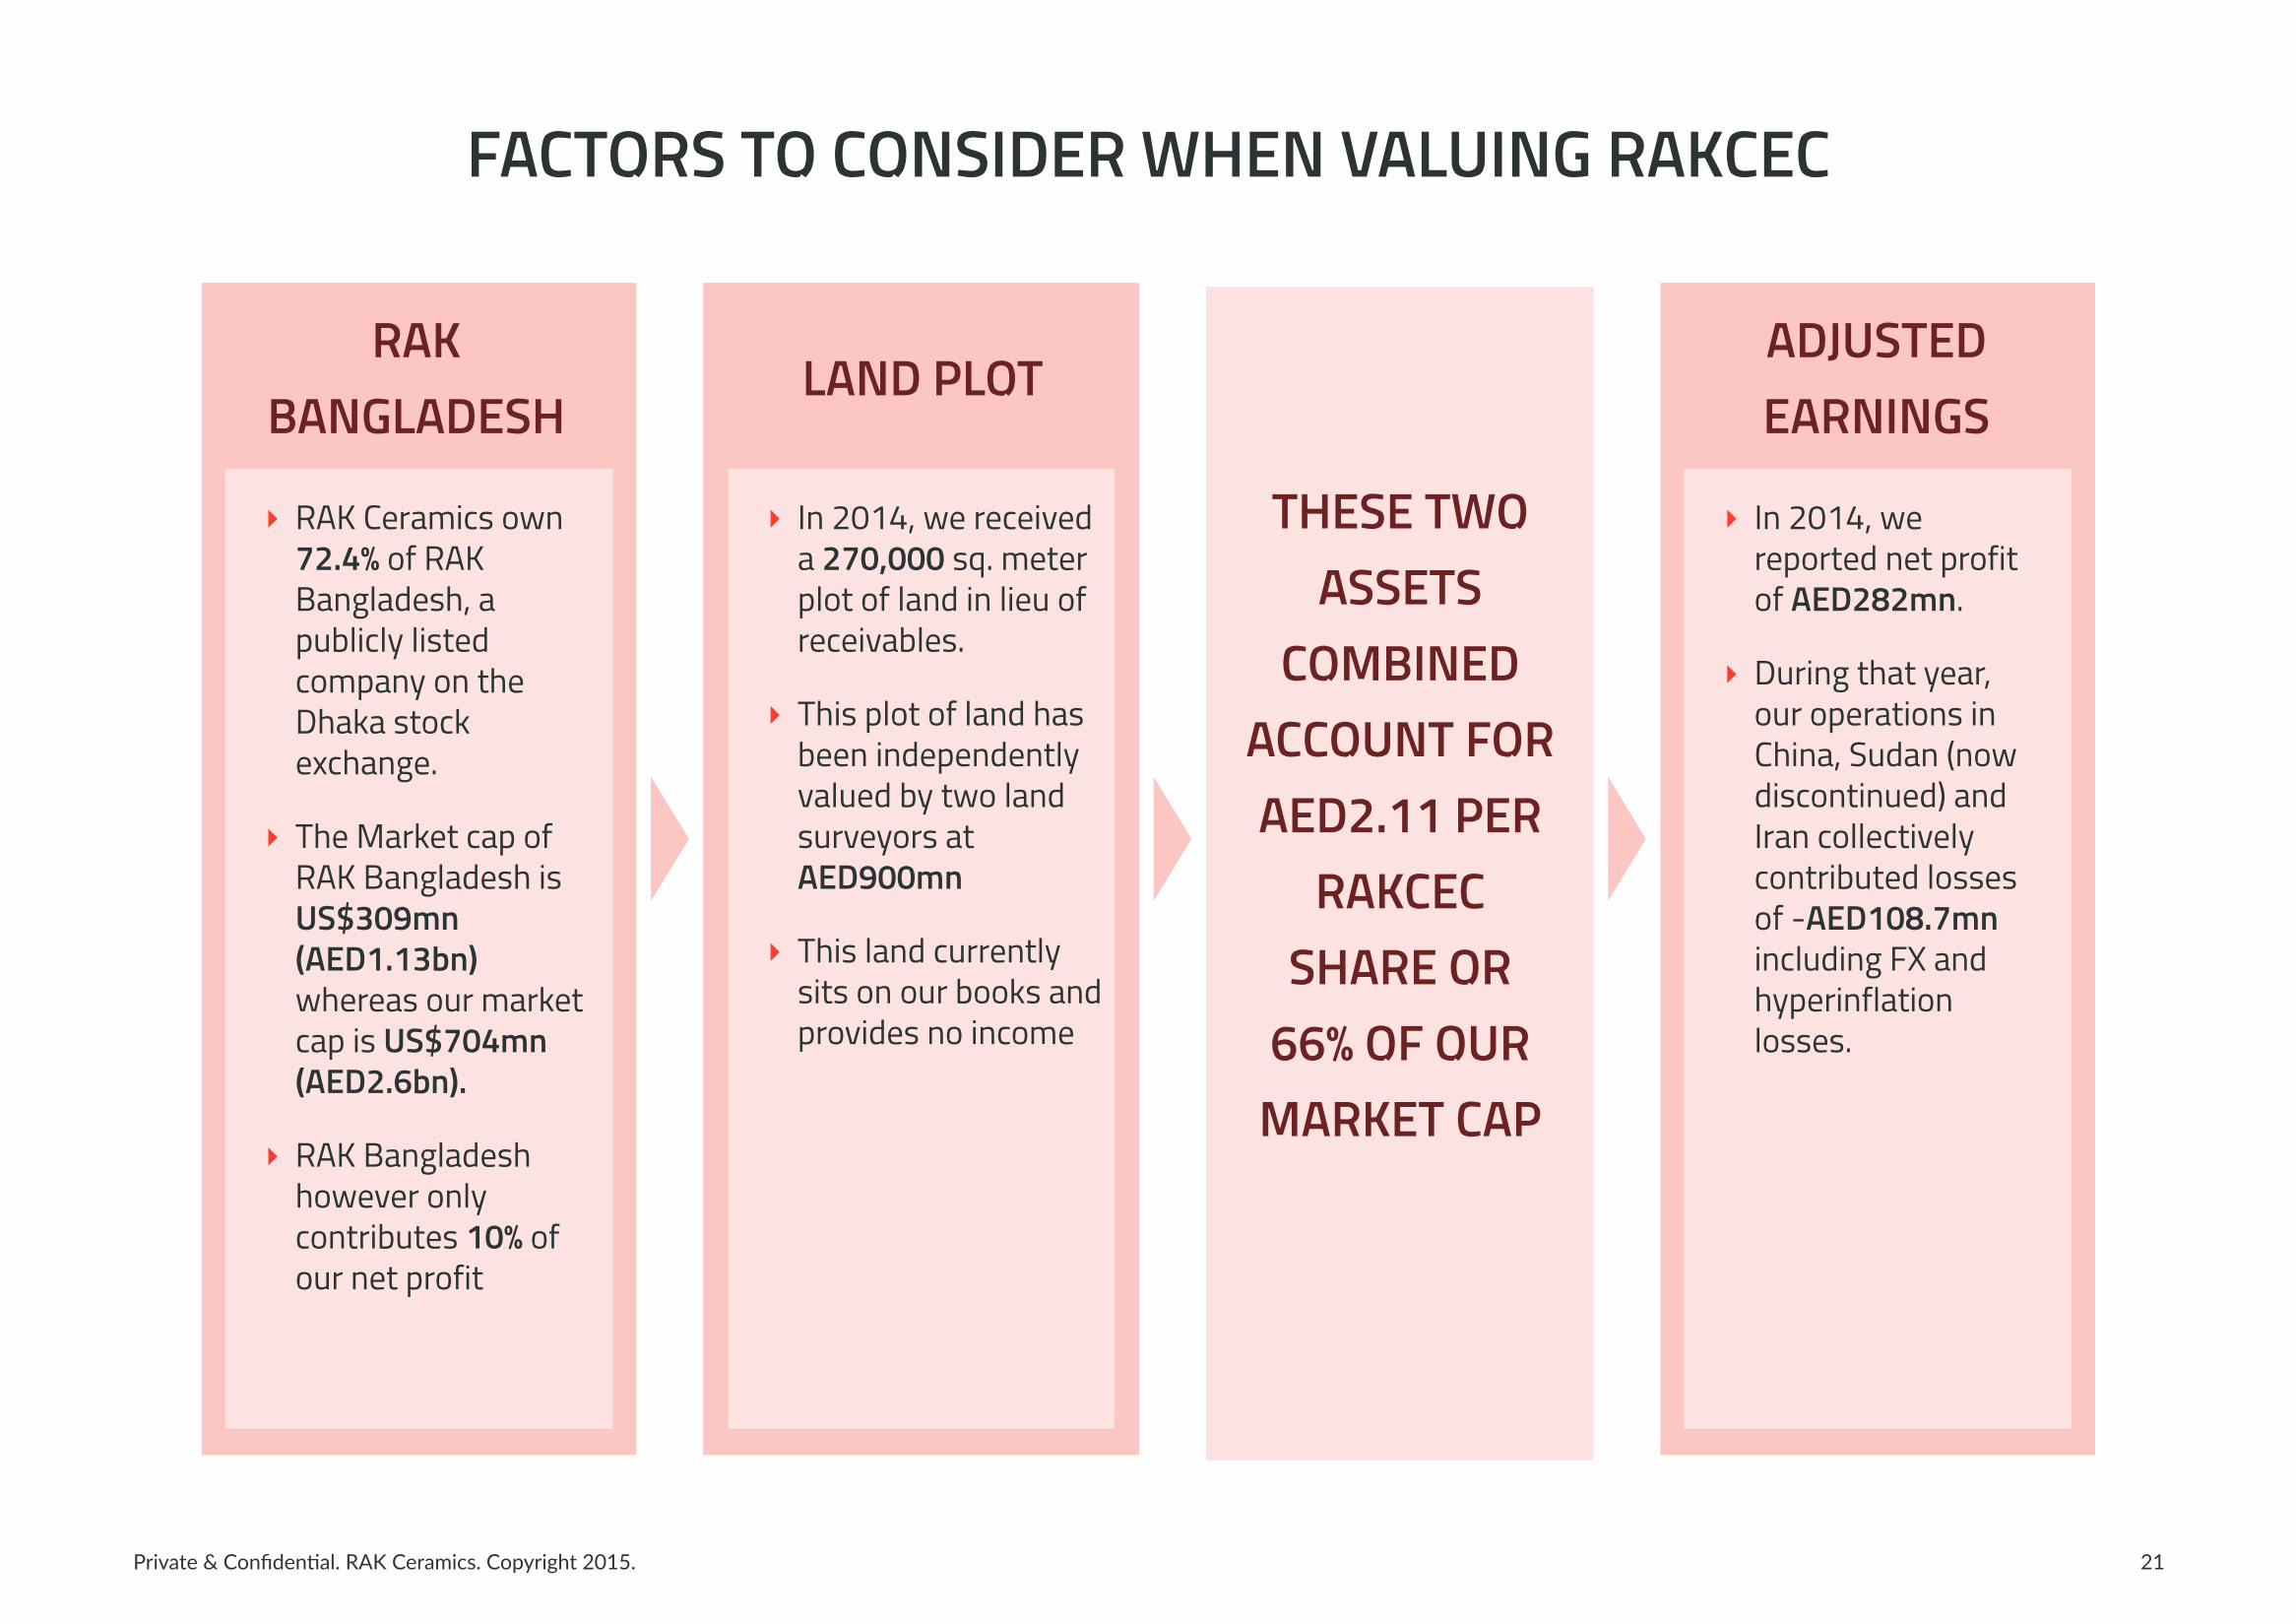
FACTORS TO CONSIDER WHEN VALUING RAKCEC
21
‣ RAK Ceramics own 72.4% of RAK Bangladesh, a publicly listed company on the Dhaka stock exchange.
‣ The Market cap of RAK Bangladesh is US$309mn (AED1.13bn) whereas our market cap is US$704mn (AED2.6bn).
‣ RAK Bangladesh however only contributes 10% of our net profit
RAK BANGLADESH
‣ In 2014, we received a 270,000 sq. meter plot of land in lieu of receivables.
‣ This plot of land has been independently valued by two land surveyors at AED900mn
‣ This land currently sits on our books and provides no income
‣ In 2014, we reported net profit of AED282mn.
‣ During that year, our operations in China, Sudan (now discontinued) and Iran collectively contributed losses of -AED108.7mn including FX and hyperinflation losses.
THESE TWO ASSETS
COMBINED ACCOUNT FOR AED2.11 PER
RAKCEC SHARE OR
66% OF OUR MARKET CAP
LAND PLOTADJUSTED EARNINGS

APPENDIX
Private & Confiden4al. RAK Ceramics. Copyright 2015.
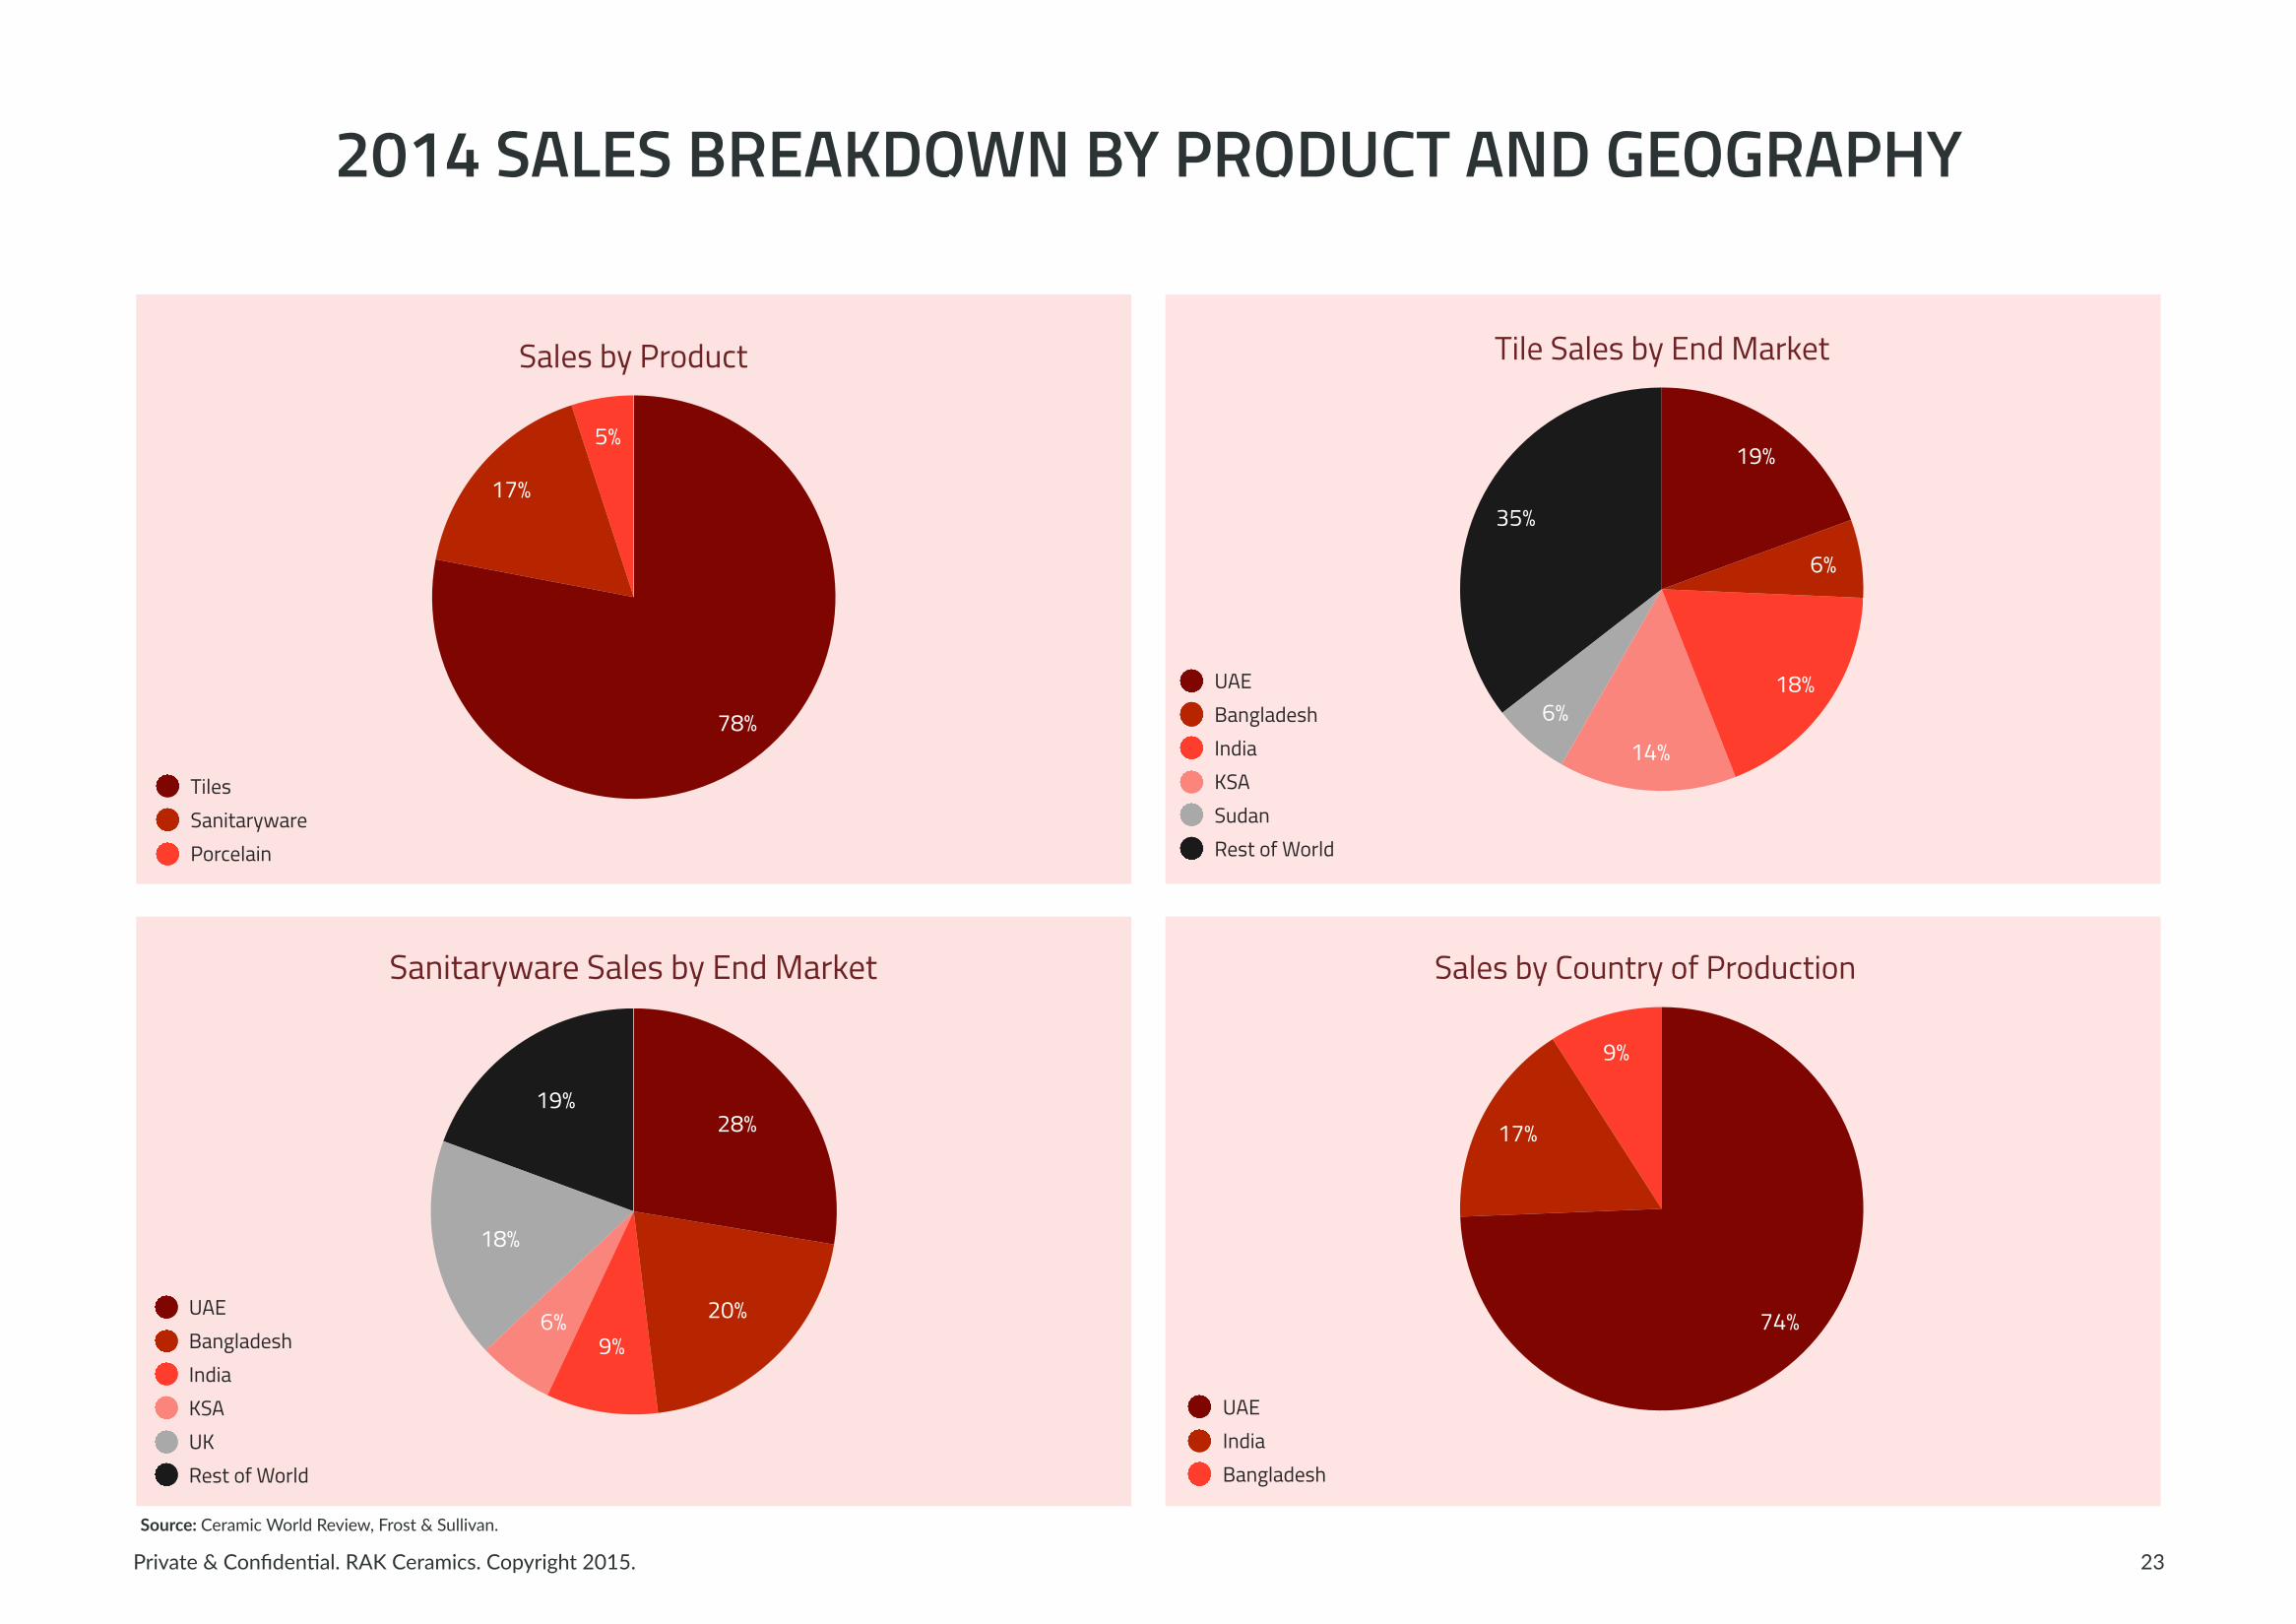
2014 SALES BREAKDOWN BY PRODUCT AND GEOGRAPHY
23
Sales by Product
5%
17%
78%
TilesSanitarywarePorcelain
Tile Sales by End Market
35%
6%14%
18%
6%
19%
UAEBangladeshIndiaKSASudanRest of World
9%
17%
74%
UAEIndiaBangladesh
19%
18%
6%9%
20%
28%
UAEBangladeshIndiaKSAUKRest of World
Sanitaryware Sales by End Market Sales by Country of Production
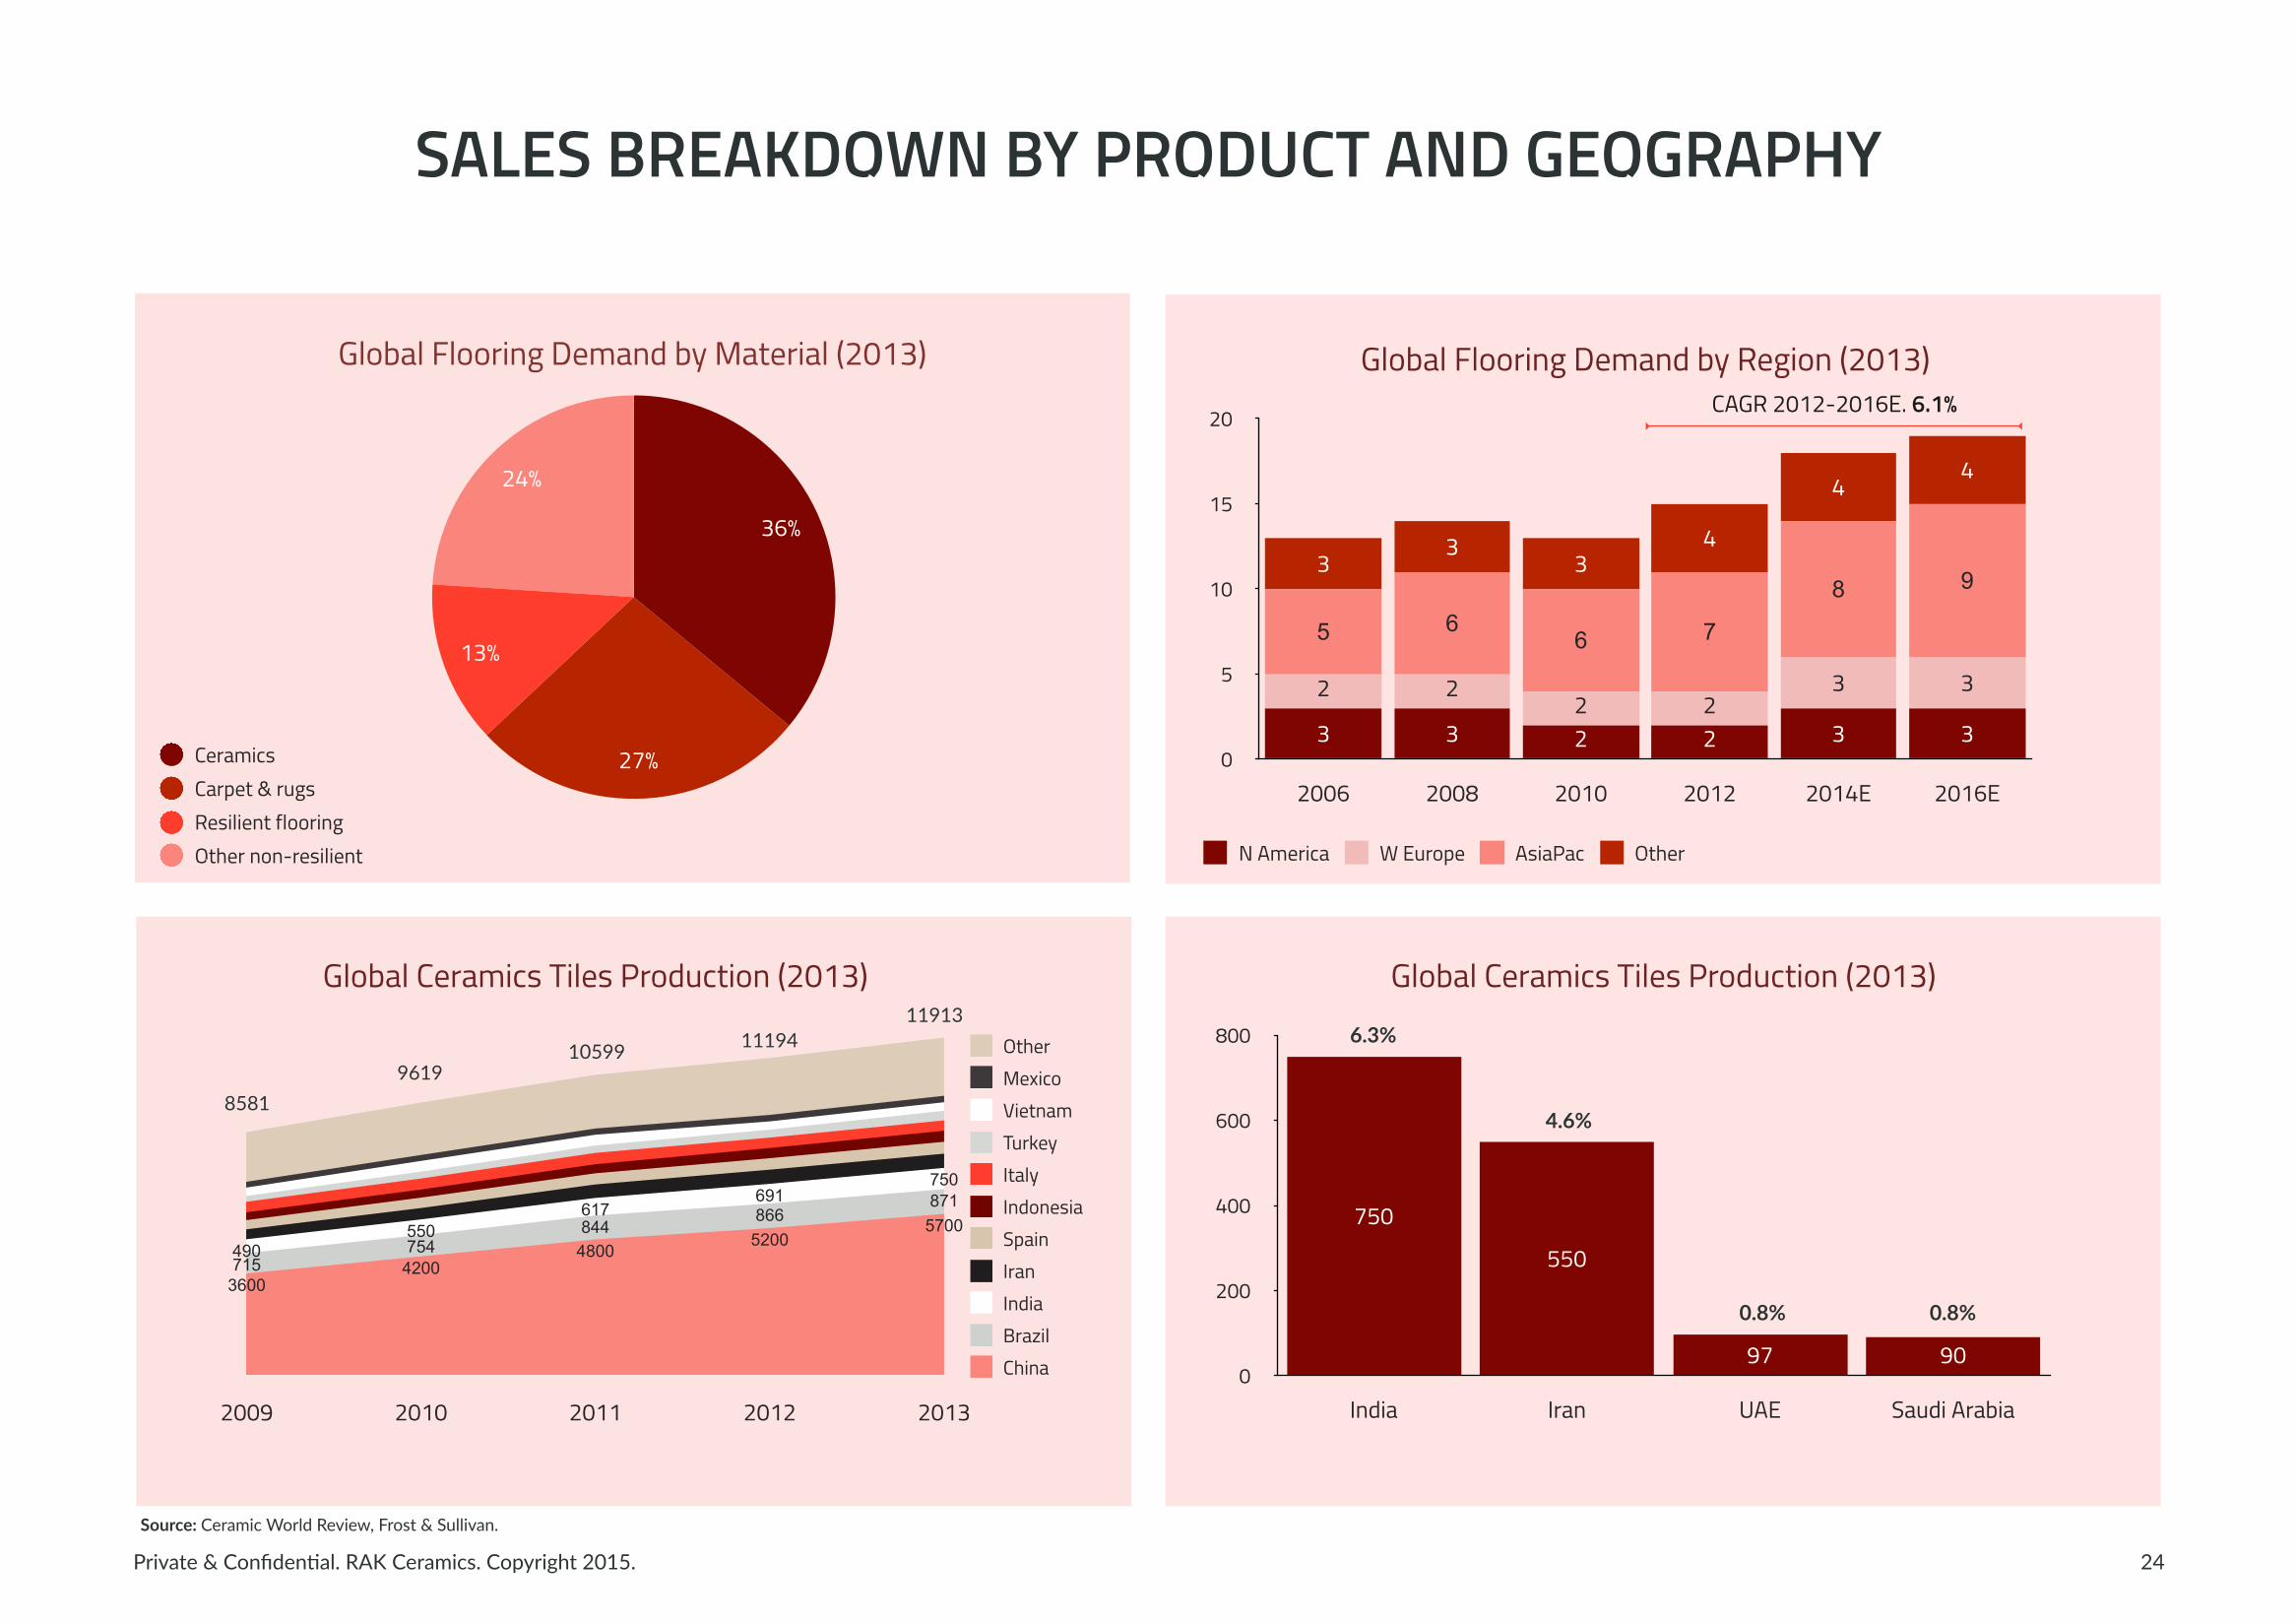
Source: Ceramic World Review, Frost & Sullivan.
Private & Confiden4al. RAK Ceramics. Copyright 2015.
SALES BREAKDOWN BY PRODUCT AND GEOGRAPHY
24
Global Ceramics Tiles Production (2013)
2009 2010 2011 2012 2013
490550
617691
750
715754
844866
871
36004200
48005200
5700
ChinaBrazilIndiaIranSpainIndonesiaItalyTurkeyVietnamMexicoOther
85819619
10599 1119411913
Source: Ceramic World Review, Frost & Sullivan.
24%
13%
27%
36%
CeramicsCarpet & rugsResilient flooringOther non-resilient
Global Flooring Demand by Material (2013) Global Flooring Demand by Region (2013)
0
5
10
15
20
2006 2008 2010 2012 2014E 2016E
44
43
33
98
7665
3322
22
332233
N America W Europe AsiaPac Other
CAGR 2012-2016E. 6.1%
Global Ceramics Tiles Production (2013)
0
200
400
600
800
India Iran UAE Saudi Arabia
9097
550
750
6.3%
4.6%
0.8% 0.8%
Private & Confiden4al. RAK Ceramics. Copyright 2015.
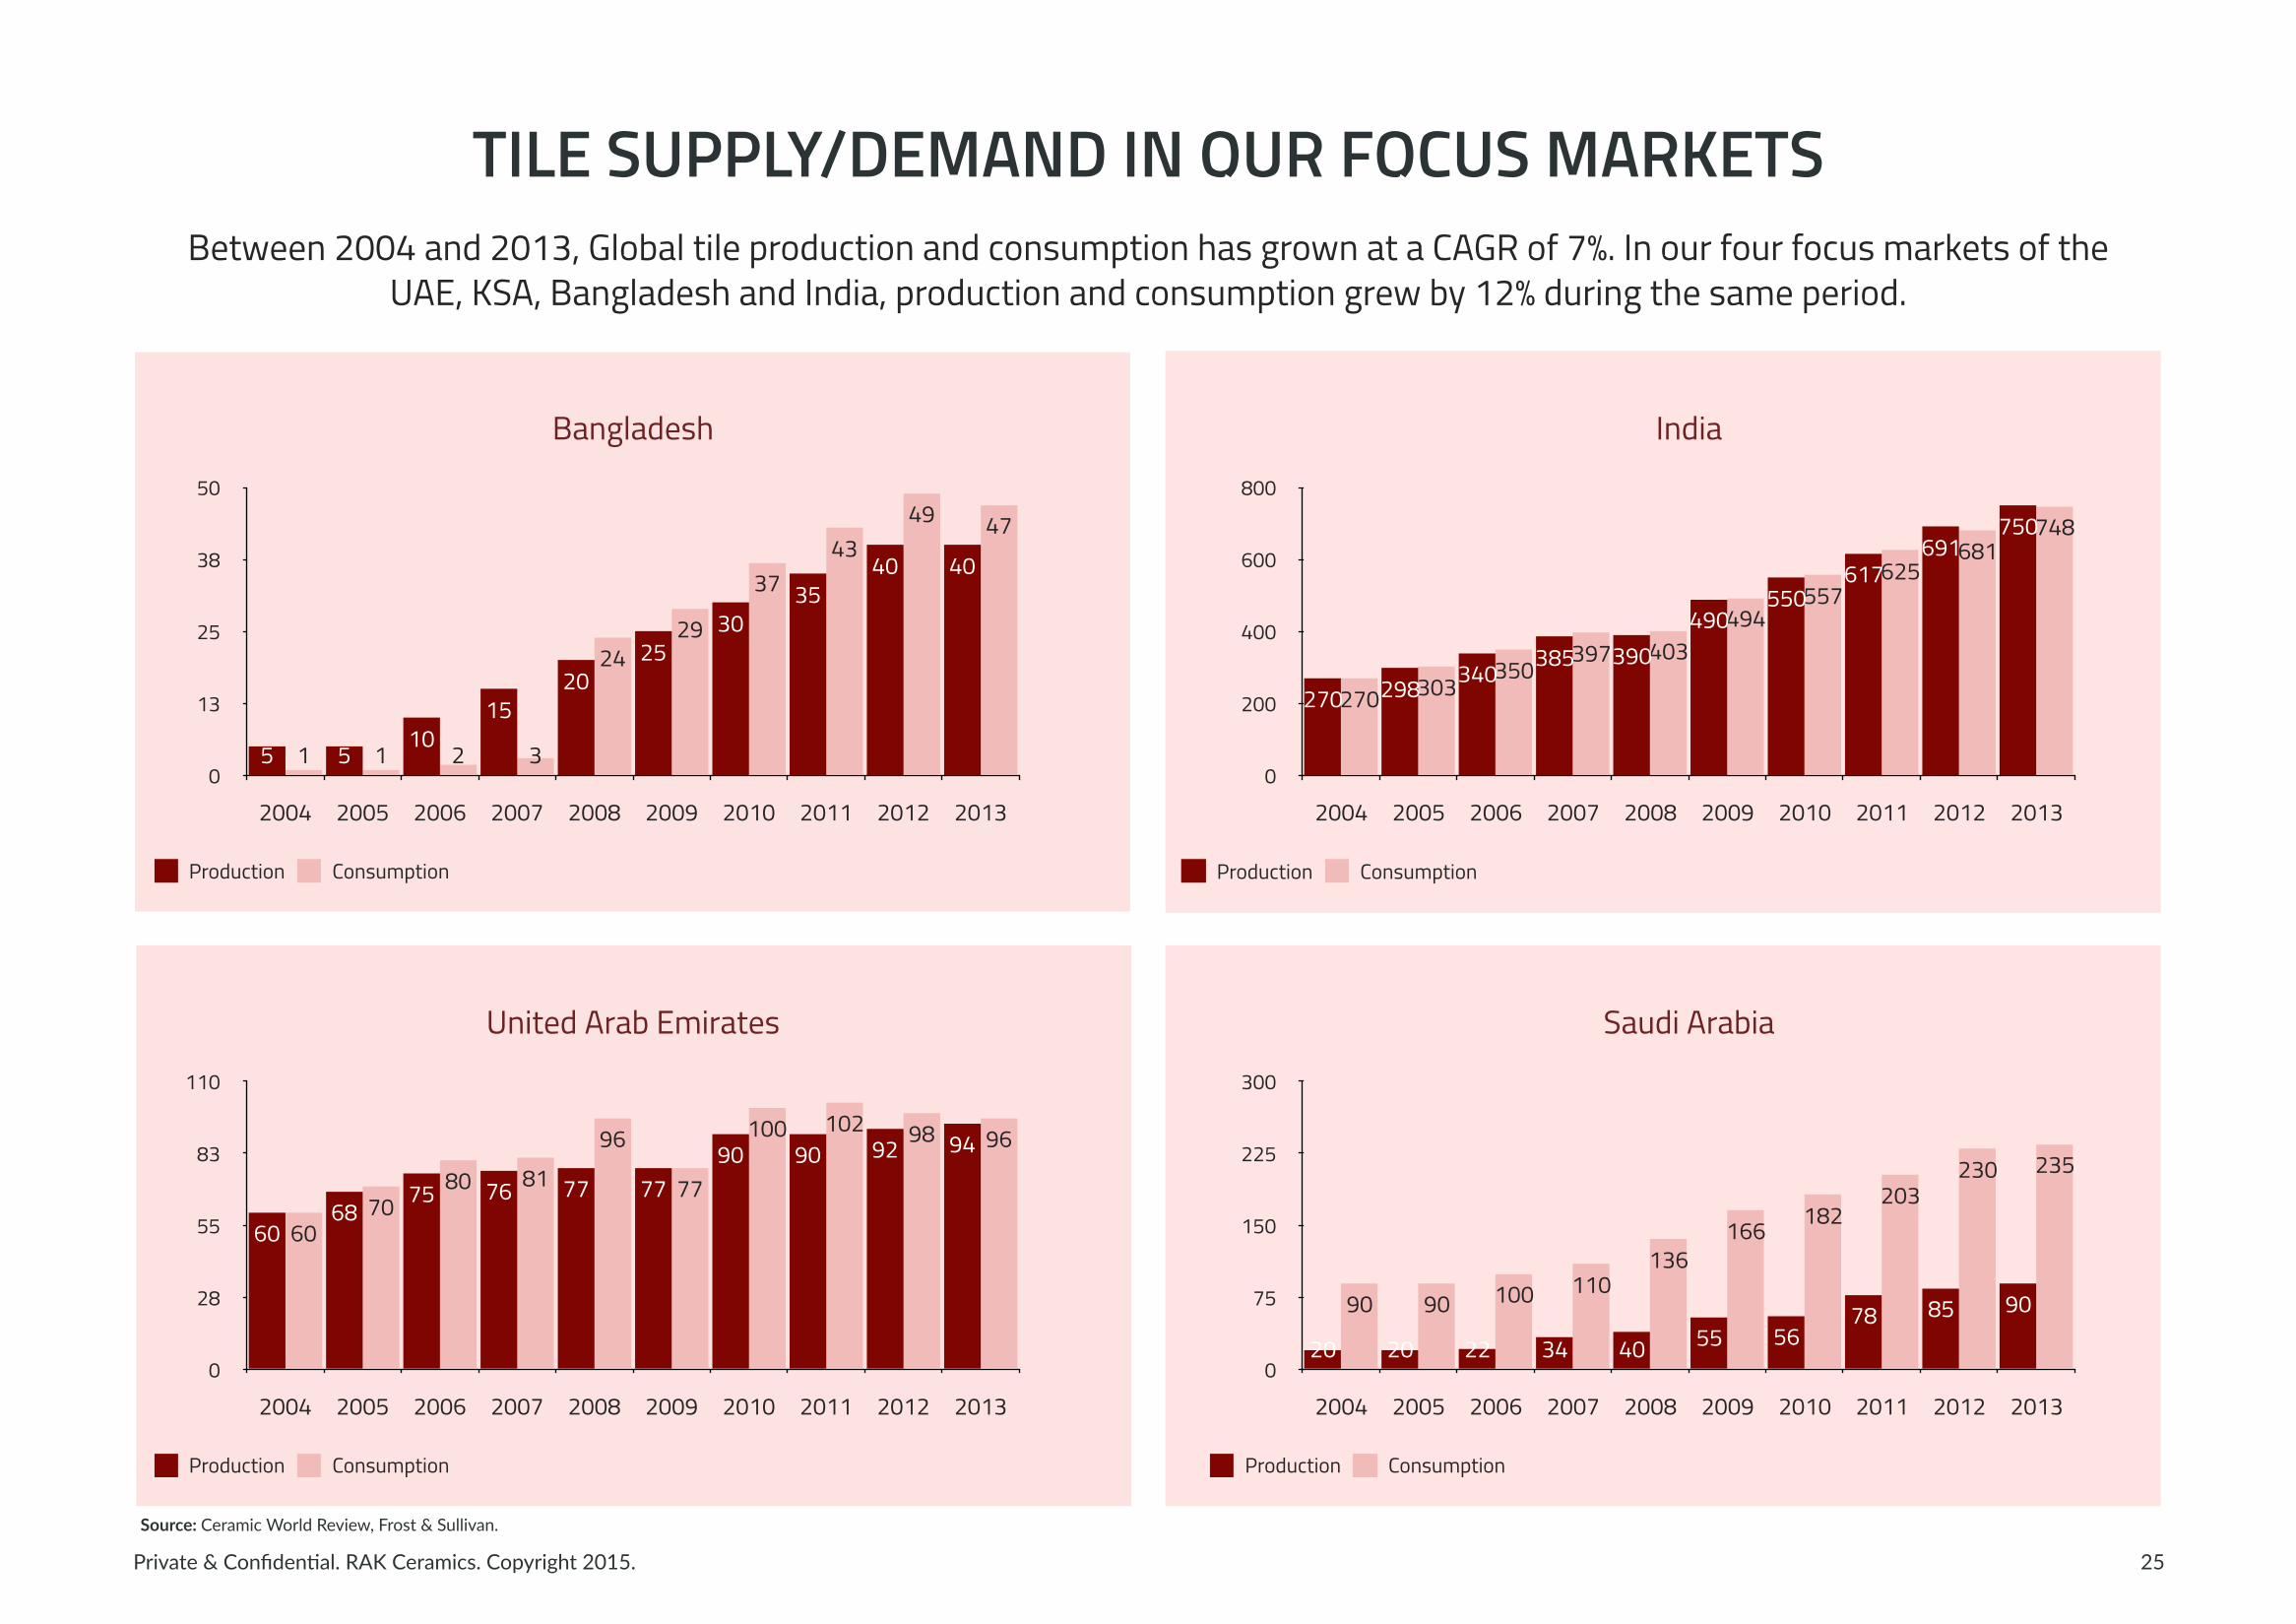
TILE SUPPLY/DEMAND IN OUR FOCUS MARKETS
25
Bangladesh
0
13
25
38
50
2004 2005 2006 2007 2008 2009 2010 2011 2012 2013
474943
37
2924
3211
404035
3025
2015
1055
Production Consumption
India
0
200
400
600
800
2004 2005 2006 2007 2008 2009 2010 2011 2012 2013
748681
625557
494403397
350303270
750691
617550
490390385
340298270
Production Consumption
United Arab Emirates
0
28
55
83
110
2004 2005 2006 2007 2008 2009 2010 2011 2012 2013
9698102100
77
968180
7060
9492909077777675
6860
Production Consumption
Saudi Arabia
0
75
150
225
300
2004 2005 2006 2007 2008 2009 2010 2011 2012 2013
235230203
182166136
1101009090 90857856554034222020
Production Consumption
Between 2004 and 2013, Global tile production and consumption has grown at a CAGR of 7%. In our four focus markets of the UAE, KSA, Bangladesh and India, production and consumption grew by 12% during the same period.
Source: Ceramic World Review, Frost & Sullivan.
Private & Confiden4al. RAK Ceramics. Copyright 2015.
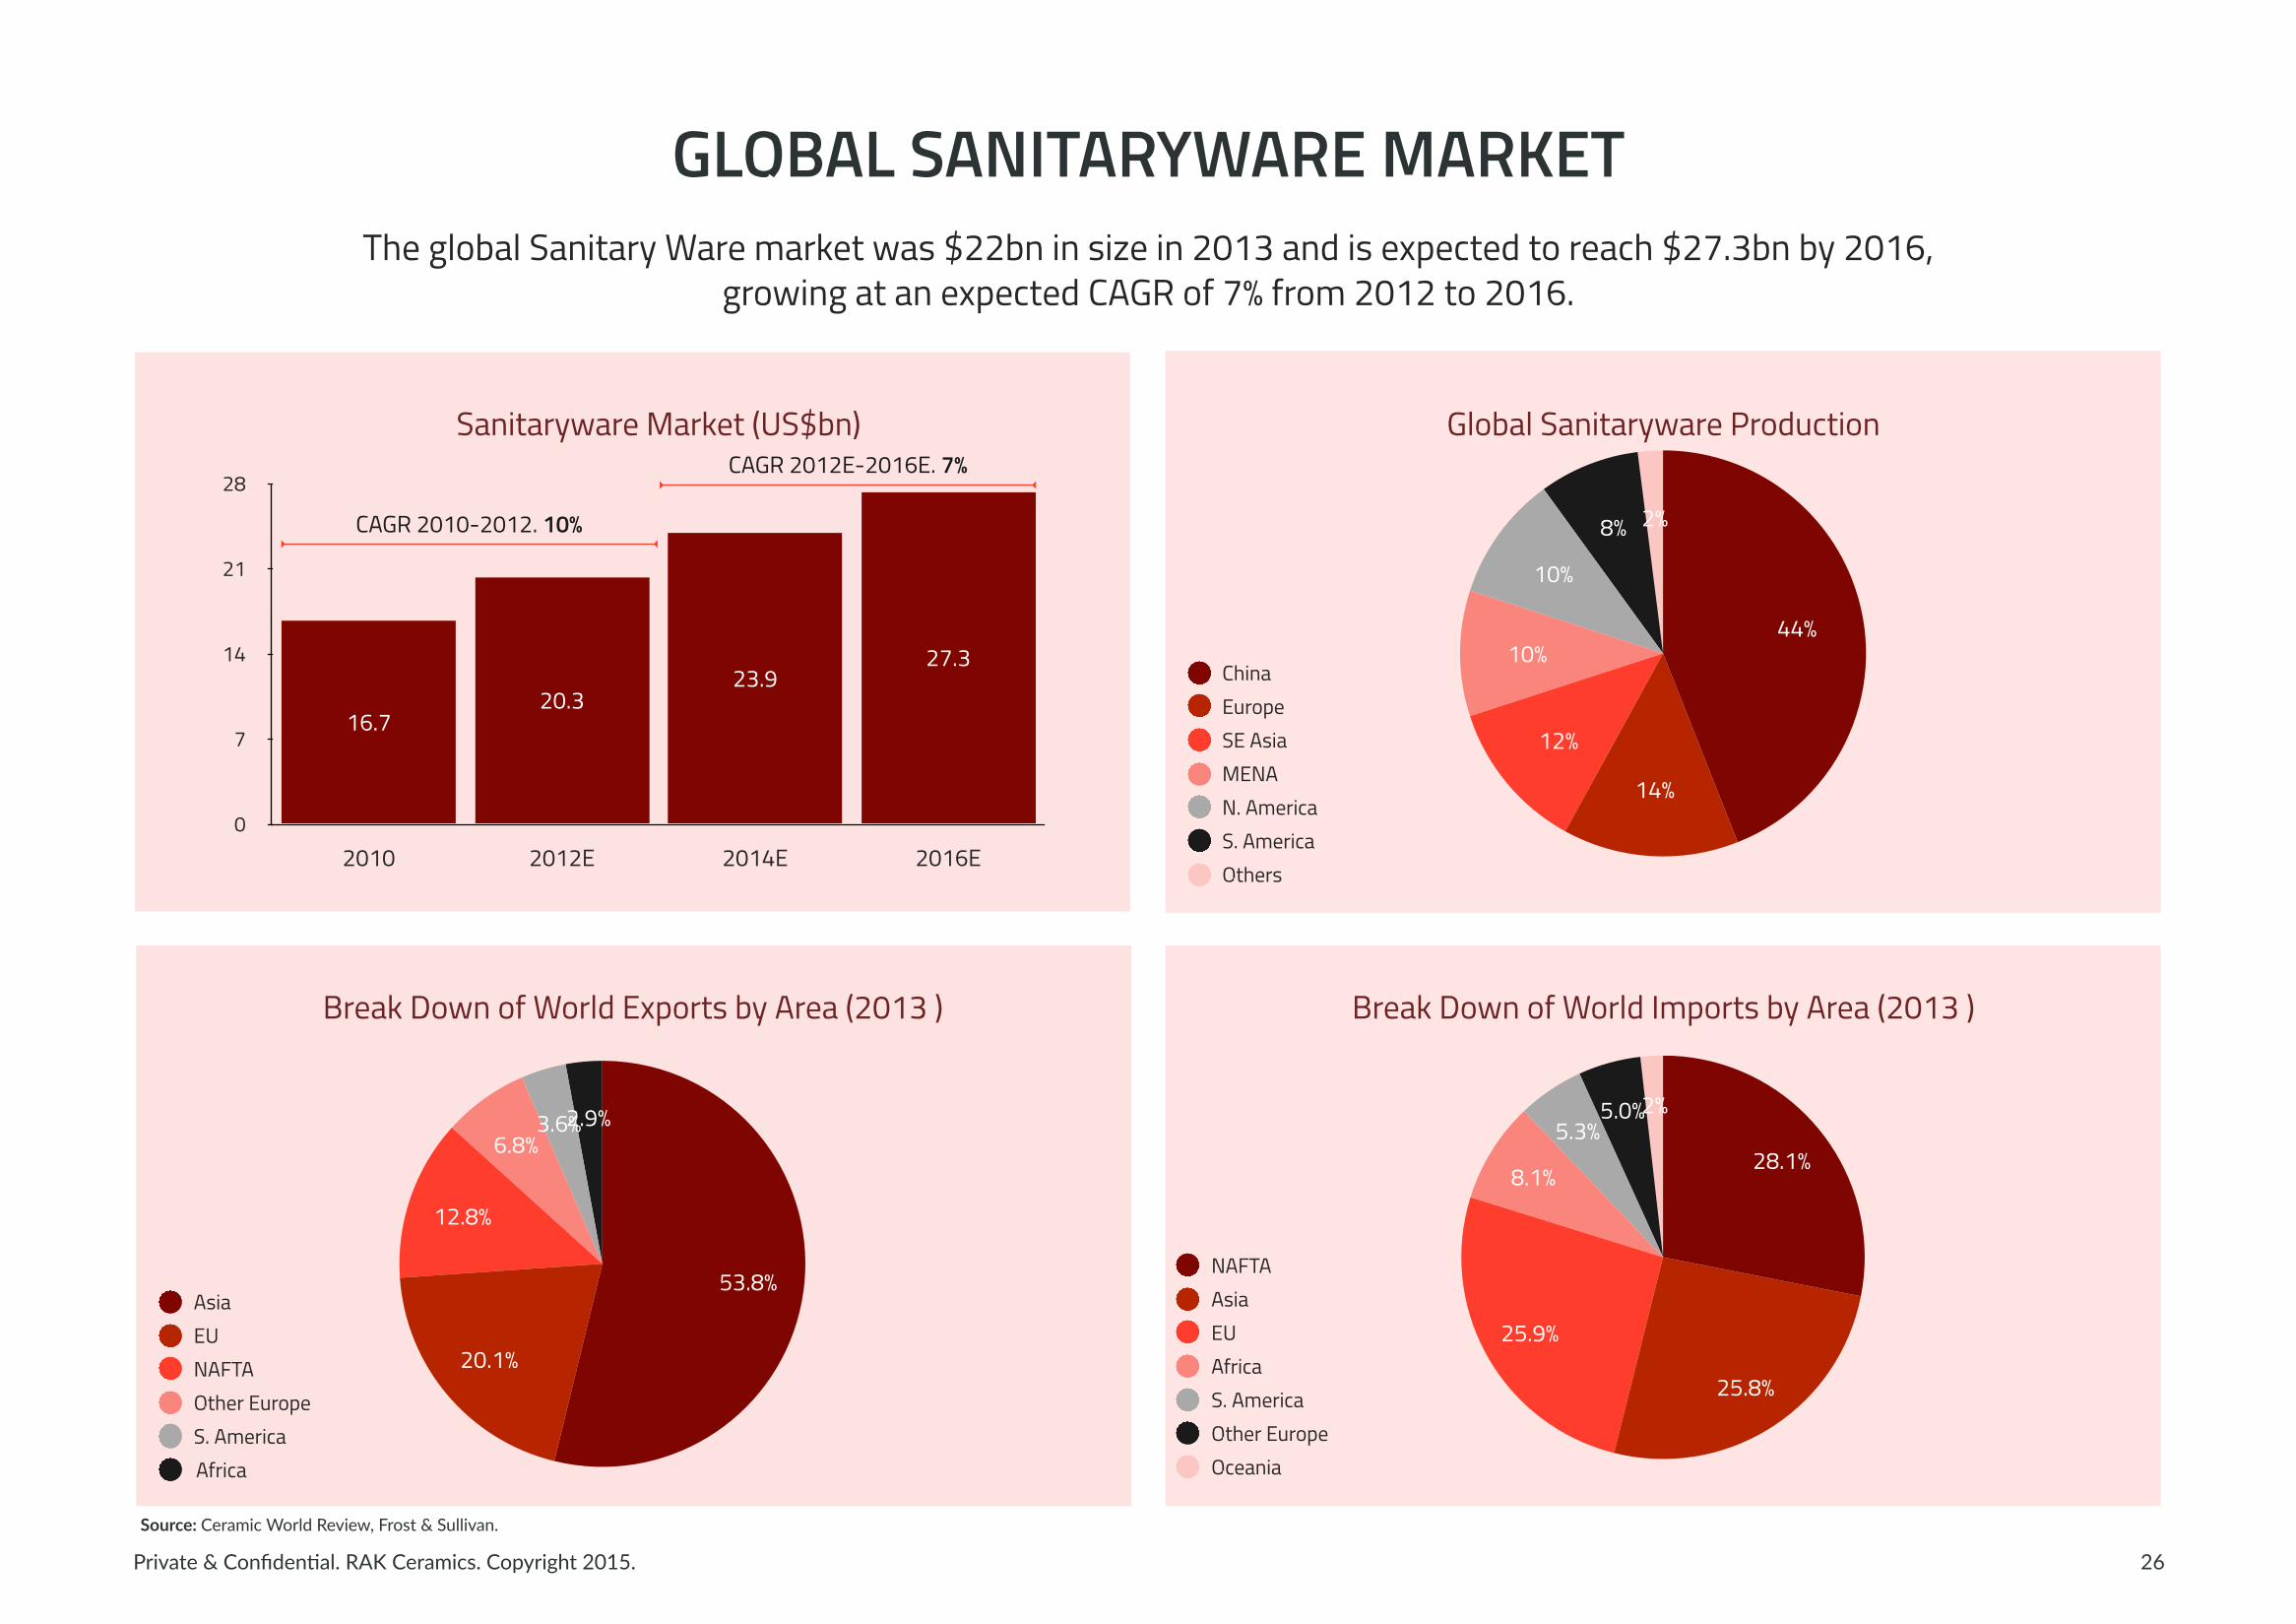
GLOBAL SANITARYWARE MARKET
26
The global Sanitary Ware market was $22bn in size in 2013 and is expected to reach $27.3bn by 2016, growing at an expected CAGR of 7% from 2012 to 2016.
Sanitaryware Market (US$bn)
0
7
14
21
28
2010 2012E 2014E 2016E
27.323.9
20.316.7
Break Down of World Imports by Area (2013 )Break Down of World Exports by Area (2013 )
Global Sanitaryware Production
CAGR 2010-2012. 10%
CAGR 2012E-2016E. 7%
2%8%
10%
10%
12%
14%
44%
ChinaEuropeSE AsiaMENAN. AmericaS. AmericaOthers
2.9%3.6%6.8%
12.8%
20.1%
53.8%AsiaEUNAFTAOther EuropeS. AmericaAfrica
2%5.0%5.3%
8.1%
25.9%
25.8%
28.1%
NAFTAAsiaEUAfricaS. AmericaOther EuropeOceania
Source: Ceramic World Review, Frost & Sullivan.
Private & Confiden4al. RAK Ceramics. Copyright 2015.
REFERENCE AND CONTACT INFORMATION
27
Further information:
The Company’s website provides www.rakceramics.com detailed information on the history, products and network of the company
The 2014 Sustainability report is available www.rakceramics.com/csr/csr2014/index.html
The most recent earnings presentation of the Company is available at
www.rakceramics.com/Investors_Center/investor-presentation/RAKCeramics_Q2_2015_Earnings_Presentation.pdf
Investor Relations Contact:
Philippe Habeichi, CFA – Head of Investor Relations: [email protected]