Embed Size (px)
Citation preview

ANNUAL REPORT2016
Moving Ahead of Time


DisclaimerThis document contains “forward-looking statements” – that is, statements related to future, not past, events. In this context, forward-looking statements often address our expected future business and financial performance and financial condition, and often contain words such as “expect,” “anticipate,” “intend,” “plan,” “believe,” “seek,” “see,” “will,” “would,” or “target.” Forward-looking statements, by their nature, address matters that are, to different degrees, uncertain, such as statements about expected income; earnings per share; revenues; organic growth; margins; cost structure; restructuring charges; cash flows; return on capital; capital expenditures, capital allocation or capital structure and dividends. These uncertainties may cause our actual future results to be materially different than those expressed in our forward-looking statements. We do not undertake to update our forward-looking statements. This document includes certain forward-looking projected financial information that is based on current estimates and forecasts. Actual results could differ materially.

Moving Ahead of TimeRAK Ceramics continues its relentless pursuit for excellence and
retains competitive edge by being a vigorous growth partner of the market. Inspired by our redefined policy formulation and credible
resources, we are moving ahead with our rejuvenated brand image and poised to convene the emergent market appetite.
06 Corporate Information
08 Company Profile
10 Vision and Mission
11 Company at a glance
12 The Performance of The Company and its Subsidiaries
16 Directors’ profiles
23 Chairman’s Statement
26 Managing Director’s Q & A
29 Sustainability-Building a better business
31 Executive management
34 Management discussion and analysis
37 Risk Management and Control Environment
40 General review of performance of the Company
43 Statement of subsidiaries
Contents

44 Corporate social responsibility
48 Value added statement
49 Directors’ Report of RAK Ceramics (Bangladesh) Limited
58 Membership Certificate of BAPLC
59 Awards and Recognitions
60 Corporate governance report
65 Certificate on Compliance of Conditions of Corporate Governance
74 Report of Audit Committee
77 Certificate for Financial Statements
79 Auditor’s Report and Consolidated Financial Statements
118 Auditor’s Report and Financial Statements (Standalone)
156 Directors’ Report, Auditor’s Report and Financial Statements of RAK Power Pvt. Ltd.
180 Directors’ Report, Auditor’s Report and Financial Statements of RAK Security and Services (Pvt.) Ltd.
195 Statement Pursuant to Section 186(1) (e) of The Companies Act, 1994

Annual Report 2016
6
Corporate InformationBoard of DirectorsChairmanMr. Abdallah Massaad
Managing DirectorMr. S.A.K. Ekramuzzaman
DirectorMr. Pramod Kumar Chand
Independent DirectorsMr. Faheemul Huq, Barrister-at-LawMr. Wassim Moukahhal
Chief Executive OfficerMr. Imtiaz Hussain
Chief Financial OfficerMr. Kaushik Das
Company SecretaryMr. Muhammad Shahidul Islam FCS
Audit Committee
ChairmanMr. Faheemul Huq, Barrister-at-Law
MembersMr. Pramod Kumar ChandMr. Wassim Moukahhal
Member SecretaryMr. Muhammad Shahidul Islam FCS
Head of Internal AuditMr. Zakir Hossain FCA
Statutory AuditorA. Qasem & Co.Chartered Accountants(a member firm of Ernst & Young Global Limited, UK)Gulshan Pink CitySuites: 01-03, Level: 07,Plot: 15, Road: 103,Gulshan Avenue,Dhaka-1212, Bangladesh
Principal BankersStandard Chartered BankHSBCCitibank, N.A.Dutch-Bangla Bank Ltd.
Credit Rating AgencyCredit Rating Information and Services Limited (CRISL)Nakshi Homes (4th & 5th floor)6/1A SegunbagichaDhaka-1000.
Legal AdvisorMr. Margub Kabir, Barrister-at-Law
Websitewww.rakcerambd.com
Registered OfficeRAK Tower (7th, 8th & 9th floor)1/A Jasimuddin AvenueSector-3, Uttara Model TownDhaka-1230.Phone: +88 (02) 58957393, 58952303Fax: +88 (02) 58957096
FactoryDhanua, Sreepur, Gazipur, Bangladesh

Annual Report 2016
7
RAK Ceramics (Bangladesh) :A strong investment case Benefits of scale g Among the largest ceramic tiles
manufacturers in Bangladesh g Comprehensive and diversified product
suite g Benefits of scale in procurement,
operations, supply chain and technologyg Sustainable relationships with
homeowners and commercial customers g Great brand image
Attractive growth opportunities g Strong culture of sales and marketing g Fragmented markets with scope for
consolidation g Large and aspiring population with rising
per capita and disposable incomesg Rising per capita consumption of ceramic
tiles and sanitary ware in Bangladesh.g Reliable payback from expansion
Robust execution culture g Strong post-sales/service orientation g Systematic performance appraisal g Best-in-class manufacturing and sales
platforms g Evolutionary operating model to
meet changing customer tastes and preferences
Low volatility g Protected gross marginsg Strong balance sheetg Asset-light approach to growth g Strong free cash flow generation through
economic cycles
4.33% Revenue CAGR
(2011-2016)
3.87% Net profit CAGR
(2011-2016)

Annual Report 2016
8
The core business of RAK Ceramics (Bangladesh) Limited is to manufacture and sell of ceramics and gres porcellanato (Porcelain/ fully vitrified) tiles, bathroom sets and all types of sanitary ware. The Company has over 2,500 models active in the ceramic and porcelain tile business and regularly adds several new designs to the product portfolio.
Company Profile
RAK Ceramics (Bangladesh) Limited is the country’s largest and most respected tiles and sanitary ware brand. The Company was incorporated in Bangladesh on 26 November, 1998 as a private limited company under the Companies Act, 1994 as a UAE-Bangladesh joint venture project. It has started its commercial production on 12 November 2000. It has converted into public limited company on 10 June 2008 and listed in the stock exchanges of Bangladesh on 13 June 2010. The Company has anchored this position on the basis of its market-leading capacities, world-class manufacturing assets, high production utilization, optimized cost structures, vibrant sales and distribution network and robust customer engagement programs.
The core business of RAK Ceramics (Bangladesh) Limited is to manufacture and sell of ceramics and gres porcellanato (Porcelain/ fully vitrified) tiles, bathroom sets and all types of sanitary ware. The Company has over 2,500 models active in the ceramic and porcelain tile business and regularly adds several new designs to the product portfolio. The Company manufactures tiles in a very wide range of tiles in the sizes from 20 cm X 30 cm up to 60 cm X 60 cm in Bangladesh location. The Company has over 30 models an exclusive range of sanitary ware to offer with a very wide choice. In sanitary ware various models are produced in wash basins (mounted as well as pedestal), water closets, accessories and marble sets. Besides, the product mix is geared to produce mostly value added products. This paired with the other advantages will ensure a shrunken payback cycle. Production is mostly consumed in local market.
Our annual production capacities: 11.68 mn sqm of tiles and 1.45 mn pieces of sanitaryware.
Our manufacturing assets: We operate the world class-leading SACMI technology that ensures high-quality, cost-effective output.
Our production capacity utilization: We continue to focus on maximizing capacity utilization. In the year 2016 actual capacity utilization of 68% at our tiles plant and 100% at our sanitary ware facility.
Our cost structures: Our costs are manifested as one of the lowest quartile in the industry by virtue of scale, technological and operational advantages.
Our vibrant sales network: We possess one of the largest and excellent dealers network, operating 4 exclusive showrooms/ display centre throughout the country.
Our consumer engagement programs: We deliver customized solutions to our customers to their utmost satisfaction even after post sale of products including outright replacement at no extra cost.
The current market for the Company includes construction developers, government institutions and local consumers. The Company has a strong market reputation in Bangladesh with a firm network of 92 dealers nationwide and receives strong support from RAK Ceramics PJSC, UAE in terms of technological know how, management and marketing support.
The Company emerged as the first Bangladeshi Company in its industry to

Annual Report 2016
9
be awarded the prestigious ISO 9001: 2008 certification by the UKAS accredited internationally recognized certification agency BVQI in May 2006. As a responsible global leader in the ceramic industry, we are maintaining our commitment to protect and preserve the environment by operating an Environmental Management System which is certified to ISO 14001:2004 standard. The Company complies with ISO 13006:2012 (E), the latest international standard for ceramic tile; locally known as BDS ISO 13006:2012. The Company’s sanitary ware complies with the quality criteria of BDS 1162:2012. Both tiles and sanitary products are BSTI-approved. The Company also awarded as ‘Superbrand’ in 2010, first time in Bangladesh. The ceramic tiles and sanitary wares are continuously tested in the factory’s own laboratory and following BS EN ISO 10545:2013 and BS EN 997:2012 standards respectively.
The ownership of RAK Ceramics (Bangladesh) Limited comprises with 75.59% held by the sponsors (71.67% by RAK Ceramics PJSC, UAE and 3.92% by local investor Mr. S.A.K. Ekramuzzaman) and remaining 24.41% is holding by general public including institutional investors as on December 31, 2016. With an annual turnover of over BDT 5,661.41 million in 2016, within the short span of 16 years RAK has firmly established itself as one of the leading manufacturer of high quality ceramic wall, floor tiles, gres porcellanato and sanitary wares products in Bangladesh.

Annual Report 2016
10
VisionOur vision is to be the world’s leading ceramics lifestyle solutions provider.
MissionOur mission is to foster an internal culture that we are committed to our vision of becoming the world’s leading ceramics lifestyle solutions provider and we will achieve this by utilising our experience, our wide product range, our innovative approach and continuing to deliver quality. We want to build a world class organisation. We have applied our expertise in some of the most iconic and innovative projects around the world and we aim to continue to push the boundaries in new and exciting projects as we move forwards.

Annual Report 2016
11
Company at a glanceRAK Ceramics (Bangladesh) is a leading manufacturer and marketer of premium branded ceramic tiles and sanitaryware products that enhance, protect and maintain the places and spaces in which people live and work.
Our growth enablersg Premium brands g Expansive product portfolio g Focus on innovation and technology g Attentive customer service g Skilled employees, best practices g Loyal and trusted trade channel distribution g Financial conservatism
At RAK Ceramics (Bangladesh), all of these elements underpin a strong and sustainable competitive advantage, a stable earnings profile and a platform for compelling growth options.
Our growth strategyWe seek above-market growth rates by:g Extending our market leading product positions to newer customers in newer geographies g Transferring our core marketing, sales and supply chain capabilities to provide full-fledged
home and office improvement solutions g Continuing to seek low-risk business opportunities that enable high customer value-additiong Focusing on organic growth through debottlenecking and strategic capacity expansion

Annual Report 2016
12
The Performance of The Company and its SubsidiariesA. RAK Ceramics (Bangladesh) Limitedi) Ceramic and gres porcellanato tiles
The performances of ceramic Tiles product were as follows:
Annual production capacities: 11.68 mn sqm.
Our production capacity utilization: We continue to focus on maximizing capacity utilization. In the year 2016 capacity utilization was 68% at our tiles plant.
Highlights 2016Achieved a 17.36% increase in production to 7.06 mn sqm.
Achieved a 7.91 % increase in sales to 6.48 mn sqm.
Achieved a 3.16 % average increase in price realizations.
Roadmap 2017Explore new markets, especially those of the neighboring countries.
Focus on cost control programs.
ii) Sanitaryware
At RAK Ceramics (Bangladesh), our sanitaryware portfolio features more than 30 models comprising wash basins (mounted and pedestal), water closets, bidets, water tanks, bathroom sets. These are increasingly preferred on account of attractive designs, diverse range and various functional applications. The performances of Sanitary Ware product were as follows:
Annual production capacities: 1.45 mn pieces.
Manufacturing assets: We operate the world class-leading SACMI technology that ensures high-quality, cost-effective output.
Our production capacity utilization: We continue to focus on maximizing capacity utilization. In the year 2016 capacity utilization was 100% at our sanitary ware facility.
Highlights 2016Achieved a 2.11% increase in production to 1.45 mn pieces.
Some of the new products launched included series RAK Galaxy, Harmony, Gloria wall hunk, Cleo model.
Some of our top selling products included cynthia, orient, washington etc.
Roadmap 2017Continued focus on growing production and sales of premium products.
Explore new markets.
B. RAK Power Pvt. Ltd.Review of Business
The plant capacity was available in excess of 90 percent of installed capacity, during 2016. However, supply was primarily dedicated to the requirement of parent company RAK Ceramics (Bangladesh) Ltd. and other group companies. The company supplied power to Bangladesh Rural Electrification Board (BREB) to the extent of 1.5–2.5 MW in excess of group company requirement and also as per requirement of REB during the first 4 month of the year 2016. After coming in to operation of the 4th plant of RAK Ceramics (Bangladesh) Ltd. Group Company’s requirement has been increased and the power supply to BREB is suspended.
Revenues increased by around 11.95 percent to BDT 373.99 mn in 2016 from BDT 334.04 mn in 2015.
Gross profit decreased by 3.78 percent to BDT 147.70 mn in 2016 from BDT 153.50 mn in 2015.

Annual Report 2016
13
Profit after tax (PAT) decreased by 2.88 percent to BDT 96.66 mn in 2016 from BDT 99.72 mn in 2015.
EBITDA decreased by 2.88 percent to BDT 159.09 mn in 2016 from BDT 163.82 mn in 2015.
C. RAK Security and Services (Pvt.)Ltd.Review of BusinessThe principal activities of the company is to carry on the business of security guarding, cleaning services, termite and pest control services, fumigation services and setting up manpower technical training establishments for creation of skilled workers in various fields of construction and public works, pre-employment back ground verification and immigration & Visa documents verification services, fire safety services etc.
EPS decreased by 3.07 percent to BDT 47.15 per share in 2016 from BDT 48.65 per share in 2015.
Revenues increased by around 108.33 percent to BDT 153.54 mn in 2016 from BDT 73.70 mn in 2015.
Gross profit increased by 32.54 percent to BDT 32.34 mn in 2016 from BDT 24.40 mn in 2015.
Profit after tax (PAT) increased by 12.82 percent to BDT 7.83 mn in 2016 from BDT 6.94 mn in 2015.
EBITDA increased by 11.70 percent to BDT 12.41 mn in 2016 from BDT 11.11 mn in 2015.
EPS increased by 12.81 percent to BDT 782.81 per share in 2016 from BDT 693.91 per share in 2015.
(Amount in BDT mn)Particulars 2012 2013 2014 2015 2016Net Sales 273.18 287.06 294.04 334.04 373.99 Gross Profit 109.09 124.48 130.59 153.50 147.70 EBITDA 141.51 148.78 145.28 163.82 159.09 PAT 59.63 74.10 88.83 99.72 96.66 EPS (Absolute BDT) 29.09 36.14 43.33 48.65 47.15
Key financial data of preceding five years:
(Amount in BDT mn)Particulars 2012 2013 2014 2015 2016Net Sales 54.78 61.62 70.23 73.70 153.54 Gross Profit 16.48 19.31 23.94 24.40 32.34 EBIDTA 5.68 7.25 10.98 11.11 12.41 PAT 3.43 4.41 6.84 6.94 7.83 EPS (Absolute BDT) 342.74 440.58 684.44 693.91 782.81
Segment Reporting 2016 (Amount in BDT mn)Particulars RAK Ceramics RAK Power RAK Security Adjustment Entity TotalSales 5,577.44 373.99 153.54 443.56 5,661.41Gross Profit 2,222.42 147.70 32.34 6.90 2,409.36Profit before Tax 1,221.12 140.99 12.04 103.49 1,270.66Profit after Tax 914.26 96.66 7.83 103.50 915.25

Annual Report 2016
14
A year of respectable progress against a challenging backdrop
2.72 3.25 1.67 2.03 1.81
2016 2015 2014 2013 2012
EPS (BDT):
61.90 66.90 57.70 53.90 56.80
2016 2015 2014 2013 2012
Stock Performance (BDT):
14.98 18.12 9.51 11.73 10.95
2016 2015 2014 2013 2012
Return on Shareholders' Funds (%):
42.55 42.74 39.14 40.55 39.60
2016 2015 2014 2013 2012
Gross Profit Margin (%):
Good progress has been made implementing the Company’s refreshed strategy, although there remains much still to do as we further reinforce our position as Bangladesh’s largest and most respected tiles and sanitaryware enterprise. While it is early in the full recovery of the construction industry, the new housing market, new commercial and industrial markets and the repair, maintenance and improvement markets have been performing largely as per our internal expectations.

Annual Report 2016
15
18.14 17.93 17.57 17.27 16.48
2016 2015 2014 2013 2012
NAV Per Share (BDT):
3.23 3.74 4.33 2.78 2.64
2016 2015 2014 2013 2012
Dividend Yield (%):
22.76 20.58 34.55 26.55 31.38
2016 2015 2014 2013 2012
P/E Ratio (Times):
30.27 34.73 27.49 28.33 28.11
2016 2015 2014 2013 2012
EBIDTA (%) :
0.19 0.20 0.06 0.08 0.07
2016 2015 2014 2013 2012
Debt Equity Ratio (Times):
20,851.05 22,535.30 19,436.28 16,505.68 15,812.49
2016 2015 2014 2013 2012
Market Capitalization (BDT mn):
1.63 1.60 2.01 1.97 1.99
2016 2015 2014 2013 2012
Current Ratio (BDT):
19.81 22.91 16.01 16.63 15.44
2016 2015 2014 2013 2012
ROCE (%) :
Annual Report 2016
16
Directors’ profiles and their representation on Board of other companiesImportantly, the Company’s growth plans are not just predicated on resurgent markets but on active consumer-centric programmes to drive sustainable competitive advantage and long-term improvements to shareholder returns. Through investing in customer propositions, optimising the branch network, accelerating scale advantages and bringing forth greater discipline into product portfolio management, RAK Ceramics (Bangladesh) remains confident it can continue to outperform the markets in which it operates in the years ahead.

Annual Report 2016
17
Mr. Abdallah MassaadChairmanMr. Abdallah Massaad, Chairman of the Company is also a member of the Board of Directors of RAK Power Pvt. Ltd. and RAK Security and Services (Pvt.) Ltd., subsidiary companies of RAK Ceramics (Bangladesh) Limited.
Mr. Massaad has been leading RAK Ceramics PJSC as Group Chief Executive Officer since June 2012.
He is also a representative on the board and management of several subsidiaries of RAK Ceramics. He is extremely knowledgeable in the fields of ceramics and industrial manufacturing, and is instrumental in helping companies engage in the forward and backward integration of the ceramics supply chain.
His tenure with RAK Ceramics began in 2004, when Mr. Massaad was invited as a Marketing Consultant to assist the CEO office, and upgrade the branding and positioning of the company in preparation for future sales and marketing challenges arising from ambitious expansion plans.
We are in constant pursuit to shape a wider product portfolio through constant innovation, vibrant design patterns and a spectrum of strategic focus that exemplifies the cornerstones of our core business forward

Annual Report 2016
18
Mr. Massaad initially joined RAK Ceramics in 2006 as Deputy CEO, responsible for operations management, strategy development, implementation and RAK Ceramics’ global interests. He supported the Chairman and CEO with strategic planning and expansion initiatives enabling the company to reach the milestone of 1 billion square metres of global sales since it began. He was also responsible for implementing Corporate Governance regulations and overseeing the strategic refocusing of the business portfolio.
June 2014 marked a transformational point for RAK Ceramics under Mr. Massaad’s leadership, when Samena Capital acquired 30.6% of the business and implemented a “Value Creation Plan” aimed at unlocking value for shareholders. As part of the Value Creation Plan, RAK Ceramics started a re-focused strategy which aims to streamline global businesses and identify its most profitable operations.
In 2015, Mr. Massaad won the International Business Stevie® Award for ‘Executive of the Year (Manufacturing)’. The efforts of Mr. Massaad as a visionary CEO were also further recognized when he was awarded ‘Industry CEO of the Year’ at the CEO Middle East Annual Awards 2015.
Having over 24 years of experience from field sales to sales management, to product marketing, Mr. Massaad has highly developed business leadership skills in national and international markets. Prior to joining RAK Ceramics, Mr. Massaad was the General Manager of International Ceramics Company SARL (ICC) Lebanon.
Mr. Massaad holds post graduate qualifications in Management ‘DEA in Business Administration’ (1998) and an undergraduate degree “Maitrise in Business Administration – Marketing” from USEK (Université Saint-Esprit de Kaslik), Lebanon. He is well versed in Arabic, French and English.

Annual Report 2016
19
Mr. S.A.K. EkramuzzamanManaging DirectorMr. S.A.K. Ekramuzzaman, Managing Director of the Company is one of the local investors having equity partnership with RAK Ceramics (Bangladesh) Limited. Besides managing diversified business interests of RAK Group, he is involved in a number of other business interests in Bangladesh.
Mr. Ekramuzzaman is also the member of the Board of Directors of RAK Power Pvt. Ltd. and RAK Security and Services (Pvt.) Ltd., subsidiaries of RAK Ceramics (Bangladesh) Limited.
We remain empowered to capacitate our efforts in terms of responding to the growing market appetite by being responsible to our stakeholders as well as aligning the application of our strategic anchoring with the dynamic market of Bangladesh

Annual Report 2016
20
Mr. Pramod Kumar ChandDirectorMr. Pramod Kumar Chand is the Group Chief Financial Officer of RAK Ceramics PJSC, Director of RAK Power Pvt. Ltd. and RAK Security and Services (Pvt.) Ltd., subsidiaries of this Company. He is also a member of the Audit Committee of RAK Ceramics (Bangladesh) Limited.
Mr. Pramod has wide experience in dealing with corporate finance matters including treasury/working capital financing, project finance, venture capital, debt & equity capital market instruments, fund raising processes and general management.
Mr. Pramod’s professional credentials span over 3 decades of post qualification experience with blue chip employers including Birla Corporation Ltd. and OCL India Ltd. in India and Rak Investment Authority in UAE.
Mr. Pramod is a Member of the Institute of Chartered Accountants of India (CA) and has been a rank holder and winner of A F Ferguson award.
It gives me immense pleasure to represent a company that has established its reputed brand image, is driven by immaculate value creation doctrines and exercises optimum corporate governance practices to proactively safeguard and maintain value for stakeholders

Annual Report 2016
21
Mr. Wassim MoukahhalIndependent DirectorMr. Wassim Moukahhal is the Independent Director of RAK Ceramics (Bangladesh) Limited and its subsidiary companies. He also serves as a Member of the Board of Directors and the Executive Committee for RAK Ceramics PJSC and as a Member of the Board of Directors of RAK Porcelain.Mr. Moukahhal has more than 12 years of experience in private equity investments and is currently a Senior Vice President of Samena Capital Investments Limited in Dubai, focusing on investments within the MENA region.Mr. Moukahhal holds an MBA from the Wharton School at the University of Pennsylvania and a Bachelor’s degree in Economics & Finance from McGill University.
We place resource utilization at the core of our operational engagements and cease to become complacent of our advantageous position within the market; which make us more accountable to our customers, stakeholders and the society at large

Annual Report 2016
22
Mr. Faheemul Huq, Barrister-at-LawIndependent DirectorMr. Faheemul Huq, Barrister-at-Law, is the Independent Director of the Company and also the Independent Director of subsidiary companies of RAK Ceramics (Bangladesh) Limited. He is the Chairman of the Audit Committee of the Company.
Mr. Huq completed his LL.B.(Hon’s) from the University of Dhaka and the University of Wolverhampton, UK., PGDL, Bar Vocational Course, Lincoln’s Inn, UK, Barrister-at-Law and was Called to the Bar from Hon’ble Society of Lincoln’s Inn, UK. He is enrolled in the Appellate Division of the Supreme Court of Bangladesh. Mr. Huq is one of the senior Advocate in the Supreme Court of Bangladesh with more than 18 years of experience in Bangladesh.
Mr. Huq is a Member of the Bangladesh Supreme Court Bar Association and the Dhaka Bar Association, Bangladesh.
Mr. Huq is involved in many social activities such as the Chairman of Fazlur Rahman Foundation and Farida Huq Foundation, Life Member of Diabetic Association of Bangladesh, Member of Patient Welfare Committee of Diabetic Association of Bangladesh, Member of Legal Affairs Committee of Diabetic Association of Bangladesh and Member of Managing Committee of Dr. Farida Huq Memorial Ibrahim General Hospital, Kaliakair, Gazipur. He is also Life Member of the Dhaka Club Limited and the Banani Club Limited.
I firmly believe that RAK will continue to grow towards the path of excellence, as it fosters environmental efficiency, stabilizes market risks and has the potential to benefit the economic progression the country is set out to experience

Annual Report 2016
23
Chairman’s StatementWhat I would like to impress upon shareholders is that a couple of years ago, when de-growth became increasingly evident, it would have been easier to stay low and stick to the conventional. On the contrary, we perceived the slowdown as a structural opportunity to look within, manage better what was within our control and create a stronger business.

Annual Report 2016
24
At RAK Ceramics (Bangladesh), our objective is to deliver sustainable growth in shareholder value, based on our vision to establish RAK Ceramics as a world-class lifestyle brand anchored on staying relevant to a modernising consumer
Dear shareholders,
The year 2016 continued to be sluggish and one of the first casualties of this was the tendency among consumers to postpone big ticket investments and defer discretionary spending.
The result was that the category growth of ceramic tiles and sanitaryware remained muted, with the sectoral prospects directly linked to the real estate industry.
This, in turn, immediately translated into an increased tendency among the trade to offer markdowns and other concessions, eroding sectoral margins on the one hand and creating a discounts-induced demand pull on the other, which is not just temporary but also unsustainable.
With margins being affected and breakeven points rising, the players in a fragmented sector found it difficult to reinvest in their businesses. To make the operating circumstances being even more challenging, the industry continued to poach from within.
I am pleased to state that these challenges notwithstanding, RAK Ceramics (Bangladesh) reported a respectable performance.
One of the most visible manifestations of
our countercyclical and counter-industry performance was the fact that we reported a healthy growth in our ceramics tiles realisations as well as sales with a relatively higher proportion of premium products in the overall sales mix.
This is a clear indication of the quality of brand franchisee we have built among our consumers with our brand symbolising a deeply inherent value that few other brands enjoy in Bangladesh.
What I would like to impress upon shareholders is that a couple of years ago, when de-growth became increasingly evident, it would have been easier to stay low and stick to the conventional. On the contrary, we perceived the slowdown as a structural opportunity to look within, manage better what was within our control and create a stronger business.
Besides, the Company could have embarked on conventional responses. So even before I describe the various initiatives that we implemented during the year under review, permit me to explain the kind of temptations we resisted.
It would have been easy to reduce our prices to fight the competition more effectively;

Annual Report 2016
25
on the contrary, we selected to resist from engaging in frequent markdowns and focused on creating a stronger business instead. It would have been alluring to create a product push that would eventually lead to an inventory pile-up at the dealers’ end; on the contrary, we emphasised on developing focused and sustained marketing campaigns instead, creating a consumer pull and helping our dealers manage their business more effectively. It would have been enticing to cater to existing needs; on the contrary, we focused on the more sustainable approach of building markets where none existed through creating innovative, stylish, aesthetic, functional and high-relevant products and solutions.
The results were encouraging even as we reported a healthy ~12% growth in revenues and an ~11% increase in gross profit; however, on the back of a sharp jump in raw material resource prices which we strategically refrained from passing on fully to our customers led to a de-growth in our net profit. I am certain that this prudent initiative will help us create value over the long-term as a calibrated approach to price increase is always more sustainable and productive than an abrupt and unequalised one that could lead to potential demand destruction, especially in a listless operating environment.
So what gives me the confidence of the times ahead?
One, the modernising consumer. With more citizens travelling abroad and getting a taste of the developed world, there is a clear shift in the mindset to try out new and different products and experiences. Besides, with the average per capita income surging to USD ~1,200 in line with a 7%-plus economic growth, a larger number of passive citizens have become active consumers with a strong co-relational growth in discretional spending.
Two, a moderating interest rate regime. The interest rates of a country are one of the most important deciding factors of real estate acquisition. With the average interest rates sharply coming down in the country, a larger
number of citizens waiting at the fences will now closely look at entering the market. Besides, the expectation of realty prices sustaining at the current levels is also a trigger in home purchases.
Three, the Bangladeshi government’s increasing thrust on industrialisation, urbanisation and infrastructure creation (for instance, the showpiece Padma Bridge, the proposed elevated expressway between the Dhaka airport and the city centre and the focus on affordable housing projects, etc.) bode well for the sector as builders will now start to identify real estate development opportunities beyond the metros and other congested pockets.
At RAK Ceramics (Bangladesh), as usual, we will remain vigilant in controlling our costs to protect profitability while investing in attractive opportunities for profitable growth. We are confident to make significant strides in the years ahead to emerge as a lifestyle brand that our consumers are proud to own.
We are also focused on creating a more sustainable business platform that our shareholders are proud to own, on the back of reinforcing our status as a sustainable consumption proxy in a country that is poised to achieve a multi-decade economic growth that is among the highest not just in Asia but in the world.
Finally, on behalf of the Board, I would like to thank our colleagues who make our business what it is today. It is their dedication, hard work and commitment that deliver improving results year-on-year and great value for our customers, suppliers and shareholders alike.
With my best wishes,
Mr. Abdallah Massaad ChairmanRAK Ceramics (Bangladesh) Limited

Annual Report 2016
26
Managing Director’s Q&AOver the year 2016, I have had a wonderful opportunity to meet and listen to our customers, suppliers, lenders and associates. This has reinforced my view of the inherent strengths of the RAK Ceramics (Bangladesh) business, not least the amazing depth of talent and dedication of our associates at the front line. It has also highlighted some of the opportunities that lie ahead of us, which are discussed below
Mr. S.A.K. Ekramuzzaman, Managing Director
Q How would you assess the business’ strengths today?
A. Undoubtedly, ours is a people business. The quality, knowledge, dedication and service that our associates deliver to our customers and the long-term and enduring relationships they develop is a key differentiator.
Today, we have a focused set of specialist ceramic tiles and sanitaryware businesses operating in un-served and under-served markets of Bangladesh with leading market positions. We reap the benefits of scale in supply chain, procurement, operations and technology, which has eventually emerged as a strong source of competitive advantage. We continue to invest in these areas to maximise the benefits we can bring to service our customers with speed and reliability and generate attractive returns for our investors.
Within our industry, long-term growth drivers remain structurally attractive in all the regions of the country where we operate today, mostly all of Bangladesh. We predominantly serve the real estate industry comprising new sales of homes and offices as well as their improvement in terms of renovation and refurbishment. It must also be stated that the majority of our businesses operate in highly fragmented markets where there are good opportunities to serve new customer segments through products that are anchored on world-class quality and value-driven propositions.
Q What are the immediate challenges RAK Ceramics (Bangladesh) faces?
A. Over the past 12 months, we have experienced more turbulent end markets accompanied by the collapse in the oil price, falling commodity prices and an overall sluggish consumption environment. Most notably, it has been the consumer expectation

Annual Report 2016
27
of further lowering of interest rates that has made them defer their real estate purchases that has led to a muted growth of the country’s realty sector, on which are prospects are directly hinged.
More so, with banks and other financial institutions suffering from a challenged home loan portfolio and effecting more stringent credit checks and loan-to-value (LTV) ratios, consumers are finding it more difficult to source cheaper home loans, which has also played a part in impacting our business.
At our Company, with decades of experience in the interior infrastructure sector and having witnessed multiple economic cycles, we have steered our businesses through these considerable changes to develop and enhance our services in support of our customers and aim to provide the most stable, yet dynamic place for associates to work in this industry. This will continue to drive profitable growth, one of the hallmarks of our business in recent years.
Q How will this influence your approach to strategy?
A. Each of our business units have clear strategic plans to generate profitable growth and they will continue to execute them with rigor and speed. Resource allocation, that is investing the most capital and human resources in those businesses/ product segments capable of generating the best returns for our shareholders, is an important part of our DNA today. We will continue to be responsible custodians of our shareholders’ capital, both in terms of identifying investment opportunities in organic expansions and also scouting for best-fit acquisitions in which we feel we can create synergies. At the same time, we will maintain a strong balance sheet that will enable us to continue to grow and invest in our businesses over the long-term without worrying too much about short-term market forces.
Q What were some of the headline highlights of our business during the
course of the year?
A. At our Company, we continue to focus on maximising capacity utilisation, which stood at 68% at our tiles plant and 100% at our sanitaryware facility. Our capacity utilisation
levels are among the highest in our sector in the country, which not only enables us to optimise unit costs, thanks to the benefits reaped from scale, but also minimise technology and asset idling. Typically, the cost of restarting our machines post a shutdown is relatively high and this is a time-consuming process too. Therefore, leaving aside planned shutdowns for repairs and maintenance etc, our plants are running as per the operations schedule with minimum – and accountable – deviations.
Q You touched upon an important point about optimising unit costs. Can you
please elaborate on that?
A. We are among the region’s lowest cost manufacturers by virtue of scale and technological and operational advantages. Our cost structures are dynamic and agile and we have discovered that even small changes in our operating processes and shopfloor practices can have a big impact on optimising our costs. Therefore, we keep indentifying such opportunities and in fact, this has seeped into our culture and today, we focus on innovation as a means to achieve business growth.
In addition, we have a robust R&D practice that is constantly engaged in developing newer products that can be made available in different textures, shapes, sizes and designs and it is to the credit of this division that we launch the maximum number of new products every year to sustain consumer excitement. As these products mature over time, they contribute sustainably to our topline. Besides, our R&D division also constantly works on newer processes and technologies that enable us to optimise the raw material mix, minimise wastages and reduce costs.
Q Please highlight some of our market-facing strengths.
A. RAK Ceramics (Bangladesh) is the market leader. The current market constituents for the Company include construction developers, government institutions and local consumers. The Company has a strong market reputation in Bangladesh with a network of 92 dealers nationwide and receives strong support from RAK Ceramics PJSC, UAE, in terms of technological knowhow and management and marketing support.

Annual Report 2016
28
Q So what will be our focus areas in the next two to three years?
A. The key challenge for our Company today is to focus our resources on those segments of the business where we need to gain rapid market share and ensure we execute our strategies much more consistently and rapidly in all of our businesses. We will continue to build on our considerable strengths and we now need to sharpen our focus in a few key areas likes sales and marketing to achieve better execution of our plans.
Q What do you believe is the business’ greatest asset?
A. We have a powerful and sustainable asset: our associates. Travelling and working around the Group, listening to them, watching the skill, knowledge and commitment they bring to servicing our customers is inspirational. We will continue to focus on execution by investing constantly in their development and enabling them to deliver the best service every day for our customers.
Prudent and disciplined financial management! We will continue to be responsible custodians of our shareholders’
capital, both in terms of identifying investment opportunities in organic expansions and also scouting for best-fit acquisitions in which we feel we can create synergies. At the same time, we will maintain a strong balance sheet that will enable us to continue
to grow and invest in our businesses over the long-term without worrying too much about short-term market forces.

Annual Report 2016
29
Sustainability – Building a better businessRAK Ceramic’s ‘Better business’ framework comprises multiple material issues which actively support our growth, improve employee engagement, address our top risks and compliance requirements and are important to our shareholders, customers and suppliers.Our peopleOur material issues Our principles Talent management and development
We are committed to people development at every level of the organisation
Competitive pay and reward
We offer competitive compensation standards to our people
Employee engagement We value our people and actively work to improve employee engagement
Diversity and inclusion We understand, respect and value personal and cultural differences
Our products
Our material issues Our principles Product quality and integrity
We work with our suppliers to maintain excellent standards of product quality and safety
Responsible sourcing We expect our suppliers, contractors and agents to adhere to our Code of Conduct and to adopt similar standards
Promoting green and eco-friendly products
We are a positive link in the sustainable real estate construction supply chain
Our operations
Our material issues Our principles Environmental efficiency
We run efficient operations that consume less energy and produce less waste
Compliance with the law
We are committed to observing both the spirit and the letter of the law
Focus on sustainability We actively encourage the preservation of precious resources including water, paper and electricity among our showrooms and offices
Our communities
Our material issues Our principles Active corporate citizenship
We voluntarily contribute our time and our financial support to the communities in which we work
Social responsibility investments
We have a well-structured CSR policy and invest in high-impact activities including healthcare and education among others

Annual Report 2016
30
RAK Ceramic’s five cornerstones:
Upholding family values
We have relationships that have been built throughout the Group that make it like a
family.
Being the best Our belief is that the best
people create the best company.
Keeping people safe
Staying safe is our highest priority.
Making decent returns
We focus on doing the right thing and doing things right.
Working for our customers
Building good customer relationships is key – it leads
to loyalty and repeatable business opportunities.

Annual Report 2016
31
Executive ManagementWith a recovery in our core markets, at our Company, together we will put optimum effort to continue pursuing our overarching mission of creating, maintaining, repairing, refurbishing and improving the built environment; in essence, helping to build Bangladesh.
Annual Report 2016
32
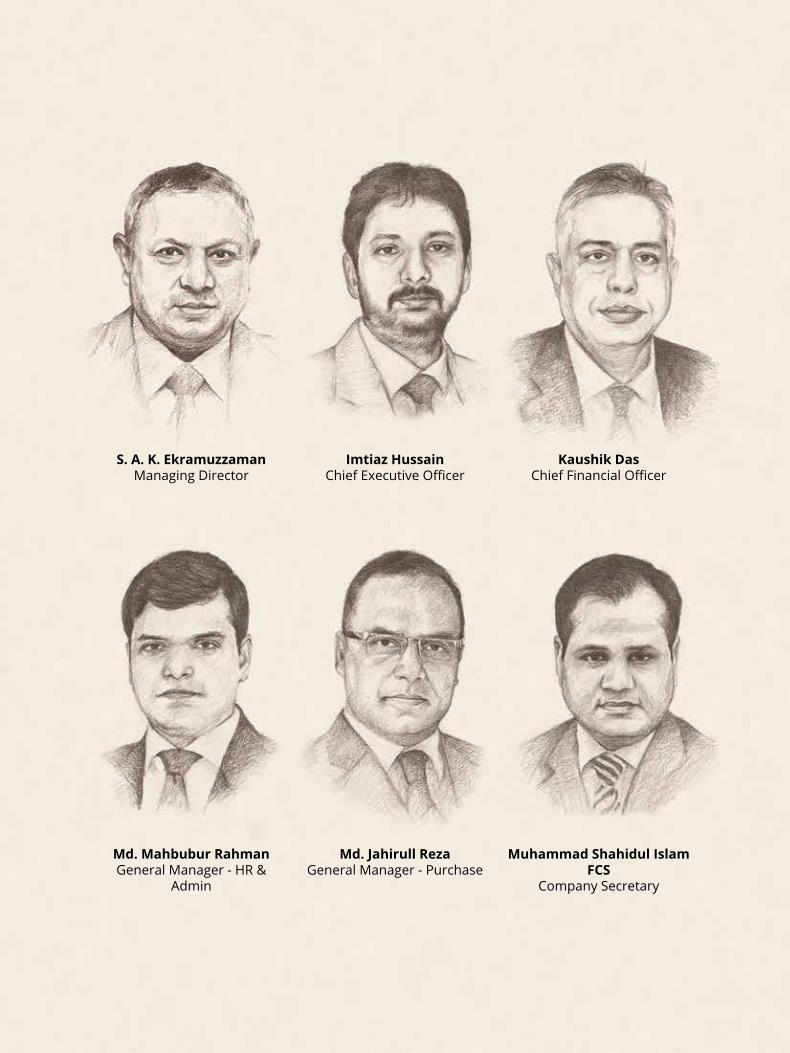
S. A. K. EkramuzzamanManaging Director
Md. Mahbubur Rahman General Manager - HR &
Admin
Imtiaz HussainChief Executive Officer
Md. Jahirull RezaGeneral Manager - Purchase
Kaushik DasChief Financial Officer
Muhammad Shahidul Islam FCS
Company Secretary
Annual Report 2016
33
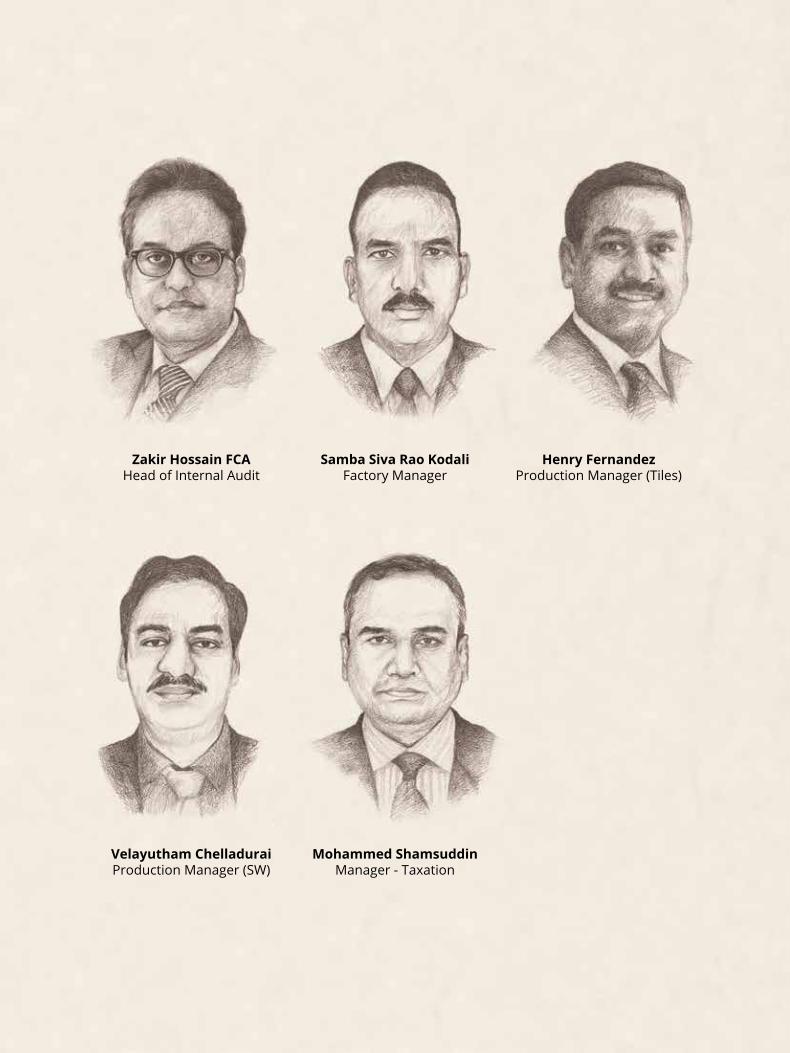
Zakir Hossain FCAHead of Internal Audit
Velayutham ChelladuraiProduction Manager (SW)
Mohammed ShamsuddinManager - Taxation
Samba Siva Rao KodaliFactory Manager
Henry FernandezProduction Manager (Tiles)

Annual Report 2016
34
Management Discussion and AnalysisGlobal economy Global economic growth for 2016 is 2.4 percent and pick up to 3 percent by 2018. Due to emerging market and developing economies are facing stronger headwinds, including weaker growth among advanced economies and low commodity prices. Commodity-exporting emerging market and developing economies have struggled to adapt to lower prices for oil and other key commodities. Growth in these economies is projected to advance at a meager 0.4 percent pace this year, whereas growth in commodity
World Tile Consumption (MSM)The world tile consumption increased by 0.66 percent to 12,175 sqm mn in 2015 from 12,095 sqm mn in 2014. The consumption of tile was shortage of 180 sqm mn in 2015 against the production.
importers has been more resilient. (Source: World Bank, Global Outlook)
Global ceramic tiles industryThe worldwide ceramic tiles market is spread across Latin America, North America, Asia Pacific, Europe and the Middle East and Africa. Currently, the highest consumption of ceramic tiles is being reported in Asia Pacific. In 2015, the region accounted for a share of 65.6% of the overall demand for these tiles in the world. The rapid urbanization has given significant rise to construction activities in emerging Asian economies over the last few years.
Country CY’11(Sqm mn)
CY’12(Sqm mn)
CY’13(Sqm mn)
CY’14(Sqm mn)
CY’15(Sqm mn)
China 4,800 5,200 5,700 6,000 5,970Brazil 844 866 871 903 899India 617 691 750 825 850Iran 475 500 500 410 300Spain 392 404 420 425 440Indonesia 320 360 390 420 370Italy 400 367 363 382 395Turkey 260 280 340 315 320Vietnam 380 290 300 360 440Mexico 219 229 228 230 242Total 8,707 9,187 9,862 10,270 10,226World Total 10,599 11,194 11,913 12,409 12,355
(Source: Ceramic World Review)
Country CY’11(Sqm mn)
CY’12(Sqm mn)
CY’13(Sqm mn)
CY’14(Sqm mn)
CY’15(Sqm mn)
China 4,000 4,250 4,556 4,894 4,885Brazil 775 803 837 853 816India 625 681 748 756 763Mexico 395 375 350 280 216Vietnam 360 254 251 310 400Indonesia 312 340 360 407 357Saudi Arabia 203 230 235 244 263

Annual Report 2016
35
Outlook: An upswing in construction activities, owing to the increasing urbanization, is boosting the demand for ceramic tiles significantly across the world. The global tile market is expected to double its value by 2018 (from five years ago) to just over $102 billion, while the global sanitary ware value will expand by one-third to $33 billion, all of these meaning the growing need for production in low-wage countries like Bangladesh. Asian countries produce over two-thirds of global production with China (37%), Brazil (7%), India (6%), Iran (4%), Italy (4%) and consumes two-thirds of the global supply.
(Source: Ceramic Review in Financial Express in 02 January 2017)
Bangladesh economy Bangladesh’s economy is the second fastest growing major economy of 2016, with a rate of 7.1%. In the decade since 2004, Bangladesh averaged a GDP growth of 6.5% that has been largely driven by its exports of readymade garments, remittances and the domestic agricultural sector. In 2016, per-capita income was estimated as per IMF data at US$ 3,840 (PPP) and US$ 1,466 (Nominal). The economy faces challenges of infrastructure bottlenecks, insufficient power and gas supplies, bureaucratic corruption, natural calamities and a lack of skilled workers.
(Source: Wikipedia, Bangladesh’s economy)
Outlook: As per the ambitious Vision 2021 and Sixth Five Years Plan (2011-2015) the country targets to attain a GDP growth rate of 7.50 percent by 2017. Other key parameters include reducing the unemployment rate to 15 percent and targeted to produce 24000 MW by 2021 and make provisions to meet the expected demand.
Ceramic industry and optimismProduction: Presently, around 54 ceramic factories manufacture porcelain wares - tiles, tableware and sanitaryware. A third of them are tableware producers and most of the rest are tile and sanitary plants. The present investment in ceramics industry is more than 50 billion. Aggregate annual production capacity of sanitary is 115,000 tonnes and tableware is 250 million pieces and 48% is export oriented and 70 million sqm for tiles.
Consumption: An estimate by Bangladesh Ceramic Ware Manufacturer and Exporters Association shows that despite tremendous local industry growth, the country still imports between 25-35 percent of the tiles consumption to fulfill the demand. According to estimates, the local consumption of
The country’s economic growth during the last few years is also significantly higher compared to the global economic growth of emerging and developing economies.
7.05 6.50 6.12 6.01 6.52
2016 2015 2014 2013 2012
Real GDP Growth (%)
1,466 1,314 1,080 1,010 950
2016 2015 2014 2013 2012
GNI Per Capital (US$)
Country CY’11(Sqm mn)
CY’12(Sqm mn)
CY’13(Sqm mn)
CY’14(Sqm mn)
CY’15(Sqm mn)
USA 194 204 230 231 254Russia 181 213 231 219 192Turkey 169 184 226 215 234Total 7,214 7,534 8,024 8,409 8,380World Total 10,436 10,932 11,574 12,095 12,175

Annual Report 2016
36
porcelain tableware is Taka 3.25 billion and export was Taka 3.60 billion export of tiles was Tk 120 million and local sale Tk 18.50 billion in fiscal year 2014-15 according to BCWMA.
The Bangladesh advantage: The Bangladeshi ceramic industry, despite a slowdown in many other manufacturing sectors, continues to grow at a healthy 15 percent a year, reflecting growing external and internal demand owing to cheap natural gas, the prime energy source required to manufacture the products. The country enjoys comparative advantages in manufacturing ceramic products, as it is gas based, labour intensive and skill-oriented. Value addition in ceramics stands at nearly 70 percent.
Investments: The ceramics industry of Bangladesh has invested about Taka 5,000
crore in the past decade. More than 54 ceramic factories are operating in Bangladesh and more than 100 thousand people of our country are directly or indirectly related ceramics industry.
Demand of Real Estate: The real estate sector is the growth centre for the development of the economy. As one of the most densely populated countries in the world, Bangladesh has been experiencing severe housing shortages. With the majority of the population in the middle and low-income groups, ensuring housing for all is difficult here. The private sector housing developers have met a large proportion of the national housing demand in the last 40 years.
Annual Report 2016
37
RAK Ceramics (Bangladesh) Limited has a strong base to identify the risk of future uncertainty with the change of local and global economy. The company is always identify the key business risks and ensures the mitigation plans of those risks. The management of the company reviewed and adopted the best practices of the industry that enable the company to achieve its ultimate objectives.
Risks are defined as uncertainties resulting in adverse variations of profitability or in losses, financial or otherwise. The core risk areas of the business operation are industry risks, market risks, quality risk, forex and funding risks, technology related risks, liquidity risk that includes foreign exchange risk, interest rate risk etc. Some of these risks and their mitigation are discussed elaborately as under:
Industry risksIndustry risk refers to the risk of increased competition from foreign and domestic sources leading to lower prices, revenues, profit margins, market share etc which could have an adverse impact on the business, financial condition and results of operation.
MitigationRAK Ceramics (Bangladesh) is known in the market as innovative technology driven capital intensive company, it has track record to upkeep with technology investment which proven them as trend setters. Also due to its superior quality and competitive pricing, wide variety of product range, the Company has been able to capture a dominant position in the market and has a brand equity presence in the local market.
Globally-benchmarked product quality ensures that the Company provides quality matching with imports at a lower price.
The strong world-wide network of the parent company brings the latest designs in Europe to the Company’s manufacturing facilities and makes the same available locally.
The Company is continuously working on product development through research and development (R&D), improved designs and service to keep pace with the customer choices, fashion and design. The company being a market leader in the ceramic tiles and sanitary ware products in Bangladesh has already captured over one fourth of the tiles market and more than two third of the sanitary ware market. As a result, company is quite well insulated from the risks of greater competition from both local and foreign sources.
Market RisksMarket risk refers to the risk of adverse market conditions affecting the sales and profitability of the company. Mostly, the risk arises from falling demand for the product or service which would harm the performance of the company.
MitigationRAK has strong brand equity in the local market and due to their foreign affiliation; they are able to produce quality products at affordable prices. Moreover, for a growing economy like Bangladesh, there would always be demand for Tiles and Sanitary Ware. The Company enjoys brand equity owing to its foreign affiliation and is continuously capturing new markets with new products.
Quality risksQuality risk management is a systematic process for the identification, assessment and control of risks to the quality of the products across the product lifecycle. A compromise in product quality could result in customer and brand attrition.
MitigationThe Company emerged as the first Bangladeshi Company in its industry to be awarded the prestigious ISO 9001: 2008 certification by the UKAS accredited internationally recognized certification
Risks Management and Control Environment

Annual Report 2016
38
agency BVQI in May 2006. As a responsible global leader in the ceramic industry, we are maintaining our commitment to protect and preserve the environment by operating an Environmental Management System which is certified to ISO 14001:2004 standard. The Company complies with ISO 13006:2012 (E), the latest international standard for ceramic tile; locally known as BDS ISO 13006:2012. The Company’s sanitary ware complies with the quality criteria of BDS 1162:2012. Both tiles and sanitary products are BSTI-approved. The Company also awarded as ‘Superbrand’ in 2010, first time in Bangladesh. The ceramic tiles and sanitary wares are continuously tested in the factory’s own laboratory and following BS EN ISO 10545:2013 and BS EN 997:2012 standards respectively.
The Company received the Superbrand status, the only player in its sector with this recognition for impeccable product quality.
Cost inflation risksCost inflation risks relating to increase in raw material, power, fuel, freight and manpower costs.
MitigationRAK Power Pvt. Ltd. (100% subsidiary of RAKCBD) is the 10MW captive power unit which supplies uninterrupted power to RAKCBD factory at a lower price than that of the government which helps RAKCBD to run the production of the factory smoothly
The natural gas connection replaced high cost propane gas, optimising energy costs.
The Company is largely insulated from fuel cost hikes as its plants are proximate to two major ports, railway station and airport.
The Company has undertaken numerous process optimization initiatives to reduce costs.
Interest rate risksInterest rate risk is concerned with borrowed funds of short term and long-term maturity. Interest rate risk is the risk that company faces due to unfavorable movements in the interest rates.
Unfavourable interest rate movements caused by volatile money markets and a
growing demand for capital could impact the Company’s ability to raise cheap funds.
MitigationRAK Ceramics (Bangladesh) is a cash rich company and operates with low independence on long term debt. The Company possess robust retained earnings of Taka 1,269.57 mn, strong cash and bank balance of Taka 802.64 mn and a low debt-equity ratio of 0.19 as at 31 December 2016, showcasing its ability to raise low-cost debt for prospective needs.
Currency riskExchange rate risk is quite relevant for RAK Ceramics (Bangladesh) Limited since a large proportion of its raw material requirements in foreign currency. Unfavorable currency fluctuations could affect profitability.
MitigationThe Company has the policy to enter into safe forward contracts allowed as per the forex policy of the Central Bank in order to cushion itself against foreign currency and price escalation risks.
The parent Company possesses a database of over 2,500 global suppliers dealing with it for more than 18 years. The Company leverages its parent Company’s monthly global resource planning exercise, which takes care of resource procurement schedules and currency fluctuation escalations. The Company hedges exchange rate risks through the strategic procurement of raw materials and consumables as well as the forward booking of foreign currency.
Regulatory risksThe Company operates under the Companies Act, 1994, and other related regulations, Income Tax Ordinance 1984, Income Tax Rules 1984, Value Added Tax (VAT) Act, 1991 and Value Added Tax (VAT) Rules, 1991. Abrupt regulatory changes could affect the Company’s business.
MitigationThe government has targeted GDP growth of 7.50 percent by 2017. It has also targeted the country’s industry contribution at 40 percent of GDP. Unless any policy change negatively and materially affects

Annual Report 2016
39
the industry as a whole, the business of the Company is not expected to be affected significantly. Bangladesh’s ceramic industry is an emerging sector with considerable local demand for differentiated products.
The health of Bangladesh’s real estate sector is directly affected by the prospects of its ancillary Industries (including tiles and sanitaryware).
Technology related RisksTechnology always plays a vital role for the existence of any industrial concern, ensuring better services to the customers and minimizing the cost in various aspects. The production facilities of the company are based on currently available technology. Any invention of new and more cost effective technology may cause technological obsolescence and negative operational efficiency.
MitigationThe Company is a subsidiary of RAK Ceramics PJSC, UAE. It enjoys access to and deploys the latest technology in its manufacturing facilities. The Company adopted the most advanced Italian technology for the production of tiles and sanitaryware.
The Company remained at the cutting-edge of technology, earning the reputation of pioneering new technology in Bangladesh.
The Company invested in a full-fledged R&D team to facilitate the absorption of new technologies with moderate investments.
The Company has access to international/multinational companies for supplying
appropriate technology and technical management support for operation of new projects & its foreign affiliation with RAK Ceramics PJSC, UAE for technical know-how and technical assistance, the company is expected to be always ahead of the other producers in the local market which ultimately reduces the technology related risks for the company.
Management risksTurnover of key managerial personnel, executives and officers may have adverse impact on business, operating results and future growth.
MitigationThe Company places a priority on developing human resources. Importance is given to on-the-job, in-house and external training programmes for members to enhance their knowledge curve. The company has reputation for cordial and congenial working environment. The staff turnover ratio is at its lowest point. The company has been arranging training of its core personnel on a continuous basis to cope with the growing challenges of the changing work environment.
The Company has been offering competitive emoluments to employees of all ranks, encouraging professionalism. The Company provided 5 percent of profit before tax towards employees’ profit participation and welfare fund.

Annual Report 2016
40
General Review of Performance of The CompanyReview of BusinessRAK Ceramics (Bangladesh) is the country’s largest and most respected tiles and sanitaryware brand. The Company has anchored this position on the basis of its market-leading capacities, world-class manufacturing assets, high production utilization, optimized cost structures, vibrant sales and distribution network and robust customer engagement programs.
Revenues increased by 11.90 percent to BDT 5,661.41 mn in 2016 from BDT 5,059.30 mn in 2015.
Gross profit increased by 11.42 percent to BDT 2,409.36 mn in 2016 from BDT 2,162.41 mn in 2015.
Profit after tax (PAT) decreased by 16.37 percent to BDT 915.25 mn in 2016 from BDT 1,094.34 mn in 2015.
EBITDA decreased by 2.46 percent to BDT 1,713.73 mn in 2016 from BDT 1,756.90 mn in 2015.
EPS decreased by 16.31 percent to BDT 2.72 per share in 2016 from BDT 3.25 per share in 2015.
DerivatesEBITDA margin decreased by 4.46 percent to 30.27 percent in 2016 from 34.73 percent in 2015.
PAT margin decreased by 5.46 percent to 16.17 percent in 2016 from 21.63 percent in 2015.
ROCE decreased by 13.53 percent to 19.81 percent in 2016 from 22.91 percent in 2015.
AnalysisInterest income was BDT 17.14 mn in 2016.
Invested BDT 567.74 mn (BDT mn 7,668.62 as on 31 December 2016 from BDT 7,100.88 mn as on 31 December 2015) in its gross block in 2016.
Maintained a strong debt-equity ratio 0.19 to against 0.20 as on 31 December 2015.
Analysis of Income StatementThe Company’s strong performance is mirrored in the Profit or Loss and other comprehensive income.
RevenueThe topline grew by 11.90 percent compared to previous year.
Revenue mix: The ceramics business accounted for a significant share of the Company’s revenue; other businesses (power and security) made contributions in growth of Group top line.
Ceramics: Revenues increase by 11.26 percent to BDT 5,577.44 mn in 2016 from BDT 5,013.04 mn in 2015. Profit after tax (PAT) increase by 21.05 percent to BDT 914.26 mn in 2016 from BDT 755.28 mn in 2015. Foreign exchange gain in 2016 is BDT 3.87 mn as compared to gain of BDT 11. 37 mn in 2015.
Power: Profit after tax decreased by 3.07 percent to BDT 96.66 mn in 2016 from BDT
Key Highlights 2016(Amount in BDT mn)
Particulars 2016 2015Sales 5,661.41 5,059.30Gross Profit 2,409.36 2,162.41PAT 915.25 1,094.34EBITDA 1,713.73 1,756.90EPS (Absolute BDT) 2.72 3.25

Annual Report 2016
41
99.72 mn in 2015 with increased in sales by11.96 percent to BDT 373.99 mn in 2016 from BDT 334.04 mn in 2015.
Security: Profit after tax increased by 12.81 percent to BDT 7.83 mn in 2016 from BDT 6.94 mn in 2015 with increased in sales by around 108.33 percent to BDT 153.54 mn in 2016 from BDT 73.70 mn in 2015.
Operating Profit: Net operating profit decreased by 7.23 percent to BDT 1,350.70 mn in 2016 from BDT 1,456.00 mn in 2015.
Cost of goods sold: Cost of goods sold has increased by BDT 355.16 mn in 2016 than 2015 in tandem with revenues.
Raw materials: Raw material cost increased in Sanitary Ware by BDT 503.00 mn due to increase of production quantity while raw material cost reduced in Tiles by BDT 2.11 mn due to change in product formulation and portfolios. Operational efficiency and innovative waste management optimized input consumption volume.
Labour costs: Labour cost increased by BDT 121.39 mn (head count increased in SW 11 persons and from Tiles by 118 persons). Another impact in the labour cost is the revision in emoluments in tandem with country inflation.
Direct expenses: Manufacturing overhead (excluding direct labour) Increased by BDT 274.69 mn in 2016 mainly due to spares, repairs, maintenance, packing expenses and depreciation.
Administrative expenses: Administrative expenses decreased by BDT 468.35 mn mainly due to write-off loan of subsidiary and increase in head count by 07 members in the group.
Marketing expenses: Marketing expenses increase by BDT 16.25 mn mainly due to increase in sales quantity.
Operating expenses
The Company’s operating expenses (operating, marketing and administrative) decreased by 2.22 percent to BDT 4,374.88 mn in 2016 from BDT 4,471.82 mn in 2015 in tandem with operational volume and country inflation. Operating cost as a proportion of sales decreased by 11.11 percent in 2016 against 2015.
Financial expensesInterest expenses increased to BDT 38.24 mn in 2016 on account of Short term loan for import of raw materials. There was no foreign exchange losses in 2016. Bank charges increased to BDT 1.78 mn in 2016 from BDT 1.43 mn in 2015.
Analysis of the Balance SheetShareholders Fund: Shareholders fund increased by 1.21 percent to BDT 6,111.73 mn in 2016 from BDT 6,038.59 mn in 2015.
Non-current assets:Property, Plant and Equipment (Fixed Assets): There has been an addition of BDT 2,086.19 mn in 2016 to the gross block of the fixed assets in the following areas: factory building is BDT 399.14 mn, factory office building is BDT 2.13 mn, purchase of plant and machinery is BDT 1,570.82 mn, mobile plant is BDT 13.30 mn, electrical instalment is BDT 58.19 mn, Gas pipeline is BDT 21.51 mn, furniture & fixture is BDT 2.57 mn, office vehicles for BDT 5.14 mn, office equipment is BDT 3.92 mn, tools and appliances is BDT 8.33 mn and communication equipment is BDT 1.13 mn.
Intangible assets: Expenditures to acquire designs, developments, brand, trademarks and various licenses for manufacturing
Operating cost matrix:
Particulars2016 2015 Increase/
(Decrease) (%)
Amount(BDT mn)
Proportionof sales (%)
Amount(BDT mn)
Proportionof sales (%)
Cost of Goods Sold 3,252.05 57.44 2,896.89 57.26 0.18Marketing Expenses 704.32 12.44 688.07 13.60 (1.16)Administration Expenses
418.50 7.39 886.86 17.53 (10.14)

Annual Report 2016
42
of ceramic tiles, sanitaryware and pharmaceutical products are capitalised. The amortization policy covers the period upto the expected tenure of accrual of benefits derived from the particular asset.
Capital work-in-progress: The Company invested BDT 28.73 mn in heavy equipment in its ceramic tiles and saniteryware facility which is expected to be commissioned in the coming year. Capital work in progress also includes construction work for factory building, plant & machinery, furniture and fixture, communication equipment and mobile plant.
Cash and bank balance: Cash and bank balances include cash in hand BDT 9.88 mn, balances in bank accounts BDT 281.324 mn and Fixed Deposits BDT 511.44 mn. The liquid balances of cash and bank are in commensurate with the smooth functioning of the business.
Equity and liabilitiesCapital and reserves: The equity capital comprised 336,850,611 equity shares of BDT 10 each (face value). The market value of the share is BDT 61.90 (31 December 2016) resulting into market capitalization of BDT 20.85 bn.
Non-current borrowings: Non-current borrowings include BDT 594.93 mn as foreign currency long term loan in 2016 for Tiles and Sanitary ware plant expansion.
Current assets:Inventory: Inventory comprises of Finished Goods BDT 387.94 mn, Raw Materials BDT 831.01 mn and Stores & Spares BDT 1,082.97 mn and Goods in transit BDT 129.41 mn. The Company has a policy of maintaining adequate inventory of key inputs to ensure uninterrupted operations.
Trade and other receivables: These largely comprise of trade receivables where average receivables cycle is 45 days.
Current borrowings: Current borrowings include short term loans BDT 278.10 mn for offshore financing and BDT 259.95 mn as current portion of foreign currency long term loan.
Current Liabilities: Current liabilities increased by 2.47 percent to BDT 4,332.52 mn in 2016 from BDT 4,218.33 mn in 2015.
Fixed assets additionsDuring the year 2016 total additions to the fixed assets including subsidiary companies was BDT 2,086.19 mn. The major additions to the fixed assets were factory building, office building, purchase of plant and machinery, mobile plant, electrical installment, Gas pipeline, furniture & fixture, office equipment, communication equipment, tools and appliances, office vehicles etc.
Asset composition
Particulars2016 2015 Increase/
(Decrease) (%)
Amount (BDT mn)
Proportionof sales (%)
Amount(BDT mn)
Proportionof sales (%)
Non-Current assets 4,114.61 36.88 4,011.70 37.31 (0.43)Current assets 7,042.98 63.12 6,741.66 62.69 0.43Total 1,1157.59 100 10,753.36 100 -
Investment matrix-parent to subsidiaries (Amount in BDT mn)
Company Relation As on 1 January 2016
Net addition During 2016
As on 31 December 2016
RAK Power Pvt. Ltd. Subsidiary 341.63 Nil 341.63RAK Security and Services (Pvt.) Ltd. Subsidiary 18.75 Nil 18.75
Annual Report 2016
43
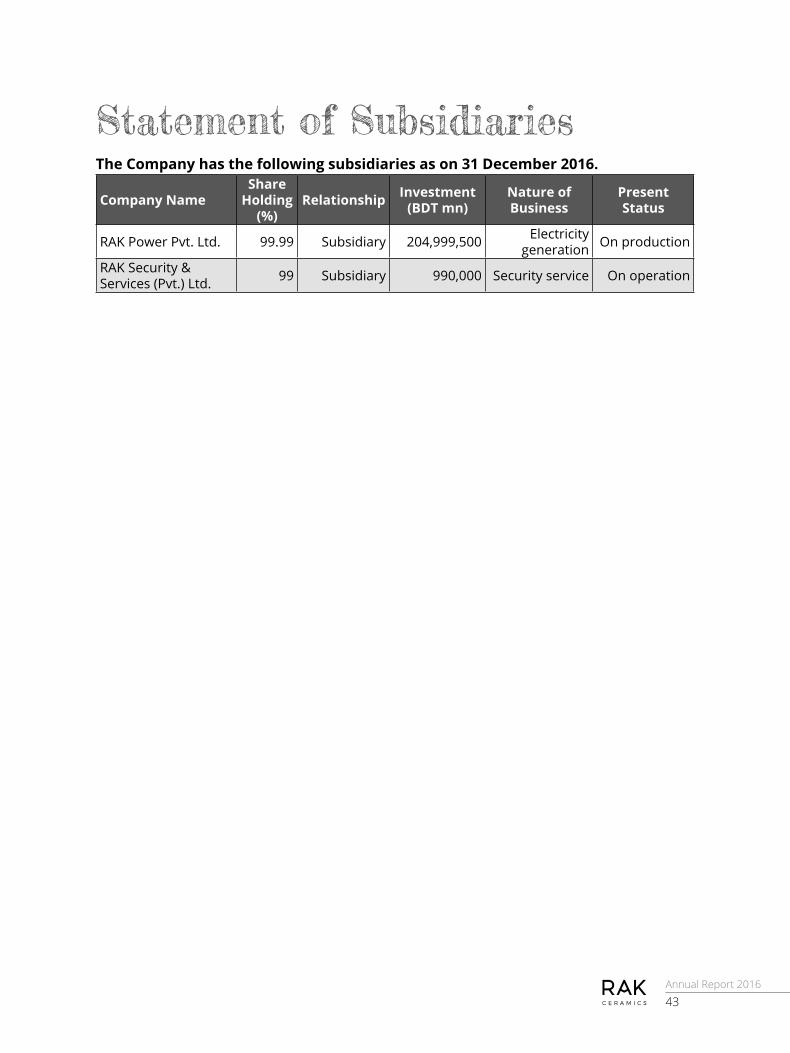
Statement of SubsidiariesThe Company has the following subsidiaries as on 31 December 2016.
Company NameShare
Holding (%)
Relationship Investment (BDT mn)
Nature of Business
Present Status
RAK Power Pvt. Ltd. 99.99 Subsidiary 204,999,500 Electricity generation On production
RAK Security & Services (Pvt.) Ltd. 99 Subsidiary 990,000 Security service On operation

Annual Report 2016
44
Corporate Social ResponsibilityAs an integral part of our culture and core values, Corporate Social Responsibility (CSR) is a characteristic of our good corporate citizenship. We believe in aligning our business progress with the development of the overall economic growth. Beside our own CSR venture, our active affiliation with different government and non-government organizations tend to elevate the individual economic growth of the mass people.

Annual Report 2016
45
Corporate Social Responsibility
Corporate social responsibility is at the heart of RAK Ceramics’ business values and we recognize that many of our stakeholders, from site neighbours and employees through to customers and investors, have rising expectations of our corporate responsibility commitment and performance.
While each of our business values has a corporate responsibility context, it is our value of integrity, which guides us to maintain the highest ethical standards wherever we operate. We ensure the health and safety of all our people and minimize our impact on the environment through which we bring corporate social responsibility into our day-to-day business operations.
There is already a great deal of valuable activity being undertaken within all of our businesses and across our manufacturing sites. However, we have identified and agreed to the need to do more and do so in a more focused manner, as we strive to become the best-in-class standard for all of our activities.
Our values- We act ethically: We conduct all our activities fairly, honestly and with integrated policies.
- We strive to translate results and improvement: We listen and respond to the needs of our customers, then exceed their expectations, we also strive to improve across all our business parameters
-We value our people: We understand, respect and value personal and cultural differences; we are open and honest in all our dealings with our people
Green production facilitiesOur production facilities are equipped with high-efficiency burners that are utilized in all heaters to reduce energy consumption. The efficiency of fuel burning equipment such as generators, kilns, spray driers and horizontal and vertical driers, among others, are fine tuned by highly experienced and competent personnel. Waste heat from tunnel kiln is used in pre-drier in Sanitaryware plant.
Water consumption is regulated and regularly measured and data is recorded. We also analyze trends to quickly detect major leaks and repair damages as soon as possible. RAK Ceramics ensures that through regular preventive maintenance, equipment and devices that use water run smoothly and ensure that they do not consume excessive water.
RAK Ceramics operates several units of effluent treatment plants (ETPs) to recycle and re-use the waste water generated from factories. Moreover, RAK Ceramics’ employees are given extensive training on water conservation awareness to reduce unnecessary wastage of water.
Water conservationOur operations develop and execute a water management programme consistent with the Company’s strategy for suitable and quality water supply. Ceramics consider various water management options that may be divided into various groups, making it possible to pinpoint reduction possibilities:
We ensure the health and safety of all our people and minimize our impact on the environment through which we bring corporate social responsibility into our day-to-day business operations. The efficiency of our fuel burning equipment such as generators, kilns, spray driers and horizontal and vertical driers, among others, are fine tuned by highly experienced and competent personnel.

Annual Report 2016
46
1) Monitoring: Water consumption is regularly measured and checked to prevent unnecessary use. We also analyze trends to quickly detect major leaks and repair damages as soon as possible.
2) Optimisation: We see that through regular preventive maintenance, equipment and devices that water is running smoothly and is not used in excess.
3) Reuse and recycling: We operate wastewater treatment facilities to treat and process wastewater and even domestic wastewater to minimise utilisation of water resources. RAK Ceramics operates effluent treatment plants (ETP) to recycle and re-use the wastewater generated from factories. All process effluents from the factories are collected in concrete tanks through pipe channels. Owing to the recycle and re-use of in-process wastewater, RAK Ceramics saves around 80 m3 of water per day, and also reduces water pollution.
Solid waste managementWe implemented programs to minimize the disposal of waste material into the environment by adopting continuous improvement in waste segregation scheme and recycling programs which includes:
-Segregating hazardous and non-hazardous waste.
-Controlling litter and odors.
-Conducting routine inspections of waste storage areas.
- All kinds of waste is identified and segregated with the use of garbage bins that are classified as: Green garbage bins– provide for residual waste, leftover food, paper, carton, floor sweepings and other waste with no commercial value.
- Blue garbage bins– provide for metals, machine parts and accessories.
- Black garbage bins– provide for contaminated items, expired chemicals and infectious waste from clinics.
Natural resource conservation and pollution controlMinimize depletion of natural minerals; RAK Ceramics has developed the expertise to combine 5-9 types of natural minerals coming from several countries around the globe to minimize the damage on the environment.
Indoor air quality and its effect on office interiorsRAK Ceramics promotes building fit-outs that will provide a healthier indoor environment and more productive workplaces, which also have less negative impact on the environment.
Ventilated facade systemNormal ventilation system is used in the plant that is suitable for local environmental condition.
Energy-saving systemRAK Ceramics ensures that the entire logistics and operations run on the basis of procuring energy-saving systems in terms of office equipment that contributes to an environmental-friendly and socially committed organization.
Focus on creating a happier and more productive workplaceWe recognize that our Company will succeed and grow only if we attract and retain the highest quality workforce; engage talented employees dedicated to serve responsive consumers and responsibly fulfilling our Company’s mission and values.
RAK Ceramics is committed to treating its employees wellLife insurance coverage: All employees are adequately covered by life insurance policy to protect against future hazards.
Provident fund and gratuity scheme: The Company maintains a recognized contributory provident fund and an approved gratuity scheme for all employees.
Workers profit participation fund: The Company maintains workers’ profit participation fund (WPPF) as per the Bangladesh Labour Act 2006.

Annual Report 2016
47
Employee welfare fund: Financial assistance is given to the employee and his immediate family members for medical and educational purposes from the Employees’ Welfare Fund maintained by the Company.
RAK Ceramics productsRAK Ceramics is the founding member of the prestigious Emirates Green Building Council that supports and promotes sustainable buildings in the UAE. As part of its commitment to focus on ‘green building’ products, it has launched several exciting and innovative products that contribute to creating a greener and cleaner environment. The Company is proud of its many performance material products, which provide excellent quality and value and often support our customers in reducing the environmental footprint.
Spreading prosperity in the societies we operate inRAK Ceramics actively promotes and engages in social contribution activities that help strengthen communities and contribute to the enrichment of the society both at the individual level and with group companies. Overall, we invested around BDT 5.74 mn for CSR activities in 2016 that encompass medicine and medical treatment, donations to hospitals and medical units, education, social and cultural activities of our country, distributing the blanket to the poverty stricken people and donations to autistic and differently-abled children organizations.

Annual Report 2016
48
Value Added StatementParticulars 31 December 2016
BDT %Revenue 7,101,333,015Other Income 24,139,245Less : Paid to suppliers for materials and services 2,011,180,315Value Added 5,114,291,945 100Distribution of Value AddedTo GovernmentIncome Taxes, Duties and Value Added Tax 2,190,583,400 42.83
To Suppliers of CapitalDividends to Shareholders 842,126,528 16.47
To EmployeesWages, Salaries, Bonus, Commissions, Pensions and other benefits
733,827,549 14.35
To Providers of FinanceInterest & Bank Charges on Borrowing 40,014,661 0.78
Retained for Reinvestment & Future GrowthDepreciation 392,485,508 7.68Retained Profit 915,254,299 17.89Total 5,114,291,945 100
ECONOMIC VALUE ADDED (EVA)Economic value added attempts to capture the true economic profit of a company. It is also provides a measurement of a company’s economic success (or failure) over a period of time.
Calculation of EVA
ParticularsAmount in
BDT2016
Net Operating Profit After Tax (NOPAT)
995,295,713
Total Capital Employed 6,835,068,670Cost of Capital in % 12%Cost of Capital (COC) 820,208,240EVA = NOPAT - COC 175,087,473
42.83%Income Taxes,Duties and Value Added Tax
16.47%Dividends toShareholders14.35%
Wages, Salaries andother Benefits
0.78%Interest & Bank
Charges onBorrowing
7.68%Depreciation
17.89%Retained Profit

Annual Report 2016
49
Directors’ ReportRAK Ceramics operates under the guidance of a host of prolific visionary leaders, who are spirited for success and possess the competence to guide the enterprise to the direction that emphasizes on sustainable growth trajectory. Starting from policy formulation to resource allocation and from operational management to excellence in corporate governance, our Board of Directors remain the instrumental stalwarts in fetching holistic success for the company.

Annual Report 2016
50
Directors’ ReportDear Shareholders,Assalamu AlaikumThe Board of Directors of RAK Ceramics (Bangladesh) Limited is pleased to present this Directors’ Report, along with Audited Financial Statements of the Company for the year ended 31 December 2016 and the Auditors’ Report thereon, for your valued consideration, approval and adoption.
Principle activitiesRAK Ceramics (Bangladesh) Limited is engaged in the manufacture and sale of ceramic tiles, bathroom sets and sanitary ware products. The Company offers a wide range of tiles and sanitary wares in ceramic sector of Bangladesh since the year 2000. Excellent designs and patterns have been created using specially selected designs for wall and floor tiles, borders, corners etc. Many of RAK Ceramic’s models come in modular designs which offer ample choice to customers through years. The unique ambience patterns created using ceramic tiles and also gres porcellanato tiles appeal to most discerning customers.
Industry OutlookThe detail about industry outlook and possible future developments in the industry is discussed in Management Discussion and Analysis on page 34 in this annual report.
Production capacityRAK Ceramics (Bangladesh) Limited presently operates with an annual standard production capacity of 11.68 mn sqm of tiles and 1.45 mn pieces of sanitary ware with over 30 active designs and widest ranges.
Business review/Operational resultsThe Company reported consolidated sales of BDT 5,661.41mn in 2016 against BDT 5,059.30 mn in 2015. The consolidated net profit after tax attributable to the equity holders of the Company was BDT 915.25 mn against BDT 1,094.34 mn in 2015. The consolidated net profit in 2015 was high mainly due to gain on disposal of subsidiary and associates. The
detail of operational results of the Company is discussed in General Review of the Performance of the Company on page 40 in this annual report.
Financial results and appropriationsThe Directors are pleased to report the financial results for the year 2016 and recommend the following appropriations:
(Amount in BDT mn)Particulars 2016 2015Profit before tax * 1,270.66 1,479.39Less: Provision for tax 355.40 385.05Profit after tax * 915.26 1,094.34Add: Un-appropriated profit brought forward
1,196.44 1,077.28
Less: Equity & non-controlling adjustment due to acquisition
- 133.05
Profit available for distribution
2,111.70 2,038.57
Less: Appropriation of dividend
842.13 842.13
Un-appropriated profit C/F 1,269.57 1,196.44* Profit before/after tax exclusive of non-controlling interest. The key operating and financial data of preceding five years is given in Annexure-1 on page 54 in this annual report.
Fixed assets additionsDuring the year 2016 total additions to the fixed assets including subsidiary companies was BDT 2,086.19 mn. The major additions to the fixed assets were factory building, office building, purchase of plant and machinery, mobile plant, electrical installment, Gas pipeline, furniture & fixture, office equipment, communication equipment, tools and appliances, office vehicles etc.
Reserve and surplusRetained earnings of the Company in 2016 stood at BDT 1,269.57 mn against BDT 1,196.44 mn in 2015.
DividendThe Board of Directors of the Company is pleased to recommend dividend @ 20% in cash and 5% in stock of the paid up capital of

Annual Report 2016
51
the Company for the year 2016.The Company paid cash dividend @ 25 percent of paid up capital of the Company for the year 2015.
Contribution to national exchequerRAK Ceramics (Bangladesh) Limited regularly pays its direct and indirect tax obligations in time. During the year 2016, RAK Ceramics (Bangladesh) Ltd. had contributed to National Exchequer total of BDT 2,190.58 mn, by way of Corporate Income tax of BDT 355.40 mn, withholding tax and vat from suppliers and service providers of BDT 244.54 mn, VAT of BDT 934.49 mn, supplementary duty of BDT 505.43 mn and other duties/taxes of BDT 150.72 mn.
Risks and concernsThe detail of risks and concerns of the Company is discussed in Risk Management and Control Environment on page 37 in this annual report.
AuditorsM/s A. Qasem & Co., Chartered Accountants (a member firm of Ernst & Young Global Limited, UK) shall retire in the 18th AGM, being eligible, they offered themselves for re-appointment and the Board also recommended re-appointing them for the year 2017. Remuneration of the auditor will be fixed by the shareholders at this Annual General Meeting.
Parent and subsidiary companies RAK Ceramics Co. PJSC, UAE is the parent company of RAK Ceramics (Bangladesh) Limited. It is a public joint stock company and is a UAE based leading tiles and sanitaryware manufacturing Company. RAK Ceramics an annual turnover approximately around USD 1 billion global conglomerate that supplies to over 150 countries and has been officially recognized as the world’s largest ceramics manufacturer with a global annual production output of 110 million square meters of tiles, 5 million pieces of sanitaryware.
RAK Ceramics (Bangladesh) Limited has two subsidiaries namely RAK Power Pvt. Ltd. and RAK Security and Services (Pvt.) Ltd. and these are fully owned subsidiary of the Company. The principal activities and status of these subsidiaries are separately disclosed in
Statement of Subsidiaries on page 43 in this annual report.
Basis for related party transactionsThe detail list of the related parties with whom transactions have been taken place and their relationship as identified and certified by management is disclosed in Related party disclosures under BAS-24 on page 113 in this annual report.
Corporate Social ResponsibilityThe Company understands its responsibility towards social welfare and contributed an amount of BDT 5.74 mn as CSR during the year under review. The detail of the CSR activities of the Company during the year is discussed in Corporate Social Responsibility on page 44 in this annual report.
Human resources and staff welfareRAK Ceramics (Bangladesh) Limited gives the highest priority on human resources and staff welfare. The Company ensures the safe and healthy working environment for its employees. The Company is currently has 1,689 full time employees. It offer well-designed compensation package for the employees to encourage professionalism, stimulate team work and promote innovation reinforced with high ethical standards. The employees of the Company enjoy benefits of Contributory Provident Fund, Gratuity Scheme and Group Life Insurance, etc. The Company established “Workers Profit Participation Fund and Welfare Fund”. In year 2016, the Company contributed 5 (five) percent of its profit before tax towards Workers’ Profit Participation and Welfare Fund amounting to BDT 61.06 mn.
Internal controlThe Board has the ultimate responsibility of establishing effective systems of internal control. To ensure the internal control regarding risk management, financial control and compliance legislation, the Company follows the principle of decentralization and delegation combined with responsibility and accountability matrix. It has been designed to mitigate the risk of failure to achieve the objectives of the Company. The Company has established internal audit department to function under an Independent Head of Internal Audit to ensure internal control and compliances in place.

Annual Report 2016
52
Board of DirectorsThe Board of Directors of the Company is comprised with 5 (Five) members including 2 (two) independent directors. Names and profiles including nature of expertise in specific functional areas of the Directors of the Company are shown in Short Profile of the Directors on page 16 in this annual report. A statement for each of their involvement in other corporate bodies within the group is disclosed in Annexure-4 on page 57 in this annual report. The Board of Directors of the Company met together 5 (Five) times for meeting during the year under review. The number of Board meeting held and the attendance of each director during the year 2016 is disclosed in Annexure-2 on page 55 in this annual report.
Appointment/re-appointment of directorsIn accordance with the Article 93, 94 and 95 of the Articles of Association of the Company, Mr. Pramod Kumar Chand will retire from his office as Director by rotation in the 18th Annual General Meeting and being eligible, offers himself for re-election in accordance with the terms of Article 96 of the Articles of Association of the Company.
Mr. Faheemul-Huq, Barrister-at-Law, has been appointed by the Board on July 27, 2016 as independent director of the Company for 3 (three) years and shall be placed for approval by the shareholders in the 18th Annual General Meeting in compliance with the condition of the corporate governance guidelines issued by the Bangladesh Securities and Exchange Commission (BSEC) on August 07, 2012.
Code of ConductIn compliance with the corporate governance, the Board has laid down a code of conduct of all Board members and annual compliance of the code is recorded accordingly. The Company did not pay any remuneration to any director including the independent directors, except board meeting attendance fee and 3% of profit before tax to Managing Director.
Pattern of shareholdingIn accordance with the condition of the corporate governance guidelines issued by
the Bangladesh Securities and Exchange Commission (BSEC) on August 07, 2012, the shareholding pattern of the Company is disclosed in Annexure-3 on page 56 in this annual report.
Financial reporting standardsThe Directors, in accordance with BSEC’s notification No. SEC/CMRRCD/2006-158/134/Admin/44 dated August 07, 2012 confirms the following to the best of their knowledge:
a. The financial statements prepared by the management of Company present fairly its state of affairs, the results of its operations, cash flows and changes in equity.
b. Proper books of accounts of the Company have been maintained.
c. Appropriate accounting policies have been consistently applied in preparation of the financial statements and that the accounting estimates are based on reasonable and prudent judgment.
d. International Accounting Standards, as applicable in Bangladesh, have been followed in preparation of the financial statements and any departure there-from has been adequately disclosed.
e. The system of internal control is sound in design and has been effectively implemented and monitored.
f. There are no significant doubts of the Company’s ability to continue as a going Concern.
g. The significant deviations from the last year’s operating results of the Company have been highlighted in the report and reasons thereof have been explained.
Corporate Governance To ensure the spirit of the corporate governance with accountability for inspiring confidence of investors, regulators, financer and other stakeholders, RAK Ceramics (Bangladesh) Limited is committed to comply with all the requirements of corporate governance as required by the Bangladesh Securities and Exchange Commission (BSEC). The detail about corporate governance is discussed in Corporate Governance Report on page 60 in this annual report.
Annual Report 2016
53
Reporting and Compliance of Corporate GovernanceThe Company has complied with the conditions of corporate governance guidelines of the Bangladesh Securities and Exchange Commission (BSEC) Notification no. SEC/CMRRCD/2006-158/134/Admin/44 dated 07 August 2012. The detail status on corporate governance along with the certificate on compliance of conditions of corporate governance has been included on page 65 in this annual report.
Membership with BAPLCBeing a publicly traded company RAK Ceramics (Bangladesh) Limited has a membership with the Bangladesh Association of Publicly Listed Companies (BAPLC). A certificate of BAPLC membership has been included on page 58 in this annual report.
Post balance sheet eventsThere are no material events which have occurred after the balance sheet/reporting date, non disclosure of which could affect the ability of the users of these financial statements to make an appropriate evaluation.
AppreciationThe Board would like to take this opportunity to thank the Government bodies, its shareholders, investors, bankers and employees for their continuous commitment, cooperation, confidence and support in achieving the Company’s objectives.
For and on behalf of the Board of Directors,
Abdallah MassaadChairmanJanuary 23, 2017Ras Al Khaimah, UAE

Annual Report 2016
54
Annexure-1Amount in BDT
Particulars 2016 2015 2014 2013 2012Sales 5,661,411,578 5,059,300,403 5,508,642,947 5,169,225,208 4,908,171,279Cost of sales 3,252,054,966 2,896,889,441 3,255,268,010 3,073,003,258 2,964,666,370Gross profit 2,409,356,612 2,162,410,962 2,253,374,937 2,096,221,950 1,943,504,909Administration expenses 418,502,413 886,856,902 344,100,573 344,071,654 354,750,752
Marketing and selling expenses 704,320,334 688,070,995 1,035,123,422 854,918,221 730,822,714
Net profit before financial expenses
1,286,533,865 587,483,065 874,150,942 897,232,075 857,931,443
Financial expense 40,014,661 18,935,684 44,080,102 44,737,610 40,361,152Other income* 24,139,245 910,848,168 80,195,921 95,327,515 39,382,333Net profit before taxation 1,270,658,449 1,479,395,549 910,266,761 947,821,980 856,952,624
Income tax expenses 355,403,678 385,055,782 422,191,844 358,296,602 356,741,639
Non controlling interest 472 487 (74,724,435) (92,892,932) (107,912,172)
Net profit after taxation 915,254,299 1,094,339,280 562,799,352 682,418,310 608,123,157
*Other income includes interest income, dividend income, rental Income, forex gain and profit on sale of fixed assets.
Key operating and financial data of preceding five years

Annual Report 2016
55
The number of Board meetings held and the attendance by each director during the year 2016
Annexure-2
Name of directors PositionNumber of
meetings held while a member
Number of meetings attended
Mr. Abdallah Massaad(Nominee of RAK Ceramics PJSC, UAE) Chairman 05 04
Mr. S.A.K. Ekramuzzaman Managing Director 05 05
Mr. Khaled Abdulla Yousef Abdulla Aal Abdulla (Nominee of RAK Ceramics PJSC, UAE)
Director till July 27, 2016 04 Nil
Mr. Pramod Kumar Chand(Nominee of RAK Ceramics PJSC, UAE) Director 05 04
Mr. Rafique-ul Huq,Barrister-at-Law
Independent Director till July
27, 2016 04 04
Mr. Faheemul HuqBarrister-at-Law
Independent Director 01 01
Mr. Wassim Moukahhal Independent Director 05 03

Annual Report 2016
56
Annexure-3The pattern of Shareholding as on 31 December 2016
a) Parent/Subsidiary/Associated companies and other related partiesName Status/Position No. of Shares heldRAK Ceramics Co. PJSC, UAE Parent Company 241,410,021
b) Directors /CEO/CS/CFO/Head of Internal Audit and their spouses and minor children.Name Status/Position No. of Shares heldMr. Abdallah Massaad (Nominee of RAK Ceramics PJSC, UAE) Chairman 14
Mr. S.A.K. Ekramuzzaman Managing Director 13,211,985Mr. Pramod Kumar Chand (Nominee of RAK Ceramics PJSC, UAE) Director Nil
Mr. Faheemul Huq, Barrister-at-Law Independent Director 81,906Mr. Wassim Moukahhal Independent Director NilMr. Imtiaz Hussain Chief Executive Officer NilMr. Kaushik Das Chief Financial Officer NilMr. Zakir Hossain Head of Internal Audit NilMr. Muhammad Shahidul Islam Company Secretary Nil
c) Shareholding status of top 5 salaried employees other than CEO, CS, CFO & HIAName Status/Position No. of Shares heldMr. Mahbubur Rahman GM-HR & Admin 40,698Mr. Mohammad Jahirull Reza GM-Purchase NilMr. Rajib Kumar Saha Head of Performance
Management OfficeNil
Mr. Md. Azimul Hossain IT Business Lead Manager
Nil
Mr. Mohammed Shamsuddin Manager- Taxation Nil
d) Shareholders holding 10% or more voting interest in the company.Name Status/Position No. of Shares heldRAK Ceramics Co. PJSC, UAE Parent Company 241,410,021

Annual Report 2016
57
Annexure-4Directors’ involvement in other organization within the group
Directors Involvement in other organization within the group
Name Position Name of the Company Position
Shareholding on 01.01.2016
Shareholding on 31.12.2016
No. of shares
Amount (BDT mn)
No. of shares
Amount (BDT mn)
Mr. Abdallah Massaad Chairman
RAK Power Pvt. Ltd. Chairman Nil Nil Nil NilRAK Security and Services (Pvt.) Ltd. Chairman Nil Nil Nil Nil
Mr. S.A.K. Ekramuzzaman
Managing Director
RAK Power Pvt. Ltd. Director Nil Nil Nil NilRAK Security and Services (Pvt.) Ltd. Director Nil Nil Nil Nil
Mr. Pramod Kumar Chand Director
RAK Power Pvt. Ltd. Director Nil Nil Nil NilRAK Security and Services (Pvt.) Ltd. Director Nil Nil Nil Nil
Mr. Faheemul Huq,Barrister-at-Law
IndependentDirector
RAK Power Pvt. Ltd.Independent
Director Nil Nil Nil Nil
RAK Security and Services (Pvt.) Ltd.
IndependentDirector Nil Nil Nil Nil
Mr. Wassim Moukahhal
IndependentDirector
RAK Power Pvt. Ltd. IndependentDirector Nil Nil Nil Nil
RAK Security and Services (Pvt.) Ltd.
IndependentDirector Nil Nil Nil Nil

Annual Report 2016
58
Membership Certificate of BAPLC

Annual Report 2016
59
Awards and Recognitions
RAK Ceramics (Bangladesh) has been awarded the “First Position” in the “16th ICAB National Award for Best Presented Annual Report 2015” in the manufacturing category as a mark of excellence in corporate reporting.
The Company also received the “Certificate of Merit” in the “Best Presented Annual Report Awards and SAARC Anniversary Awards for Corporate Governance Disclosures 2015” by the south Asian Federation of Accountants (SAFA).
The Company has been awarded the “Bronze Award” in the “ICSB
National Award 2015” for Corporate Governance Excellence.

Annual Report 2016
60
Corporate GovernanceRAK Ceramics has established a benchmark of effective corporate governance practices that corresponds to the core values of the enterprise and amplifies its promise for operational excellence at every sphere. Best articulated through sustained growth that the company has maintained, corporate governance efforts at RAK Ceramics is emblematic to the distinction the business has achieved.

Annual Report 2016
61
Corporate Governance ReportCorporate governance refers to the structures and processes for the direction and control of companies. Sound corporate governance is a fundamental part of the culture of the company and ensures long term success. The company believes in adopting the best practices in the area of Corporate Governance and follows the principles of transparency and accountability, thereby protecting the interests of management, Board of Directors, controlling shareholders, minority shareholders and other stakeholders.
Strong corporate governance works as the backbone of an upright organization. The Company and its Board of Directors accordingly, remain dedicated in its commitment towards maintaining excellence in corporate governance. The Board of Directors of RAK Ceramics is firmly committed to upholding principles of sound corporate governance. The main objective of corporate governance is creation of lasting value for stakeholders. Transparency in business transaction and disclosure of information to regulatory bodies as part of its legal obligations constitute sound corporate governance. Good corporate governance also means conformity to sound ethical principles and a code of conduct in business dealings.
At RAK Ceramics, we believe in transparency and commit ourselves to adherence to good corporate governance practices at all times, as we believe that good governance generates goodwill among business partners, customers and investors and helps the company grow.
Board of DirectorsThe Board of Directors is juxtaposed between the shareholders and operational management of the organization. Directors are elected or appointed by the shareholders. The Board of Directors is responsible for operation of the company for best interest of its shareholders and accountable to the shareholders.
Composition of the BoardThe Board of Directors of RAK Ceramics (Bangladesh) Limited comprised of 05
(Five) members including two independent directors in compliance with the corporate governance guidelines of the BSEC. Board of Directors is performing the responsibilities, among others, setting the company’s strategic objectives, providing leadership, supervision and safeguarding shareholders’ interest. The Company has a nonexecutive Chairman and Managing Director, separately. The day-to-day management of the Company is conducted by the Managing Director who is assisted by the executive management.
Board ProcedureTo ensure transparency, the Board follows the practice of advance planning in matters requiring discussion and decision by the Board. The Board is appraised the presentation on finance, sales, marketing, major business segments and operations of the Company and other matters, as the members want. The Managing Director along with the Company Secretary finalizes the agenda papers for the Board meeting in consultation with the other person concerned. The minutes of the proceedings of each Board meeting are maintained in terms of statutory provisions.
The Board of Directors of RAK Ceramics (Bangladesh) Limited has been laid down a Code of Conduct of all Board members and annual compliances of the code has been recorded.
Committee of the BoardIn accordance with the requirement of corporate governance of the BSEC, RAK Ceramics (Bangladesh) Limited has an Audit Committee as a sub-committee of the Board of Directors.
Audit CommitteeThe Audit Committee assists the Board of Directors in ensuring a good monitoring system within the business. The Audit Committee is responsible to the Board and the duties and responsibilities of the Audit Committee are clearly set forth in writing by the Board in the Audit Committee Charter. According to the corporate governance

Annual Report 2016
62
notification of BSEC, the audit committee reports to-a) The Board of Directorsb) The authoritiesc) The shareholders and general investors The number of the Audit Committee meeting held and attendance of each member during the year 2016 are as follows:
The detail about Audit Committee including background, composition, responsibilities, meetings, reporting and activities carried out by the Audit Committee is disclosed in this annual report in “Report of Audit Committee” signed by the Chairman of the Committee.
Chairman of the Board and Chief Executive OfficerThe position of the Chairman of the Board and the Managing Director of RAK Ceramics (Bangladesh) Limited filled by different individuals. The Chairman of the Company is elected among the directors of the Company. In addition, RAK Ceramics (Bangladesh) Limited has also appointed a Chief Executive Officer (CEO) of the Company. The Board of Directors also clearly defined respective roles and responsibilities of the Chairman, the Managing Director and the CEO in addition to their roles and responsibilities as per Articles of Association of the Company.
Chief Financial OfficerMr. Kushik Das is the Chief Financial Officer (CFO) of RAK Ceramics (Bangladesh) Limited.
He is responsible for accounts and finance activities of the Company. The Board of Directors clearly defined respective roles, responsibilities and duties of the CFO.
Head of Internal AuditMr. Zakir Hossain is the Head of Internal Audit of RAK Ceramics (Bangladesh) Limited. He is a qualified Chartered Accountant and fellow member of the Institute of Chartered Accountants of Bangladesh (ICAB). He is responsible for internal control and compliance of the Company. The Board of Directors clearly defined respective roles, responsibilities and duties of the Head of Internal Audit.
Company SecretaryMr. Muhammad Shahidul Islam is the Company Secretary of RAK Ceramics (Bangladesh) Limited and has been appointed by the Board of Directors of the Company. He is a qualified Chartered Secretary and fellow member of the Institute of Chartered Secretaries of Bangladesh (ICSB). The Board of Directors clearly defined respective roles,
Name of directors Position
Number of meetings
held while a member
Number of
meetings attended
Mr. Rafique-ul Huq,Barrister-at-Law
Independent Director and Chairman of the Committee till July 27, 2016 03 03
Mr. Faheemul Huq, Barrister-at-Law
Independent Director and Chairman of the Committee appointed in the Board Meeting held on July 27, 2016
01 01
Mr. Khaled Abdulla Yousef Abdulla Aal Abdulla (Nominee of RAK Ceramics PJSC, UAE)
Director and Member of the Committee till July 27, 2016 03 Nil
Mr. Wassim Moukahhal, (Nominee of RAK Ceramics PJSC, UAE)
Director and Member of the Committee appointed in the Board Meeting held on July 27, 2016
01 01
Mr. Pramod Kumar Chand (Nominee of RAK Ceramics PJSC, UAE)
Director and Member of the Committee 04 03
Mr. Muhammad Shahidul Islam
Company Secretary and Member Secretary of the Committee 04 04

Annual Report 2016
63
responsibilities and duties of the Company Secretary.
Statutory AuditorsA. Qasem & Co. Chartered Accountants (a member firm of Ernst & Young Global Limited, UK) was the external/ statutory auditor of the Company for the year 2016. They carry out systematic examination of books and records of the Company and ascertain, verify and report upon the facts regarding the financial operation and the results of the Company. To comply with the corporate governance properly, the Company did not engage its statutory auditors to perform the following services:
(i) Appraisal or valuation services or fairness opinions;
(ii) Financial information systems design and implementation;
(iii) Book-keeping or other services related to the accounting records or financial statements;
(iv) Broker-dealer services;
(v) Actuarial services;
(vi) Internal audit services; and
(vii) Any other service that the Audit Committee determines.
(viii) No partner or employees of the auditors are holding any shares of RAK Ceramics (Bangladesh) Limited during the tenure of their audit assignment.
(ix) Audit/certification services on compliance of corporate governance. External/Statutory auditors are appointed by the shareholders in the Annual General Meeting and fix their remuneration thereof.
Internal Audit and ControlRAK Ceramics (Bangladesh) Limited often considered that internal audit is one of the “four pillars” of corporate governance, the other pillars being the Board of Directors, Management and the External Auditors. Hence, the Company has an independent internal audit department under control of the Audit Committee of the Board. Internal auditing of RAK Ceramics (Bangladesh) Limited assists the Company in accomplishing
its objectives by bringing a systematic and disciplined approach to evaluate and improve the effectiveness of the organization’s risk management, control and governance processes. It helps the Audit Committee of the Board of Directors to perform their responsibilities effectively. This includes reporting critical internal control problems, informing the committee on the material issues or findings, suggesting questions or topics for the Audit Committee’s meeting agendas and coordinating carefully with the committee to receive effective information.
The scope of Internal Audit encompasses the examination and evaluation of the adequacy and effectiveness of the organization’s governance, risk management process, system of internal control structure and the quality of performance to achieve the organization’s stated goals and objectives. It includes:
-Reviewing the reliability and integrity of financial and operating information and the means to identify measure, classify and report such information.
-Reviewing the systems established to ensure compliance with those policies, plans, procedures, laws and regulations which could have a significant impact on operations and reports and whether the organisation is in compliance.
-Reviewing the means of safeguarding assets and as appropriate, verifying the existence of such assets.
-Reviewing operations or programs to ascertain whether results are consistent with established.
Objectives and goals and whether the operations or programs are being carried out as planned.
-Reviewing specific operations at the request of the Audit Committee or management, as appropriate.
-Monitoring and evaluating the effectiveness of the organization’s risk management system. Reviewing the quality of performance of external auditors and the degree of coordination with internal audit.
-Review the internal control statement by the senior management used by the external auditor for audit planning.

Annual Report 2016
64
Subsidiary CompanyRAK Ceramics (Bangladesh) Limited has two subsidiary companies and in compliance with the corporate governance guidelines of the BSEC, the Company ensured followings in all subsidiaries:
- The conditions relating to composition of the Board of Directors including independent directors is fulfill
- Independent director of the Company is also a director in subsidiary companies.
- The affairs of subsidiary companies have been reviewed in the Board meeting of the Company.
- Minutes of the Board meeting of subsidiary companies have been placed for review in the Board meeting of the Company.
- Financial statements of subsidiary companies have been reviewed by the audit committee of the Company.
Code of EthicsAs an organization, our values include integrity, self determination and valuing people. Our parent company has specified corporate values for the Company and stipulated a code of ethics for employees, ensuring that the latter maintain the highest integrity and comply with the relevant laws and ethical principles. Therefore, the Company considers the significance of ethical, human and environmental matters in the conduct of its business. The Board of RAK Ceramics (Bangladesh) Limited also established a separate ‘Code of Conduct’ for its Directors in compliance with the requirement of Bangladesh Securities and Exchange Commission (BSEC) notification.
CompliancesTo ensure the spirit of the corporate governance with accountability for inspiring confidence of investors, regulators, financer and other stakeholders, RAK Ceramics (Bangladesh) Limited is committed to comply with all the requirements of corporate governance as required by the Bangladesh Securities and Exchange Commission (BSEC).
Human ResourcesRAK Ceramics believes that Human Resources
of the company are their best capital. This human capital push the organization towards achieving the goal. Frequently changing business environment requires having a well trained work force, therefore, the Company has given more emphasis on developing management skills to suit today’s business environment. Various training programs and workshops were carried out during the year. The management and employee relationship in the company was excellent throughout the year.
Communication with ShareholdersThe Company encourages communications with the shareholders throughout the year and welcomes their participation in the annual general meeting. In the annual general meeting, the management of the Company received their valuable opinion and tries to implement it’s for the betterment of the Company. The Company discloses the quarterly and yearly financial statements and other reports to its shareholders in due time.
Company’s Corporate WebsiteThe Company’s website is a comprehensive reference of RAK Ceramics (Bangladesh) Limited management, vision and mission, value statement, investor relations, sales network, products, promotions and events. All the information regarding financial statements, patterns of shareholding, corporate benefits, notices, price sensitive information, dividend, refund warrant etc are disclosed in the sub-menu ‘Investors’ of the website. In addition to that, the Company regularly publishes the entire regulatory requirement in the website of the Company.
ConclusionRAK Ceramics (Bangladesh) Limited ensured highest standards in corporate good governance and strict adherence to the requirements of ethical code of conduct, through close monitoring. Through the code of ethics all levels of staff have been educated and encouraged to report to whistle blowing, when they suspect wrong doings by other employees.

Annual Report 2016
65
Certificate on compliance of conditions of corporate governance guidelines to the shareholders of RAK Ceramics (Bangladesh) LimitedWe have examined the compliance of conditions of corporate governance guidelines of the Bangladesh Securities and Exchange Commission (“BSEC”) by RAK Ceramics (Bangladesh) Limited (the “Company”) for the year ended 31 December 2016 as stipulated in clause 7(i) of the BSEC Notification No. SEC/CMRRCD/2006-158/134/Admin/44 dated 07 August 2012.
The compliance of conditions of corporate governance guidelines as stated in the aforesaid notification and reporting of the status of compliance is the responsibility of the Company’s management. Our examination for the purpose of issuing this certification was limited to the checking of procedures and implementations thereof, adopted by the Company for ensuring the compliance of conditions of corporate governance and correct reporting of compliance status on the attached statement on the basis of evidence gathered and representation received.
To the best of our information and according to the explanations given to us, we certify that, as reported on the attached status of compliance statement, the Company has complied with the conditions of corporate governance stipulated in the above mentioned BSEC notification dated 07 August 2012.
A F Nesaruddin, FCAPartnerICAB Enrolment Number- 469For Hoda Vasi Chowdhury & CoChartered AccountantsDated: January 23, 2017

Annual Report 2016
66
Status of Compliance with the Corporate Governance Guidelines (CGG)RAK Ceramics (Bangladesh) Limited For the year ended 31 December 2016Status of the compliance with the conditions imposed by the Notification No. SEC/CMRRCD/2006-158/134/Admin/44 dated 07 August 2012 of the Bangladesh Securities and Exchange Commission (BSEC) issued under section 2CC of the Securities and Exchange Ordinance 1969:
(Report under Condition No. 7.00)
Condition No. Title
Compliance status Remarks
Complied Not complied
1 BOARD OF DIRECTORS:1.1 Board’s Size
The number of the Board members of the Company shall not be less than 5 (five) and more than 20 (twenty).
√
1.2 Independent Directors1.2(i) At least one fifth (1/5) of the total number
of directors in the Company’s Board shall be Independent Directors.
√
1.2(ii)(a) Who either does not hold share in the Company or holds less than one (1%) shares of the total paid up shares of the Company;
√
1.2(ii)(b) Who is not sponsor of the Company and is not connected with any sponsor or director or shareholder who holds one percent or more shares of the Company;
√
1.2(ii)(c) Who does not have any other relationship, whether pecuniary or otherwise, with the company or its subsidiary/associated companies; √
Independent Director of subsidiary companies
1.2(ii)(d) Who is not a member, director or officer of any stock exchange; √
1.2(ii)(e) Who is not a shareholder, director or officer of any member of stock exchange or an intermediary of the capital market;
√
1.2(ii)(f) Who is not a partner or an executive or was not a partner or an executive during the preceding 3 (three) years of the concerned Company’s statutory audit firm;
√

Annual Report 2016
67
Condition No. Title
Compliance status Remarks
Complied Not complied
1.2(ii)(g) Who shall not be an independent director in more than 3 (three) listed companies; √
1.2(ii)(h) Who has not been convicted by a court of competent jurisdiction as a defaulter in payment of any loan to a bank or a Non-Bank Financial Institution (NBFI);
√
1.2(ii)(i) Who has not been convicted for a criminal offence involving moral turpitude. √
1.2(iii) Independent Director(s) shall be appointed by the Board of Directors and approved by the shareholders in the Annual General Meeting (AGM).
√
1.2(iv) The post of independent director(s) cannot remain vacant for more than 90 (ninety) days. √
1.2(v) The Board shall lay down a code of conduct of all Board members and annual compliance of the code to be recorded.
√
1.2(vi) The tenure of office of an independent director shall be for a period of 3 (three) years, which may be extended for 1 (one) term only.
√
1.3 Qualification of Independent Director (ID)1.3(i) Independent Director shall be a knowledgeable
individual with integrity who is able to ensure compliance with financial, regulatory and corporate laws and can make meaningful contribution to business.
√
1.3(ii) The person should be a Business Leader / Corporate Leader / Bureaucrat / University Teacher with Economics or Business Studies or Law background / Professionals like Chartered Accountants, Cost & Management Accountants, Chartered Secretaries. The independent director must have at least 12 (twelve) years of corporate management / professional experiences.
√
1.3(iii) In special cases the above qualifications may be relaxed subject to prior approval of the Commission.
No such matter
1.4 Chairman of the Board and Chief Executive Officer The positions of the Chairman of the Board and the Chief Executive Officer of the companies shall be filled by different individuals. The Chairman of the Company shall be elected from among the directors of the Company. The Board of Directors shall clearly define respective roles and responsibilities of the Chairman and the Chief Executive Officer.
√

Annual Report 2016
68
Condition No. Title
Compliance status Remarks
Complied Not complied
1.5 The Directors’ Report to ShareholdersDirectors Report to Shareholders shall include following additional statements on:
1.5(i) Industry outlook and possible future developments in the industry. √
1.5(ii) Segment-wise or product-wise performance. √1.5(iii) Risks and concerns. √1.5(iv) Discussion on Cost of Goods sold, Gross Profit
Margin and Net Profit Margin. √
1.5(v) Discussion on continuity of any Extra-Ordinary gain or loss.
No such matter
1.5(vi) Statement of all related party transactions. √1.5(vii) Utilization of proceeds from public issues, rights
issues and/or through any others instruments.No such matter
1.5(viii) An explanation if the financial results deteriorate after the Company goes for Initial Public Offering (IPO), Repeat Public Offering (RPO), Rights Offer, Direct Listing, etc.
No such matter
1.5(ix) If significant variance occurs between Quarterly Financial performance and Annual Financial Statements the management shall explain about the variance on their Annual Report.
No such matter
1.5(x) Remuneration to directors including independent directors. √
1.5(xi) The financial statements prepared by the management of the issuer company present fairly its state of affairs, the result of its operations, cash flows and changes in equity.
√
1.5(xii) Proper books of account of the issuer Company have been maintained. √
1.5(xiii) Appropriate accounting policies have been consistently applied in preparation of the financial statements and that the accounting estimates are based on reasonable and prudent judgment.
√
1.5(xiv) International Accounting Standards (IAS) / Bangladesh Accounting Standards (BAS) / International Financial Reporting Standards (IFRS) / Bangladesh Financial Reporting Standards (BFRS), as applicable in Bangladesh, have been followed in preparation of the financial statements and any departure there-from has been adequately disclosed.
√
1.5(xv) The system of internal control is sound in design and has been effectively implemented and monitored.
√

Annual Report 2016
69
Condition No. Title
Compliance status Remarks
Complied Not complied
1.5(xvi) There are no significant doubts upon the issuer company’s ability to continue as a going concern. If the issuer company is not considered to be a going concern, the fact along with reasons thereof should be disclosed.
No such matter
1.5(xvii) Significant deviations from the last year’s operating results of the issuer company shall be highlighted and the reasons thereof should be explained.
No such matter
1.5(xviii) Key operating and financial data of at least preceding 5 (five) years shall be summarized. √
1.5(xix) If the issuer company has not declared dividend (cash or stock) for the year, the reasons thereof shall be given.
No such matter
1.5(xx) The number of Board meetings held during the year and attendance by each director shall be disclosed.
√
1.5(xxi) The pattern of shareholding shall be reported to disclose the aggregate number of shares (along with name wise details where stated below) held by:-
1.5(xxi)(a) Parent / Subsidiary / Associated Companies and other related parties (name wise details); √
1.5(xxi)(b) Directors, Chief Executive Officer, Company Secretary, Chief Financial Officer, Head of Internal Audit and their spouses and minor children (name wise details);
√
1.5(xxi)(c) Executives; √1.5(xxi)(d) Shareholders holding ten percent (10%) or more
voting interest in the company (name wise details).
√
1.5(xxii) In case of the appointment / reappointment of a director the company shall disclose the following information to the shareholders:-
1.5(xxii)(a) A brief resume of the director; √1.5(xxii)(b)
Nature of his / her expertise in specific functional areas; √
1.5(xxii)(c) Names of companies in which the person also holds the directorship and the membership of committees of the board.
√

Annual Report 2016
70
Condition No. Title
Compliance status Remarks
Complied Not complied
2.0 CHIEF FINANCIAL OFFICER (CFO), HEAD OF INTERNAL AUDIT AND COMPANY SECRETARY (CS):
2.1 AppointmentThe company shall appoint a Chief Financial Officer (CFO), a Head of Internal Audit (Internal Control and Compliance) and a Company Secretary (CS). The Board of Directors should clearly define respective roles, responsibilities and duties of the CFO, the Head of Internal Audit and the CS.
√
2.2 Requirement to attend the Board MeetingsThe CFO and the Company Secretary of the companies shall attend the meetings of the Board of Directors, provided that the CFO and / or the Company Secretary shall not attend such part of a meeting of the Board of Directors which involves consideration of an agenda item relating to their personal matters.
√
3.0 AUDIT COMMITTEE:3.0 (i) The Company shall have an Audit Committee as a
sub-committee of the Board of Directors. √
3.0(ii) The Audit Committee shall assist the Board of Directors in ensuring that the financial statements reflect true and fair view of the state of affairs of the Company and in ensuring a good monitoring system within the business.
√
3.0(iii) The Audit Committee shall be responsible to the Board of Directors. The duties of the Audit Committee shall be clearly set forth in writing.
√
3.1 Constitution of the Audit Committee:3.1(i) The Audit Committee shall be composed of at
least 3 (three) members. √
3.1(ii) The Board of Directors shall appoint members of the Audit Committee who shall be directors of the Company and shall include at least 1 (one) Independent Director.
√
3.1(iii) All members of the Audit Committee should be “financially literate” and at least 1 (one) member shall have accounting or related financial management experience.
√
3.1(iv) Filling of casual vacancy in the Audit Committee. No such matter
3.1(v) The company secretary shall act as the secretary of the Committee. √
3.1(vi) The quorum of the Audit Committee meeting shall not constitute without independent director.
√

Annual Report 2016
71
Condition No. Title
Compliance status Remarks
Complied Not complied
3.2 Chairman of the Audit Committee3.2(i) The Board of Directors shall select 1 (one)
member of the Audit Committee to be Chairman of the Audit Committee, who shall be an independent director.
√
3.2(ii) Chairman of the audit committee shall remain present in the Annual General Meeting (AGM). √
3.3 Role of Audit Committee:3.3(i) Oversee the financial reporting process. √3.3(ii) Monitor choice of accounting policies and
principles. √
3.3(iii) Monitor Internal Control Risk management process. √
3.3(iv) Oversee hiring and performance of external auditors. √
3.3(v) Review along with the management, the annual financial statements before submission to the board for approval.
√
3.3(vi) Review along with the management, the quarterly and half yearly financial statements before submission to the Board for approval.
√
3.3(vii) Review the adequacy of internal audit function. √3.3(viii) Review statement of significant related party
transactions submitted by the management. √
3.3(ix) Review Management Letters / Letter of Internal Control weakness issued by statutory auditors. √
3.3(x) Declaration to Audit Committee by the Company regarding utilization of IPO / RPO, Right issue money.
No such matter
3.4 Reporting of the Audit Committee:3.4.1(i) The Audit Committee shall report on its activities
to the Board of Directors. √
3.4.1 (ii) The Audit Committee shall immediately report to the Board of Directors on the following findings, if any:-
3.4.1(ii)(a) Report on conflicts of interests; No such matter
3.4.1(ii)(b) Suspected or presumed fraud or irregularity or material defect in the internal control system;
No such matter
3.4.1(ii)(c) Suspected infringement of laws, including securities related laws, rules and regulations;
No such matter
3.4.1(ii)(d) Any other matter which shall be disclosed to the Board of Directors immediately.
No such matter
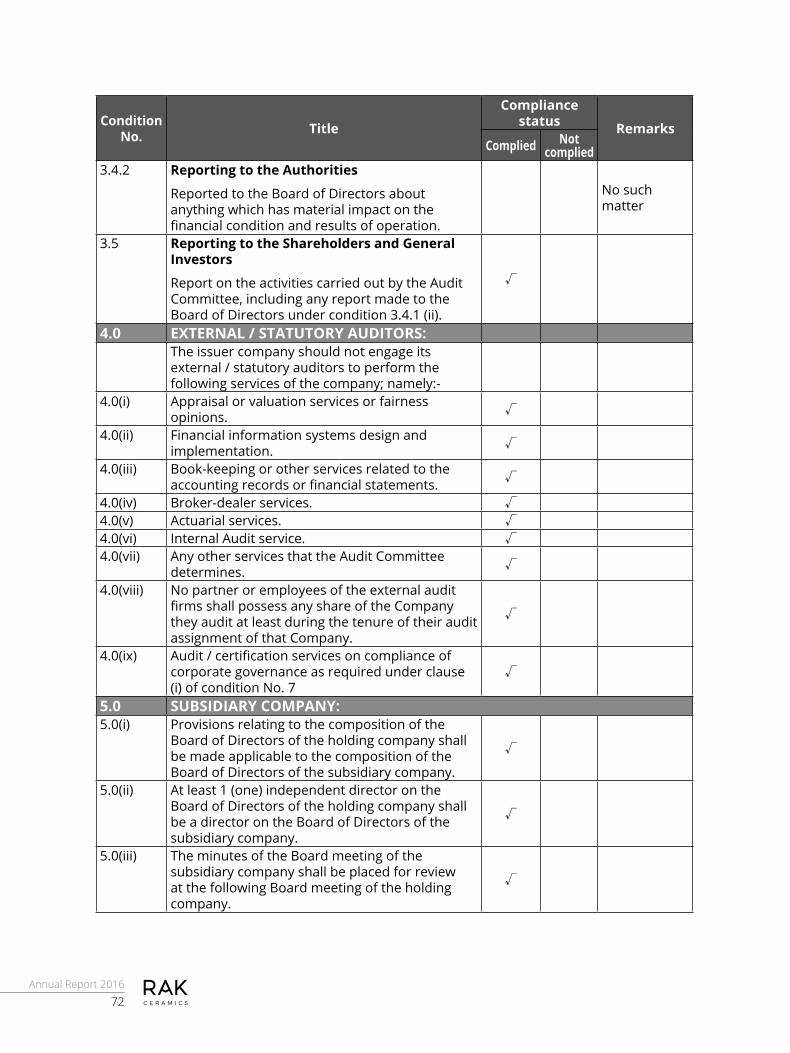
Annual Report 2016
72
Condition No. Title
Compliance status Remarks
Complied Not complied
3.4.2 Reporting to the Authorities
Reported to the Board of Directors about anything which has material impact on the financial condition and results of operation.
No such matter
3.5 Reporting to the Shareholders and General Investors
Report on the activities carried out by the Audit Committee, including any report made to the Board of Directors under condition 3.4.1 (ii).
√
4.0 EXTERNAL / STATUTORY AUDITORS:The issuer company should not engage its external / statutory auditors to perform the following services of the company; namely:-
4.0(i) Appraisal or valuation services or fairness opinions. √
4.0(ii) Financial information systems design and implementation. √
4.0(iii) Book-keeping or other services related to the accounting records or financial statements. √
4.0(iv) Broker-dealer services. √4.0(v) Actuarial services. √4.0(vi) Internal Audit service. √4.0(vii) Any other services that the Audit Committee
determines. √
4.0(viii) No partner or employees of the external audit firms shall possess any share of the Company they audit at least during the tenure of their audit assignment of that Company.
√
4.0(ix) Audit / certification services on compliance of corporate governance as required under clause (i) of condition No. 7
√
5.0 SUBSIDIARY COMPANY:5.0(i) Provisions relating to the composition of the
Board of Directors of the holding company shall be made applicable to the composition of the Board of Directors of the subsidiary company.
√
5.0(ii) At least 1 (one) independent director on the Board of Directors of the holding company shall be a director on the Board of Directors of the subsidiary company.
√
5.0(iii) The minutes of the Board meeting of the subsidiary company shall be placed for review at the following Board meeting of the holding company.
√
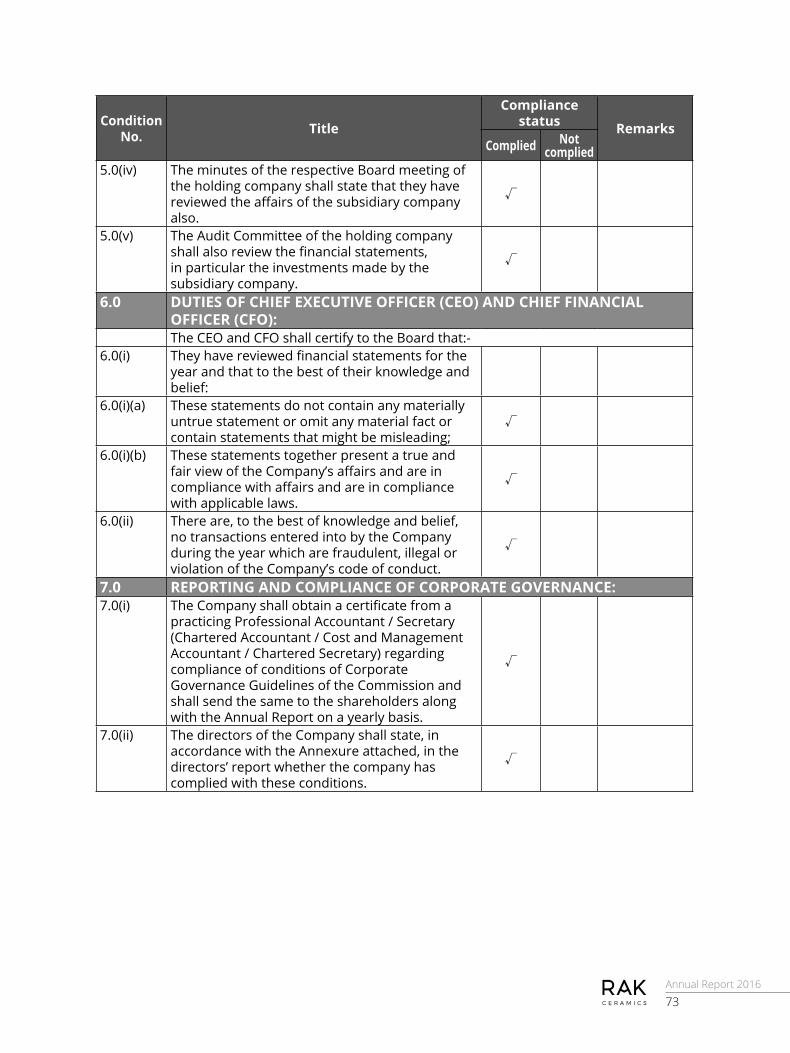
Annual Report 2016
73
Condition No. Title
Compliance status Remarks
Complied Not complied
5.0(iv) The minutes of the respective Board meeting of the holding company shall state that they have reviewed the affairs of the subsidiary company also.
√
5.0(v) The Audit Committee of the holding company shall also review the financial statements, in particular the investments made by the subsidiary company.
√
6.0 DUTIES OF CHIEF EXECUTIVE OFFICER (CEO) AND CHIEF FINANCIAL OFFICER (CFO):The CEO and CFO shall certify to the Board that:-
6.0(i) They have reviewed financial statements for the year and that to the best of their knowledge and belief:
6.0(i)(a) These statements do not contain any materially untrue statement or omit any material fact or contain statements that might be misleading;
√
6.0(i)(b) These statements together present a true and fair view of the Company’s affairs and are in compliance with affairs and are in compliance with applicable laws.
√
6.0(ii) There are, to the best of knowledge and belief, no transactions entered into by the Company during the year which are fraudulent, illegal or violation of the Company’s code of conduct.
√
7.0 REPORTING AND COMPLIANCE OF CORPORATE GOVERNANCE:7.0(i) The Company shall obtain a certificate from a
practicing Professional Accountant / Secretary (Chartered Accountant / Cost and Management Accountant / Chartered Secretary) regarding compliance of conditions of Corporate Governance Guidelines of the Commission and shall send the same to the shareholders along with the Annual Report on a yearly basis.
√
7.0(ii) The directors of the Company shall state, in accordance with the Annexure attached, in the directors’ report whether the company has complied with these conditions.
√
Annual Report 2016
74
Report of Audit CommitteeThe Audit Committee of RAK Ceramics (Bangladesh) Limited monitors the decisions and processes designed to ensure the integrity of financial and corporate reporting and ensures that robust systems of internal control and risk management are in place and adhered to. The Committee also works to uphold corporate governance within the organization. The Audit Committee is a committee of the Board of Directors of the Company with independent oversight over Company’s affairs. The duties and responsibilities of the Audit Committee are clearly set forth in writing by the Board in the Audit Committee Charter.
Formation and Operation of the CommitteeThe formation and operation of the Committee are primarily guided by a Charter approved by the Board of Directors that is based on the underlying corporate laws and regulations, currently accepted best practices and latest Corporate Governance Guidelines of the Bangladesh Securities and Exchange Commission (BSEC).
CompositionIn accordance with the Corporate Governance Guidelines of BSEC (No. SEC/CMRRCD/2006-158/134/Admin/44) issued on August 07, 2012, the Audit Committee of RAK Ceramics (Bangladesh) Limited comprises of three members including two Independent Directors. The Chairman of the Committee is an Independent Director of the Company. The Company Secretary is the member secretary of the Committee.
The current members of the Audit Committee are as follows:
1. Mr. Faheemul Huq, Barrister-at-Law (Independent Director), Chairman
2. Mr. Wassim Moukahhal, Member
3. Mr. Pramod Kumar Chand, Member
4. Mr. Muhammad Shahidul Islam, Member Secretary.
Mr. Wassim Moukahhal and Barrister Faheemul Huq, Independent Directors of the Company were appointed as the new Members of the Audit Committee of RAK Ceramics (Bangladesh) Limited in place of Mr. Khaled Abdulla Yousef Abdulla Aal Abdulla and Barrister Rafique-ul Huq in the meeting of the Board of Directors held on July 27, 2016.
All the members of the Committee have business acumen and are knowledgeable individuals with integrity who are able to ensure compliance with financial, regulatory and corporate laws with meaningful contribution to business as well.
Roles and ResponsibilitiesThe roles and responsibilities of the Audit Committee are clearly defined in the Audit Committee Charter. The Audit Committee shall assist the Board in fulfilling its oversight responsibilities. To recognise the importance of oversight responsibilities of the Board with special emphasis on ensuring compliance with all applicable legislations and regulations, the prime responsibilities of the Audit Committee, among others, are as follows: g Oversee the financial reporting process.g Monitor choice of accounting policies and
principles.g Monitor internal control risk management
process.g Oversee hiring process and performance of
statutory auditors.g Review along with the management,
the annual, quarterly and half yearly financial statements of the Company and its subsidiaries before submission to the Board for approval.
g Review the adequacy of internal audit functions.
g Review statement of significant related party transactions submitted by the management.
g Review Management Letters / Letter of Internal Control Weakness issued by the statutory auditors.

Annual Report 2016
75
g Advise the Management on key improvement areas of operation.
g Perform other activities related to this Charter as requested by the Board of Directors.
Internal Control and Risk Management ProcessInternal control is a process for assuring achievement of an organization’s objectives in operational effectiveness and efficiency, reliable financial reporting, and compliance with laws, regulations and policies. It is a means by which an organization’s resources are directed, monitored and measured and plays an important role in detecting and preventing fraud and error. Indeed internal control involves everything that controls risks to an organization.
The Committee has an ongoing process for reviewing the effectiveness of the system of internal controls within the Company.
Ethical leadership and human capital are the cornerstones of the Company’s risk management philosophy as these ensure entrepreneurial flair, sound corporate reputation and effective governance.
The risk management process in RAK Ceramics (Bangladesh) Limited comprises the arrangement of resources to ensure the achievement of strategy and business plans, including the exploitation of available
opportunities that meet the risk appetite criteria set by the Board. Risk profiles inherent to existing activities are furthermore maintained within the approved risk tolerance levels, thereby optimizing the risk return parameters for the creation of sustainable growth and value for shareholders and other stakeholders. However the Committee discussed with management how they would continue to deliver high-quality oversight and risk evaluation against the background of the current economic climate.
Committee Meetings and AttendanceDuring 2016, the Committee held 4 (four) meetings complying with the requirement of at least one meeting in every quarter in which the Committee reviewed issues relating to business operation, compliance, human resource, finance and accounts, among other things. Managing Director, Chief Executive Officer, Chief Financial Officer and Head of Internal Audit were the permanent invitees of the meeting. Relevant departmental heads and other members of the management also attended the meetings as required. The proceedings of the meetings are properly minuted and regularly reported to the Board of Directors.
The number of Audit Committee meetings held and the attendance by each member during the year 2016:
Name of directors Position
Number of meetings
held while a member
Number of meetings attended
Mr. Rafique-ul Huq, Barrister-at-Law
Independent Director and Chairman of the Committee till July 27, 2016 03 03
Mr. Faheemul Huq, Barrister-at-Law
Independent Director and Chairman of the Committee appointed in the Board Meeting held on July 27, 2016
01 01
Mr. Khaled Abdulla Yousef Abdulla Aal Abdulla (Nominee of RAK Ceramics PJSC, UAE)
Director and Member of the Committee till July 27, 2016 03 Nil
Mr. Wassim Moukahhal, (Nominee of RAK Ceramics PJSC, UAE)
Director and Member of the Committee appointed in the Board Meeting held on July 27, 2016
01 01
Mr. Pramod Kumar Chand (Nominee of RAK Ceramics PJSC, UAE)
Director and Member of the Committee 04 03
Mr. Muhammad Shahidul Islam
Company Secretary and Member Secretary of the Committee 04 04

Annual Report 2016
76
Committee’s Report SummaryThe Committee has the following opinions regarding Corporate and the Financial Affairs of the Company:g Laws and regulations relating to business
and internal policies, procedures & guidelines have been complied with.
g Financial Statements for the year ended December 31, 2016 contained full disclosures and these are prepared in accordance with Bangladesh Financial Reporting Standards (BFRS) as adopted by the Institute of Chartered Accountants of Bangladesh (ICAB).
g Adequate internal control systems are put in place to detect, correct and prevent fraud and errors on timely manner.
g Appropriate Management Information Systems (MIS) are in place to facilitate decision making process.
g Existing risk management procedures are effective to capture and mitigate risk.
g The Committee considered the recommendations made by the statutory and internal auditors of the Company in their respective reports.
The findings and recommendations of the Committee were reported to the Board of Directors and the Board of Directors had taken appropriate measures thereof. The minutes of all Audit Committee meetings were circulated among the members of the Committee.
Statutory AuditorThe Committee has satisfied itself through its own process of review that the statutory auditor of the Company is independent as defined by the related Act.
The Audit Committee of the Board recommended to re-appoint M/s A. Qasem &
Co., Chartered Accountants (a Member Firm of Ernst & Young Global Limited) as the statutory auditors of the Company for the year 2017.
Internal AuditInternal audit is regarded as one of the four pillars of corporate governance. Internal audit is conducted under the supervision of Mr. Zakir Hossain FCA, Head of Internal Audit in accordance with the approved Audit Committee Charter and corporate governance guidelines/best practice.
Financial ManagementThe financial management/activities of the Company are running under the supervision of Mr. Kaushik Das, Chief Financial Officer of the Company. The Audit Committee has satisfied itself that Mr. Kaushik Das has the appropriate expertise and knowledge to fulfill his role efficiently.
Evaluation of Quarterly ReportAs per BSEC Guideline ref no. SEC/CMRRCD/2006-158/134/Admin/44 dated August 07, 2012, the Audit Committee reviewed quarterly financial statements of the Company and its subsidiaries and found that these statements reflected true and fair view of the state of affairs of those companies.
Annual Financial StatementsThe Committee has tabled the financial statements for approval by the Board. The Board has subsequently approved the financial statements which will be opened for discussion at the forthcoming annual general meeting.
AppreciationThe Audit Committee expressed their sincere thanks to the members of the Board, Management, statutory and internal auditors for their support in carrying out its duties and responsibilities effectively.
Barrister Faheemul Huq) Chairman
Audit Committee
Dated: 23.01.2017
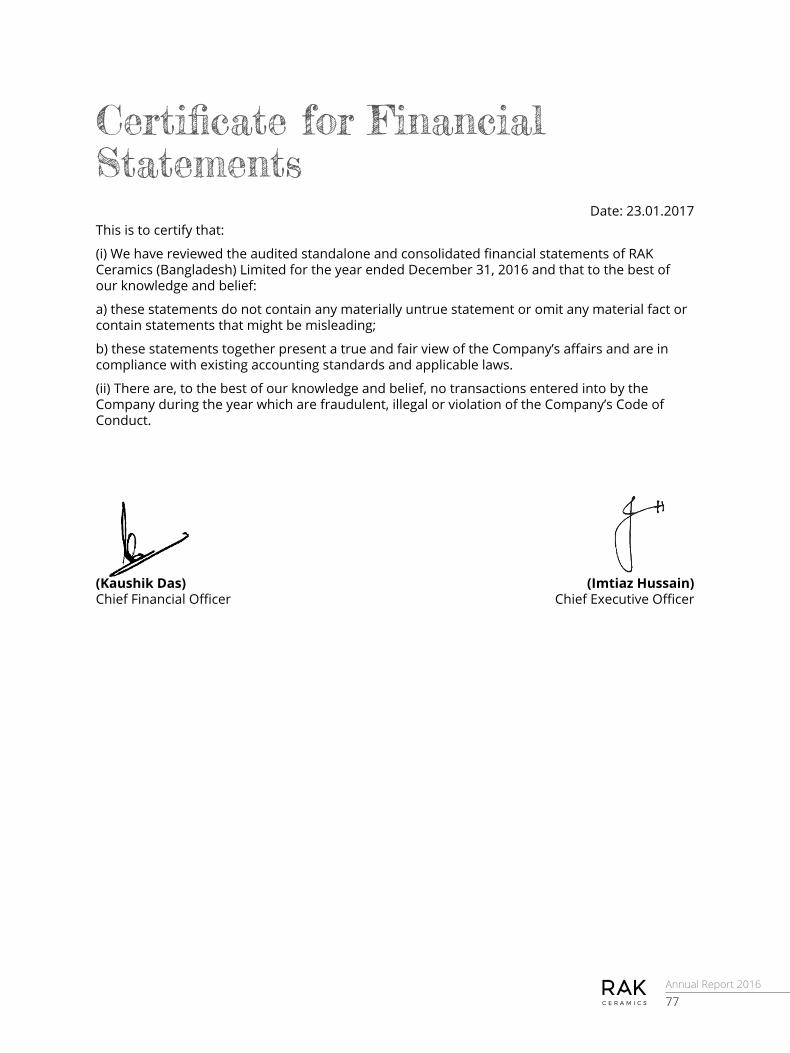
Annual Report 2016
77
(Imtiaz Hussain) Chief Executive Officer
(Kaushik Das)Chief Financial Officer
Certificate for Financial StatementsThis is to certify that:
(i) We have reviewed the audited standalone and consolidated financial statements of RAK Ceramics (Bangladesh) Limited for the year ended December 31, 2016 and that to the best of our knowledge and belief:
a) these statements do not contain any materially untrue statement or omit any material fact or contain statements that might be misleading;
b) these statements together present a true and fair view of the Company’s affairs and are in compliance with existing accounting standards and applicable laws.
(ii) There are, to the best of our knowledge and belief, no transactions entered into by the Company during the year which are fraudulent, illegal or violation of the Company’s Code of Conduct.
Date: 23.01.2017
Annual Report 2016
78
Financial ReportsWith a sophisticated framework for internal and external control and optimum care for resources, we pledge to prevent discrepancies with numbers and ensure clarity with our holistic monetary policy. With strict adherence to regulatory frameworks, RAK Ceramics remains a trusted entity for leveraging resources, optimizing desired productivity.

Annual Report 2016
79
RAK CERAMICS (BANGLADESH) LIMITED
Auditor’s Report and Consolidated Financial Statements
as at and for the year ended 31 December 2016

Annual Report 2016
80
Independent Auditor’s Reportto the Shareholders ofRAK Ceramics (Bangladesh) Ltd.Report on the Consolidated Financial StatementsWe have audited the accompanying consolidated financial statements of RAK Ceramics (Bangladesh) Ltd. which comprise the consolidated statement of financial position as at 31 December 2016, and the consolidated statement of profit or loss and other comprehensive income, consolidated statement of changes in equity and consolidated statement of cash flows for the year then ended, and a summary of significant accounting policies and other explanatory information.
Management’s Responsibility for the Financial Statements
Management is responsible for the preparation and fair presentation of these consolidated financial statements in accordance with Bangladesh Financial Reporting Standards (BFRS) and for such internal control as management determines is necessary to enable the preparation of financial statements that are free from material misstatement, whether due to fraud or error.
Auditors’ ResponsibilityOur responsibility is to express an opinion on these consolidated financial statements based on our audit. We conducted our audit in accordance with Bangladesh Standards on Auditing (BSA). Those standards require that we comply with ethical requirements and plan and perform the audit to obtain reasonable assurance about whether the financial statements are free from material misstatement.
An audit involves performing procedures to obtain audit evidence about the amounts and disclosures in the financial statements. The procedures selected depend on the auditors’ judgment, including the assessment of the risks of material misstatement of the financial statements, whether due to fraud or error. In making those risk assessments, the auditor considers internal control relevant to the entity’s preparation and fair presentation of the financial statements in order to design audit procedures that are appropriate in the circumstances, but not for the purpose of
expressing an opinion on the effectiveness of the entity’s internal control. An audit also includes evaluating the appropriateness of accounting policies used and the reasonableness of accounting estimates made by management, as well as evaluating the overall presentation of the financial statements.
We believe that the audit evidence we have obtained is sufficient and appropriate to provide a basis for our audit opinion.
Opinion
In our opinion, the consolidated financial statements present fairly, in all material respects, the financial position of RAK Ceramics (Bangladesh) Ltd. as at 31 December 2016 and its financial performance and its cash flows for the year then ended in accordance with Bangladesh Financial Reporting Standards (BFRS).
Other matterThe financial statements of two subsidiaries of RAK Ceramics (Bangladesh) Ltd. are audited by another auditor who expressed an unmodified opinion on those financial statements on 23 January 2017
Report on other legal and regulatory requirementsIn accordance with the Companies Act 1994 and Securities and Exchange Rules 1987, we also report the following:
(a) we have obtained all the information and explanations which to the best of our knowledge and belief were necessary for the purpose of our audit and made due verification thereof;
(b) in our opinion, proper books of account as required by law have been kept by the Company so far as it appeared from our examination of those books;
(c) the consolidated statement of financial position and the statement of profit or loss and other comprehensive income dealt with by the report are in agreement with the books of accounts; and
(d) the expenditure incurred was for the purposes of the Company’s business.
Dated, 23 January 2017(A. Qasem & Co.)
Chartered Accountants

Annual Report 2016
81
RAK Ceramics (Bangladesh) Ltd.Consolidated statement of financial position as at 31 December 2016
Notes 2016 2015 Taka Taka
AssetsProperty, plant and equipment 4 4,005,119,013 2,311,590,599 Intangible assets 6 6,740,159 6,683,955 Capital work-in-progress 7 28,726,285 1,545,379,710 Trade and other receivables 10 74,025,000 148,050,000
Total non-current assets 4,114,610,457 4,011,704,264 Inventories 9 2,527,507,042 2,239,844,230 Trade and other receivables 10 618,841,556 638,387,373 Loan to disposed subsidiary 8 201,898,000 201,898,000 Advances, deposits and prepayments 11 406,247,968 340,158,392 Advance income tax 12 2,485,841,759 2,219,806,786 Cash and cash equivalents 13 802,643,479 1,101,566,520
Total current assets 7,042,979,804 6,741,661,301 Total assets 11,157,590,261 10,753,365,565
Equity Share capital 14 3,368,506,110 3,368,506,110 Share premium 1,473,647,979 1,473,647,979 Retained earnings 1,269,570,793 1,196,443,022
Equity attributable to equity holders of the company 6,111,724,882 6,038,597,111 Non-controlling interests 1,501 1,529 Total equity 6,111,726,383 6,038,598,640 Liabilities
Borrowings 17 594,926,064 420,624,802 Deferred tax liability 15 128,416,223 75,811,194
Total non-current liabilities 723,342,287 496,435,996 Employees benefit payable 16 3,458,783 26,224,135 Borrowings 17 567,719,326 771,119,369 Trade and other payables 18 589,425,022 640,626,199 Accrued expenses 19 275,376,870 196,618,285 Provision for income tax 20 2,886,541,590 2,583,742,941
Total current liabilities 4,322,521,591 4,218,330,929 Total liabilities 5,045,863,878 4,714,766,925 Total equity and liabilities 11,157,590,261 10,753,365,565
The notes on pages 85 to 117 are an integral part of these financial statements
Dated, 23 January 2017
Company SecretaryDirectorManaging Director
(A. Qasem & Co.)Chartered Accountants
As per our report of same date

Annual Report 2016
82
RAK Ceramics (Bangladesh) Ltd.Consolidated statement of profit or loss and other comprehensive incomefor the year ended 31 December 2016
Notes2016 2015Taka Taka
Sales 21 5,661,411,578 5,059,300,403 Cost of sales 22 (3,252,054,966) (2,896,889,441)Gross profit 2,409,356,612 2,162,410,962 Other income 23 3,109,360 841,198,710 Administrative expenses 24 (357,446,247) (859,551,141)Marketing and selling expenses 25 (704,320,334) (688,070,995)
(1,058,657,221) (706,423,426)Profit from operating activities 1,350,699,391 1,455,987,536 Finance income 26 21,029,885 90,059,260 Finance expenses 27 (40,014,661) (18,935,684)Net finance income (18,984,776) 71,123,576 Share of profit/(loss) of equity-accounted investees 5 - (20,409,802)Profit before contribution to workers' profit participation and welfare fund 1,331,714,615 1,506,701,310 Contribution to worker's profit participation and welfare fund 28 (61,056,166) (27,305,761)Profit before income tax 1,270,658,449 1,479,395,549 Income tax expense Current tax 29 (302,798,649) (387,662,773) Deferred tax 15 (52,605,029) 2,606,991
(355,403,678) (385,055,782)Profit for the year 915,254,771 1,094,339,767
Other comprehensive income - - Total comprehensive income for the year 915,254,771 1,094,339,767 Profit attributable to:Equity holders of the company 915,254,299 1,094,339,280 Non-controlling interests 472 487 Profit after tax for the year 915,254,771 1,094,339,767 Basic earnings per share (Par value TK 10) 33 2.72 3.25
The notes on pages 85 to 117 are an integral part of these financial statements
Dated, 23 January 2017
Company SecretaryDirectorManaging Director
(A. Qasem & Co.)Chartered Accountants
As per our report of same date

Annual Report 2016
83
Att
ribu
tabl
e to
ow
ners
of t
he C
ompa
nyN
on-
cont
rolli
ng
inte
rest
sTo
tal
eq
uity
Shar
e
capi
tal
Shar
e Pr
emiu
mRe
tain
ed
ea
rnin
gsTo
tal
Taka
Taka
Taka
Taka
Taka
Taka
Bala
nce
as a
t 01
Janu
ary
2015
3,36
8,50
6,11
0 1,
473,
647,
979
1,07
7,27
5,39
5 5,
919,
429,
484
(58,
949,
789)
5,86
0,47
9,69
5
Tota
l com
preh
ensi
ve in
com
e fo
r 20
15
Profi
t/(lo
ss) f
or th
e ye
ar -
- 1,
059,
275,
865
1,05
9,27
5,86
5 3
5,06
3,90
2 1,
094,
339,
767
Pr
ior
year
adj
ustm
ent
- -
(275
) (2
75)
(499
,725
) (5
00,0
00)
El
imin
atio
n on
dis
posa
l of s
ubsi
diar
y 1
95,2
61,9
30
195
,261
,930
A
cqui
sitio
n of
furt
her
purc
hase
of R
AK P
ower
sha
res
(97,
981,
435)
(97,
981,
435)
(126
,799
,789
) (2
24,7
81,2
24)
Tran
sact
ions
with
the
shar
ehol
ders
Cas
h di
vide
nd (2
014)
- -
(842
,126
,528
) (8
42,1
26,5
28)
(44,
075,
000)
(886
,201
,528
)Ba
lanc
e as
at
31 D
ecem
ber
2015
3,36
8,50
6,11
0 1,
473,
647,
979
1,19
6,44
3,02
2 6,
038,
597,
111
1,5
29
6,03
8,59
8,64
0
Bala
nce
as a
t 01
Janu
ary
2016
3,36
8,50
6,11
0 1,
473,
647,
979
1,19
6,44
3,02
2 6,
038,
597,
111
1,5
29
6,03
8,59
8,64
0
Tota
l com
preh
ensi
ve in
com
e fo
r 20
16
Profi
t/(lo
ss) f
or th
e ye
ar -
- 9
15,2
54,2
99
915
,254
,299
4
72
915
,254
,771
Tran
sact
ions
with
the
shar
ehol
ders
:
C
ash
divi
dend
(201
5) -
- (8
42,1
26,5
28)
(842
,126
,528
) (5
00)
(842
,127
,028
)Ba
lanc
e as
at
31 D
ecem
ber
2016
3,36
8,50
6,11
0 1,
473,
647,
979
1,26
9,57
0,79
3 6,
111,
724,
882
1,5
01
6,11
1,72
6,38
3
The
note
s on
pag
es 8
5 to
117
are
an
inte
gral
par
t of t
hese
fina
ncia
l sta
tem
ents
RAK
Cera
mic
s (B
angl
ades
h) L
td.
Con
solida
ted
stat
emen
t of
cha
nges
in
equi
ty
fo
r th
e ye
ar e
nded
31
Dec
embe
r 20
16

Annual Report 2016
84
2016 2015Taka Taka
Cash flows from operating activitiesCash receipts from customers 5,601,413,958 4,867,818,550 Cash payments to suppliers and employees (4,235,590,594) (3,750,429,478)Cash generated from operating activities 1,365,823,364 1,117,389,072
Interest received from bank deposit 3,356,834 6,584,014 Income tax paid (266,034,973) (206,010,655)Net cash (used in)/from operating activities 1,103,145,225 917,962,431
Cash flows from investing activitiesAcquisition of property, plant and equipment (585,844,016) (1,805,104,980)Sale of property, plant and equipment 707,150 158,681 Disposal proceeds of subsidiary and associate 86,710,000 374,599,560 Interest received from FDR 15,105,005 68,179,402 Income from rental 2,020,000 2,280,000 Intangible assets (12,401,543) (5,673,511)Dividend received 250 - Net cash (used in)/from investing activities (493,703,154) (1,365,560,848)
Cash flows from financing activitiesFinance charges (42,554,701) (15,570,077)Avail/(repayment) of term loan 174,301,262 420,624,802 Avail/(repayment) of short-term loan (203,400,043) 447,364,206 Dividend paid (838,775,610) (836,657,004)Unclaimed share application refund 2,064,480 (1,017,600)Loan realized from associate - 102,973,608 Adjustment related with non-controlling interest (500) (44,075,000)Net cash (used in)/from financing activities (908,365,112) 73,642,935 Net increase/(decrease) in cash and cash equivalents (298,923,041) (373,955,482)Cash and cash equivalents as at 01 January 1,101,566,520 1,475,522,002 Cash and cash equivalents as at 31 December (Note 13) 802,643,479 1,101,566,520
The notes on pages 85 to 117 are an integral part of these financial statements
RAK Ceramics (Bangladesh) Ltd.Consolidated statement of cash flowsfor the year ended 31 December 2016

Annual Report 2016
85
RAK Ceramics (Bangladesh) Ltd.Notes to the Consolidated Financial Statementsas at and for the year ended 31 December 2016
1. Reporting entityRAK Ceramics (Bangladesh) Limited (the Company), formerly RAK Ceramics (Bangladesh) Pvt. Limited, a UAE-Bangladesh joint venture company, was incorporated in Bangladesh on 26 November 1998 as a private company limited by shares under the Companies Act 1994. The Company was later converted from a private limited into a public limited on 10 June 2008 after observance of required formalities as per laws. The name of the Company was thereafter changed to RAK Ceramics (Bangladesh) Ltd. as per certificate issued by the Registrar of Joint Stock Companies dated 11 February 2009. The address of the Company’s registered office is RAK Tower, Plot # 1/A, Jasimuddin Avenue, Sector # 3, Uttara, Dhaka 1230. The company got listed with Dhaka Stock Exchange (DSE) and Chittagong Stock Exchange (CSE) on 13 June 2010.
1.1 Nature of businessThe Company is engaged in manufacturing and marketing of ceramics tiles, bathroom sets and all types of sanitary ware. It has started its commercial production on 12 November 2000. The commercial production of its new sanitary ware plant, expansion unit of ceramics facilities, tiles and sanitary plant was started on 10 January 2004, 1 July 2004,1 September 2007, 1 April 2015 and 17th May respectively.
1.2 Description of subsidiaries
RAK Power Pvt. Ltd.RAK Power Pvt. Ltd. has been incorporated in Bangladesh under the Companies Act 1994 on 30 June 2005 as a private company limited by shares with an authorized capital of Taka 1,000,000,000 divided into 10,000,000 ordinary shares of Taka 100 each. The paid up capital stands at Taka 205,000,000 as at 31 December 2016. The Company has gone into operation from 1 May 2009. The registered office of the Company is at House # 5, Road # 1/A Sector # 4, Uttara, Dhaka- 1230. The Power Plant is located at Village : Dhanua, P.S: Sreepur, District: Gazipur. 57% shares of RAK Power Pvt. Ltd. is held by RAK Ceramics (Bangladesh) Limited.
The Board of Directors of RAK Ceramics (Bangladesh) Limited in its meeting held on July 26, 2015 have decided to further increase the shareholding in RAK Power Pvt. Ltd. from 57% to 100% through purchase of 881,495 number of ordinary shares of BDT 100 each in consideration of BDT 255 per share totaling to BDT 224,781,225 only from all the other shareholders of RAK Power Pvt. Ltd. subject to approval by the shareholders and concerned authorities for the interest of the business of the Company. The shareholders of RAK Ceramics (Bangladesh) Limited have approved the same in the EGM dated September 20, 2015.The effect of acquisition has been taken place as approved in Board of Directors meeting of RAK Power (Pvt.) Ltd on 20 October 2015
RAK Security and Services (Pvt.) LimitedRAK Security and Services (Pvt.) Ltd. has been incorporated in Bangladesh under the Companies Act 1994 on 21 December 2006 as a private company limited by shares with an authorized capital of Taka 1,00,000,000 divided into 1,000,000 ordinary shares of Taka 100 each. The paid up capital stands at Taka 1,000,000 as at 31 December 2016. The Company has gone into operation from 1 May 2007. The registered office of the Company is at House # 5, Road # 1/A Sector # 4, Uttara, Dhaka- 1230. 35% shares of RAK Security and Services (Pvt.) Ltd is held by RAK Ceramics (Bangladesh) Limited.
The Board of Directors of RAK Ceramics (Bangladesh) Limited in its meeting held on July 26, 2015 have decided to further increase the shareholding in RAK Security & Services (Pvt.) Ltd. from 35% to 100% through purchase of 6,500 number of ordinary shares of BDT 100 each in consideration of BDT 2,875 per share totaling to BDT 18,687,500 only from all the other shareholders of RAK Security & Services (Pvt.) Ltd. subject to approval by the shareholders and concerned authorities for the interest of the business of the Company. The shareholders of RAK Ceramics (Bangladesh) Limited have approved the same in the EGM dated September 20, 2015. The effect of acquisition has been taken place as approved in Board of Directors meeting of RAK Security and Services (Pvt.) Ltd on 20 October 2015.

Annual Report 2016
86
2. Basis of preparation
2.1 Statement of complianceThese financial statements have been prepared in accordance with Bangladesh Financial Reporting Standards (BFRSs), the Companies Act 1994 and the Securities and Exchange Rules 1987.
The title and format of these financial statements follow the requirements of BFRS which are to some extent different from the requirement of the Companies Act 1994. However, such differences are not material and in the view of management BFRS titles and format give better presentation to the shareholders.
Authorisation for issue
These financial statements have been authorised for issue by the Board of Directors of the Company on 23 January 2017.
2.2 Basis of measurement
These financial statements have been prepared on historical cost basis except for inventories which are measured at lower of cost and net realisable value.
2.3 Functional and presentational currency
These financial statements are presented in Bangladesh Taka (Taka/Tk/BDT), which is the functional currency and presentation currency of the Company. The figures of financial statements have been rounded off to the nearest Taka.
2.4 Use of estimates and judgements
The preparation of these financial statements in conformity with BFRSs requires management to make judgements, estimates and assumptions that affect the application of accounting policies and the reported amounts of assets, liabilities, income and expenses. Actual results may differ from these estimates.Estimates and underlying assumptions are reviewed on an ongoing basis. Revisions to accounting estimates are recognised in the year in which the estimates are revised and in any future years affected.In particular, information about significant areas of estimation uncertainty and critical judgements in applying accounting policies that have the most significant effect on the amount recognised in the financial statements are stated in the following notes:
Note 4 Property, plant & equipmentNote 15 Deferred tax liabilityNote 16 Employees benefit payableNote 20 Provision for income tax
2.5 Reporting periodThe financial period of the Company covers one year from 1 January to 31 December and is followed consistently.
2.6 Going concernThe Company has adequate resources to continue in operation for foreseeable future and hence, the financial statements have been prepared on going concern basis. As per management assessment there are no material uncertainties related to events or conditions which may cast significant doubt upon the Company’s ability to continue as a going concern.
Notes to the Financial Statementsas at and for the year ended 31 December 2016

Annual Report 2016
87
3 Significant accounting policiesThe accounting policies set out below, which comply with IFRS, have been applied consistently to all years presented in these consolidated financial statements, and have been applied consistently by Group entities.
3.1 Basis of consolidation“These consolidated financial statements comprise the consolidated financial position and the consolidated results of operations of the Company and its subsidiaries (collectively referred to as “the Group”) on a line by line basis together with the Group’s share in the net assets of its equity- accounted investees. BFRS-10 “”Consolidated Financial Statements”” introduces a new control model that focuses on whether the group has power over an investee, exposure or rights to variable returns from its involvement with the investee and ability to use its power to affect those returns. An investor has power over an investee when the investor has existing rights that gives it the current ability to direct the relevant activities that significantly affect the investee’s returns. Power arises from rights. An investor is exposed, or has rights, to variable returns from its involvement with the investee when the investor’s returns from its involvement have the potential to vary as a result of the investee’s performance. An investor controls an investee if the investor not only has the power over the investee and exposure or rights to variable returns from its involvement with the investee, but also has the ability to use its power to affect the investor’s return from its involvement with the investee.”
SubsidiariesSubsidiaries are enterprises controlled by the Group. Control exists when the Group has the power to govern the financial and operating policies of an entity so as to obtain benefits from its activities. In assessing control, potential voting rights that are presently exercisable are taken into account. The results of operations and total assets and liabilities of subsidiary companies are included in the consolidated financial statements on a line-by-line basis and the interest of minority shareholders, if any, in the results and net assets of subsidiaries is stated separately. The financial statements of subsidiaries are included in the consolidated financial statements of the Group from the date that control commences until the date that control ceases. Any gains or losses on increase/decrease in non-controlling interest in subsidiaries without a change in control, is recognised as a component of equity.
Loss of controlUpon the loss of control, the Group derecognises the assets and liabilities of the subsidiary, any non-controlling interest and other components of equity related to the subsidiary. Any surplus or deficit arising on the loss of control is recognised in profit or loss. If the Group retains any interest in the previous subsidiary, then such interest is measured at fair value at the date that control is lost. Subsequently it is accounted for as an equity-accounted investee or as an available-for-sale financial asset depending on the level of influence retained.
Investments in associatesAssociates are those entities in which the Group has significant influence, but not control, over the financial and operating policies. Significant influence is presumed to exist when the Group holds between 20% and 50% of the voting power of another entity.
Investments in associates are accounted for using the equity method and are recognised initially at cost. The cost of the investment includes transaction costs.The consolidated financial statements include the Group’s share of the profit or loss and other comprehensive income of equity accounted investees, after adjustments to align the accounting policies with those of the Group, from the date that significant influence commences until the date that significant influence ceases.
Notes to the Financial Statementsas at and for the year ended 31 December 2016

Annual Report 2016
88
When the Group’s share of losses exceeds its interest in an equity-accounted investee, the carrying amount of the investment, including any long-term interests that form part thereof, is reduced to zero, and the recognition of further losses is discontinued except to the extent that the Group has an obligation or has made payments on behalf of the investee.
Transactions eliminated on consolidationIntra-group balances and transactions, and any unrealised income and expenses arising from intra-group transactions, are eliminated in preparing the consolidated financial statements. Unrealised gains arising from transactions with equity-accounted investees are eliminated against the investment to the extent of the Group’s interest in the investee. Unrealised losses are eliminated in the same way as unrealised gains, but only to the extent that there is no evidence of impairment.
3.2 Financial instrumentsA financial instrument is any contract that gives rise to a financial asset of one entity and a financial liability or equity instrument of another entity.
3.2.1 Non-derivative financial assetsThe Group initially recognises loans and receivables on the date that they are originated. All other financial assets are recognised initially on the trade date, which is the date that the Group becomes a party to the contractual provisions of the instrument.
The Group derecognises a financial asset when the contractual rights to the cash flows from the asset expire, or it transfers the rights to receive the contractual cash flows in a transaction in which substantially all the risks and rewards of ownership of the financial asset are transferred. Any interest in such transferred financial assets that is created or retained by the Group is recognised as a separate asset or liability.The Group classifies non-derivative financial assets into the following categories: financial assets at fair value through profit or loss, held-to-maturity financial assets, loans and receivables and available for-sale financial assets.
Financial assets at fair value through profit or lossA financial asset is classified as at fair value through profit or loss if it is classified as held for trading or is designated as such on initial recognition. Financial assets are designated as at fair value through profit or loss if the Group manages such investments and makes purchase and sale decisions based on their fair value in accordance with the Group’s documented risk management or investment strategy. Attributable transaction costs are recognised in profit or loss as incurred. Financial assets at fair value through profit or loss are measured at fair value and changes therein, which takes into account any dividend income, are recognised in the statement of profit or loss and other comprehensive income.Financial assets designated as at fair value through profit or loss comprise equity securities that otherwise would have been classified as available for sale.
Held-to-maturity financial assetsIf the Group has the positive intent and ability to hold debt securities to maturity, then such financial assets are classified as held to maturity. Held-to-maturity financial assets are recognised initially at fair value plus any directly attributable transaction costs. Subsequent to initial recognition, held-to-maturity financial assets are measured at amortised cost using the effective interest method, less any impairment losses.
Notes to the Financial Statementsas at and for the year ended 31 December 2016

Annual Report 2016
89
Available-for-sale financial assetsAvailable-for-sale financial assets are non-derivative financial assets that are designated as available for sale or are not classified in any of the above categories of financial assets. Available-for-sale financial assets are recognised initially at fair value plus any directly attributable transaction costs.
Subsequent to initial recognition, they are measured at fair value and changes therein, other than impairment losses and foreign currency differences on available-for-sale debt instruments, are recognised in other comprehensive income and presented by the fair value reserve in equity. When an investment is derecognised, the gain or loss accumulated in equity is reclassified to profit or loss.
Available-for-sale financial assets comprise equity securities and debt securities.
Loans and receivables
Loans and receivables are financial assets with fixed or determinable payments that are not quoted in an active market. Such assets are recognised initially at fair value plus any directly attributable transaction costs. Subsequent to initial recognition, loans and receivables are measured at amortised cost using the effective interest method, less any impairment losses.
Non-derivative financial assets comprise investment in associates, loans to associates, trade & other receivables and cash and cash equivalents.
a) Investment in associatesInvestments in associates are recognised initially at cost plus any directly attributable transaction costs. Subsequent to initial recognition, investment in associates are measured at cost less impairment loss, if any.
b) Loans to associatesLoans to associates are recognised initially at fair value plus any directly attributable transaction costs. Subsequent to initial recognition, these are measured at amortised cost using the effective interest method, less any impairment losses.
c) Trade & other receivablesTrade & other receivables are financial assets with fixed or determinable payments that are not quoted in an active market. Such assets are recognised initially at fair value plus any directly attributable transaction costs. Subsequent to initial recognition trade & other receivables are measured at amortised cost using the effective interest method, less any bad debts provision.
d) Cash and cash equivalentsCash and cash equivalents comprise cash in hand, cash at bank including short notice deposits and fixed deposits having maturity of three months or less that are subject to an insignificant risk of changes in their fair value, and are used by the Group in the management of its short-term commitments.
3.2.2 Non-derivative financial liabilitiesFinancial liabilities are recognised initially on the trade date at which the Group becomes a party to the contractual provisions of the instrument.
The Company derecognises a financial liability when its contractual obligations are discharged, cancelled or expired.
Non-derivative financial liabilities comprise trade & other payables, and interest bearing borrowings.
a) Trade & other payablesTrade & other payables are recognised initially at fair value less any directly attributable transaction costs. Subsequent to initial recognition, trade & other payables are measured at amortised cost using the effective interest method.
Notes to the Financial Statementsas at and for the year ended 31 December 2016

Annual Report 2016
90
b) BorrowingsInterest-bearing borrowings include short term bank loan. Interest-bearing borrowings are recognised initially at fair value less any directly attributable transaction costs. Subsequent to initial recognition, interest-bearing borrowings are stated at amortised cost using the effective interest method.
3.3 Share capitalOrdinary shares are classified as equity. Incremental costs directly attributable to the issue of ordinary shares are recognised as a deduction from equity, net of any tax effects. Paid up share capital represents total amount contributed by the shareholders and bonus shares issued by the Company to the ordinary shareholders. Holders of ordinary shares are entitled to receive dividends as declared from time to time and are entitled to vote at shareholders' meetings. In the event of a winding up of the Company, ordinary shareholders rank after all other shareholders and creditors and are fully entitled to any residual proceeds of liquidation.
3.4 Property, plant and equipmentItems of property, plant and equipment are measured at cost less accumulated depreciation and impairment losses, if any. Cost includes expenditures that are directly attributable to the acquisition of the property, plant and equipment.
Subsequent expenditure is capitalised only when it is probable that the future economic benefits associated with the expenditure will flow to the Group. Ongoing repairs and maintenance is expensed as incurred.
An asset is derecognised on disposal or when no future economic benefits are expected from its use and subsequent disposal. Any gain or loss on disposal of an item of property, plant and equipment (calculated as the difference between the net proceeds from disposal and the carrying amount of the item) is recognised as gain or loss in the statement of profit or loss and other comprehensive income.
3.4.1 Depreciation on property, plant and equipmentItems of property, plant and equipment are depreciated on a straight-line basis in profit or loss over the estimated useful lives of each component. Capital-work-in-progress and land are not depreciated. Depreciation on addition to fixed assets is charged from the day of their acquisition and charging of depreciation on property, plant and equipment ceases from the day on which the deletion thereof takes place. Depreciation continues to be charged on each item of property, plant and equipment until written down value of such fixed asset is reduced to Taka one.
Rates of depreciation on various classes of property, plant and equipment are as under:
Category of property, plant and equipment Rate (%)Factory building 2.5-5General building 2.5-20Head Office building 2.5-5Plant and machinery 5-10Mobile plant 10Electrical installation 10-20Gas pipeline 10-20Furniture, fixture and equipment 10Office equipment 10-20Communication equipment 10-20Tools and appliances 10-20Vehicles 10-20Fire fighting equipment 20
Depreciation methods, useful lives and residual values are reviewed at each reporting date and adjusted if appropriate. Land is not depreciated as it is deemed to have an indefinite life.
Notes to the Financial Statementsas at and for the year ended 31 December 2016

Annual Report 2016
91
3.5 Capital work-in-progressCapital work in progress is stated at cost less impairment, if any, until the construction is completed. Upon completion of construction, the cost of such assets together with the cost directly attributable to construction, including capitalised borrowing costs are transferred to the respective class of asset. No depreciation is charged on capital work in progress.
3.6 Intangible assetsIntangible assets that are acquired by the Group (such as designs and trade marks for manufacture of ceramic tiles and sanitary ware and pharmaceuticals products) and have finite useful lives are measured at cost less accumulated amortisation and accumulated impairment losses, if any.
Subsequent expenditure is capitalised only when it increases the future economic benefits embodied in the specific asset to which it relates.
Intangible assets are amortised on a straight-line basis in profit or loss over their estimated useful lives of 2 to 3 years from the date that they are available for use.
Amortisation methods, useful lives and residual values are reviewed at each reporting date and adjusted if appropriate.
3.7 Leased assetsLeases in terms of which the Group assumes substantially all of the risks and rewards of ownership are classified as finance leases. On initial recognition, the leased asset is measured at an amount equal to the lower of its fair value and the present value of the minimum lease payments. Subsequent to initial recognition, the asset is accounted for in accordance with the accounting policy applicable to that asset.
Lease payments
In respect of finance lease, lease payments are apportioned between finance charges and reduction of lease liability so as to achieve a constant rate of interest on the remaining balance of liability. Finance charges are reflected in profit or loss.
Operating leases payments are recognised as an expense in profit or loss on a straight-line basis over the term of the lease. Lease incentives received are recognised as an integral part of the total lease expense, over the term of the lease.
3.8 InventoriesInventories are measured at the lower of cost and net realisable value. The cost of inventories is based on the weighted average cost principle, and includes expenditure incurred in acquiring the inventories, production or conversion costs, and other costs incurred in bringing them to their existing location and condition. In the case of manufactured inventories and work in progress, cost includes an appropriate share of production overheads based on normal operating capacity. Raw materials in transit are valued at cost.
Net realisable value (NRV) is the estimated selling price in the ordinary course of business, less estimated cost of completion and any estimated costs necessary to make the sale.
3.9 ImpairmentNon-derivative financial assets
Financial assets not classified as at fair value through profit or loss, are assessed at each reporting date to determine whether there is objective evidence that it is impaired. A financial asset is impaired if objective evidence indicates that a loss event has occurred after the initial recognition of the asset, and that the loss event had a negative effect on the estimated future cash flows of that asset that can be estimated reliably.
Notes to the Financial Statementsas at and for the year ended 31 December 2016

Annual Report 2016
92
Non-financial assets
The carrying amount of the non-financial assets, other than inventories are reviewed at each reporting date to determine whether there is any indication of impairment. If any such indication exists then the assets' recoverable amounts are estimated. For intangible assets that have indefinite lives, recoverable amount is estimated at each reporting date. An impairment loss is recognised if the carrying amount of an asset or its cash generating unit (CGU) exceeds its estimated recoverable amount.
Calculation of recoverable amount
The recoverable amount of an asset is the greater of its value in use and its fair value less costs to sell. In assessing value in use, the estimated future cash flows are discounted to their present value using a pre-tax discount rate that reflects the current market assessment of the time value of money and risk specific to the asset. For an asset that does not generate significantly independent cash inflows, the recoverable amount is determined for the cash generating unit (CGU) to which the asset belongs.
Recognition of impairmentImpairment losses are recognised in profit or loss. Impairment losses in respect of CGUs are allocated first to reduce the carrying amount of any goodwill allocated to the CGU and then to reduce the carrying amount of other assets in the CGU on a pro-rata basis.
Reversal of impairmentAn impairment loss in respect of goodwill is not reversed. For other assets, an impairment loss is reversed only to the extent that the asset's carrying amount does not exceed the carrying amount that would have been determined, net of depreciation or amortisation, if no impairment loss had been recognised.
3.10 Employee benefit schemesThe Company maintains both defined contribution plan and defined benefit plan for its eligible permanent employees. The eligibility is determined according to the terms and conditions set forth in the respective deeds.
Defined contribution plan (provident fund)Defined contribution plan is a post employment benefit plan under which the Company provides benefits to one or more employees. The recognised Employees Provident Fund is considered as defined contribution plan as it meets the recognition criteria specified for this purpose. All permanent employees contribute 10 percent of their basic salary to the provident fund and the Company also makes equal contribution to the fund. These are administered by the Board of Trustees. The contributions are invested separately from the company's assets.
Contribution to defined contribution plan is recognised as an expense when an employee has rendered services to the Company. The legal and constructive obligation is limited to the amount it agrees to contribute to the fund.
Defined benefit plan A defined benefit plan is a post-employment benefit plan other than a defined contribution plan. The Company’s net obligation in respect of defined benefit plans is calculated secarately for each plan by estimating the amount of future benefit that employees have earned in return for their service in the current and prior periods.
Permanent employees are entitled to gratuity on the basis of his latest basic salary for a completed year of service or for service for a period of more than six months, salary of minimum 30 days, or salary of 45 days for a continuous service for more than ten years, it shall be in addition to any payment of compensation or payment of any wage or allowance in lieu of notice due to termination of services of a worker on different grounds. The expected cost of this benefit is included in respective annual statement of profit or loss and other comprehensive income over the period of employment.
Notes to the Financial Statementsas at and for the year ended 31 December 2016

Annual Report 2016
93
3.11 Workers' profit participation fund and welfare fund (WPPF)The Company provides 5% of its net profit before tax after charging such expense as WPPF in accordance with "The Bangladesh Labour (Amendment) Act 2013".
3.12 ProvisionsProvisions are recognised on the reporting date if, as a result of past events, the Company has a present legal or constructive obligation that can be estimated reliably, and it is probable that an outflow of economic benefits will be required to settle the obligation.
3.13 Revenue recognitionRevenue is measured at fair value of consideration received or receivable. Revenue from sale of goods is recognised when the company has transferred significant risk and rewards of ownership of the goods to the buyer and the revenue and costs incurred to effect the transaction can be measured reliably in compliance with the requirements of Bangladesh Accounting Standard (BAS) -18 "Revenue".
3.14 Finance income and expensesFinance income comprises interest income on fixed deposits, Short Notice Deposit (SND) and amounts due from related parties. Interest income is recognized in profit or loss as it accrues, using the effective interest rate method.
Finance costs comprises interest expense on overdraft, LTR, term loan, short term borrowings and finance lease. All finance expenses are recognised in the statement of profit or loss and other comprehensive income.
Borrowing costs that are not directly attributable to the acquisition, construction or production of a qualifying asset are recognised in profit or loss using the effective interest method.
Foreign currency gains and losses on financial assets and financial liabilities are reported on a net basis as either finance income or finance cost depending on whether foreign currency movements are in a net gain or net loss position.
3.15 Foreign currencyTransactions in foreign currencies are translated to Taka at the foreign exchange rates prevailing on the date of transaction. All monetary assets and liabilities denominated in foreign currencies at reporting date are translated to Taka at the rates of exchange prevailing on that date. Resulting exchange differences arising on the settlement of monetary items or on translating monetary items at the end of the reporting period are recognised in the statement of profit or loss and other comprehensive income as per Bangladesh Accounting Standard (BAS) - 21 "The Effects of Changes in Foreign Exchange Rates".
3.16 TaxationIncome tax expenses represent current tax and deferred tax. Income tax expense is recognised in the statement of profit or loss and other comprehensive income except to the extent that it relates to items recognised directly in equity, in which case it is recognised in equity.
Current tax:Current tax is the expected tax payable on the taxable income for the year, using tax rates enacted or substantially enacted at the reporting date, and any adjustment to tax payable in respect of previous year. Provisions for corporate income tax is made following the rate applicable for companies as per Finance Act 2016.
Deferred tax:Deferred tax has been recognised in accordance with Bangladesh Accounting Standard (BAS) - 12 "Income taxes". Deferred tax is provided using the liability method for temporary differences between the carrying amount of assets and liabilities for financial reporting purposes and the amount used for taxation purpose. Deferred tax is determined at the effective income tax rate prevailing at the reporting date.
Notes to the Financial Statementsas at and for the year ended 31 December 2016

Annual Report 2016
94
A deferred tax asset is recognised for unused tax losses, tax credits and deductible temporary differences to the extent that it is probable that future taxable profits will be available against which they can be utilised. Deferred tax assets are reviewed at each reporting date and are reduced to the extent that it is no longer probable that the related tax benefit will be realised.
3.17 Earning per shareThe Company presents basic and diluted (when dilution is applicable) earnings per share (EPS) for its ordinary shares. Basic EPS is calculated by dividing the profit or loss attributable to ordinary shareholders of the Company with the weighted average number of ordinary shares outstanding during the year, adjusted for the effect of change in number of shares for bonus issue. Diluted EPS is determined by adjusting the profit or loss attributable to ordinary shareholders and the weighted average number of ordinary shares outstanding, for the effects of all dilutive potential ordinary shares. However, dilution of EPS is not applicable for these financial statements as there was no dilutive potential ordinary shares during the relevant years.
3.18 Determination and presentation of operating segmentDetails of product-wise segment reporting as required by BFRS - 8 "operating segments" is followed.
3.19 ContingenciesContingent liability
Contingent liability is a possible obligation that arises from past events and whose existence will be confirmed only by the occurrence or non-occurrence of one or more uncertain future events not wholly within the control of the entity.
Contingent liability should not be recognised in the financial statements, but may require disclosure. A provision should be recognised in the year in which the recognition criteria of provision have been met.
Contingent asset
Contingent asset is a possible asset that arises from past events and whose existence will be confirmed only by the occurrence or non-occurrence of one or more uncertain future events not wholly within the control of the entity.
A contingent asset must not be recognised. Only when the realisation of the related economic benefits is virtually certain should recognition take place provided that it can be measured reliably because, at that point, the asset is no longer contingent.
3.20 Statement of cash flowsStatement of cash flows is prepared under direct method in accordance with Bangladesh Accounting Standard (BAS) - 7 "Statement of cash flows" as required by the Securities and Exchange Rules 1987.
3.21 Events after the reporting yearEvents after the reporting period that provide additional information about the Company's position at the reporting date are reflected in the financial statements. Material events after the reporting year that are not adjusting events are disclosed by way of note.
3.22 Comparatives and reclassificationComparative information have been disclosed in respect of 2015 for all numerical information in the financial statements and also the narrative and descriptive information when it is relevant for understanding of the current year's financial statements.
To facilitate comparison, certain relevant balances pertaining to the previous year have been rearranged/reclassified whenever considered necessary to confirm to current year's presentation.
Notes to the Financial Statementsas at and for the year ended 31 December 2016

Annual Report 2016
95
4. P
rope
rty,
pla
nt a
nd e
quip
men
t 20
16Am
ount
s in
Tak
a
Parti
cular
s
C O
S T
D E P
R E
C I A
T I O
N
Net b
ook
valu
e as a
t 31
Dec
2016
Balan
ce as
at
01 Ja
n 201
6 Ad
dition
due
to ac
quisi
tion
Addi
tions
du
ring t
he
year
Sale/
dispo
sal
durin
g the
ye
ar
Balan
ce as
at
31 D
ec 20
16
Rate
(%
)Ba
lance
as at
01 Ja
n 2016
Ad
dition
due
to ac
quisi
tion
Char
ged
durin
g the
ye
ar
Adjus
tmen
t du
ring
the y
ear
Balan
ce as
at
31 D
ec 20
16
Land
790,1
57,35
7 -
- -
790,1
57,35
7 -
-
- -
- -
790,1
57,35
7 Fa
ctory
build
ing 48
6,550
,770
- 39
9,135
,849
- 88
5,686
,619
2.5-5
254,7
67,60
1 -
34,25
4,266
-
289,0
21,86
7 59
6,664
,752
Office
build
ing 19
9,973
,534
- 2,
135,8
92
- 20
2,109
,426
2.5-5
81,67
4,994
-
10,16
9,456
-
91,84
4,450
11
0,264
,976
Plant
and m
achin
ery 3,
525,5
00,74
9 -
1,570
,824,4
61
- 5,
096,3
25,21
0 5-
10 2,
544,0
72,04
8 -
296,6
86,16
7 -
2,840
,758,2
15
2,255
,566,9
95
Mobil
e plan
t 10
3,009
,939
- 13
,297,8
40
- 11
6,307
,779
10 74
,859,6
97
- 8,
014,1
18
- 82
,873,8
15
33,43
3,964
Ele
ctrica
l insta
llatio
n 18
3,272
,165
- 58
,192,4
82
- 24
1,464
,647
10-2
0 15
7,552
,492
- 12
,407,0
66
- 16
9,959
,558
71,50
5,089
Ga
s pipe
line
48,13
6,891
-
21,51
0,403
-
69,64
7,294
10
-20
43,15
5,571
-
2,38
3,926
-
45,53
9,497
24
,107,7
97
Furn
iture
and fi
xtures
30,95
8,310
2,
569,6
44
- 33
,527,9
54
10 21
,298,4
83
- 2,
883,0
18
- 24
,181,5
01
9,34
6,453
Offi
ce eq
uipme
nt 95
,375,1
11
- 3,
920,2
47
(112
,730)
99,18
2,629
10
-20
19,99
0,457
-
17,19
9,735
(7
5,275
) 37
,114,9
17
62,06
7,711
Co
mmun
icatio
n equ
ipmen
t 10
,133,0
36
- 1,
128,2
97
- 11
,261,3
33
10-2
0 4,
149,0
46
- 1,
221,3
64
- 5,
370,4
10
5,89
0,923
To
ols an
d app
lianc
es 8,
739,4
26
- 8,
330,4
43
- 17
,069,8
69
10-2
0 5,
748,1
54
- 87
1,759
-
6,61
9,913
10
,449,9
56
Vehic
les 70
,061,5
29
- 5,
140,6
69
(1,68
2,494
) 73
,519,7
04
10-2
0 33
,009,6
75
- 6,
394,6
33
(1,54
7,643
) 37
,856,6
65
35,66
3,039
Fir
e figh
ting e
quipm
ents
3,63
1,012
-
- -
3,63
1,012
20
3,63
1,012
-
- -
3,63
1,012
-
Total a
t 31 D
ecemb
er 201
6 5,
555,4
99,82
9 -
2,08
6,186
,228
(1,79
5,224
) 7,
639,8
90,83
3 3,
243,9
09,23
0 -
392,4
85,508
(1,
622,9
18)
3,634
,771,8
20
4,005
,119,0
13
Not
es t
o th
e Fin
anci
al S
tate
men
tsas
at a
nd fo
r th
e ye
ar e
nded
31
Dec
embe
r 20
16

Annual Report 2016
96
4.(a
) RA
K Se
curi
ty a
nd S
ervi
ces
(Pvt
.) Lt
d. (A
cqui
siti
on C
ompa
ny)
Amou
nts
in T
aka
Parti
cular
sC
O S
TD
E P R
E C I
A T
I O N
Net b
ook v
alue a
s at
31 D
ec 20
15Ba
lance
as at
20
Oct
2015
Ad
ditio
ns du
ring
the y
ear
Sale/
dispo
sal du
ring
the ye
arBa
lance
as at
31
Dec
2015
Ra
te
(%)
Balan
ce as
at
20 O
ct 20
15
Char
ged d
urin
g th
e yea
rAd
justm
ent d
uring
th
e yea
rBa
lance
as at
31
Dec
2015
Land
7,59
6,466
-
- 7,
596,4
66
- 7,5
96,46
6 Fu
rnitu
re an
d fixtu
res 52
4,848
-
(59,5
87)
465,2
61
10 20
3,077
8,
270
(28,5
85)
182,7
62
282,4
99
Office
equip
ment
1,21
0,380
-
(268
,780)
941,6
00
10 60
3,708
11
,216
(226
,876)
388,0
48
553,5
52
Tools
and a
pplia
nces
136,1
05
- (1
6,350
) 11
9,755
20
109,9
96
1,31
2 (1
0,072
) 10
1,236
18
,519
Vehic
les 2,
389,7
25
- -
2,38
9,725
20
995,1
25
63,88
2 1,0
59,00
7 1,3
30,71
8 To
tal at
31 De
cemb
er 20
15 11
,857,5
24
(344
,717)
11,51
2,807
1,
911,9
06
84,68
0 (2
65,53
3) 1,
731,0
53
9,78
1,754
201
5Am
ount
s in
Tak
a
Parti
cular
s
C O
S T
D E P
R E
C I A
T I O
NNe
t boo
k va
lue a
s at 3
1 De
c 201
5Ba
lance
as at
01
Jan 2
015
Addit
ion du
e to
acqu
isitio
n
Addi
tions
du
ring t
he
year
Sale/
dispo
sal
durin
g the
year
Balan
ce as
at
31 D
ec 20
15
Rate
(%
)Ba
lance
as at
01 Ja
n 2015
Addit
ion du
e to
acqu
isitio
n
Char
ged
durin
g the
ye
ar
Adjus
tmen
t du
ring t
he ye
arBa
lance
as at
31
Dec
2015
Land
763,3
96,64
1 7,
596,4
66
19,16
4,250
-
790,1
57,35
7 -
- -
- -
790,1
57,35
7 Fa
ctory
build
ing 46
2,050
,577
- 24
,500,1
93
- 48
6,550
,770
2.5-5
232,0
33,10
3 -
22,73
4,498
-
254,7
67,60
1 23
1,783
,169
Facto
ry offi
ce bu
ilding
83,56
8,695
-
12,75
7,294
-
96,32
5,989
2.5
-20 33
,969,0
10
- 4,
184,2
42
- 38
,153,2
52
58,17
2,737
He
ad offi
ce bu
ilding
103,6
47,54
5 -
- -
103,6
47,54
5 2.5
-5 38
,339,3
65
- 5,
182,3
77
- 43
,521,7
42
60,12
5,803
Pla
nt an
d mac
hinery
3,14
1,538
,261
- 38
3,962
,488
- 3,5
25,50
0,749
5-
10 2,
350,5
70,89
3 -
193,5
01,15
5 -
2,544
,072,0
48
981,4
28,70
1 Mo
bile p
lant
92,97
9,617
-
10,03
0,322
-
103,0
09,93
9 10
67,86
8,822
-
6,99
0,875
-
74,85
9,697
28
,150,2
42
Electr
ical in
stalla
tion
176,3
68,70
8 -
6,90
3,457
-
183,2
72,16
5 10
-20
148,5
10,24
0 -
9,042
,252
- 15
7,552
,492
25,71
9,673
Ga
s pipe
line
43,98
5,379
-
4,15
1,512
-
48,13
6,891
10
-20
42,10
7,920
-
1,04
7,651
-
43,15
5,571
4,
981,3
20
Furn
iture
and fi
xtures
27,39
5,225
52
4,848
3,
097,8
24
(59,5
87)
30,95
8,310
10
18,46
7,403
20
3,077
2,
656,5
88
(28,5
85)
21,29
8,483
9,
659,8
27
Office
equip
ment
23,35
3,785
1,
210,3
80
71,07
9,726
(2
68,78
0) 95
,375,1
11
10-2
0 16
,404,9
13
603,7
08
3,20
8,712
(2
26,87
6) 19
,990,4
57
75,38
4,654
Co
mmun
icatio
n equ
ipmen
t 7,
373,5
33
- 2,
759,5
03
- 10
,133,0
36
10-2
0 3,
426,4
49
- 72
2,597
-
4,14
9,046
5,
983,9
90
Tools
and a
pplia
nces
7,61
1,979
13
6,105
1,
007,6
92
(16,3
50)
8,73
9,426
10
-20
5,01
5,836
10
9,996
63
2,394
(1
0,072
) 5,
748,1
54
2,99
1,272
Ve
hicles
62,90
4,576
2,
389,7
25
4,76
7,228
-
70,06
1,529
10
-20
25,72
6,318
99
5,125
6,2
88,23
2 -
33,00
9,675
37
,051,8
54
Fire fi
ghtin
g equ
ipmen
ts 3,
631,0
12
- -
- 3,
631,0
12
20 3,
631,0
12
- -
- 3,
631,0
12
- Tot
al at 3
1 Dece
mber
2015
4,99
9,805
,533
11,85
7,524
54
4,181
,489
(344
,717)
5,555
,499,8
29
2,98
6,071
,284
1,91
1,906
25
6,191,
573
(265,5
33)
3,243
,909,2
30
2,311
,590,5
99
Not
es t
o th
e Fin
anci
al S
tate
men
tsas
at a
nd fo
r th
e ye
ar e
nded
31
Dec
embe
r 20
16

Annual Report 2016
97
2016 2015Taka Taka
4.1 Depreciation charged on the basis of the purpose of use Cost of sales (Note 22) 354,613,598 233,947,512 Administrative expenses (Note 24) 37,871,910 22,244,061
392,485,508 256,191,573
4.2 Disposal of property, plant and equipmentYear 2016
ParticularsOriginal cost Accumulated
depreciation Book value Receipt against sales/insurance
Profit/(loss) on disposal
Taka Taka Taka Taka TakaVehicle 1,682,494 1,547,643 134,851 687,050 552,199 Office equipment 112,730 75,275 37,455 20,100 (17,355)Total 1,795,224 1,622,918 172,306 707,150 534,844
Year 2015
ParticularsOriginal cost Accumulated
depreciation Book value Sale/Lost Profit/(loss) on disposal
Taka Taka Taka Taka Taka Furniture & fixture 59,587 28,585 31,002 13,100 (17,902)Office equipment 400,501 226,876 173,625 145,281 (28,344)Tools & appliances 16,350 10,072 6,278 300 (5,978)Total 476,438 265,533 210,905 158,681 (52,224)
5. Equity-accounted investees
Share of net profit/(loss) : Ownership Reprting
dateNature of
investment
Income Expenses Tax expenses
Profit or (loss)
Share of profit/(loss)
Taka Taka Taka Taka Taka31 December 2015RAK Security and Services (Pvt.) Ltd. 35% 31 Dec
2015 Associate 58,329,409 50,957,080 2,580,315 4,792,014 1,677,205
RAK Paints Pvt. Ltd. 47% 31 Dec 2015 Associate 716,421,865 776,932,553 (60,510,688) (21,749,142)
RAK Mosfly (Bangladesh) Pvt. Ltd. 20% 31 Dec
2015 Associate 87,089,723 91,561,460 - (4,471,737) (337,865)
(20,409,802)
Notes to the Financial Statementsas at and for the year ended 31 December 2016
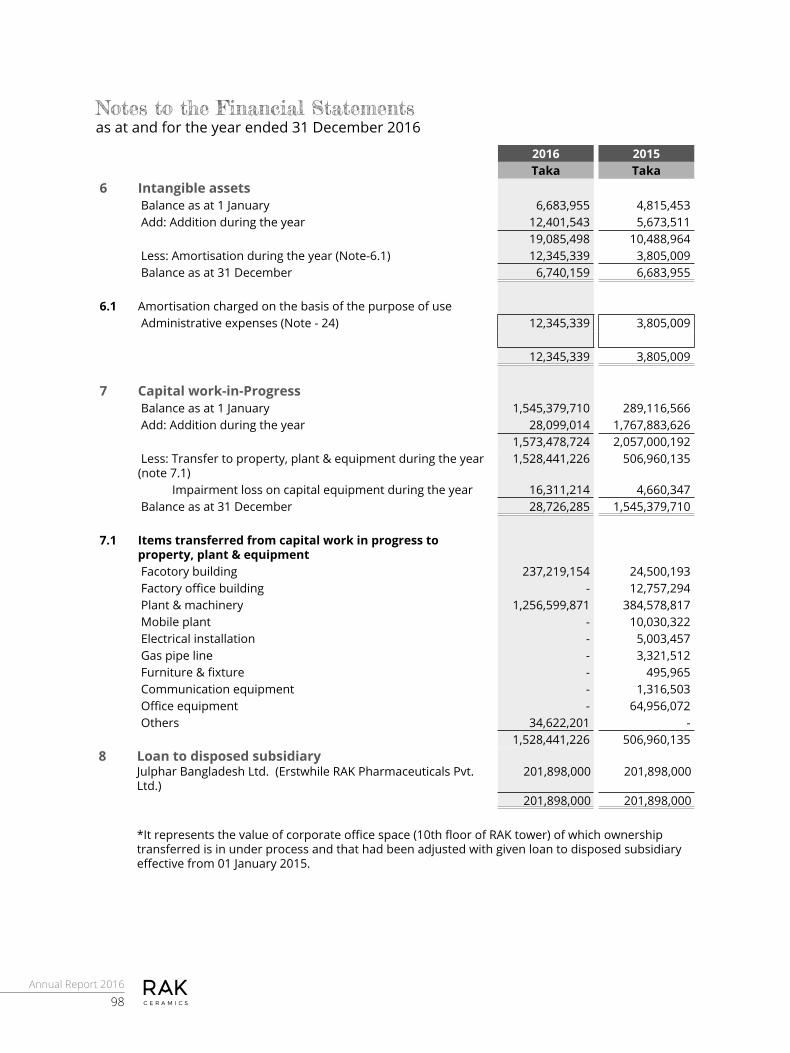
Annual Report 2016
98
2016 2015Taka Taka
6 Intangible assets Balance as at 1 January 6,683,955 4,815,453 Add: Addition during the year 12,401,543 5,673,511
19,085,498 10,488,964 Less: Amortisation during the year (Note-6.1) 12,345,339 3,805,009 Balance as at 31 December 6,740,159 6,683,955
6.1 Amortisation charged on the basis of the purpose of use Administrative expenses (Note - 24) 12,345,339 3,805,009
12,345,339 3,805,009
7 Capital work-in-Progress Balance as at 1 January 1,545,379,710 289,116,566 Add: Addition during the year 28,099,014 1,767,883,626
1,573,478,724 2,057,000,192 Less: Transfer to property, plant & equipment during the year (note 7.1)
1,528,441,226 506,960,135
Impairment loss on capital equipment during the year 16,311,214 4,660,347 Balance as at 31 December 28,726,285 1,545,379,710
7.1 Items transferred from capital work in progress to property, plant & equipment Facotory building 237,219,154 24,500,193 Factory office building - 12,757,294 Plant & machinery 1,256,599,871 384,578,817 Mobile plant - 10,030,322 Electrical installation - 5,003,457 Gas pipe line - 3,321,512 Furniture & fixture - 495,965 Communication equipment - 1,316,503 Office equipment - 64,956,072 Others 34,622,201 -
1,528,441,226 506,960,135 8 Loan to disposed subsidiary
Julphar Bangladesh Ltd. (Erstwhile RAK Pharmaceuticals Pvt. Ltd.)
201,898,000 201,898,000
201,898,000 201,898,000
*It represents the value of corporate office space (10th floor of RAK tower) of which ownership transferred is in under process and that had been adjusted with given loan to disposed subsidiary effective from 01 January 2015.
Notes to the Financial Statementsas at and for the year ended 31 December 2016

Annual Report 2016
99
2016 2015Taka Taka
9 Inventories Raw materials 844,891,203 852,533,747 Less : Provision for obsolescence made during the year (13,878,807) (4,665,753)
831,012,396 847,867,994 Stores and consumables spares 1,082,968,219 957,748,655 Finished goods 387,942,404 216,781,132 Work-in-process 96,173,371 37,268,593 Goods-in-transit 129,410,652 180,177,856
2,527,507,042 2,239,844,230 10 Trade and other receivables
Non current : Receivable against disposal of investment 74,025,000 148,050,000
Current : Trade receivables (Note 10.1) 548,029,728 553,947,412
548,029,728 553,947,412
Accrued interest (Note 10.2) 2,336,714 3,659,847 Accrued rental income 380,000 - Receivable against disposal of investment 68,095,114 80,780,114
618,841,556 638,387,373 10.1 Trade receivables
Receivables from local sales 548,029,728 553,303,108 Receivables from export sales - 644,304
548,029,728 553,947,412 10.2 Accrued interest
Interest accrued on FDR 2,336,714 3,659,847 2,336,714 3,659,847
11 Advances, deposits and prepaymentsAdvances:Employees 17,500 18,726 Land advance & others 36,776,888 28,421,141 Suppliers against material & services 225,082,941 159,240,033
261,877,329 187,679,900 Security and other deposits:Titas gas 22,262,600 20,215,520 Mymenshing Palli Bidyut Samity-2 1,955,000 1,955,000 VAT and supplementary duty (note 11.1) 36,231,093 58,015,290 Deposit with income tax authority 17,185,655 9,705,739 Deposit with VAT authority 7,530,001 7,530,001 Other deposits 1,491,853 1,491,853
86,656,202 98,913,403 Prepayments:House rent 9,176,471 10,715,974 Insurance 48,237,825 42,609,058 Others 300,141 240,057
57,714,437 53,565,089 406,247,968 340,158,392
11.1 Supplementary duty & VAT Balance as at 1 January 58,015,290 41,050,431 Add: Treasury deposit for SD & VAT purpose 1,121,800,000 987,440,000 Rebate of input VAT 273,305,798 298,183,784
Notes to the Financial Statementsas at and for the year ended 31 December 2016

Annual Report 2016
100
2016 2015Taka Taka
1,453,121,088 1,326,674,215 Add: Receivable - SD & VAT - 657,660
1,453,121,088 1,327,331,875 Less: SD & VAT on sales 1,416,418,729 1,268,899,645 Payable- SD & VAT 471,266 416,940
1,416,889,995 1,269,316,585 Balance as at 31 December 36,231,093 58,015,290
12 Advance income tax Balance as at 1 January 2,219,806,786 2,013,796,131 Add: Paid during the year 266,034,973 191,578,493 Add: Addition due to acquisition of RAK Security - 14,432,162 Balance as at 31 December (12.1 ) 2,485,841,759 2,219,806,786
12.1 Payment for the yearIncome year Year 2016 229,618,424 - Year 2015 187,267,285 150,935,063 Year 2014 295,379,428 295,379,428 Year 2013 392,118,319 392,118,319 Year 2012 336,319,884 336,319,884 Year 2011 328,082,711 327,998,384 Year 2010 265,684,491 265,684,491 Year 2009 218,091,876 218,091,876 Year 2008 85,378,847 85,378,847 Year 2007 124,813,161 124,813,161 Year 2006 23,087,333 23,087,333
2,485,841,759 2,219,806,786 13 Cash and cash equivalents
Cash in hand 9,880,543 1,877,620 Cash at banksHSBC (current account -001-013432-011,001-107580-011,001-096015-011, 001-096007-011 - BDT)
40,412,746 41,911,217
Standard Chartered Bank (current account - 01-6162940-01, 01-3767272-01 - BDT)
66,626,593 62,681,974
Citibank N.A. (current account - G0100001200262018 - BDT) 15,162,084 11,566,925 Dutch Bangla Bank Ltd. (current account - 117-110-12733,117-110-2481, 117.110.23474 -BDT)
142,302 18,647,617
HSBC (ERQ account - 001-013432-047 - USD) 6,549,288 4,595,333 Standard Chartered Bank (ERQ - 42-6162940-01 - USD) 973,813 267,806 EXIM Bank (SND account - 01513100031877 - BDT) 114,271 113,239 Standard Chartered Bank (SND account - 02-3767272-01 - BDT) 1,038,142 400,958 Dutch Bangla Bank Ltd. (SND account - 117-120-589, 117-120-330,117-120.2550 - BDT)
81,821,359 133,216,271
BRAC Bank (SND - 1513101731248001 - BDT) 356,703 354,466 Prime Bank Ltd. (SND - 12531010022563 - BDT) 20,282,604 14,168,711 Commercial Bank of Ceylon (SND-2817000777 - BDT.) 6,559,754 7,792,797
240,039,659 295,717,314
Notes to the Financial Statementsas at and for the year ended 31 December 2016

Annual Report 2016
101
2016 2015Taka Taka
IPO bank accountCitibank N.A. (RAK-IPO Central Account - G010001200262022 - BDT)
2,453,275 389,032
Citibank N.A. (RAK-IPO-NRB Subscription - G0100001200262042 - USD)
3,941,453 3,941,472
Citibank N.A. (RAK-IPO-NRB Subscription - G0100001200262026 - EURO)
153,603 153,608
Citibank N.A. (RAK-IPO-NRB Subscription - G0100001200262034 - GBP)
126,588 126,593
6,674,919 4,610,705 Dividend bank accountBRAC Bank (Current - 1510201731248001 - BDT) - 2010 2,627,831 2,636,151 BRAC Bank (Current - 1513201731248001 - BDT) - 2011 2,222,418 2,326,783 SCB (Current - 02-6162940-02- BDT) - 2012 3,899,024 3,893,227 SCB (Current - 02-6162940-03- BDT) - 2013 16,697,585 16,679,336 SCB (Current - 02-6162940-04- BDT) - 2014 5,082,074 5,685,749 SCB (Current - 02-6162940-05- BDT) - 2015 4,082,795 -
34,611,727 31,221,246 Investment in Fixed Deposit Receipt (FDR)HSBC 30,674,551 30,652,345 SCB 762,080 762,080 Prime Bank Ltd. - 155,000,000 Dutch Bangla Bank Ltd. 480,000,000 581,725,210
511,436,631 768,139,635
Total 802,643,479 1,101,566,520 14 Share Capital
Authorised : 600,000,000 ordinary shares of Taka 10/- each 6,000,000,000 6,000,000,000
Issued, subscribed, called and paid up : 336,850,611 ordinary shares of Taka 10/- each 3,368,506,110 3,368,506,110
Percentage of shareholdings2016 2015
% Taka % TakaRAK Ceramics PJSC, UAE 71.67 2,414,100,210 71.67 2,414,100,210 S.A.K. Ekramuzzaman 3.92 132,119,850 4.22 142,119,850 HH Sheikh Saud Bin Saqr Al Qassimi
0.00 280 0.00 280
Sheikh Omer Bin Saqr Al Qassimi 0.00 280 0.00 280 Sheikh Ahmad Bin Humaid al Qassimi
0.00 280 0.00 280
Hamad Abdulla Al Muttawa 0.00 140 0.00 140 Dr. Khater Massaad 0.00 140 0.00 140 Abdallah Massaad 0.00 140 0.00 140 Manoj Uttamrao Ahire 0.00 140 0.00 140 General Public 24.41 822,284,650 24.11 812,284,650
100.00 3,368,506,110 100.00 3,368,506,110
Notes to the Financial Statementsas at and for the year ended 31 December 2016

Annual Report 2016
102
Classification of shareholders by holding
Shareholder's range Number of shareholders Number of shares
2016 2015 2016 2015 Less than 500 shares 26,718 32,023 5,617,564 6,687,947 501 to 5,000 shares 8,021 8,478 11,426,420 11,550,626 5001 to 10,000 shares 618 623 4,593,958 4,591,318 10,001 to 20,000 shares 308 302 4,505,626 4,371,383 20,001 to 30,000 shares 99 110 2,463,012 2,717,968 30,001 to 40,000 shares 50 47 1,774,201 1,695,813 40,001 to 50,000 shares 38 31 1,760,460 1,400,209 50,001 to 100,000 shares 80 77 5,479,795 5,437,755 100,001 to 1,000,000 shares 63 76 18,732,649 21,716,461 Over 1,000,000 shares 11 8 280,496,926 276,681,131
36,005 41,775 336,850,611 336,850,611
2016 2015Taka Taka
15 Deferred tax liabilities Balance as at 1 January 75,811,194 78,418,185 Less : Deferred tax (income)/expenses 52,605,029 (2,606,991)Balance as at 31 December 128,416,223 75,811,194
16 Employees benefits payable
Provident fund 362,708 3,292,467 Gratuity fund 3,096,075 22,931,668
3,458,783 26,224,135
2016Provident fund Gratuity fund Total
Taka Taka TakaBalance as at 1 January 3,292,467 22,931,668 26,224,135 Add: Provision made during the year 50,299,846 34,732,847 85,032,693
53,592,313 57,664,515 111,256,828 Less: Payments made to fund during the year
53,229,605 54,568,440 107,798,045
Balance as at 31 December 362,708 3,096,075 3,458,783
2015Provident fund Gratuity fund Total
Taka Taka TakaBalance as at 1 January 2,715,018 68,456,325 71,171,343 Add: Provision made during the year 34,825,936 21,384,334 56,210,270 Add: Addition due to acquisition of RAK Security
375,674 1,852,138 2,227,812
37,916,628 91,692,797 129,609,425 Less: Payments made to fund during the year
34,624,161 68,761,129 103,385,290
Balance as at 31 December 3,292,467 22,931,668 26,224,135
Notes to the Financial Statementsas at and for the year ended 31 December 2016

Annual Report 2016
103
2016 2015Taka Taka
17 Borrowings Non-current: Term loan 854,877,901 497,742,616 Current portion of term loan (259,951,837) (77,117,814)
594,926,064 420,624,802 Current: Bank overdrafts 29,663,693 - Short-term borrowings 278,103,796 694,001,555 Current portion of term loan 259,951,837 77,117,814
567,719,326 771,119,369 Balance as at 31 December 1,162,645,390 1,191,744,171
17.1 Borrowings by maturity
At 31 December 2016 < 1 year 1-2 years 2-5 years > 5 years Total
Bank overdrafts 29,663,693 - - - 29,663,693 Short-term borrowings 278,103,796 - - - 278,103,796 Term loan 259,951,837 259,951,837 334,974,228 - 854,877,901
567,719,326 259,951,837 334,974,228 - 1,162,645,390
At 31 December 2015 < 1 year 1-2 years 2-5 years > 5 years Total Short-term borrowings 694,001,555 - - - 694,001,555 Term loan 77,117,814 124,789,765 295,835,037 - 497,742,616
771,119,369 124,789,765 295,835,037 - 1,191,744,171
2016 2015Taka Taka
18 Trade and other payablesTrade payables Payable to local suppliers 174,944,298 146,223,649 Payable to foreign suppliers 182,859,392 329,901,031 Payable to service provider 80,465,357 44,247,355 Payable to C & F agent 10,283,280 18,636,933
448,552,327 539,008,968
Other payables Tax deducted at source 15,971,206 18,885,935 VAT deducted at source 9,998,255 9,086,375 Dividend Payable 33,889,190 30,538,272 Unclaimed share application 20,838,116 18,773,636 Advance from cutomer against sales 8,237,699 22,393,794 Security deposit payable 1,638,234 1,939,219 Provisional liabilities - material & services 50,299,995 -
140,872,695 101,617,231 589,425,022 640,626,199
Notes to the Financial Statementsas at and for the year ended 31 December 2016

Annual Report 2016
104
2016 2015Taka Taka
19 Accrued expensesPower and gas 23,498,627 23,895,998 Staff cost 41,406,844 69,173,773 Audit fees 1,157,500 846,000 Professional charges 538,000 338,000 Interest on loans 1,495,042 4,035,081 Telephone 270,927 146,882 Provision of exchange rate difference 5,856,833 - Provision for freight 11,774,670 - Managing Director's remuneration (Note 19.1) 40,911,795 34,075,485 Worker's profit participation and welfare fund (Note 19.2) 61,056,166 54,064,400 Royalty and technical know-how fees (Note 19.3) 83,946,396 2,399,388 Others 3,464,070 7,643,278
275,376,870 196,618,285
19.1 Managing Director's remunerationBalance as at 1 January 34,075,485 30,682,702 Add: Provision made during the year 40,911,795 34,075,485 Less : Adjustment for prior year - (16,850,928)
74,987,280 47,907,259 Less: Paid to Managing Director 34,075,485 13,831,774 Balance as at 31 December 40,911,795 34,075,485
19.2 Worker's profit participation and welfare fundBalance as at 1 January 54,064,400 48,623,250 Add: Contribution made to the fund during the year 61,056,166 54,064,400 Less : Adjustment for prior year - (26,758,639)
115,120,566 75,929,011 Less: Payment made from the fund during the year 54,064,400 21,864,611 Balance as at 31 December 61,056,166 54,064,400
19.3 Provision for royalty and technical know-how fees Balance as at 1 January 2,399,388 38,352,170 Add: Provision made during the year 96,547,008 80,414,124 Add: Adjustment for prior year - 233,797
98,946,396 119,000,091 Less: Payment made during the year - 36,683,680 Less: Tax provision on disallowance of royalty paid for the year 2009
15,000,000 25,000,000
Less: Tax provision on disallowance of royalty paid for the year 2010
- 36,160,532
Less: Tax provision for delay payment of vat on royalty for the year 2010
- 18,756,491
Balance as at 31 December (note 35.1) 83,946,396 2,399,388
Notes to the Financial Statementsas at and for the year ended 31 December 2016

Annual Report 2016
105
2016 2015Taka Taka
20 Provision for income TaxBalance as at 1 January 2,583,742,941 2,182,344,567 Add: Provision made for the year 302,798,649 319,661,270 Add: Provision made for earlier year - 54,917,023 Add: Adjustment for prior year - 11,928,337 Add: Addition due to acquisition of RAK Security - 14,891,744 Balance as at 31 December (Note 20.1) 2,886,541,590 2,583,742,941
20.1 Provision for income TaxIncome year
Year 2016 302,798,649 Year 2015 323,397,728 323,397,728 Year 2014 381,571,248 381,571,248 Year 2013 364,979,858 364,979,858 Year 2012 341,267,796 341,267,796 Year 2011 328,376,284 328,376,284 Year 2010 350,044,556 350,044,556 Year 2009 266,823,984 266,823,984 Year 2008 147,117,914 147,117,914 Year 2007 80,163,573 80,163,573
2,886,541,590 2,583,742,941 21 Sales
Gross sales (Local) 7,086,463,915 6,303,404,641 Gross sales (Export) 14,869,100 26,559,633 Total Sales 7,101,333,015 6,329,964,274 Less: Supplementary Duty 505,431,618 452,357,549 VAT 934,489,819 818,306,322 Net sales 5,661,411,578 5,059,300,403
22 Cost of sales Materials consumed: Opening stock as at 1 January 847,867,994 699,653,297 Add: Purchase during the year 1,533,071,495 1,779,555,491
2,380,939,489 2,479,208,788 Less: Closing stock as at 31 December 831,012,396 847,867,994
1,549,927,093 1,631,340,794 Manufacturing overhead: Direct labour (Note 22.1.1) 444,973,745 323,585,760 Direct expenses: Power and gas 130,098,593 148,565,272 Repairs and indirect materials (Note 22.1.2) 689,372,362 612,028,483 Rental charges 1,033,670 821,739 Moulds and punches 16,012,411 32,029,495 Depreciation 354,613,598 233,947,512
Notes to the Financial Statementsas at and for the year ended 31 December 2016

Annual Report 2016
106
2016 2015Taka Taka
Royalty and technical know-how/assistance fees (22.1.3) 81,547,008 730,898 Other production overhead (Note 22.1.4) 66,552,096 36,417,434 Movement in stock (82,075,610) (122,577,947)
3,252,054,966 2,896,889,441
22.1.1 Direct labourSalary & wages 244,761,008 178,787,327 Overtime 39,468,500 22,298,872 Bonus 34,404,958 28,841,216 Incentive 3,817,616 11,807,366 Temporary labour wages 82,877,430 55,442,744 Gratuity 22,873,314 14,253,446 Employer's contribution to provident fund 14,709,574 10,663,602 Leave encashment 75,173 - Group life insurance 1,986,172 1,491,187
444,973,745 323,585,760 22.1.2 Repairs and indirect materials
Stores, spares, repair & maintenance 379,775,144 350,734,468 Packing expenses 309,597,218 261,294,015
689,372,362 612,028,483 22.1.3 Royalty and technical know-how/assistance fees
Royalty and technical know-how/assistance fees 96,547,008 80,414,124 Add : Adjustment for prior year - 233,797 Less : Tax provision on disallowance of royalty paid for the year 2009
15,000,000 25,000,000
Less : Tax provision on disallowance of royalty paid for the year 2010
- 36,160,532
Less : Tax provision for delay payment of vat on royalty for the year 2010
- 18,756,491
81,547,008 730,898 22.1.4 Other production overhead
Hotel fare and expenses for technician 4,763,388 5,210,385 Demurrage 1,644,495 4,142,877 Insurance 16,262,644 14,820,501 Hiring charges and transportation 2,195,697 - Impairment loss on capital equipment 16,311,214 4,660,347 Provision for obsolescence 13,878,807 4,665,753 Other expenses 11,495,851 2,917,571
66,552,096 36,417,434
Notes to the Financial Statementsas at and for the year ended 31 December 2016

Annual Report 2016
107
2016 2015Taka Taka
23 Other income Dividend income 250 - Miscellaneous income 174,266 - Rental income 2,400,000 2,400,000 Profit on sale of fixed assets 534,844 - Gain on disposal of investment against subsidiary - 600,568,643 Gain on disposal of investment against associates - 236,379,531 Revaluation gain on acquisition of RAK security shares - 1,850,536
3,109,360 841,198,710 24 Administrative expenses
Staff cost (note-24.1) 156,846,313 126,694,890 Annual General Meeting expenses 15,445,361 28,200,673 Telephone and postage 5,873,788 6,751,399 Office repair and maintenance (note 24.2) 6,357,274 9,413,660 Registration and renewal 1,064,355 1,138,470 Security and guard expenses 11,826,935 12,032,300 Electricity, gas and water 7,882,910 6,127,490 Depreciation 37,871,910 22,244,061 Amortisation 12,345,339 3,805,009 Legal and professional fees 8,678,487 8,546,078 Vehicle repair and maintenance 11,354,916 9,897,829 Rent, rate and tax 5,512,554 9,794,128 Loss on sale of property, plant and equipment - 52,224 Bad debts 357,846 - Write off of loan and interest to subsidiary : Current year - 10,100,916 Prior year - 578,548,552 CSR expenses 5,742,270 3,494,124 Managing Director's remuneration (note-24.3) 40,911,795 17,224,557 Technical consultancy & others 29,374,192 5,484,781
357,446,247 859,551,141 24.1 Staff cost
Salary & wages 105,028,514 83,344,859 Bonus 14,438,616 12,509,899 Incentive 3,176,143 5,517,327 Gratuity 7,983,353 5,874,315 Employer's contribution to provident fund 3,873,145 4,802,175 Leave encashment 210,439 - Group life insurance 587,102 609,490 Canteen and conveyance expenses 7,230,364 5,246,286 Staff uniform expenses 2,392,774 1,230,754 Travelling expenses 9,969,236 4,829,997 Medical expenses 1,429,061 423,089 Accommodation expenses 88,280 444,559 Other employee benefit 439,286 1,862,140
156,846,313 126,694,890
Notes to the Financial Statementsas at and for the year ended 31 December 2016

Annual Report 2016
108
2016 2015Taka Taka
24.2 Office repair & maintenanceRepairs office equipment 1,580,698 1,016,153 Office maintenance 4,776,576 8,397,507
6,357,274 9,413,660 24.3 Managing Director's remuneration
Provision made during the year 40,911,795 34,075,485 Less : Adjustment for prior year - (16,850,928)
40,911,795 17,224,557 Managing Director's remuneration represents provision made 3% of net profit before tax of RAK Ceramics (Bangladesh) Ltd.
25 Marketing & selling expenses Staff cost (note-25.1) 30,039,530 34,964,930 Advertisement 3,300,823 14,143,967 Freight and transportation 228,405,546 222,315,294 Performance rebates (note-25.2) 260,753,693 214,502,266 Business promotion 15,108,279 24,882,555 Discount 136,150,662 145,491,345 Travel, entertainment and others 30,561,801 31,770,638
704,320,334 688,070,995 25.1 Staff cost
Salary & wages 22,118,115 24,725,511 Bonus 2,999,899 3,543,159 Incentive 1,120,679 2,881,905 Gratuity 1,636,563 1,830,280 Employer's contribution to provident fund 835,966 1,372,772 Group life insurance 125,620 179,488 Conveyance & food expenses 1,202,688 431,815
30,039,530 34,964,930 25.2 Performance rebates
Compensation to customer 6,616,203 18,351,094 Dealers' commission 102,695,348 91,585,364 Breakage commission 151,442,142 104,565,808
260,753,693 214,502,266 26 Finance income
Interest on bank account (SND) 3,356,834 6,584,014 Interest on loan to associate - 13,353,532 Interest on FDR 13,781,872 58,486,010 Exchange gain 3,891,179 11,635,704
21,029,885 90,059,260 27 Financial expenses
Interest expenses 38,237,651 17,504,954 Bank charges 1,777,010 1,430,730
40,014,661 18,935,684 28 Contribution to worker's profit participation and
welfare fundProvision made during the year 61,056,166 54,064,400 Less : Adjustment for prior year - (26,758,639)
61,056,166 27,305,761
Notes to the Financial Statementsas at and for the year ended 31 December 2016

Annual Report 2016
109
2016 2015Taka Taka
29 Current taxCurrent year 302,798,649 320,817,413 Other tax provision - 54,917,023 Adjustment for prior year - 11,928,337
302,798,649 387,662,773 30 Financial risk management
The management has overall responsibility for the establishment and oversight of the Company’s risk management framework. The Company’s risk management policies are established to identify and analyse the risks faced by the Company, to set appropriate risk limits and controls, and to monitor risks and adherence to limits. Risk management policies, procedures and systems are reviewed regularly to reflect changes in market conditions and the Company’s activities. The Company has exposure to the following risks from its use of financial instruments.g Credit riskg Liquidity riskg Market risk
30.1 Credit riskCredit risk is the risk of financial loss to the Company if a client or counterparty to a financial instrument fails to meet its contractual obligations, and arises principally from the Company’s trade receivables and other receivables.
Management has a credit policy in place and the exposure to credit risk is monitored on an ongoing basis. In monitoring credit risk, debtors are grouped according to their risk profile, i.e. their legal status, financial condition etc. Trade & other receivable are mainly related to receivables from dealers, receivables from export sales, claim receivables, accrued interest and other receivables. The Company’s exposure to credit risk on accounts receivables is mainly influenced by the individual payment characteristics of customers.
The maximum exposure to credit risk is represented by the carrying amount of each financial asset in the statement of financial position.
a) Exposure to credit riskThe carrying amount of financial assets represents the maximum credit exposure. The maximum exposure to credit risk at the reporting date was:
USD USD Amounts in Taka As at 31 Dec
2016 As at 31 Dec
2015 As at 31 Dec
2016 As at 31 Dec
2015 Trade receivablesCustomer-Local - - 548,029,728 553,303,108 Customer-Export - 8,260 - 644,304
- 8,260 548,029,728 553,947,412
Other receivablesAccrued Interest 2,336,714 3,659,847 Accrued rental income 380,000 - Receivable against disposal of investment 142,120,114 228,830,114
144,836,828 232,489,961 Loan to disposed subsidiaryJulphar Bangladesh Ltd. (Erstwhile RAK Pharmaceuticals Pvt. Ltd.) 201,898,000 201,898,000
201,898,000 201,898,000
Cash equivalents 792,762,936 1,099,688,900
Notes to the Financial Statementsas at and for the year ended 31 December 2016
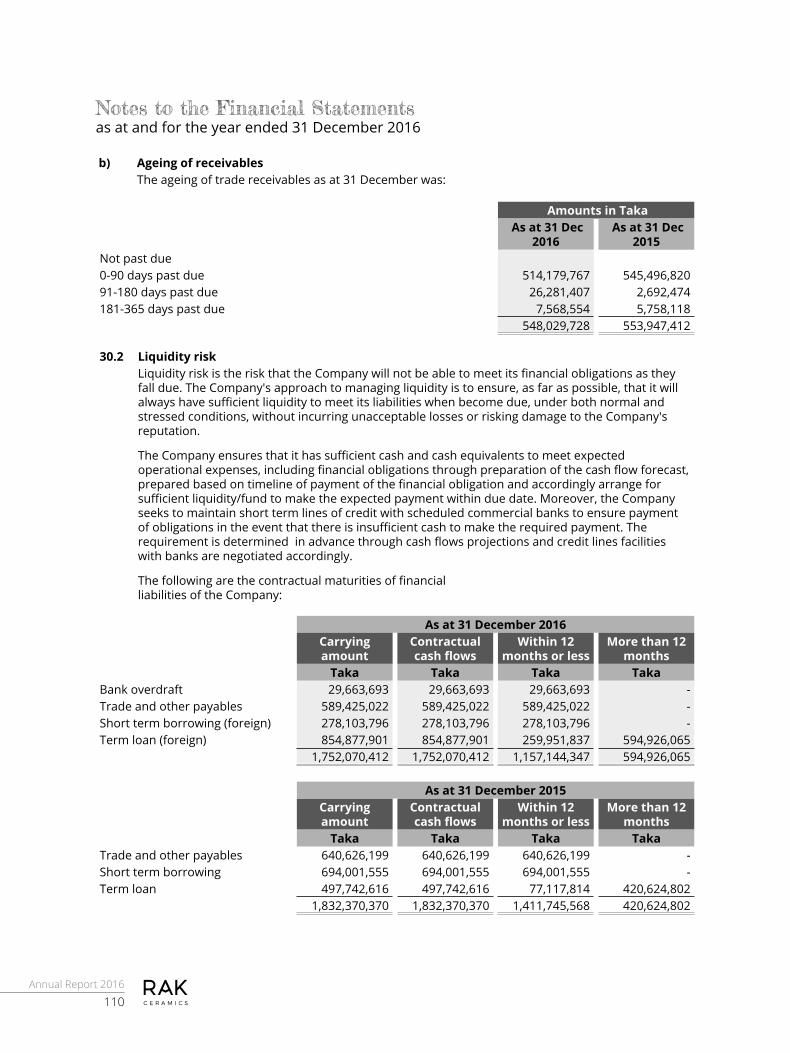
Annual Report 2016
110
b) Ageing of receivablesThe ageing of trade receivables as at 31 December was:
Amounts in Taka As at 31 Dec
2016 As at 31 Dec
2015 Not past due0-90 days past due 514,179,767 545,496,820 91-180 days past due 26,281,407 2,692,474 181-365 days past due 7,568,554 5,758,118
548,029,728 553,947,412
30.2 Liquidity riskLiquidity risk is the risk that the Company will not be able to meet its financial obligations as they fall due. The Company's approach to managing liquidity is to ensure, as far as possible, that it will always have sufficient liquidity to meet its liabilities when become due, under both normal and stressed conditions, without incurring unacceptable losses or risking damage to the Company's reputation.
The Company ensures that it has sufficient cash and cash equivalents to meet expected operational expenses, including financial obligations through preparation of the cash flow forecast, prepared based on timeline of payment of the financial obligation and accordingly arrange for sufficient liquidity/fund to make the expected payment within due date. Moreover, the Company seeks to maintain short term lines of credit with scheduled commercial banks to ensure payment of obligations in the event that there is insufficient cash to make the required payment. The requirement is determined in advance through cash flows projections and credit lines facilities with banks are negotiated accordingly.
The following are the contractual maturities of financial liabilities of the Company:
As at 31 December 2016Carrying amount
Contractual cash flows
Within 12 months or less
More than 12 months
Taka Taka Taka TakaBank overdraft 29,663,693 29,663,693 29,663,693 - Trade and other payables 589,425,022 589,425,022 589,425,022 - Short term borrowing (foreign) 278,103,796 278,103,796 278,103,796 - Term loan (foreign) 854,877,901 854,877,901 259,951,837 594,926,065
1,752,070,412 1,752,070,412 1,157,144,347 594,926,065
As at 31 December 2015Carrying amount
Contractual cash flows
Within 12 months or less
More than 12 months
Taka Taka Taka TakaTrade and other payables 640,626,199 640,626,199 640,626,199 - Short term borrowing 694,001,555 694,001,555 694,001,555 - Term loan 497,742,616 497,742,616 77,117,814 420,624,802
1,832,370,370 1,832,370,370 1,411,745,568 420,624,802
Notes to the Financial Statementsas at and for the year ended 31 December 2016

Annual Report 2016
111
30.3 Market riskMarket risk is the risk that changes in market prices such as foreign exchange rates and interest rates will affect the Company's income or the value of its holding of financial instruments. The objective of market risk management is to manage and control market risk exposures within acceptable parameters, while optimising the return.
a) Currency riskThe Company is exposed to currency risk on certain revenues and purchase of raw material, spare parts, accessories and capital item. Majority of the company's foreign currency purchase are denominated in USD and EURO. All the export proceeds are receipt in USD, 50% of export proceeds are crediting to export retention quota account and rest of the 50% are converted to Taka and crediting to company's current account.
i) Exposure to currency riskThe Company's exposure to foreign currency risk was as follows based on notional amounts (in Taka):
As at 31 December 2016 As at 31 December 2015GBP USD EURO JPY USD EURO JPY
Foreign currency denominated assetsReceivable from customers-Export
- - - - 8,260 - -
Cash at bank - 96,388 - - 62,348 - - - 96,388 - - 70,608 - -
As at 31 December 2016 As at 31 December 2015GBP USD EURO JPY USD EURO JPY
Foreign currency denominated liabilitiesTrade payables 164,899 1,274,984 797,167 - 635,721 1,240,389 - Short term borrowings - 3,100,548 375,259 - 2,148,305 5,932,170 5,145,000 Term loan - 10,893,763 - - 6,300,539 - - Royalty & Technical Fees - 1,061,940 - - 30,372 - -
164,899 16,331,235 1,172,426 - 9,114,937 7,172,559 5,145,000 Net exposure (164,899) (16,234,847) (1,172,426) - (9,044,329) (7,172,559) (5,145,000)
The Company has foreign exchange gain of Tk 3,891,179 during the year ended 31 December 2016 (31 December 2015: Exchange gain Tk 11,635,704).
The following significant exchange rates have been applied:
Exchange rate as at31 Dec 2016
31 Dec 2015
Taka TakaGBP 96.2662 116.3353 USD 78.5500 78.5000 EURO 82.3516 85.8006 JPY 0.6737 0.6518
ii) Foreign exchange rate sensitivity analysis for foreign currency expendituresA strengthening or weakening of the Taka, as indicated below, against the GBP, USD, EURO, and JPY at 31 December would have increased/(decreased) profit or loss by the amounts shown below.
Notes to the Financial Statementsas at and for the year ended 31 December 2016

Annual Report 2016
112
As at 31 December 2016 As at 31 December 2015 Profit or (loss) Profit or (loss)
Strengthening Weakening Strengthening WeakeningTaka Taka Taka Taka
At 31 DecemberGBP (3 percent movement) (5,100) 4,803 - - USD (3 percent movement) (502,109) 472,860 (279,722) 263,427 EURO (3 percent movement) (36,261) 34,148 (221,832) 208,909 JPY (3 percent movement) - - (159,124) 149,854
b) Interest rate riskInterest rate risk is the risk that arises due to changes in interest rates on borrowings. The Company is not significantly exposed to fluctuation in interest rates as it has neither floating interest rate bearing financial liabilities nor entered into any type of derivative instrument in order to hedge interest rate risk as at the reporting date.
ProfileAt the reporting date, the interest rate profile of the Company's interest bearing financial instruments was:
Carrying amount As at As at
31 December 2016
31 December 2015
Taka TakaFixed rate instrumentsFinancial assetsInvestment in FDR 511,436,631 768,139,635 Cash at banks 281,326,305 331,549,267 Financial liabilitiesTerm loan (Foreign) 854,877,901 497,742,616 Bank overdraft 29,663,693 - Short term borrowing (foreign) 278,103,796 694,001,555
Fair value of financial assets and liabilities of the Company together with carrying amount shown in the statement of financial position are as follows:
As at 31 December 2016 As at 31 December 2015Carrying amount Fair value Carrying
amount Fair value
Taka Taka Taka TakaFinancial assetsHeld to maturity assetsInvestment in FDR 511,436,631 511,436,631 768,139,635 768,139,635
Loans and receivablesTrade receivables 548,029,728 548,029,728 553,947,412 553,947,412 Other receivables 144,836,828 144,836,828 232,489,961 232,489,961 Loan to disposed subsidiary 201,898,000 201,898,000 201,898,000 201,898,000 Cash equivalents 792,762,936 792,762,936 1,099,688,900 1,099,688,900
Notes to the Financial Statementsas at and for the year ended 31 December 2016

Annual Report 2016
113
Financial liabilitiesLiabilities carried at amortised costsTerm loan 854,877,901 854,877,901 497,742,616 497,742,616 Bank overdraft 29,663,693 29,663,693 - - Trade and other payables 589,425,022 589,425,022 640,626,199 640,626,199 Short term borrowing (foreign)
278,103,796 278,103,796 694,001,555 694,001,555
Interest rates used for determining amortised costThe interest rates used to discount estimated cash flows, when applicable were as follows:
31 December 2016
31 December 2015
Investment in FDR 2.50%-4.00% 3.70%-7.00% Term loan Libor+3.00% Libor+3.00% Bank overdraft 8.00%-10.75% 12.00%-13.50% Short term bank loan (local currency)
8.00%-13.50% 12.00%-13.50%
Short term bank loan (foreign currency/USD)
Libor+(2.75%-3.00%) Libor+(2.75%-3.00%)
31 Related party disclosures under BAS-24List of related parties with whom transactions have taken place and their relationship as identified and certified by management:
Amount in Taka
31.1 Name of related party Relationship PeriodPurchase of goods/services
Sale of goods/
servicesOutstanding receivables
Outstanding payable Remuneration Loan Interest
receivables
RAK Power Pvt. Ltd Subsidiary
Current year 347,049,244 6,891,130 -
30,270,872 - - -
Previous year 287,431,234 5,478,261 -
27,282,047 - - -
RAK Security & Services (Pvt.) Ltd Subsidiary
Current year 94,606,305 - -
12,282,590 - - -
Previous year 77,977,779 - - 7,498,230 - - -
RAK Ceramics - UAE Parent
Current year 47,125,490 - -
21,118,318 - - -
Previous year 67,027,200 - 360,822 - - - -
Kea Printing & Packaging Industries
Other related party
Current year 112,892,298 - -
17,671,058 - - -
Previous year 96,773,812 - -
15,595,692 - - -
Palli Properties Pte. Ltd
Other related party
Current year 18,901,088 - - 1,277,772 - - -
Previous year 11,137,513 - - 1,253,443 - - -
Sky Bird Travel Agents Pvt. Ltd.
Other related party
Current year 5,553,673 - - - - - -
Previous year 4,551,466 - - 17,163 - - -
Green Planet Communications
Other related party
Current year 5,298,996 - - - - - -
Previous year 7,088,620 - - 290,323 - - -
Notes to the Financial Statementsas at and for the year ended 31 December 2016

Annual Report 2016
114
Name of related party Relationship PeriodPurchase of goods/services
Sale of goods/
servicesOutstanding receivables
Outstanding payable Remuneration Loan Interest
receivables
Global Business Associates Ltd.
Other related party
Current year - - - - - - -
Previous year 139,512 - - 12,150 - - -
Mohammed TradingOther
related party
Current year - 2,522,019,940 380,083,753 - - - -
Previous year - 1,711,216,467 397,263,967 - - - -
S.A.K. EkramuzzamanKey
Management Personnel
Current year - - - 40,911,795 40,911,795 - -
Previous year - - - 34,075,485 34,075,485 - -
Imtiaz HussainKey
Management Personnel
Current year - - - 680,520 9,588,240 - -
Previous year - - - 636,000 9,537,000 - -
31.2 Events after the reporting periodNo events, adjusting or non-adjusting, occurred after the date of statement of financial position which require adjustments or disclosures.
31.3 Paid to DirectorsDuring the year, provision was made as MD's remuneration for Taka. 40,911,795.During the year, Board meeting fees of Taka 450,000 was paid to the board members for attending the Board meetings.
32 Segment reportingThe company currently has three reportable segments which offer different products and services and are managed separately because they require different technology and marketing strategies. The following summary describes the operations of each segment:
Ceramics & Sanitary Ware: Engages in manufacturing and marketing of ceramics tiles, bathroom sets and all types of sanitary ware.
Power: Set-up power utilities and operate power-generating plants, transmission system and distribution system and to sell the generated electric power to any legal entity.
Security & services: Engages in providing security guarding, cleaning services, termite and pest control services and setup manpower technical training.
Notes to the Financial Statementsas at and for the year ended 31 December 2016

Annual Report 2016
115
31 December 2016Business Segments
Ceramic & sanitary
warePower Security and
ServicesInter
segmentPrior year
adjustment Entity total
Taka Taka Taka Taka Taka Taka
Revenue - external customers 5,577,443,970 26,937,134 57,030,474 - - 5,661,411,578
Revenue - inter segment - 347,049,244 96,512,158 (443,561,402) - -
Total segment revenue 5,577,443,970 373,986,378 153,542,632 (443,561,402) - 5,661,411,578
Cost of sales- external customer (2,906,473,929) (224,380,162) (121,200,876) - - (3,252,054,966)
Cost of sales- inter segment (448,546,679) (1,905,853) - 450,452,532 - -
Total segment cost of sales (3,355,020,608) (226,286,015) (121,200,876) 450,452,532 (3,252,054,966)
Gross profit 2,222,423,362 147,700,363 32,341,756 - 2,409,356,612
Other income 469,194 239,916 709,110
Dividend income 103,489,500 10,000 250 (103,499,500) - 250
Rental income 9,291,130 - - (6,891,130) - 2,400,000
Financial income 18,400,859 2,567,214 61,812 - - 21,029,885
Financial expenses (39,747,963) (256,318) (10,380) - - (40,014,661)
Depreciation (374,020,896) (18,093,909) (370,703) - - (392,485,508)
Other operating expenses (719,181,874) 8,824,166 (19,979,528) - - (730,337,236)
Segment profit before tax 1,221,123,312 140,991,432 12,043,207 - - 1,270,658,449
Income tax expense (253,189,745) (45,393,782) (4,215,122) - - (302,798,649)
Deferred tax (53,671,503) 1,066,474 - - - (52,605,029)
Non -Controlling interest - 472 0.38 - - 472
Profit for the year 915,254,299
Notes to the Financial Statementsas at and for the year ended 31 December 2016

Annual Report 2016
116
31 December 2015Business Segments
Ceramic & sanitary
warePower Security and
servicesInter
segmentPrior year
adjustment Entity total
Taka Taka Taka Taka Taka TakaRevenue - external customers 5,013,034,253 46,607,310 (341,160) - - 5,059,300,403
Revenue - inter segment - 287,431,234 15,751,786 (303,183,020) - -
Total segment revenue 5,013,034,253 334,038,544 15,410,626 (303,183,020) 5,059,300,403
Cost of sales- external customer (2,707,097,224) (180,169,235) (9,389,183) - (233,797) (2,896,889,441)
Cost of sales- inter segment (308,291,416) (369,868) - 308,661,283 - -
Total segment cost of sales (3,015,388,640) (180,539,103) (9,389,183) 308,661,283 (233,797) (2,896,889,441)
Gross profit 1,997,645,613 153,499,441 6,021,443 - (233,797) 2,162,410,962
Dividend income 58,775,000 - - (58,775,000) - Rental income 7,878,261 - - (5,478,261) 2,400,000 Gain on disposal of investment against subsidiary
- - - 600,568,643
Gain on disposal of investment against associates
- - - 236,379,531
Revaluation gain on acquisition of associates shares
- - - 1,850,536
Financial income 86,212,028 3,824,325 22,907 - 90,059,260 Financial expenses (18,812,730) (118,101) (4,853) - (18,935,684)Depreciation (237,990,276) (18,116,617) (84,680) - (256,191,573)Other operating expenses (812,419,898) 6,599,108 (2,651,550) - (808,472,340)
Provision relating to subsidiary loan and interest
(578,548,552) (578,548,552)
Adjustment relating to WPPF 26,758,639 26,758,639
Adjustment relating to Managing Director's remuneration
16,850,928 16,850,928
Elimination of investment loss of RAK Paints Pvt. Ltd.
24,675,000
Share of profit of equity-accounted investee
- - - (20,409,802)
Segment profit before tax 1,081,287,998 145,688,156 3,303,267 - - 1,479,395,549
Income tax expense (329,336,045) (45,242,248) (1,156,143) - (375,734,436)Adjustment relating to income tax (11,928,337) (11,928,337)
Deferred tax 3,328,681 (721,690) - 2,606,991 Non -Controlling interest - 486 0.10 - 487
Profit for the year 1,094,339,280
Notes to the Financial Statementsas at and for the year ended 31 December 2016

Annual Report 2016
117
2016 2015Taka Taka
33 Earnings per share (EPS)Calculation of earnings per share (EPS) is as under:Earnings attributable to the ordinary shareholdersProfit attributable to equity holders of the Company 915,254,299 1,094,339,280 No. of ordinary equity shares 336,850,611 336,850,611 Weighted average no. of equity shares outstanding (Note 33.1) 336,850,611 336,850,611 Earnings per share (EPS) for the year 2.72 3.25
33.1 Weighted average number of ordinary sharesThe weighted average number of ordinary shares outstanding during the year is the number of ordinary shares outstanding at the beginning of the year, adjusted by the number of ordinary shares issued during the year multiplied by a time-weighting factor. The time-weighting factor is the number of days that the shares are outstanding as a proportion of the total number of days in the year. The weighted average number of shares is calculated by assuming that the shares have always been in issue. This means that they have been issued at the start of the year presented as the comparative figures.
2016 2015Outstanding shares 336,850,611 336,850,611
336,850,611 336,850,611
33.2 Diluted earning per shareNo diluted earnings per share is required to be calculated for the year as there was no scope for dilution during these years.
34 Contingent liabilitiesThere are contingent liabilities on account of unresolved disputed corporate tax assessments and VAT claims by the authority aggregating to Tk 541,950,341 (31 Dec 2015: Tk 340,532,611). Considering the merits of the cases, it has not been deemed necessary to make provisions for all such disputed claims.
There is also contingent liability in respect of outstanding letters of credit of Tk 398,511,738 (31 Dec 2015: Tk 363,013,905) and letter of guarantee of Tk 42,310,078 (31 Dec 2015: Tk 38,625,334).
35 Other disclosures35.1 Changes in policy & estimates
Changes of royalty policy from 2.5% of net sales to 8% of PBT or 2.5% of net sales whichever is lower effective from 01 January 2012.
Notes to the Financial Statementsas at and for the year ended 31 December 2016

Annual Report 2016
118
RAK CERAMICS (BANGLADESH) LIMITED
Auditor’s Report and Financial Statements
as at and for the year ended 31 December 2016

Annual Report 2016
119
Independent Auditor’s Reportto the Shareholders ofRAK Ceramics (Bangladesh) Ltd.Report on the Financial StatementsWe have audited the accompanying financial statements of RAK Ceramics (Bangladesh) Ltd. which comprise the statement of financial position as at 31 December 2016 and the statement of profit or loss and other comprehensive income, statement of changes in equity and statement of cash flows for the year then ended, and a summary of significant accounting policies and other explanatory information.
Management’s Responsibility for the Financial StatementsManagement is responsible for the preparation and fair presentation of these financial statements in accordance with Bangladesh Financial Reporting Standards (BFRS) and for such internal control as management determines is necessary to enable the preparation of financial statements that are free from material misstatement, whether due to fraud or error.
Auditors’ ResponsibilityOur responsibility is to express an opinion on these financial statements based on our audit. We conducted our audit in accordance with Bangladesh Standards on Auditing (BSA). Those standards require that we comply with ethical requirements and plan and perform the audit to obtain reasonable assurance about whether the financial statements are free from material misstatement.
An audit involves performing procedures to obtain audit evidence about the amounts and disclosures in the financial statements. The procedures selected depend on the auditors’ judgment, including the assessment of the risks of material misstatement of the financial statements, whether due to fraud or error. In making those risk assessments, the auditor considers internal control relevant to the entity’s preparation and fair presentation of the financial statements in order to design audit procedures that are appropriate
in the circumstances, but not for the purpose of expressing an opinion on the effectiveness of the entity’s internal control. An audit also includes evaluating the appropriateness of accounting policies used and the reasonableness of accounting estimates made by management, as well as evaluating the overall presentation of the financial statements.
We believe that the audit evidence we have obtained is sufficient and appropriate to provide a basis for our audit opinion.
Opinion
In our opinion, the financial statements present fairly, in all material respects, the financial position of RAK Ceramics (Bangladesh) Ltd. as at 31 December 2016 and its financial performance and its cash flows for the year then ended in accordance with Bangladesh Financial Reporting Standards. (BFRS).
Report on other legal and regulatory requirementsIn accordance with the Companies Act 1994 and Securities and Exchange Rules 1987, we also report the following:
(a) we have obtained all the information and explanations which to the best of our knowledge and belief were necessary for the purpose of our audit and made due verification thereof;
(b) in our opinion, proper books of account as required by law have been kept by the Company so far as it appeared from our examination of those books;
(c) the statement of financial position and the statement of profit or loss and other comprehensive income dealt with by the report are in agreement with the books of account; and
(d) the expenditure incurred was for the purposes of the Company’s business.
Dated, 23 January 2017 (A. Qasem & Co.)
Chartered Accountants

Annual Report 2016
120
Notes 2016 2015 Taka Taka
AssetsProperty, plant and equipment 4 3,812,044,109 2,101,671,865 Intangible assets 5 6,740,159 6,683,955 Capital work in progress 6 28,726,284 1,545,379,710 Investment in subsidiary 7 360,379,950 360,379,950 Trade and other receivables 10 74,025,000 148,050,000
Total non-current assets 4,281,915,502 4,162,165,480
Inventories 9 2,461,037,120 2,182,676,306 Trade and other receivables 10 600,037,283 611,920,398 Loan to disposed subsidiary 8 201,898,000 201,898,000 Advances, deposits and prepayments 11 398,705,901 332,412,027 Advance income tax 12 2,280,196,137 2,059,429,603 Cash and cash equivalents 13 693,707,402 997,806,852
Total current assets 6,635,581,843 6,386,143,186 Total assets 10,917,497,345 10,548,308,666
EquityShare capital 14 3,368,506,110 3,368,506,110 Share premium 1,473,647,979 1,473,647,979 Retained earnings 1,291,214,523 1,219,078,987
Total equity 6,133,368,612 6,061,233,076 Liabilities
Deferred tax liability 15 91,907,602 38,236,099 Borrowings 17 594,926,064 420,624,802
Total non-current liabilities 686,833,666 458,860,901 Employees benefit payable 16 - 23,904,515 Borrowings 17 567,719,326 771,119,369 Trade and other payables 18 621,222,937 662,561,271 Accrued expenses 19 251,406,561 166,873,036 Provision for income tax 20 2,656,946,243 2,403,756,498
Total current liabilities 4,097,295,067 4,028,214,689 Total liabilities 4,784,128,733 4,487,075,590 Total equity and liabilities 10,917,497,345 10,548,308,666
The notes on pages 124 to 155 are an integral part of these financial statements.
RAK Ceramics (Bangladesh) Ltd.Statement of financial positionas at 31 December 2016
Dated, 23 January 2017
Company SecretaryDirectorManaging Director
(A. Qasem & Co.)Chartered Accountants
As per our report of same date

Annual Report 2016
121
Notes 2016 2015Taka Taka
Sales 21 5,577,443,970 5,013,034,253 Cost of sales 22 (3,355,020,608) (3,015,388,640)Gross profit 2,222,423,362 1,997,645,613
Other income 23 113,249,824 66,653,261 Administrative expenses 24 (332,594,844) (308,662,916)Marketing and selling expenses 25 (699,551,760) (687,682,858)
(918,896,780) (929,692,513)Profit from operating activities 1,303,526,582 1,067,953,100
Finance income 26 18,400,859 86,212,028 Finance expenses 27 (39,747,963) (18,812,730)Net finance income (21,347,104) 67,399,298 Profit before contribution to workers'profit participation and welfare fund and income tax 1,282,179,478 1,135,352,398 Contribution to workers' profit participation and welfare fund (61,056,166) (54,064,400)
Profit before income tax 1,221,123,312 1,081,287,998 Income tax expense:Current tax 28 (253,189,745) (329,336,045)Deferred tax 15 (53,671,503) 3,328,681
(306,861,248) (326,007,364)Profit for the year 914,262,064 755,280,634
Other comprehensive income - - Total comprehensive income for the year 914,262,064 755,280,634
Basic earnings per share (par value Taka 10) 33 2.71 2.24
The notes on pages 124 to 155 are an integral part of these financial statements.
RAK Ceramics (Bangladesh) Ltd.Statement of profit or loss and other comprehensive incomefor the year ended 31 December 2016
Dated, 23 January 2017
Company SecretaryDirectorManaging Director
(A. Qasem & Co.)Chartered Accountants
As per our report of same date

Annual Report 2016
122
RAK Ceramics (Bangladesh) Ltd.Statement of changes in equityfor the year ended 31 December 2016
Sharecapital
Sharepremium
Retainedearnings Total
Taka Taka Taka TakaBalance as at 1 January 2015 3,368,506,110 1,473,647,979 1,305,924,881 6,148,078,970
Total comprehensive income for 2015Profit for the year - - 755,280,634 755,280,634 Other comprehensive income - - - -
Transactions with the shareholdersCash dividend (2014) - - (842,126,528) (842,126,528)
Balance as at 31 December 2015 3,368,506,110 1,473,647,979 1,219,078,987 6,061,233,076
Balance as at 1 January 2016 3,368,506,110 1,473,647,979 1,219,078,987 6,061,233,076
Total comprehensive income for 2016Profit for the year - - 914,262,064 914,262,064 Other comprehensive income - - - -
Transactions with the shareholdersCash dividend (2015) - - (842,126,528) (842,126,528)
Balance as at 31 December 2016 3,368,506,110 1,473,647,979 1,291,214,523 6,133,368,612
The notes on pages 124 to 155 are an integral part of these financial statements.

Annual Report 2016
123
2016 2015Taka Taka
Cash flows from operating activitiesCash receipts from customers 5,509,595,241 5,077,233,550 Cash payments to suppliers and employees (4,303,618,433) (3,910,804,174)Cash generated from operating activities 1,205,976,808 1,166,429,376
Interest received from bank deposit 2,501,297 5,878,296 Income tax paid (220,766,533) (147,147,845)Net cash from operating activities 987,711,572 1,025,159,827
Cash flows from investing activities
Acquisition of property, plant and equipment (584,223,234) (1,797,584,154)Sale of property, plant and equipment 641,500 - Loan realized from associates - 102,973,608 Investment in subsidiary and associates - (243,179,950)Disposal proceeds of subsidiary and associates 86,710,000 374,599,560 Interest received from FDR and associates 13,159,539 65,415,094 Income from rental 8,911,130 7,758,261
Intangible assets (12,401,543) (5,673,511)
Dividend received 103,489,500 58,775,000 Net cash (used in)/from investing activities (383,713,108) (1,436,916,092)Cash flows from financing activitiesFinance charges (42,288,002) (15,447,122)Avail/ (repayment) of short term borrowings (203,400,043) 447,364,206 Avail/ (repayment) of long term borrowings 174,301,261 420,624,802 Dividend paid (838,775,610) (836,657,005)Unclaimed share application fund 2,064,480 (1,017,600)Net cash (used in)/from financing activities (908,097,914) 14,867,281 Net increase/(decrease) in cash and cash equivalents (304,099,450) (396,888,984)
Cash and cash equivalents as at 1 January 997,806,852 1,394,695,836
Cash and cash equivalents as at 31 December (Note 13) 693,707,402 997,806,852
The notes on pages 124 to 155 are an integral part of these financial statements.
RAK Ceramics (Bangladesh) Ltd.Statement of cash flowsfor the year ended 31 December 2016

Annual Report 2016
124
RAK Ceramics (Bangladesh) Ltd.Notes to the Financial Statementsas at and for the year ended 31 December 2016
1. Reporting entity
RAK Ceramics (Bangladesh) Ltd (the Company), formerly RAK Ceramics (Bangladesh) Pvt. Limited, a UAE-Bangladesh joint venture company, was incorporated in Bangladesh on 26 November 1998 as a private company limited by shares under the Companies Act 1994. The Company was later converted from a private limited into a public limited on 10 June 2008 after observance of required formalities as per laws. The name of the Company was thereafter changed to RAK Ceramics (Bangladesh) Ltd. as per certificate issued by the Registrar of Joint Stock Companies dated 11 February 2009. The address of the Company’s registered office is RAK Tower, Plot # 1/A, Jasimuddin Avenue, Sector # 3, Uttara, Dhaka 1230. The company got listed with Dhaka Stock Exchange (DSE) and Chittagong Stock Exchange (CSE) on 13 June 2010.
1.1 Nature of business
The Company is engaged in manufacturing and marketing of ceramics tiles, bathroom sets and all types of sanitary ware. It has started its commercial production on 12 November 2000. The commercial production of its new sanitary ware plant, expansion unit of ceramics facilities, tiles and sanitary plant was started on 10 January 2004, 1 July 2004, 1 September 2007, 1 April 2015 and 17th May 2016 respectively.
2. Basis of preparation
2.1 Statement of compliance
These financial statements have been prepared in accordance with Bangladesh Financial Reporting Standards (BFRS), the Companies Act 1994 and the Securities and Exchange Rules 1987.
The title and format of these financial statements follow the requirements of BFRS which are to some extent different from the requirement of the Companies Act 1994. However, such differences are not material and in the view of management BFRS titles and format give better presentation to the shareholders.
Authorisation for issue
These financial statements have been authorised for issue by the Board of Directors of the Company on 23 January 2017.
2.2 Basis of measurement
These financial statements have been prepared on historical cost basis except for inventories which are measured at lower of cost and net realisable value.
2.3 Functional and presentational currency
These financial statements are presented in Bangladesh Taka (Taka/Tk/BDT), which is the functional currency and presentation currency of the Company. The figures of financial statements have been rounded off to the nearest Taka.
2.4 Use of estimates and judgements
The preparation of these financial statements in conformity with BFRS requires management to make judgements, estimates and assumptions that affect the application of accounting policies and the reported amounts of assets, liabilities, income and expenses. Actual results may differ from these estimates.
Estimates and underlying assumptions are reviewed on an ongoing basis. Revisions to accounting estimates are recognised in the period in which the estimates are revised and in any future periods affected.
Annual Report 2016
125
In particular, information about significant areas of estimation uncertainty and critical judgements in applying accounting policies that have the most significant effect on the amount recognised in the financial statements are stated in the following notes:
Note 4 Property, plant & equipmentNote 15 Deferred tax liabilityNote 16 Employees benefit payableNote 20 Provision for income tax
2.5 Reporting period
The financial period of the Company covers one year from 1 January to 31 December and is followed consistently.
2.6 Going concern
The Company has adequate resources to continue in operation for foreseeable future and hence, the financial statements have been prepared on going concern basis. As per management assessment there are no material uncertainties related to events or conditions which may cast significant doubt upon the Company’s ability to continue as a going concern.
3. Significant accounting policies
The accounting policies set out below have been applied consistently to all periods presented in these financial statements, and have been applied consistently.
3.1 Property, plant and equipment
Items of property, plant and equipment are measured at cost less accumulated depreciation and impairment losses, if any. Cost includes expenditures that are directly attributable to the acquisition of the property, plant and equipment. Maintenance, renewals and betterments that enhance the economic useful life of the property, plant and equipment or that improve the capacity, quality or reduce substantially the operating cost or administration expenses are capitalised by adding it to the related property, plant and equipment. Ongoing repairs and maintenance is expensed as incurred.
An asset is derecognised on disposal or when no future economic benefits are expected from its use and subsequent disposal. Gain or loss arising from the retirement or disposal of an asset is determined as the difference between the net disposal proceeds and the carrying amount of the asset and is recognised as gain or loss from disposal of asset under other income in the statement of profit or loss and other comprehensive income.
3.2 Depreciation on property, plant and equipment
Depreciation charged on the basis of straight line method. Depreciation continues to be charged on each item of property, plant and equipment until written down value of such fixed asset is reduced to Taka one. Depreciation on addition to fixed assets is charged from the day of their acquisition and charging of depreciation on property, plant and equipment ceases from the day on which the deletion thereof takes place.
Notes to the Financial Statementsas at and for the year ended 31 December 2016

Annual Report 2016
126
Rates of depreciation on various classes of property, plant and equipment are as under:
Category of property, plant and equipment Rate (%)Building 5Plant and machinery 10Mobile plant 10Electrical installation 10Gas pipeline 10Furniture, fixture and equipment 10Office equipment 10-20Communication equipment 10-20Tools and appliances 10Vehicles 10
Land is not depreciated as it deemed to have an infinite life.
3.3 Intangible assets
Expenditure to acquire designs and trade marks for manufacture of ceramic tiles and sanitary ware is capitalised. This is being amortised equally within a period of two to three years depending upon the tenure of accrual of benefits.
Subsequent expenditure is capitalised only when it increases the future economic benefits embodied in the specific asset to which it relates.
Amortisation methods, useful lives and residual values are reviewed at each reporting date and adjusted if appropriate.
3.4 Capital work-in-progress
Capital work-in-progress represents the cost incurred for acquisition and/or construction of items of property, plant and equipment that are not ready for use. Capital work-in-progress is recorded at cost to the extent of expenditure incurred at the date of Statement of Financial Position. The amount of capital work-in-progress is transferred to appropriate asset category and depreciated when the asset is completed and commissioned.
3.5 Financial instruments
A financial instrument is any contract that gives rise to a financial asset of one entity and a financial liability or equity instrument of another entity.
3.5.1 Non-derivative financial assets
The Company initially recognises loans and receivables on the date that they are originated. All other financial assets are recognised initially on the trade date, which is the date that the Company becomes a party to the contractual provisions of the instrument.
The Company derecognises a financial asset when the contractual rights to the cash flows from the asset expire, or it transfers the rights to receive the contractual cash flows in a transaction in which substantially all the risks and rewards of ownership of the financial assets are transferred. Any interest in such transferred financial assets that is created or retained by the Company is recognised as a separate asset or liability.
The Company classifies non-derivative financial assets into the following categories: financial assets at fair value through profit or loss, held-to-maturity financial assets, loans and receivables and available for-sale financial assets.
Notes to the Financial Statementsas at and for the year ended 31 December 2016

Annual Report 2016
127
Financial assets at fair value through profit or loss
A financial asset is classified as at fair value through profit or loss if it is classified as held for trading or is designated as such on initial recognition. Financial assets are designated as at fair value through profit or loss if the Company manages such investments and makes purchase and sale decisions based on their fair value in accordance with the Company’s documented risk management or investment strategy. Attributable transaction costs are recognised in profit or loss as incurred. Financial assets at fair value through profit or loss are measured at fair value and changes therein, which takes into account any dividend income, are recognised in the statement of profit or loss and other comprehensive income.
Financial assets designated as at fair value through profit or loss comprise equity securities that otherwise would have been classified as available for sale.
Held-to-maturity financial assets
If the Company has the positive intent and ability to hold debt securities to maturity, then such financial assets are classified as held-to-maturity. Held-to-maturity financial assets are recognised initially at fair value plus any directly attributable transaction costs. Subsequent to initial recognition, held-to-maturity financial assets are measured at amortised cost using the effective interest method, less any impairment losses.
Available-for-sale financial assets
Available-for-sale financial assets are non-derivative financial assets that are designated as available for sale or are not classified in any of the above categories of financial assets. Available-for-sale financial assets are recognised initially at fair value plus any directly attributable transaction costs.
Subsequent to initial recognition, they are measured at fair value and changes therein, other than impairment losses and foreign currency differences on available-for-sale debt instruments, are recognised in other comprehensive income and presented by the fair value reserve in equity. When an investment is derecognised, the gain or loss accumulated in equity is reclassified to profit or loss.
Available-for-sale financial assets comprise equity securities and debt securities.
Loans and receivables
Loans and receivables are financial assets with fixed or determinable payments that are not quoted in an active market. Such assets are recognised initially at fair value plus any directly attributable transaction costs. Subsequent to initial recognition, loans and receivables are measured at amortised cost using the effective interest method, less any impairment losses.
Non-derivative financial assets comprise investment in subsidiaries, investment in associates, loans to subsidiaries & associates, trade & other receivables and cash and cash equivalents.
a) Investment in subsidiaries
Investment in subsidiaries are recognised initially at cost plus any directly attributable transaction costs. Subsequent to initial recognition, investment in subsidiaries are measured at cost less impairment loss, if any.
b) Investment in associates
Investment in associates are recognised initially at cost plus any directly attributable transaction costs. Subsequent to initial recognition, investment in associates are measured at cost less impairment loss, if any.
Notes to the Financial Statementsas at and for the year ended 31 December 2016

Annual Report 2016
128
c) Loans to subsidiaries & associate companies
Loan to subsidiaries & associate companies are recognised initially at fair value. Subsequent to initial recognition, these are measured at amortised cost using the effective interest method.
d) Trade & other receivables
Trade & other receivables are recognised initially at fair value. Subsequent to initial recognition, trade & other receivables are measured at amortised cost using the effective interest method, less any bad debts provision.
e) Cash and cash equivalents
Cash and cash equivalents comprise cash in hand, cash at bank including short notice deposits and fixed deposits having maturity of three months or less which are available for use by the Company without any restriction. Bank overdraft that are repayable on demand and form an integral part of the Company's cash management are included as a component of cash and cash equivalents for the purpose only of the statement of cash flows.
3.5.2 Financial liabilities
The Company recognises a financial liability in its statement of financial position when the entity becomes a party to the contractual provisions of the instrument.
The Company derecognises a financial liability when its contractual obligations are discharged, cancelled or expired.
Non-derivative financial liabilities comprise trade & other payables, and interest bearing borrowings.
a) Trade & other payables
Trade & other payables are recognised initially at fair value. Subsequent to initial recognition, trade payables are stated at amortised cost using the effective interest method.
b) Borrowings
Interest-bearing borrowings include short term bank loan. Interest-bearing borrowings are recognised initially at fair value less attributable transaction costs. Subsequent to initial recognition, interest-bearing borrowings are stated at amortised cost using the effective interest method.
3.6 Leased assets
Leases for which the Company assumes substantially all of the risks and rewards of ownership are classified as finance leases. On initial recognition, the leased asset is measured at an amount equal to the lower of its fair value and the present value of minimum lease payments. Subsequent to initial recognition, the asset is accounted for in accordance with the accounting policy applicable to that asset.
Lease payments
Payments made under operating leases are recognised in profit or loss on a straight-line basis over the term of the lease. Lease payments made under finance leases are apportioned between finance expense and the reduction of the outstanding liability. The finance expense is allocated to each period during the lease term so as to produce a constant periodic rate of interest on the remaining balance of the liability.
Notes to the Financial Statementsas at and for the year ended 31 December 2016
Annual Report 2016
129
3.7 Inventories
Inventories on hand are valued at the lower of cost and net realisable value. For raw materials and stores and consumable spares cost is determined on a weighted average cost basis. Work-in-process is stated at cost to complete of respective product. Cost comprises cost of raw materials, direct labour and other overheads up to the stage of completion. Finished products are stated at lower of cost and net realisable value. Net realisable value (NRV) is the estimated selling price in the ordinary course of business less the estimated cost of completion and any estimated costs necessary to make the sale. Raw materials in transit are valued at cost.
3.8 Impairment
Non-derivative financial assetsFinancial assets not classified as at fair value through profit or loss, loans and receivables are assessed at each reporting date to determine whether there is objective evidence that it is impaired. A financial asset is impaired if objective evidence indicates that a loss event has occurred after the initial recognition of the asset, and that the loss event had a negative effect on the estimated future cash flows of that asset that can be estimated reliably.
Non-financial assetsThe carrying amount of the non-financial assets, other than inventories are reviewed at each reporting date to determine whether there is any indication of impairment. If any such indication exists then the assets' recoverable amounts are estimated. For intangible assets that have indefinite lives, recoverable amount is estimated at each reporting date. An impairment loss is recognised if the carrying amount of an asset exceeds its estimated recoverable amount.
Calculation of recoverable amountThe recoverable amount of an asset is the greater of its value in use and its fair value less costs to sell. In assessing value in use, the estimated future cash flows are discounted to their present value using a pre-tax discount rate that reflects the current market assessment of the time value of money and risk specific to the asset. For an asset that does not generate significantly independent cash inflows, the recoverable amount is determined for the cash generating unit (CGU) to which the asset belongs.
Recognition of impairmentImpairment losses are recognised in profit or loss. Impairment losses in respect of CGUs are allocated first to reduce the carrying amount of any goodwill allocated to the CGU and then to reduce the carrying amount of other assets in the CGU on a pro-rata basis.
Reversal of impairmentAn impairment loss in respect of goodwill is not reversed. For other assets, an impairment loss is reversed only to the extent that the asset's carrying amount does not exceed the carrying amount that would have been determined, net of depreciation or amortisation, if no impairment loss had been recognised.
3.9 Share capitalOrdinary shares are classified as equity. Incremental costs attributable to the issue of ordinary shares are recognised as a deduction from equity, net of any tax affects. Paid up share capital represents total amount contributed by the shareholders and bonus shares issued by the Company to the ordinary shareholders. Holders of ordinary shares are entitled to receive dividends as declared from time to time and are entitled to vote at shareholders' meetings. In the event of a winding up of the Company, ordinary shareholders rank after all other shareholders and creditors and are fully entitled to any residual proceeds of liquidation.
3.10 Employee benefit schemesThe Company maintains both defined contribution plan and defined benefit plan for its eligible permanent employees. The eligibility is determined according to the terms and conditions set forth in the respective deeds.
Notes to the Financial Statementsas at and for the year ended 31 December 2016

Annual Report 2016
130
Defined contribution plan (provident fund)Defined contribution plan is a post employment benefit plan under which the Company provides benefits to one or more employees. The recognised Employees Provident Fund is considered as defined contribution plan as it meets the recognition criteria specified for this purpose. All permanent employees contribute 10 percent of their basic salary to the provident fund and the Company also makes equal contribution to the fund. These are administered by the Board of Trustees. The contributions are invested separately from the company's assets.
Contribution to defined contribution plan is recognised as an expense when an employee has rendered services to the Company. The legal and constructive obligation is limited to the amount it agrees to contribute to the fund. Defined benefit plan (gratuity fund)A defined benefit plan is a post-employment benefit plan other than a defined contribution plan. The Company’s net obligation in respect of defined benefit plans is calculated separately for each plan by estimating the amount of future benefit that employees have earned in return for their service in the current and prior periods.
Permanent employees are entitled to gratuity on the basis of his latest basic salary for a completed year of service or for service for a period of more than six months, salary of minimum 30 days, or salary of 45 days for a continuous service for more than ten years, it shall be in addition to any payment of compensation or payment of any wage or allowance in lieu of notice due to termination of services of a worker on different grounds. The expected cost of this benefit is included in respective annual statement of profit or loss and other comprehensive income over the period of employment.
3.11 Workers' Profit Participation and Welfare Fund The Company provides 5% of its net profit before tax after charging such expense as workers' profit participation and welfare fund in accordance with "The Bangladesh Labour (Amendment) Act 2013".
3.12 ProvisionsProvisions are recognised on the reporting date if, as a result of past events, the Company has a present legal or constructive obligation that can be estimated reliably, and it is probable that an outflow of economic benefits will be required to settle the obligation.
3.13 Revenue recognitionRevenue is measured at fair value of consideration received or receivable. Revenue from sale of goods is recognised when the company has transferred significant risk and rewards of ownership of the goods to the buyer and the revenue and costs incurred to effect the transaction can be measured reliably in compliance with the requirements of Bangladesh Accounting Standard (BAS) -18 "Revenue".
3.14 Finance income and expensesFinance income comprises interest income on funds invested in FDR and Short Notice Deposit (SND) accounts. Interest income is recognised on accrual basis.
Finance expense comprises interest expense on overdraft, LTR, term loan, short term borrowings and finance lease. All finance expenses are recognised in the statement of profit or loss and other comprehensive income.
3.15 TaxationIncome tax expenses comprises current tax and deferred tax. Income tax expense is recognised in the statement of profit or loss and other comprehensive income except to the extent that it relates to items recognised directly in equity, in which case it is recognised in equity.
Notes to the Financial Statementsas at and for the year ended 31 December 2016

Annual Report 2016
131
Current tax:Current tax is the expected tax payable on the taxable income for the year, using tax rates enacted or substantially enacted at the reporting date, and any adjustment to tax payable in respect of previous year. Provisions for corporate income tax is made following the rate applicable for a publicly-traded company of the same industry. The tax rate 25% is used for the reporting period 2016 as per Finance Act 2016.
Deferred tax:Deferred tax has been recognised in accordance with Bangladesh Accounting Standard (BAS) - 12 "Income Tax". Deferred tax is provided using the liability method for temporary differences between the carrying amount of assets and liabilities for financial reporting purposes and the amount used for taxation purpose. Deferred tax is determined at the effective income tax rate prevailing at the reporting date.
A deferred tax asset is recognised for unused tax losses, tax credits and deductible temporary differences to the extent that it is probable that future taxable profits will be available against which they can be utilised. Deferred tax assets are reviewed at each reporting date and are reduced to the extent that it is no longer probable that the related tax benefit will be realised.
3.16 Foreign currencyTransactions in foreign currencies are translated to Taka at the foreign exchange rates prevailing on the date of transaction. All monetary assets and liabilities denominated in foreign currencies at reporting date are translated to Taka at the rates of exchange prevailing on that date. Resulting exchange differences arising on the settlement of monetary items or on translating monetary items at the end of the reporting period are recognised in the statement of profit or loss and other comprehensive income as per Bangladesh Accounting Standard (BAS) - 21 "The Effects of Changes in Foreign Exchange Rates".
3.17 Earning per shareThe Company presents basic and diluted (when dilution is applicable) earnings per share (EPS) for its ordinary shares. Basic EPS is calculated by dividing the profit or loss attributable to ordinary shareholders of the Company with the weighted average number of ordinary shares outstanding during the period, adjusted for the effect of change in number of shares for bonus issue. Diluted EPS is determined by adjusting the profit or loss attributable to ordinary shareholders and the weighted average number of ordinary shares outstanding, for the effects of all dilutive potential ordinary shares. However, dilution of EPS is not applicable for these financial statements as there was no dilutive potential ordinary shares during the relevant year.
3.18 Contingencies
3.18.1 Contingent liabilityContingent liability is a possible obligation that arises from past events and whose existence will be confirmed only by the occurrence or non-occurrence of one or more uncertain future events not wholly within the control of the entity.
Contingent liability should not be recognised in the financial statements, but may require disclosure. A provision should be recognised in the period in which the recognition criteria of provision have been met.
3.18.2 Contingent assetContingent asset is a possible asset that arises from past events and whose existence will be confirmed only by the occurrence or non-occurrence of one or more uncertain future events not wholly within the control of the entity.
A contingent asset must not be recognised. Only when the realisation of the related economic benefits is virtually certain should recognition take place provided that it can be measured reliably because, at that point, the asset is no longer contingent.
Notes to the Financial Statementsas at and for the year ended 31 December 2016

Annual Report 2016
132
3.19 Statement of cash flowsStatement of cash flows is prepared under direct method in accordance with Bangladesh Accounting Standard (BAS) - 7 "Statement of cash flows" as required by the Securities and Exchange Rules 1987.
3.20 Duty drawbackDuty drawback paid on imported material for export sale is adjusted against VAT payable on domestic sale.
3.21 Events after the reporting periodEvents after the reporting period that provide additional information about the Company's position at the reporting date are reflected in the financial statements. Material events after the reporting period that are not adjusting events are disclosed by way of note.
3.22 Comparatives and reclassificationComparative information have been disclosed in respect of 2015 for all numerical information in the financial statements and also the narrative and descriptive information when it is relevant for understanding of the current year's financial statements.
To facilitate comparison, certain relevant balances pertaining to the previous year have been rearranged/reclassified whenever considered necessary to confirm to current year's presentation.
Notes to the Financial Statementsas at and for the year ended 31 December 2016
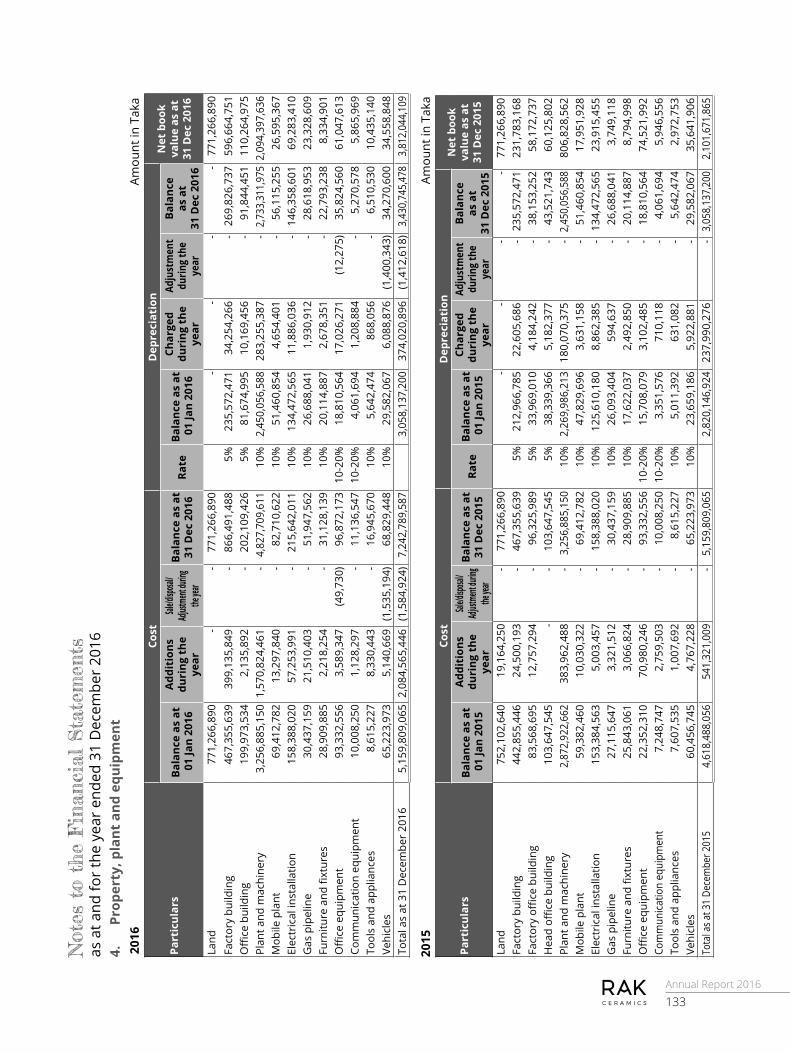
Annual Report 2016
133
4.
Pr
oper
ty, p
lant
and
equ
ipm
ent
201
6
Amou
nt in
Tak
a
Part
icul
ars
Cost
Dep
reci
atio
nN
et b
ook
valu
e as
at
31 D
ec 2
016
Bala
nce
as a
t 0
1 Ja
n 20
16
Add
itio
ns
duri
ng t
he
year
Sale/d
isposa
l/ Adj
ustme
nt duri
ng the
year
Bala
nce
as a
t 31
Dec
201
6Ra
teBa
lanc
e as
at
01
Jan
2016
Char
ged
duri
ng t
he
year
Adju
stm
ent
durin
g th
e ye
ar
Bala
nce
as a
t
31 D
ec 2
016
Land
771
,266
,890
-
- 7
71,2
66,8
90
- -
- -
771
,266
,890
Fa
ctor
y bu
ildin
g 4
67,3
55,6
39
399
,135
,849
-
866
,491
,488
5%
235
,572
,471
3
4,25
4,26
6 -
269
,826
,737
5
96,6
64,7
51
Offi
ce b
uild
ing
199
,973
,534
2
,135
,892
-
202
,109
,426
5%
81,
674,
995
10,
169,
456
- 9
1,84
4,45
1 1
10,2
64,9
75
Plan
t and
mac
hine
ry 3
,256
,885
,150
1,5
70,8
24,4
61
- 4
,827
,709
,611
10
% 2
,450
,056
,588
2
83,2
55,3
87
- 2
,733
,311
,975
2,0
94,3
97,6
36
Mob
ile p
lant
69,
412,
782
13,
297,
840
- 8
2,71
0,62
2 10
% 5
1,46
0,85
4 4
,654
,401
-
56,
115,
255
26,
595,
367
Elec
tric
al in
stal
latio
n 1
58,3
88,0
20
57,
253,
991
- 2
15,6
42,0
11
10%
134
,472
,565
1
1,88
6,03
6 -
146
,358
,601
6
9,28
3,41
0 G
as p
ipel
ine
30,
437,
159
21,
510,
403
- 5
1,94
7,56
2 10
% 2
6,68
8,04
1 1
,930
,912
-
28,
618,
953
23,
328,
609
Furn
iture
and
fixt
ures
28,
909,
885
2,2
18,2
54
- 3
1,12
8,13
9 10
% 2
0,11
4,88
7 2
,678
,351
-
22,
793,
238
8,3
34,9
01
Offi
ce e
quip
men
t 9
3,33
2,55
6 3
,589
,347
(4
9,73
0) 9
6,87
2,17
3 10
-20%
18,
810,
564
17,
026,
271
(12,
275)
35,
824,
560
61,
047,
613
Com
mun
icat
ion
equi
pmen
t 1
0,00
8,25
0 1
,128
,297
-
11,
136,
547
10-2
0% 4
,061
,694
1
,208
,884
-
5,2
70,5
78
5,8
65,9
69
Tool
s an
d ap
plia
nces
8,6
15,2
27
8,3
30,4
43
- 1
6,94
5,67
0 10
% 5
,642
,474
8
68,0
56
- 6
,510
,530
1
0,43
5,14
0 Ve
hicl
es 6
5,22
3,97
3 5
,140
,669
(1
,535
,194
) 6
8,82
9,44
8 10
% 2
9,58
2,06
7 6
,088
,876
(1
,400
,343
) 3
4,27
0,60
0 3
4,55
8,84
8 To
tal a
s at
31
Dec
embe
r 20
16 5
,159
,809
,065
2,0
84,5
65,4
46
(1,5
84,9
24)
7,2
42,7
89,5
87
3,0
58,1
37,2
00
374
,020
,896
(1
,412
,618
) 3
,430
,745
,478
3
,812
,044
,109
2015
Am
ount
in T
aka
Part
icul
ars
Cost
Dep
reci
atio
nN
et b
ook
valu
e as
at
31 D
ec 2
015
Bala
nce
as a
t 0
1 Ja
n 20
15
Add
itio
ns
duri
ng t
he
year
Sale/d
isposa
l/ Adj
ustme
nt duri
ng the
year
Bala
nce
as a
t 31
Dec
201
5Ra
teBa
lanc
e as
at
01
Jan
2015
Char
ged
duri
ng t
he
year
Adju
stm
ent
durin
g th
e ye
ar
Bala
nce
as a
t
31 D
ec 2
015
Land
752
,102
,640
1
9,16
4,25
0 -
771
,266
,890
-
- -
- 7
71,2
66,8
90
Fact
ory
build
ing
442
,855
,446
2
4,50
0,19
3 -
467
,355
,639
5%
212
,966
,785
2
2,60
5,68
6 -
235
,572
,471
2
31,7
83,1
68
Fact
ory
office
bui
ldin
g 8
3,56
8,69
5 1
2,75
7,29
4 -
96,
325,
989
5% 3
3,96
9,01
0 4
,184
,242
-
38,
153,
252
58,
172,
737
Hea
d offi
ce b
uild
ing
103
,647
,545
-
- 1
03,6
47,5
45
5% 3
8,33
9,36
6 5
,182
,377
-
43,
521,
743
60,
125,
802
Plan
t and
mac
hine
ry 2
,872
,922
,662
3
83,9
62,4
88
- 3
,256
,885
,150
10
% 2
,269
,986
,213
18
0,07
0,37
5 -
2,4
50,0
56,5
88
806
,828
,562
M
obile
pla
nt 5
9,38
2,46
0 1
0,03
0,32
2 -
69,
412,
782
10%
47,
829,
696
3,6
31,1
58
- 5
1,46
0,85
4 1
7,95
1,92
8 El
ectr
ical
inst
alla
tion
153
,384
,563
5
,003
,457
-
158
,388
,020
10
% 1
25,6
10,1
80
8,8
62,3
85
- 1
34,4
72,5
65
23,
915,
455
Gas
pip
elin
e 2
7,11
5,64
7 3
,321
,512
-
30,
437,
159
10%
26,
093,
404
594
,637
-
26,
688,
041
3,7
49,1
18
Furn
iture
and
fixt
ures
25,
843,
061
3,0
66,8
24
- 2
8,90
9,88
5 10
% 1
7,62
2,03
7 2
,492
,850
-
20,
114,
887
8,7
94,9
98
Offi
ce e
quip
men
t 2
2,35
2,31
0 7
0,98
0,24
6 -
93,
332,
556
10-2
0% 1
5,70
8,07
9 3
,102
,485
-
18,
810,
564
74,
521,
992
Com
mun
icat
ion
equi
pmen
t 7
,248
,747
2
,759
,503
-
10,
008,
250
10-2
0% 3
,351
,576
7
10,1
18
- 4
,061
,694
5
,946
,556
To
ols
and
appl
ianc
es 7
,607
,535
1
,007
,692
-
8,6
15,2
27
10%
5,0
11,3
92
631
,082
-
5,6
42,4
74
2,9
72,7
53
Vehi
cles
60,
456,
745
4,7
67,2
28
- 6
5,22
3,97
3 10
% 2
3,65
9,18
6 5
,922
,881
-
29,
582,
067
35,
641,
906
Tota
l as a
t 31
Dece
mbe
r 201
5 4
,618
,488
,056
5
41,3
21,0
09
- 5
,159
,809
,065
2
,820
,146
,924
23
7,99
0,27
6 -
3,0
58,1
37,2
00
2,1
01,6
71,8
65
Not
es t
o th
e Fin
anci
al S
tate
men
tsas
at a
nd fo
r th
e ye
ar e
nded
31
Dec
embe
r 20
16

Annual Report 2016
134
4.1 Depreciation charged on the basis of the purpose of use
2016 2015Taka Taka
Cost of sales (Note 22) 336,849,058 216,395,322 Administrative expenses (Note 24) 37,171,838 21,594,954
374,020,896 237,990,276 4.2 Disposal of property, plant and equipment Year 2016
Particulars Original cost Accumulated depreciation Book value
Receipts against
insurance claim and sale.
Profit/(loss) on disposal
Taka Taka Taka Taka Taka Vehicles 1,535,194 1,400,343 134,851 631,500 496,649 Office equipment
49,730 12,275 37,455 10,000 (27,455)
Total 1,584,924 1,412,618 172,306 641,500 469,194 Year 2015
Particulars Originalcost
Accumulateddepreciation
Bookvalue
Receipts against sale.
Profit /(loss) on disposal
Taka Taka Taka Taka TakaNo disposal - - - - - Total - - - - -
2016 2015Taka Taka
5 Intangible assetsBalance as at 1 January 6,683,955 4,815,453 Add: Addition during the year 12,401,543 5,673,511
19,085,498 10,488,964 Less: Amortized during the year 12,345,339 3,805,009 Balance as at 31 December 6,740,159 6,683,955 The above amount represents cost of various licenses which are being amortised over 2-3 years from the date of their expenses.
6 Capital work in progressBalance as at 1 January 1,545,379,710 289,116,566 Add: Addition during the year 28,099,014 1,767,883,626
1,573,478,724 2,057,000,192 Less: Transfer to property, plant & equipment during the year (Note-6.1)
1,528,441,226 506,960,135
Impairment loss on capital equipment during the year 16,311,214 4,660,347 Balance as at 31 December 28,726,284 1,545,379,710
Notes to the Financial Statementsas at and for the year ended 31 December 2016

Annual Report 2016
135
2016 2015Taka Taka
6.1 Items transferred from capital work in progress to property, plant & equipment
Factory office building - 12,757,294 Factory building 237,219,154 24,500,193 Plant and machinery 1,256,599,871 384,578,817 Mobile Plant - 10,030,322 Electrical Installation - 5,003,457 Gas pipe line - 3,321,512 Furniture & fixture - 495,965 Office equipment - 64,956,072 Communication equipment - 1,316,503 Others 34,622,201 -
1,528,441,226 506,960,135 7 Investment in subsidiaries (Note-7.1)
RAK Power Pvt. Ltd 341,629,950 341,629,950 RAK Security & Services Pvt. Ltd 18,750,000 18,750,000
360,379,950 360,379,950 7.1 Details of investments in subsidiaries
Name of subsidiaries Nature of business % of holding 2016
Taka 2015 Taka 2016 2015
RAK Power Pvt. Ltd Electricity generation 99.99 99.99 341,629,950 341,629,950 RAK Security & Services (Pvt.) Ltd
Security services provider
99.00 99.00 18,750,000 18,750,000
2016 2015Taka Taka
8 Loan to disposed subsidiaryJulphar Bangladesh Ltd. * (Erstwhile RAK Pharmaceuticals Pvt. Ltd.)
201,898,000 201,898,000
201,898,000 201,898,000 * It represents the value of corporate office space (10th floor of RAK tower) of which ownership transferred is in under process.
9 InventoriesRaw materials 844,891,203 852,533,747 Less : Provision for obsolescence made during the year 13,878,807 4,665,753
831,012,396 847,867,994
Stores and consumables spares 1,016,498,297 900,614,223 Finished goods 387,942,404 216,781,132 Work-in-process 96,173,371 37,268,593 Goods-in-transit 129,410,652 180,144,364
2,461,037,120 2,182,676,306
Notes to the Financial Statementsas at and for the year ended 31 December 2016

Annual Report 2016
136
2016 2015Taka Taka
10 Trade and other receivables Non-current: Receivable against disposal of investment (Note-10.3) 74,025,000 148,050,000
74,025,000 148,050,000
Current: Trade receivables (Note-10.1) 523,695,477 522,140,620 Accrued interest (Note-10.2) 1,936,806 3,069,778 Accrued rental income 380,000 - Receivable against disposal of investment (Note-10.3) 74,025,000 86,710,000
600,037,283 611,920,398 10.1 Trade receivables
Receivable from dealers 523,695,477 521,496,316 Receivable from export sales - 644,304
523,695,477 522,140,620
10.2 Accrued Interest Interest accrued on FDR 1,936,806 3,069,778 Interest accrued on loan to subsidiary - 10,100,916
1,936,806 13,170,694 Less : Write off of interest and loan to subsidiary - 10,100,916
1,936,806 3,069,778 10.3 Receivable against disposal of investment
Classic Porcelain Pvt. Ltd. - 2,550,000 RAK Food & Beverage Pvt. Ltd. - 510,000 RAK-Mosfly (Bangladesh) Pvt. Ltd. - 9,625,000 RAK Paints Pvt. Ltd. * 148,050,000 222,075,000
148,050,000 234,760,000
* Receivable against disposal of investment includes Taka. 148,050,000 relating to RAK Paints (Pvt.) Limited in which Taka 74,025,000 shown as Non current receivable and remaining is current receivable.
11 Advance, deposits and prepaymentsAdvances: Employees 17,500 6,000 Purchase of land and others 36,776,888 28,421,141 Suppliers against materials and services 224,624,271 158,568,287
261,418,659 186,995,428 Security and other deposit: Titas gas 16,389,450 14,342,370 Mymensingh Palli Bidyut Samity-2 1,955,000 1,955,000 VAT and Supplementary duty (Note-11.1) 36,075,086 57,875,829 Deposited with income tax authority 17,185,655 9,705,739 Deposited with VAT authority 7,530,001 7,530,001 Other deposits 1,491,853 1,491,853
80,627,045 92,900,792
Notes to the Financial Statementsas at and for the year ended 31 December 2016

Annual Report 2016
137
2016 2015Taka Taka
Prepayments: House rent 9,063,471 10,625,974 Insurance and others 47,596,726 41,889,833
56,660,197 52,515,807
398,705,901 332,412,027
11.1 VAT and supplementary duty (SD)Balance as at 1 January 57,875,829 40,633,658 Add: Treasury deposit for SD & VAT purpose 1,121,000,000 987,000,000 Rebate of input VAT 273,305,798 298,183,784
1,452,181,627 1,325,817,441 Add: Receivable - SD & VAT - 657,660
1,452,181,627 1,326,475,101 Less: SD & VAT on sales 1,415,635,275 1,268,182,333 Payable - SD & VAT 471,266 416,940
1,416,106,541 1,268,599,273 Balance as at 31 December 36,075,086 57,875,829
12 Advance Income TaxBalance as at 1 January 2,059,429,603 1,912,281,758 Add: Paid during the year 220,766,534 147,147,845 Balance as at 31 December 2,280,196,137 2,059,429,603
12.01 Year wise closing balanceIncome yearYear 2016 196,923,871 - Year 2015 138,288,579 114,445,916 Year 2014 253,701,667 253,701,667 Year 2013 352,440,807 352,440,807 Year 2012 301,027,378 301,027,378 Year 2011 322,755,413 322,755,413 Year 2010 263,692,205 263,692,205 Year 2009 218,086,876 218,086,876 Year 2008 85,378,847 85,378,847 Year 2007 124,813,161 124,813,161 Year 2006 (Unadjusted balance) 23,087,333 23,087,333
2,280,196,137 2,059,429,603
13 Cash and cash equivalentsCash in hand 8,663,146 1,550,778 Cash at banksHSBC (current account - 001-013432-011 - BDT) 38,312,406 40,554,823 Standard Chartered Bank (current account - 01-6162940-01 - BDT)
66,586,636 62,560,788
Notes to the Financial Statementsas at and for the year ended 31 December 2016

Annual Report 2016
138
2016 2015Taka Taka
Citibank N.A. (current account - G010000200262018 - BDT) 15,162,084 11,566,925 Dutch Bangla Bank Ltd. (current account - 117 - 110 - 12733 - BDT)
- 18,646,192
HSBC (ERQ account - 001-013432-047 - USD) 6,549,288 4,595,333 Standard Chartered Bank (ERQ - 42-6162940-01 - USD) 973,813 267,806 EXIM Bank (SND account - 01513100031877 - BDT) 114,271 113,239 Dutch Bangla Bank Ltd. (SND account - 117-120-589 - BDT) 58,860,051 114,803,043 BRAC Bank (STD - 1513101731248001 - BDT) 356,703 354,466 Prime Bank Ltd. (SND - 12531010022563 - BDT) 20,282,604 14,168,711 Commercial Bank of Ceylon (SND - 2817000777 - BDT) 6,559,754 7,792,797
213,757,610 275,424,123
IPO bank accountCitibank N.A. (RAK-IPO Central Account - G010001200262022 - BDT)
2,453,275 389,032
Citibank N.A. (RAK-IPO-NRB Subscription - G010000200262042 - USD)
3,941,453 3,941,472
Citibank N.A. (RAK-IPO-NRB Subscription - G010000200262026 - EURO)
153,603 153,608
Citibank N.A. (RAK-IPO-NRB Subscription - G010000200262034 - GBP)
126,588 126,593
6,674,919 4,610,705
Dividend bank accountBRAC Bank (Current - 1510201731248001 - BDT) - 2010 2,627,831 2,636,151 BRAC Bank (Current - 1513201731248001 - BDT) - 2011 2,222,418 2,326,783 SCB (Current - 02-6162940-02 - BDT) - 2012 3,899,024 3,893,227 SCB (Current - 02-6162940-03 - BDT) - 2013 16,697,585 16,679,336 SCB (Current - 02-6162940-04 - BDT) - 2014 5,082,074 5,685,749 SCB (Current - 02-6162940-05 - BDT) - 2015 4,082,795 -
34,611,727 31,221,246
Investment in Fixed Deposit Receipt (FDR)HSBC 30,000,000 30,000,000 Prime Bank Ltd. - 155,000,000 Dutch Bangla Bank Ltd. 400,000,000 500,000,000
430,000,000 685,000,000 Total 693,707,402 997,806,852
14 Share CapitalAuthorised 600,000,000 ordinary shares of Tk 10 each 6,000,000,000 6,000,000,000
Issued, subscribed, called and paid up336,850,611 ordinary shares of Tk 10 each 3,368,506,110 3,368,506,110
Notes to the Financial Statementsas at and for the year ended 31 December 2016

Annual Report 2016
139
2016 2015Taka Taka
Percentage of shareholding:
2016 2015 % Taka % Taka
RAK Ceramics PJSC, UAE 71.67 2,414,100,210 71.67 2,414,100,210 SAK Ekramuzzaman 3.92 132,119,850 4.22 142,119,850 HH Sheikh Saud Bin Saqr Al Qassimi
0.00 280 0.00 280
Sheikh Omer Bin Saqr Al Qassimi
0.00 280 0.00 280
Sheikh Ahmad Bin Humaid al Qassimi
0.00 280 0.00 280
Hamad Abdulla Al Muttawa 0.00 140 0.00 140 Dr. Khater Massaad 0.00 140 0.00 140 Abdallah Massaad 0.00 140 0.00 140 Manoj Uttamrao Ahire 0.00 140 0.00 140 General Public 24.41 822,284,650 24.11 812,284,650
100.00 3,368,506,110 100.00 3,368,506,110 Classification of shareholders by range
Shareholder's range Number of shareholders Number of shares
2016 2015 2016 2015Less than 500 shares 26,718 32,023 5,617,564 6,687,947 501 to 5,000 shares 8,021 8,478 11,426,420 11,550,626 5001 to 10,000 shares 618 623 4,593,958 4,591,318 10,001 to 20,000 shares 308 302 4,505,626 4,371,383 20,001 to 30,000 shares 99 110 2,463,012 2,717,968 30,001 to 40,000 shares 50 47 1,774,201 1,695,813 40,001 to 50,000 shares 38 31 1,760,460 1,400,209 50,001 to 100,000 shares 80 77 5,479,795 5,437,755 100,001 to 1,000,000 shares 63 76 18,732,649 21,716,461 Over 1,000,000 shares 11 8 280,496,926 276,681,131
36,005 41,775 336,850,611 336,850,611
2016 2015Taka Taka
15 Deferred tax liabilities
Balance as at 1 January 38,236,099 41,564,780 Deferred tax (income) / expenses 53,671,503 (3,328,681) Balance as at 31 December 91,907,602 38,236,099
Notes to the Financial Statementsas at and for the year ended 31 December 2016

Annual Report 2016
140
Carryingamount on the
date of statementof financial
position
Tax base
Taxable/ (deductible) temporary difference
Taka Taka Taka As at 31 December 2016 Property, plant and equipment (Excluding land and others)
2,926,442,603 2,514,345,896 412,096,707
Provision for obsolescence (21,164,564) - (21,164,564)Impairment loss on capital equipment (23,301,734) - (23,301,734)Net taxable temporary difference 367,630,409
Deferred tax liability (applying tax rate 25.00%) 91,907,602
As at 31 December 2015
Property, plant and equipment (Excluding land and others)
1,202,808,738 1,035,588,065 167,220,673
Provision for obsolescence (7,285,757) - (7,285,757) Impairment loss on capital equipment (6,990,520) - (6,990,520) Net taxable temporary difference 152,944,396
Deferred tax liability (applying tax rate 25.00%) 38,236,099
16 Employees benefits payable - 2,851,979 Provident fund - 21,052,536 Gratuity fund - 23,904,515
2016Provident Fund Gratuity Fund Total
Taka Taka Taka
Balance as at 1 January 2,851,979 21,052,536 23,904,515 Add: Provision made during the year 44,902,055 28,664,587 73,566,642
47,754,034 49,717,123 97,471,157 Less: Payments made to fund during the year 47,754,034 49,717,123 97,471,157 Balance as at 31 December - - -
Notes to the Financial Statementsas at and for the year ended 31 December 2016

Annual Report 2016
141
2015Provident
FundGratuity Fund Total
Taka Taka Taka
Balance as at 1 January 2,533,320 68,155,006 70,688,326 Add: Provision made during the year 34,102,340 21,052,536 55,154,876
36,635,660 89,207,542 125,843,202 Less: Payments made to fund during the year 33,783,681 68,155,006 101,938,687 Balance as at 31 December 2,851,979 21,052,536 23,904,515
2016 2015Taka Taka
17 BorrowingsNon-current:Term loan -HSBC 854,877,901 497,742,616 Less : Current portion of long term loan - HSBC (259,951,837) (77,117,814)
594,926,064 420,624,802 Current:Overdraft - DBBL 27,579,039 - Overdraft - CBC 2,084,654 - Short term borrowings - HSBC 92,039,897 644,332,280 Short term borrowings - SCB 186,063,899 49,669,275 Current portion of long term loan - HSBC 259,951,837 77,117,814
567,719,326 771,119,369 Balance as at 31 December 1,162,645,390 1,191,744,171
17.1 Borrowings by maturity
At 31 December 2016 < 1 year 1-2 years 2-5 years > 5 years Total Overdrafts 29,663,693 - - - 29,663,693 Short-term borrowings 278,103,796 - - - 278,103,796 Term loan and others 259,951,837 259,951,837 334,974,228 - 854,877,901
567,719,326 259,951,837 334,974,228 - 1,162,645,390
At 31 December 2015 < 1 year 1-2 years 2-5 years > 5 years Total Short-term borrowings 694,001,555 - - - 694,001,555 Term loan and others 77,117,814 124,789,765 295,835,037 - 497,742,616
771,119,369 124,789,765 295,835,037 - 1,191,744,171
The company enjoys off-shore financing from HSBC, SCB & Citibank N.A. on its outstanding import bills as deferred payment bills under letter of credits.
Notes to the Financial Statementsas at and for the year ended 31 December 2016

Annual Report 2016
142
17.2 Facilities details
Bank Name of facilities Limit Utilisation Maturity Repayment Security - STL Security -
LTL
SCBOverdraftShort term loan
50,000,000
350,000,000
-
186,063,899
Revolving 180/360 days from B/L date
From company's own source
1) Letter of comfort, 2) Hypothecation over plant & machinery on parri - passu basis with other lenders. 3) Hypothecation over stock & book debts on a parri - passu basis with other lenders. 4) Demand promissory note.
1) Land, 2) Plant and machinery of the expansion plant.
HSBC
OverdraftShort term loanLong term loan
25,000,000
540,000,000
1,366,872,000
-
92,039,897
854,877,901
Revolving180/360 days from B/L date5 years
From company's own source
Citibank N.A.
OverdraftShort term loan
50,000,000
700,000,000
-
-
Revolving180/360 days from B/L date
From company's own source
Dutch-Bangla Bank Ltd.
OverdraftShort term loan
25,000,000
125,000,000
27,579,039
-
Revolving180/360 days from B/L date
From company's own source
Commercial Bank of Ceylon
OverdraftShort term loan
25,000,000
300,000,000
2,084,654
-
Revolving180/360 days from B/L date
From company’s own source
2016 2015Taka Taka
18 Trade and other payablesTrade payablesPayable to local suppliers 204,134,111 173,351,469 Payable to foreign suppliers 182,859,392 329,901,031 Payable to service provider 86,458,040 42,540,947 Payable to C & F agent and freight forwarder 10,283,280 18,636,933
483,734,823 564,430,380 Other payablesTax deducted at source 15,189,449 18,192,562 VAT deducted at source 8,209,959 7,150,741 Dividend Payable 33,889,190 30,538,272 Unclaimed share application 20,838,116 18,773,636 Advance from customer against Sales 7,443,813 21,575,188 Provisional liabilities - material & services 50,299,995 - Security deposit payable 1,617,592 1,900,492
137,488,114 98,130,892 Total 621,222,937 662,561,271
19 Accrued expensesPower and gas 11,309,101 11,309,101 Staff cost 33,292,631 59,849,699 Audit fees 1,100,000 800,000 Taxation Matter 400,000 200,000
Notes to the Financial Statementsas at and for the year ended 31 December 2016

Annual Report 2016
143
2016 2015Taka Taka
Interest on short term loan 1,495,042 4,035,081 Telephone 263,927 139,882 Provision for exchange rate difference 5,856,833 - Provision for freight 11,774,670 - Managing Director's remuneration (Note-19.1) 40,911,795 34,075,485 Workers profit participation and welfare fund (Note-19.2) 61,056,166 54,064,400 Royalty and technical know-how fee (Note-19.3) 83,946,396 2,399,388
251,406,561 166,873,036 19.1 Managing Director's remuneration
Balance as at 1 January 34,075,485 13,831,774 Add: Payable to Managing Director 40,911,795 34,075,485
74,987,280 47,907,259 Less: Paid to Managing Director 34,075,485 13,831,774 Balance as at 31 December 40,911,795 34,075,485
19.2 Workers' Profit Participation and Welfare FundBalance as at 1 January 54,064,400 21,864,611 Add: Contribution made to the fund during the year 61,056,166 54,064,400
115,120,566 75,929,011 Less: Payment made from the fund during the year 54,064,400 21,864,611 Balance as at 31 December 61,056,166 54,064,400
19.3 Royalty and technical know-how feeBalance as at 1 January 2,399,388 38,585,967 Add: Provision made during the year 96,547,008 80,414,124
98,946,396 119,000,091 Less: Payment made during the year - 36,683,680 Less: Tax provision on disallowance of royalty paid for 2009 15,000,000 25,000,000 Less: Tax provision on disallowance of royalty paid for the year 2010 - 36,160,532
Less: Provision for interest being delay payment of VAT on royalty for the year 2010 - 18,756,491
Balance as at 31 December 83,946,396 2,399,388
20 Provision for income taxBalance as at 1 January 2,403,756,498 2,074,420,453 Add: Provision made for current year 253,189,745 274,419,022 Provision made for prior year - 54,917,023 Balance as at 31 December (note 20.1) 2,656,946,243 2,403,756,498
20.1 Year wise closing balanceIncome yearYear 2016 253,189,745 - Year 2015 274,419,022 274,419,022 Year 2014 339,893,487 339,893,487 Year 2013 318,166,647 318,166,647
Notes to the Financial Statementsas at and for the year ended 31 December 2016
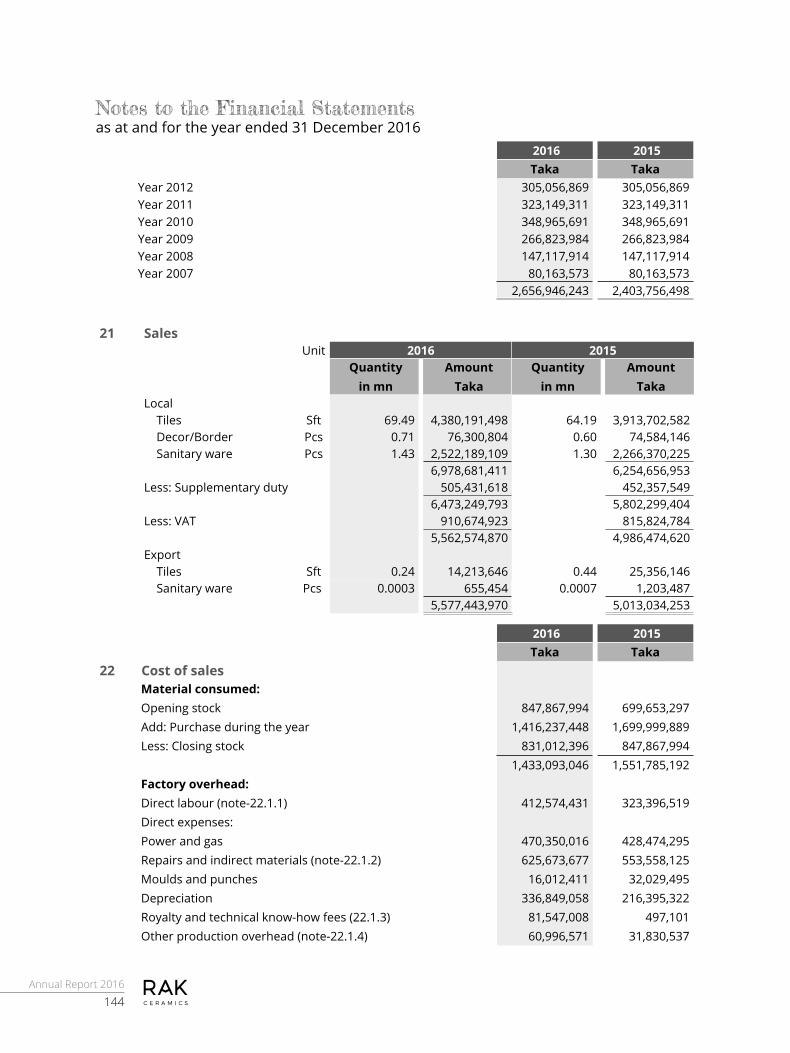
Annual Report 2016
144
2016 2015Taka Taka
Year 2012 305,056,869 305,056,869 Year 2011 323,149,311 323,149,311 Year 2010 348,965,691 348,965,691 Year 2009 266,823,984 266,823,984 Year 2008 147,117,914 147,117,914 Year 2007 80,163,573 80,163,573
2,656,946,243 2,403,756,498
21 Sales Unit 2016 2015
Quantity in mn
Amount Taka
Quantity in mn
Amount Taka
Local Tiles Sft 69.49 4,380,191,498 64.19 3,913,702,582 Decor/Border Pcs 0.71 76,300,804 0.60 74,584,146 Sanitary ware Pcs 1.43 2,522,189,109 1.30 2,266,370,225
6,978,681,411 6,254,656,953 Less: Supplementary duty 505,431,618 452,357,549
6,473,249,793 5,802,299,404 Less: VAT 910,674,923 815,824,784
5,562,574,870 4,986,474,620 Export Tiles Sft 0.24 14,213,646 0.44 25,356,146 Sanitary ware Pcs 0.0003 655,454 0.0007 1,203,487
5,577,443,970 5,013,034,253
2016 2015Taka Taka
22 Cost of sales Material consumed: Opening stock 847,867,994 699,653,297 Add: Purchase during the year 1,416,237,448 1,699,999,889 Less: Closing stock 831,012,396 847,867,994
1,433,093,046 1,551,785,192 Factory overhead: Direct labour (note-22.1.1) 412,574,431 323,396,519 Direct expenses: Power and gas 470,350,016 428,474,295 Repairs and indirect materials (note-22.1.2) 625,673,677 553,558,125 Moulds and punches 16,012,411 32,029,495 Depreciation 336,849,058 216,395,322 Royalty and technical know-how fees (22.1.3) 81,547,008 497,101 Other production overhead (note-22.1.4) 60,996,571 31,830,537
Notes to the Financial Statementsas at and for the year ended 31 December 2016

Annual Report 2016
145
2016 2015Taka Taka
Movement in stock (82,075,610) (122,577,947) 3,355,020,608 3,015,388,640
22.1.1 Direct labour Salary & wages 235,766,374 183,299,278 Overtime 27,064,242 20,059,144 Bonus 30,221,427 27,515,079 Incentive 3,678,653 11,651,580 Temporary labour wages 82,877,431 55,442,744 Gratuity 17,897,123 13,672,491 Employers contribution to provident fund 13,464,159 10,373,380 Group life insurance 1,605,022 1,382,823
412,574,431 323,396,519 22.1.2 Repair and indirect materials
Stores, spares, repair & maintenance 316,076,459 292,264,110 Packing expenses 309,597,218 261,294,015
625,673,677 553,558,125 22.1.3 Royalty & technical know how fees
Royalty and technical know-how fee 96,547,008 80,414,124 Less: Tax provision on disallowance of royalty paid for the year 2009 15,000,000 25,000,000
Less: Tax provision on disallowance of royalty paid for the year 2010 - 36,160,532
Less: Provision for interest being delay payment of VAT on royalty for the year 2010 - 18,756,491
81,547,008 497,101 22.1.4 Other production overhead
Hotel fare and expenses for technician 4,763,388 5,210,385 Demurrage 1,644,495 4,142,877 Insurance 14,409,297 12,804,226 Impairment loss on capital equipment 16,311,214 4,660,347 Provision for obsolescence 13,878,807 4,665,753 Hiring charges and transportation 2,195,697 - Other expenses 7,793,673 346,949
60,996,571 31,830,537 23 Other income
Dividend income 103,489,500 58,775,000 Rental income 9,291,130 7,878,261 Profit on sale of fixed assets 469,194 -
113,249,824 66,653,261
Notes to the Financial Statementsas at and for the year ended 31 December 2016

Annual Report 2016
146
2016 2015Taka Taka
24 Administrative expenses Staff cost (note-24.1) 140,679,241 117,337,858 Annunal General Meeting expenses 15,432,136 28,193,198 Telephone and postage 4,839,821 6,440,638 Office repair and maintenance (note-24.2) 5,110,969 9,050,231 Registration and renewal 965,738 1,053,742 Security and guard expenses 11,826,935 12,032,300 Electricity, gas and water 7,629,244 6,070,905 Depreciation 37,171,838 21,594,954 Amortization 12,345,339 3,805,009 Legal and professional fees 8,320,262 7,537,492 Vehicle repair and maintenance 9,636,242 9,078,048 Rent, rate and tax 2,851,132 8,985,085 CSR expenses 5,742,270 3,494,124 Write off of loan and interest - 10,100,916 Impairment loss of investment - 24,675,000 Others 29,131,882 5,137,930 Managing Director's remuneration (note-24.3) 40,911,795 34,075,485
332,594,844 308,662,916
24.1 Staff cost Salary & wages 95,164,239 80,284,412 Bonus 12,916,793 11,139,763 Incentive 3,151,473 5,406,921 Gratuity 6,977,329 5,579,978 Employers contribution to provident fund 3,483,023 4,442,198 Leave encashment 178,500 - Group life insurance 556,001 576,421 Canteen and conveyance expenses 6,779,106 4,208,519 Staff uniform expenses 18,140 346,534 Travelling expenses 9,937,296 4,485,464 Medical expenses 1,429,061 423,089 Accommodation expenses 88,280 444,559
140,679,241 117,337,858
24.2 Office repair & maintenance Repairs office equipment 334,393 652,724 Office maintenance 4,776,576 8,397,507
5,110,969 9,050,231
24.3 This represents provision made @ 3% of net profit before tax.
25 Marketing & selling expenses Staff cost (note-25.1) 28,697,586 34,773,928 Advertisement 3,205,198 14,143,967 Freight and transportation 228,405,546 222,315,294 Performance rebates (note-25.2) 260,753,693 214,502,266
Notes to the Financial Statementsas at and for the year ended 31 December 2016

Annual Report 2016
147
2016 2015Taka Taka
Business promotion 14,672,343 24,581,105 Discount 136,150,662 145,491,345 Travel, entertainment and others 27,666,732 31,874,953
699,551,760 687,682,858
25.1 Staff cost Salary & wages 21,055,742 24,711,010 Bonus 2,870,399 3,436,159 Incentive 1,120,679 2,881,905 Gratuity 1,550,517 1,800,067 Employers contribution to provident fund 774,005 1,334,252 Group life insurance 123,556 178,720 Conveyance and food expenses 1,202,688 431,815
28,697,586 34,773,928
25.2 Performance rebates Compensation to customer 6,616,203 18,351,094 Dealers' commission 102,695,348 91,585,365 Breakage commission 151,442,142 104,565,807
260,753,693 214,502,266
26 Finance income Interest on bank account (SND) 2,501,297 5,878,296 Interest on loan to subsidiary & associate - 13,353,532 Interest on FDR 12,026,567 55,608,360 Exchange gain 3,872,995 11,371,840
18,400,859 86,212,028
27 Finance expensesInterest expenses 38,231,070 17,491,924 Bank charges 1,516,893 1,320,806
39,747,963 18,812,730
28 Income tax expenses Current year 253,189,745 274,419,022 Other tax provision - 54,917,023
253,189,745 329,336,045
29 Transaction in foreign currencyCIF value of import:Raw materials 1,049,031,315 1,106,770,147 Spare parts 299,222,609 282,864,227 Capital machinery 45,568,474 1,103,235,000
Notes to the Financial Statementsas at and for the year ended 31 December 2016

Annual Report 2016
148
2016 2015Taka Taka
Expenditure:Royalty, consultancy & training fees - 30,125,868 Dividend 573,348,800 579,286,300 Earning in foreign currency:FOB value of exports 14,869,100 26,559,633
1,982,040,298 3,128,841,175
22.2.1 Quantitative details of opening stock, purchase/production, consumption/sales and closing stock of raw materials and finished goods
Quantity in mn
Description Unit Opening stock Purchase / Production
Sale / Consumption Closing stock
Quantity Quantity Quantity Quantity Raw materials KGCurrent year 121.36 223.11 197.94 146.53 Previous year 103.95 186.99 169.58 121.36
Finished goodsTiles: SftCeramics/graniteCurrent year 2.72 75.99 69.74 8.97 Previous year 2.60 64.75 64.63 2.72
Decor/border PcsCurrent year 0.09 0.74 0.71 0.12 Previous year 0.10 0.59 0.60 0.09
Sanitaryware:Sanitary items PcsCurrent year 0.14 1.46 1.43 0.17 Previous year 0.02 1.42 1.30 0.14
22.2.2 Production capacity and actual production are given below: 2016
Production Unit
Installed Capacity (Million)
Utilisation during the year
(Million)
% of Utilisation
Over/(Under) Utilisation
(Million)Annual
Tiles Sft 111.04 75.99 68% (35.05)Sanitary ware Pcs 1.45 1.46 100% 0.01
2015
Production Unit
Installed Capacity (Million)
Utilisation during the year
(Million)
% of Utilisation
Over/(Under) Utilisation
(Million)Annual
Tiles Sft 86.40 64.75 75% (21.65)Sanitary ware Pcs 1.45 1.42 98% (0.03)
Notes to the Financial Statementsas at and for the year ended 31 December 2016

Annual Report 2016
149
30 Financial risk managementThe management has overall responsibility for the establishment and oversight of the Company's risk management framework. The Company's risk management policies are established to identify and analyse the risks faced by the Company, to set appropriate risk limits and controls, and to monitor risks and adherence to limits. Risk management policies, procedures and systems are reviewed regularly to reflect changes in market conditions and the Company's activities. The Company has exposure to the following risks from its use of financial instruments.g Credit riskg Liquidity riskg Market risk
30.1 Credit riskCredit risk is the risk of financial loss to the Company if a client or counterparty to a financial instrument fails to meet its contractual obligations, and arises principally from the Company's trade receivables and other receivables.
Management has a credit policy in place and the exposure to credit risk is monitored on an ongoing basis. In monitoring credit risk, debtors are grouped according to their risk profile, i.e. their legal status, financial condition etc. Accounts receivable are mainly related to local receivables. The Company's exposure to credit risk on accounts receivables is mainly influenced by the individual payment characteristics of local customers. The Company has established receivable department to minimise credit risk involving collection of local receivables.
The maximum exposure to credit risk is represented by the carrying amount of each financial asset in the statement of financial position.
a) Exposure to credit riskThe carrying amount of financial assets represents the maximum credit exposure. The maximum exposure to credit risk at the reporting date was:
Amount in USD Amount in Taka
As at 31 Dec As at 31 Dec As at 31 Dec As at 31 Dec
2016 2015 2016 2015 Trade receivables
Customer-Local - - 523,695,477 521,496,316 Customer-Export - 8,260 - 644,304
- 8,260 523,695,477 522,140,620
Other receivablesAccrued rental income 380,000 - Accrued Interest 1,936,806 3,069,778 Receivable against disposal of investment 148,050,000 234,760,000
150,366,806 237,829,778
Loan to disposed subsidiaryJulphar Bangladesh Ltd. (Erstwhile RAK Pharmaceuticals Pvt. Ltd) 201,898,000 201,898,000
201,898,000 201,898,000
Cash equivalents 685,044,256 996,256,074
Notes to the Financial Statementsas at and for the year ended 31 December 2016

Annual Report 2016
150
b) Aging of receivablesAmount in Taka
As at 31 Dec As at 31 Dec 2016 2015
The aging of trade receivables as at 31 December was:
Not past due0-90 days past due 523,695,477 522,140,620
30.2 Liquidity risk
Liquidity risk is the risk that the Company will not be able to meet its financial obligations as they fall due. The Company's approach to managing liquidity is to ensure, as far as possible, that it will always have sufficient liquidity to meet its liabilities when become due, under both normal and stressed conditions, without incurring unacceptable losses or risking damage to the Company's reputation.
The Company ensures that it has sufficient cash and cash equivalents to meet expected operational expenses, including financial obligations through preparation of the cash flow forecast, prepared based on timeline of payment of the financial obligation and accordingly arrange for sufficient liquidity/fund to make the expected payment within due date. Moreover, the Company seeks to maintain short term lines of credit with scheduled commercial banks to ensure payment of obligations in the event that there is insufficient cash to make the required payment. The requirement is determined in advance through cash flows projections and credit lines facilities with banks are negotiated accordingly.
The following are the contractual maturities of financial liabilities of the Company:
As at 31 Dec 2016
Carrying amount
Contractual cash flows
Within 12 months or
less
More than 12 months
Taka Taka Taka Taka
Overdrafts 29,663,693 29,663,693 29,663,693 - Short term borrowing (foreign) 278,103,796 278,103,796 278,103,796 -
Long term borrowing (foreign) 854,877,901 854,877,901 259,951,837 594,926,065
Trade and other payables 621,222,937 621,222,937 621,222,937 - 1,783,868,327 1,783,868,327 1,188,942,263 594,926,065
As at 31 Dec 2015
Carrying amount
Contractual cash flows
Within 12 months or
less
More than 12 months
Taka Taka Taka Taka
Short term borrowing 694,001,555 694,001,555 694,001,555 - Long term borrowing 497,742,616 497,742,616 77,117,814 420,624,802 Trade and other payables 662,561,271 662,561,271 662,561,271 -
1,854,305,442 1,854,305,442 1,433,680,640 420,624,802
Notes to the Financial Statementsas at and for the year ended 31 December 2016

Annual Report 2016
151
30.3 Market risk
Market risk is the risk that changes in market prices such as foreign exchange rates and interest rates will affect the Company’s income or the value of its holding of financial instruments. The objective of market risk management is to manage and control market risk exposures within acceptable parameters, while optimising the return.
a) Currency risk
The Company is exposed to currency risk on certain revenues and purchase of raw material, spare parts, accessories and capital item. Majority of the company’s foreign currency purchase are denominated in USD and EURO. All the export proceeds are receipt in USD, 50% of export proceeds are crediting to export retention quota account and rest of the 50% are converted to Taka and crediting to company’s current account.
i) Exposure to currency risk
The Company's exposure to foreign currency risk was as follows based on notional amounts (in Taka):
As at 31 Dec 2016 As at 31 Dec 2015GBP USD EURO JPY USD EURO JPY
Foreign currency denominated assetsReceivables from customers-Export - - - - 8,260
-
-
Cash at bank - 96,388 - - 62,348
-
-
- 96,388 - - 70,608 -
-
As at 31 Dec 2016 As at 31 Dec 2015GBP USD EURO JPY USD EURO JPY
Foreign currency denominated liabilitiesTrade and other payables 164,899 1,274,984 772,181 - 635,721 1,214,844 - Short term borrowings (foreign) - 3,100,548 375,259 - 2,148,305 5,932,170 5,145,000
Long term borrowings (foreign) - 10,893,763 - - 6,300,539 - -
Royalty & Technical Fees - 1,061,940 - - 30,372 - - 164,899 16,331,235 1,147,440 - 9,114,937 7,147,014 5,145,000
Net exposure (164,899) (16,234,847) (1,147,440) - (9,044,329) (7,147,014) (5,145,000)
The Company has foreign exchange gain of Tk 3,872,995 during the year ended 31 Dec 2016 (31 Dec 2015: Exchange gain Tk 11,371,840).
The following significant exchange rates have been applied:
Exchange rate As at 31 Dec As at 31 Dec
2016 2015 GBP 96.2662 116.3353 USD 78.5500 78.5000 EURO 82.3516 85.8006 JPY 0.6737 0.6518
ii) Foreign exchange rate sensitivity analysis for foreign currency expenditures
A strengthening or weakening of the Taka, as indicated below, against the GBP, USD, EURO and JPY at 31 Dec would have increased/(decreased) profit or loss by the amounts shown below.
Notes to the Financial Statementsas at and for the year ended 31 December 2016

Annual Report 2016
152
As at 31 Dec 2016 As at 31 Dec 2015Profit or (loss) Profit or (loss)
Strengthening Weakening Strengthening Weakening
GBP (3 percent movement) (5,100) 4,803 - - USD (3 percent movement) (502,109) 472,860 (279,722) 263,427 EURO (3 percent movement) (35,488) 33,421 (221,042) 208,165 JPY (3 percent movement) - - (159,124) 149,854
b) Interest rate risk
Interest rate risk is the risk that arises due to changes in interest rates on borrowings. The Company is not significantly exposed to fluctuation in interest rates as it has neither floating interest rate bearing financial liabilities nor entered into any type of derivative instrument in order to hedge interest rate risk as at the reporting date.
Profile
At the reporting date, the interest rate profile of the Company's interest bearing financial instruments was:
Carrying amountAmount in Taka
As at 31 Dec As at 31 Dec 2016 2015
Fixed rate instruments
Financial assetsInvestment in FDR 430,000,000 685,000,000 Cash at banks 255,044,256 311,256,075
Financial liabilitiesOverdrafts 29,663,693 - Long term borrowing 854,877,901 497,742,616 Short term borrowing 278,103,796 694,001,555
Fair value of financial assets and liabilities of the Company together with carrying amount shown in the statement of financial position are as follows:
Amount in Taka Amount in TakaAs at 31 Dec 2016 As at 31 Dec 2015
Carrying amount Fair value Carrying
amount Fair value
Financial assets
Held to maturity assetsInvestment in FDR 430,000,000 430,000,000 685,000,000 685,000,000
Notes to the Financial Statementsas at and for the year ended 31 December 2016
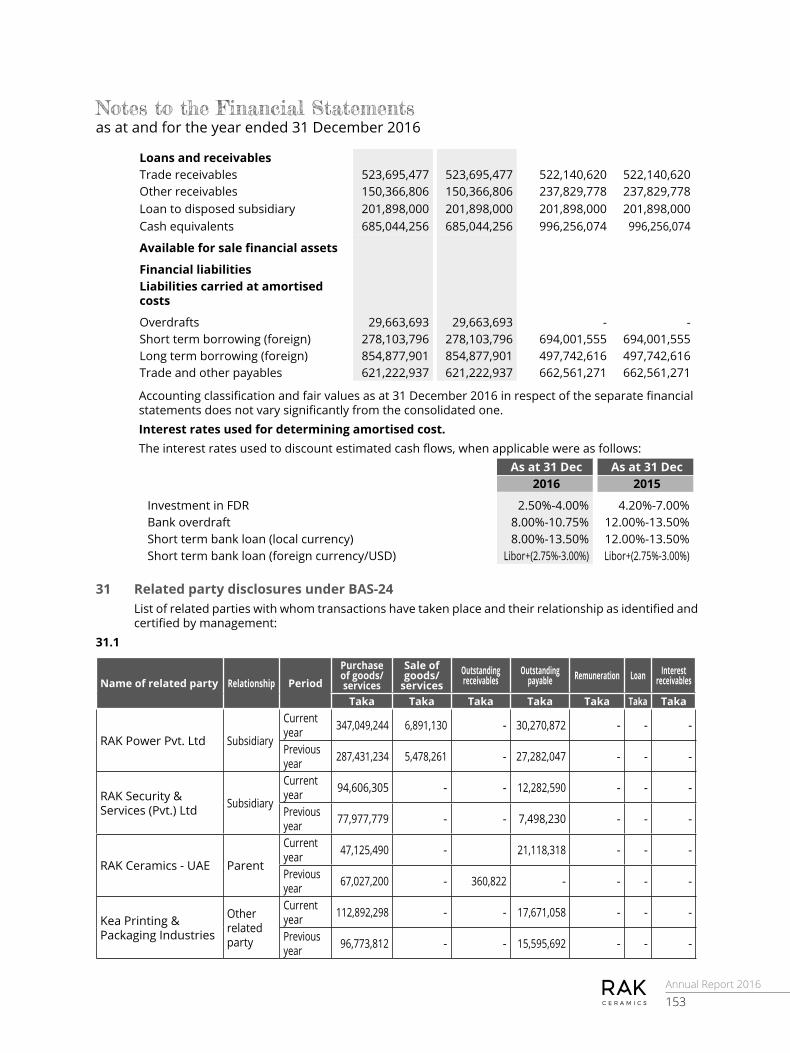
Annual Report 2016
153
Loans and receivablesTrade receivables 523,695,477 523,695,477 522,140,620 522,140,620 Other receivables 150,366,806 150,366,806 237,829,778 237,829,778 Loan to disposed subsidiary 201,898,000 201,898,000 201,898,000 201,898,000 Cash equivalents 685,044,256 685,044,256 996,256,074 996,256,074
Available for sale financial assets
Financial liabilitiesLiabilities carried at amortised costs
Overdrafts 29,663,693 29,663,693 - - Short term borrowing (foreign) 278,103,796 278,103,796 694,001,555 694,001,555 Long term borrowing (foreign) 854,877,901 854,877,901 497,742,616 497,742,616 Trade and other payables 621,222,937 621,222,937 662,561,271 662,561,271
Accounting classification and fair values as at 31 December 2016 in respect of the separate financial statements does not vary significantly from the consolidated one.Interest rates used for determining amortised cost.The interest rates used to discount estimated cash flows, when applicable were as follows:
As at 31 Dec As at 31 Dec 2016 2015
Investment in FDR 2.50%-4.00% 4.20%-7.00% Bank overdraft 8.00%-10.75% 12.00%-13.50% Short term bank loan (local currency) 8.00%-13.50% 12.00%-13.50% Short term bank loan (foreign currency/USD) Libor+(2.75%-3.00%) Libor+(2.75%-3.00%)
31 Related party disclosures under BAS-24 List of related parties with whom transactions have taken place and their relationship as identified and
certified by management:31.1
Name of related party Relationship PeriodPurchase of goods/services
Sale of goods/
servicesOutstanding receivables
Outstanding payable Remuneration Loan Interest
receivables
Taka Taka Taka Taka Taka Taka Taka
RAK Power Pvt. Ltd Subsidiary
Current year 347,049,244 6,891,130 - 30,270,872 - - -
Previous year 287,431,234 5,478,261 - 27,282,047 - - -
RAK Security & Services (Pvt.) Ltd Subsidiary
Current year 94,606,305 - - 12,282,590 - - -
Previous year 77,977,779 - - 7,498,230 - - -
RAK Ceramics - UAE Parent
Current year 47,125,490 - 21,118,318 - - -
Previous year 67,027,200 - 360,822 - - - -
Kea Printing & Packaging Industries
Other related party
Current year 112,892,298 - - 17,671,058 - - -
Previous year 96,773,812 - - 15,595,692 - - -
Notes to the Financial Statementsas at and for the year ended 31 December 2016

Annual Report 2016
154
Name of related party Relationship PeriodPurchase of goods/services
Sale of goods/
servicesOutstanding receivables
Outstanding payable Remuneration Loan Interest
receivables
Taka Taka Taka Taka Taka Taka Taka
Palli Properties Pte. Ltd
Other related party
Current year 18,901,088 - - 1,277,772 - - -
Previous year 11,137,513 - - 1,253,443 - - -
Sky Bird Travel Agents Pvt. Ltd.
Other related party
Current year 5,553,673 - - - - - -
Previous year 4,551,466 - - 17,163 - - -
Green Planet Communications
Other related party
Current year 5,298,996 - - - - - -
Previous year 7,088,620 - - 290,323 - - -
Global Business Associates Ltd.
Other related party
Current year - - - - - - -
Previous year 139,512 - - 12,150 - - -
Mohammed TradingOther related party
Current year - 2,522,019,940 380,083,753 - - - -
Previous year - 1,711,216,467 397,263,967 - - - -
S.A.K. Ekramuzzaman
Key Management Personnel
Current year - - - 40,911,795 40,911,795 - -
Previous year - - - 34,075,485 34,075,485 - -
Imtiaz HussainKey Management Personnel
Current year - - - 680,520 9,588,240 - -
Previous year - - - 636,000 9,537,000 - -
31.2 Events after the reporting period No events, adjusting or non-adjusting, occurred after the date of statement of financial position which
require adjustments or disclosures. 31.3 Paid to Directors During the year, provision was made as MD’s remuneration for Taka 40,911,795
During the year, Board meeting fees of Taka 450,000 was paid to the board members for attending the Board meetings.
32 Number of employees The number of employees engaged for the period who received total remuneration of Taka 36,000
and above was 1,689 (31 Dec 2015 : 1,475) None of receiving below Taka 3,000 per month.
Notes to the Financial Statementsas at and for the year ended 31 December 2016
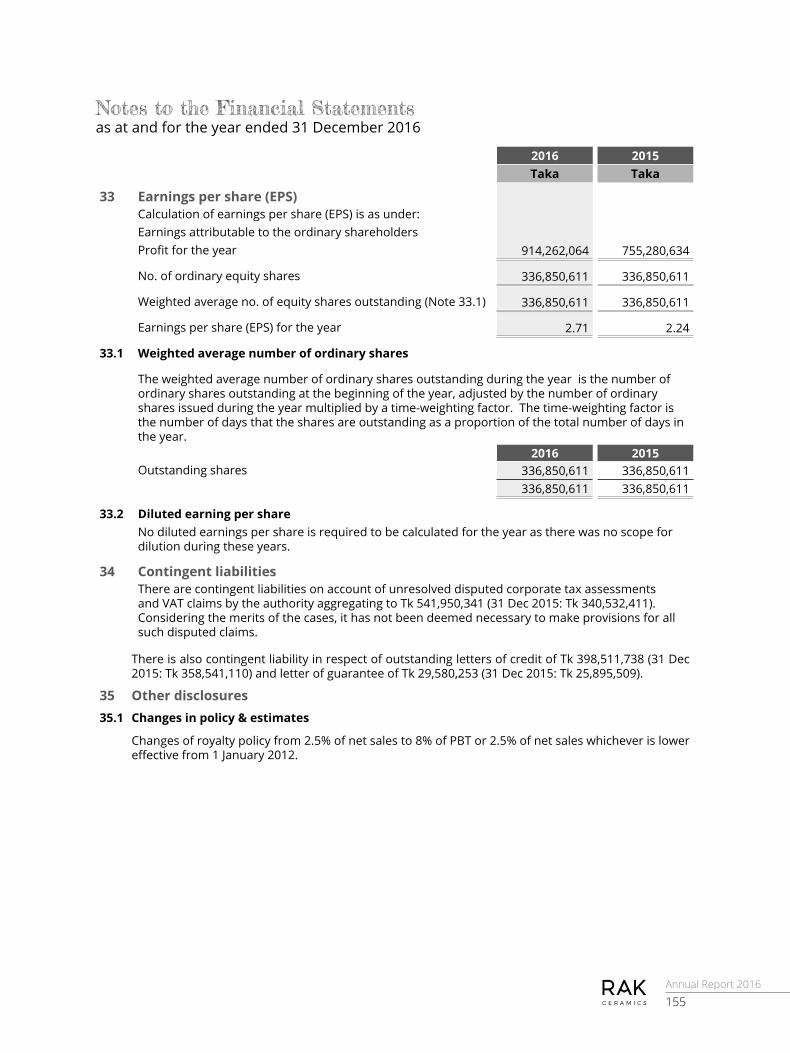
Annual Report 2016
155
2016 2015Taka Taka
33 Earnings per share (EPS)Calculation of earnings per share (EPS) is as under:Earnings attributable to the ordinary shareholdersProfit for the year 914,262,064 755,280,634
No. of ordinary equity shares 336,850,611 336,850,611
Weighted average no. of equity shares outstanding (Note 33.1) 336,850,611 336,850,611
Earnings per share (EPS) for the year 2.71 2.24
33.1 Weighted average number of ordinary shares
The weighted average number of ordinary shares outstanding during the year is the number of ordinary shares outstanding at the beginning of the year, adjusted by the number of ordinary shares issued during the year multiplied by a time-weighting factor. The time-weighting factor is the number of days that the shares are outstanding as a proportion of the total number of days in the year.
2016 2015Outstanding shares 336,850,611 336,850,611
336,850,611 336,850,611
33.2 Diluted earning per shareNo diluted earnings per share is required to be calculated for the year as there was no scope for dilution during these years.
34 Contingent liabilitiesThere are contingent liabilities on account of unresolved disputed corporate tax assessments and VAT claims by the authority aggregating to Tk 541,950,341 (31 Dec 2015: Tk 340,532,411). Considering the merits of the cases, it has not been deemed necessary to make provisions for all such disputed claims.
There is also contingent liability in respect of outstanding letters of credit of Tk 398,511,738 (31 Dec 2015: Tk 358,541,110) and letter of guarantee of Tk 29,580,253 (31 Dec 2015: Tk 25,895,509).
35 Other disclosures35.1 Changes in policy & estimates
Changes of royalty policy from 2.5% of net sales to 8% of PBT or 2.5% of net sales whichever is lower effective from 1 January 2012.
Notes to the Financial Statementsas at and for the year ended 31 December 2016
Annual Report 2016
156
RAK POWER PVT. LTD.
Auditor’s Report and Financial Statements
For the year ended 31 December 2016

Annual Report 2016
157
RAK POWER PVT. LTD.Directors’ Report Dear Shareholders,The Board of Directors of RAK Power Pvt. Ltd. is pleased to present this Directors’ Report together with the Auditors’ Report and Audited Financial Statements of the Company for the year ended December 31, 2016 thereon, for your valued consideration, approval and adoption.
Principal activitiesThe main objects of the company is to set-up power utilities, own and operate power-generating plants, transmission system and distribution system and to sell the generated electric power to any legal entity or any designated franchise area within Bangladesh and generate electricity based on different available types of fuels such as gaseous, liquid and solid fuels, hydro potential and any other natural resources such as solar, wind, tidal and waste materials.
Review of BusinessThe plant capacity was available in excess of 90 percent of installed capacity, during 2016. However, supply was primarily dedicated to the requirement of parent company RAK Ceramics (Bangladesh) Ltd. and other group companies. The company supplied power to Bangladesh Rural Electrification Board (BREB) to the extent of 1.5–2.5 MW in excess of group company requirement and also as per requirement of REB during the first 4 month of the year 2016. After coming in to operation of the 4th plant of RAK Ceramics (Bangladesh) Ltd. Group Company’s requirement has been increased and the power supply to BREB is suspended.
Operational result:The operational results of the Company for the year ended December 31, 2016 as follows:
(Amount in BDT mn)Particulars 2016 2015Sales 373.99 334.04 Gross Profit 147.70 153.50Net Profit After Tax 96.66 99.72Earnings Per Share (Absolute BDT)
47.15 48.65
Net Operating Cash Flow Per Share (NOCFPS)
50.27 60.14
Net Asset Value (NAV) 307.23 313.07Net Asset Value per share (Absolute BDT)
149.87 152.72
DividendThe Board of Directors of the Company is pleased to recommend cash dividend @ 40 percent of the paid up capital of the Company for the year 2016. While recommending the dividend, the Board of Directors has considered the operational performance, business result, the assets as at that date and the working capital requirement for future development and expansion. The Company paid cash dividend @ 50 percent of paid up capital of the Company for the year 2015.
AuditorsM/s. K.M. Hasan & Co., Chartered Accountants shall retire in the 12th AGM, being eligible, they offered themselves for re-appointment and the Board also recommended re-appoint them for the year 2017. Remuneration of the auditor will be fixed by the shareholders at this Annual General Meeting.
Post statement of financial position date eventsThere is no material events which have occurred after the statement of financial position/reporting date, non-disclosure of which could affect the ability of the users of these financial statements to make an appropriate evaluation.
AppreciationThe Board would like to take this opportunity to thank Government bodies, its shareholders, investors, bankers and employees for their continuous commitment, cooperation, confidence and support in attaining Company’s objectives.
For and on behalf of the Board of Directors
Abdallah MassaadChairman
January 23, 2017 Ras Al Khaimah, UAE

Annual Report 2016
158
We have audited the accompanying financial statements of RAK Power Pvt. Ltd., which comprise the statement of financial position as at 31 December 2016 the statement of profit or loss and other comprehensive income, statement of changes in equity and statement of cash flows for the year then ended, and a summary of significant accounting policies and other explanatory information.
Management’s Responsibility for the Financial StatementsManagement of RAK Power Pvt. Ltd. is responsible for the preparation and fair presentation of these financial statements in accordance with Bangladesh Financial Reporting Standards (BFRSs) and for such internal control as management determines is necessary to enable the preparation of financial statements that are free from material misstatement, whether due to fraud or error.
Auditor’s ResponsibilityOur responsibility is to express an opinion on these financial statements based on our audit. We conducted our audit in accordance with Bangladesh Standards on Auditing (BSA). Those standards require that we comply with ethical requirements and plan and perform the audit to obtain reasonable assurance about whether the financial statements are free from material misstatement.
An audit involves performing procedures to obtain audit evidence about the amounts and disclosures in the financial statements. The procedures selected depend on our judgement, including the assessment of the risks of material misstatement of the financial statements, whether due to fraud or error. In making those risk assessments, we consider internal control relevant to the entity’s preparation and fair presentation of the financial statements in order to design audit procedures
that are appropriate in the circumstances, but not for the purpose of expressing an opinion on the effectiveness of the entity’s internal control. An audit also includes evaluating the appropriateness of accounting policies used and the reasonableness of accounting estimates made by management, as well as evaluating the overall presentation of the financial statements.
We believe that the audit evidence we have obtained is sufficient and appropriate to provide a basis for our audit opinion.
OpinionIn our opinion, the financial statements, prepared in accordance with Bangladesh Financial Reporting Standard (BFRSs), give a true and fair view of the financial position as at 31 December 2016 and its financial performance and its cash flows for the year then ended and comply with the Companies Act, 1994 and other applicable laws and regulations.
We also report that:a. we have obtained all the information and
explanations which to the best of our knowledge and belief were necessary for the purposes of our audit and made due verification thereof;
b. in our opinion, proper books of account as required by law have been kept by the Company so far as it appeared from our examination of those books; and
c. the company’s statement of financial position and statement of profit or loss and other comprehensive income dealt with by the report are in agreement with the books of account.
Dated: 23 January 2017K. M. HASAN & CO.
Chartered Accountants
RAK POWER PVT. LTD.Auditor’s Report to The Shareholders

Annual Report 2016
159
RAK POWER PVT. LTD.Statement of Financial PositionAs at 31 December 2016
Notes 2016 2015 Taka Taka
ASSETSNon - Current AssetsProperty, plant and equipment 4 183,270,263 200,136,981 Investment in RAK Security and Services Pvt. Ltd. 5 287,500 287,500 Total non-current assets 183,557,763 200,424,481
Current AssetsInventories 6 66,469,916 57,167,915 Trade and other receivables 7 33,593,221 37,069,491 Advance, deposits & prepayments 8 6,836,797 7,340,323 Advance income tax 9 187,568,115 145,945,021 Cash and cash equivalents 10 102,371,034 100,305,618 Total current assets 396,839,083 347,828,368 Total assets 580,396,846 548,252,849
EQUITY & LIABILITIESCapital and ReservesShare capital 11 205,000,000 205,000,000 Retained earnings 102,231,168 108,067,044 Total equity 307,231,168 313,067,044
Non-Current liabilitiesDeferred tax liability 12 36,508,621 37,575,095 Total non-current liabilities 36,508,621 37,575,095
Current LiabilitiesProvision for employees' benefit 13 - 91,809 Trade and other payables 14 9,641,273 10,881,516 Liability for expenses 15 16,527,304 21,542,687 Provision for corporate tax 16 210,488,480 165,094,698 Total current liabilities 236,657,057 197,610,710 Total equities and liabilities 580,396,846 548,252,849
The annexed notes form an integral part of these financial statements (Page 163-179)
Dated: 23 January 2017
Director Managing Director
Signed in terms of separate report of even date annexed.
K.M. HASAN & CO. Chartered Accountants

Annual Report 2016
160
RAK POWER PVT. LTD.Statement of Profit or Loss and other Comprehensive IncomeFor the year ended 31 December 2016
Notes2016 2015Taka Taka
Sales 17 373,986,378 334,038,544 Cost of sales 18 (226,286,015) (180,539,103) Gross profit 147,700,363 153,499,441 Administrative expenses 19 (9,269,743) (11,517,509) Profit from operating activities 138,430,620 141,981,932 Other income 20 2,817,130 3,824,325 Financial expenses 21 (256,318) (118,101) Net finance income 2,560,812 3,706,224 Profit before income tax 140,991,432 145,688,156 Income tax expenses Current tax 22 (45,393,782) (45,242,248) Deferred tax 12 1,066,474 (721,690)
(44,327,308) (45,963,938) Profit for the year 96,664,124 99,724,218 Other comprehensive income - - Total comprehensive income 96,664,124 99,724,218
Basic Earnings Per Share (EPS) of Taka 100 each 25.2 47.15 48.65
The annexed notes form an integral part of these financial statements (Page 163-179)
Dated: 23 January 2017
Director Managing Director
Signed in terms of separate report of even date annexed.
K.M. HASAN & CO. Chartered Accountants
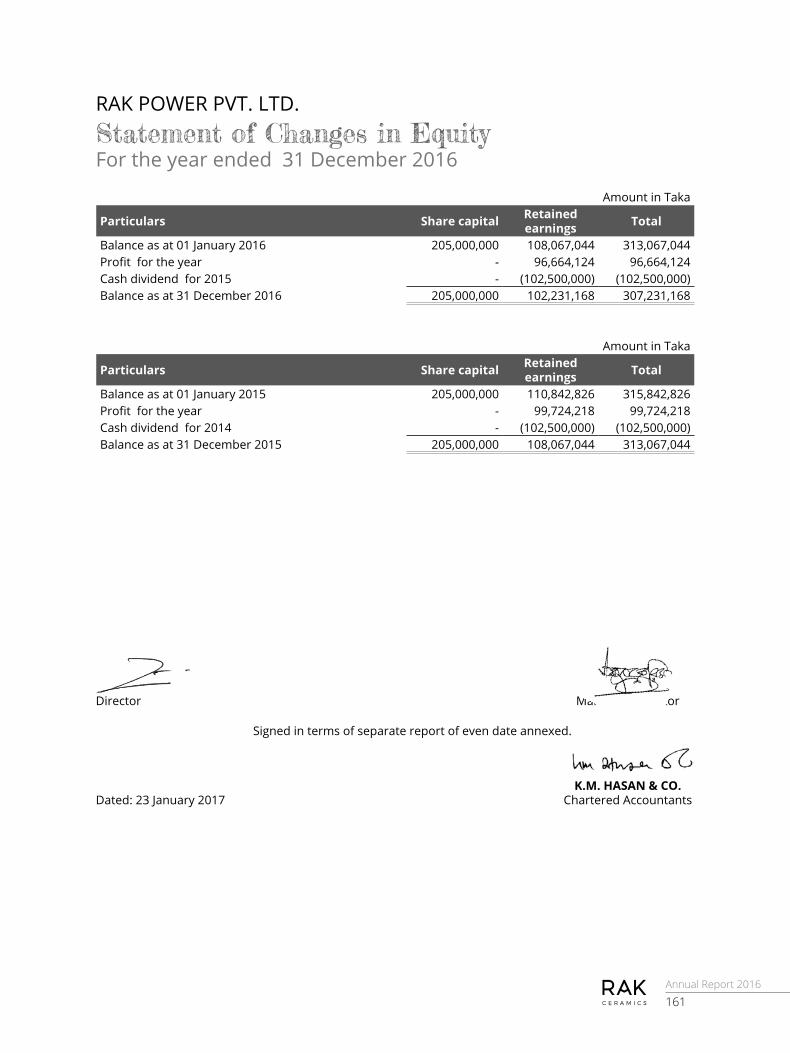
Annual Report 2016
161
RAK POWER PVT. LTD.Statement of Changes in EquityFor the year ended 31 December 2016
Amount in Taka
Particulars Share capital Retained earnings Total
Balance as at 01 January 2016 205,000,000 108,067,044 313,067,044 Profit for the year - 96,664,124 96,664,124 Cash dividend for 2015 - (102,500,000) (102,500,000)Balance as at 31 December 2016 205,000,000 102,231,168 307,231,168
Amount in Taka
Particulars Share capital Retained earnings Total
Balance as at 01 January 2015 205,000,000 110,842,826 315,842,826 Profit for the year - 99,724,218 99,724,218 Cash dividend for 2014 - (102,500,000) (102,500,000)Balance as at 31 December 2015 205,000,000 108,067,044 313,067,044
Dated: 23 January 2017
Director Managing Director
Signed in terms of separate report of even date annexed.
K.M. HASAN & CO. Chartered Accountants

Annual Report 2016
162
2016 2015 Taka Taka
Cash flows from operating activitiesCash receipts from customers 377,530,587 328,294,712 Cash paid to customer and others (232,857,496) (160,574,862)
144,673,091 167,719,850
Income tax paid (41,623,094) (44,430,648)Net cash from operating activities 103,049,997 123,289,202
Cash flows from investing activitiesAcquisition of property, plant and equipments (1,227,191) (2,860,480)Investment in RAK securities and services - (287,500)Interest received from Bank 2,739,191 3,447,120 Dividend received 10,000 - Net cash from investing activities 1,522,000 299,140 Net cash from investing activities 1,522,000 299,140
Cash flows from financing activitiesFinance charge (6,581) (13,030)Dividend paid (102,500,000) (102,500,000)Net cash used in financing activities (102,506,581) (102,513,030)Increase/(decrease) in cash and cash equivalents 2,065,416 21,075,312 Cash and cash equivalent as at 01 January 2016 100,305,618 79,230,306 Cash and cash equivalent as at 31 December 2016 102,371,034 100,305,618
RAK POWER PVT. LTD.Statement of Cash FlowsFor the year ended 31 December 2016
Dated: 23 January 2017
Director Managing Director
Signed in terms of separate report of even date annexed.
K.M. HASAN & CO. Chartered Accountants

Annual Report 2016
163
RAK POWER PVT. LTD.Notes to the Financial StatementsAs at and for the year ended 31 December 2016
1. The company and it’s activities
RAK Power Pvt. Ltd. has been incorporated in Bangladesh under the Companies Act ,1994 on 30 June 2005 as a private company limited by shares.The company has gone into commercial operation from 01 May 2009.
The registered office of the company is at RAK Tower (8th Floor), Jashimuddin Avenue, Plot # 1/A, Sector # 3,Uttara Model Town, Dhaka-1230. The Power Plant is located at Vill : Dhanua, P.S: Sreepur, Dist : Gazipur, Bangladesh.
The main objects of the company is to set-up power utilities, own and operate power-generating plants, transmission system and distribution system and to sell the generated electric power to any legal entity or any designated franchise area within Bangladesh and generate electricity based on different available types of fuels such as gaseous, liquid and solid fuels, hydro potential and any other natural resources such as solar , wind , tidal and waste materials.
2. Significant accounting policies
The financial statements have been prepared on a going concern concept under historical cost convention in accordance with Generally Accepted Accounting Principles as laid down in the International Accounting Standards (IASs)/International Financial Reporting Standards (IFRSs), applicable to the company as adopted by the Institute of Chartered Accountants of Bangladesh as Bangladesh Accounting Standards (BASs) / Bangladesh Financial Reporting Standards (BFRSs).
2.1. Risk and uncertainties for use of estimates in preparation of financial statements
The preparation of financial statements in conformity with the Bangladesh Accounting Standards require management to make estimates and assumptions that affect the reported amounts of assets and liabilities and disclosure of contingent assets and liabilities at the date of financial statements, and revenues and expenses during the reported period. Actual results could differ from those estimates. Estimates are used for accounting of certain items such as provision for doubtful accounts, depreciation, taxes, reserves and contingencies.
2.2 Property, plant and equipment
Property, plant and equipment are stated in attached statement of financial position at cost less accumulated depreciation in accordance with IAS-16/BAS-16. Cost represents the purchase price of the assets and other cost incurred to bring the assets to their existing location and condition.
Subsequent expenditure for renewals and betterments that enhance the economic useful life of the property, plant and equipment or that improve the capacity, quality or reduce substantially the operating cost or administration expenses are capitalized by adding to the related property, plant and equipment.
All other expenditure for maintenance of property, plant and equipment are charged to the statement of profit or loss and other comprehensive income.
Upon disposal of items of property, plant and equipment, the cost of those assets and their related accumulated depreciation are adjusted up to the date of disposal and any gain or loss thereof is reported in the statement of comprehensive income of that year.
2.3. Depreciation on Property, plant and equipment
Depreciation on property, plant and equipment is charged on straight line method and over the estimated useful life. Depreciation of assets is charged as and when the assets is available for use and depreciation is provided for the period in use of the assets.
Rates of depreciation on various classes of assets are as under:

Annual Report 2016
164
Category of fixed assetEstimated
useful life in years
Rate (%)
Building for plant 5 20Plant and machinery : - Main genset 20 5- Auxiliary equipments 10 10Electrical installation 5 20Gas pipeline 5 20Furniture and fixtures & fittings 10 10Office equipment 5 20Communication equipment 10 10Tools and appliances 5 20Vehicles 5 20Fire fighting equipments 5 20
Land is not depreciated as it is deemed to have an infinite life.
2.4. Trade receivable
Trade receivable are recognized at invoice amount which is the fair value of the consideration given in return.
2.5. Valuation of inventories
Inventories are stated at lower of cost and net realizable value in compliance with the requirements of paras 21 and 25 of IAS-2/BAS-2:”Inventory”.
2.6. Employees’ benefit plan
i) Provident fund
The company for its permanent employees operates a scheme of contributory provident fund. The provident fund is administrated by a Board of Trustees and is funded by contributions from the employees @ 10% of basic salary and wages equally matched by the company. The contributions are invested separately from the company’s assets.
ii) Gratuity
Permanent employees are also entitled to gratuity after completion of minimum six months of service in the company. The gratuity is calculated on the last basic pay and is payable at the rate of one month’s basic pay for every completed year of service. The employees who has completed ten years of service is entitled for one and half time of last basic salary. The expected cost of this benefit is included in respective annual Statement of Profit or Loss and Other Comprehensive Income over the period of employment.
iii) WPPF
As per Bangladesh Labour Act 2006 as amended in 2013, The Workers Profit Participation Fund is yet to be introduced.
2.7. Revenues recognition
Revenue is measured at the fair value of the consideration received or receivable. Revenue from sale of electricity is recognized when the electricity is transmitted from delivery point (metering point, which is situated inside the power station) to customers. The revenue and the cost incurred to effect the transaction can be measured reliably in compliance with the requirements of BAS-18: “Revenues”.
Notes to the Financial Statementsas at and for the year ended 31 December 2016

Annual Report 2016
165
Notes to the Financial Statementsas at and for the year ended 31 December 20162.8. Borrowing cost
In compliance with the requirement of BAS-23.”Borrowing Cost”, borrowing cost relating to operational period on long term loans, short term loans and overdraft facilities was charged to profit or loss and other comprehensive income as an expenses as incurred.
2.9. Creditors and accruals
Liabilities are recorded at the level of cost / estimated amount payable in settlement.
2.10. Foreign currency transaction
Foreign currency transactions are recorded in Taka at the applicable rates of exchange ruling at the transaction date. The monetary assets and liabilities, if any, denominated in foreign currencies at the statement of financial position date are translated at the applicable rates of exchanges ruling at the date. Exchange rate differences are charged off as revenue expenditure to statement of comprehensive income in compliance with the provisions of IAS-21/BAS-21-The effect of changes in foreign exchange rates.
2.11. Cash and cash equivalents
Cash and cash equivalents include cash in hand, cash at banks, term deposits, etc. which are available for use by the Company without any restrictions. There is no significant risk of change in value of the same.
2.12. Statement of cash flows
Statement of cash flows is prepared principally in accordance with BAS-7: “Statement of Cash Flows” and the cash flow from operating activities has been prepared under direct method.
2.13. Taxation
The company has operating profit during the year as such provision for corporate tax @ 35% made for the current year.
The company will get the benefit of 10% rebate on payable income tax upto 30 June 2019 as per S.R.O.NO.185-AIN / Aikor / 2014 Date: 01 July 2014 since the power plant is situated outside of the City Corporation.
Deferred Tax resulting from ‘Timing difference” between books and taxable profit calculated as per IAS-12/BAS-12 is accounted using the tax rates and laws that have been enacted or substantively enacted as on statement of financial position date.
3. Disclosures
The disclosures of information have been made in accordance with the requirements of the above mentioned standards and in compliance with Companies Act 1994 and the statement of financial position and statement of profit or loss and other comprehensive income have been prepared according to IAS-1/BAS-1 (Presentation of Financial Statements) based on accrual basis.
3.1. Segment reporting
As there is a single business and geographical segment within which the company operates as such no segment reporting is felt necessary.
3.2. General
3.2.1. The figures in the financial statements represent Bangladesh currency (Taka) which is the functional currency of the company.
3.2.2. Figures in these notes and annexed financial statements have been rounded off to the nearest Taka.
3.2.3. Previous year’s figures have been regrouped and/or rearranged wherever considered necessary for the purpose of current year’s presentation.

Annual Report 2016
166
Not
es t
o th
e Fin
anci
al S
tate
men
tsas
at a
nd fo
r th
e ye
ar e
nded
31
Dec
embe
r 20
16
4.
Prop
erty
, pla
nt a
nd e
quip
men
t
2016
PART
ICU
LARS
C O
S T
Rate
D E
P R
E C
I A
T I
O N
WRI
TTEN
D
OW
N
VALU
E AS
AT
31
DEC
EMBE
R 20
16
Bala
nce
as a
t 01
Ja
nuar
y 20
16
Add
itio
n du
ring
the
ye
ar S
ales
/ di
spos
al
Tota
l as
at
31 D
ecem
ber
2016
Bala
nce
as a
t 01
Ja
nuar
y 20
16
Cha
rged
du
ring
the
ye
ar
Adju
stm
ent
duri
ng th
e ye
ar
Tota
l as
at
31
Dec
embe
r 20
16La
nd 1
1,29
4,00
0 -
- 1
1,29
4,00
0 0%
- -
- -
11,
294,
000
Build
ing
19,
195,
131
- -
19,
195,
131
20%
19,
195,
130
- -
19,
195,
130
1
Plan
t and
mac
hine
ry -
M
ain
Gen
Set
268
,615
,599
-
- 2
68,6
15,5
99
5% 9
4,01
5,46
0 1
3,43
0,78
0 -
107
,446
,240
1
61,1
69,3
59
A
uxili
ary
equi
pmen
ts 3
3,59
7,15
7 -
- 3
3,59
7,15
7 10
% 2
3,39
8,84
3 3
,359
,717
-
26,
758,
560
6,8
38,5
97
Elec
tric
al in
stal
latio
n 2
4,88
4,14
5 9
38,4
91
- 2
5,82
2,63
6 20
% 2
3,07
9,92
7 5
21,0
30
- 2
3,60
0,95
7 2
,221
,679
G
as p
ipel
ine
17,
699,
732
- -
17,
699,
732
20%
16,
467,
529
453
,014
-
16,
920,
543
779
,189
Fu
rnitu
re a
nd fi
xtur
es 1
,583
,164
2
34,2
00
- 1
,817
,364
10%
1,0
00,8
33
172
,551
-
1,1
73,3
84
643
,980
O
ffice
equ
ipm
ent
1,1
00,9
55
54,
500
63,
000
1,0
92,4
55 2
0% 7
91,8
44
104
,723
6
3,00
0 8
33,5
67
258
,887
Co
mm
unic
atio
n eq
uipm
ent
124
,786
-
- 1
24,7
86 1
0% 8
7,35
3 1
2,48
0 -
99,
833
24,
953
Tool
s an
d ap
plia
nces
4,4
45
- -
4,4
45 2
0% 4
,444
-
- 4
,444
1
Fi
re fi
ghtin
g eq
uipm
ents
3,6
31,0
12
- -
3,6
31,0
12 2
0% 3
,631
,011
-
- 3
,631
,011
1
Ve
hicl
es 2
,447
,831
-
147
,300
2
,300
,531
20%
2,3
68,6
02
39,
614
147
,300
2
,260
,916
3
9,61
5 To
tal a
s at 3
1 De
cem
ber 2
016
384
,177
,957
1
,227
,191
2
10,3
00
385
,194
,848
1
84,0
40,9
76
18,
093,
909
210
,300
2
01,9
24,5
85
183
,270
,263
Allo
cati
on o
f dep
reci
atio
n to
A
dmin
istr
ativ
e ex
pens
es
329
,368
C
ost o
f gen
erat
ion
of e
lect
rici
ty
17,
764,
541
18,
093,
909
Dis
posa
l of P
rope
rty,
pla
nt a
nd e
quip
men
t
Par
ticu
lars
C
ost
Acc
umul
ated
de
prec
iati
on
Net
boo
k va
lue
Sal
es
proc
eed
Pro
fit
on
disp
osal
Ve
hicl
e 1
47,3
00
147
,300
-
55,
550
55,
550
Offi
ce E
quip
men
t 6
3,00
0 6
3,00
0 -
10,
100
10,
100
Tot
al
210
,300
2
10,3
00
- 6
5,65
0 6
5,65
0

Annual Report 2016
167
Not
es t
o th
e Fin
anci
al S
tate
men
tsas
at a
nd fo
r th
e ye
ar e
nded
31
Dec
embe
r 20
16
2015
PART
ICU
LARS
C O
S T
Rate
D E
P R
E C
I A
T I
O N
WRI
TTEN
D
OW
N
VALU
E AS
AT
31
DEC
EMBE
R 20
15
Bala
nce
as a
t 01
Ja
nuar
y 20
15
Add
itio
n du
ring
the
ye
ar
Sal
es/
disp
osal
Tota
l as
at
31 D
ecem
ber
2015
Bala
nce
as a
t 01
Ja
nuar
y 20
15
Cha
rged
du
ring
the
ye
ar
Adju
stm
ent
duri
ng th
e ye
ar
Tota
l as
at
31
Dec
embe
r 20
15
Land
11,
294,
000
- -
11,
294,
000
0% -
- -
- 1
1,29
4,00
0
Build
ing
19,
195,
131
- -
19,
195,
131
20%
19,
066,
318
128
,812
-
19,1
95,1
30
1
Plan
t and
mac
hine
ry
M
ain
Gen
Set
268,
615,
599
- -
268,
615,
599
5% 8
0,58
4,68
0 1
3,43
0,78
0 -
94,0
15,4
60
174
,600
,139
A
uxili
ary
equi
pmen
ts 3
3,59
7,15
7 -
- 3
3,59
7,15
7 10
% 2
0,03
9,12
6 3
,359
,717
-
23,3
98,8
43
10,
198,
314
Elec
tric
al in
stal
latio
n 2
2,98
4,14
5 1
,900
,000
-
24,
884,
145
20%
22,
900,
060
179
,867
-
23,0
79,9
27
1,8
04,2
18
Gas
pip
elin
e 1
6,86
9,73
2 8
30,0
00
- 1
7,69
9,73
2 20
% 1
6,01
4,51
5 4
53,0
14
- 16
,467
,529
1
,232
,203
Furn
iture
and
fixt
ures
1,5
52,1
64
31,
000
- 1
,583
,164
10%
845
,365
1
55,4
68
- 1
,000
,833
5
82,3
31
Offi
ce e
quip
men
t 1
,001
,475
9
9,48
0 -
1,1
00,9
55 2
0% 6
96,8
33
95,
011
- 7
91,8
44
309
,111
Com
mun
icat
ion
equi
pmen
t 1
24,7
86
- -
124
,786
10%
74,
874
12,
479
- 8
7,35
3 3
7,43
3
Tool
s an
d ap
plia
nces
4,4
45
- -
4,4
45 2
0% 4
,444
-
- 4
,444
1
Fire
figh
ting
equi
pmen
ts 3
,631
,012
-
- 3
,631
,012
20%
3,6
31,0
11
- -
3,6
31,0
11
1
Vehi
cles
2,4
47,8
31
- -
2,4
47,8
31 2
0% 2
,067
,133
3
01,4
69
- 2
,368
,602
7
9,22
9
Tota
l as a
t 31
Dece
mbe
r 201
538
1,31
7,47
7 2
,860
,480
-
384,
177,
957
165,
924,
359
18,
116,
617
- 18
4,04
0,97
6 2
00,1
36,9
81
Allo
cati
on o
f dep
reci
atio
n to
A
dmin
istr
ativ
e ex
pens
es
564
,427
C
ost o
f gen
erat
ion
of e
lect
rici
ty
17,
552,
190
18,
116,
617

Annual Report 2016
168
Notes to the Financial Statementsas at and for the year ended 31 December 2016
2016 2015 Taka Taka
5. Investment in RAK Security and Services Pvt. Ltd. 287,500 287,500 The company has purchased 100 ordinary shares of RAK security and services Ltd. on 20.10.2015 at its fair value of Taka 2,875 per share.
6. InventoriesStores and consumables spares 66,469,916 57,134,423 Goods-in-transit - 33,492
66,469,916 57,167,915 57,167,915 60,666,941
7. Trade and other receivablesTrade receivables (Note-7.1) 33,193,313 36,479,422 Accrued interest 399,908 590,069
33,593,221 37,069,491 7.1. Trade receivables
Receivables from captive customers 33,193,313 32,829,624 Receivables from Bangladesh Rural Electrification Board (BREB) - 3,649,798
33,193,313 36,479,422
8. Advance, deposits and prepaymentsAdvance (Note-8.1) - 469,246 Security and other deposits (Note-8.2) 6,029,157 6,012,611 Prepayments (Note-8.3) 807,640 858,466
6,836,797 7,340,323 8.1 Advance
Suppliers against materials and services - 469,246
8.2 Security and other depositsTitas Gas Transmission & Distribution Ltd. 5,873,150 5,873,150 VAT and supplementary duty (Note-8.2.2) 156,007 139,461
6,029,157 6,012,611 8.2.2 VAT and supplementary duty
Balance as at 1 January 2016 139,461 416,773 Add: Treasury deposit for VAT & SD purpose 800,000 440,000
939,461 856,773 Less: VAT & SD on sales 783,454 717,312 Closing Balance 156,007 139,461
8.3 PrepaymentsHouse rent 113,000 90,000 Insurance 641,099 719,225 Registration & renewal 53,541 49,241
807,640 858,466 9. Advance income tax
Balance as at 01 January 2016 145,945,021 101,514,373 Add: Paid during the year 41,623,094 44,430,648 Balance as at 31 December 2016 187,568,115 145,945,021

Annual Report 2016
169
Notes to the Financial Statementsas at and for the year ended 31 December 2016
2016 2015 Taka Taka
9.1. Head wise paymentAdvance income tax-paid in cash 181,925,273 141,925,273 Against import 4,250,194 2,931,591 Vehicle registration 144,000 114,000 TDS on bank interest 1,246,648 974,157 TDS on dividend income 2,000 -
187,568,115 145,945,021
9.2. Year wise paymentYear 2016 29,432,885 - Year 2015 45,242,248 33,052,039 Year 2014 37,992,335 37,992,335 Year 2013 37,210,247 37,210,247 Year 2012 33,236,075 33,236,075 Year 2011 3,535,904 3,535,904 Year 2010 913,421 913,421 Year 2009 5,000 5,000
187,568,115 145,945,021
10. Cash and cash equivalentsCash in hand 475,964 51,384 Cash at banks (Note 10.1) 20,458,439 17,114,599 Investment in Fixed Deposit Receipt (FDR) (Note-10.2) 81,436,631 83,139,635
102,371,034 100,305,618 10.1. Cash at banks
HSBC (Current Account-001-107580-011), Main Branch 2,100,340 1,356,394 SCB (Current Account 01-3767272-01), Main Branch 39,957 121,186 SCB (SND Account 02-3767272-01), Main Branch 1,038,142 400,958 DBBL (Current Account 117.110.23474), Uttara Branch 1,425 - DBBL (SND Account 117.120.2550), Uttara Branch 17,278,575 15,236,061
20,458,439 17,114,599 10.2. Investment in fixed deposit receipt (FDR)
SCB 9 37672720 01 762,080 762,080 HSBC 001-107580-101 674,551 652,345 DBBL 117-502-35088 - 10,788,749 DBBL 117-502-35574 - 10,621,461 DBBL 117-502-37995 - 10,157,500 DBBL 117-502-38006 - 10,157,500 DBBL 117-502-38490 - 10,000,000 DBBL 117-502-38987 - 10,000,000 DBBL 117-502-39211 - 10,000,000 DBBL 117-502-39295 - 10,000,000 DBBL 117-502-41358 10,000,000 - DBBL 117-502-41365 10,000,000 - DBBL 117-502-41547 10,000,000 - DBBL 117-502-41552 10,000,000 - DBBL 117-502-41568 10,000,000 -

Annual Report 2016
170
Notes to the Financial Statementsas at and for the year ended 31 December 2016
2016 2015 Taka Taka
DBBL 117-502-41916 10,000,000 - DBBL 117-502-41996 10,000,000 - DBBL 117-502-42000 10,000,000 -
81,436,631 83,139,635 11. Share capital
Authorised10,000,000 ordinary shares of Tk 100 each ordinary shares 1,000,000,000 1,000,000,000
Issued, subscribed, called and paid up2,050,000 ordinary shares of Tk 100 each ordinary shares 205,000,000 205,000,000
Percentage of shareholdings2016 2015 2016 2015
% % Taka Taka RAK Ceramics (Bangladesh) Limited. 100.00 100.00 204,999,000 204,999,000 Engr. Md. Maqsudul Karim 0.00 0.00 500 500 RAK Security and Services Pvt. Ltd. 0.00 0.00 500 500
100.00 100.00 205,000,000 205,000,000
Classification of shareholders by rangeShareholder's range No. of shareholders No. of shares
2016 2015 2016 2015Less than 500 shares 2 2 10 10 501 to 1,000,000 shares - - - - Over 1,000,000 shares 1 1 2,049,990 2,049,990
3 3 2,050,000 2,050,000
2016 2015 Taka Taka
12. Deferred tax liabilitiesDeferred tax liability is arrived at as follows:
Opening balance 37,575,095 36,853,405 Deferred tax income / (expenses) 1,066,474 (721,690)Closing balance 36,508,621 37,575,095
Carrying amount as per Taxable/ (deductible) Temporary difference
Statement of
financial position
Tax base
As at 31 December 2016Property, plant and equipment 183,270,263 78,959,916 104,310,347 - As at 31 December 2015Property, plant and equipment 200,136,981 92,779,568 - 107,357,413 Net deductible temporary difference 104,310,347 107,357,413 Deferred tax liability (applying tax rate 35%) 36,508,621 37,575,095

Annual Report 2016
171
Notes to the Financial Statementsas at and for the year ended 31 December 2016
2016 2015 Taka Taka
13. Provision for employees' benefitProvident fund (Note 13.1) - 64,814 Gratuity fund (Note 13.2) - 26,995
- 91,809
13.1. Provident fundBalance as at 01 January 2016 64,814 181,698 Add: Addition during the year 851,707 723,596
916,521 905,294 Less: Payment made during the year 916,521 840,480 Balance as at 31 December 2016 - 64,814
13.2. Gratuity fundBalance as at 01 January 2016 26,995 301,319 Add: Addition during the year 2,972,185 331,798
2,999,180 633,117 Less: Payment made during the year 2,999,180 606,122 Balance as at 31 December 2016 - 26,995
14. Trade and other payablesTrade payablesPayable to supplier 1,081,059 154,227 Payable to service provider 6,289,907 9,204,638
7,370,966 9,358,865
Other payablesTax deducted at source 880,588 670,373 VAT deducted at source 1,389,719 852,278
2,270,307 1,522,651 9,641,273 10,881,516
15. Liability for expensesPower and gas 12,142,346 12,567,717 Staff cost 3,849,495 3,914,642 Professional charges 109,250 109,250 Telephone bill & other expenses 7,000 7,000 Provision for operation & maintenance 419,213 4,944,078
16,527,304 21,542,687 16. Provision for corporate tax
Balance as at 01 January 2016 165,094,698 119,852,450 Add: Provision made during the year 45,393,782 45,242,248 Balance as at 31 December 2016 210,488,480 165,094,698

Annual Report 2016
172
Notes to the Financial Statementsas at and for the year ended 31 December 2016
2016 2015 Taka Taka
16.1. Year wise provisionFinancial year 2016 45,393,782 - Financial year 2015 45,242,248 45,242,248 Financial year 2014 37,992,335 37,992,335 Financial year 2013 44,169,714 44,169,714 Financial year 2012 33,236,076 33,236,076 Financial year 2011 3,535,904 3,535,904 Financial year 2010 913,421 913,421 Financial year 2009 5,000 5,000
210,488,480 165,094,698
17. Sales Sales to group company 361,750,189 301,057,003 Sales to Bangladesh Rural Electrification Board (BREB) 13,019,643 33,698,853 Gross sales 374,769,832 334,755,856 Less : VAT 783,454 717,312 Net sales 373,986,378 334,038,544
Selling electricity to BREB is VAT exempted as per SRO 119 -ain/2015/725-VAT, Dated-04 June 2015.
Selling electricity to Captive organizations is VAT exempted as per SRO 351 -ain/2010/578, Dated:18 October 2010.
18. Cost of salesStock of finished goods as at 01 January 2016 - - Cost of generation of electricity (Note 18.1) 226,286,015 180,539,103 Cost of finished goods available for sale 226,286,015 180,539,103 Less: Stock of finished goods as at 31 December 2016 - -
226,286,015 180,539,103
18.1. Cost of generation of electricity Cost of materials consumed: Opening stock - - Purchase during the year 116,834,047 79,555,601 Less: Closing stock - -
116,834,047 79,555,601 Production overheads: Direct labour (Note-18.1.1) 9,602,267 6,880,413 Direct expenses: Lubricating Oil 6,797,821 7,522,214 Repair & indirect materials (Note-18.1.2) 63,698,685 58,470,358 Rental for caterpillar Gensets 7,924,800 6,300,000 Depreciation 17,764,541 17,552,190 Other production overheads (Note 18.1.3) 3,663,854 4,258,327
109,451,968 100,983,502 226,286,015 180,539,103
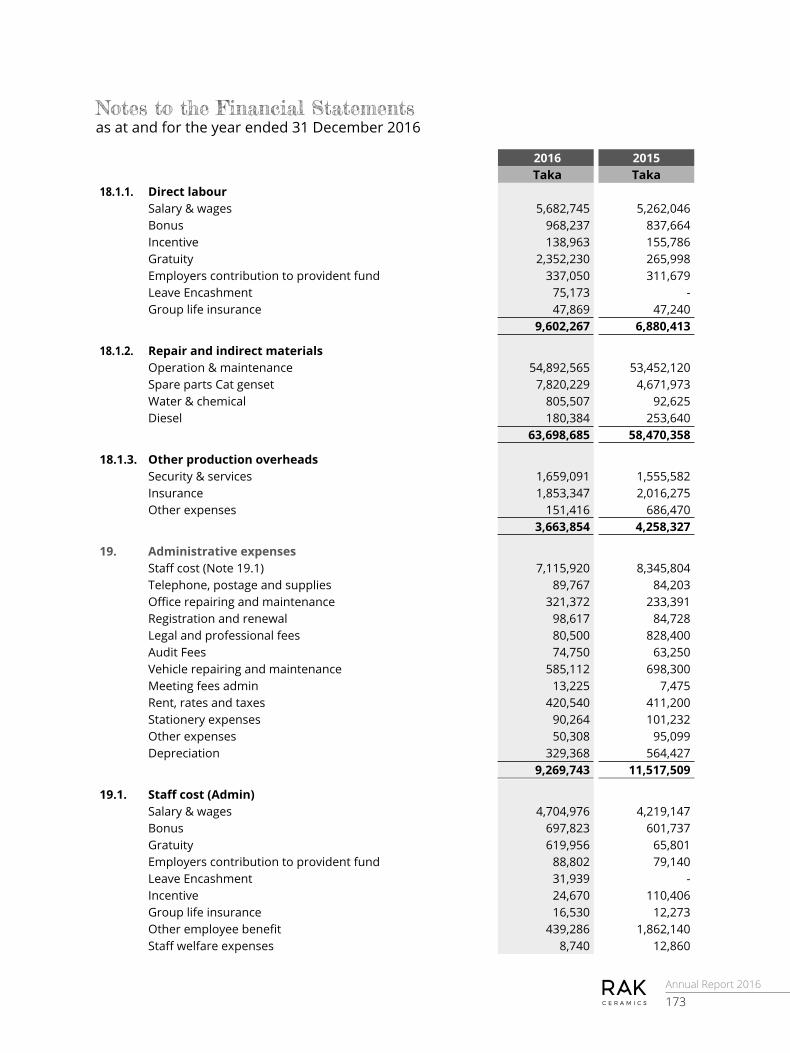
Annual Report 2016
173
Notes to the Financial Statementsas at and for the year ended 31 December 2016
2016 2015 Taka Taka
18.1.1. Direct labour Salary & wages 5,682,745 5,262,046 Bonus 968,237 837,664 Incentive 138,963 155,786 Gratuity 2,352,230 265,998 Employers contribution to provident fund 337,050 311,679 Leave Encashment 75,173 - Group life insurance 47,869 47,240
9,602,267 6,880,413
18.1.2. Repair and indirect materials Operation & maintenance 54,892,565 53,452,120 Spare parts Cat genset 7,820,229 4,671,973 Water & chemical 805,507 92,625 Diesel 180,384 253,640
63,698,685 58,470,358
18.1.3. Other production overheads Security & services 1,659,091 1,555,582 Insurance 1,853,347 2,016,275 Other expenses 151,416 686,470
3,663,854 4,258,327
19. Administrative expenses Staff cost (Note 19.1) 7,115,920 8,345,804 Telephone, postage and supplies 89,767 84,203 Office repairing and maintenance 321,372 233,391 Registration and renewal 98,617 84,728 Legal and professional fees 80,500 828,400 Audit Fees 74,750 63,250 Vehicle repairing and maintenance 585,112 698,300 Meeting fees admin 13,225 7,475 Rent, rates and taxes 420,540 411,200 Stationery expenses 90,264 101,232 Other expenses 50,308 95,099 Depreciation 329,368 564,427
9,269,743 11,517,509
19.1. Staff cost (Admin) Salary & wages 4,704,976 4,219,147 Bonus 697,823 601,737 Gratuity 619,956 65,801 Employers contribution to provident fund 88,802 79,140 Leave Encashment 31,939 - Incentive 24,670 110,406 Group life insurance 16,530 12,273 Other employee benefit 439,286 1,862,140 Staff welfare expenses 8,740 12,860
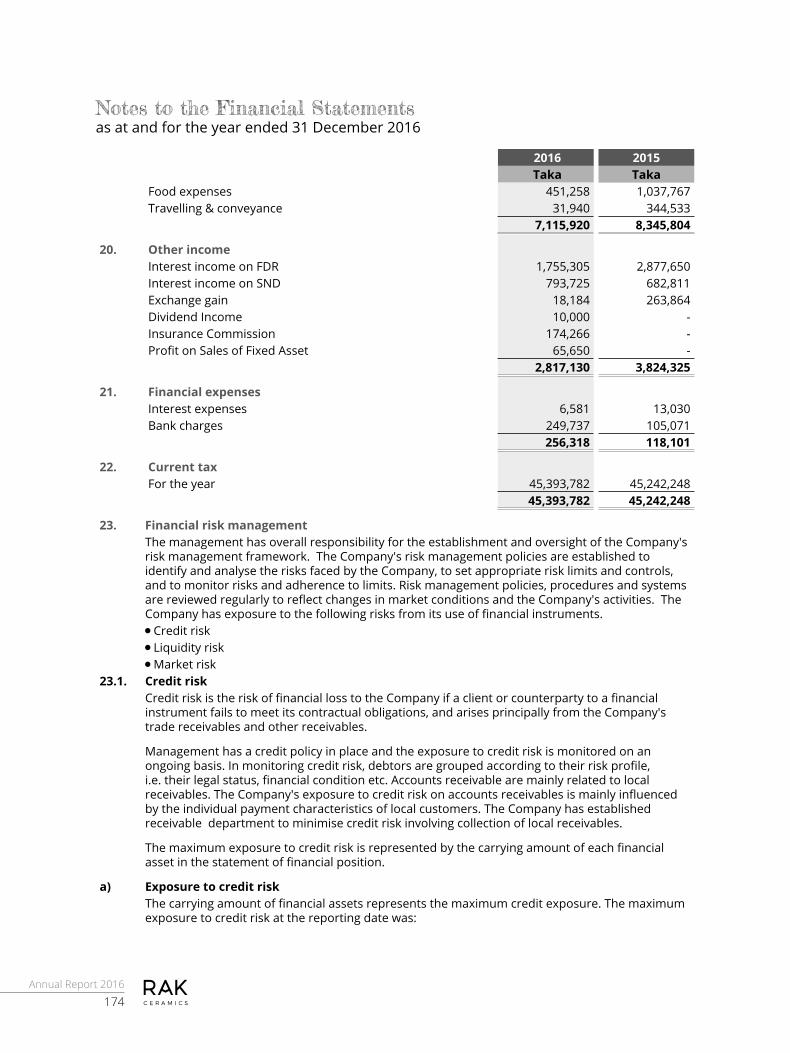
Annual Report 2016
174
Notes to the Financial Statementsas at and for the year ended 31 December 2016
2016 2015 Taka Taka
Food expenses 451,258 1,037,767 Travelling & conveyance 31,940 344,533
7,115,920 8,345,804
20. Other income Interest income on FDR 1,755,305 2,877,650 Interest income on SND 793,725 682,811 Exchange gain 18,184 263,864 Dividend Income 10,000 - Insurance Commission 174,266 - Profit on Sales of Fixed Asset 65,650 -
2,817,130 3,824,325
21. Financial expenses Interest expenses 6,581 13,030 Bank charges 249,737 105,071
256,318 118,101
22. Current tax For the year 45,393,782 45,242,248
45,393,782 45,242,248
23. Financial risk managementThe management has overall responsibility for the establishment and oversight of the Company's risk management framework. The Company's risk management policies are established to identify and analyse the risks faced by the Company, to set appropriate risk limits and controls, and to monitor risks and adherence to limits. Risk management policies, procedures and systems are reviewed regularly to reflect changes in market conditions and the Company's activities. The Company has exposure to the following risks from its use of financial instruments.n Credit riskn Liquidity riskn Market risk
23.1. Credit riskCredit risk is the risk of financial loss to the Company if a client or counterparty to a financial instrument fails to meet its contractual obligations, and arises principally from the Company's trade receivables and other receivables.
Management has a credit policy in place and the exposure to credit risk is monitored on an ongoing basis. In monitoring credit risk, debtors are grouped according to their risk profile, i.e. their legal status, financial condition etc. Accounts receivable are mainly related to local receivables. The Company's exposure to credit risk on accounts receivables is mainly influenced by the individual payment characteristics of local customers. The Company has established receivable department to minimise credit risk involving collection of local receivables.
The maximum exposure to credit risk is represented by the carrying amount of each financial asset in the statement of financial position.
a) Exposure to credit riskThe carrying amount of financial assets represents the maximum credit exposure. The maximum exposure to credit risk at the reporting date was:

Annual Report 2016
175
Notes to the Financial Statementsas at and for the year ended 31 December 2016
USD Amount in Taka As at 31
December As at 31
December As at 31
December As at 31
December 2016 2015 2016 2015
Trade receivablesCustomer-local - - 33,193,313 36,479,422 Customer-Export - - - -
- - 33,193,313 36,479,422
Other receivablesAccrued interest 399,908 590,069 Other receivables - -
399,908 590,069
Cash equivalents 102,371,034 100,305,618
b) Aging of receivablesThe aging of trade receivables as at 31 December 2015 was :Not past due - - 0-90 days past due 33,193,313 33,710,078 91-180 days past due - 2,692,474 Over 180 days - 76,870
33,193,313 36,479,422
23.2. Liquidity riskLiquidity risk is the risk that the Company will not be able to meet its financial obligations as they fall due. The Company's approach to managing liquidity is to ensure, as far as possible, that it will always have sufficient liquidity to meet its liabilities when become due, under both normal and stressed conditions, without incurring unacceptable losses or risking damage to the Company's reputation.
The Company ensures that it has sufficient cash and cash equivalents to meet expected operational expenses, including financial obligations through preparation of the cash flow forecast, prepared based on timeline of payment of the financial obligation and accordingly arrange for sufficient liquidity/fund to make the expected payment within due date. Moreover, the Company seeks to maintain short term lines of credit with scheduled commercial banks to ensure payment of obligations in the event that there is insufficient cash to make the required payment. The requirement is determined in advance through cash flows projections and credit lines facilities with banks are negotiated accordingly.
The following are the contractual maturities of financial liabilities of the Company :
As at 31 December 2016Carrying amount
Contractual cash flows
Within 12 months or less
More than 12 months
Taka Taka Taka Taka
Trade and other payables 9,641,273 9,641,273 9,641,273 - 9,641,273 9,641,273 9,641,273 -

Annual Report 2016
176
Notes to the Financial Statementsas at and for the year ended 31 December 2016
As at 31 December 2015Carrying amount
Contractual cash flows
Within 12 months or less
More than 12 months
Taka Taka Taka TakaTrade and other payables 10,881,516 10,881,516 10,881,516 -
10,881,516 10,881,516 10,881,516 -
23.3. Market riskMarket risk is the risk that changes in market prices such as foreign exchange rates and interest rates will affect the Company's income or the value of its holding of financial instruments. The objective of market risk management is to manage and control market risk exposures within acceptable parameters, while optimising the return.
a) Currency riskThe Company is exposed to currency risk on certain revenues and purchase of raw material, spare parts, accessories and capital item. Majority of the company's foreign currency purchase are denominated in EURO.
i) Exposure to currency risk
As at 31 December 2016 As at 31 December 2015USD EURO USD EURO
Foreign currency denominated liabilities 25,545 Trade payables - 24,986 - -
- 24,986 - 25,545 Net exposure - (24,986) - (25,545)
The Company has foreign exchange loss or gain. Exchange gain for the year was Tk. 18,184.
The following significant exchange rates have been applied:Exchange rates
As at 31 December
As at 31 December
2016 2015
USD 79.0450 78.4950 EURO 82.3474 85.7963 ii) Foreign exchange rate sensitivity analysis for foreign currency expenditures:
A strengthening or weakening of the Taka, as indicated below, against the USD and EURO at 31 December 2016 would have increased/(decreased) profit or loss by the amounts shown below.
As at 31 December 2016 As at 31 December 2015Profit or (loss) Amount in
TakaProfit or (loss) Amount in
TakaStrengthening Weakening Strengthening Weakening
ClosingUSD (3 percent movement) - - - - EURO (3 percent movement) 63,636 (59,929) 67,784 (63,836)

Annual Report 2016
177
Notes to the Financial Statementsas at and for the year ended 31 December 2016
b) Interest rate riskInterest rate risk is the risk that arises due to changes in interest rates on borrowings. The Company is not significantly exposed to fluctuation in interest rates as it has neither floating interest rate bearing financial liabilities nor entered into any type of derivative instrument in order to hedge interest rate risk as at the reporting date.
ProfileAt the reporting date, the interest rate profile of the Company's interest bearing financial instruments was:
Carrying amount in Taka As at 31
December As at 31
December 2016 2015
Fixed rate instrumentsFinancial assetsInvestment in FDR 81,436,631 83,139,635 Cash at banks 20,458,439 17,114,599 Fair value of financial assets and liabilities of the Company together with carrying amount shown in the statement of financial position are as follows:
Amount in Taka Amount in TakaAs at 31 December 2016 As at 31 December 2015Carrying amount
Fair value Carrying amount
Fair value
Held to maturity assetsInvestment in FDR 81,436,631 81,436,631 83,139,635 83,139,635 Loans and receivablesTrade receivables 33,193,313 33,193,313 36,479,422 36,479,422 Other receivables 399,908 399,908 590,069 590,069 Cash equivalents 102,371,034 102,371,034 100,305,618 100,305,618
Amount in Taka Amount in TakaAs at 31 December 2016 As at 31 December 2015
Carrying amount Fair value
Carrying amount
Fair value
Liabilities carried at amortised costTrade and other payables 9,641,273 9,641,273 10,881,516 10,881,516
Accounting classification and fair values as at 31 December 2016 in respect of the separate financial statements does not vary significantly from the consolidated one.
Interest rates used for determining amortised costThe interest rates used to discount estimated cash flows, when applicable were as follows:
As at 31 December
As at 31 December
2016 2015Investment in FDR 1.70%-5.50% 3.70%-7.00% Bank overdraft 10.75% 13%-13.50%

Annual Report 2016
178
24. Related party disclosure under IAS-24/ BAS-24
24.1. List of related parties with whom transactions have taken place and their relationship as identified and certified by management:Name of related party RelationshipRAK Ceramics (Bangladesh) Limited. Parent CompanyRAK Security & Services Pvt. Ltd Fellow SubsidiaryMr.Engr. Md. Maqsudul Karim Key Management PersonnelMr. S.A.K. Ekramuzzaman Key Management Personnel
24.2. Transaction with related parties (Amount in Taka)
Nature of transaction Parent Company
Key Management Personnel
Other related parties
Purchase of goods/services - - 1,905,853 Sale of goods/services 347,049,244 - 13,917,491 Genset rental (excluding VAT) 6,891,130 - - Outstanding receivables 30,270,872 - 2,922,441 Outstanding payables - - 136,831 Dividend Payment 102,499,500 250
24.3. Payment to directorsDuring the year no amount was paid by the Company for compensating any member of the board including the Managing Director for rendering services except the following fees.
Nature of Meeting Amount in Taka
Board Meeting 13225
25. Other disclosures
25.1. Number of employeesThe number of employees engaged for the period who received a total remuneration of Taka 63,600 and above was 17. None is receiving below Taka 5,300 per month.
25.2. Earning per share (EPS)
ParticularsAs at 31
December 2016
As at 31 December
2015Net profit after tax attributable to ordinary shareholder
96,664,124 99,724,218
Number of ordinary shares 205,000,000 2,050,000 Weighted number of ordinary shares outstanding 205,000,000 2,050,000 Nominal value per share 100 100 Earnings Per Share (EPS) for the year 47.15 48.65
25.3. Transaction in foreign currencyNature of transaction Amount in TakaCIF value of imported spare parts 34,742,113
25.4. Trade & other receivableParticulars Amount in TakaAdvance, deposit & prepayments 6,836,797
Notes to the Financial Statementsas at and for the year ended 31 December 2016

Annual Report 2016
179
Notes to the Financial Statementsas at and for the year ended 31 December 2016
25.5. Contingent liabilities and commitmentsNature of transaction Amount in Taka Letter of Guarantee 90% 12,729,825
25.6. Amount paid to auditors and other professional service providersNature of transaction Amount in TakaAudit fee 74,750Taxation 23,000Professional fees (GF actuarial valuation) 57,500
Figures are including VAT25.7. Capacity utilization
(MW) (kwh)
Licensed Capacity
Installed capacity
Available capacity
Standard capacity @ 85% (kwh)
Actual utilization for
2016 (kwh)
Period utilization (on Standard
Capacity)
Over/(under)
utilization
Actual utilization
for 2015 (kwh)
10 MW 10 MW 8.543 MW 63,785,455 51,726,433 81% -19% 53,169,218 25.8. Event after reporting period
i) The Board of Directors in it’s meeting held on 23 January 2017 approved the financial statements of the company for the year ended 31 December 2016 and authorised the same for issue. The Board of Directors also recommended cash dividend @ 40% for the shareholders for the year 2016.
ii) No material events occurred after the date of statement of financial position, non-disclosure of which could affect the ability of the users of these financial statements to make appropriate evaluation.
Managing Director Director
Dated: 23 January 2017

Annual Report 2016
180
RAK SECURITY AND SERVICES (PVT.) LTD.
Auditor’s Report and Financial Statements
For the year ended 31 December 2016

Annual Report 2016
181
RAK SECURITY AND SERVICES (PVT.) LTD.Directors’ ReportDear Shareholders,The Board of Directors of RAK Security and Services (Pvt.) Ltd. is pleased to present this Directors’ Report together with the Auditors’ Report and Audited Financial Statements of the Company for the year ended December 31, 2016 thereon, for your valued consideration, approval and adoption.
Principal activitiesThe principal activities of the company is to carry on the business of security guarding, cleaning services, termite and pest control services, fumigation services and setting up manpower technical training establishments for creation of skilled workers in various fields of construction and public works, pre-employment back ground verification and immigration & Visa documents verification services, fire safety services etc.
Operational resultThe operational results of the Company for the year ended December 31, 2016 as follows:
(Amount in BDT mn)Particulars 2016 2015Sales 153.54 73.70 Gross profit 32.34 24.40 Net profit after tax 7.83 6.94 Earnings Per Share (Absolute BDT)
782.81 693.91
Net Operating Cash Flow Per Share (NOCFPS)
450.45 37.70
Net Asset Value (NAV) 32.43 25.61Net Asset Value per share (Absolute BDT)
3,243.79 1,967.07
DividendThe Board of Directors of the Company is pleased to recommend cash dividend @ 200 percent of the paid up capital of the Company for the year 2016. While recommending the dividend, the Board of Directors has considered the operational performance, business result, the assets as at that date and working capital requirement for future development and expansion. The Company paid cash dividend @ 100 percent of paid up capital of the Company for the year 2015.
AuditorsM/s. K.M. Hasan & Co., Chartered Accountants shall retire in the 10th AGM, being eligible, they offered themselves for re-appointment and the Board also recommended to re-appoint them for the year 2017. Remuneration of the auditor will be fixed by the shareholders at this Annual General Meeting.
Post balance sheet eventsThere are no material events which have occurred after the balance sheet/reporting date, non disclosure of which could affect the ability of the users of these financial statements to make an appropriate evaluation.
AppreciationThe Board would like to take this opportunity to thank Government bodies, its shareholders, investors, bankers and employees for their continuous commitment, cooperation, confidence and support in attaining Company’s objectives.
Dated: January 23, 2017
For and on behalf of the Board of Directors
(Abdallah Massaad)Chairman
Ras Al Khaimah, UAE

Annual Report 2016
182
Auditor’s Report to the Shareholders ofRAK SECURITY AND SERVICES (PVT.) LTD.We have audited the accompanying financial statements of RAK Security And Services (Pvt.) Ltd. which comprise the statement of financial position as at 31 December 2016, statement of profit or loss and other comprehensive income, statement of changes in equity and statement of cash flows for the year then ended, and a summary of significant accounting policies and other explanatory information.
Management’s Responsibility for the Financial StatementsManagement of RAK Security And Services (Pvt.) Ltd. is responsible for the preparation and fair presentation of these financial statements in accordance with Bangladesh Financial Reporting Standards (BFRSs), and for such internal control as management determines is necessary to enable the preparation of financial statements that are free from material misstatement, whether due to fraud or error.
Auditor’s ResponsibilityOur responsibility is to express an opinion on these financial statements based on our audit. We conducted our audit in accordance with Bangladesh Standards on Auditing (BSA). Those standards require that we comply with ethical requirements and plan and perform the audit to obtain reasonable assurance about whether the financial statements are free from material misstatement.
An audit involves performing procedures to obtain audit evidence about the amounts and disclosures in the financial statements. The procedures selected depend on our judgment, including the assessment of the risks of material misstatement of the financial statements, whether due to fraud or error. In making those risk assessments, we consider internal control relevant to the entity’s preparation and fair presentation of the financial statements in order to design audit procedures that are appropriate in the circumstances, but not for the purpose of expressing an opinion on the effectiveness of the entity’s internal control. An audit also includes evaluating the appropriateness of accounting policies used and the reasonableness of accounting estimates made by management, as well as evaluating the overall presentation of the financial statements.
We believe that the audit evidence we have obtained is sufficient and appropriate to provide a basis for our audit opinion.
OpinionIn our opinion, the financial statements, prepared in accordance with Bangladesh Financial Reporting Standards (BFRSs), give a true and fair view of the financial position as at 31 December 2016 and its financial performance and its cash flows for the period then ended and comply with the Companies Act, 1994 and other applicable laws and regulations.
We also report that:
(a) we have obtained all the information and explanations which to the best of our knowledge and belief were necessary for the purposes of our audit and made due verification thereof;
(b) in our opinion, proper books of account as required by law have been kept by the company so far as it appeared from our examination of those books; and
(c) the company’s statement of financial position and statement of profit or loss and other comprehensive income dealt with by the report are in agreement with the books of account.
K.M. HASAN & CO.Chartered AccountantsDated: 23 January 2017

Annual Report 2016
183
RAK SECURITY AND SERVICES (PVT.) LTD.Statement of Financial PositionAs at 31 December 2016
Assets Notes2016 2015 Taka Taka
Non - Current AssetsProperty, Plant and Equipment 4 4,517,395 4,494,508 Investment in RAK Power Pvt. Ltd. 1,275 1,275
4,518,670 4,495,783 Current AssetsTrade and Other Receivables 5 33,849,961 30,308,127 Loan, Advances and Prepayments 6 705,270 406,042 Advance Income Tax 7 18,077,507 14,432,162 Cash and Cash Equivalents 8 6,565,043 3,454,050
59,197,781 48,600,381 Total Assets 63,716,451 53,096,164
Equity and Liabilities
Capital and ReservesShare Capital 9 1,000,000 1,000,000 Retained Earnings 31,437,962 24,609,877
32,437,962 25,609,877 Current LiabilitiesTrade and Other Payables 10 1,269,835 2,164,169 Liability for Expenses 11 7,443,005 8,202,562 Provision for Income Tax 12 19,106,866 14,891,744 Provision for Employees' Benefit 13 3,458,783 2,227,812
31,278,489 27,486,287 Total Equity and Liabilities 63,716,451 53,096,164
Director Managing Director
K.M. HASAN & CO.Chartered AccountantsDated: 23 January 2017
The annexed notes form an integral part of these financial statements (Page 187-194)
For RAK Security and Services (Pvt.) Ltd.
Signed in terms of our separate report of even date annexed.

Annual Report 2016
184
RAK SECURITY AND SERVICES (PVT.) LTD.Statement of Profit or Loss and Other Comprehensive IncomeFor the year ended 31 December 2016
Notes2016 2015 Taka Taka
Turnover - Services 14 153,542,632 73,697,636 Less: Direct Expenses 15 121,200,876 49,297,083 Gross Profit 32,341,756 24,400,553 Less: Operating ExpensesAdministrative Expenses 16 15,581,657 12,392,050 Marketing Expenses 17 4,768,574 1,381,760 Financial Expenses 18 10,380 16,453
20,360,611 13,790,263 Operating Profit 11,981,145 10,610,290 Add: Other Income 19 62,062 65,305 Net Profit before Tax 12,043,207 10,675,595 Less: Provision for Income Tax 4,215,122 3,736,458 Net Profit After Tax 7,828,085 6,939,137 Add: Other Comprehensive Income - - Total Comprehensive Income 7,828,085 6,939,137
Earnings Per Share (EPS) 20 782.81 693.91
The annexed notes form an integral part of these financial statements (Page 187-194)
For RAK Security and Services (Pvt.) Ltd.
Director Managing Director
K.M. HASAN & CO.Chartered AccountantsDated: 23 January 2017
Signed in terms of our separate report of even date annexed.

Annual Report 2016
185
RAK SECURITY AND SERVICES (PVT.) LTD.Statement of Changes in EquityFor the year ended 31 December 2016
(Amount in Taka)
Particulars Ordinary Shares (No)
Share Capital
Retained Earnings Total
Balance as at 01 January 2016 10,000 1,000,000 24,609,877 25,609,877 Net Profit for the year - - 7,828,085 7,828,085 Dividend paid - - (1,000,000) (1,000,000)Balance as at 31 December 2016 10,000 1,000,000 31,437,962 32,437,962
For the year ended 31 December 2015(Amount in Taka)
ParticularsOrdinary
Shares ( No)
Share Capital
Retained Earnings Total
Balance as at 01 January 2015 10,000 1,000,000 18,670,740 19,670,740 Net Profit for the year - - 6,939,137 6,939,137 Dividend paid - - (1,000,000) (1,000,000)Balance as at 31 December 2015 10,000 1,000,000 24,609,877 25,609,877
For RAK Security and Services (Pvt.) Ltd.
Director Managing Director
K.M. HASAN & CO.Chartered AccountantsDated: 23 January 2017
Signed in terms of our separate report of even date annexed.

Annual Report 2016
186
RAK SECURITY AND SERVICES (PVT.) LTD.Statement of Cash FlowsFor the year ended 31 December 2016
2016 2015 Taka Taka
a. Cash flows from operating activitiesNet profit before tax 12,043,207 10,675,595 Add: Adjustment for non cash iteamsLoss on disposal of Property, Plant & Equipment - 52,224 Depreciation 370,703 439,170 Operating profit before working capital changes 12,413,910 11,166,989
Changes in working capital:(Increase)/Decrease in Trade and Other Receivables (3,541,834) (7,927,082)(Increase)/Decrease in Loan, Advances and Prepayments (299,228) (84,078)Increase/(Decrease) in Trade and Other Payables (894,334) 868,149 Increase/(Decrease) in Liability for Expenses (759,557) 636,488 Increase/(Decrease) in Provision for Employees' Benefit 1,230,971 99,646 Changes in working capital (4,263,982) (6,406,877)Income tax paid (3,645,345) (4,383,109)Net cash provided from operating activities 4,504,583 377,003
b. Cash flows from investing activitiesAcquisition of Property, Plant & Equipment (393,590) (79,828)Sale/Disposal of Property, Plant & Equipment - 158,681 Investment in RAK Power Pvt. Ltd. - (1,275)Net cash provided from/(used in) investing activities (393,590) 77,578
c. Cash flows from financing activitiesDividend paid (1,000,000) (1,000,000)Net cash used in financing activities (1,000,000) (1,000,000)
Net increase/(decrease) in cash and cash equivalents (a+b+c) 3,110,993 (545,419)
Opening cash and cash equivalents 3,454,050 3,999,469
Closing cash and cash equivalents 6,565,043 3,454,050
For RAK Security and Services (Pvt.) Ltd.
Director Managing Director
K.M. HASAN & CO.Chartered AccountantsDated: 23 January 2017
Signed in terms of our separate report of even date annexed.

Annual Report 2016
187
RAK SECURITY AND SERVICES (PVT.) LTD.Notes to the Financial StatementsAs at and for the year ended 31 December 20161. Introduction
RAK Security And Services (Pvt.) Ltd. is a Private Company Limited by shares incorporated in Bangladesh on 21 December 2006 under the Companies Act XVIII of 1994.The registered office of the company is situated at RAK Tower (8th Floor), Plot No. 1/A, Jasimuddin Avenue, Sector No. 03, Uttara, Dhaka 1230.
2. Nature of Business
The main objects of the company is to carry on the business of security guarding, cleaning services, termite and pest control services, fumigation services and setting up manpower technical training establishments for creation of skilled workers in various fields of construction and public works.
3. Significant Accounting Policies
3.1 Accounting convention and basis
“The financial statements have been prepared on a going concern concept under historical cost convention in accordance with Generally Accepted Accounting Principles as laid down in the International Accounting Standards (IASs)/ International Financial Reporting Standards (IFRSs), applicable to the company as adopted by the Institute of Chartered Accountants of Bangladesh as Bangladesh Accounting Standards (BASs)/ Bangladesh Financial Reporting Standards (BFRSs).
The disclosures of information have been made in accordance with the requirements of the above mentioned standards and in compliance with Companies Act 1994 and the statement of financial position and statement of profit or loss and other comprehensive income have been prepared according to IAS-1 / BAS-1 (Presentation of Financial Statements) based on accrual basis and other applicable laws and regulations.
3.2 Integral components of the financial statements The financial statements of the Company include the following components:-
a. Statement of Financial Position
b. Statement of Profit or Loss and Other Comprehensive Income
c. Statement of Changes in Equity
d. Statement of Cash Flows
e. Notes to the Financial Statements
3.3 Property, Plant & Equipments (PPE)
Property, Plant & Equipments have been shown at cost less accumulated depreciation. Depreciation has been charged on tangible assets other than land at reducing balance method from the date of acquisition and in operation.
The rate of percentage of depreciation is as under:Category RateFurniture & fixtures 10%Tools & appliances 20%Vehicles 20%Office Equipment 10%
Depreciation has not been charged on Land as it deems to have infinite life.
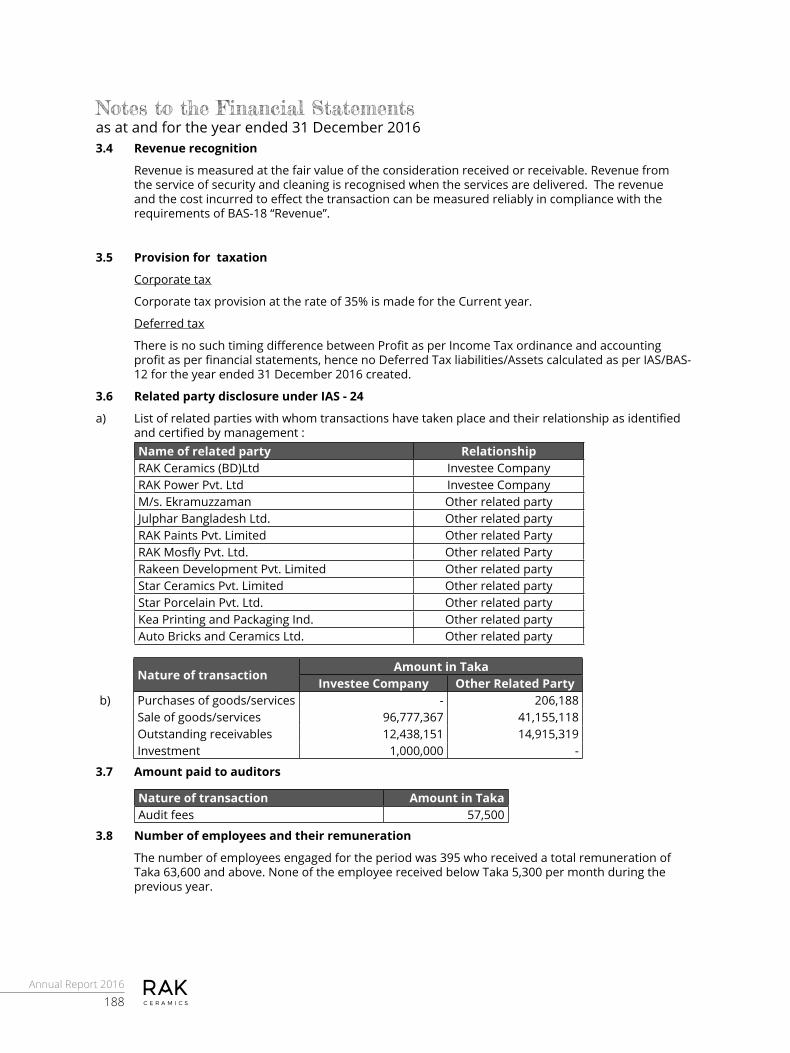
Annual Report 2016
188
3.4 Revenue recognition
Revenue is measured at the fair value of the consideration received or receivable. Revenue from the service of security and cleaning is recognised when the services are delivered. The revenue and the cost incurred to effect the transaction can be measured reliably in compliance with the requirements of BAS-18 “Revenue”.
3.5 Provision for taxation
Corporate tax
Corporate tax provision at the rate of 35% is made for the Current year.
Deferred tax
There is no such timing difference between Profit as per Income Tax ordinance and accounting profit as per financial statements, hence no Deferred Tax liabilities/Assets calculated as per IAS/BAS-12 for the year ended 31 December 2016 created.
3.6 Related party disclosure under IAS - 24
a) List of related parties with whom transactions have taken place and their relationship as identified and certified by management :Name of related party RelationshipRAK Ceramics (BD)Ltd Investee CompanyRAK Power Pvt. Ltd Investee CompanyM/s. Ekramuzzaman Other related partyJulphar Bangladesh Ltd. Other related partyRAK Paints Pvt. Limited Other related Party RAK Mosfly Pvt. Ltd. Other related Party Rakeen Development Pvt. Limited Other related partyStar Ceramics Pvt. Limited Other related partyStar Porcelain Pvt. Ltd. Other related partyKea Printing and Packaging Ind. Other related partyAuto Bricks and Ceramics Ltd. Other related party
b)
Nature of transactionAmount in Taka
Investee Company Other Related PartyPurchases of goods/services - 206,188 Sale of goods/services 96,777,367 41,155,118 Outstanding receivables 12,438,151 14,915,319 Investment 1,000,000 -
3.7 Amount paid to auditors
Nature of transaction Amount in TakaAudit fees 57,500
3.8 Number of employees and their remuneration
The number of employees engaged for the period was 395 who received a total remuneration of Taka 63,600 and above. None of the employee received below Taka 5,300 per month during the previous year.
Notes to the Financial Statementsas at and for the year ended 31 December 2016

Annual Report 2016
189
Notes to the Financial Statementsas at and for the year ended 31 December 20163.9 Payment to Directors
During the year no amount was paid by the Company for compensating any member of the Board including the Managing Director for rendering services, except Board Meeting fees.
Nature of meeting Amount in TakaBoard meeting 13,225
3.10 Employees’ benefit
Provident fund :
The company operates a recognized contributory provident fund for eligible employees with effect from January 2011 and is administrated by a duly constituted independent Trust and equal contribution @ 10% of basic salary is made by both the employees and employer (the Company).
Gratuity :
The company operates an unfunded gratuity scheme for its employees with effect from January 2011. Each employee who has completed three years of service is eligible to one month’s last basic pay as gratuity per year of service.
3.11 General:
3.11.1 Figures in these notes and annexed financial statements have been rounded off to the nearest Taka.
3.11.2 Previous year’s figures have been regrouped and/or rearranged wherever considered necessary for the purpose of current year’s presentation.
4. Property, Plant and Equipment
Amount in Taka
Particulars
Cost Rate of
Dep. (%)
Depreciation Written Down Value as at
31.12.2016
Balance as at
01.01.2016
Additions during
the year
Total sales/
disposal
Balance as at
31.12.2016
Balance as at
01.01.2016
Charged during
the year
Adjustment during the
year
Balance as at
31.12.2016Land 2,309,220 - - 2,309,220 - - - - - 2,309,220 Furniture & fixtures
465,261 117,190 - 582,451 10% 182,762 32,116 - 214,878 367,573
Office equipments
941,600 276,400 - 1,218,000 10% 388,048 68,741 - 456,789 761,211
Tools & appliances
119,755 - - 119,755 20% 101,236 3,703 - 104,939 14,816
Vehicles 2,389,725 - - 2,389,725 20% 1,059,007 266,143 - 1,325,150 1,064,575 Total as at 2016
6,225,561 393,590 - 6,619,151 1,731,053 370,703 - 2,101,756 4,517,395
Total as at 2015
6,622,171 79,828 476,438 6,225,561 1,557,416 439,170 265,533 1,731,053 4,494,508

Annual Report 2016
190
Notes to the Financial Statementsas at and for the year ended 31 December 2016
2016 2015 Taka Taka
5. Trade and Other ReceivablesTrade receivable exceeding 6 months 7,568,554 5,681,248 Trade receivables below 6 months 26,281,407 24,626,879
33,849,961 30,308,127 6. Loan, Advances and Prepayments
Advance to suppliers 458,670 202,500 Employees' PF - 12,726 Prepaid expenses 246,600 190,816
705,270 406,042
7. Advance Income TaxBalance as at 01 January 14,432,162 10,049,054 Add: Paid during the year 3,645,345 4,383,108 Balance as at 31 December 18,077,507 14,432,162
7.1 Head wise paymentInterest on bank deposit 43,892 22,465 Registrations 30,500 95,500 Supplies 3,087,277 5,260,005 Paid in cash 14,915,838 9,054,192
18,077,507 14,432,162
7.2 Year wise paymentAdvance Tax & TDS -2016 3,261,668 - Advance Tax & TDS -2015 3,736,458 3,437,108 Advance Tax & TDS -2014 3,685,426 3,685,426 Advance Tax & TDS -2013 2,467,265 2,467,265 Advance Tax & TDS -2012 2,056,431 2,056,431 Advance Tax & TDS -2011 1,691,067 1,691,067 Advance Tax & TDS -2010 1,078,865 1,078,865 Advance Tax Appeal -2011 100,327 16,000
18,077,507 14,432,162 8. Cash and Cash Equivalents
Cash in hand 741,433 275,458 Cash at bank with DBBL:Current account 140,877 1,425 Short term deposit account 5,682,733 3,177,167
6,565,043 3,454,050
9. Share CapitalAuthorized capital1,000,000 ordinary shares of Tk. 100 each 100,000,000 100,000,000
Issued, subscribed, called and paid up capital10,000 ordinary shares of Tk. 100 each 1,000,000 1,000,000

Annual Report 2016
191
Notes to the Financial Statementsas at and for the year ended 31 December 2016
Particulars of share-holdings are as follows:
Name of shareholders No. of shares Value per share
RAK Ceramics (Bangladesh) Ltd.
9,900 100 990,000 990,000
RAK Power Pvt. Ltd. 100 100 10,000 10,000 Total 10,000 1,000,000 1,000,000
10. Trade and Other PayablesAdvance from customers 793,886 818,606 Due to employee ( Security deposit) 20,642 38,727 TDS Employee 38,000 23,000 VAT Payable 417,307 1,283,836
1,269,835 2,164,169 11. Liability for Expenses
Payable to personnel 3,094,620 3,926,792 Audit fees 57,500 46,000 Leave Encashment 392,198 380,090 Special Bonus 777,900 1,102,550 Legal & professional expenses 28,750 28,750 Utilities bill 47,180 19,180 Cleaning services 3,044,857 2,699,200
7,443,005 8,202,562 12. Provision for Income Tax
Balance as at 01 January 14,891,744 11,155,286 Add: Provision made during the year 4,215,122 3,736,458 Balance as at 31 December 19,106,866 14,891,744
12.1 Year wise provisionFor the year 2010 1,078,865 1,078,865 For the year 2011 1,691,067 1,691,067 For the year 2012 2,056,431 2,056,431 For the year 2013 2,643,497 2,643,497 For the year 2014 3,685,426 3,685,426 For the year 2015 3,736,458 3,736,458 For the year 2016 4,215,122 -
19,106,866 14,891,744 13. Provision for Employees' Benefit
Provident Fund (Note-13.1) 362,708 375,674 Gratuity Fund (Note-13.2) 3,096,075 1,852,138
3,458,783 2,227,812
2016 2015 Taka Taka

Annual Report 2016
192
Notes to the Financial Statementsas at and for the year ended 31 December 2016
13.1 Provident FundOpening balance 375,674 342,436 Add: Addition during the year 4,546,084 4,307,346
4,921,758 4,649,782 Less: Payment during the year 4,559,050 4,274,108 Closing balance 362,708 375,674
13.2 Gratuity FundOpening balance 1,852,138 1,785,730Add: Addition during the year 3,096,075 1,852,138
4,948,213 3,637,868 Less: Payment during the year 1,852,138 1,785,730 Closing balance 3,096,075 1,852,138
14. Turnover-ServicesGross receipts from services 176,574,074 86,226,806 Less: Value Added Tax (VAT) 23,031,442 12,529,170
153,542,632 73,697,636 15. Direct Expenses
Payment to personnel (Note-15.1) 119,309,205 47,792,093 Security training expenses (Note-15.2) 318,281 315,404 Other direct expenses (Note-15.3) 1,573,390 1,189,586
121,200,876 49,297,083 15.1 Payment to Personnel
Staff cost 99,824,047 30,689,621 Overtime 12,404,258 11,292,121 Bonus 3,215,294 2,999,223 Provident fund 908,364 907,364 Gratuity 2,623,961 1,593,389 Group Life Insurance 333,281 310,375
119,309,205 47,792,093 15.2 Security Training Expenses
Staff welfare 287,865 281,955 Conveyance 9,165 11,804 Repair and maintenance 21,251 21,645
318,281 315,404 15.3 Other Direct Expenses
Cleaning expenses 3,743 110,639 Uniform expenses 1,569,647 1,009,257 Bicycle expenses - 8,490 Fuel expenses - 61,200
1,573,390 1,189,586
2016 2015 Taka Taka

Annual Report 2016
193
Notes to the Financial Statementsas at and for the year ended 31 December 2016
16. Administrative ExpensesPayment to personnel (Note-16.1) 9,051,152 6,979,663 Rent, rates and taxes 2,240,882 2,048,671 Telephone and telex expenses 246,279 196,814 Repair and maintenance 924,933 452,379 Printing and stationery 607,657 309,321 Insurance 78,501 82,211 Electricity, gas and WASA 253,666 208,469 Vehicle running expenses 1,055,061 1,026,587 Bad debts 357,846 - Legal and professional charges 145,475 381,000 Miscellaneous expenses 176,367 168,341 Taxation Expenses 15,635 1,200 Audit fee 57,500 46,000 Depreciation 370,703 439,170 Loss on sale of Fixed assets - 52,224
15,581,657 12,392,050 16.1 Payment to Personnel
Salary 5,159,299 4,809,735 Bonus 824,000 768,399 Staff welfare 2,365,894 871,360 Provident fund 301,320 280,837 Gratuity 386,068 228,536 Group Life Insurance 14,571 20,796
9,051,152 6,979,663 17. Marketing Expenses
Payment to personnel (Note-17.1) 1,341,944 836,334 Entertainment 832,685 62,081 Promotional expenses 435,936 301,450 Conveyance 2,032,194 175,047 Telephone and telex expenses 26,870 6,733 Advertisement 95,625 - Miscellaneous Expenses 3,320 115
4,768,574 1,381,760 17.1 Payment to Personnel
Salary 1,062,373 659,833 Bonus 129,500 107,000 Provident fund 61,961 38,520 Gratuity 86,046 30,213 Group Life Insurance 2,064 768
1,341,944 836,334
2016 2015 Taka Taka
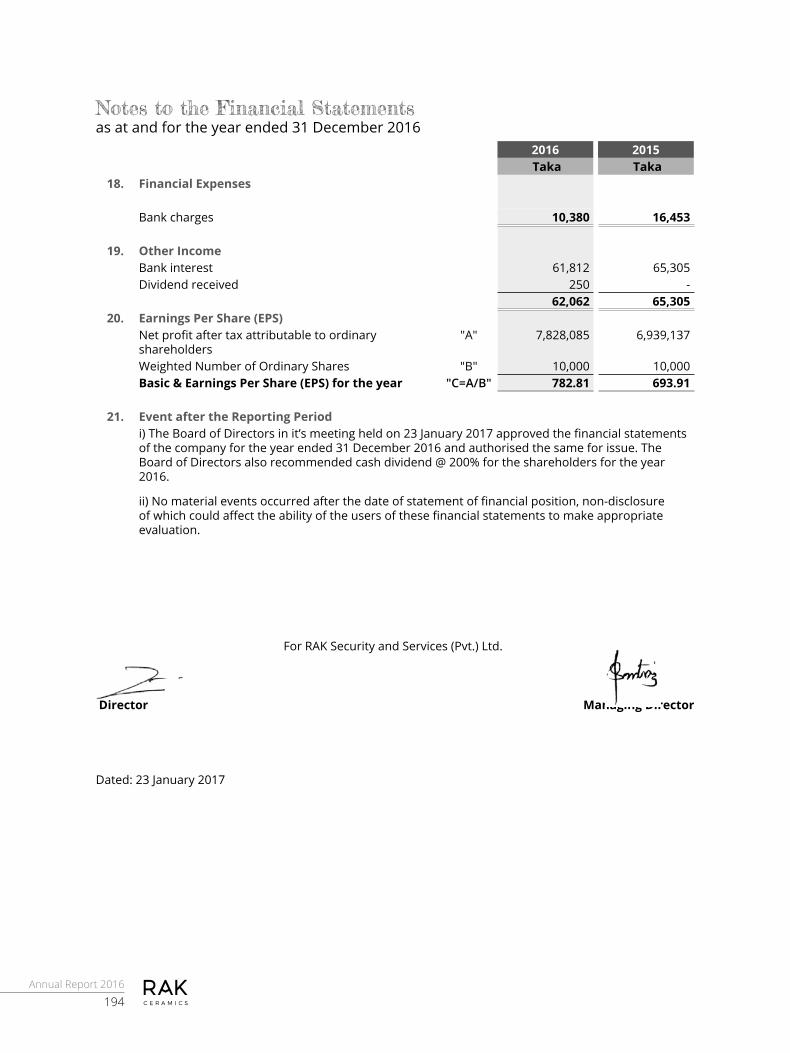
Annual Report 2016
194
18. Financial Expenses
Bank charges 10,380 16,453
19. Other IncomeBank interest 61,812 65,305 Dividend received 250 -
62,062 65,305 20. Earnings Per Share (EPS)
Net profit after tax attributable to ordinary shareholders
"A" 7,828,085 6,939,137
Weighted Number of Ordinary Shares "B" 10,000 10,000 Basic & Earnings Per Share (EPS) for the year "C=A/B" 782.81 693.91
21. Event after the Reporting Periodi) The Board of Directors in it’s meeting held on 23 January 2017 approved the financial statements of the company for the year ended 31 December 2016 and authorised the same for issue. The Board of Directors also recommended cash dividend @ 200% for the shareholders for the year 2016.
ii) No material events occurred after the date of statement of financial position, non-disclosure of which could affect the ability of the users of these financial statements to make appropriate evaluation.
Notes to the Financial Statementsas at and for the year ended 31 December 2016
Director
Dated: 23 January 2017
Managing Director
For RAK Security and Services (Pvt.) Ltd.
2016 2015 Taka Taka

Annual Report 2016
195
Statement Pursuant to Section 186 (1) (e) of the Companies Act, 1994
Name of the subsidiary RAK Power Pvt. Ltd. RAK Security and Services (Pvt.) Ltd.
Name of the holding company RAK Ceramics (Bangladesh) Limited
RAK Ceramics (Bangladesh) Limited
Holding Company’s interest2,049,990 ordinary shares of Tk.100 each fully paid up
9,900 ordinary shares of Tk.100 each fully paid up
Extent of holding 99.99% 99.00%The ‘financial year’ of the subsidiary company ended on December 31, 2016 December 31, 2016
Net aggregate amount of the subsidiary company’s profits/(losses) dealt with in the holding company’s accounts
BDT 304.33 mn BDT 2.00 mn
For the subsidiary’s aforesaid financial year BDT 102.50 mn BDT 1.00 mnFor the previous financial years since it became subsidiary BDT 201.83 mn BDT 1.00 mn
Net aggregate amount of the subsidiary company’s profits/(losses) not dealt with in the holding company’s accounts
BDT 63.18 mn BDT 12.77 mn
For the subsidiary’s aforesaid financial year NIL BDT 6.83 mnFor the previous financial years since it became subsidiary BDT 63.18 mn BDT 5.94 mn
Changes, if any, in the holding company’s interest in the subsidiary between the end of the financial year of the subsidiary and that of the holding company
N/A N/A
Material changes, if any, between the end of the financial year of the subsidiary and that of the holding company
N/A N/A

Annual Report 2016
196
Notice of the 18th Annual General MeetingNotice is hereby given that the 18th Annual General Meeting of RAK Ceramics (Bangladesh) Limited will be held on Wednesday, March 29, 2017 at 10.00 a.m. at International Convention City, Bashundhara (Pushpoguscho), Joarshahara, Purbachal Link Road, Khilkhet, Dhaka-1229 to transact the following businesses:
AGENDA:1. To receive, consider and adopt the Audited Financial Statements of the Company for the year
ended 31 December 2016 together with the reports of the Auditor and the Directors.
2. To declare dividend for the year ended 31 December 2016.
3. To elect/re-elect Director(s) of the Company.
4. To appoint the Auditors of the Company for the year 2017 and fix their remuneration.
Notes:1. The Shareholders whose name appeared in the Share Register of the Company or in the
Depository Register on the ‘Record Date’ (i.e. February 14, 2017) will be entitled to attend the meeting and receive the dividend.
2. The Board unanimously recommended dividend @ 20% in cash and 5% in stock of the paid up capital of the Company for the year 2016.
3. A shareholder entitled to attend and vote at the Annual General Meeting may appoint a proxy to attend and vote in his/her behalf (such proxy shall be a shareholder of the Company). The Proxy Form, duly filled and stamped, must be deposited at the Registered Office of the Company not later than 48 hours before the time fixed for the meeting.
4. Admission to the meeting will be strictly on production of the attendance slip attached with the Annual Report.
5. Shareholders are requested to submit to the Registered Office of the Company on or before March 23, 2017, their written option to receive dividend in the form enclosed with the Annual Report. If the shareholders fail to submit such option within the stipulated time, the dividend will be paid off as deemed appropriate by the Company.
6. In case of non-receipt of the Annual Report of the Company sent through courier, shareholders may collect the same from the Registered Office of the Company on or before March 23, 2017. No additional Annual Report will be distributed in the AGM venue.
7. Brokerage Houses/DPs are requested to provide the statement along with detail of their margin loan holders on or before March 20, 2017 who are entitled to receive the cash dividend of the Company for the year ended December 31, 2016. The statement should include shareholder’s name, BO ID Number, client-wise shareholding position, gross dividend receivable, applicable tax rate, net dividend receivable, bank account number, routing number, contact person etc.
Shareholders may please note that no food or gift or benefit in cash or kind shall be given at the Annual General Meeting.
By order of the Board of Directors
Sd/-(Muhammad Shahidul Islam FCS)
Company SecretaryDhaka, Bangladesh Date: March 14, 2017

Annual Report 2016
197
I/We .........................................................................................................................................................................................................
of ..............................................................................................................................................................................................................
........................................................................being a shareholder of RAK Ceramics (Bangladesh) Limited, do hereby appoint
Mr./Ms...............................................................................of............................................................................................................ as
my/our proxy to attend and vote on my/our behalf at the 18th Annual General Meeting of the Company to be held on
March 29, 2017 at 10.00 a.m. at International Convention City, Bashundhara (Pushpoguscho), Joarshahara, Purbachal
Link Road, Khilkhet, Dhaka-1229 and at any adjournment thereof.
As witness my / our hand this ........................................ Day of ........................................2017.
I/We do hereby record my/our attendance at the 18th Annual General Meeting of the Company to be held on March 29, 2017 at 10.00 a.m at International Convention City, Bashundhara (Pushpoguscho), Joarshahara, Purbachal Link Road, Khilkhet, Dhaka-1229, Bangladesh.
Name of the Shareholder(s)/Proxy: ....................................................................................................................................................
No. of Shares held: ...............................................................................
No. of Shares held by Shareholder: ...............................................................................
No. of Shares held by Proxyholder: ...............................................................................
Note: Please present this attendance slip at the registration counter on or before 9:30 am on the AGM date.
Notes:1. A shareholder entitled to attend and vote in the AGM may appoint a Proxy to attend and vote on his/her behalf.2. The Proxy Form, duly filed and stamped must be deposited at the Registered Office of the Company, not later than
48 (Forty Eight) hours before the time fixed for the meeting.3. Signature of the shareholder must be in accordance with the Specimen Signature recorded with the Company.4. As per Article of Association of the Company, no person shall act as a proxy unless he himself is a shareholder of the
Company.
Proxy Form
Attendance Slip
RAK Ceramics (Bangladesh) Limited
RAK Ceramics (Bangladesh) Limited
RAK Tower (7th, 8th & 9th floor), 1/A Jasimuddin Avenue, Sector-3, Uttara Model Town, Dhaka-1230.
RAK Tower (7th, 8th & 9th floor), 1/A Jasimuddin Avenue, Sector-3, Uttara Model Town, Dhaka-1230.
..................................(Signature of Proxy)
......................................(Authorized Signature)RAK Ceramics (Bangladesh) Limited
................................(Signature Verified)
..............................................
(Signature of Shareholder)
...........................................................Signature of Shareholder(s)/Proxy
BO ID No.
BO ID No. of Shareholder:
BO ID No. of Proxy holder:
BO ID No.
Revenue Stamp
Taka 20/-

Annual Report 2016
198
Annual Report 2016
199
I/We ........................................................................................................................................................................................................................................................................................................................of................................................................................................................................................................................................................................................................................................................................................................. being a shareholder of RAK Ceramics (Bangladesh) Limited, do hereby exercise my/our option to receive dividend in the following manner [please tick (√) in the applicable box]:
□ a) In the form of Dividend Warrant
□ b) Through online transfer to my/our bank account recorded with the Company
Notes:1. The form duly completed must be deposited at the Registered Office of the Company on or before March
27, 2017.2. Signature of the Shareholder(s) must be in accordance with the Specimen Signature recorded with the
Company.3. Number of shares, Bank Account detail and address shall be considered final as provided by CDBL on
Record Date i.e. February 14, 2017.4. Applicable service charge, if any, shall be borne by the Shareholder(s) in case of payment of dividend
through online transfer to the Shareholder(s) bank account as per BSEC notification.
Option for Receiving Dividend
RAK Ceramics (Bangladesh) LimitedRAK Tower (7th, 8th & 9th floor), 1/A Jasimuddin Avenue, Sector-3, Uttara Model Town, Dhaka-1230.
Information of the Shareholder(s):
Mobile number: ......................................
.........................................................Signature of the Shareholder(s)
.............................................................................Authorized Signatory of the Company
...............................................(Signature Verified by)
BO ID No.

Annual Report 2016
200