Embed Size (px)
Citation preview

Bra
nd
sm
c 2
12
2013: Issue 389, Week: 23rd - 26th SeptemberA Weekly Update from SMC(For private circulation only)
WISE M NEY
®

(Saurabh Jain)
Contents
Equity 4-7
Derivatives 8-9
Commodity 10-13
Currency 14
IPO 15
Fixed Deposit 16
Mutual Fund 17-18
EDITORIAL STAFF
Editor Saurabh Jain
Executive Editor Jagannadham Thunuguntla
+Editorial Team
Dr. R.P. Singh Nitin Murarka
Vandana Bharti Tejas Seth
Sandeep Joon Dinesh Joshi
Vineet Sood Shitij Gandhi
Dhirender Singh Bisht Subhranil Dey
Parminder Chauhan Ajay Lakra
Mudit Goyal
Content Editor Kamla Devi
Graphic Designer Pramod Chhimwal
Research Executive Sonia Bamba
REGISTERED OFFICES:
11 / 6B, Shanti Chamber, Pusa Road, New Delhi 110005.
Tel: 91-11-30111000, Fax: 91-11-25754365
MUMBAI OFFICE:
Dheeraj Sagar, 1st Floor, Opp. Goregaon sports Club, Link Road
Malad (West), Mumbai 400064
Tel: 91-22-67341600, Fax: 91-22-28805606
KOLKATA OFFICE:
18,Rabindra Sarani, Poddar Court, Gate No-4, 4th & 5th Floor,
Kolkata-700001
Tel : 91-33-39847000/39801300, Fax No : 91-33-39847004
AHMEDABAD OFFICE :
10/A, 4th Floor, Kalapurnam Building, Near Municipal Market,
C G Road, Ahmedabad-380009, Gujarat
Tel : 91-79-26424801 - 05, 40049801 - 03
CHENNAI OFFICE:
2nd Floor, Mookambika Complex, 4, Lady Desikachari Road,
Mylapore, Chennai-600004
Tel: 91- 44 - 39109100 Fax: 91- 44 - 39109111
SECUNDERABAD OFFICE:
206, 3rd Floor, above CMR Exclusive, Bhuvana Towers, S.D.Road,
Secunderabad - 500003
Tel: 91-40-30780298/99, 39109536
DUBAI OFFICE:
312, Belshalat Building, Al Karama, Dubai, P.O. Box 117210, U.A.E.
Tel: 97143963120, Mobile : 971502612483
Fax : 9714 3963122
Email ID : [email protected]
Printed and Published on behalf of
Mr. Saurabh Jain @ Publication Address
11/6B, Shanti Chamber, Pusa Road, New Delhi-110005
Website: www.smcindiaonline.com
Investor Grievance : [email protected]
Printed at: S&S MARKETING
102, Mahavirji Complex LSC-3, Rishabh Vihar, New Delhi - 110092 (India)
Ph.: +91-11- 43035012, 43035014, Email: [email protected]
he global Stock markets rocked during the week after the much awaited
announcement by the U.S. Fed on the issue of reduction of bond purchases. TU.S. Federal Reserve in the monetary policy meeting surprised the markets by
not reducing the amount of monthly bond purchases worth $85 billion. The decision
led to huge rally across the global stock markets and emerging markets, which were
feeling the heat, rallied the most. Fed said that it would like to wait for some more
time before reducing bond purchases till it sees more evidence of sustained progress
in the economy.
Back at home, Dr. Raghuram Rajan stunned the markets by hiking Repo Rate by 25 bps
to 7.5%. At the same time RBI decided to cautiously unwind the exceptional measures
by reducing the effective policy rate aligned to Marginal Standing Facility (MSF) by 75
bps to 9.5%. So now the gap between the Repo Rate and MSF stands at 200 bps from 300
bps.
Indian markets took a beating on the announcement as markets were expecting some
positives from the policy as regards to exceptional measures taken to reduce the
undue volatility in the rupee in the month of July. While RBI cut the MSF rate to 9.5%
which is the effective policy rate but at the same time it has raised the Repo rate by 25
bps. Clearly it is sufficiently strong signal for the banks to hike base rates thereby
moving towards the higher interest rates as the uncertainty on when interest rates
would be lowered down depends upon the stability in the currency and inflation.
Additionally, Indian industry which is walking through tough time was expecting some
stimulus from RBI may be in terms of lower cost of capital but the stance taken by the
RBI seems to have pushed the hopes at least for a quarter or two. Though U.S. Federal
Reserve has deferred the bond tapering but it is inevitable and again the talks would
resume may be after a gap of two months or so. As regards to the domestic markets, at
the moment the markets are looking short of upside triggers, hence some correction
and consolidation is looking on the cards.
On the commodities front, the commodity market also got surprised by the
unexpected Federal Reserve's decision not to taper its bond buying program. It was
nowhere in the minds of the investors that Fed would postpone the start of the wind
down of its massive monetary stimulus, citing concerns about the health of the U.S.
economy because the US economy is continuously sending signals that it is on the
revival path. The market reacted very swiftly and sharply; it has sparked a buying
mania among the investors. However, the Dollar index slipped and compelled
investors to reassess their portfolios and strategies. Going forward crude oil is
expected to rally as fundamentals of the U.S. economy are reflecting higher demand.
Any positive outcome of economic releases may further support the industrial metals
prices whereas bullion counter can trade in a range after a swift recovery. Consumer
confidence and durable goods order of US, GDP of UK, CPI of Japan and Germany etc
are some of the few important data scheduled this week and one should take care of
these data while trading in commodities.
From The Desk Of Editor
4
NOTES:
1) These levels should not be confused with the daily trend sheet, which is sent every morning by e-mail in the name of "Morning Mantra ".
2) S1 & S2 indicate first support & second support respectively & R1 & R2 indicate first resistance and second resistance respectively.
3) Sometimes you will find the stop loss to be too far but if we change the stop loss once, we will find more strength coming into the stock. At the moment, the stop loss will be far as we are seeing the graphs on weekly basis and taking a long-term view and not a short-term view.
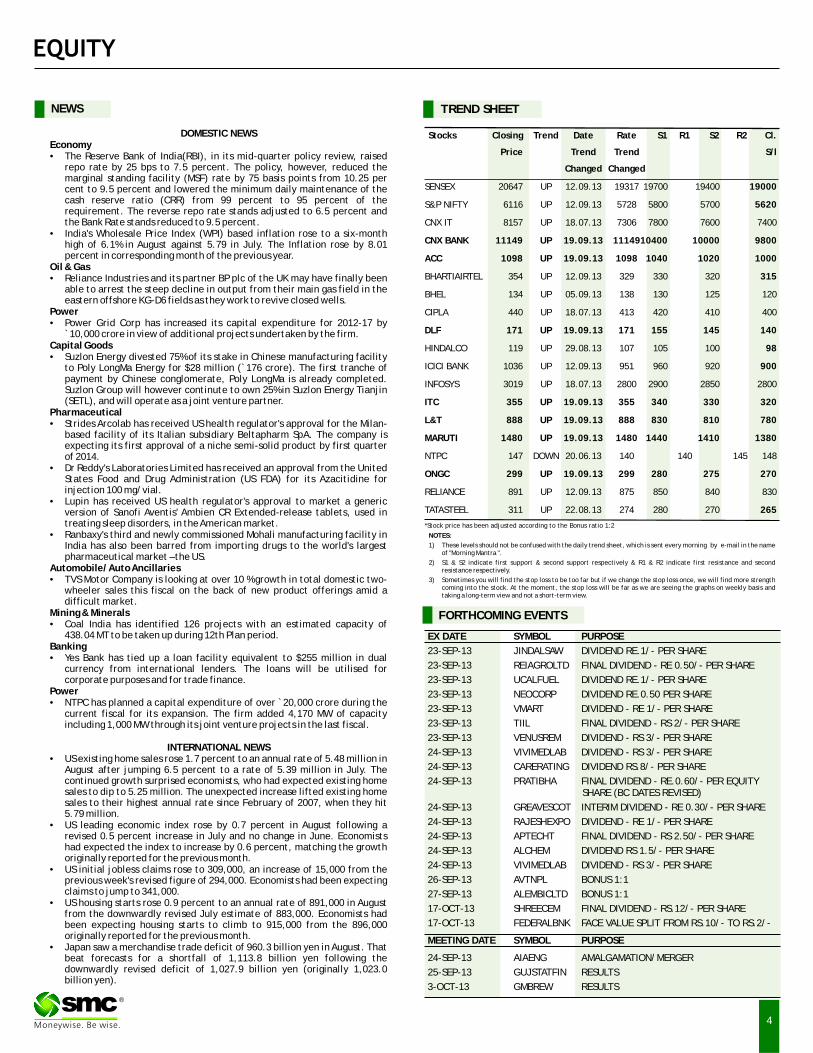
TREND SHEET
Stocks Closing Trend Date Rate S1 R1 S2 R2 Cl.
Price Trend Trend S/l
Changed Changed
SENSEX 20647 UP 12.09.13 19317 19700 19400 19000
S&P NIFTY 6116 UP 12.09.13 5728 5800 5700 5620
CNX IT 8157 UP 18.07.13 7306 7800 7600 7400
CNX BANK 11149 UP 19.09.13 1114910400 10000 9800
ACC 1098 UP 19.09.13 1098 1040 1020 1000
BHARTIAIRTEL 354 UP 12.09.13 329 330 320 315
BHEL 134 UP 05.09.13 138 130 125 120
CIPLA 440 UP 18.07.13 413 420 410 400
DLF 171 UP 19.09.13 171 155 145 140
HINDALCO 119 UP 29.08.13 107 105 100 98
ICICI BANK 1036 UP 12.09.13 951 960 920 900
INFOSYS 3019 UP 18.07.13 2800 2900 2850 2800
ITC 355 UP 19.09.13 355 340 330 320
L&T 888 UP 19.09.13 888 830 810 780
MARUTI 1480 UP 19.09.13 1480 1440 1410 1380
NTPC 147 DOWN 20.06.13 140 140 145 148
ONGC 299 UP 19.09.13 299 280 275 270
RELIANCE 891 UP 12.09.13 875 850 840 830
TATASTEEL 311 UP 22.08.13 274 280 270 265
NEWS
EX DATE SYMBOL PURPOSE
23-SEP-13 JINDALSAW DIVIDEND RE.1/- PER SHARE
23-SEP-13 REIAGROLTD FINAL DIVIDEND - RE 0.50/- PER SHARE
23-SEP-13 UCALFUEL DIVIDEND RE.1/- PER SHARE
23-SEP-13 NEOCORP DIVIDEND RE.0.50 PER SHARE
23-SEP-13 VMART DIVIDEND - RE 1/- PER SHARE
23-SEP-13 TIIL FINAL DIVIDEND - RS 2/- PER SHARE
23-SEP-13 VENUSREM DIVIDEND - RS 3/- PER SHARE
24-SEP-13 VIVIMEDLAB DIVIDEND - RS 3/- PER SHARE
24-SEP-13 CARERATING DIVIDEND RS.8/- PER SHARE
24-SEP-13 PRATIBHA FINAL DIVIDEND - RE.0.60/- PER EQUITY SHARE (BC DATES REVISED)
24-SEP-13 GREAVESCOT INTERIM DIVIDEND - RE 0.30/- PER SHARE
24-SEP-13 RAJESHEXPO DIVIDEND - RE 1/- PER SHARE
24-SEP-13 APTECHT FINAL DIVIDEND - RS 2.50/- PER SHARE
24-SEP-13 ALCHEM DIVIDEND RS 1.5/- PER SHARE
24-SEP-13 VIVIMEDLAB DIVIDEND - RS 3/- PER SHARE
26-SEP-13 AVTNPL BONUS 1:1
27-SEP-13 ALEMBICLTD BONUS 1:1
17-OCT-13 SHREECEM FINAL DIVIDEND - RS.12/- PER SHARE
17-OCT-13 FEDERALBNK FACE VALUE SPLIT FROM RS.10/- TO RS.2/-
MEETING DATE SYMBOL PURPOSE
24-SEP-13 AIAENG AMALGAMATION/MERGER
25-SEP-13 GUJSTATFIN RESULTS
3-OCT-13 GMBREW RESULTS
FORTHCOMING EVENTS
DOMESTIC NEWSEconomy• The Reserve Bank of India(RBI), in its mid-quarter policy review, raised
repo rate by 25 bps to 7.5 percent. The policy, however, reduced the marginal standing facility (MSF) rate by 75 basis points from 10.25 per cent to 9.5 percent and lowered the minimum daily maintenance of the cash reserve ratio (CRR) from 99 percent to 95 percent of the requirement. The reverse repo rate stands adjusted to 6.5 percent and the Bank Rate stands reduced to 9.5 percent.
• India's Wholesale Price Index (WPI) based inflation rose to a six-month high of 6.1% in August against 5.79 in July. The Inflation rose by 8.01 percent in corresponding month of the previous year.
Oil & Gas• Reliance Industries and its partner BP plc of the UK may have finally been
able to arrest the steep decline in output from their main gas field in the eastern offshore KG-D6 fields as they work to revive closed wells.
Power• Power Grid Corp has increased its capital expenditure for 2012-17 by
`10,000 crore in view of additional projects undertaken by the firm. Capital Goods• Suzlon Energy divested 75% of its stake in Chinese manufacturing facility
to Poly LongMa Energy for $28 million (`176 crore). The first tranche of payment by Chinese conglomerate, Poly LongMa is already completed. Suzlon Group will however continute to own 25% in Suzlon Energy Tianjin (SETL), and will operate as a joint venture partner.
Pharmaceutical• Strides Arcolab has received US health regulator's approval for the Milan-
based facility of its Italian subsidiary Beltapharm SpA. The company is expecting its first approval of a niche semi-solid product by first quarter of 2014.
• Dr Reddy's Laboratories Limited has received an approval from the United States Food and Drug Administration (US FDA) for its Azacitidine for injection 100 mg/vial.
• Lupin has received US health regulator's approval to market a generic version of Sanofi Aventis' Ambien CR Extended-release tablets, used in treating sleep disorders, in the American market.
• Ranbaxy's third and newly commissioned Mohali manufacturing facility in India has also been barred from importing drugs to the world's largest pharmaceutical market – the US.
Automobile/ Auto Ancillaries• TVS Motor Company is looking at over 10 % growth in total domestic two-
wheeler sales this fiscal on the back of new product offerings amid a difficult market.
Mining & Minerals• Coal India has identified 126 projects with an estimated capacity of
438.04 MT to be taken up during 12th Plan period. Banking• Yes Bank has tied up a loan facility equivalent to $255 million in dual
currency from international lenders. The loans will be utilised for corporate purposes and for trade finance.
Power• NTPC has planned a capital expenditure of over `20,000 crore during the
current fiscal for its expansion. The firm added 4,170 MW of capacity including 1,000 MW through its joint venture projects in the last fiscal.
INTERNATIONAL NEWS• US existing home sales rose 1.7 percent to an annual rate of 5.48 million in
August after jumping 6.5 percent to a rate of 5.39 million in July. The continued growth surprised economists, who had expected existing home sales to dip to 5.25 million. The unexpected increase lifted existing home sales to their highest annual rate since February of 2007, when they hit 5.79 million.
• US leading economic index rose by 0.7 percent in August following a revised 0.5 percent increase in July and no change in June. Economists had expected the index to increase by 0.6 percent, matching the growth originally reported for the previous month.
• US initial jobless claims rose to 309,000, an increase of 15,000 from the previous week's revised figure of 294,000. Economists had been expecting claims to jump to 341,000.
• US housing starts rose 0.9 percent to an annual rate of 891,000 in August from the downwardly revised July estimate of 883,000. Economists had been expecting housing starts to climb to 915,000 from the 896,000 originally reported for the previous month.
• Japan saw a merchandise trade deficit of 960.3 billion yen in August. That beat forecasts for a shortfall of 1,113.8 billion yen following the downwardly revised deficit of 1,027.9 billion yen (originally 1,023.0 billion yen).
*Stock price has been adjusted according to the Bonus ratio 1:2
®
5
BSE SENSEX GAINERS & LOSERS TOP (% Change) NSE NIFTY GAINERS TOP & LOSERS (% Change)
SECTORAL INDICES (% Change)
SMC Trend
SMC Trend
FMCGHealthcare
FTSE 100CAC 40
Auto BankRealty
Cap GoodsCons Durable
Oil & GasPower
NasdaqDow jonesS&P 500
NikkeiStrait times
Hang SengShanghai
INSTITUTIONAL ACTIVITY (Equity) (` Crore)
ITMetal
Down SidewaysUp
SMC Trend
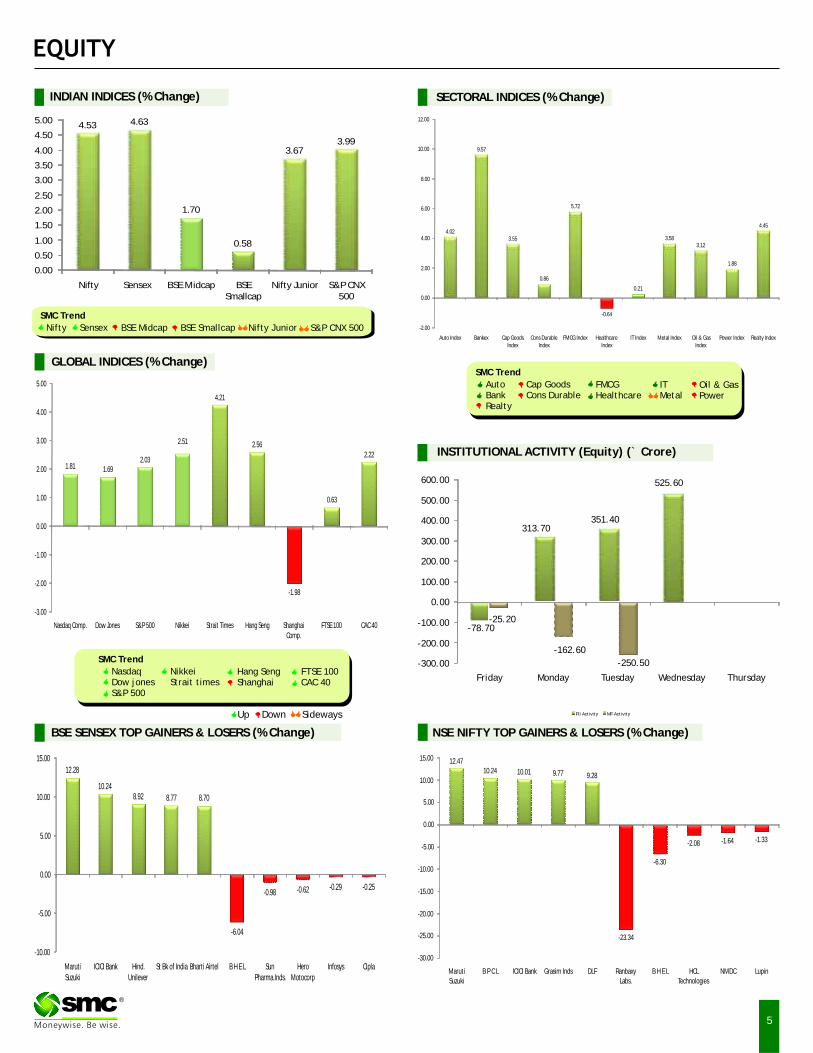
Nifty BSE Midcap Nifty JuniorSensex BSE Smallcap S&P CNX 500
GLOBAL INDICES (% Change)
INDIAN INDICES (% Change)
®
4.53 4.63
1.70
0.58
3.673.99
0.00
0.50
1.00
1.50
2.00
2.50
3.00
3.50
4.00
4.50
5.00
Nifty Sensex BSE Midcap BSE Smallcap
Nifty Junior S&P CNX 500
-0.64
4.02
9.57
3.55
0.86
5.72
0.21
3.583.12
1.88
4.45
-2.00
0.00
2.00
4.00
6.00
8.00
10.00
12.00
Auto Index Bankex Cap Goods Index
Cons Durable Index
FMCG Index Healthcare Index
IT Index Metal Index Oil & Gas Index
Power Index Realty Index
-1.98
1.81 1.692.03
2.51
4.21
2.56
0.63
2.22
-3.00
-2.00
-1.00
0.00
1.00
2.00
3.00
4.00
5.00
Nasdaq Comp. Dow Jones S&P 500 Nikkei Strait Times Hang Seng Shanghai Comp.
FTSE 100 CAC 40
313.70351.40
525.60
-78.70-25.20
-162.60
-250.50-300.00
-200.00
-100.00
0.00
100.00
200.00
300.00
400.00
500.00
600.00
Friday Monday Tuesday Wednesday Thursday
FII Activity MF Activity
12.28
10.248.92 8.77 8.70
-6.04
-0.98 -0.62 -0.29 -0.25
-10.00
-5.00
0.00
5.00
10.00
15.00
Maruti Suzuki
ICICI Bank Hind. Unilever
St Bk of India Bharti Airtel B H E L Sun Pharma.Inds.
Hero Motocorp
Infosys Cipla
12.4710.24 10.01 9.77 9.28
-23.34
-6.30
-2.08 -1.64 -1.33
-30.00
-25.00
-20.00
-15.00
-10.00
-5.00
0.00
5.00
10.00
15.00
Maruti Suzuki
B P C L ICICI Bank Grasim Inds DLF Ranbaxy Labs.
B H E L HCL Technologies
NMDC Lupin
Beat the street - Fundamental Analysis
6
® Above calls are recommended with a time horizon of 1 year. Source: Company Website Reuters Capitaline
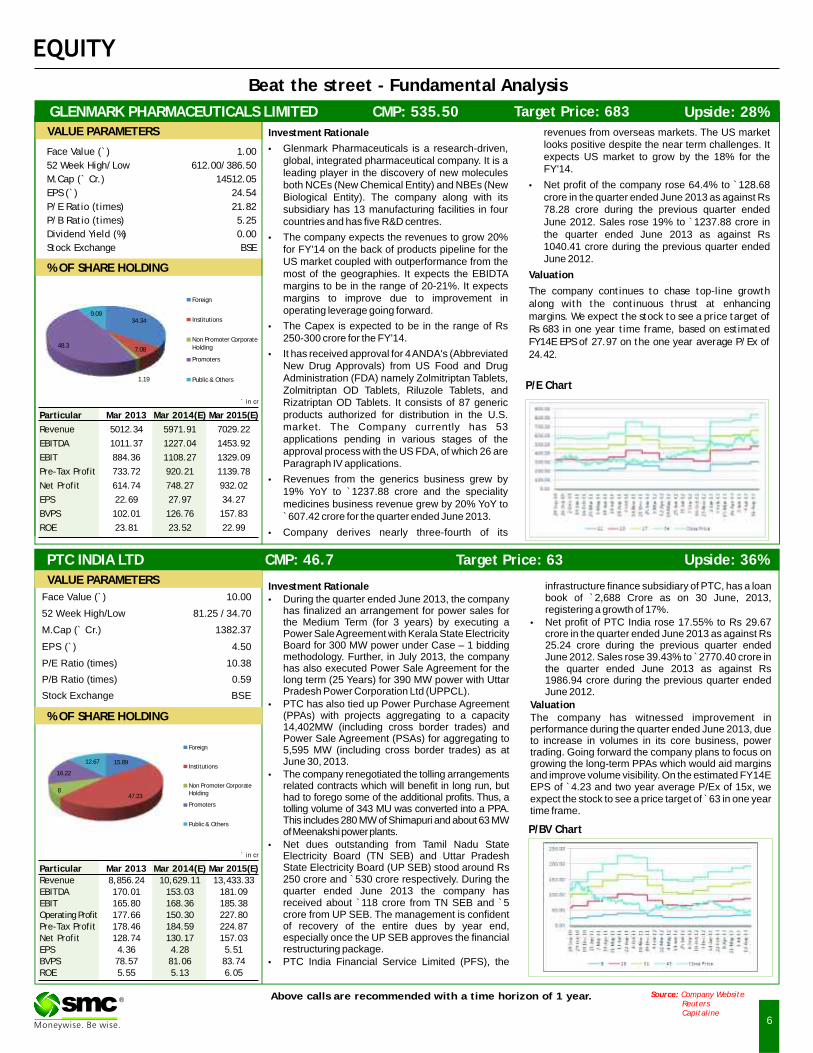
Face Value (`) 1.00
52 Week High/Low 612.00/386.50
M.Cap (` Cr.) 14512.05
EPS (`) 24.54
P/E Ratio (times) 21.82
P/B Ratio (times) 5.25
Dividend Yield (%) 0.00
Stock Exchange BSE
` in cr
Particular Mar 2013 Mar 2014 Mar 2015
Revenue 5012.34 5971.91 7029.22
EBITDA 1011.37 1227.04 1453.92
EBIT 884.36 1108.27 1329.09
Pre-Tax Profit 733.72 920.21 1139.78
Net Profit 614.74 748.27 932.02
EPS 22.69 27.97 34.27
BVPS 102.01 126.76 157.83
ROE 23.81 23.52 22.99
(E) (E)
VALUE PARAMETERS
% OF SHARE HOLDING
Investment Rationale revenues from overseas markets. The US market looks positive despite the near term challenges. It •Glenmark Pharmaceuticals is a research-driven, expects US market to grow by the 18% for the global, integrated pharmaceutical company. It is a FY'14. leading player in the discovery of new molecules
both NCEs (New Chemical Entity) and NBEs (New •Net profit of the company rose 64.4% to `128.68 Biological Entity). The company along with its crore in the quarter ended June 2013 as against Rs subsidiary has 13 manufacturing facilities in four 78.28 crore during the previous quarter ended countries and has five R&D centres. June 2012. Sales rose 19% to `1237.88 crore in
the quarter ended June 2013 as against Rs •The company expects the revenues to grow 20% 1040.41 crore during the previous quarter ended for FY'14 on the back of products pipeline for the June 2012.US market coupled with outperformance from the
most of the geographies. It expects the EBIDTA Valuationmargins to be in the range of 20-21%. It expects The company continues to chase top-line growth margins to improve due to improvement in
along with the continuous thrust at enhancing operating leverage going forward.
margins. We expect the stock to see a price target of •The Capex is expected to be in the range of Rs Rs 683 in one year time frame, based on estimated
250-300 crore for the FY'14. FY14E EPS of 27.97 on the one year average P/Ex of •It has received approval for 4 ANDA's (Abbreviated 24.42.
New Drug Approvals) from US Food and Drug Administration (FDA) namely Zolmitriptan Tablets, Zolmitriptan OD Tablets, Riluzole Tablets, and Rizatriptan OD Tablets. It consists of 87 generic products authorized for distribution in the U.S. market. The Company currently has 53 applications pending in various stages of the approval process with the US FDA, of which 26 are Paragraph IV applications.
•Revenues from the generics business grew by 19% YoY to `1237.88 crore and the speciality medicines business revenue grew by 20% YoY to `607.42 crore for the quarter ended June 2013.
•Company derives nearly three-fourth of its
P/E Chart
GLENMARK PHARMACEUTICALS LIMITED CMP: 535.50 Upside: 28%Target Price: 683
PTC INDIA LTD CMP: 46.7 Upside: 36%Target Price: 63
Face Value (`) 10.00
52 Week High/Low 81.25 / 34.70
M.Cap (` Cr.) 1382.37
EPS (`) 4.50
P/E Ratio (times) 10.38
P/B Ratio (times) 0.59
Stock Exchange BSE
VALUE PARAMETERS
% OF SHARE HOLDING
Investment Rationale infrastructure finance subsidiary of PTC, has a loan book of `2,688 Crore as on 30 June, 2013, •During the quarter ended June 2013, the company registering a growth of 17%.has finalized an arrangement for power sales for
the Medium Term (for 3 years) by executing a •Net profit of PTC India rose 17.55% to Rs 29.67 Power Sale Agreement with Kerala State Electricity crore in the quarter ended June 2013 as against Rs Board for 300 MW power under Case – 1 bidding 25.24 crore during the previous quarter ended methodology. Further, in July 2013, the company June 2012. Sales rose 39.43% to ̀ 2770.40 crore in has also executed Power Sale Agreement for the the quarter ended June 2013 as against Rs long term (25 Years) for 390 MW power with Uttar 1986.94 crore during the previous quarter ended Pradesh Power Corporation Ltd (UPPCL). June 2012.
•PTC has also tied up Power Purchase Agreement Valuation(PPAs) with projects aggregating to a capacity The company has witnessed improvement in 14,402MW (including cross border trades) and performance during the quarter ended June 2013, due Power Sale Agreement (PSAs) for aggregating to to increase in volumes in its core business, power 5,595 MW (including cross border trades) as at trading. Going forward the company plans to focus on June 30, 2013. growing the long-term PPAs which would aid margins
•The company renegotiated the tolling arrangements and improve volume visibility. On the estimated FY14E related contracts which will benefit in long run, but EPS of `4.23 and two year average P/Ex of 15x, we had to forego some of the additional profits. Thus, a expect the stock to see a price target of ̀ 63 in one year tolling volume of 343 MU was converted into a PPA. time frame. This includes 280 MW of Shimapuri and about 63 MW of Meenakshi power plants.
•Net dues outstanding from Tamil Nadu State Electricity Board (TN SEB) and Uttar Pradesh State Electricity Board (UP SEB) stood around Rs 250 crore and `530 crore respectively. During the quarter ended June 2013 the company has received about `118 crore from TN SEB and `5 crore from UP SEB. The management is confident of recovery of the entire dues by year end, especially once the UP SEB approves the financial restructuring package.
•PTC India Financial Service Limited (PFS), the
` in cr
Particular Mar 2013 2014(E) 2015Revenue 8,856.24 10,629.11 13,433.33EBITDA 170.01 153.03 181.09EBIT 165.80 168.36 185.38Operating Profit 177.66 150.30 227.80Pre-Tax Profit 178.46 184.59 224.87Net Profit 128.74 130.17 157.03EPS 4.36 4.28 5.51BVPS 78.57 81.06 83.74ROE 5.55 5.13 6.05
Mar Mar (E)
P/BV Chart
34.34
7.08
1.19
48.3
9.09
Foreign
Institutions
Non Promoter Corporate Holding
Promoters
Public & Others
15.89
47.238
16.22
12.67
Foreign
Institutions
Non Promoter Corporate Holding
Promoters
Public & Others
Charts by Spider Software India Ltd
7
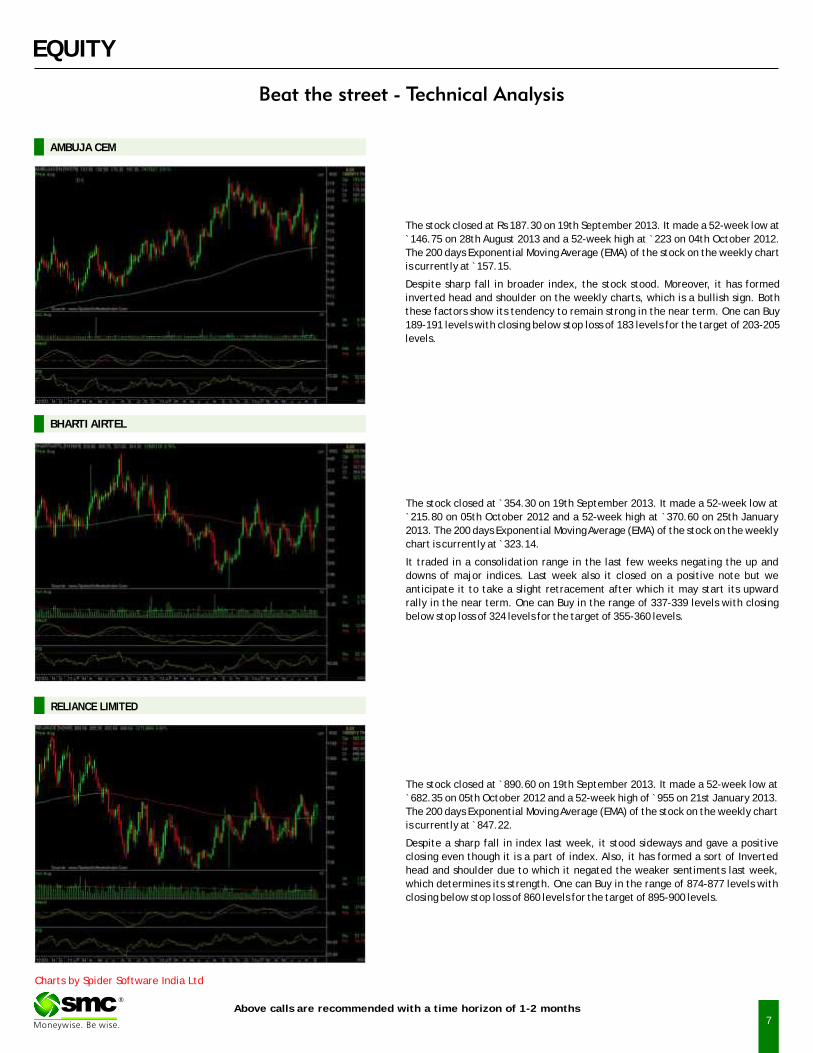
The stock closed at Rs 187.30 on 19th September 2013. It made a 52-week low at
`146.75 on 28th August 2013 and a 52-week high at `223 on 04th October 2012.
The 200 days Exponential Moving Average (EMA) of the stock on the weekly chart
is currently at ̀ 157.15.
Despite sharp fall in broader index, the stock stood. Moreover, it has formed
inverted head and shoulder on the weekly charts, which is a bullish sign. Both
these factors show its tendency to remain strong in the near term. One can Buy
189-191 levels with closing below stop loss of 183 levels for the target of 203-205
levels.
EQUITY
Above calls are recommended with a time horizon of 1-2 months
The stock closed at 354.30 on 19th September 2013. It made a 52-week low at
`215.80 on 05th October 2012 and a 52-week high at `370.60 on 25th January
2013. The 200 days Exponential Moving Average (EMA) of the stock on the weekly
chart is currently at ̀ 323.14.
It traded in a consolidation range in the last few weeks negating the up and
downs of major indices. Last week also it closed on a positive note but we
anticipate it to take a slight retracement after which it may start its upward
rally in the near term. One can Buy in the range of 337-339 levels with closing
below stop loss of 324 levels for the target of 355-360 levels.
`
The stock closed at 890.60 on 19th September 2013. It made a 52-week low at
`682.35 on 05th October 2012 and a 52-week high of ̀ 955 on 21st January 2013.
The 200 days Exponential Moving Average (EMA) of the stock on the weekly chart
is currently at ̀ 847.22.
Despite a sharp fall in index last week, it stood sideways and gave a positive
closing even though it is a part of index. Also, it has formed a sort of Inverted
head and shoulder due to which it negated the weaker sentiments last week,
which determines its strength. One can Buy in the range of 874-877 levels with
closing below stop loss of 860 levels for the target of 895-900 levels.
`
AMBUJA CEM
RELIANCE LIMITED
BHARTI AIRTEL
®
DERIVATIVES
BASIS GAP IN NIFTY
Global cues will continue to play an influential role this week. The Nifty is expected to remain in the range of 5900-6150 levels. The put-call ratio of open interest
increased and closed at 1.67 levels indicating put writing. The options open interest remained mixed as the week progressed. The option concentration
continues to be at the 5600-strike put option with a highest open interest of above 50 lakh shares, closely followed by the 6000-strike call option with above 40
lakh shares in open interest. The Implied Volatility (IV) of call options closed lower at 25.67% on Friday, while the average IV of put options ended at 26.00%. Nifty
VIX has decreased towards the weekend and is expected to remain volatile in the short term. Nifty is expected to remain in the range of 5900-6150 and only a
breach on the downside of 5900 will push the index to lower levels. The index may find intermediate support around 5930 levels, any instability on the global
front will bring about selling pressure from current levels.
WEEKLY VIEW OF THE MARKET
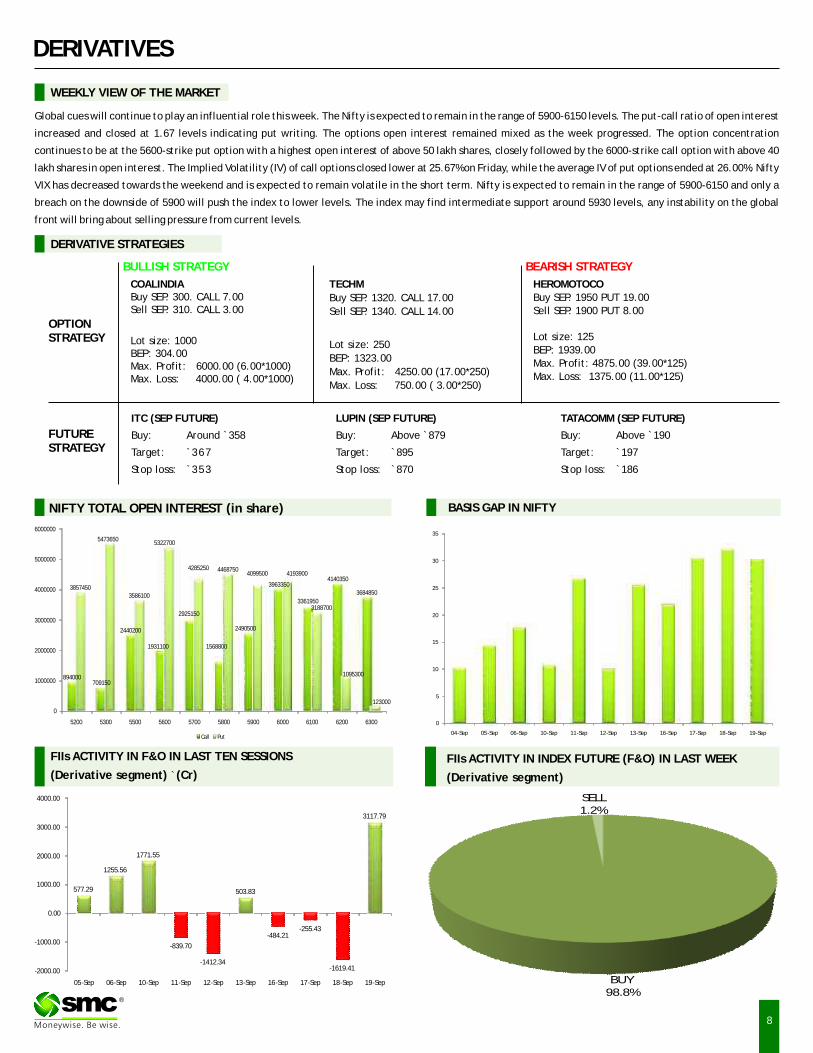
NIFTY TOTAL OPEN INTEREST (in share)
FIIs ACTIVITY IN INDEX FUTURE (F&O) IN LAST WEEK
(Derivative segment)
®
FIIs ACTIVITY IN F&O IN LAST TEN SESSIONS
(Derivative segment) `(Cr)
ITC (SEP FUTURE)
Buy: Around `358
Target: `367
Stop loss: `353
HEROMOTOCOBuy SEP. 1950 PUT 19.00Sell SEP. 1900 PUT 8.00
Lot size: 125BEP: 1939.00Max. Profit: 4875.00 (39.00*125)Max. Loss: 1375.00 (11.00*125)
OPTIONSTRATEGY
FUTURESTRATEGY
COALINDIABuy SEP. 300. CALL 7.00Sell SEP. 310. CALL 3.00
Lot size: 1000BEP: 304.00Max. Profit: 6000.00 (6.00*1000)Max. Loss: 4000.00 ( 4.00*1000)
TATACOMM (SEP FUTURE)
Buy: `190
Target: `197
Stop loss: `186
Above
TECHM
Buy SEP. 1320. CALL 17.00
Sell SEP. 1340. CALL 14.00
Lot size: 250
BEP: 1323.00
Max. Profit: 4250.00 (17.00*250)
Max. Loss: 750.00 ( 3.00*250)
BULLISH STRATEGY
DERIVATIVE STRATEGIES
LUPIN (SEP FUTURE)
Buy: `879
Target: `895
Stop loss: `870
Above
BEARISH STRATEGY
894000709150
2440200
1931100
2925150
1568800
2490500
3963350
3361950
4140350
36848503857450
5473650
3586100
5322700
4285250 44687504099500 4193900
3188700
1095300
123000
0
1000000
2000000
3000000
4000000
5000000
6000000
5200 5300 5500 5600 5700 5800 5900 6000 6100 6200 6300
Call Put
0
5
10
15
20
25
30
35
04-Sep 05-Sep 06-Sep 10-Sep 11-Sep 12-Sep 13-Sep 16-Sep 17-Sep 18-Sep 19-Sep
BUY98.8%
SELL1.2%
-839.70
-1412.34
-484.21-255.43
-1619.41
577.29
1255.56
1771.55
503.83
3117.79
-2000.00
-1000.00
0.00
1000.00
2000.00
3000.00
4000.00
05-Sep 06-Sep 10-Sep 11-Sep 12-Sep 13-Sep 16-Sep 17-Sep 18-Sep 19-Sep
8
9
BHARTIARTL 11158000 10118000 -9.32 0.86 1.13 0.27 52.38 42.05 -10.33
DLF 29576000 27216000 -7.98 1.35 1.57 0.22 78.85 64.70 -14.15
HINDALCO 22108000 21624000 -2.19 0.99 1.25 0.26 61.94 55.70 -6.24
HINDUNILVR 8586500 7743500 -9.82 0.75 1.48 0.73 34.27 43.91 9.64
ICICIBANK 10730250 9660750 -9.97 0.94 1.33 0.39 62.20 58.39 -3.81
IDEA 9934000 10212000 2.80 0.56 0.65 0.09 56.15 51.39 -4.76
INFY 2006125 1882375 -6.17 1.16 1.05 -0.11 38.49 37.80 -0.69
ITC 24475000 21088000 -13.84 0.84 1.35 0.51 46.60 44.72 -1.88
JPASSOCIAT 60240000 56248000 -6.63 0.64 0.68 0.04 93.12 79.05 -14.07
NTPC 10448000 8636000 -17.34 0.73 0.76 0.03 41.90 41.00 -0.90
ONGC 8922000 8261000 -7.41 0.76 1.02 0.26 54.01 41.13 -12.88
RANBAXY 6269000 7772500 23.98 0.81 0.64 -0.17 82.35 77.85 -4.50
RCOM 38468000 35120000 -8.70 1.03 1.25 0.22 67.50 65.71 -1.79
RELIANCE 8399750 7262250 -13.54 0.79 0.79 0.00 40.50 34.34 -6.16
NIFTY 17317450 16204200 -6.43 1.52 1.67 0.15 26.78 25.67 -1.11
SAIL 16672000 16632000 -0.24 0.36 0.42 0.06 64.31 53.49 -10.82
SBIN 5386875 4995125 -7.27 0.78 0.97 0.19 47.19 46.26 -0.93
TATASTEEL 15125000 15732000 4.01 0.99 0.96 -0.03 53.92 49.04 -4.88
UNITECH 80328000 86712000 7.95 0.33 0.28 -0.05 80.52 75.04 -5.48
IMPORTANT INDICATORS OF NIFTY AND OTHER ACTIVE FUTURE CONTRACTS
OPEN INTEREST PCR RATIO IMPLIED VOLATILITY
SCRIPTS PREV. CURRENT % PREV. CURRENT PREV. CURRENT WEEK WEEK CHANGE WEEK WEEK CHANGE WEEK WEEK CHANGE
DERIVATIVES
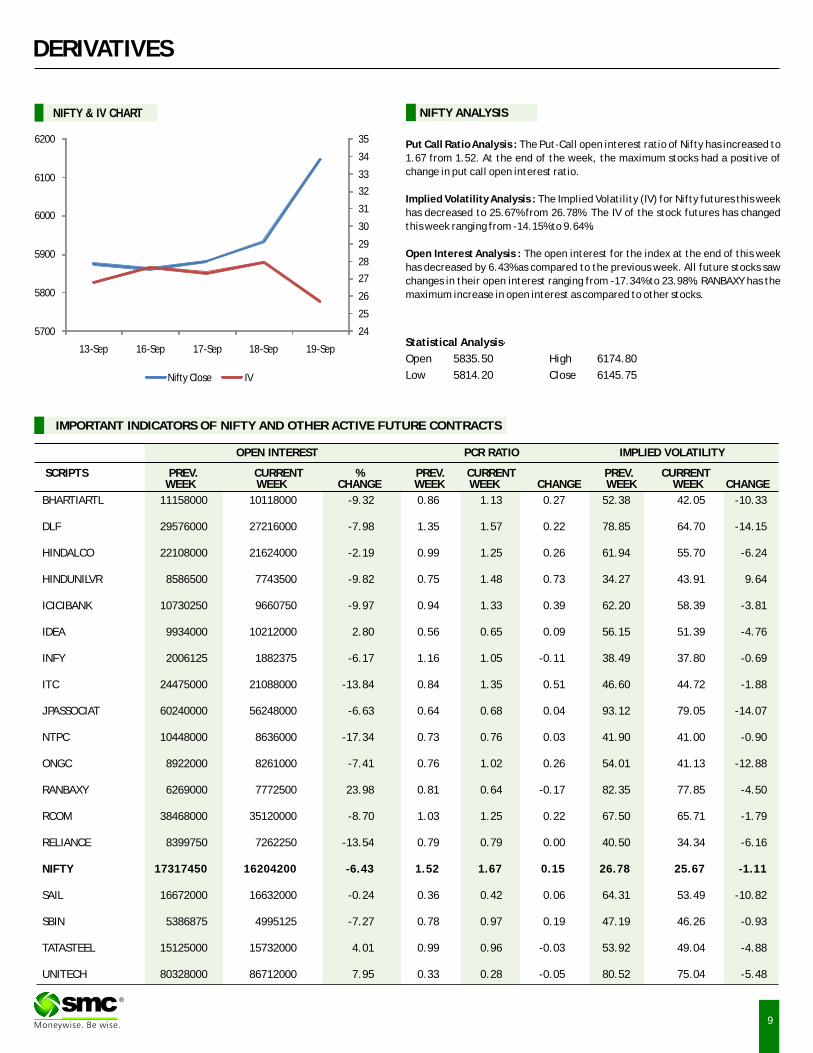
Put Call Ratio Analysis : The Put-Call open interest ratio of Nifty has increased to
1.67 from 1.52. At the end of the week, the maximum stocks had a positive of
change in put call open interest ratio.
Implied Volatility Analysis : The Implied Volatility (IV) for Nifty futures this week
has decreased to 25.67% from 26.78%. The IV of the stock futures has changed
this week ranging from -14.15% to 9.64%.
Open Interest Analysis : The open interest for the index at the end of this week
has decreased by 6.43% as compared to the previous week. All future stocks saw
changes in their open interest ranging from -17.34% to 23.98%. RANBAXY has the
maximum increase in open interest as compared to other stocks.
Statistical Analysis·
Open 5835.50 High 6174.80
Low 5814.20 Close 6145.75
NIFTY & IV CHART NIFTY ANALYSIS
®
24
25
26
27
28
29
30
31
32
33
34
35
5700
5800
5900
6000
6100
6200
13-Sep 16-Sep 17-Sep 18-Sep 19-Sep
Nifty Close IV
10
®
Bullion counter is expected to remain sideways with some short covering at lower levels on the back of firm international markets after US federal reserve did not taper the stimulus program. Fed Chairman Ben Bernanke last week refused to commit to begin reducing the central bank's bond purchases this year and instead went out of his way to stress the programme was "not on a preset course". Many had expected a $10 billion cut to the $85 billion monthly bond purchases following strong economic data. On the domestic bourses local currency rupee after strengthening sharply in recent weeks can weaken to some extent, which can keep the bullion counter well supported in MCX. Gold may trade in the range of $1300-1430 in COMEX and 29500-31500 in MCX. White metal silver can also trade in the range of 48500-53500 in near term. India called a meeting of top officials from the finance and trade ministries last week to break a two-month impasse on gold imports that has crimped supply and pushed up prices in the world's biggest gold consumer. Recently Federal Reserve's surprise decision not to taper stimulus increased demand for bullion as a hedge against accelerating inflation and currency debasement. COMEX Gold is set for the first annual drop in 13 years as some investors lose faith in the metal as a store of value amid signs economies are strengthening. U.S. Dollar Index dropped 2.7 percent in the past two weeks to the lowest since Feb. 19.Dollar index can further dip lower towards 79 in near term.
BULLIONS
Movement of greenback and development in Middle East tensions will influence the direction of crude oil in near term. Moreover movement of local currency rupee will also give direction to the Crude oil prices in MCX. Overall it can move in the range of 6400-6900 in MCX and $102-109 in NYMEX. Last week after the Fed kept the $85 billion of bond purchases crude oil investors refocused on increased Libyan production and dwindling geopolitical concerns about Iran. Libyan government officials stated that the country has managed to resume production by nearly 800,000 barrels per day as against last month's reading of 150,000 barrels per day. OPEC might increase its crude shipments by 1.4% as Saudi Arabia continues to boost the output as per latest updates from tanker tracker Oil Movements. OPEC, excluding Angola and Ecuador, will export about 23.9 million barrels a day in the four weeks to Oct, up 320,000 barrels a day from the period to September 7. Natural gas can trade on volatile path in the range of 220-245 in MCX. The U.S. Energy Information Administration stated in its weekly report that natural gas storage in the U.S. in the week ended Sept. 13 rose by 46 billion cubic feet to 3.299 trillion cubic feet, below market expectations for an increase of 56 billion cubic feet. Demand for natural gas tends to wane at the country's thermal power plants, as homes and businesses throttle back on their air conditioners. Investors continue to track a weather disturbance over the southwestern Gulf of Mexico.
ENERGY COMPLEX
Base metals complex may trade sideways with some lower level buying. Recently U.S. home resales surged in August to a 6-1/2-year high and factories grew busier in the Mid-Atlantic region this month, which indicate that rising borrowing costs are weighing only modestly on the economy. Last week fed put on hold the tapering of monetary stimulus measures as the committee decided to await more evidence that progress will be sustained before adjusting the pace of its purchases. In a new set of quarterly forecasts, the Fed said it now sees growth in a 2 percent to 2.3 percent range this year, down from 2.3 percent to 2.6 percent in its June estimates. The downgrade for next year was even sharper. Red metal copper can trade in the range of 440-485. Chinese copper smelters are looking for up to a 50 percent increase in annual term treatment and refining charges (TC/RCs) for 2014, encouraged by greater availability of concentrates and spot charges hitting two-year highs. Zinc prices can hover in the range of 115-122 in MCX. Nickel prices can trade in the range of 850-930 in MCX. According to the International Nickel Study Group (INSG) global nickel market was in surplus by 90,300 tonnes in the first seven months of the year. Battery metal Lead can move in the range of 129-137. The International Lead and Zinc Study Group (ILZSG have assessed that the refined lead market outside of China as being in 83,000-tonne deficit in the first half of this year. Aluminum prices may move in the range of 109-114 levels.
BASE METALS
Turmeric futures (Oct) is unlikely to recover as better sowing reports, huge
carryover stocks and lack of demand even at these lower levels is likely to
keep market sentiments weak. Traders and exporters are still waiting for
the fresh export inquires and therefore are staying away from the bulk
buying. Prices may trade in the range of 4600-5000. But the demand in
coming weeks is likely to rise from North India during the upcoming festive
season. Jeera futures (Oct) is expected to trade lower and prices may
remain in the range of 13600-12800. Sluggish demand from local buyers and
higher-than-expected supplies in the domestic markets are putting
pressure on the counter. Rumors of early sowing of jeera (possibly October
onwards) in Gujarat due to ample soil moisture may add more bearish
sentiments in the jeera market. However, export orders are expected to
improve in the coming days due to negligible supply from Turkey, Syria and
Iran. Cardamom futures (Oct) is likely to manage and may remain in the
range of 740-775. Ample stocks prevailing at the auctions centre and higher
arrivals as the second round of harvesting is in full swing are likely to keep
cardamom prices under pressure. But the counter may get support by a
possible pick-up in export and domestic demand. A downside bias may
continue in chilli futures due to the prevailing weak trend at the spot market
and the prices may continue in the range of 5200-4800. However, dwindling
acreage of chilli in AP, especially Guntur might limit the sharp fall in prices.
SPICES
OTHER COMMODITIES
Guar complex may remain in lower side on slacked buying at these higher levels and traders apprehend present high rates are not sustainable and some more fall in rates cannot be ruled out in the short term. Better production prospects amid better sowing reports and low export demand may keep the market sentiments weak in spot and futures markets for both guarseed and guargum. Sugar futures (Oct) is likely to trade lower with resistance of 3050 due to continuous supply from millers to ease off their stocks ahead of coming crushing season. Chana futures (Oct) is likely to trade in the range of 2950-3300 with the negative bias. Better pulses production reports and sufficient stock to meet the festive demand are pressurizing the market sentiments. According to the Ministry of Agriculture, India, the sowing area for kharif pulses crop 2013-14 as on September 13 is up by to 103.76 lakh hectares in comparison with 98.25 lakh hectares in the corresponding period during the last year. Kapas prices may remain in downside in the range of 1050-930 due to lower demand from China and higher production estimates. Cotton Association of India (CAI) states that Indian cotton production in 2013-14 may surge by 6% to 37.5million bales from 35.7 million bales in last year. Wheat future may trade in the range of 1550-1620 due to lackluster trading activities. Supply remains ample and only needful buying is talking place.
Soybean futures (Oct) is likely to trade in the range of 3320-3500. As the
early sowing this year, the crop will start arriving in the market a little bit
early this season. In some area of Maharashtra and in the markets of Madhya
Pradesh, new soybean has started arriving and are likely to pick up pace in
the coming days. Industry sources say that this year production may remain
higher by at least 18% at 13.34 million tonnes as compared to last year.
Mustard futures (Oct) is likely to remain bearish as higher kharif oilseeds
crop prospects on higher acreage will continue to pressurize the markets.
Global supplies of rapeseed are widely believed to rise, which will put
pressure on the rapeseed prices in the coming weeks. But traders expect
increase in demand of oil amid upcoming festive season and meal due to
increased export demand. The price may trade in the range of 3420-3600.
CPO futures (Sept) prices may remains in negative zone in the range of 520-
545 on the weak cues of Malaysian market. Palm oil production in Indonesia
and Malaysia is expected to start rising this month as trees enter the peak
production cycle, while rainfall in the U.S. Midwest is likely to boost yields
of the moisture-stressed soybean crop. Even good export numbers are not
helping the palm oil market to recover. Refined soy oil futures (Oct) is likely
trade in the range of 3420-3600 with negative bias due to sluggish demand.
OIL AND OILSEEDS
Closing as on 19.09.2013
11
NOTES : 1) Buy / Sell 25% of Commodity at S1/R1 respectively & rest 75% at S2/R2 respectively.2) S1 & S2 indicate first support & second support & R1 & R 2 indicate first resistance & second resistance. 3) Sometimes you will find the stop loss to be too far but if we change the stop loss once, we will find more strength coming into the commodity. At the moment, the stop loss will be far as we are seeing the graphs on weekly
basis and taking a long-term view and not a short-term view.4) These levels should not be confused with the daily trend sheet, which is sent every morning by e-mail in the name of Daily report- commodities.
TECHNICAL RECOMMENDATIONS
EXCHANGE CONTRACT CLOSING DATE TREND
PRICE CHANGED CHANGED STOP/LOSS
NCDEX SOYABEAN (OCT) 3449.50 29.08.13 SIDEWAYS
NCDEX JEERA (OCT) 13432.50 11.04.13 UP 13795.00 12800.00 - 12300.00 - 11800.00
NCDEX RED CHILLI (OCT) 5552.00 17.04.13 DOWN 6362.00 - 5800.00 6000.00 6100.00
NCDEX RM SEEDS (OCT) 3551.00 25.07.13 DOWN 3099.00 - 3600.00 3700.00 3800.00
MCX MENTHA OIL (OCT) 871.50 13.06.13 SIDEWAYS
MCX CARDAMOM (OCT) 763.20 28.02.13 DOWN 965.00 - 800.00 830.00 860.00
MCX SILVER (DEC) 51750.00 14.08.13 UP 46573.00 50000.00 - 48000.00 - 46000.00
MCX GOLD (OCT ) 30544.00 12.09.13 SIDEWAYS
MCX COPPER (NOV) 465.45 12.09.13 DOWN 459.25 480.00 - 490.00 - 505.00
MCX LEAD (SEP) 131.20 12.09.13 DOWN 134.65 139.00 - 145.00 - 149.00
MCX ZINC (SEP) 116.60 12.09.13 DOWN 118.20 122.00 - 128.00 - 132.00
MCX NICKEL (SEP) 891.10 12.09.13 DOWN 879.20 930.00 - 960.00 - 1000.00
MCX ALUMINUM (SEP) 111.30 12.09.13 SIDEWAYS
MCX CRUDE OIL (OCT) 6630.00 12.09.13 SIDEWAYS
MCX NATURAL GAS (SEP) 230.30 22.08.13 UP 231.30 230.00 - 220.00 - 210.00
TREND RATE TREND S1 R1 S2 R2 CLOSING
*
TREND SHEET
COMMODITY
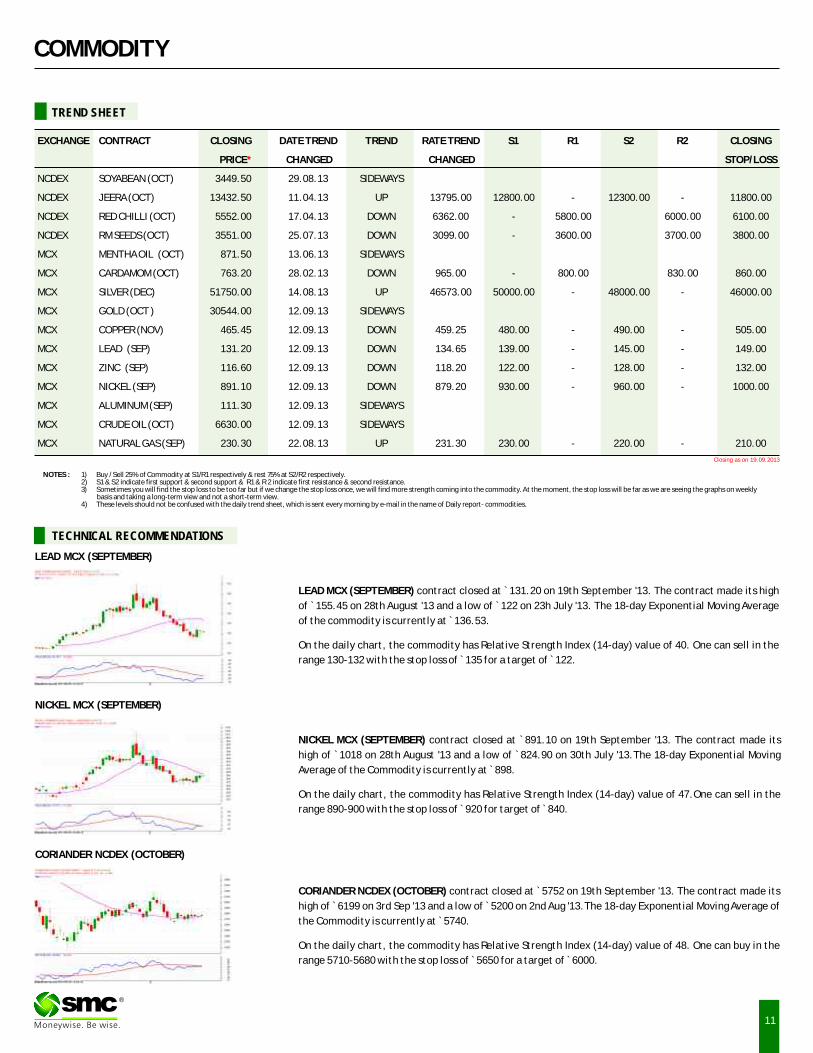
LEAD MCX (SEPTEMBER) contract closed at 131.20 on 19th September '13. The contract made its high
of ̀ 155.45 on 28th August '13 and a low of ̀ 122 on 23h July '13. The 18-day Exponential Moving Average
of the commodity is currently at ̀ 136.53. On the daily chart, the commodity has Relative Strength Index (14-day) value of 40. One can sell in the
range 130-132 with the stop loss of ̀ 135 for a target of ̀ 122.
`
NICKEL MCX (SEPTEMBER) contract closed at 891.10 on 19th September '13. The contract made its
high of `1018 on 28th August '13 and a low of `824.90 on 30th July '13.The 18-day Exponential Moving
Average of the Commodity is currently at ̀ 898.
On the daily chart, the commodity has Relative Strength Index (14-day) value of 47.One can sell in the
range 890-900 with the stop loss of ̀ 920 for target of ̀ 840.
`
CORIANDER NCDEX (OCTOBER) contract closed at 5752 on 19th September '13. The contract made its
high of ̀ 6199 on 3rd Sep '13 and a low of ̀ 5200 on 2nd Aug '13.The 18-day Exponential Moving Average of
the Commodity is currently at ̀ 5740.
On the daily chart, the commodity has Relative Strength Index (14-day) value of 48. One can buy in the
range 5710-5680 with the stop loss of ̀ 5650 for a target of ̀ 6000.
`
®
LEAD MCX (SEPTEMBER)
NICKEL MCX (SEPTEMBER)
CORIANDER NCDEX (OCTOBER)
COMMODITY
NEWS DIGEST
FOMC's decision “not to taper the stimulus” came as a surprise for the market and because of it the market witnessed huge volatility. Furthermore, sharp appreciation was witnessed in the local currency which locked some volatility in the domestic market. On the contrary, the dollar index fell to a seven-month low as against a basket of 10 currencies last week. The bullion counter witnessed wild swings, reacted heavily throughout the week. Gold jumped the most in 15 months as the Federal Reserve unexpectedly refrained from reducing the pace of monthly bond purchases. Silver followed the footsteps of gold. However, in the local market upside was comparatively low in bullion owing to sharp appreciation in rupee. In energy counter, crude traded up in the international market after the Federal Reserve said it will maintain monthly bond purchases to stimulate economic growth in the U.S., the world's biggest oil consumer. However, it closed the week on a negative note as Libya's oil output increased and Syrian President Bashar al-Assad said he would give inspectors access to the chemical-weapons facilities. As the supply contracted, US crude stockpiles fell to the lowest level since March 2012, and supplies at Cushing, Oklahoma, the delivery point for WTI contracts also dropped for an 11th week, according to a government report. Refineries operated at 92.5% of capacity. U.S. utilization rates typically increase during the summer months when gasoline demand peaks, and decline after the Labor Day holiday in early September when consumption slows. Base metals reacted positively on Fed action, however in Indian market some of them closed the week on a negative note despite the sharp recovery.
On the agri commodities front, most of them traded weak. Selling pressure was noticed in edible oil and oil seeds complex. Nevertheless, in later part of the week, this counter shed some of its loss. Soyabean prices revived after U.S. reported its fifth-biggest sale of the oilseed on record in a deal with China, the world's largest buyer. Furthermore, soyabean rallied 16% since reaching an almost 19-month low in August as hot, dry weather worsened prospects for the U.S. harvest, which usually starts in September. Sugar extended hit lowest level in more than five months, weighed by expectations of higher supplies from the new crop. With subdued demand in the spot market as mounting stocks and expectations of higher sowing weighed, chana futures travelled in lower trading zone. Like other counter, bears had a tight grip in spices complex due to lack of trading activities. Turmeric futures fell due to higher carry-forward stocks and conducive weather for the sown crop, though fresh demand from exporters limited the downside.
WEEKLY COMMENTARY
WEEKLY STOCK POSITIONS IN WAREHOUSE (NCDEX)
COMMODITY UNIT 11.09.13 18.09.13 DIFFERENCEQTY.
BARLEY MT 23102 22601 -501
CASTOR SEED MT 96926 97551 625
CHANA MT 109290 108010 -1280
CHILLI MT 3711 3232 -479
COTTONSEED OILCAKE MT 18444 17045 -1399
JEERA MT 3744 3695 -49
MAIZE MT 2722 2722 0
RAPE MUSTARD SEED MT 43476 42693 -783
SOYA BEAN SEEDS MT 0 0 0
SUGAR M MT 5396 6644 1248
WHEAT MT 12871 12871 0
COMMODITY UNIT 12.09.13 19.09.13 DIFFERENCE
QTY. QTY.
CARDAMOM MT 58.30 67.10 8.80
KAPASIA KHALLI BALES 1111.40 198.88 -912.52
GOLD KGS 428.00 439.00 11.00
GOLD MINI KGS 36.30 33.90 -2.40
GOLD GUINEA KGS 26.55 26.55 0.00
MENTHA OIL KGS 2641080.85 2661624.85 20544.00
MILD STEEL MT 873.73 873.73 0.00
SILVER (30 KG Bar) KGS 728.00 17730.55 17002.55
•FMC has asked all exchanges not to trade in non agri
commodities on all Saturdays with immediate effect.
•India increased the import duty on gold jewellery to
15% from 10%.
•US investors sold 694.8 metric tonnes through gold-
backed exchange-traded products this year, erasing
$56.7 billion from the funds' value.
•World primary nickel consumption totalled 1,107,600
tonnes in January to July, while primary nickel output
was 1,017,300 tonnes.
•Peru is likely to more than double its copper output
by the end of 2016 as several large mining projects
start production.
•China's new home prices rose at the fastest rate in at
least 2-1/2 years in August.
•Euro zone exports rose by 3%, year on year, following
a 3% drop in June compared to the same month a year
ago.
•US Industrial output increased 0.4 percent last month
after being flat in July.
•U.S. Mint sold 11,500 ounces of American Eagle gold
coins in August, the least in six years and down from
as much as 209,500 ounces in April.
WEEKLY STOCK POSITIONS IN WAREHOUSE (MCX)
12
®
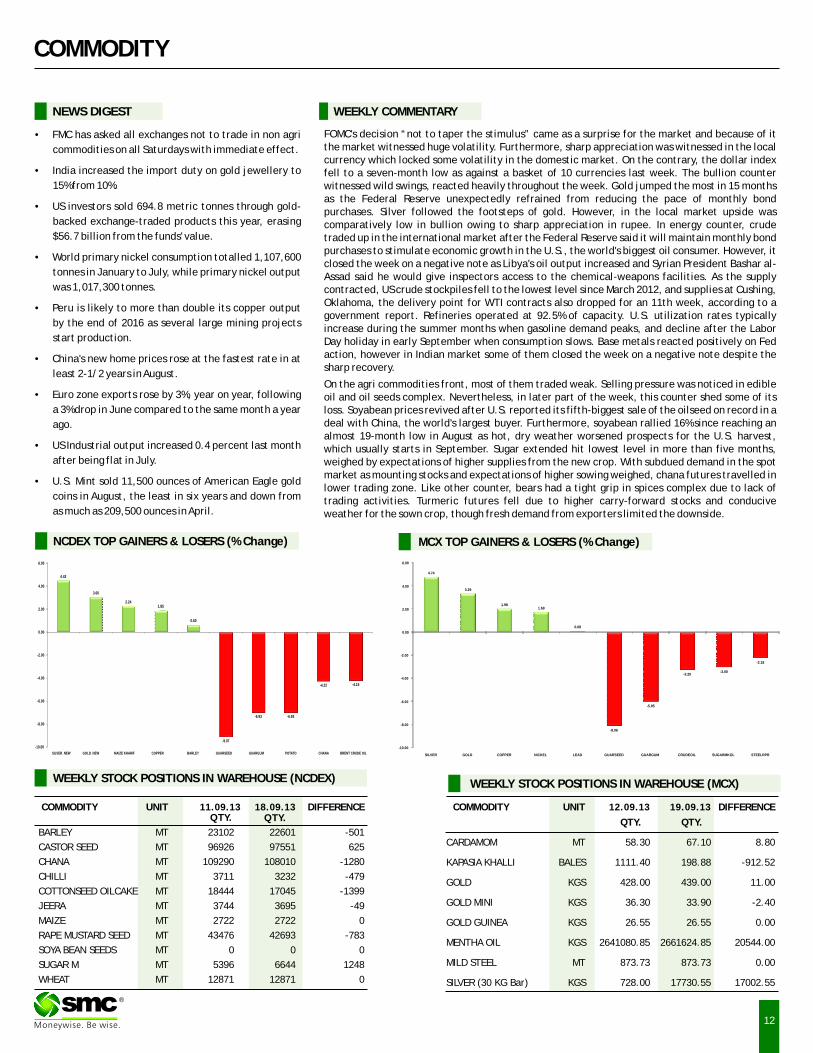
NCDEX TOP GAINERS & LOSERS (% Change) MCX TOP GAINERS & LOSERS (% Change)
QTY.
4.43
3.00
2.241.85
0.60
-9.07
-6.93 -6.93
-4.22 -4.15
-10.00
-8.00
-6.00
-4.00
-2.00
0.00
2.00
4.00
6.00
SILVER_NEW GOLD_NEW MAIZE KHARIF COPPER BARLEY GUARSEED GUARGUM POTATO CHANA BRENT CRUDE OIL
4.74
3.29
1.981.69
0.08
-8.06
-5.95
-3.20-3.00
-2.18
-10.00
-8.00
-6.00
-4.00
-2.00
0.00
2.00
4.00
6.00
SILVER GOLD COPPER NICKEL LEAD GUARSEED GUARGUM CRUDEOIL SUGARMKOL STEELRPR
Maize
13
SPOT PRICES (% change)
COMMODITY
WEEKLY STOCK POSITIONS IN LME (IN TONNES)
COMMODITY STOCK POSITION STOCK POSITION DIFFERENCE
12.09.13 19.09.13
ALUMINIUM 5359525 5387650 28125
COPPER 585275 571950 -13325
NICKEL 216108 218448 2340
LEAD 180425 245100 64675
ZINC 985350 981000 -4350
INTERNATIONAL COMMODITY PRICES
COMMODITY EXCHANGE CONTRACT UNIT 12.09.13 19.09.13 CHANGE(%)
Soya CBOT NOV Cent per Bushel 1396.00 1339.00 -4.08
Maize CBOT SEPT Cent per Bushel 479.00 450.00 -6.05
CPO BMD NOV MYR per MT 2344.00 2318.00 -1.11
Sugar LIFFE DEC 10 cents per MT 492.60 487.50 -1.04
COMMODITY EXCHANGE CONTRACT 12.09.13 19.09.13 CHANGE%
ALUMINIUM LME 3 MONTHS 1812.00 1829.00 0.94
COPPER LME 3 MONTHS 7060.00 7335.00 3.90
LEAD LME 3 MONTHS 2120.00 2126.00 0.28
NICKEL LME 3 MONTHS 13785.00 14400.00 4.46
ZINC LME 3 MONTHS 1878.00 1906.00 1.49
GOLD COMEX DEC 1330.60 1369.30 2.91
SILVER COMEX DEC 22.15 23.29 5.15
LIGHT CRUDE OIL NYMEX OCT 108.60 106.39 -2.03
NATURAL GAS NYMEX OCT 3.64 3.72 2.20
PRICES OF METALS IN LME/ COMEX/ NYMEX (in US $)
Maize or corn is important for its wide variety of applications, ranging from food
and feed to industrial products, and more recently, as an alternate fuel. In India,
maize is the third most important food crop after rice and wheat.
Global corn production & consumption
US, China, France, Indonesia, India and South Africa are major maize producing
countries. According to the latest report of USDA, World corn production is
projected at 956.67 million tonnes in 2013-14, up 96.61 million tonnes, or 11
percent, from 860.06 million tonnes in 2012-13. Global corn consumption was
projected at 927.84
million tonnes in
2013-14, up 58.53
million tonnes, or 10
percent, from
869.31 million
tonnes in 2012-13.
World corn exports
were projected at
102.72 million
tonnes, up 8.37
million tonnes, or 9
percent, from 94.35
million tonnes in
2012-13. Global corn ending stocks for 2013/14 are projected 1.3 million tonnes
higher with larger stocks in Brazil and the United States.
Maize production in India
India's share in the global maize production and export is around 2% and 3%
respectively. India is estimated to produce an all-time high crop of 22.5 million
tonnes in 2013/14, according to the USDA, up marginally from 22.2 million tonnes a
year ago. As per sowing report by Ministry of agriculture, maize sowing has
increased from last year owing to good rainfall in the maize growing regions.
Farmers have planted maize in 8.19 million hectares as of 12th September, 2013 as
against 7.4 million hectares sown in 2012-13. After wheat and rice, to provide a big
thrust to maize production, the government has a fixed the MSP of maize for 2013-
14 crop season at ̀ 1,310 per quintal. The export of maize for the first time reached
a record around 5 million tonnes in 2012-13 up 24% from the previous years, making
India a prominent player in the world maize market dominated largely by US.
Current price scenario
In CBOT, 2012 was a remarkable year for corn prices which breached the historical
high levels due to worries over the US corn output that has been hit by the worst
drought in 56 years. But in 2013, Prices tumbled 34 percent as expectation that
U.S. farmers will collect 13.843 billion bushels of corn in 2013, 28 percent up from
last year's drought-reduced harvest, helping send global inventories to a 12-year
high.
Outlook
Higher output estimate amid higher sowing area due to better rains and higher
global supply will keep the prices on weak sentiment. Exportable surplus in the
U.S. and Ukraine may increase due higher production estimate. But shortage of
stocks in the domestic market and report of crop damage in Andhra Pradesh due to
excessive rain may support the prices in short term.
®
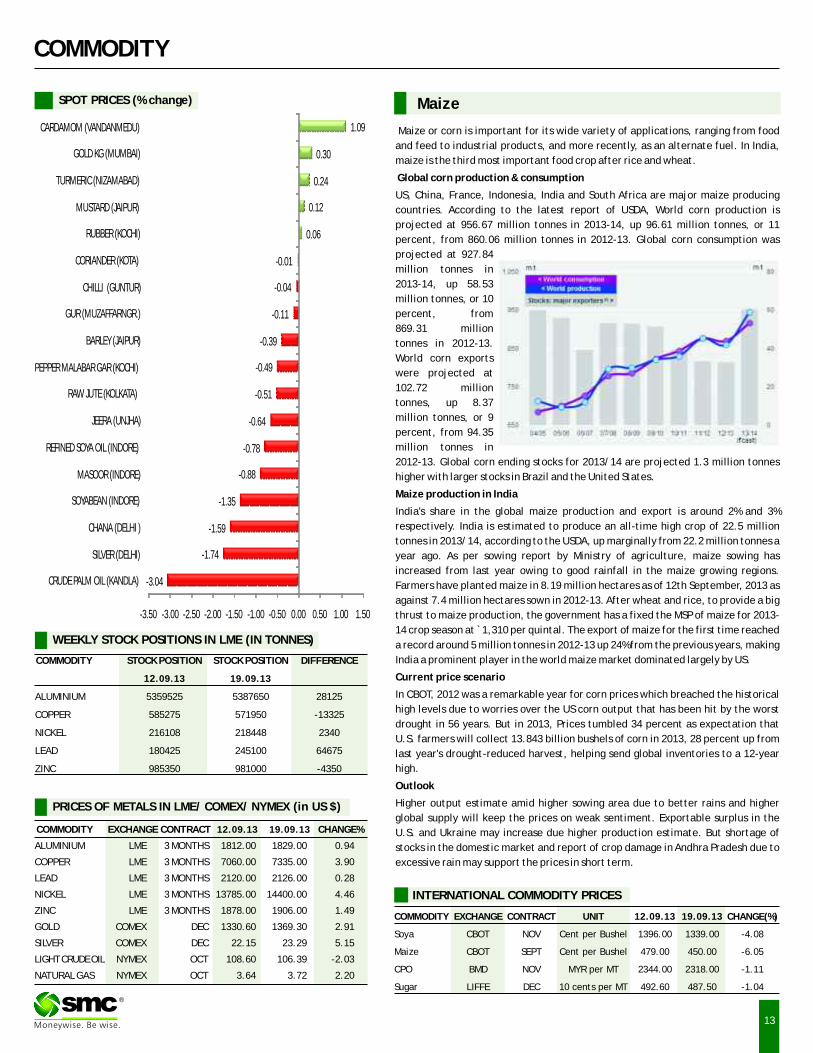
-3.04
-1.74
-1.59
-1.35
-0.88
-0.78
-0.64
-0.51
-0.49
-0.39
-0.11
-0.04
-0.01
0.06
0.12
0.24
0.30
1.09
-3.50 -3.00 -2.50 -2.00 -1.50 -1.00 -0.50 0.00 0.50 1.00 1.50
CRUDE PALM OIL (KANDLA)
SILVER (DELHI)
CHANA (DELHI )
SOYABEAN (INDORE)
MASOOR (INDORE)
REFINED SOYA OIL (INDORE)
JEERA (UNJHA)
RAW JUTE (KOLKATA)
PEPPER MALABAR GAR (KOCHI)
BARLEY (JAIPUR)
GUR (MUZAFFARNGR.)
CHILLI (GUNTUR)
CORIANDER (KOTA)
RUBBER (KOCHI)
MUSTARD (JAIPUR)
TURMERIC (NIZAMABAD)
GOLD KG (MUMBAI)
CARDAMOM (VANDANMEDU)
CURRENCY
Currency Table
Currency Pair Open High Low Close
USD/INR 63.91 64.33 61.90 62.37
EUR/INR 85.23 85.65 82.64 84.51
GBP/INR 101.28 102.20 99.52 100.20
JPY/INR 64.22 64.72 62.76 62.88
(Source: FX Central, Open: Monday 9.00 AM IST, Close: Thursday (5.00 PM IST)
News Flows of last week
19th Sept: U.S. home resales surged in August to a 6-1/2-year high
19th Sept: RBI surprised markets with a hike in the repo rate on Friday
19th Sept: The Reserve Bank of India has relaxed intraday foreign exchange trading position restrictions imposed in June on some banks
19th Sept: U.S. current account narrowed to lowest level in four years
19th Sept: Fed surprises, sticks to stimulus as it cuts growth outlook
18th Sept: U.S. single-family housing starts, permits show recovery on track
17th Sept: The number of U.S. residents living in poverty edged up to 46.5 million last year
EUR/INR (OCT) contract closed at 84.51 on 19th September'13. The contract made its high of `85.65 on 17th September'13 and a low of `82.64 on 19th September'13 (Weekly Basis). The 14-day Exponential Moving Average of the EUR/INR is currently at ̀ 85.62.
On the daily chart, EUR/INR has Relative Strength Index (14-day) value of 44.88. One can buy above 85.50 for a target of 87.00 with the stop loss of 84.80.
`
JPY/INR (OCT) contract closed at 62.88 on 19th September'13. The contract made its high of `64.72 on 17th September'13 and a low of `62.76 on 19th September'13 (Weekly Basis). The 14-day Exponential Moving Average of the JPY/INR is currently at ̀ 64.65.
On the daily chart, JPY/INR has Relative Strength Index (14-day) value of 39.86. One can sell around 63.40 for a target of 62.00 with the stop loss of ̀ 64.00.
`
Market Stance
The week gone by was full of global events as Fed has to take decision on
retaining its stimulus while RBI has to review its monetary policy. However, the
Fed's surprise decision on hold on to its stimulus programme helped the rupee to
surge nearly to one month high. But sharp gains were capped after RBI surprised
markets with a hike in the repo rate on Friday. RBI raised the policy repo rate by
25 basis points (bps) to 7.50 percent. The RBI rolled back some of the steps that
had been imposed to support a currency that had fallen as much as 20 percent to
a record low in late August, reducing the marginal standing facility (MSF) rate by
75 bps to 9.50 percent. Earlier in the mid- July, RBI has lifted the MSF rate to
10.25 percent in order to tighten market liquidity and stabilise the rupee.
EUR/INR
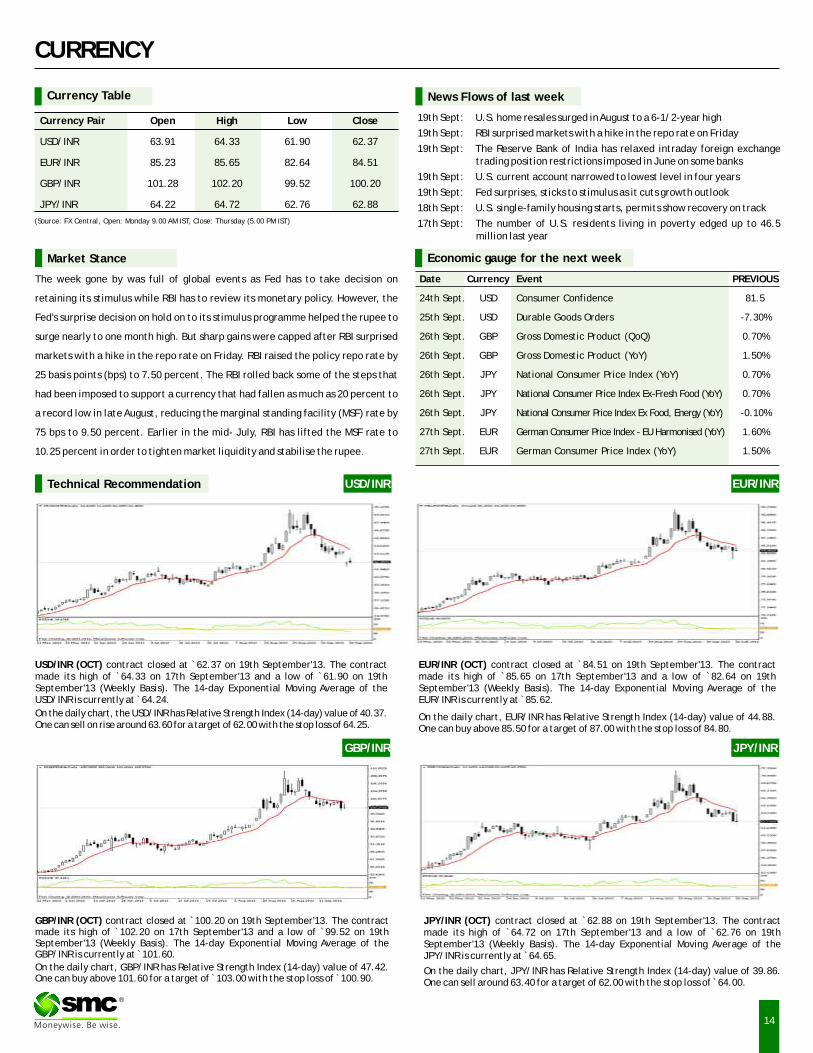
USD/INR (OCT) contract closed at 62.37 on 19th September'13. The contract made its high of `64.33 on 17th September'13 and a low of `61.90 on 19th September'13 (Weekly Basis). The 14-day Exponential Moving Average of the USD/INR is currently at ̀ 64.24.
On the daily chart, the USD/INR has Relative Strength Index (14-day) value of 40.37. One can sell on rise around 63.60 for a target of 62.00 with the stop loss of 64.25.
`
GBP/INR (OCT) contract closed at 100.20 on 19th September'13. The contract made its high of `102.20 on 17th September'13 and a low of `99.52 on 19th September'13 (Weekly Basis). The 14-day Exponential Moving Average of the GBP/INR is currently at ̀ 101.60.
On the daily chart, GBP/INR has Relative Strength Index (14-day) value of 47.42. One can buy above 101.60 for a target of ̀ 103.00 with the stop loss of ̀ 100.90.
`
USD/INRTechnical Recommendation
GBP/INR JPY/INR
14
®
Economic gauge for the next week
Date Currency Event PREVIOUS
24th Sept. USD Consumer Confidence 81.5
25th Sept. USD Durable Goods Orders -7.30%
26th Sept. GBP Gross Domestic Product (QoQ) 0.70%
26th Sept. GBP Gross Domestic Product (YoY) 1.50%
26th Sept. JPY National Consumer Price Index (YoY) 0.70%
26th Sept. JPY National Consumer Price Index Ex-Fresh Food (YoY) 0.70%
26th Sept. JPY National Consumer Price Index Ex Food, Energy (YoY) -0.10%
27th Sept. EUR German Consumer Price Index - EU Harmonised (YoY) 1.60%
27th Sept. EUR German Consumer Price Index (YoY) 1.50%
IPOIPO
INDIAN IPO NEWS
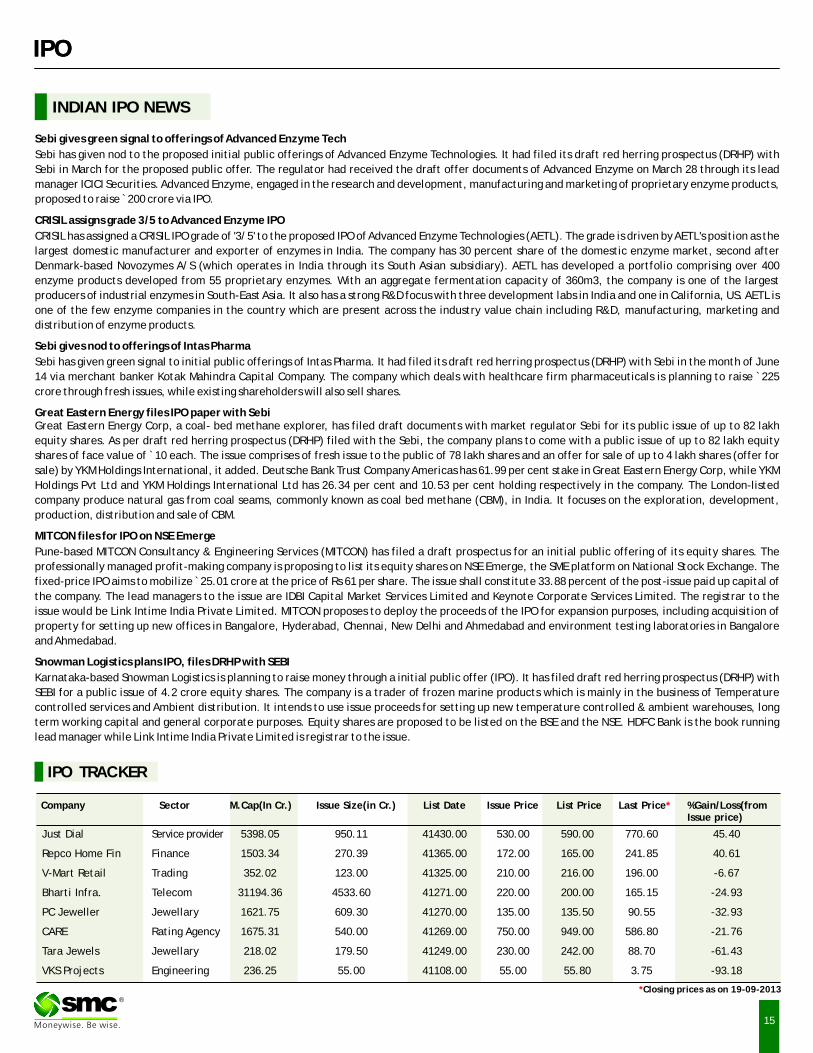
Sebi gives green signal to offerings of Advanced Enzyme Tech
Sebi has given nod to the proposed initial public offerings of Advanced Enzyme Technologies. It had filed its draft red herring prospectus (DRHP) with
Sebi in March for the proposed public offer. The regulator had received the draft offer documents of Advanced Enzyme on March 28 through its lead
manager ICICI Securities. Advanced Enzyme, engaged in the research and development, manufacturing and marketing of proprietary enzyme products,
proposed to raise ̀ 200 crore via IPO.
CRISIL assigns grade 3/5 to Advanced Enzyme IPO
CRISIL has assigned a CRISIL IPO grade of '3/5' to the proposed IPO of Advanced Enzyme Technologies (AETL). The grade is driven by AETL's position as the
largest domestic manufacturer and exporter of enzymes in India. The company has 30 percent share of the domestic enzyme market, second after
Denmark-based Novozymes A/S (which operates in India through its South Asian subsidiary). AETL has developed a portfolio comprising over 400
enzyme products developed from 55 proprietary enzymes. With an aggregate fermentation capacity of 360m3, the company is one of the largest
producers of industrial enzymes in South-East Asia. It also has a strong R&D focus with three development labs in India and one in California, US. AETL is
one of the few enzyme companies in the country which are present across the industry value chain including R&D, manufacturing, marketing and
distribution of enzyme products.
Sebi gives nod to offerings of Intas Pharma
Sebi has given green signal to initial public offerings of Intas Pharma. It had filed its draft red herring prospectus (DRHP) with Sebi in the month of June
14 via merchant banker Kotak Mahindra Capital Company. The company which deals with healthcare firm pharmaceuticals is planning to raise `225
crore through fresh issues, while existing shareholders will also sell shares.
Great Eastern Energy files IPO paper with SebiGreat Eastern Energy Corp, a coal- bed methane explorer, has filed draft documents with market regulator Sebi for its public issue of up to 82 lakh
equity shares. As per draft red herring prospectus (DRHP) filed with the Sebi, the company plans to come with a public issue of up to 82 lakh equity
shares of face value of ̀ 10 each. The issue comprises of fresh issue to the public of 78 lakh shares and an offer for sale of up to 4 lakh shares (offer for
sale) by YKM Holdings International, it added. Deutsche Bank Trust Company Americas has 61.99 per cent stake in Great Eastern Energy Corp, while YKM
Holdings Pvt Ltd and YKM Holdings International Ltd has 26.34 per cent and 10.53 per cent holding respectively in the company. The London-listed
company produce natural gas from coal seams, commonly known as coal bed methane (CBM), in India. It focuses on the exploration, development,
production, distribution and sale of CBM.
MITCON files for IPO on NSE Emerge
Pune-based MITCON Consultancy & Engineering Services (MITCON) has filed a draft prospectus for an initial public offering of its equity shares. The
professionally managed profit-making company is proposing to list its equity shares on NSE Emerge, the SME platform on National Stock Exchange. The
fixed-price IPO aims to mobilize ̀ 25.01 crore at the price of Rs 61 per share. The issue shall constitute 33.88 percent of the post-issue paid up capital of
the company. The lead managers to the issue are IDBI Capital Market Services Limited and Keynote Corporate Services Limited. The registrar to the
issue would be Link Intime India Private Limited. MITCON proposes to deploy the proceeds of the IPO for expansion purposes, including acquisition of
property for setting up new offices in Bangalore, Hyderabad, Chennai, New Delhi and Ahmedabad and environment testing laboratories in Bangalore
and Ahmedabad.
Snowman Logistics plans IPO, files DRHP with SEBI
Karnataka-based Snowman Logistics is planning to raise money through a initial public offer (IPO). It has filed draft red herring prospectus (DRHP) with
SEBI for a public issue of 4.2 crore equity shares. The company is a trader of frozen marine products which is mainly in the business of Temperature
controlled services and Ambient distribution. It intends to use issue proceeds for setting up new temperature controlled & ambient warehouses, long
term working capital and general corporate purposes. Equity shares are proposed to be listed on the BSE and the NSE. HDFC Bank is the book running
lead manager while Link Intime India Private Limited is registrar to the issue.
®
IPO TRACKER
*Closing prices as on 19-09-2013
Company Sector M.Cap(In Cr.) Issue Size(in Cr.) List Date Issue Price List Price Last Price %Gain/Loss(from Issue price)
*
Just Dial Service provider 5398.05 950.11 41430.00 530.00 590.00 770.60 45.40
Repco Home Fin Finance 1503.34 270.39 41365.00 172.00 165.00 241.85 40.61
V-Mart Retail Trading 352.02 123.00 41325.00 210.00 216.00 196.00 -6.67
Bharti Infra. Telecom 31194.36 4533.60 41271.00 220.00 200.00 165.15 -24.93
PC Jeweller Jewellary 1621.75 609.30 41270.00 135.00 135.50 90.55 -32.93
CARE Rating Agency 1675.31 540.00 41269.00 750.00 949.00 586.80 -21.76
Tara Jewels Jewellary 218.02 179.50 41249.00 230.00 242.00 88.70 -61.43
VKS Projects Engineering 236.25 55.00 41108.00 55.00 55.80 3.75 -93.18
15
®
MUTUAL FUND
NEWS
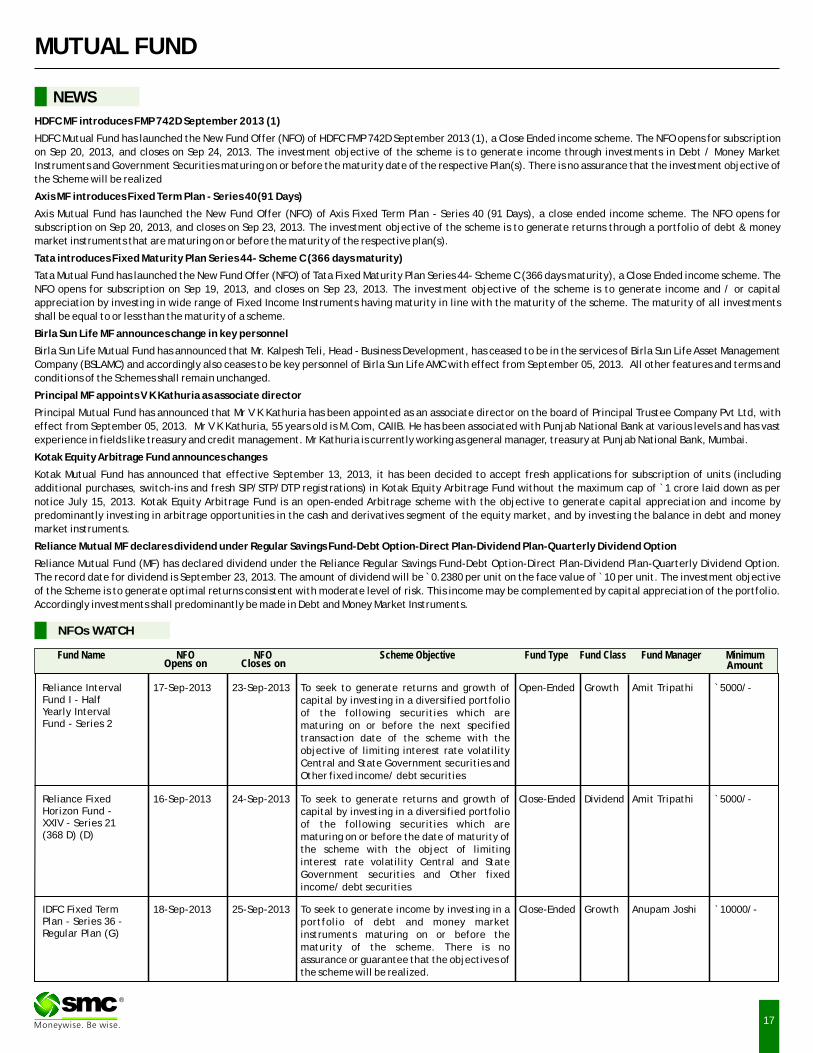
HDFC MF introduces FMP 742D September 2013 (1)
HDFC Mutual Fund has launched the New Fund Offer (NFO) of HDFC FMP 742D September 2013 (1), a Close Ended income scheme. The NFO opens for subscription
on Sep 20, 2013, and closes on Sep 24, 2013. The investment objective of the scheme is to generate income through investments in Debt / Money Market
Instruments and Government Securities maturing on or before the maturity date of the respective Plan(s). There is no assurance that the investment objective of
the Scheme will be realized
Axis MF introduces Fixed Term Plan - Series 40(91 Days)
Axis Mutual Fund has launched the New Fund Offer (NFO) of Axis Fixed Term Plan - Series 40 (91 Days), a close ended income scheme. The NFO opens for
subscription on Sep 20, 2013, and closes on Sep 23, 2013. The investment objective of the scheme is to generate returns through a portfolio of debt & money
market instruments that are maturing on or before the maturity of the respective plan(s).
Tata introduces Fixed Maturity Plan Series 44- Scheme C (366 days maturity)
Tata Mutual Fund has launched the New Fund Offer (NFO) of Tata Fixed Maturity Plan Series 44- Scheme C (366 days maturity), a Close Ended income scheme. The
NFO opens for subscription on Sep 19, 2013, and closes on Sep 23, 2013. The investment objective of the scheme is to generate income and / or capital
appreciation by investing in wide range of Fixed Income Instruments having maturity in line with the maturity of the scheme. The maturity of all investments
shall be equal to or less than the maturity of a scheme.
Birla Sun Life MF announces change in key personnel
Birla Sun Life Mutual Fund has announced that Mr. Kalpesh Teli, Head - Business Development, has ceased to be in the services of Birla Sun Life Asset Management
Company (BSLAMC) and accordingly also ceases to be key personnel of Birla Sun Life AMC with effect from September 05, 2013. All other features and terms and
conditions of the Schemes shall remain unchanged.
Principal MF appoints V K Kathuria as associate director
Principal Mutual Fund has announced that Mr V K Kathuria has been appointed as an associate director on the board of Principal Trustee Company Pvt Ltd, with
effect from September 05, 2013. Mr V K Kathuria, 55 years old is M.Com, CAIIB. He has been associated with Punjab National Bank at various levels and has vast
experience in fields like treasury and credit management. Mr Kathuria is currently working as general manager, treasury at Punjab National Bank, Mumbai.
Kotak Equity Arbitrage Fund announces changes
Kotak Mutual Fund has announced that effective September 13, 2013, it has been decided to accept fresh applications for subscription of units (including
additional purchases, switch-ins and fresh SIP/STP/DTP registrations) in Kotak Equity Arbitrage Fund without the maximum cap of `1 crore laid down as per
notice July 15, 2013. Kotak Equity Arbitrage Fund is an open-ended Arbitrage scheme with the objective to generate capital appreciation and income by
predominantly investing in arbitrage opportunities in the cash and derivatives segment of the equity market, and by investing the balance in debt and money
market instruments.
Reliance Mutual MF declares dividend under Regular Savings Fund-Debt Option-Direct Plan-Dividend Plan-Quarterly Dividend Option
Reliance Mutual Fund (MF) has declared dividend under the Reliance Regular Savings Fund-Debt Option-Direct Plan-Dividend Plan-Quarterly Dividend Option.
The record date for dividend is September 23, 2013. The amount of dividend will be ̀ 0.2380 per unit on the face value of ̀ 10 per unit. The investment objective
of the Scheme is to generate optimal returns consistent with moderate level of risk. This income may be complemented by capital appreciation of the portfolio.
Accordingly investments shall predominantly be made in Debt and Money Market Instruments.
17
®
NFOs WATCH
Fund Name NFO NFO Scheme Objective Fund Type Fund Class Fund Manager MinimumOpens on Closes on Amount
16-Sep-2013 24-Sep-2013 Close-Ended Dividend `5000/-Reliance Fixed Horizon Fund - XXIV - Series 21 (368 D) (D)
Amit TripathiTo seek to generate returns and growth of capital by investing in a diversified portfolio of the following securities which are maturing on or before the date of maturity of the scheme with the object of limiting interest rate volatility Central and State Government securities and Other fixed income/ debt securities
17-Sep-2013 23-Sep-2013 Open-Ended Growth `5000/-Reliance Interval Fund I - Half Yearly Interval Fund - Series 2
Amit TripathiTo seek to generate returns and growth of capital by investing in a diversified portfolio of the following securities which are maturing on or before the next specified transaction date of the scheme with the objective of limiting interest rate volatility Central and State Government securities and Other fixed income/ debt securities
18-Sep-2013 25-Sep-2013 Close-Ended Growth `10000/-IDFC Fixed Term Plan - Series 36 - Regular Plan (G)
Anupam JoshiTo seek to generate income by investing in a portfolio of debt and money market instruments maturing on or before the maturity of the scheme. There is no assurance or guarantee that the objectives of the scheme will be realized.
18
MUTUAL FUND Performance Charts
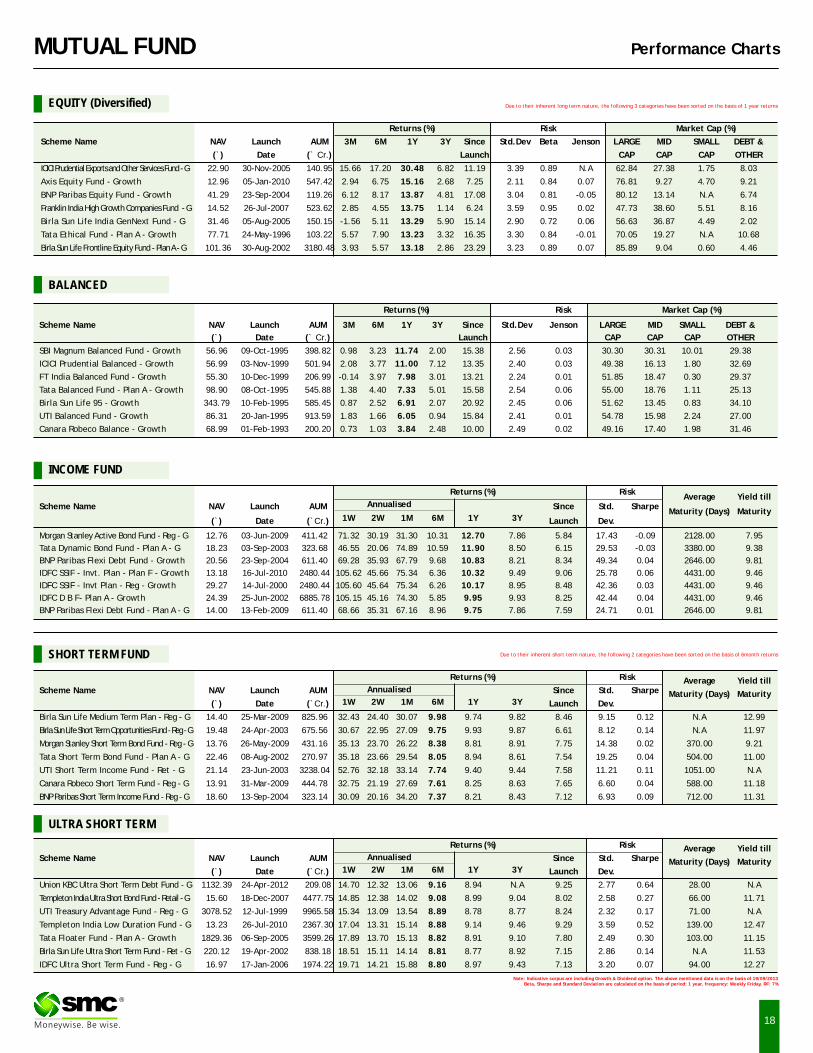
Returns (%) Risk Market Cap (%)
Scheme Name NAV Launch AUM 3M 6M 1Y 3Y Since Std.Dev Beta Jenson LARGE MID SMALL DEBT &
(`) Date (` Cr.) Launch CAP CAP CAP OTHER
ICICI Prudential Exports and Other Services Fund - G 22.90 30-Nov-2005 140.95 15.66 17.20 30.48 6.82 11.19 3.39 0.89 N.A 62.84 27.38 1.75 8.03
Axis Equity Fund - Growth 12.96 05-Jan-2010 547.42 2.94 6.75 15.16 2.68 7.25 2.11 0.84 0.07 76.81 9.27 4.70 9.21
BNP Paribas Equity Fund - Growth 41.29 23-Sep-2004 119.26 6.12 8.17 13.87 4.81 17.08 3.04 0.81 -0.05 80.12 13.14 N.A 6.74
Franklin India High Growth Companies Fund - G 14.52 26-Jul-2007 523.62 2.85 4.55 13.75 1.14 6.24 3.59 0.95 0.02 47.73 38.60 5.51 8.16
Birla Sun Life India GenNext Fund - G 31.46 05-Aug-2005 150.15 -1.56 5.11 13.29 5.90 15.14 2.90 0.72 0.06 56.63 36.87 4.49 2.02
Tata Ethical Fund - Plan A - Growth 77.71 24-May-1996 103.22 5.57 7.90 13.23 3.32 16.35 3.30 0.84 -0.01 70.05 19.27 N.A 10.68
Birla Sun Life Frontline Equity Fund - Plan A - G 101.36 30-Aug-2002 3180.48 3.93 5.57 13.18 2.86 23.29 3.23 0.89 0.07 85.89 9.04 0.60 4.46
EQUITY (Diversified)
BALANCED
INCOME FUND
Note: Indicative corpus are including Growth & Dividend option. The above mentioned data is on the basis of 19/09/2013Beta, Sharpe and Standard Deviation are calculated on the basis of period: 1 year, frequency: Weekly Friday, RF: 7%
ULTRA SHORT TERM
SHORT TERM FUND
Due to their inherent long term nature, the following 3 categories have been sorted on the basis of 1 year returns
Due to their inherent short term nature, the following 2 categories have been sorted on the basis of 6month returns
Returns (%) Risk Market Cap (%)
Scheme Name NAV Launch AUM 3M 6M 1Y 3Y Since Std.Dev Jenson LARGE MID SMALL DEBT &
(`) Date (` Cr.) Launch CAP CAP CAP OTHER
SBI Magnum Balanced Fund - Growth 56.96 09-Oct-1995 398.82 0.98 3.23 11.74 2.00 15.38 2.56 0.03 30.30 30.31 10.01 29.38
ICICI Prudential Balanced - Growth 56.99 03-Nov-1999 501.94 2.08 3.77 11.00 7.12 13.35 2.40 0.03 49.38 16.13 1.80 32.69
FT India Balanced Fund - Growth 55.30 10-Dec-1999 206.99 -0.14 3.97 7.98 3.01 13.21 2.24 0.01 51.85 18.47 0.30 29.37
Tata Balanced Fund - Plan A - Growth 98.90 08-Oct-1995 545.88 1.38 4.40 7.33 5.01 15.58 2.54 0.06 55.00 18.76 1.11 25.13
Birla Sun Life 95 - Growth 343.79 10-Feb-1995 585.45 0.87 2.52 6.91 2.07 20.92 2.45 0.06 51.62 13.45 0.83 34.10
UTI Balanced Fund - Growth 86.31 20-Jan-1995 913.59 1.83 1.66 6.05 0.94 15.84 2.41 0.01 54.78 15.98 2.24 27.00
Canara Robeco Balance - Growth 68.99 01-Feb-1993 200.20 0.73 1.03 3.84 2.48 10.00 2.49 0.02 49.16 17.40 1.98 31.46
Returns (%) RiskAverage Yield till
Scheme Name NAV Launch AUM Since Std. SharpeMaturity (Days) Maturity
1W 2W 1M 6M 1Y 3Y(`) Date (`Cr.) Launch Dev.
Morgan Stanley Active Bond Fund - Reg - G 12.76 03-Jun-2009 411.42 71.32 30.19 31.30 10.31 12.70 7.86 5.84 17.43 -0.09 2128.00 7.95
Tata Dynamic Bond Fund - Plan A - G 18.23 03-Sep-2003 323.68 46.55 20.06 74.89 10.59 11.90 8.50 6.15 29.53 -0.03 3380.00 9.38
BNP Paribas Flexi Debt Fund - Growth 20.56 23-Sep-2004 611.40 69.28 35.93 67.79 9.68 10.83 8.21 8.34 49.34 0.04 2646.00 9.81
IDFC SSIF - Invt. Plan - Plan F - Growth 13.18 16-Jul-2010 2480.44 105.62 45.66 75.34 6.36 10.32 9.49 9.06 25.78 0.06 4431.00 9.46
IDFC SSIF - Invt Plan - Reg - Growth 29.27 14-Jul-2000 2480.44 105.60 45.64 75.34 6.26 10.17 8.95 8.48 42.36 0.03 4431.00 9.46
IDFC D B F- Plan A - Growth 24.39 25-Jun-2002 6885.78 105.15 45.16 74.30 5.85 9.95 9.93 8.25 42.44 0.04 4431.00 9.46
BNP Paribas Flexi Debt Fund - Plan A - G 14.00 13-Feb-2009 611.40 68.66 35.31 67.16 8.96 9.75 7.86 7.59 24.71 0.01 2646.00 9.81
Annualised
Returns (%) Risk Average Yield tillScheme Name NAV Launch AUM Since Std. Sharpe Maturity (Days) Maturity
1W 2W 1M 6M 1Y 3Y(`) Date (`Cr.) Launch Dev.
Birla Sun Life Medium Term Plan - Reg - G 14.40 25-Mar-2009 825.96 32.43 24.40 30.07 9.98 9.74 9.82 8.46 9.15 0.12 N.A 12.99
Birla Sun Life Short Term Opportunities Fund - Reg - G 19.48 24-Apr-2003 675.56 30.67 22.95 27.09 9.75 9.93 9.87 6.61 8.12 0.14 N.A 11.97
Morgan Stanley Short Term Bond Fund - Reg - G 13.76 26-May-2009 431.16 35.13 23.70 26.22 8.38 8.81 8.91 7.75 14.38 0.02 370.00 9.21
Tata Short Term Bond Fund - Plan A - G 22.46 08-Aug-2002 270.97 35.18 23.66 29.54 8.05 8.94 8.61 7.54 19.25 0.04 504.00 11.00
UTI Short Term Income Fund - Ret - G 21.14 23-Jun-2003 3238.04 52.76 32.18 33.14 7.74 9.40 9.44 7.58 11.21 0.11 1051.00 N.A
Canara Robeco Short Term Fund - Reg - G 13.91 31-Mar-2009 444.78 32.75 21.19 27.69 7.61 8.25 8.63 7.65 6.60 0.04 588.00 11.18
BNP Paribas Short Term Income Fund - Reg - G 18.60 13-Sep-2004 323.14 30.09 20.16 34.20 7.37 8.21 8.43 7.12 6.93 0.09 712.00 11.31
Annualised
Returns (%) Risk Average Yield tillScheme Name NAV Launch AUM Since Std. Sharpe Maturity (Days) Maturity
1W 2W 1M 6M 1Y 3Y(`) Date (`Cr.) Launch Dev.
Union KBC Ultra Short Term Debt Fund - G 1132.39 24-Apr-2012 209.08 14.70 12.32 13.06 9.16 8.94 N.A 9.25 2.77 0.64 28.00 N.A
Templeton India Ultra Short Bond Fund - Retail - G 15.60 18-Dec-2007 4477.75 14.85 12.38 14.02 9.08 8.99 9.04 8.02 2.58 0.27 66.00 11.71
UTI Treasury Advantage Fund - Reg - G 3078.52 12-Jul-1999 9965.58 15.34 13.09 13.54 8.89 8.78 8.77 8.24 2.32 0.17 71.00 N.A
Templeton India Low Duration Fund - G 13.23 26-Jul-2010 2367.30 17.04 13.31 15.14 8.88 9.14 9.46 9.29 3.59 0.52 139.00 12.47
Tata Floater Fund - Plan A - Growth 1829.36 06-Sep-2005 3599.26 17.89 13.70 15.13 8.82 8.91 9.10 7.80 2.49 0.30 103.00 11.15
Birla Sun Life Ultra Short Term Fund - Ret - G 220.12 19-Apr-2002 838.18 18.51 15.11 14.14 8.81 8.77 8.92 7.15 2.86 0.14 N.A 11.53
IDFC Ultra Short Term Fund - Reg - G 16.97 17-Jan-2006 1974.22 19.71 14.21 15.88 8.80 8.97 9.43 7.13 3.20 0.07 94.00 12.27
Annualised
®

Mr S C Aggarwal, Chairman & MD, SMC Group during '8th Public procurement Summit' organized by ASSOCHAM at New Delhi.
Mr S C Aggarwal, Chairman & MD, SMC Group during '9th Annual Banking Summit cum Social Banking Excellence Awards 2013' organized by ASSOCHAM at New Delhi.