Embed Size (px)
Citation preview

WISE M NEY
Bra
nd
sm
c 2
54
2014: Issue 431, Week: 14th - 17th JulyA Weekly Update from SMC
(For private circulation only)
(Saurabh Jain)
Contents
Equity 4-7
Derivatives 8-9
Commodity 10-13
Currency 14
IPO 15
Fixed Deposit 16
Mutual Fund 17-18
EDITORIAL STAFF
Editor Saurabh Jain
Executive Editor Jagannadham Thunuguntla
+Editorial Team
Dr. R.P. Singh Nitin Murarka
Vandana Bharti Sandeep Joon
Dinesh Joshi Vineet Sood
Shitij Gandhi Dhirender Singh Bisht
Subhranil Dey Parminder Chauhan
Ajay Lakra Mudit Goyal
Content Editor Kamla Devi
Graphic Designer Pramod Chhimwal
Research Executive Sonia Bamba
REGISTERED OFFICES:
11 / 6B, Shanti Chamber, Pusa Road, New Delhi 110005.
Tel: 91-11-30111000, Fax: 91-11-25754365
MUMBAI OFFICE:
Dheeraj Sagar, 1st Floor, Opp. Goregaon sports Club, Link Road
Malad (West), Mumbai 400064
Tel: 91-22-67341600, Fax: 91-22-28805606
KOLKATA OFFICE:
18,Rabindra Sarani, Poddar Court, Gate No-4,
5th Floor, Kolkata-700001
Tel : 91-33-39847000 Fax No : 91-33-39847004
AHMEDABAD OFFICE :
10/A, 4th Floor, Kalapurnam Building, Near Municipal Market,
C G Road, Ahmedabad-380009, Gujarat
Tel : 91-79-26424801 - 05, 40049801 - 03
CHENNAI OFFICE:
Salzburg Square, Flat No.1, III rd Floor, Door No.107, Harrington Road,
Chetpet, Chennai - 600031.
Tel: 044-39109100, Fax -044- 39109111
SECUNDERABAD OFFICE:
206, 3rd Floor, above CMR Exclusive, Bhuvana Towers, S.D.Road,
Secunderabad - 500003
Tel: 91-40-30780298/99, 39109536
DUBAI OFFICE:
312, Belshalat Building, Al Karama, Dubai, P.O. Box 117210, U.A.E.
Tel: 97143963120, Mobile : 971502612483
Fax : 9714 3963122
Email ID : [email protected]
Printed and Published on behalf of
Mr. Saurabh Jain @ Publication Address
11/6B, Shanti Chamber, Pusa Road, New Delhi-110005
Website: www.smcindiaonline.com
Investor Grievance : [email protected]
Printed at: S&S MARKETING
102, Mahavirji Complex LSC-3, Rishabh Vihar, New Delhi - 110092 (India)
Ph.: +91-11- 43035012, 43035014, Email: [email protected]
tock market globally came off during the week on some concerns pertaining
to some financial risks in Portugal and concerns over Iraq. U.S. Federal SReserve minutes released during the week showed that the policy makers
agreed to end the bond purchase program by the end of October this year.
Meanwhile recovery in job market, housing, etc is also fueling expectations that
interest rates may begin to rise earlier than expected. European Central Bank (ECB)
chief Mario Draghi once again reiterated that the extraordinary measures it enacted
a month ago would work their way through the economy before deciding whether
additional action was needed to bolster growth and keep deflation at bay. China's
exports rose 7.2% for the month of June coming lower than the expectations of
10.4%. In Japan, effects of sales tax hike can be seen in the form of lower machinery
orders that fell to record in the month of May largely reflecting lower external
demand.
Back at home, Prime Minster Narendra Modi led government presented its maiden
budget. Finance Minster Mr. Arun Jaitely keeping fiscal deficit target of 4.1% for the
current fiscal year presented the pragmatic budget. To spur growth, he relaxed cap
in foreign direct investment in defense and insurance and simultaneously
announced plans to revive growth that included highways, airports, ports, etc.
Indian equities saw some selling during the second half of the week after budget
announcements were made. With monsoon concerns haunting the economy,
investors are sensing inflation to inch up which could jeopardize the relaxation in
the monetary policy by Reserve Bank of India. Rains for the week 3rd July – 9th July
were short to the extent of 41% of the long period average against the expectation
of Indian Meteorological Department. Selling may continue in the Indian stock
markets in the next week while stock specific activity cannot be ruled out.
Commodities market turned bearish from past two weeks on strength in dollar index
and some sluggish indications. Geopolitical picture isn't as volatile as it once was,
leading to melting crude prices. Base metals were down on profit booking except
zinc which continued its magical upside on tight inventories. Back at home, first
budget of Modi government brought cheers on farmer's face but it was dovish for
commodity futures market and bullion market. Jaitley kept the import duty on gold
unchanged at 10% and maintained the rule requiring shippers to supply 20% of their
cargo to jewelers for re-export. This has led to bullion prices jumps to multi week
high. India, which represented about 25% of global demand in 2013, raised the tax
three times last year and linked purchases to re-exports. CPI of UK, EU, Canada and
New Zealand, Advance Retail Sales of US, Bank of Canada Rate Decision, University
of Michigan Confidence etc. are some very important data points and events which
may give some crucial impact on the prices of commodities.
From The Desk Of Editor
NEWS
DOMESTIC NEWSEconomy•India's Finance Minister Arun Jaitley said in his maiden budget statement,
India's fiscal deficit is estimated to narrow to 3.6 percent of gross domestic product in 2015-16 and then to 3 percent in 2016-17. The fiscal deficit for FY 2015 is estimated at 4.1 percent of GDP. But the minister said achieving this target is challenging. India aims to achieve 7-8 percent economic growth in the next three to four years.
Automobile•Tata Motors is looking at launching a couple of models each year till 2020
as the company looks to ramp up its portfolio in the competitive Indian car market. The new vehicles will also cater to global markets and service various attractive segments.
•Mahindra & Mahindra (M&M) is planning to start supply of new engines & transmissions to Original Equipment Manufacturers (OEMs). The company, which has merged Mahindra Powerol with New Powertrain Division, has set up new Power-train division. This new division would manufacture transmission and automotive engines.
Textile•Arvind is planning to increase its borrowing limit to `5,000 crore in order
to fund expansion activities as well as for future business requirements.Pharmaceuticals•Piramal Enterprises has earmarked `5,000 crore ($837 million) for
projects, which have been jeopardized by an economy struggling through its longest period of sub-5% growth since the 1980s.
•Cipla, in collaboration with the UK government, has expressed its intention to make investments of up to 100 million pounds in its UK subsidiary over the next few years. The investments are expected to facilitate the launch of a range of products in the area of respiratory, oncology and antiretroviral medicines to further Cipla's higher purpose of universal affordable access.
•Glenmark Pharmaceuticals will launch generic version of anti-hypertension drug telmisartan tablets in the US market following receipt of approval from the country's health regulator.
Diamonds, Gems & Jewellery•Rajesh Exports has bagged an export order worth ̀ 1,260 crore of designer range
of gold and diamond studded jewellery and medallions from A1 Jameelat Jewellery, UAE. The order is to be completed by September 30, 2014.
Power•Neyveli Lignite Corporation (NLC), the public sector lignite mining and
power generation enterprise owned new thermal power stations in state of Tamil Nadu would generate additional 1,500 MW power within five months. The four new thermal units with a capacity of 1,500 MW will be commissioned at Neyveli and Tuticorin.
•NTPC is expected to commence work on the first unit of the proposed 4,000 mw (5x800) power plant at Ramagundam in Telangana immediately.
Information Technology•Tech Mahindra has signed a Memorandum of Understanding (MoU) with the
Dubai Economic Council (DEC) for providing innovative IT solutions to help achieve the status of 'Smart City'. The DEC seeks to benefit from the private sectors' spectacular experience in smart technologies to help connect not only Dubai's community but also the UAE and the world.
Power•Tata Power is planning to export fly-ash from its 4,000-MW Mundra plant to
West Asia. The plant consumes about 40,000 tonnes of imported coal per day. The ash content, consequent to the burning of fuel, is 4% or about 1,600 tonnes per day. The company is looking to despatch a minimum quantity of 30,000-40,000 tonnes annually. Currently, four companies in Qatar are interested in lifting the fly-ash from the company.
INTERNATIONAL NEWS•US Federal Reserve plans to completely unwind its asset purchase plan in
October as long the economy continues to pick up. The Federal Open Market Committee has reduced bond purchases by $10 billion at each meeting since December, and will end by cutting $15 billion in October.
•US consumer credit increased by $19.6 billion in May after surging up by a revised $26.1 billion in April. Economists had expected credit to increase by about $20.0 billion compared to the $26.8 billion jump originally reported for the previous month.
•US non-manufacturing index edged down to 56.0 in June from 56.3 in May, although a reading above 50 indicates continued growth in the service sector. Economists had been expecting the index to come in unchanged.
•China posted a merchandise trade surplus of $31.6 billion in June. That missed forecasts for a surplus of $36.95 billion, and was down from $35.92 billion in May. Exports were up 7.2 percent on year - also missing expectations for 10.4 percent but up from 7.0 percent in the previous month. Imports gained an annual 5.5 percent versus forecasts for 6.0 percent following the 1.6 percent decline a month earlier.
•Japan consumer confidence index rose to 41.1 in June from 39.3 in May, with all the sub-indices contributing positively to the overall index. This marked the highest level of confidence since December 2013.
EX-DATE SYMBOL PURPOSE
14-JUL-14 COROMANDEL DIVIDEND RS.4.50 PER SHARE14-JUL-14 TATASTEEL DIVIDEND - RS.10/- PER ORDINARY SHARE15-JUL-14 TITAN DIVIDEND - RS 2.10/- PER SHARE15-JUL-14 DBCORP FINAL DIVIDEND - RS 4.25/- PER SHARE16-JUL-14 MPHASIS DIVIDEND - RS 7/- PER SHARE17-JUL-14 IDFC DIVIDEND @ RS.2.60 PER SHARE17-JUL-14 M&M DIVIDEND - RS 13.50/- PER SHARE +
SPECIAL DIVIDEND - RE 0.50/- PER SHARE18-JUL-14 GREAVESCOT FINAL DIVIDEND - RE 0.60/- PER SHARE18-JUL-14 L&TFH DIVIDEND - RE 0.75/- PER SHARE21-JUL-14 WIPRO FINAL DIVIDEND- RS.5/- PER SHARE 22-JUL-14 PRAJIND DIVIDEND - RS 1.62/- PER SHARE23-JUL-14 TATAPOWER DIVIDEND - RS.1.25 PER SHARE24-JUL-14 TAJGVK DIVIDEND - RE 0.20/- PER SHARE
MEETING DATE SYMBOL PURPOSE
14-JUL-14 DCBBANK RESULTS16-JUL-14 KOTAKBANK RESULTS16-JUL-14 FEDERALBNK RESULTS16-JUL-14 BAJFINANCE RESULTS17-JUL-14 TCS RESULTS/DIVIDEND17-JUL-14 BAJAJ-AUTO RESULTS18-JUL-14 ZEEL RESULTS19-JUL-14 ULTRACEMCO RESULTS21-JUL-14 EXIDEIND RESULTS22-JUL-14 INGVYSYABK RESULTS22-JUL-14 KPIT RESULTS22-JUL-14 HEXAWARE RESULTS/DIVIDEND22-JUL-14 AXISBANK RESULTS23-JUL-14 CAIRN RESULTS23-JUL-14 JSWENERGY RESULTS
FORTHCOMING EVENTS
NOTES:
1) These levels should not be confused with the daily trend sheet, which is sent every morning by e-mail in the name
of "Morning Mantra ".
2) Sometimes you will find the stop loss to be too far but if we change the stop loss once, we will find more strength
coming into the stock. At the moment, the stop loss will be far as we are seeing the graphs on weekly basis and
taking a long-term view and not a short-term view.
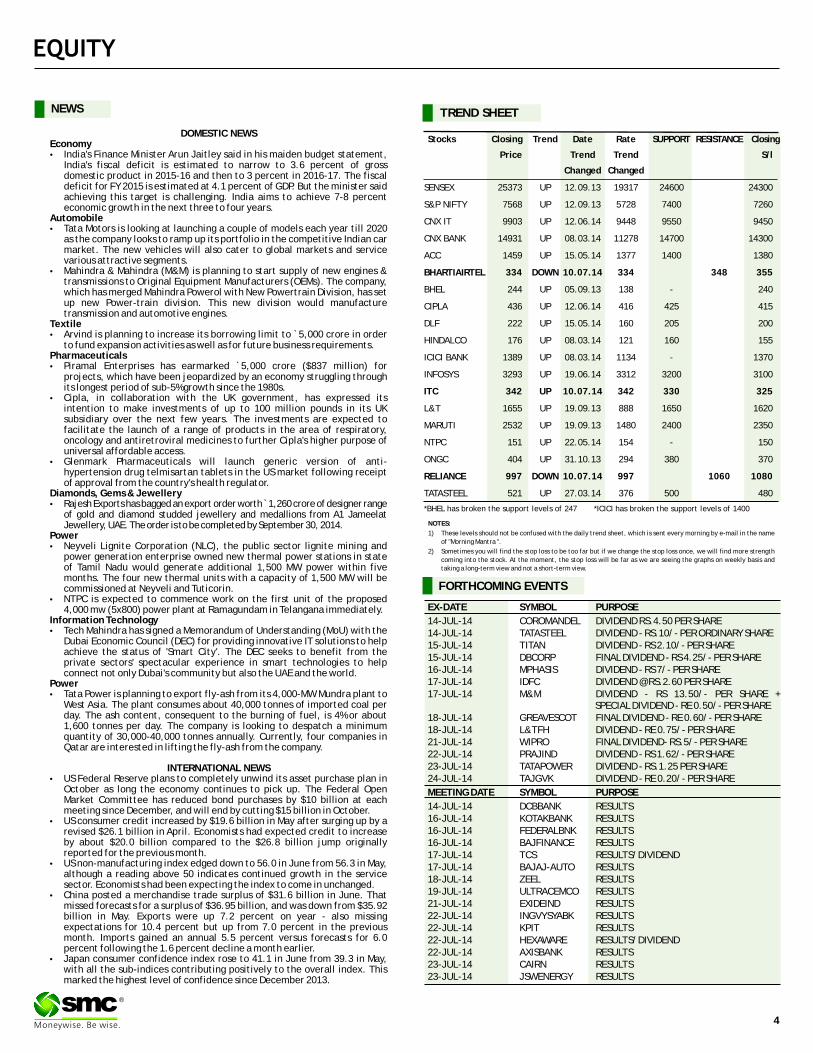
TREND SHEET
Stocks Closing Trend Date Rate SUPPORT RESISTANCE Closing
Price Trend Trend
Changed Changed
SENSEX 25373 UP 12.09.13 19317 24600 24300
S&P NIFTY 7568 UP 12.09.13 5728 7400 7260
CNX IT 9903 UP 12.06.14 9448 9550 9450
CNX BANK 14931 UP 08.03.14 11278 14700 14300
ACC 1459 UP 15.05.14 1377 1400 1380
BHARTIAIRTEL 334 DOWN 10.07.14 334 348 355
BHEL 244 UP 05.09.13 138 - 240
CIPLA 436 UP 12.06.14 416 425 415
DLF 222 UP 15.05.14 160 205 200
HINDALCO 176 UP 08.03.14 121 160 155
ICICI BANK 1389 UP 08.03.14 1134 - 1370
INFOSYS 3293 UP 19.06.14 3312 3200 3100
ITC 342 UP 10.07.14 342 330 325
L&T 1655 UP 19.09.13 888 1650 1620
MARUTI 2532 UP 19.09.13 1480 2400 2350
NTPC 151 UP 22.05.14 154 - 150
ONGC 404 UP 31.10.13 294 380 370
RELIANCE 997 DOWN 10.07.14 997 1060 1080
TATASTEEL 521 UP 27.03.14 376 500 480
S/l
4
®
*BHEL has broken the support levels of 247 *ICICI has broken the support levels of 1400
BSE SENSEX GAINERS & LOSERS TOP (% Change) NSE NIFTY GAINERS TOP & LOSERS (% Change)
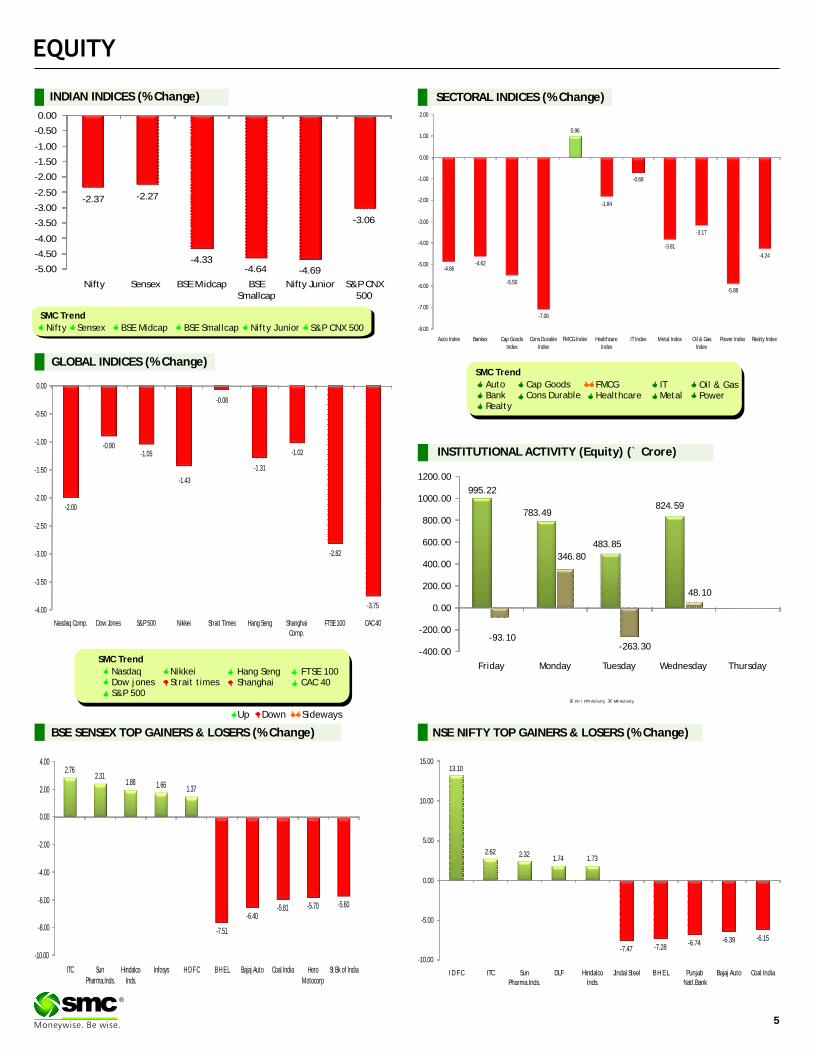
SECTORAL INDICES (% Change)
SMC Trend
SMC Trend
FMCGHealthcare
FTSE 100CAC 40
Auto BankRealty
Cap GoodsCons Durable
Oil & GasPower
NasdaqDow jonesS&P 500
NikkeiStrait times
Hang SengShanghai
ITMetal
Down SidewaysUp
SMC Trend
Nifty BSE Midcap S&P CNX 500
GLOBAL INDICES (% Change)
INDIAN INDICES (% Change)
BSE SmallcapSensex Nifty Junior
5
®
-93.10-263.30
995.22
783.49
483.85
824.59
346.80
48.10
-400.00
-200.00
0.00
200.00
400.00
600.00
800.00
1000.00
1200.00
Friday Monday Tuesday Wednesday Thursday
FII / FPI Activity MF Activity
INSTITUTIONAL ACTIVITY (Equity) (` Crore)
2.762.31
1.88 1.66 1.37
-7.51
-6.40-5.81 -5.70 -5.60
-10.00
-8.00
-6.00
-4.00
-2.00
0.00
2.00
4.00
ITC Sun Pharma.Inds.
Hindalco Inds.
Infosys H D F C B H E L Bajaj Auto Coal India Hero Motocorp
St Bk of India
13.10
2.62 2.321.74 1.73
-7.47 -7.28-6.74 -6.39 -6.15
-10.00
-5.00
0.00
5.00
10.00
15.00
I D F C ITC Sun Pharma.Inds.
DLF Hindalco Inds.
Jindal Steel B H E L Punjab Natl.Bank
Bajaj Auto Coal India
-2.37 -2.27
-4.33-4.64 -4.69
-3.06
-5.00
-4.50
-4.00
-3.50
-3.00
-2.50
-2.00
-1.50
-1.00
-0.50
0.00
Nifty Sensex BSE Midcap BSE Smallcap
Nifty Junior S&P CNX 500
-2.00
-0.90-1.05
-1.43
-0.08
-1.31
-1.02
-2.82
-3.75-4.00
-3.50
-3.00
-2.50
-2.00
-1.50
-1.00
-0.50
0.00
Nasdaq Comp. Dow Jones S&P 500 Nikkei Strait Times Hang Seng Shanghai Comp.
FTSE 100 CAC 40
-4.86-4.62
-5.50
-7.06
0.96
-1.84
-3.81
-3.17
-5.88
-4.24
-8.00
-7.00
-6.00
-5.00
-4.00
-3.00
-2.00
-1.00
0.00
1.00
2.00
Auto Index Bankex Cap Goods Index
Cons Durable Index
FMCG Index Healthcare Index
IT Index Metal Index Oil & Gas Index
Power Index Realty Index
-0.68
Beat the street - Fundamental Analysis
Above calls are recommended with a time horizon of 1 year. Source: Company Website Reuters Capitaline
VALUE PARAMETERS
% OF SHARE HOLDING
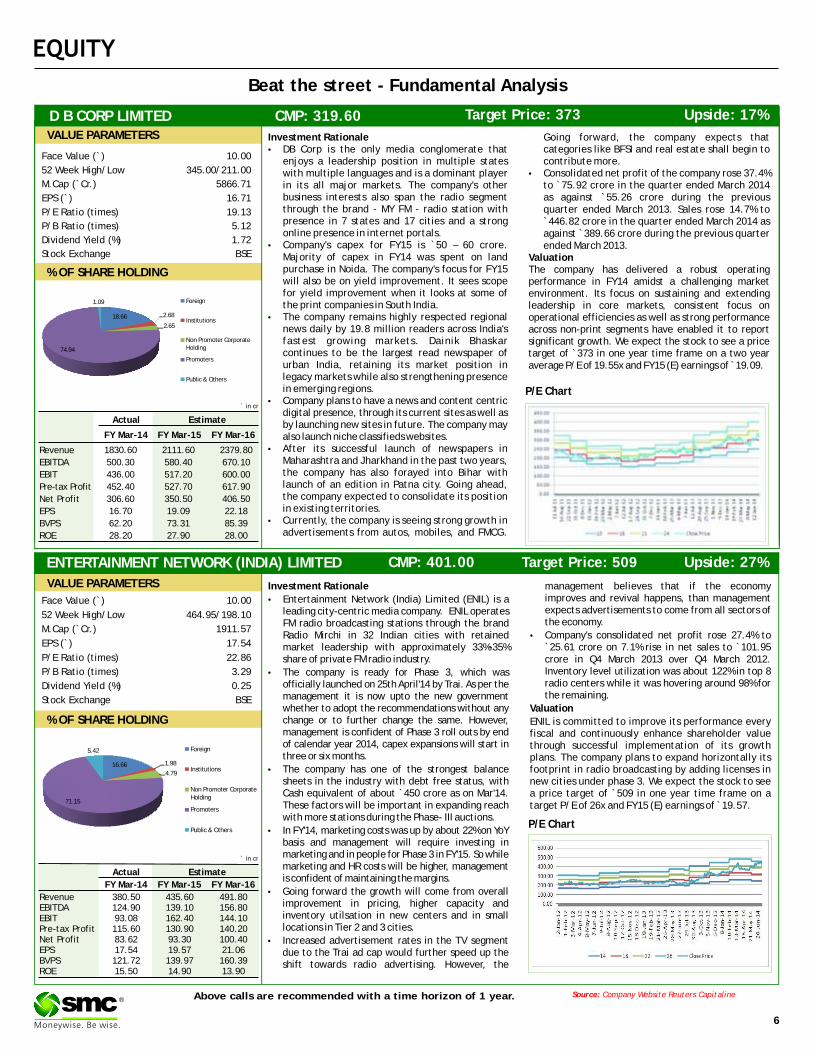
Investment Rationale management believes that if the economy improves and revival happens, than management •Entertainment Network (India) Limited (ENIL) is a expects advertisements to come from all sectors of leading city-centric media company. ENIL operates the economy. FM radio broadcasting stations through the brand
Radio Mirchi in 32 Indian cities with retained •Company's consolidated net profit rose 27.4% to market leadership with approximately 33%-35% `25.61 crore on 7.1% rise in net sales to `101.95 share of private FM radio industry. crore in Q4 March 2013 over Q4 March 2012.
Inventory level utilization was about 122% in top 8 •The company is ready for Phase 3, which was radio centers while it was hovering around 98% for officially launched on 25th April'14 by Trai. As per the the remaining.management it is now upto the new government
whether to adopt the recommendations without any Valuationchange or to further change the same. However, ENIL is committed to improve its performance every management is confident of Phase 3 roll outs by end fiscal and continuously enhance shareholder value of calendar year 2014, capex expansions will start in through successful implementation of its growth three or six months. plans. The company plans to expand horizontally its
•The company has one of the strongest balance footprint in radio broadcasting by adding licenses in sheets in the industry with debt free status, with new cities under phase 3. We expect the stock to see Cash equivalent of about `450 crore as on Mar'14. a price target of `509 in one year time frame on a These factors will be important in expanding reach target P/E of 26x and FY15 (E) earnings of ̀ 19.57.with more stations during the Phase- III auctions.
•In FY'14, marketing costs was up by about 22% on YoY basis and management will require investing in marketing and in people for Phase 3 in FY'15. So while marketing and HR costs will be higher, management is confident of maintaining the margins.
•Going forward the growth will come from overall improvement in pricing, higher capacity and inventory utilsation in new centers and in small locations in Tier 2 and 3 cities.
•Increased advertisement rates in the TV segment due to the Trai ad cap would further speed up the shift towards radio advertising. However, the
` in cr
Actual Estimate
FY Mar-14 FY Mar-15 FY Mar-16
Revenue 380.50 435.60 491.80EBITDA 124.90 139.10 156.80EBIT 93.08 162.40 144.10Pre-tax Profit 115.60 130.90 140.20Net Profit 83.62 93.30 100.40EPS 17.54 19.57 21.06BVPS 121.72 139.97 160.39ROE 15.50 14.90 13.90
Face Value (`) 10.00
52 Week High/Low 464.95/198.10
M.Cap (`Cr.) 1911.57
EPS (`) 17.54
P/E Ratio (times) 22.86
P/B Ratio (times) 3.29
Dividend Yield (%) 0.25
Stock Exchange BSE
ENTERTAINMENT NETWORK (INDIA) LIMITED CMP: 401.00 Upside: 27%Target Price: 509
P/E Chart
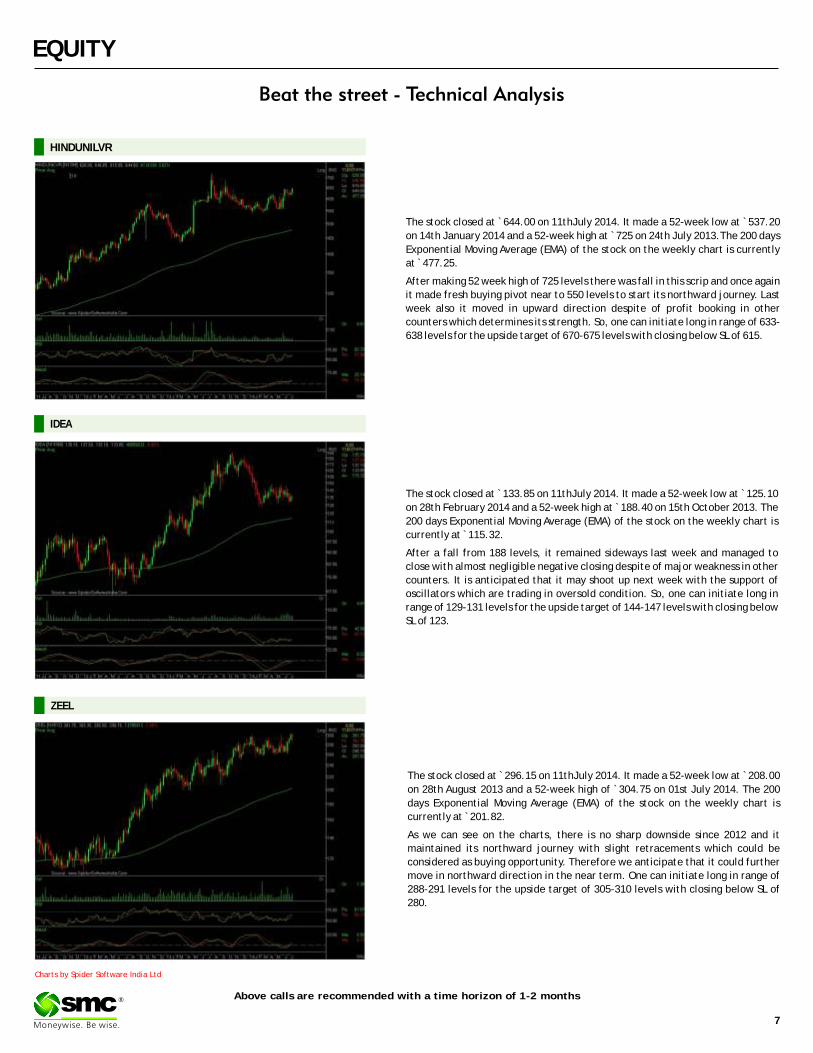
Face Value (`) 10.00
52 Week High/Low 345.00/211.00
M.Cap (`Cr.) 5866.71
EPS (`) 16.71
P/E Ratio (times) 19.13
P/B Ratio (times) 5.12
Dividend Yield (%) 1.72
Stock Exchange BSE
` in cr
Actual Estimate
FY Mar-14 FY Mar-15 FY Mar-16
Revenue 1830.60 2111.60 2379.80
EBITDA 500.30 580.40 670.10
EBIT 436.00 517.20 600.00
Pre-tax Profit 452.40 527.70 617.90
Net Profit 306.60 350.50 406.50
EPS 16.70 19.09 22.18
BVPS 62.20 73.31 85.39
ROE 28.20 27.90 28.00
% OF SHARE HOLDING
Investment Rationale Going forward, the company expects that •DB Corp is the only media conglomerate that categories like BFSI and real estate shall begin to
enjoys a leadership position in multiple states contribute more.with multiple languages and is a dominant player •Consolidated net profit of the company rose 37.4% in its all major markets. The company's other to `75.92 crore in the quarter ended March 2014 business interests also span the radio segment as against `55.26 crore during the previous through the brand - MY FM - radio station with quarter ended March 2013. Sales rose 14.7% to presence in 7 states and 17 cities and a strong `446.82 crore in the quarter ended March 2014 as online presence in internet portals. against ̀ 389.66 crore during the previous quarter
•Company's capex for FY15 is `50 – 60 crore. ended March 2013.Majority of capex in FY14 was spent on land Valuationpurchase in Noida. The company's focus for FY15 The company has delivered a robust operating will also be on yield improvement. It sees scope performance in FY14 amidst a challenging market for yield improvement when it looks at some of environment. Its focus on sustaining and extending the print companies in South India. leadership in core markets, consistent focus on
•The company remains highly respected regional operational efficiencies as well as strong performance news daily by 19.8 million readers across India's across non-print segments have enabled it to report fastest growing markets. Dainik Bhaskar significant growth. We expect the stock to see a price continues to be the largest read newspaper of target of `373 in one year time frame on a two year urban India, retaining its market position in average P/E of 19.55x and FY15 (E) earnings of ̀ 19.09.legacy markets while also strengthening presence in emerging regions.
•Company plans to have a news and content centric digital presence, through its current sites as well as by launching new sites in future. The company may also launch niche classifieds websites.
•After its successful launch of newspapers in Maharashtra and Jharkhand in the past two years, the company has also forayed into Bihar with launch of an edition in Patna city. Going ahead, the company expected to consolidate its position in existing territories.
•Currently, the company is seeing strong growth in advertisements from autos, mobiles, and FMCG.
P/E Chart
D B CORP LIMITED CMP: 319.60 Upside: 17%Target Price: 373
VALUE PARAMETERS
18.66 2.68
2.65
74.94
1.09 Foreign
Institutions
Non Promoter Corporate Holding
Promoters
Public & Others
16.66 1.98
4.79
71.15
5.42 Foreign
Institutions
Non Promoter Corporate Holding
Promoters
Public & Others
6
®
Charts by Spider Software India Ltd
7
The stock closed at ̀ 644.00 on 11thJuly 2014. It made a 52-week low at ̀ 537.20
on 14th January 2014 and a 52-week high at ̀ 725 on 24th July 2013.The 200 days
Exponential Moving Average (EMA) of the stock on the weekly chart is currently
at ̀ 477.25.
After making 52 week high of 725 levels there was fall in this scrip and once again
it made fresh buying pivot near to 550 levels to start its northward journey. Last
week also it moved in upward direction despite of profit booking in other
counters which determines its strength. So, one can initiate long in range of 633-
638 levels for the upside target of 670-675 levels with closing below SL of 615.
EQUITY
Above calls are recommended with a time horizon of 1-2 months
The stock closed at ̀ 133.85 on 11thJuly 2014. It made a 52-week low at ̀ 125.10
on 28th February 2014 and a 52-week high at ̀ 188.40 on 15th October 2013. The
200 days Exponential Moving Average (EMA) of the stock on the weekly chart is
currently at ̀ 115.32.
After a fall from 188 levels, it remained sideways last week and managed to
close with almost negligible negative closing despite of major weakness in other
counters. It is anticipated that it may shoot up next week with the support of
oscillators which are trading in oversold condition. So, one can initiate long in
range of 129-131 levels for the upside target of 144-147 levels with closing below
SL of 123.
The stock closed at 296.15 on 11thJuly 2014. It made a 52-week low at 208.00
on 28th August 2013 and a 52-week high of `304.75 on 01st July 2014. The 200
days Exponential Moving Average (EMA) of the stock on the weekly chart is
currently at ̀ 201.82.
As we can see on the charts, there is no sharp downside since 2012 and it
maintained its northward journey with slight retracements which could be
considered as buying opportunity. Therefore we anticipate that it could further
move in northward direction in the near term. One can initiate long in range of
288-291 levels for the upside target of 305-310 levels with closing below SL of
280.
` `
HINDUNILVR
ZEEL
IDEA
®
DERIVATIVES
BASIS GAP IN NIFTY
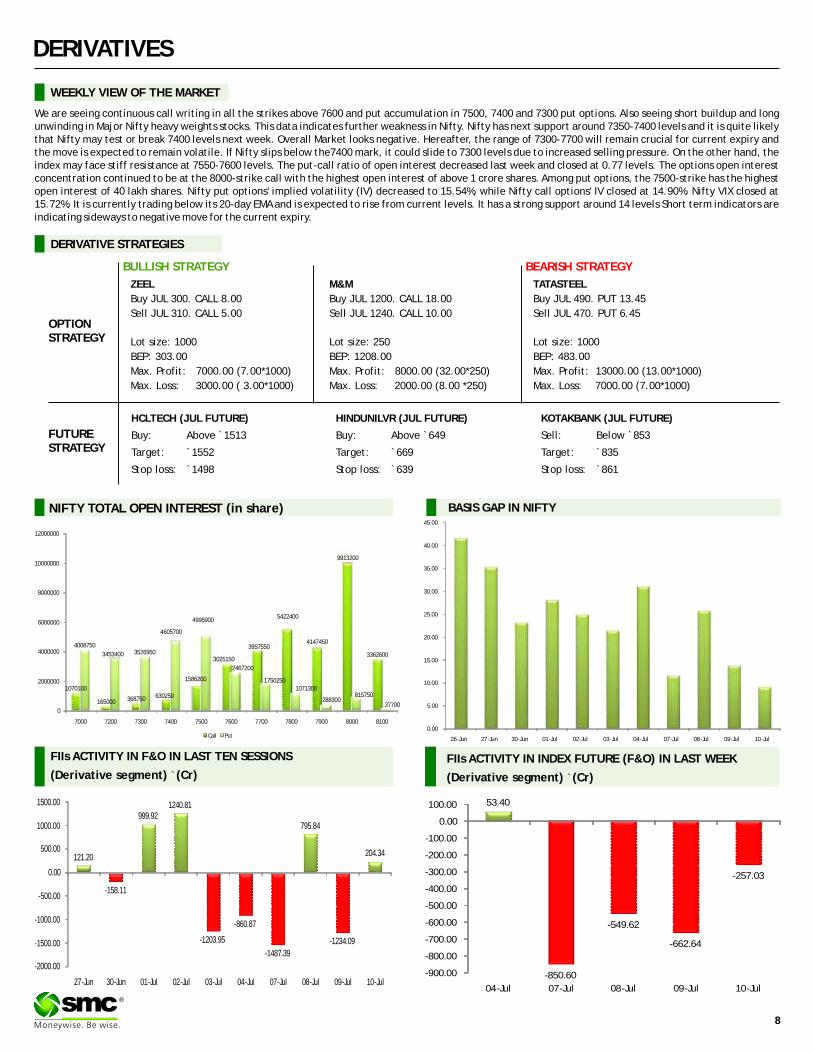
We are seeing continuous call writing in all the strikes above 7600 and put accumulation in 7500, 7400 and 7300 put options. Also seeing short buildup and long unwinding in Major Nifty heavy weights stocks. This data indicates further weakness in Nifty. Nifty has next support around 7350-7400 levels and it is quite likely that Nifty may test or break 7400 levels next week. Overall Market looks negative. Hereafter, the range of 7300-7700 will remain crucial for current expiry and the move is expected to remain volatile. If Nifty slips below the7400 mark, it could slide to 7300 levels due to increased selling pressure. On the other hand, the index may face stiff resistance at 7550-7600 levels. The put-call ratio of open interest decreased last week and closed at 0.77 levels. The options open interest concentration continued to be at the 8000-strike call with the highest open interest of above 1 crore shares. Among put options, the 7500-strike has the highest open interest of 40 lakh shares. Nifty put options' implied volatility (IV) decreased to 15.54%, while Nifty call options' IV closed at 14.90%. Nifty VIX closed at 15.72%. It is currently trading below its 20-day EMA and is expected to rise from current levels. It has a strong support around 14 levels Short term indicators are indicating sideways to negative move for the current expiry.
WEEKLY VIEW OF THE MARKET
NIFTY TOTAL OPEN INTEREST (in share)
®
FIIs ACTIVITY IN F&O IN LAST TEN SESSIONS
(Derivative segment) `(Cr)
HCLTECH (JUL FUTURE)
Buy: Above `1513
Target: `1552
Stop loss: `1498
TATASTEEL
Buy JUL 490. PUT 13.45
Sell JUL 470. PUT 6.45
Lot size: 1000
BEP: 483.00
Max. Profit: 13000.00 (13.00*1000)
Max. Loss: 7000.00 (7.00*1000)
OPTIONSTRATEGY
FUTURESTRATEGY
ZEEL
Buy JUL 300. CALL 8.00
Sell JUL 310. CALL 5.00
Lot size: 1000
BEP: 303.00
Max. Profit: 7000.00 (7.00*1000)
Max. Loss: 3000.00 ( 3.00*1000)
M&M
Buy JUL 1200. CALL 18.00
Sell JUL 1240. CALL 10.00
Lot size: 250
BEP: 1208.00
Max. Profit: 8000.00 (32.00*250)
Max. Loss: 2000.00 (8.00 *250)
BULLISH STRATEGY
DERIVATIVE STRATEGIES
HINDUNILVR (JUL FUTURE)
Buy: Above `649
Target: `669
Stop loss: `639
KOTAKBANK (JUL FUTURE)
Sell: `853
Target: `835
Stop loss: `861
Below
BEARISH STRATEGY
FIIs ACTIVITY IN INDEX FUTURE (F&O) IN LAST WEEK
(Derivative segment) `(Cr)
53.40
-850.60
-549.62
-662.64
-257.03
-900.00
-800.00
-700.00
-600.00
-500.00
-400.00
-300.00
-200.00
-100.00
0.00
100.00
04-Jul 07-Jul 08-Jul 09-Jul 10-Jul
121.20
-158.11
999.921240.81
-1203.95
-860.87
-1487.39
795.84
-1234.09
204.34
-2000.00
-1500.00
-1000.00
-500.00
0.00
500.00
1000.00
1500.00
27-Jun 30-Jun 01-Jul 02-Jul 03-Jul 04-Jul 07-Jul 08-Jul 09-Jul 10-Jul
0.00
5.00
10.00
15.00
20.00
25.00
30.00
35.00
40.00
45.00
26-Jun 27-Jun 30-Jun 01-Jul 02-Jul 03-Jul 04-Jul 07-Jul 08-Jul 09-Jul 10-Jul
1070100
165000 368750 630250
1586200
3025150
3957550
5422400
4147450
9913200
3362600
4008750
3453400 3526950
4605700
4995900
2467200
17502501071300
288300815750
377000
2000000
4000000
6000000
8000000
10000000
12000000
7000 7200 7300 7400 7500 7600 7700 7800 7900 8000 8100
Call Put
8
9
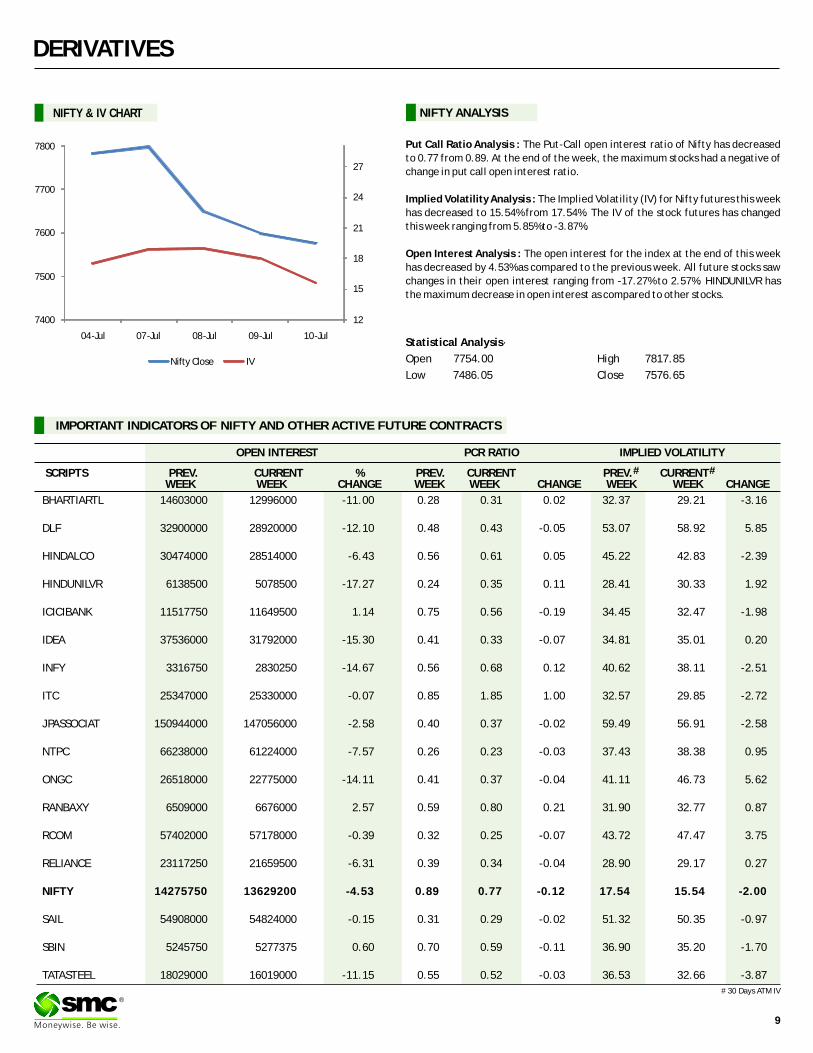
BHARTIARTL 14603000 12996000 -11.00 0.28 0.31 0.02 32.37 29.21 -3.16
DLF 32900000 28920000 -12.10 0.48 0.43 -0.05 53.07 58.92 5.85
HINDALCO 30474000 28514000 -6.43 0.56 0.61 0.05 45.22 42.83 -2.39
HINDUNILVR 6138500 5078500 -17.27 0.24 0.35 0.11 28.41 30.33 1.92
ICICIBANK 11517750 11649500 1.14 0.75 0.56 -0.19 34.45 32.47 -1.98
IDEA 37536000 31792000 -15.30 0.41 0.33 -0.07 34.81 35.01 0.20
INFY 3316750 2830250 -14.67 0.56 0.68 0.12 40.62 38.11 -2.51
ITC 25347000 25330000 -0.07 0.85 1.85 1.00 32.57 29.85 -2.72
JPASSOCIAT 150944000 147056000 -2.58 0.40 0.37 -0.02 59.49 56.91 -2.58
NTPC 66238000 61224000 -7.57 0.26 0.23 -0.03 37.43 38.38 0.95
ONGC 26518000 22775000 -14.11 0.41 0.37 -0.04 41.11 46.73 5.62
RANBAXY 6509000 6676000 2.57 0.59 0.80 0.21 31.90 32.77 0.87
RCOM 57402000 57178000 -0.39 0.32 0.25 -0.07 43.72 47.47 3.75
RELIANCE 23117250 21659500 -6.31 0.39 0.34 -0.04 28.90 29.17 0.27
NIFTY 14275750 13629200 -4.53 0.89 0.77 -0.12 17.54 15.54 -2.00
SAIL 54908000 54824000 -0.15 0.31 0.29 -0.02 51.32 50.35 -0.97
SBIN 5245750 5277375 0.60 0.70 0.59 -0.11 36.90 35.20 -1.70
TATASTEEL 18029000 16019000 -11.15 0.55 0.52 -0.03 36.53 32.66 -3.87
IMPORTANT INDICATORS OF NIFTY AND OTHER ACTIVE FUTURE CONTRACTS
OPEN INTEREST PCR RATIO IMPLIED VOLATILITY
# SCRIPTS PREV. CURRENT % PREV. CURRENT PREV. CURRENT WEEK WEEK CHANGE WEEK WEEK CHANGE WEEK WEEK CHANGE
#
DERIVATIVES
Put Call Ratio Analysis : The Put-Call open interest ratio of Nifty has decreased
to 0.77 from 0.89. At the end of the week, the maximum stocks had a negative of
change in put call open interest ratio.
Implied Volatility Analysis : The Implied Volatility (IV) for Nifty futures this week
has decreased to 15.54% from 17.54%. The IV of the stock futures has changed
this week ranging from 5.85% to -3.87%.
Open Interest Analysis : The open interest for the index at the end of this week
has decreased by 4.53% as compared to the previous week. All future stocks saw
changes in their open interest ranging from -17.27% to 2.57%. HINDUNILVR has
the maximum decrease in open interest as compared to other stocks.
Statistical Analysis·
Open 7754.00 High 7817.85
Low 7486.05 Close 7576.65
NIFTY & IV CHART NIFTY ANALYSIS
®# 30 Days ATM IV
12
15
18
21
24
27
7400
7500
7600
7700
7800
04-Jul 07-Jul 08-Jul 09-Jul 10-Jul
Nifty Close IV
Chilli futures (Aug) is likely to hold above 9950 levels. In Andhra Pradesh, as of now, deficient rains have no impact on the sowing progress, in the core chilli growing areas the land preparation and transplanting activity are likely to delay by 15 – 20 days in some parts. On the demand side, there is high demand for Oleoresin, which is extracted from Teja variety of chilli. It has wider applications as a natural colouring and flavouring agent in confectionery, beverages, pharmaceutical and other industries. Cardamom futures (Aug) is expected to remain below 990 levels, with upside getting capped by factors such as profit booking and commencement of new crop arrivals. During the current season of the crop ending this month, arrivals were 21,134 tonnes against 15,040 tonnes during the same period a year ago. Sales were 20,496 tonnes against 14,409 tonnes. The auctions have resumed from July 8 in the open markets in Bodinayakannur in Tamil Nadu, the primary markets in Kerala's Idukki and Wayanad districts. It is reported that prevailing weather conditions is suitable and there are expectations that the cardamom crop would be normal this year. Turmeric futures (Aug) would probably consolidate in the range of 6300-6800 levels. This season, farmer's intention of pre-sowing area for turmeric is almost likely to be same as compared to the last year. On the demand side, the upcountry exporters are awaiting for some orders to emerge from North Indian pockets. In current scenario, they are buying limited stocks to cater their committed masala firm orders. Jeera futures (Aug) is expected to test 11850 levels on the upside on expectation of exports order getting diverted to India due to rising tensions in Syria & Turkey.
SPICES
Upside movement in the bullion counter may persist continuing last week gains as tension in the Middle East and concerns regarding euro zone economy may increase the safe haven demand. On domestic bourses movement of local currency rupee will impact the bullion counter which can move in range of 59.30-60.8. Gold may move in the range of 27800-29000 in MCX. White metal silver can hover in the range of 44500-48000. COMEX gold gained 11 percent this year as the pace of sales from exchange traded products slowed amid expectations that U.S. interest rates will remain low and as geopolitical tensions around the world rose. Economic uncertainty also increase safe haven buying in bullion counter. In Portugal, Banco Espirito Santo SA bonds plunged to records after a parent company delayed debt payments on short-term notes, fueling concern that the euro region remains vulnerable to financial shocks. Tensions between Israel and Gaza and in Iraq have prompted investors to invest in bullion counter. Israeli leaders want to stop a hail of rockets on Israel from the Hamas-controlled Gaza Strip. Israel is mobilizing 20,000 soldiers for a possible ground invasion of the Gaza Strip to halt rocket bombardments. Tensions in Ukraine is also continuing as Ukraine targeted separatists near Donetsk with air strikes, killing about 50 fighters, as the European Union prepared to expand sanctions in response to the pro-Russian violence that has rocked the country since March. Last week India surprised bullion markets by keeping the import duty on gold and silver unchanged at 10 percent in its fiscal budget.
BULLIONS
10
®
Base metals counter may extend last week gains as good economic data from US and China along with dwindling stockpiles is supporting the prices. Red metal copper can trade in the range of 420-445.Potentially easing supply curbs for copper, Freeport-McMoRan Copper & Gold Inc have agreed a memorandum of understanding with the Indonesian government on contract renegotiations. Battery metal lead can move in the range of 128-134 in MCX. Zinc can hover in range of 132-138. Zinc rose on speculation that China, the biggest user, will take measures to spur growth, boosting demand prospects for the metal amid dwindling stockpiles. LME stockpiles for zinc have fallen 29 percent this year to 661,850 tonnes, the lowest since December 2010. Nickel prices may hover in range of 1120-1200 in MCX. Nickel prices fell to a one-week low on speculation that ore exports will pick up from Indonesia. In Indonesia, unofficial counts by most survey companies had Jakarta Governor Joko Widodo securing more votes than his opponent in the presidential election and the nation may relax ban on ore exports imposed in January. Aluminum can move in the range of 112-117. Standard Bank Group Ltd., Africa's largest lender, started legal proceedings in China after about $170 million-worth of aluminium was held in bonded warehouses. The bank's U.K. unit, which trades commodities, is seeking to “protect its position” in regard to the stocks at Qingdao Port and an additional $40 million-worth of aluminium at other locations in Shandong province.
BASE METALS
Geopolitical uncertainty and movement of local currency rupee along with inventory data will give further direction to the crude oil prices. Meanwhile any increase in tensions in Israel, Iraq and Ukraine can support the prices. Crude oil prices may trade in range of 6000-6350 in MCX and $100-106 in NYMEX. Recently Libya boosted its crude output and gasoline stockpiles expanded in the U.S., the world's biggest oil consumer .Libya's supply gained as the Sharara field resumed production and two oil export terminals reopened. Fighting in Iraq, the second largest OPEC member hasn't spread to the country's south, home to three-quarters of its output. Meanwhile U.S. gasoline inventories rose last week as a measure of demand fell, the Energy Information Administration reported on July 9. In the U.S., gasoline stockpiles expanded by 579,000 barrels in the week ended July 4. Natural gas prices may remain tamed down on higher inventories as it can move in range of 240-260 in MCX. The U.S. Energy Information Administration said in its weekly report that natural gas storage in the U.S. in the week ended July 4 rose by 93 billion cubic feet, above expectations for an increase of 92 billion cubic feet. Meanwhile, updated weather-forecasting models called for cooler temperatures across most parts of the heavily populated Midwest and Northeast regions over the next five days. Demand for natural gas tends to fluctuate in the summer based on hot weather and air conditioning use.
ENERGY COMPLEX
U.S soybean futures (Nov) is likely to fall towards 1060 levels a s mild temperatures forecast for growing regions have bolstered the outlook for a projected record-high crop in the U.S. The output probably will climb 15% to an all-time high this year after farmers told the government in June they planted the most acres ever, according to a survey by Bloomberg News. Back at home, soybean futures (Oct) is expected to trade in the range of 3615-3800 levels. The market participants are closely watching the sowing progress as concerns are rising on availability of quality seeds & rainfall activities getting slowed down in the major growing regions. The area coverage under soybean as on 10th July, 2014 is pegged at 7.86 lakh hectares, lower by 75.64 lakh hectares compared to corresponding period of Kharif 2013. In the latest report by the Indian Meteorological Department, it is cited that the conditions are favorable & the Southwest Monsoon has further advanced into remaining parts of Madhya Maharashtra, Marathawada & Vidarbha and some more parts of West Madhya Pradesh. Mustard futures (Aug) will possibly continue to take support above 3510 levels, cushioned by strong mustard meal demand & expectations of higher enquiries in days to come. A team from the Chinese Quarantine Department was in India for a week to check into rapeseed processing verifications. The visiting officials have expressed satisfaction and readiness to sign a protocol agreement with the Export Inspection Council of India on mutually agreed terms. CPO futures (Aug) is expected to face resistance near 535 levels as vegetable oil imports by India are forecasted to rise as a lacklustre monsoon is likely to hit the country's oilseed output.
OIL AND OILSEEDS
OTHER COMMODITIES
Wheat futures (Aug) is likely to maintain support above 1530 levels. It is said that the Govt. is planning to hold on to supplies for its domestic market instead of boosting exports. The Government has decided to keep on hold a program under which wheat was being sold regularly through state-run trading companies to global bidders. Moreover, with the end of procurement season and increasing demands for wheat, the counter may witness some upside movement in days to come. The downside in Kapas futures (Apr) is expected to extend towards 910-900 levels. It is reported that the average cotton yield in 2013-14 has increased by 9% to 565.36 kg per hectare compared to 2012-13 as the quality of the seeds has improved. The Cotton Advisory Board has estimated cotton output to rise 7% to 390 lakh bales (of 170 kg each) in comparison with 365 lakh bales last year. With the opening stock of 35 lakh bales the total supply is expected to touch 433 lakh bales. Adding to it, currently, around 4 million running bales of unsold stock is lying with the ginners. There are talks that China is likely to decontrol its cotton from August, which will impact India's exports. Sugar futures (Aug) would possibly witness a consolidation in the range of 3040-3120 levels. The upside may remain capped as millers are continuously selling and stockists are carrying enough inventories. The sentiments at the spot markets are cautious as demand from retailers and stockists are need-based. Moreover, there are estimates that this season the sugar production will expand 3.7% to 25 million metric tonnes in the harvesting season starting Oct. 1, the first gain since 2011-2012 according to a Bloomberg survey.
11
TECHNICAL RECOMMENDATIONS
COMMODITY
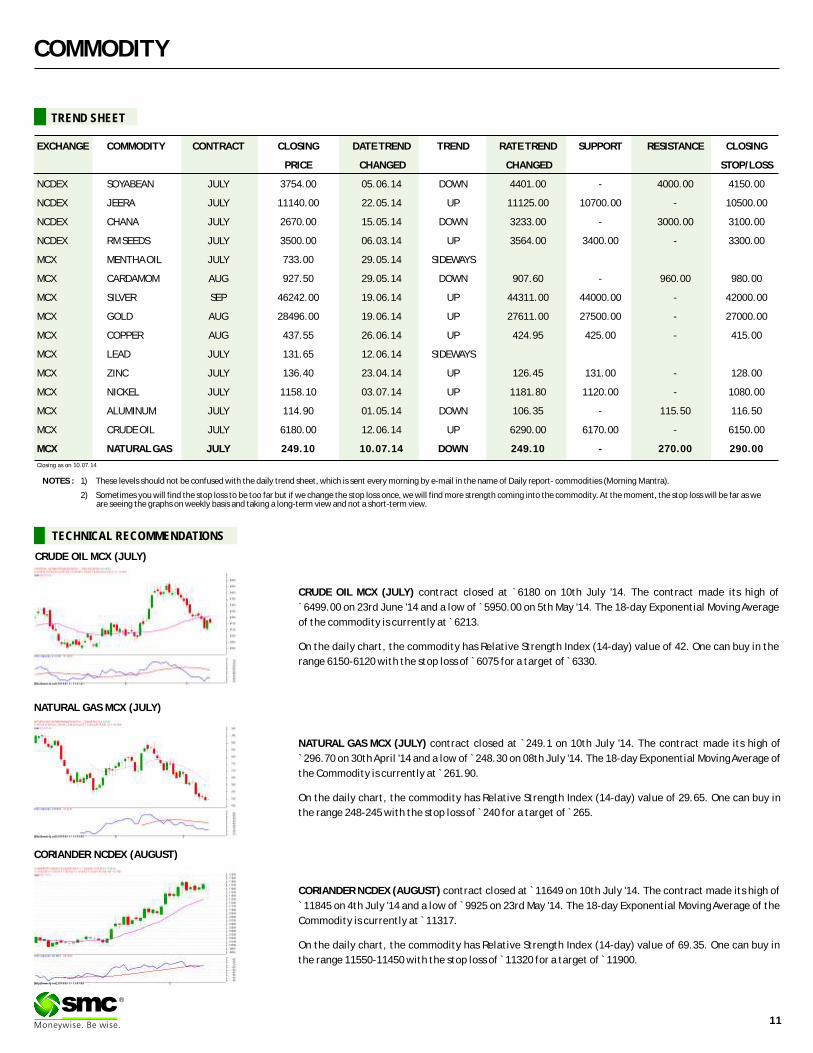
CRUDE OIL MCX (JULY) contract closed at `6180 on 10th July '14. The contract made its high of
`6499.00 on 23rd June '14 and a low of ̀ 5950.00 on 5th May '14. The 18-day Exponential Moving Average
of the commodity is currently at ̀ 6213. On the daily chart, the commodity has Relative Strength Index (14-day) value of 42. One can buy in the
range 6150-6120 with the stop loss of ̀ 6075 for a target of ̀ 6330.
NATURAL GAS MCX (JULY) contract closed at 249.1 on 10th July '14. The contract made its high of
`296.70 on 30th April '14 and a low of ̀ 248.30 on 08th July '14. The 18-day Exponential Moving Average of
the Commodity is currently at ̀ 261.90.
On the daily chart, the commodity has Relative Strength Index (14-day) value of 29.65. One can buy in
the range 248-245 with the stop loss of ̀ 240 for a target of ̀ 265.
`
CORIANDER NCDEX (AUGUST) contract closed at 11649 on 10th July '14. The contract made its high of
`11845 on 4th July '14 and a low of ̀ 9925 on 23rd May '14. The 18-day Exponential Moving Average of the
Commodity is currently at ̀ 11317.
On the daily chart, the commodity has Relative Strength Index (14-day) value of 69.35. One can buy in
the range 11550-11450 with the stop loss of ̀ 11320 for a target of ̀ 11900.
`
®
CRUDE OIL MCX (JULY)
NATURAL GAS MCX (JULY)
CORIANDER NCDEX (AUGUST)
NOTES : 1) These levels should not be confused with the daily trend sheet, which is sent every morning by e-mail in the name of Daily report- commodities (Morning Mantra).
2) Sometimes you will find the stop loss to be too far but if we change the stop loss once, we will find more strength coming into the commodity. At the moment, the stop loss will be far as we are seeing the graphs on weekly basis and taking a long-term view and not a short-term view.
EXCHANGE COMMODITY CONTRACT CLOSING DATE TREND TREND RATE TREND SUPPORT RESISTANCE CLOSING
PRICE CHANGED CHANGED STOP/LOSS
NCDEX SOYABEAN JULY 3754.00 05.06.14 DOWN 4401.00 - 4000.00 4150.00
NCDEX JEERA JULY 11140.00 22.05.14 UP 11125.00 10700.00 - 10500.00
NCDEX CHANA JULY 2670.00 15.05.14 DOWN 3233.00 - 3000.00 3100.00
NCDEX RM SEEDS JULY 3500.00 06.03.14 UP 3564.00 3400.00 - 3300.00
MCX MENTHA OIL JULY 733.00 29.05.14 SIDEWAYS
MCX CARDAMOM AUG 927.50 29.05.14 DOWN 907.60 - 960.00 980.00
MCX SILVER SEP 46242.00 19.06.14 UP 44311.00 44000.00 - 42000.00
MCX GOLD AUG 28496.00 19.06.14 UP 27611.00 27500.00 - 27000.00
MCX COPPER AUG 437.55 26.06.14 UP 424.95 425.00 - 415.00
MCX LEAD JULY 131.65 12.06.14 SIDEWAYS
MCX ZINC JULY 136.40 23.04.14 UP 126.45 131.00 - 128.00
MCX NICKEL JULY 1158.10 03.07.14 UP 1181.80 1120.00 - 1080.00
MCX ALUMINUM JULY 114.90 01.05.14 DOWN 106.35 - 115.50 116.50
MCX CRUDE OIL JULY 6180.00 12.06.14 UP 6290.00 6170.00 - 6150.00
MCX NATURAL GAS JULY 249.10 10.07.14 DOWN 249.10 - 270.00 290.00
TREND SHEET
Closing as on 10.07.14
COMMODITY
NEWS DIGEST
Commodities market turned bearish from past two weeks on strength in dollar index and some
sluggish indications. Sharp decline in energy counter stimulated selling pressure in CRB as well.
News of smooth supply of crude oil from Libya amid some peace in Iraq compelled investors to opt
for selling in energy counter. Libya which has regained control of oil terminals seized by rebels,
are planning to increase shipments gradually. Furthermore, crude stockpiles rose the most since
January at Cushing, Oklahoma. Gasoline inventories increased and consumption fell, according
to Energy Information Administration figures. Even natural gas prices tumbled to multi week low
on poor demand. Gold climbed to the highest in more than three months as Middle East tension
spurred haven demand and after the dollar weakened following Federal Reserve minutes. Back at
home, gold prices in India climbed the most since September after Finance Minister Arun Jaitley
kept curbs on imports in the annual budget, limiting supply and potentially boosting premiums
during the festival season. Silver rose too along with gold. Industrial metals surrendered their
previous gain except zinc. Zinc advanced as inventories shrank amid speculation that weaker-
than-expected Chinese trade data will drive the government to add more stimulus to support
growth. China's trade surplus contracted to $31.6 billion in June, with exports and imports both
rising less than forecast. Copper prices moved down on weaker Chinese import. China's imports of
unwrought copper and copper products fell to about 350,000 tons in June, a 7.9% decline from the
previous month. As regards agri commodities, selling pressure remained there. Lower demand for oil at higher
level and prevailing uncertainty over rainfall in castor growing region has left market in a fix and
prices of castor moved down. Guar counter declined despite of decline in arrivals as market
participants take profit bookings at higher levels. With International prices were moving
downwards with increasing pace of cane crush by Brazilian mills, Indian sugar prices also dipped
down. With arrival from private holdings continues and news of sufficient stocks to cater current
demand exerted pressure on wheat prices. Cash wheat market traded weak despite end of
procurement season and lower arrivals in major markets. Lower arrival of mentha put the price
up in major spot markets as well as in futures market. In spices, jeera, turmeric and cardamom
were under pressure whereas chilli prices spurred. Most of the edible oils featured losses at
various markets tracking bearish cues from international oil.
WEEKLY COMMENTARY
WEEKLY STOCK POSITIONS IN WAREHOUSE (NCDEX)
COMMODITY UNIT 03.07.14 10.07.14 DIFFERENCEQTY. QTY.
BARLEY MT 8388 7568 -820CASTOR SEED MT 156520 145155 -11365CHANA MT 123112 123800 688CORIANDER MT 500 560 60COTTONSEED OILCAKE MT 46359 42283 -4076GUARGUM MT 7527 8642 1115GUARSEED MT 4318 6323 2005JEERA MT 1596 1447 -149MAIZE MT 20254 22644 2390RAPE MUSTARD SEED MT 81548 80866 -682SOYABEAN MT 39757 39807 50SUGAR MT 25115 21977 -3138TURMERIC MT 570 615 45WHEAT MT 7659 8207 548
COMMODITY UNIT 02.07.14 10.07.14 DIFFERENCE
QTY. QTY.
CARDAMOM MT 9.10 10.00 0.90
COTTON BALES 83800.00 78100.00 -5700.00
KAPASIA KHALLI MT 99.10 99.10 0.00
GOLD KGS 45.00 45.00 0.00
GOLD MINI KGS 445.80 12.00 -433.80
GOLD GUINEA KGS 8.15 8.08 -0.07
MENTHA OIL KGS 1797836.80 2246055.30 448218.50
SILVER (30 KG Bar) KGS 8749.25 7627.20 -1122.05
•US Unemployment Claims declined by 11,000 to
304,000 for the week ending on 4th July 2014 as against
a rise of 315,000 in previous week.
•China consumer price index (CPI) rose 2.3 percent in
June from a year earlier, missing the market forecast of
2.4 percent.
•China services PMI compiled by HSBC/Markit
rebounded to 53.1 in June from 50.7 in May.
•Libya plans to resume exports from the major eastern
Ras Lanuf and Es Sider oil ports.
•In Budget 2014-2015, the service tax on loading,
unloading, storage, warehousing and transportation of
cotton, whether ginned or baled, is being exempted to
bring it on par with certain other agricultural produce.
•India has exported 17.5 lakh tonne sugar during the
first six months of the 2013-14 marketing year ending
September with maximum quantity shipped to Iran.
•Imports of pulses declined by 10% to 3.66 million tonnes
(MT) in 2013-14 on account of higher domestic
production.
•Agricultural exports, including marine, increased by
5.1% to $37.29 billion in 2013-14, on account of jump in
exports of rice.
WEEKLY STOCK POSITIONS IN WAREHOUSE (MCX)
12
®
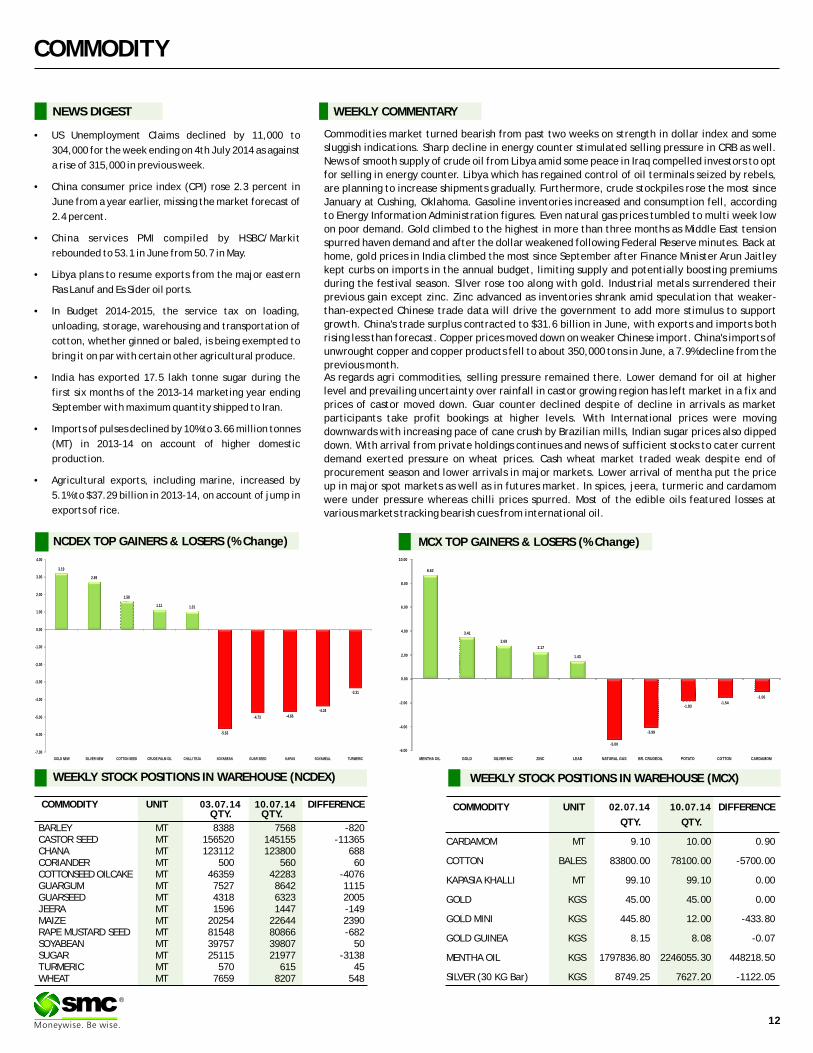
NCDEX TOP GAINERS & LOSERS (% Change) MCX TOP GAINERS & LOSERS (% Change)
8.62
3.41
2.69
2.17
1.43
-5.00
-3.99
-1.83-1.54
-1.06
-6.00
-4.00
-2.00
0.00
2.00
4.00
6.00
8.00
10.00
MENTHA OIL GOLD SILVER MIC ZINC LEAD NATURAL GAS BR. CRUDEOIL POTATO COTTON CARDAMOM
3.19
2.69
1.58
1.11 1.01
-5.63
-4.73 -4.66
-4.34
-3.31
-7.00
-6.00
-5.00
-4.00
-3.00
-2.00
-1.00
0.00
1.00
2.00
3.00
4.00
GOLD NEW SILVER NEW COTTON SEED CRUDE PALM OIL CHILLI TEJA SOYABEAN GUAR SEED KAPAS SOYAMEAL TURMERIC
COMMODITY
COMMODITY EXCHANGE CONTRACT 04.07.14 10.07.14 CHANGE%
ALUMINIUM LME 3 MONTHS 1923.00 1925.00 0.10
COPPER LME 3 MONTHS 7150.00 7162.00 0.17
LEAD LME 3 MONTHS 2181.00 2190.00 0.41
NICKEL LME 3 MONTHS 19400.00 19250.00 -0.77
ZINC LME 3 MONTHS 2237.00 2271.00 1.52
GOLD COMEX* AUG 1317.00 1339.20 1.69
SILVER COMEX* SEPT 21.01 21.51 2.35
LIGHT CRUDE OIL NYMEX* AUG 103.53 102.93 -0.58
NATURAL GAS NYMEX* AUG 4.23 4.12 -2.49
PRICES OF METALS IN LME/ COMEX/ NYMEX (in US $)
WEEKLY STOCK POSITIONS IN LME (IN TONNES)
COMMODITY STOCK POSITION STOCK POSITION DIFFERENCE
03.07.14 10.07.14
ALUMINIUM 5066400 5024225 -42175
COPPER 156775 159075 2300
NICKEL 305394 306828 1434
LEAD 193700 213600 19900
ZINC 666775 662525 -4250
INTERNATIONAL COMMODITY PRICES
COMMODITY EXCHANGE CONTRACT UNIT 04.07.14 10.07.14 CHANGE(%)
Soya CBOT* NOV Cent per Bushel 1125.20 1093.00 -2.86
Maize CBOT* JULY Cent per Bushel 409.25 400.50 -2.14
CPO BMD SEPT MYR per MT 2402.00 2386.00 -0.67
Sugar LIFFE OCT 10 cents per MT 468.10 459.10 -1.92
13
®
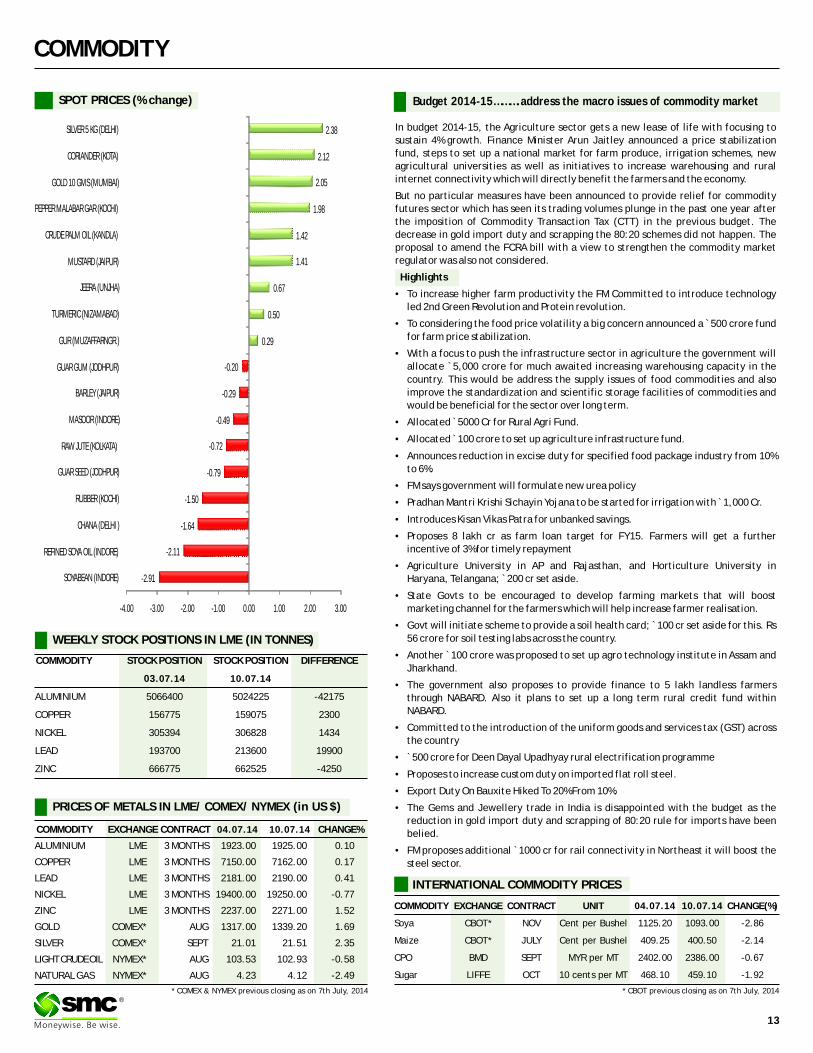
SPOT PRICES (% change) Budget 2014-15……….address the macro issues of commodity market
In budget 2014-15, the Agriculture sector gets a new lease of life with focusing to
sustain 4% growth. Finance Minister Arun Jaitley announced a price stabilization
fund, steps to set up a national market for farm produce, irrigation schemes, new
agricultural universities as well as initiatives to increase warehousing and rural
internet connectivity which will directly benefit the farmers and the economy.
But no particular measures have been announced to provide relief for commodity
futures sector which has seen its trading volumes plunge in the past one year after
the imposition of Commodity Transaction Tax (CTT) in the previous budget. The
decrease in gold import duty and scrapping the 80:20 schemes did not happen. The
proposal to amend the FCRA bill with a view to strengthen the commodity market
regulator was also not considered.
Highlights
• To increase higher farm productivity the FM Committed to introduce technology
led 2nd Green Revolution and Protein revolution.
• To considering the food price volatility a big concern announced a ̀ 500 crore fund
for farm price stabilization.
• With a focus to push the infrastructure sector in agriculture the government will
allocate `5,000 crore for much awaited increasing warehousing capacity in the
country. This would be address the supply issues of food commodities and also
improve the standardization and scientific storage facilities of commodities and
would be beneficial for the sector over long term.
• Allocated ̀ 5000 Cr for Rural Agri Fund.
• Allocated ̀ 100 crore to set up agriculture infrastructure fund.
• Announces reduction in excise duty for specified food package industry from 10%
to 6%.
• FM says government will formulate new urea policy
• Pradhan Mantri Krishi Sichayin Yojana to be started for irrigation with ̀ 1,000 Cr.
• Introduces Kisan Vikas Patra for unbanked savings.
• Proposes 8 lakh cr as farm loan target for FY15. Farmers will get a further
incentive of 3% for timely repayment
• Agriculture University in AP and Rajasthan, and Horticulture University in
Haryana, Telangana; ̀ 200 cr set aside.
• State Govts to be encouraged to develop farming markets that will boost
marketing channel for the farmers which will help increase farmer realisation.
• Govt will initiate scheme to provide a soil health card; ̀ 100 cr set aside for this. Rs
56 crore for soil testing labs across the country.
• Another ̀ 100 crore was proposed to set up agro technology institute in Assam and
Jharkhand.
• The government also proposes to provide finance to 5 lakh landless farmers
through NABARD. Also it plans to set up a long term rural credit fund within
NABARD.
• Committed to the introduction of the uniform goods and services tax (GST) across
the country
• `500 crore for Deen Dayal Upadhyay rural electrification programme
• Proposes to increase custom duty on imported flat roll steel.
• Export Duty On Bauxite Hiked To 20% From 10%.
• The Gems and Jewellery trade in India is disappointed with the budget as the
reduction in gold import duty and scrapping of 80:20 rule for imports have been
belied.
• FM proposes additional ̀ 1000 cr for rail connectivity in Northeast it will boost the
steel sector.
-2.91
-2.11
-1.64
-1.50
-0.79
-0.72
-0.49
-0.29
-0.20
0.29
0.50
0.67
1.41
1.42
1.98
2.05
2.12
2.38
-4.00 -3.00 -2.00 -1.00 0.00 1.00 2.00 3.00
SOYABEAN (INDORE)
REFINED SOYA OIL (INDORE)
CHANA (DELHI )
RUBBER (KOCHI)
GUAR SEED (JODHPUR)
RAW JUTE (KOLKATA)
MASOOR (INDORE)
BARLEY (JAIPUR)
GUAR GUM (JODHPUR)
GUR (MUZAFFARNGR.)
TURMERIC (NIZAMABAD)
JEERA (UNJHA)
MUSTARD (JAIPUR)
CRUDE PALM OIL (KANDLA)
PEPPER MALABAR GAR (KOCHI)
GOLD 10 GMS (MUMBAI)
CORIANDER (KOTA)
SILVER 5 KG (DELHI)
* COMEX & NYMEX previous closing as on 7th July, 2014 * CBOT previous closing as on 7th July, 2014
CURRENCY
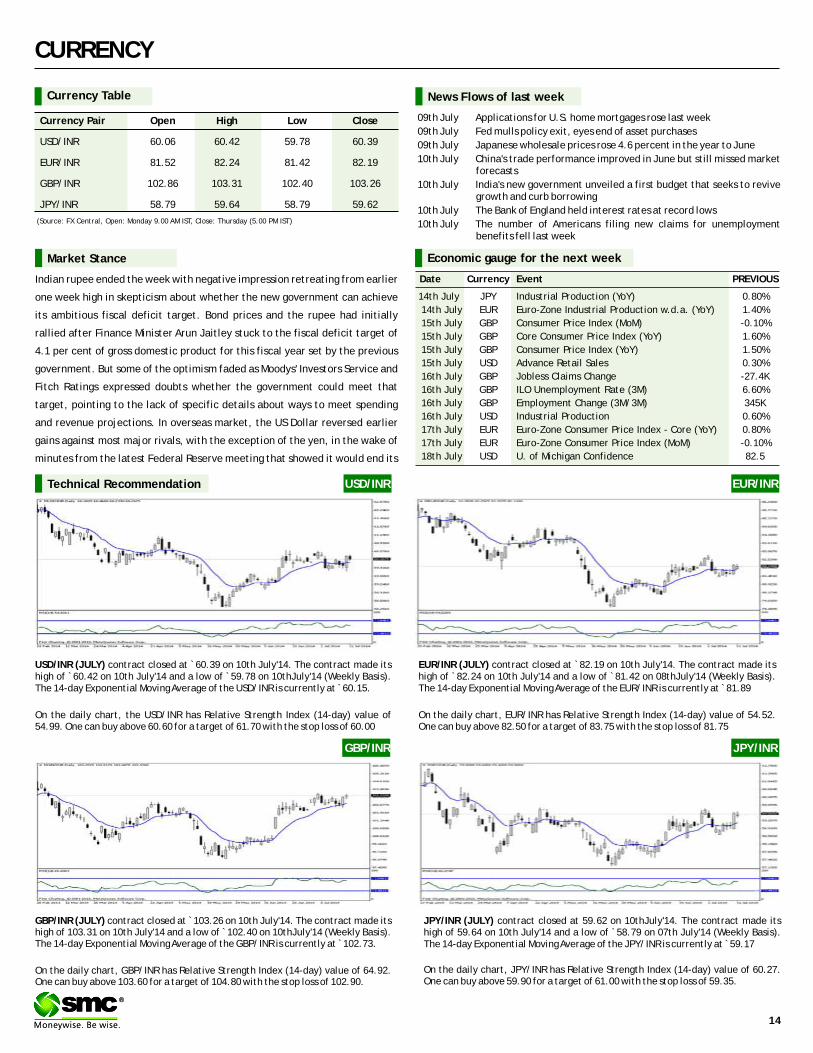
Currency Table
Currency Pair Open High Low Close
USD/INR 60.06 60.42 59.78 60.39
EUR/INR 81.52 82.24 81.42 82.19
GBP/INR 102.86 103.31 102.40 103.26
JPY/INR 58.79 59.64 58.79 59.62
(Source: FX Central, Open: Monday 9.00 AM IST, Close: Thursday (5.00 PM IST)
News Flows of last week
09th July Applications for U.S. home mortgages rose last week
09th July Fed mulls policy exit, eyes end of asset purchases
09th July Japanese wholesale prices rose 4.6 percent in the year to June
10th July China's trade performance improved in June but still missed market forecasts
10th July India's new government unveiled a first budget that seeks to revive growth and curb borrowing
10th July The Bank of England held interest rates at record lows
10th July The number of Americans filing new claims for unemployment benefits fell last week
EUR/INR (JULY) contract closed at 82.19 on 10th July'14. The contract made its high of `82.24 on 10th July'14 and a low of `81.42 on 08thJuly'14 (Weekly Basis). The 14-day Exponential Moving Average of the EUR/INR is currently at ̀ 81.89
On the daily chart, EUR/INR has Relative Strength Index (14-day) value of 54.52. One can buy above 82.50 for a target of 83.75 with the stop loss of 81.75
`
JPY/INR (JULY) contract closed at 59.62 on 10thJuly'14. The contract made its high of 59.64 on 10th July'14 and a low of `58.79 on 07th July'14 (Weekly Basis). The 14-day Exponential Moving Average of the JPY/INR is currently at ̀ 59.17
On the daily chart, JPY/INR has Relative Strength Index (14-day) value of 60.27. One can buy above 59.90 for a target of 61.00 with the stop loss of 59.35.
Market Stance
Indian rupee ended the week with negative impression retreating from earlier
one week high in skepticism about whether the new government can achieve
its ambitious fiscal deficit target. Bond prices and the rupee had initially
rallied after Finance Minister Arun Jaitley stuck to the fiscal deficit target of
4.1 per cent of gross domestic product for this fiscal year set by the previous
government. But some of the optimism faded as Moodys' Investors Service and
Fitch Ratings expressed doubts whether the government could meet that
target, pointing to the lack of specific details about ways to meet spending
and revenue projections. In overseas market, the US Dollar reversed earlier
gains against most major rivals, with the exception of the yen, in the wake of
minutes from the latest Federal Reserve meeting that showed it would end its
EUR/INR
USD/INR (JULY) contract closed at ̀ 60.39 on 10th July'14. The contract made its high of `60.42 on 10th July'14 and a low of `59.78 on 10thJuly'14 (Weekly Basis). The 14-day Exponential Moving Average of the USD/INR is currently at ̀ 60.15.
On the daily chart, the USD/INR has Relative Strength Index (14-day) value of 54.99. One can buy above 60.60 for a target of 61.70 with the stop loss of 60.00
GBP/INR (JULY) contract closed at 103.26 on 10th July'14. The contract made its high of 103.31 on 10th July'14 and a low of ̀ 102.40 on 10thJuly'14 (Weekly Basis). The 14-day Exponential Moving Average of the GBP/INR is currently at ̀ 102.73.
On the daily chart, GBP/INR has Relative Strength Index (14-day) value of 64.92. One can buy above 103.60 for a target of 104.80 with the stop loss of 102.90.
`
USD/INRTechnical Recommendation
GBP/INR JPY/INR
Economic gauge for the next week
Date Currency Event PREVIOUS
14th July JPY Industrial Production (YoY) 0.80%
14th July EUR Euro-Zone Industrial Production w.d.a. (YoY) 1.40%
15th July GBP Consumer Price Index (MoM) -0.10%
15th July GBP Core Consumer Price Index (YoY) 1.60%
15th July GBP Consumer Price Index (YoY) 1.50%
15th July USD Advance Retail Sales 0.30%
16th July GBP Jobless Claims Change -27.4K
16th July GBP ILO Unemployment Rate (3M) 6.60%
16th July GBP Employment Change (3M/3M) 345K
16th July USD Industrial Production 0.60%
17th July EUR Euro-Zone Consumer Price Index - Core (YoY) 0.80%
17th July EUR Euro-Zone Consumer Price Index (MoM) -0.10%
18th July USD U. of Michigan Confidence 82.5
14
®®
IPO
IPO NEWSIPO NEWS
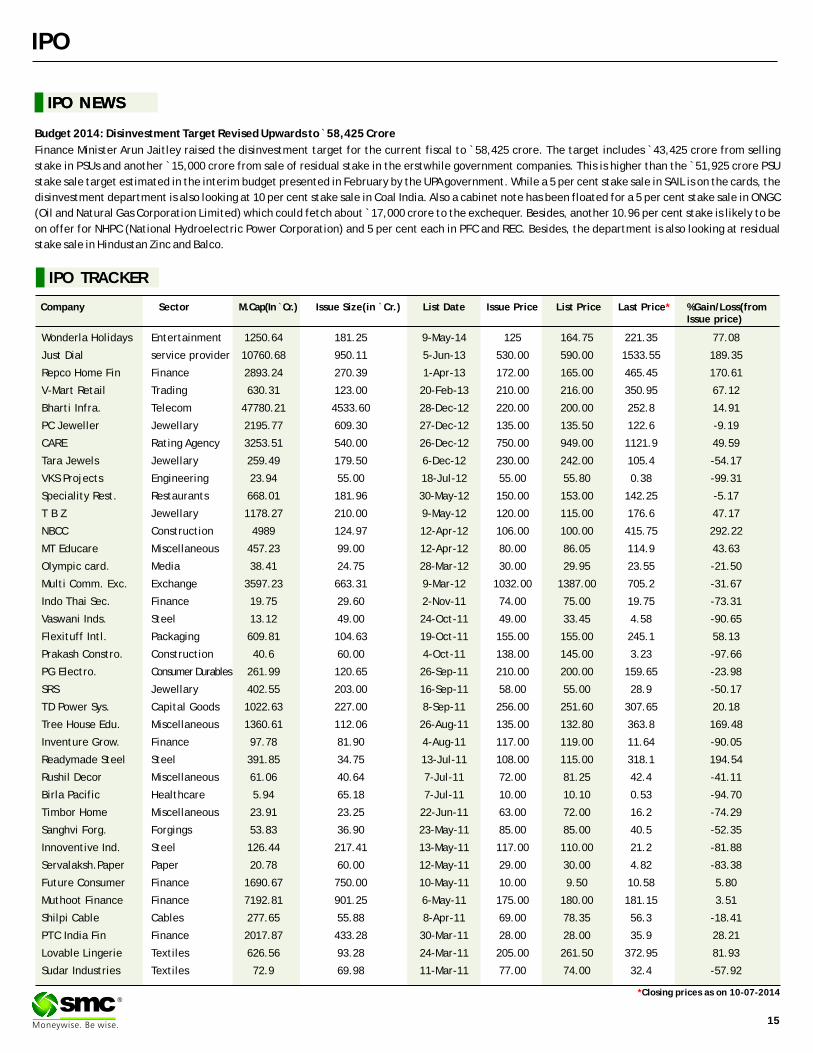
Budget 2014: Disinvestment Target Revised Upwards to ̀ 58,425 Crore
Finance Minister Arun Jaitley raised the disinvestment target for the current fiscal to 58,425 crore. The target includes 43,425 crore from selling
stake in PSUs and another 15,000 crore from sale of residual stake in the erstwhile government companies. This is higher than the 51,925 crore PSU
stake sale target estimated in the interim budget presented in February by the UPA government. While a 5 per cent stake sale in SAIL is on the cards, the
disinvestment department is also looking at 10 per cent stake sale in Coal India. Also a cabinet note has been floated for a 5 per cent stake sale in ONGC
(Oil and Natural Gas Corporation Limited) which could fetch about 17,000 crore to the exchequer. Besides, another 10.96 per cent stake is likely to be
on offer for NHPC (National Hydroelectric Power Corporation) and 5 per cent each in PFC and REC. Besides, the department is also looking at residual
stake sale in Hindustan Zinc and Balco.
` `
` `
`
15
®*Closing prices as on 10-07-2014
IPO TRACKER
Wonderla Holidays Entertainment 1250.64 181.25 9-May-14 125 164.75 221.35 77.08
Just Dial service provider 10760.68 950.11 5-Jun-13 530.00 590.00 1533.55 189.35
Repco Home Fin Finance 2893.24 270.39 1-Apr-13 172.00 165.00 465.45 170.61
V-Mart Retail Trading 630.31 123.00 20-Feb-13 210.00 216.00 350.95 67.12
Bharti Infra. Telecom 47780.21 4533.60 28-Dec-12 220.00 200.00 252.8 14.91
PC Jeweller Jewellary 2195.77 609.30 27-Dec-12 135.00 135.50 122.6 -9.19
CARE Rating Agency 3253.51 540.00 26-Dec-12 750.00 949.00 1121.9 49.59
Tara Jewels Jewellary 259.49 179.50 6-Dec-12 230.00 242.00 105.4 -54.17
VKS Projects Engineering 23.94 55.00 18-Jul-12 55.00 55.80 0.38 -99.31
Speciality Rest. Restaurants 668.01 181.96 30-May-12 150.00 153.00 142.25 -5.17
T B Z Jewellary 1178.27 210.00 9-May-12 120.00 115.00 176.6 47.17
NBCC Construction 4989 124.97 12-Apr-12 106.00 100.00 415.75 292.22
MT Educare Miscellaneous 457.23 99.00 12-Apr-12 80.00 86.05 114.9 43.63
Olympic card. Media 38.41 24.75 28-Mar-12 30.00 29.95 23.55 -21.50
Multi Comm. Exc. Exchange 3597.23 663.31 9-Mar-12 1032.00 1387.00 705.2 -31.67
Indo Thai Sec. Finance 19.75 29.60 2-Nov-11 74.00 75.00 19.75 -73.31
Vaswani Inds. Steel 13.12 49.00 24-Oct-11 49.00 33.45 4.58 -90.65
Flexituff Intl. Packaging 609.81 104.63 19-Oct-11 155.00 155.00 245.1 58.13
Prakash Constro. Construction 40.6 60.00 4-Oct-11 138.00 145.00 3.23 -97.66
PG Electro. Consumer Durables 261.99 120.65 26-Sep-11 210.00 200.00 159.65 -23.98
SRS Jewellary 402.55 203.00 16-Sep-11 58.00 55.00 28.9 -50.17
TD Power Sys. Capital Goods 1022.63 227.00 8-Sep-11 256.00 251.60 307.65 20.18
Tree House Edu. Miscellaneous 1360.61 112.06 26-Aug-11 135.00 132.80 363.8 169.48
Inventure Grow. Finance 97.78 81.90 4-Aug-11 117.00 119.00 11.64 -90.05
Readymade Steel Steel 391.85 34.75 13-Jul-11 108.00 115.00 318.1 194.54
Rushil Decor Miscellaneous 61.06 40.64 7-Jul-11 72.00 81.25 42.4 -41.11
Birla Pacific Healthcare 5.94 65.18 7-Jul-11 10.00 10.10 0.53 -94.70
Timbor Home Miscellaneous 23.91 23.25 22-Jun-11 63.00 72.00 16.2 -74.29
Sanghvi Forg. Forgings 53.83 36.90 23-May-11 85.00 85.00 40.5 -52.35
Innoventive Ind. Steel 126.44 217.41 13-May-11 117.00 110.00 21.2 -81.88
Servalaksh.Paper Paper 20.78 60.00 12-May-11 29.00 30.00 4.82 -83.38
Future Consumer Finance 1690.67 750.00 10-May-11 10.00 9.50 10.58 5.80
Muthoot Finance Finance 7192.81 901.25 6-May-11 175.00 180.00 181.15 3.51
Shilpi Cable Cables 277.65 55.88 8-Apr-11 69.00 78.35 56.3 -18.41
PTC India Fin Finance 2017.87 433.28 30-Mar-11 28.00 28.00 35.9 28.21
Lovable Lingerie Textiles 626.56 93.28 24-Mar-11 205.00 261.50 372.95 81.93
Sudar Industries Textiles 72.9 69.98 11-Mar-11 77.00 74.00 32.4 -57.92
Company Sector M.Cap(In ̀ Cr.) Issue Size(in `Cr.) List Date Issue Price List Price Last Price %Gain/Loss(from Issue price)
*
16
®
MUTUAL FUND
NEWS
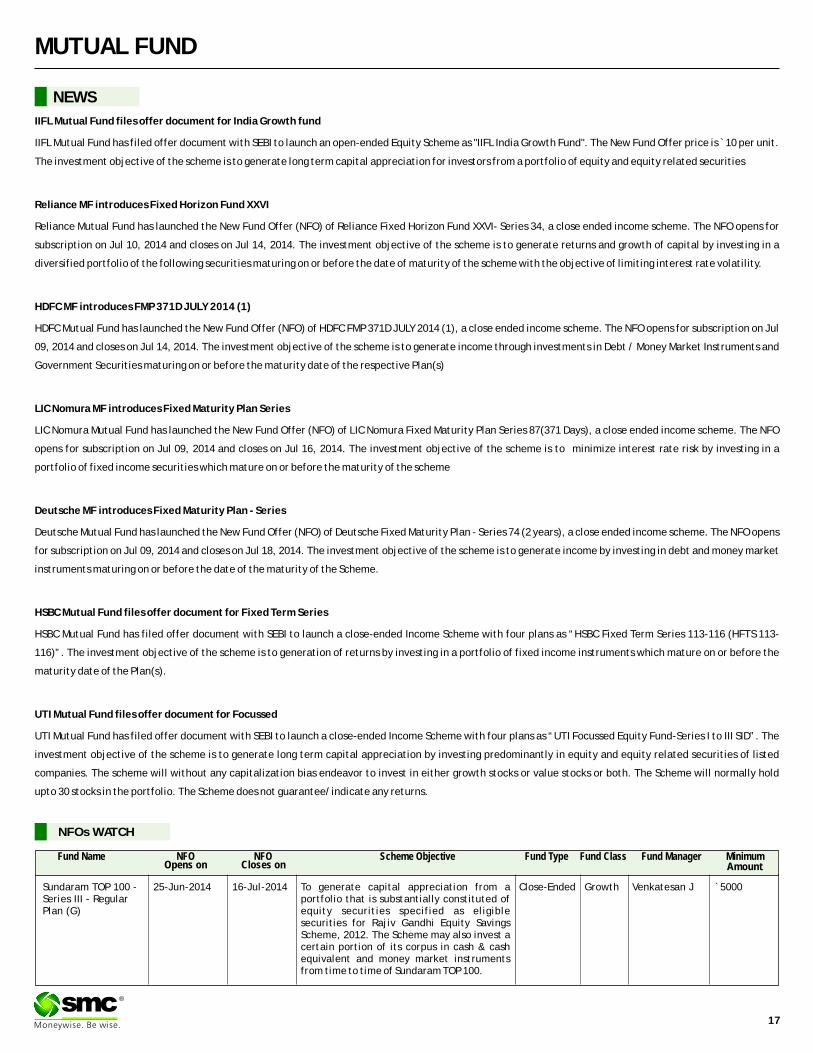
IIFL Mutual Fund files offer document for India Growth fund
IIFL Mutual Fund has filed offer document with SEBI to launch an open-ended Equity Scheme as "IIFL India Growth Fund". The New Fund Offer price is ̀ 10 per unit.
The investment objective of the scheme is to generate long term capital appreciation for investors from a portfolio of equity and equity related securities
Reliance MF introduces Fixed Horizon Fund XXVI
Reliance Mutual Fund has launched the New Fund Offer (NFO) of Reliance Fixed Horizon Fund XXVI- Series 34, a close ended income scheme. The NFO opens for
subscription on Jul 10, 2014 and closes on Jul 14, 2014. The investment objective of the scheme is to generate returns and growth of capital by investing in a
diversified portfolio of the following securities maturing on or before the date of maturity of the scheme with the objective of limiting interest rate volatility.
HDFC MF introduces FMP 371D JULY 2014 (1)
HDFC Mutual Fund has launched the New Fund Offer (NFO) of HDFC FMP 371D JULY 2014 (1), a close ended income scheme. The NFO opens for subscription on Jul
09, 2014 and closes on Jul 14, 2014. The investment objective of the scheme is to generate income through investments in Debt / Money Market Instruments and
Government Securities maturing on or before the maturity date of the respective Plan(s)
LIC Nomura MF introduces Fixed Maturity Plan Series
LIC Nomura Mutual Fund has launched the New Fund Offer (NFO) of LIC Nomura Fixed Maturity Plan Series 87(371 Days), a close ended income scheme. The NFO
opens for subscription on Jul 09, 2014 and closes on Jul 16, 2014. The investment objective of the scheme is to minimize interest rate risk by investing in a
portfolio of fixed income securities which mature on or before the maturity of the scheme
Deutsche MF introduces Fixed Maturity Plan - Series
Deutsche Mutual Fund has launched the New Fund Offer (NFO) of Deutsche Fixed Maturity Plan - Series 74 (2 years), a close ended income scheme. The NFO opens
for subscription on Jul 09, 2014 and closes on Jul 18, 2014. The investment objective of the scheme is to generate income by investing in debt and money market
instruments maturing on or before the date of the maturity of the Scheme.
HSBC Mutual Fund files offer document for Fixed Term Series
HSBC Mutual Fund has filed offer document with SEBI to launch a close-ended Income Scheme with four plans as “HSBC Fixed Term Series 113-116 (HFTS 113-
116)”. The investment objective of the scheme is to generation of returns by investing in a portfolio of fixed income instruments which mature on or before the
maturity date of the Plan(s).
UTI Mutual Fund files offer document for Focussed
UTI Mutual Fund has filed offer document with SEBI to launch a close-ended Income Scheme with four plans as “UTI Focussed Equity Fund-Series I to III SID”. The
investment objective of the scheme is to generate long term capital appreciation by investing predominantly in equity and equity related securities of listed
companies. The scheme will without any capitalization bias endeavor to invest in either growth stocks or value stocks or both. The Scheme will normally hold
upto 30 stocks in the portfolio. The Scheme does not guarantee/indicate any returns.
17
®
NFOs WATCH
Fund Name NFO NFO Scheme Objective Fund Type Fund Class Fund Manager MinimumOpens on Closes on Amount
25-Jun-2014 16-Jul-2014 Close-Ended Growth `5000Sundaram TOP 100 - Series III - Regular Plan (G)
Venkatesan JTo generate capital appreciation from a portfolio that is substantially constituted of equity securities specified as eligible securities for Rajiv Gandhi Equity Savings Scheme, 2012. The Scheme may also invest a certain portion of its corpus in cash & cash equivalent and money market instruments from time to time of Sundaram TOP 100.
18
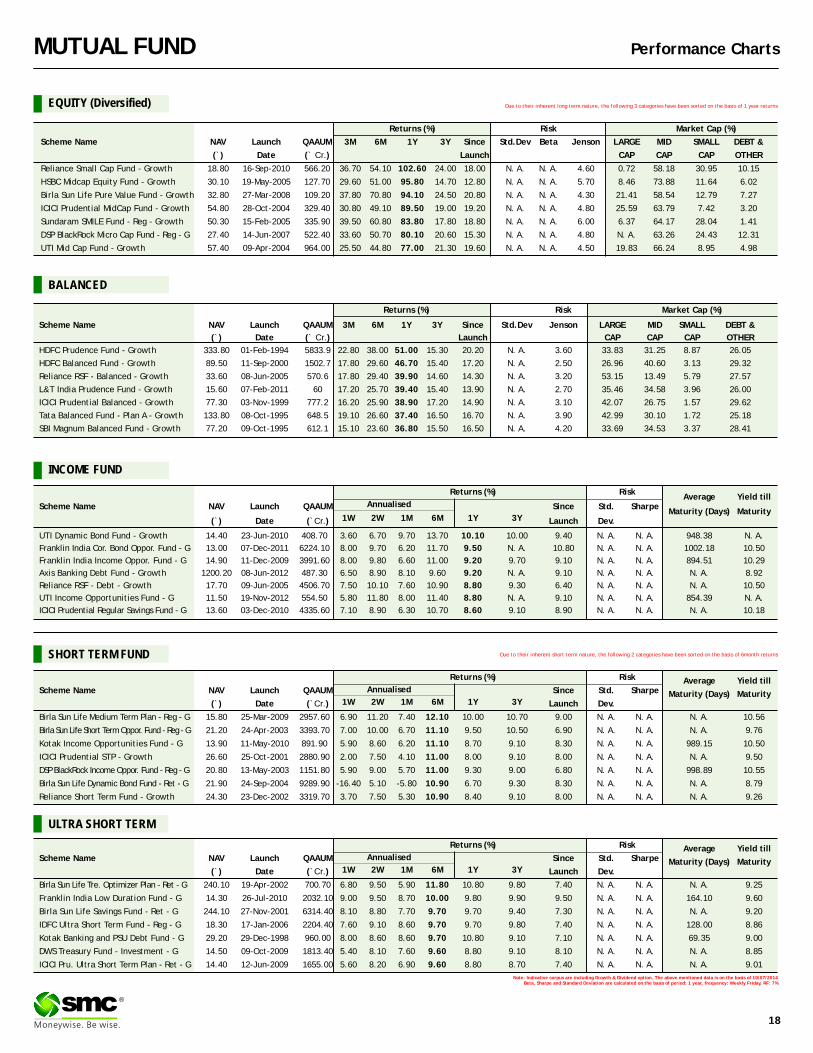
MUTUAL FUND Performance Charts
Returns (%) Risk Market Cap (%)
Scheme Name NAV Launch QAAUM 3M 6M 1Y 3Y Since Std.Dev Beta Jenson LARGE MID SMALL DEBT &
(`) Date (` Cr.) Launch CAP CAP CAP OTHER
Reliance Small Cap Fund - Growth 18.80 16-Sep-2010 566.20 36.70 54.10 102.60 24.00 18.00 N. A. N. A. 4.60 0.72 58.18 30.95 10.15
HSBC Midcap Equity Fund - Growth 30.10 19-May-2005 127.70 29.60 51.00 95.80 14.70 12.80 N. A. N. A. 5.70 8.46 73.88 11.64 6.02
Birla Sun Life Pure Value Fund - Growth 32.80 27-Mar-2008 109.20 37.80 70.80 94.10 24.50 20.80 N. A. N. A. 4.30 21.41 58.54 12.79 7.27
ICICI Prudential MidCap Fund - Growth 54.80 28-Oct-2004 329.40 30.80 49.10 89.50 19.00 19.20 N. A. N. A. 4.80 25.59 63.79 7.42 3.20
Sundaram SMILE Fund - Reg - Growth 50.30 15-Feb-2005 335.90 39.50 60.80 83.80 17.80 18.80 N. A. N. A. 6.00 6.37 64.17 28.04 1.41
DSP BlackRock Micro Cap Fund - Reg - G 27.40 14-Jun-2007 522.40 33.60 50.70 80.10 20.60 15.30 N. A. N. A. 4.80 N. A. 63.26 24.43 12.31
UTI Mid Cap Fund - Growth 57.40 09-Apr-2004 964.00 25.50 44.80 77.00 21.30 19.60 N. A. N. A. 4.50 19.83 66.24 8.95 4.98
EQUITY (Diversified)
BALANCED
INCOME FUND
Note: Indicative corpus are including Growth & Dividend option. The above mentioned data is on the basis of 10/07/2014Beta, Sharpe and Standard Deviation are calculated on the basis of period: 1 year, frequency: Weekly Friday, RF: 7%
ULTRA SHORT TERM
SHORT TERM FUND
Due to their inherent long term nature, the following 3 categories have been sorted on the basis of 1 year returns
Due to their inherent short term nature, the following 2 categories have been sorted on the basis of 6month returns
Returns (%) Risk Market Cap (%)
Scheme Name NAV Launch QAAUM 3M 6M 1Y 3Y Since Std.Dev Jenson LARGE MID SMALL DEBT &
(`) Date (` Cr.) Launch CAP CAP CAP OTHER
HDFC Prudence Fund - Growth 333.80 01-Feb-1994 5833.9 22.80 38.00 51.00 15.30 20.20 N. A. 3.60 33.83 31.25 8.87 26.05
HDFC Balanced Fund - Growth 89.50 11-Sep-2000 1502.7 17.80 29.60 46.70 15.40 17.20 N. A. 2.50 26.96 40.60 3.13 29.32
Reliance RSF - Balanced - Growth 33.60 08-Jun-2005 570.6 17.80 29.40 39.90 14.60 14.30 N. A. 3.20 53.15 13.49 5.79 27.57
L&T India Prudence Fund - Growth 15.60 07-Feb-2011 60 17.20 25.70 39.40 15.40 13.90 N. A. 2.70 35.46 34.58 3.96 26.00
ICICI Prudential Balanced - Growth 77.30 03-Nov-1999 777.2 16.20 25.90 38.90 17.20 14.90 N. A. 3.10 42.07 26.75 1.57 29.62
Tata Balanced Fund - Plan A - Growth 133.80 08-Oct-1995 648.5 19.10 26.60 37.40 16.50 16.70 N. A. 3.90 42.99 30.10 1.72 25.18
SBI Magnum Balanced Fund - Growth 77.20 09-Oct-1995 612.1 15.10 23.60 36.80 15.50 16.50 N. A. 4.20 33.69 34.53 3.37 28.41
Returns (%) RiskAverage Yield till
Scheme Name NAV Launch QAAUM Since Std. SharpeMaturity (Days) Maturity
1W 2W 1M 6M 1Y 3Y(`) Date (`Cr.) Launch Dev.
UTI Dynamic Bond Fund - Growth 14.40 23-Jun-2010 408.70 3.60 6.70 9.70 13.70 10.10 10.00 9.40 N. A. N. A. 948.38 N. A.
Franklin India Cor. Bond Oppor. Fund - G 13.00 07-Dec-2011 6224.10 8.00 9.70 6.20 11.70 9.50 N. A. 10.80 N. A. N. A. 1002.18 10.50
Franklin India Income Oppor. Fund - G 14.90 11-Dec-2009 3991.60 8.00 9.80 6.60 11.00 9.20 9.70 9.10 N. A. N. A. 894.51 10.29
Axis Banking Debt Fund - Growth 1200.20 08-Jun-2012 487.30 6.50 8.90 8.10 9.60 9.20 N. A. 9.10 N. A. N. A. N. A. 8.92
Reliance RSF - Debt - Growth 17.70 09-Jun-2005 4506.70 7.50 10.10 7.60 10.90 8.80 9.30 6.40 N. A. N. A. N. A. 10.50
UTI Income Opportunities Fund - G 11.50 19-Nov-2012 554.50 5.80 11.80 8.00 11.40 8.80 N. A. 9.10 N. A. N. A. 854.39 N. A.
ICICI Prudential Regular Savings Fund - G 13.60 03-Dec-2010 4335.60 7.10 8.90 6.30 10.70 8.60 9.10 8.90 N. A. N. A. N. A. 10.18
Annualised
Returns (%) Risk Average Yield tillScheme Name NAV Launch QAAUM Since Std. Sharpe Maturity (Days) Maturity
1W 2W 1M 6M 1Y 3Y(`) Date (`Cr.) Launch Dev.
Birla Sun Life Medium Term Plan - Reg - G 15.80 25-Mar-2009 2957.60 6.90 11.20 7.40 12.10 10.00 10.70 9.00 N. A. N. A. N. A. 10.56
Birla Sun Life Short Term Oppor. Fund - Reg - G 21.20 24-Apr-2003 3393.70 7.00 10.00 6.70 11.10 9.50 10.50 6.90 N. A. N. A. N. A. 9.76
Kotak Income Opportunities Fund - G 13.90 11-May-2010 891.90 5.90 8.60 6.20 11.10 8.70 9.10 8.30 N. A. N. A. 989.15 10.50
ICICI Prudential STP - Growth 26.60 25-Oct-2001 2880.90 2.00 7.50 4.10 11.00 8.00 9.10 8.00 N. A. N. A. N. A. 9.50
DSP BlackRock Income Oppor. Fund - Reg - G 20.80 13-May-2003 1151.80 5.90 9.00 5.70 11.00 9.30 9.00 6.80 N. A. N. A. 998.89 10.55
Birla Sun Life Dynamic Bond Fund - Ret - G 21.90 24-Sep-2004 9289.90 -16.40 5.10 -5.80 10.90 6.70 9.30 8.30 N. A. N. A. N. A. 8.79
Reliance Short Term Fund - Growth 24.30 23-Dec-2002 3319.70 3.70 7.50 5.30 10.90 8.40 9.10 8.00 N. A. N. A. N. A. 9.26
Annualised
Returns (%) Risk Average Yield tillScheme Name NAV Launch QAAUM Since Std. Sharpe Maturity (Days) Maturity
1W 2W 1M 6M 1Y 3Y(`) Date (`Cr.) Launch Dev.
Birla Sun Life Tre. Optimizer Plan - Ret - G 240.10 19-Apr-2002 700.70 6.80 9.50 5.90 11.80 10.80 9.80 7.40 N. A. N. A. N. A. 9.25
Franklin India Low Duration Fund - G 14.30 26-Jul-2010 2032.10 9.00 9.50 8.70 10.00 9.80 9.90 9.50 N. A. N. A. 164.10 9.60
Birla Sun Life Savings Fund - Ret - G 244.10 27-Nov-2001 6314.40 8.10 8.80 7.70 9.70 9.70 9.40 7.30 N. A. N. A. N. A. 9.20
IDFC Ultra Short Term Fund - Reg - G 18.30 17-Jan-2006 2204.40 7.60 9.10 8.60 9.70 9.70 9.80 7.40 N. A. N. A. 128.00 8.86
Kotak Banking and PSU Debt Fund - G 29.20 29-Dec-1998 960.00 8.00 8.60 8.60 9.70 10.80 9.10 7.10 N. A. N. A. 69.35 9.00
DWS Treasury Fund - Investment - G 14.50 09-Oct-2009 1813.40 5.40 8.10 7.60 9.60 8.80 9.10 8.10 N. A. N. A. N. A. 8.85
ICICI Pru. Ultra Short Term Plan - Ret - G 14.40 12-Jun-2009 1655.00 5.60 8.20 6.90 9.60 8.80 8.70 7.40 N. A. N. A. N. A. 9.01
Annualised
®

“Best Commodity Broker of the Year 2014” at Assocham Excellence Award presented to SMC Comtrade Limited on 9th July, 2014 at Hotel Le-Meridien, New Delhi
Mr. Ajay Garg (Director, SMC Group) addressing the audience during Sub-Broker Meet organised by SMC at Ahmedabad.
From Left to right : Shri Dinesh Rai, Chairman - Warehousing Development and Regulatory Authority, Department of Food and Public Distribution, Government of India
Mr. Subhash C Aggarwal, Chairman & MD-SMC Group Mr. Mahesh C Gupta, Vice Chairman & MD-SMC Group Mr. Ajay Garg, Whole Time Director – SMC Global Securities Ltd