Embed Size (px)
Citation preview

2013: Issue 359, Week: 25th - 28th FebruaryA Weekly Update from SMC(For private circulation only)
WISE M NEY
Bra
nd
sm
c 1
84
®

(Saurabh Jain)
Contents
Equity 4-7
Derivatives 8-9
Commodity 10-13
Currency 14
IPO 15
Fixed Deposit 16
Mutual Fund 17-18
EDITORIAL STAFF
Editor Saurabh Jain
Executive Editor Jagannadham Thunuguntla
+Editorial Team
Dr. R.P. Singh Nitin Murarka
Vandana Bharti Tejas Seth
Sandeep Joon Dinesh Joshi
Vineet Sood Shitij Gandhi
Dhirender Singh Bisht Subhranil Dey
Parminder Chauhan Ajay Lakra
Mudit Goyal
Content Editor Kamla Devi
Graphic Designer Pramod Chhimwal
Research Executive Simmi Chibber
REGISTERED OFFICES:
11 / 6B, Shanti Chamber, Pusa Road, New Delhi 110005.
Tel: 91-11-30111000, Fax: 91-11-25754365
MUMBAI OFFICE:
Dheeraj Sagar, 1st Floor, Opp. Goregaon sports Club, Link Road
Malad (West), Mumbai 400064
Tel: 91-22-67341600, Fax: 91-22-28805606
KOLKATA OFFICE:
18,Rabindra Sarani, Poddar Court, Gate No-4, 4th & 5th Floor,
Kolkata-700001
Tel : 91-33-39847000/39801300, Fax No : 91-33-39847004
AHMEDABAD OFFICE :
10/A, 4th Floor, Kalapurnam Building, Near Municipal Market,
C G Road, Ahmedabad-380009, Gujarat
Tel : 91-79-26424801 - 05, 40049801 - 03
CHENNAI OFFICE:
2nd Floor, Mookambika Complex, 4, Lady Desikachari Road,
Mylapore, Chennai-600004
Tel: 91- 44 - 39109100 Fax: 91- 44 - 39109111
SECUNDERABAD OFFICE:
206, 3rd Floor, above CMR Exclusive, Bhuvana Towers, S.D.Road,
Secunderabad - 500003
Tel: 91-40-30780298/99, 39109536
DUBAI OFFICE:
312, Belshalat Building, Al Karama, Dubai, P.O. Box 117210, U.A.E.
Tel: 97143963120, Mobile : 971502612483
Fax : 9714 3963122
Email ID : [email protected]
Printed and Published on behalf of
Mr. Saurabh Jain @ Publication Address
11/6B, Shanti Chamber, Pusa Road, New Delhi-110005
Website: www.smcindiaonline.com
Investor Grievance : [email protected]
Printed at: KOZMIC STYLE OFFSET
D-137, Okhla Industrial Area, Phase-I, New Delhi - 110020 (India)
Ph.: +91-11- 46251190, Email: [email protected]
tock markets globally witnessed pressure on the apprehension that the
easy global liquidity, which is a significant factor driving asset classes may Sget a stroke as the Minutes of Federal Open Market Committee suggested
about the possibility of reduction in asset purchase program. Economic data out
of U.S. and Europe also showed mild weakness along with concern that will put
some measures to curb rise in property prices. Services and manufacturing
activity contracted at a more than expected pace in the Euro Area.
Back at home, the budget session is about to start and investors are anxious to see
what policies are in the offing. Implementation of Goods and Services tax and
disinvestment target for the ensuing fiscal are some of the key things among
many that markets are eyeing on. Recently, the cancellation of auction of Rs
12,000 crore worth of bonds boosted the sentiments as it reinforces the
confidence that fiscal deficit would be contained within the revised target of
5.3% of GDP. RBI Chief, Subbarao during a speech in Moscow said that the RBI has
limited room to cut interest rates to spur growth in the economy that is seeing
weakest economic expansion in the last one decade. RBI would also see the
government stance on fiscal consolidation as it would be a critical factor in its
decision making. Overall, the expectation is that the budget would be pro-
growth and investor friendly and no major alterations are expected in duties and
taxes as corporate and individuals are already seeing pressure because of lower
growth. As regard to capital markets, we expect a cut in Security Transaction tax
(STT) as delivery volumes have nearly dropped to 3% and some simplification to
the Rajiv Gandhi Equity Saving Scheme which was announced last year.
On the commodities front, sentiment towards the metals has changed, after it
saw a freefall last week. Most of them had touched multi months low as some
Federal Reserve officials were reconsidering the scale and duration of the U.S.
monetary stimulus programme had confused investors. Dollar re-strengthened in
past three week also pressurized commodities prices. Now traders should adopt
“Wait and watch” strategy before taking any large position. Physical buyers of
gold and silver may jump at this level, but investors are mostly cautiously
watching the next move. Crude oil may see further correction whereas some
lower level buying is expected in metals. However sustainability at higher levels
is still doubtful. Many important economic releases such as consumer
confidence, durable goods order, GDP, Personal Consumption Expenditure,
Michigan Confidence and ISM manufacturing of US, GDP of UK and Canada, CPI
data of euro zone and Germany, PMI data of China etc will keep the investors on
toes throughout the week.
From The Desk Of Editor
4
NOTES:
1) These levels should not be confused with the daily trend sheet, which is sent every morning by e-mail in the name of "Morning Mantra ".
2) S1 & S2 indicate first support & second support respectively & R1 & R2 indicate first resistance and second resistance respectively.
3) Sometimes you will find the stop loss to be too far but if we change the stop loss once, we will find more strength coming into the stock. At the moment, the stop loss will be far as we are seeing the graphs on weekly basis and taking a long-term view and not a short-term view.
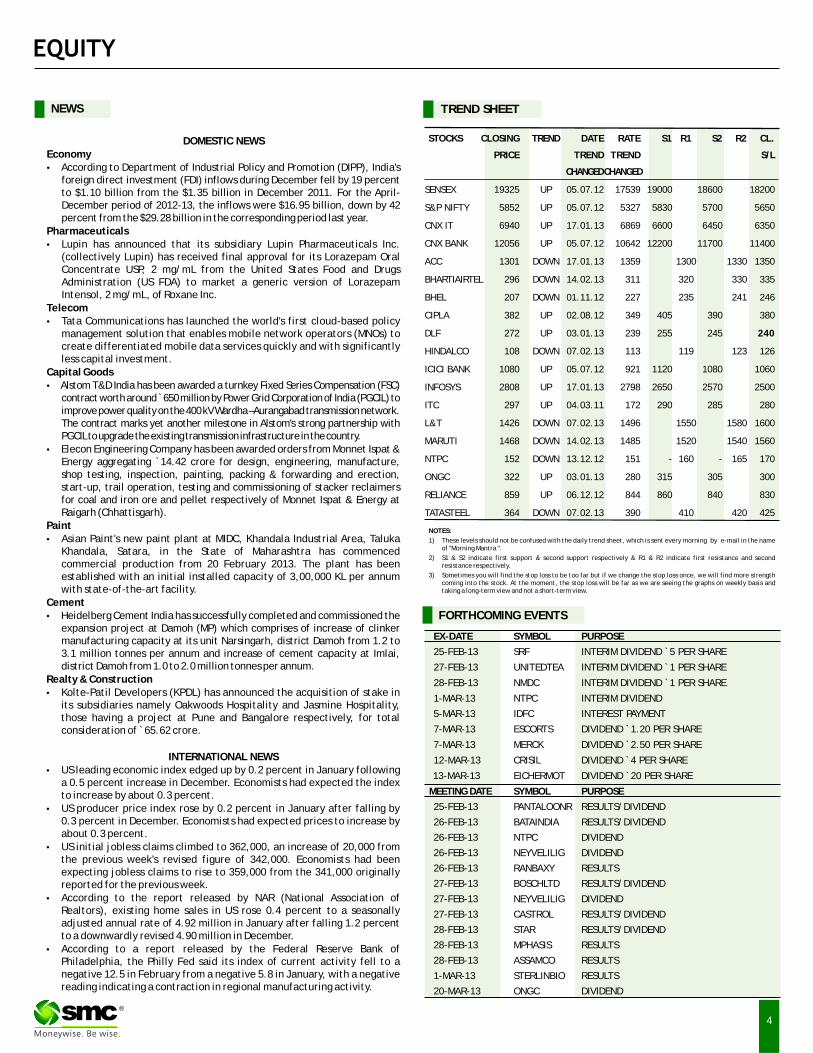
TREND SHEET
STOCKS CLOSING TREND DATE RATE S1 R1 S2 R2 CL.
PRICE TREND TREND S/L
CHANGEDCHANGED
SENSEX 19325 UP 05.07.12 17539 19000 18600 18200
S&P NIFTY 5852 UP 05.07.12 5327 5830 5700 5650
CNX IT 6940 UP 17.01.13 6869 6600 6450 6350
CNX BANK 12056 UP 05.07.12 10642 12200 11700 11400
ACC 1301 DOWN 17.01.13 1359 1300 1330 1350
BHARTIAIRTEL 296 DOWN 14.02.13 311 320 330 335
BHEL 207 DOWN 01.11.12 227 235 241 246
CIPLA 382 UP 02.08.12 349 405 390 380
DLF 272 UP 03.01.13 239 255 245 240
HINDALCO 108 DOWN 07.02.13 113 119 123 126
ICICI BANK 1080 UP 05.07.12 921 1120 1080 1060
INFOSYS 2808 UP 17.01.13 2798 2650 2570 2500
ITC 297 UP 04.03.11 172 290 285 280
L&T 1426 DOWN 07.02.13 1496 1550 1580 1600
MARUTI 1468 DOWN 14.02.13 1485 1520 1540 1560
NTPC 152 DOWN 13.12.12 151 - 160 - 165 170
ONGC 322 UP 03.01.13 280 315 305 300
RELIANCE 859 UP 06.12.12 844 860 840 830
TATASTEEL 364 DOWN 07.02.13 390 410 420 425
NEWS
EX-DATE SYMBOL PURPOSE
25-FEB-13 SRF INTERIM DIVIDEND `5 PER SHARE
27-FEB-13 UNITEDTEA INTERIM DIVIDEND `1 PER SHARE
28-FEB-13 NMDC INTERIM DIVIDEND `1 PER SHARE
1-MAR-13 NTPC INTERIM DIVIDEND
5-MAR-13 IDFC INTEREST PAYMENT
7-MAR-13 ESCORTS DIVIDEND `1.20 PER SHARE
7-MAR-13 MERCK DIVIDEND `2.50 PER SHARE
12-MAR-13 CRISIL DIVIDEND `4 PER SHARE
13-MAR-13 EICHERMOT DIVIDEND `20 PER SHARE
MEETING DATE SYMBOL PURPOSE
25-FEB-13 PANTALOONR RESULTS/DIVIDEND
26-FEB-13 BATAINDIA RESULTS/DIVIDEND
26-FEB-13 NTPC DIVIDEND
26-FEB-13 NEYVELILIG DIVIDEND
26-FEB-13 RANBAXY RESULTS
27-FEB-13 BOSCHLTD RESULTS/DIVIDEND
27-FEB-13 NEYVELILIG DIVIDEND
27-FEB-13 CASTROL RESULTS/DIVIDEND
28-FEB-13 STAR RESULTS/DIVIDEND
28-FEB-13 MPHASIS RESULTS
28-FEB-13 ASSAMCO RESULTS
1-MAR-13 STERLINBIO RESULTS
20-MAR-13 ONGC DIVIDEND
FORTHCOMING EVENTS
DOMESTIC NEWSEconomy·According to Department of Industrial Policy and Promotion (DIPP), India's
foreign direct investment (FDI) inflows during December fell by 19 percent to $1.10 billion from the $1.35 billion in December 2011. For the April-December period of 2012-13, the inflows were $16.95 billion, down by 42 percent from the $29.28 billion in the corresponding period last year.
Pharmaceuticals·Lupin has announced that its subsidiary Lupin Pharmaceuticals Inc.
(collectively Lupin) has received final approval for its Lorazepam Oral Concentrate USP, 2 mg/mL from the United States Food and Drugs Administration (US FDA) to market a generic version of Lorazepam Intensol, 2 mg/mL, of Roxane Inc.
Telecom·Tata Communications has launched the world's first cloud-based policy
management solution that enables mobile network operators (MNOs) to create differentiated mobile data services quickly and with significantly less capital investment.
Capital Goods·Alstom T&D India has been awarded a turnkey Fixed Series Compensation (FSC)
contract worth around ̀ 650 million by Power Grid Corporation of India (PGCIL) to improve power quality on the 400 kV Wardha – Aurangabad transmission network. The contract marks yet another milestone in Alstom's strong partnership with PGCIL to upgrade the existing transmission infrastructure in the country.
·Elecon Engineering Company has been awarded orders from Monnet Ispat & Energy aggregating `14.42 crore for design, engineering, manufacture, shop testing, inspection, painting, packing & forwarding and erection, start-up, trail operation, testing and commissioning of stacker reclaimers for coal and iron ore and pellet respectively of Monnet Ispat & Energy at Raigarh (Chhattisgarh).
Paint·Asian Paint's new paint plant at MIDC, Khandala Industrial Area, Taluka
Khandala, Satara, in the State of Maharashtra has commenced commercial production from 20 February 2013. The plant has been established with an initial installed capacity of 3,00,000 KL per annum with state-of-the-art facility.
Cement·Heidelberg Cement India has successfully completed and commissioned the
expansion project at Damoh (MP) which comprises of increase of clinker manufacturing capacity at its unit Narsingarh, district Damoh from 1.2 to 3.1 million tonnes per annum and increase of cement capacity at Imlai, district Damoh from 1.0 to 2.0 million tonnes per annum.
Realty & Construction·Kolte-Patil Developers (KPDL) has announced the acquisition of stake in
its subsidiaries namely Oakwoods Hospitality and Jasmine Hospitality, those having a project at Pune and Bangalore respectively, for total consideration of ̀ 65.62 crore.
INTERNATIONAL NEWS·US leading economic index edged up by 0.2 percent in January following
a 0.5 percent increase in December. Economists had expected the index to increase by about 0.3 percent.
·US producer price index rose by 0.2 percent in January after falling by 0.3 percent in December. Economists had expected prices to increase by about 0.3 percent.
·US initial jobless claims climbed to 362,000, an increase of 20,000 from the previous week's revised figure of 342,000. Economists had been expecting jobless claims to rise to 359,000 from the 341,000 originally reported for the previous week.
·According to the report released by NAR (National Association of Realtors), existing home sales in US rose 0.4 percent to a seasonally adjusted annual rate of 4.92 million in January after falling 1.2 percent to a downwardly revised 4.90 million in December.
·According to a report released by the Federal Reserve Bank of Philadelphia, the Philly Fed said its index of current activity fell to a negative 12.5 in February from a negative 5.8 in January, with a negative reading indicating a contraction in regional manufacturing activity.
®
5
BSE SENSEX GAINERS & LOSERS TOP (% Change) NSE NIFTY GAINERS TOP & LOSERS (% Change)
SECTORAL INDICES (% Change)
SMC Trend
SMC Trend
FMCGHealthcare
FTSE 100CAC 40
Auto BankRealty
Cap GoodsCons Durable
Oil & GasPower
NasdaqDow jonesS&P 500
NikkeiStrait times
Hang SengShanghai
INSTITUTIONAL ACTIVITY (Equity) (` Crore)
ITMetal
* Shanghai market was closed on account of New Year Celebration Down SidewaysUp
SMC Trend
Nifty BSE Midcap Nifty JuniorSensex BSE Smallcap S&P CNX 500
GLOBAL INDICES (% Change)
INDIAN INDICES (% Change)
®
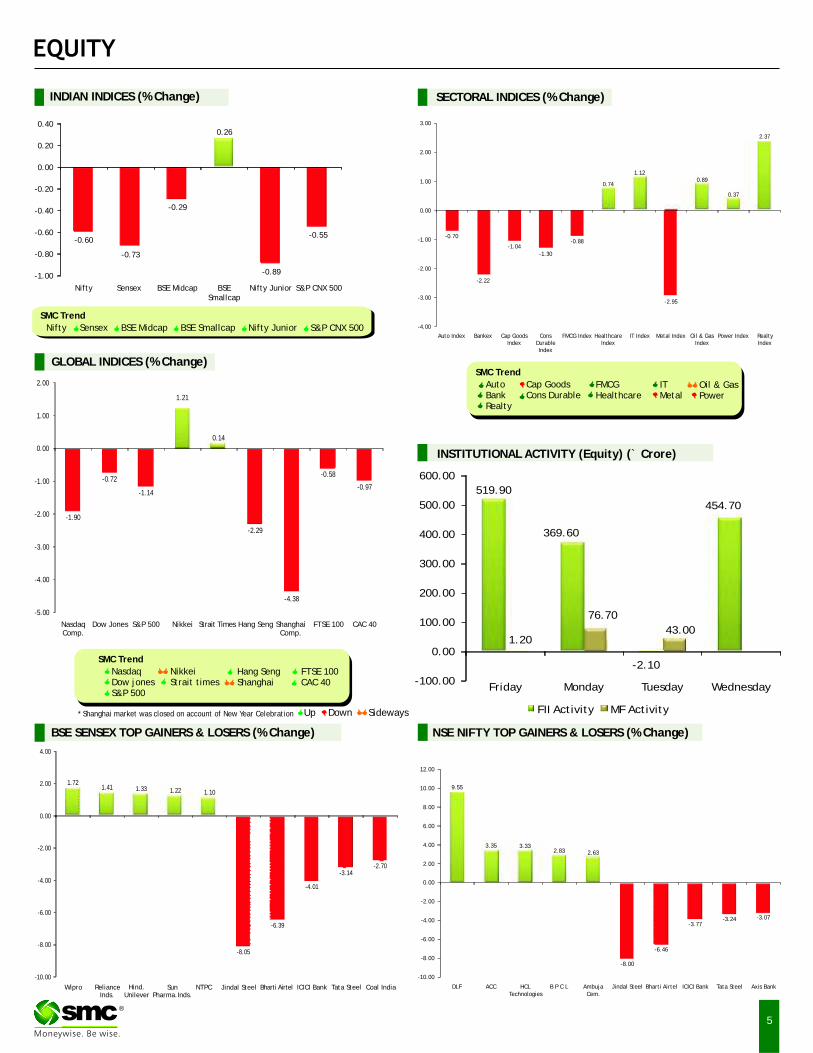
519.90
369.60
-2.10
454.70
1.20
76.70
43.00
-100.00
0.00
100.00
200.00
300.00
400.00
500.00
600.00
Friday Monday Tuesday Wednesday
FII Activity MF Activity
-0.60
-0.73
-0.29
0.26
-0.89
-0.55
-1.00
-0.80
-0.60
-0.40
-0.20
0.00
0.20
0.40
Nifty Sensex BSE Midcap BSE Smallcap
Nifty Junior S&P CNX 500
-0.70
-2.22
-1.04-1.30
-0.88
0.74
1.12
-2.95
0.89
0.37
2.37
-4.00
-3.00
-2.00
-1.00
0.00
1.00
2.00
3.00
Auto Index Bankex Cap Goods Index
Cons Durable Index
FMCG Index Healthcare Index
IT Index Metal Index Oil & Gas Index
Power Index Realty Index
-1.90
-0.72
-1.14
1.21
0.14
-2.29
-4.38
-0.58
-0.97
-5.00
-4.00
-3.00
-2.00
-1.00
0.00
1.00
2.00
Nasdaq Comp.
Dow Jones S&P 500 Nikkei Strait Times Hang Seng Shanghai Comp.
FTSE 100 CAC 40
1.721.41 1.33 1.22 1.10
-8.05
-6.39
-4.01
-3.14-2.70
-10.00
-8.00
-6.00
-4.00
-2.00
0.00
2.00
4.00
Wipro Reliance Inds.
Hind. Unilever
Sun Pharma.Inds.
NTPC Jindal Steel Bharti Airtel ICICI Bank Tata Steel Coal India
9.55
3.35 3.332.83 2.63
-8.00
-6.46
-3.77-3.24 -3.07
-10.00
-8.00
-6.00
-4.00
-2.00
0.00
2.00
4.00
6.00
8.00
10.00
12.00
DLF ACC HCL Technologies
B P C L Ambuja Cem.
Jindal Steel Bharti Airtel ICICI Bank Tata Steel Axis Bank
Above calls are recommended with a time horizon of 1 year.
Beat the street - Fundamental Analysis
6®
Face Value (`) 10.00
52 Week High/Low 449.00 / 305.98
M.Cap (` Cr.) 28203.74
EPS (`) 25.01
P/E Ratio (times) 15.60
P/B Ratio (times) 1.89
Stock Exchange BSE
VALUE PARAMETERS
% OF SHARE HOLDING
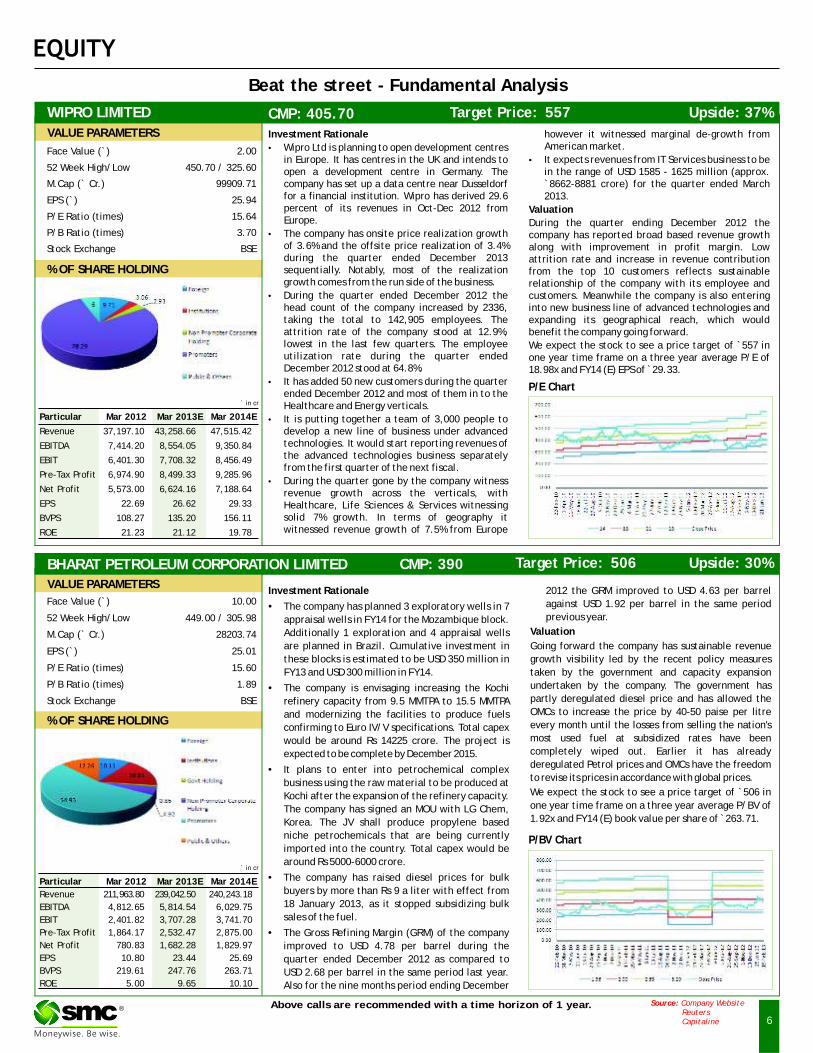
BHARAT PETROLEUM CORPORATION LIMITED CMP: 390 Upside: 30%Target Price: 506
Investment Rationale 2012 the GRM improved to USD 4.63 per barrel
against USD 1.92 per barrel in the same period ·The company has planned 3 exploratory wells in 7 previous year.appraisal wells in FY14 for the Mozambique block.
ValuationAdditionally 1 exploration and 4 appraisal wells
are planned in Brazil. Cumulative investment in Going forward the company has sustainable revenue
these blocks is estimated to be USD 350 million in growth visibility led by the recent policy measures
FY13 and USD 300 million in FY14. taken by the government and capacity expansion
undertaken by the company. The government has ·The company is envisaging increasing the Kochi partly deregulated diesel price and has allowed the refinery capacity from 9.5 MMTPA to 15.5 MMTPA OMCs to increase the price by 40-50 paise per litre and modernizing the facilities to produce fuels every month until the losses from selling the nation's confirming to Euro IV/V specifications. Total capex most used fuel at subsidized rates have been would be around Rs 14225 crore. The project is completely wiped out. Earlier it has already expected to be complete by December 2015.deregulated Petrol prices and OMCs have the freedom ·It plans to enter into petrochemical complex to revise its prices in accordance with global prices.
business using the raw material to be produced at We expect the stock to see a price target of `506 in Kochi after the expansion of the refinery capacity. one year time frame on a three year average P/BV of The company has signed an MOU with LG Chem, 1.92x and FY14 (E) book value per share of ̀ 263.71.Korea. The JV shall produce propylene based
niche petrochemicals that are being currently
imported into the country. Total capex would be
around Rs 5000-6000 crore.
·The company has raised diesel prices for bulk
buyers by more than Rs 9 a liter with effect from
18 January 2013, as it stopped subsidizing bulk
sales of the fuel.
·The Gross Refining Margin (GRM) of the company
improved to USD 4.78 per barrel during the
quarter ended December 2012 as compared to
USD 2.68 per barrel in the same period last year.
Also for the nine months period ending December
` in cr
Particular Mar 2012 Mar 2013E Mar 2014E
Revenue 211,963.80 239,042.50 240,243.18
EBITDA 4,812.65 5,814.54 6,029.75
EBIT 2,401.82 3,707.28 3,741.70
Pre-Tax Profit 1,864.17 2,532.47 2,875.00
Net Profit 780.83 1,682.28 1,829.97
EPS 10.80 23.44 25.69
BVPS 219.61 247.76 263.71
ROE 5.00 9.65 10.10
P/BV Chart
Face Value (`) 2.00
52 Week High/Low 450.70 / 325.60
M.Cap (` Cr.) 99909.71
EPS (`) 25.94
P/E Ratio (times) 15.64
P/B Ratio (times) 3.70
Stock Exchange BSE
` in cr
Particular Mar 2012 Mar 2013E Mar 2014E
Revenue 37,197.10 43,258.66 47,515.42
EBITDA 7,414.20 8,554.05 9,350.84
EBIT 6,401.30 7,708.32 8,456.49
Pre-Tax Profit 6,974.90 8,499.33 9,285.96
Net Profit 5,573.00 6,624.16 7,188.64
EPS 22.69 26.62 29.33
BVPS 108.27 135.20 156.11
ROE 21.23 21.12 19.78
VALUE PARAMETERS
% OF SHARE HOLDING
WIPRO LIMITED CMP: 405.70
Investment Rationale however it witnessed marginal de-growth from American market.·Wipro Ltd is planning to open development centres
in Europe. It has centres in the UK and intends to ·It expects revenues from IT Services business to be open a development centre in Germany. The in the range of USD 1585 - 1625 million (approx. company has set up a data centre near Dusseldorf `8662-8881 crore) for the quarter ended March for a financial institution. Wipro has derived 29.6 2013. percent of its revenues in Oct-Dec 2012 from ValuationEurope. During the quarter ending December 2012 the
·The company has onsite price realization growth company has reported broad based revenue growth of 3.6% and the offsite price realization of 3.4% along with improvement in profit margin. Low during the quarter ended December 2013 attrition rate and increase in revenue contribution sequentially. Notably, most of the realization from the top 10 customers reflects sustainable growth comes from the run side of the business. relationship of the company with its employee and
·During the quarter ended December 2012 the customers. Meanwhile the company is also entering head count of the company increased by 2336, into new business line of advanced technologies and taking the total to 142,905 employees. The expanding its geographical reach, which would attrition rate of the company stood at 12.9%, benefit the company going forward.lowest in the last few quarters. The employee We expect the stock to see a price target of `557 in utilization rate during the quarter ended one year time frame on a three year average P/E of December 2012 stood at 64.8%. 18.98x and FY14 (E) EPS of ̀ 29.33.
·It has added 50 new customers during the quarter ended December 2012 and most of them in to the Healthcare and Energy verticals.
·It is putting together a team of 3,000 people to develop a new line of business under advanced technologies. It would start reporting revenues of the advanced technologies business separately from the first quarter of the next fiscal.
·During the quarter gone by the company witness revenue growth across the verticals, with Healthcare, Life Sciences & Services witnessing solid 7% growth. In terms of geography it witnessed revenue growth of 7.5% from Europe
P/E Chart
Upside: 37%Target Price: 557
Source: Company Website Reuters Capitaline
Charts by Spider Software India Ltd
7
EQUITY
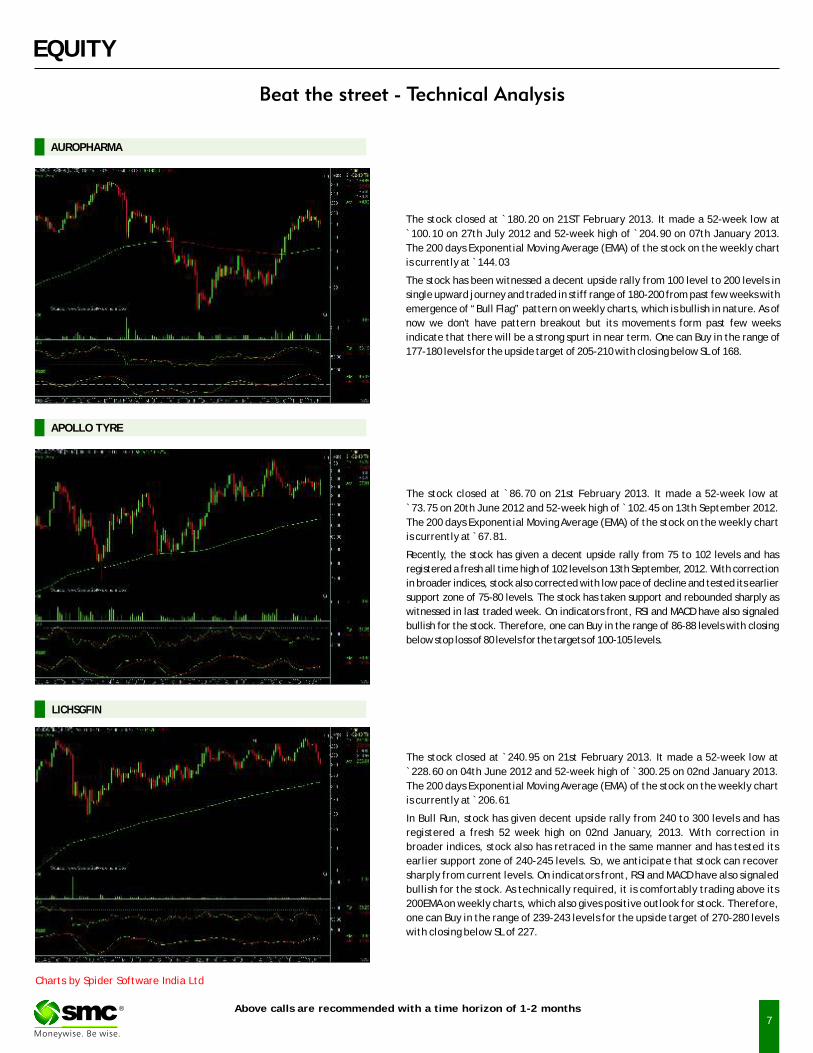
The stock closed at `180.20 on 21ST February 2013. It made a 52-week low at
`100.10 on 27th July 2012 and 52-week high of `204.90 on 07th January 2013.
The 200 days Exponential Moving Average (EMA) of the stock on the weekly chart
is currently at ̀ 144.03
The stock has been witnessed a decent upside rally from 100 level to 200 levels in
single upward journey and traded in stiff range of 180-200 from past few weeks with
emergence of “Bull Flag” pattern on weekly charts, which is bullish in nature. As of
now we don't have pattern breakout but its movements form past few weeks
indicate that there will be a strong spurt in near term. One can Buy in the range of
177-180 levels for the upside target of 205-210 with closing below SL of 168.
Above calls are recommended with a time horizon of 1-2 months
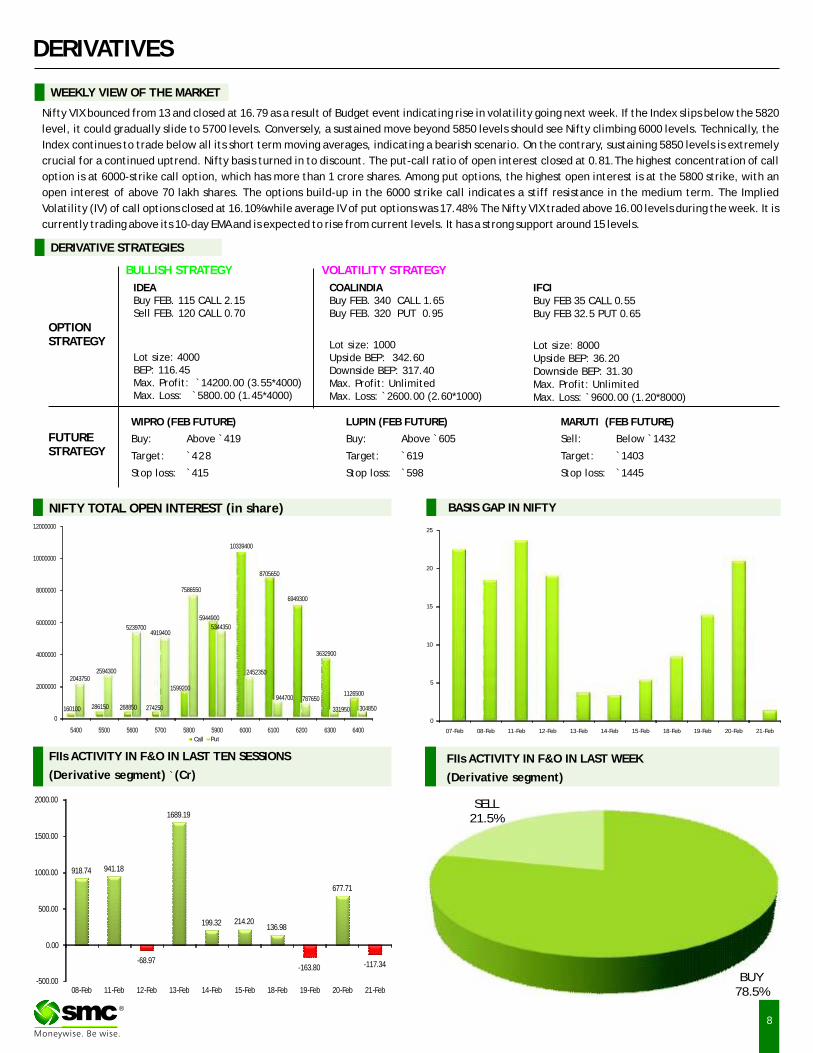
The stock closed at `86.70 on 21st February 2013. It made a 52-week low at
`73.75 on 20th June 2012 and 52-week high of ̀ 102.45 on 13th September 2012.
The 200 days Exponential Moving Average (EMA) of the stock on the weekly chart
is currently at ̀ 67.81.
Recently, the stock has given a decent upside rally from 75 to 102 levels and has
registered a fresh all time high of 102 levels on 13th September, 2012. With correction
in broader indices, stock also corrected with low pace of decline and tested its earlier
support zone of 75-80 levels. The stock has taken support and rebounded sharply as
witnessed in last traded week. On indicators front, RSI and MACD have also signaled
bullish for the stock. Therefore, one can Buy in the range of 86-88 levels with closing
below stop loss of 80 levels for the targets of 100-105 levels.
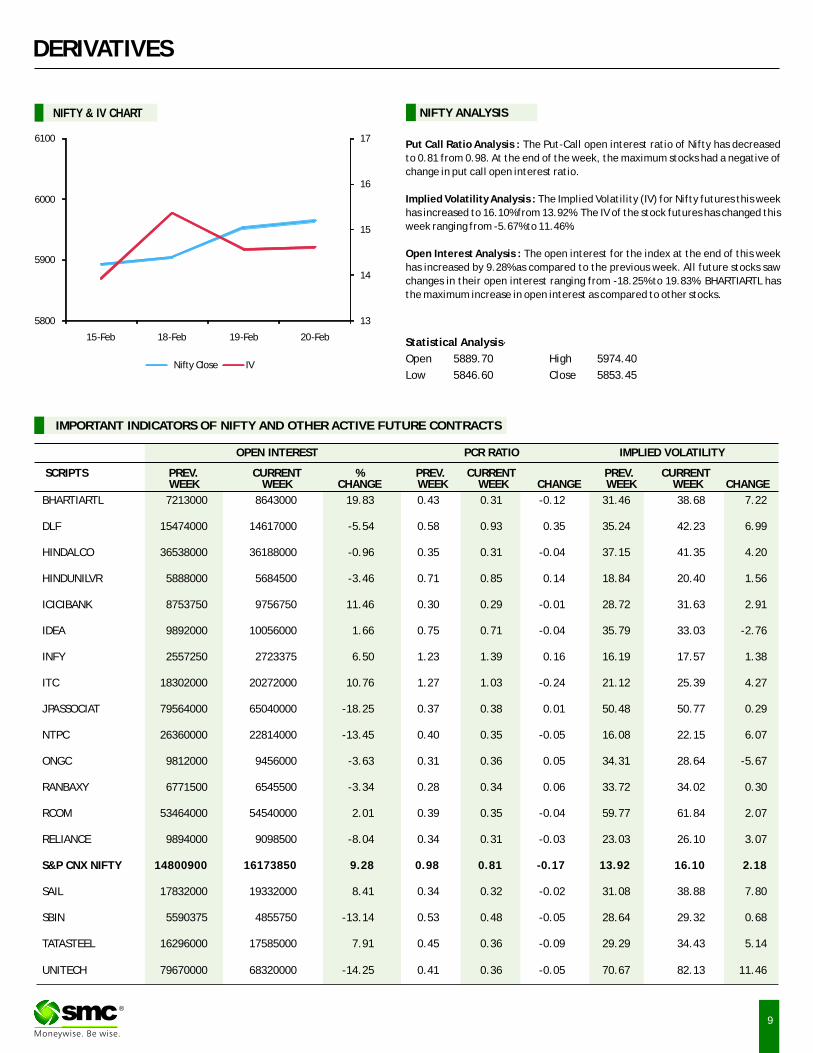
The stock closed at `240.95 on 21st February 2013. It made a 52-week low at
`228.60 on 04th June 2012 and 52-week high of `300.25 on 02nd January 2013.
The 200 days Exponential Moving Average (EMA) of the stock on the weekly chart
is currently at ̀ 206.61
In Bull Run, stock has given decent upside rally from 240 to 300 levels and has
registered a fresh 52 week high on 02nd January, 2013. With correction in
broader indices, stock also has retraced in the same manner and has tested its
earlier support zone of 240-245 levels. So, we anticipate that stock can recover
sharply from current levels. On indicators front, RSI and MACD have also signaled
bullish for the stock. As technically required, it is comfortably trading above its
200EMA on weekly charts, which also gives positive outlook for stock. Therefore,
one can Buy in the range of 239-243 levels for the upside target of 270-280 levels
with closing below SL of 227.
AUROPHARMA
LICHSGFIN
APOLLO TYRE
®
8
DERIVATIVES
BASIS GAP IN NIFTY
WIPRO (FEB FUTURE)
Buy: Above 419
Target:
Stop loss: 415
`
`428
`
LUPIN (FEB FUTURE)
Buy: Above 605
Target: `619
Stop loss: `598
`
IFCIBuy FEB 35 CALL 0.55Buy FEB 32.5 PUT 0.65
Lot size: 8000Upside BEP: 36.20Downside BEP: 31.30Max. Profit: UnlimitedMax. Loss: 9600.00 (1.20*8000)`
OPTIONSTRATEGY
FUTURESTRATEGY
IDEABuy FEB. 115 CALL 2.15Sell FEB. 120 CALL 0.70
Lot size: 4000BEP: 116.45Max. Profit: 14200.00 (3.55*4000)Max. Loss: 5800.00 (1.45*4000)
``
MARUTI (FEB FUTURE)
Sell: Below 1432
Target: 1403
Stop loss: 1445
`
`
`
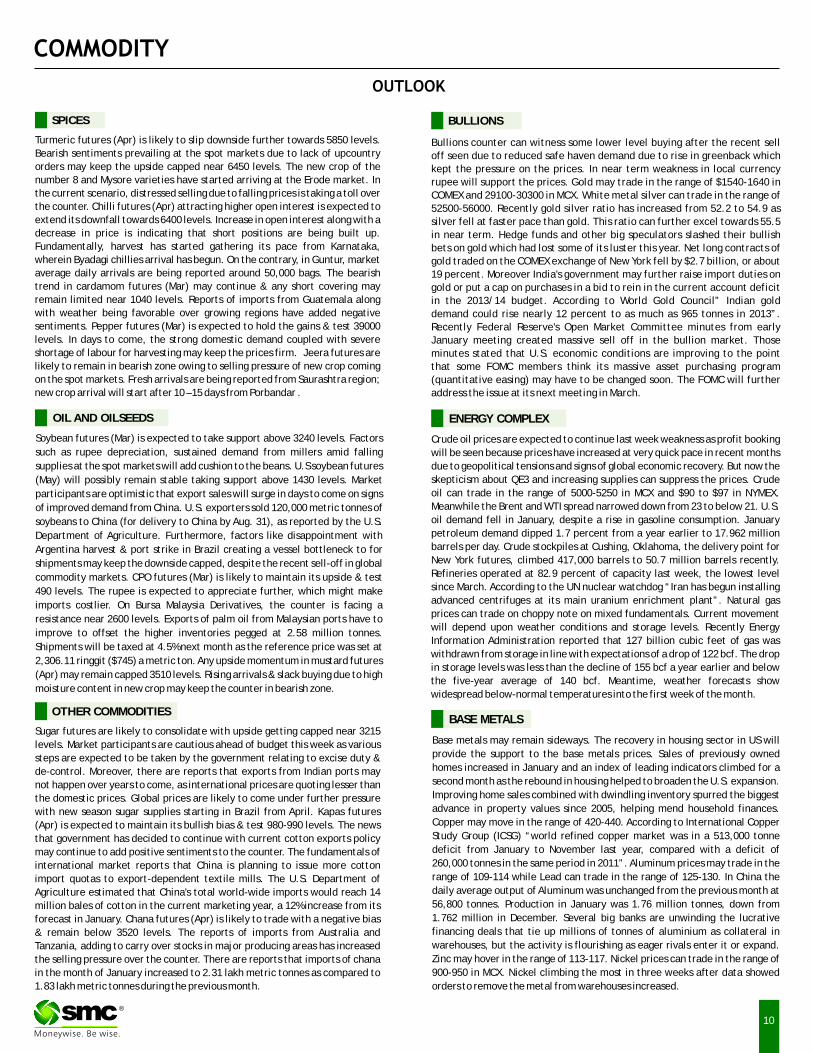
Nifty VIX bounced from 13 and closed at 16.79 as a result of Budget event indicating rise in volatility going next week. If the Index slips below the 5820
level, it could gradually slide to 5700 levels. Conversely, a sustained move beyond 5850 levels should see Nifty climbing 6000 levels. Technically, the
Index continues to trade below all its short term moving averages, indicating a bearish scenario. On the contrary, sustaining 5850 levels is extremely
crucial for a continued uptrend. Nifty basis turned in to discount. The put-call ratio of open interest closed at 0.81.The highest concentration of call
option is at 6000-strike call option, which has more than 1 crore shares. Among put options, the highest open interest is at the 5800 strike, with an
open interest of above 70 lakh shares. The options build-up in the 6000 strike call indicates a stiff resistance in the medium term. The Implied
Volatility (IV) of call options closed at 16.10% while average IV of put options was 17.48%. The Nifty VIX traded above 16.00 levels during the week. It is
currently trading above its 10-day EMA and is expected to rise from current levels. It has a strong support around 15 levels.
WEEKLY VIEW OF THE MARKET
NIFTY TOTAL OPEN INTEREST (in share)
FIIs ACTIVITY IN F&O IN LAST TEN SESSIONS
(Derivative segment) `(Cr)
FIIs ACTIVITY IN F&O IN LAST WEEK
(Derivative segment)
COALINDIABuy FEB. 340 CALL 1.65Buy FEB. 320 PUT 0.95
Lot size: 1000Upside BEP: 342.60Downside BEP: 317.40Max. Profit: UnlimitedMax. Loss: 2600.00 (2.60*1000)`
VOLATILITY STRATEGYBULLISH STRATEGY
DERIVATIVE STRATEGIES
®
160100 286150 268850 274250
1599200
5944900
10339400
8705650
6949300
3632900
1126500
20437502594300
52397004919400
7586550
5344350
2452350
944700 787650
331950 304850
0
2000000
4000000
6000000
8000000
10000000
12000000
5400 5500 5600 5700 5800 5900 6000 6100 6200 6300 6400
Call Put
0
5
10
15
20
25
07-Feb 08-Feb 11-Feb 12-Feb 13-Feb 14-Feb 15-Feb 18-Feb 19-Feb 20-Feb 21-Feb
BUY78.5%
SELL21.5%
918.74 941.18
-68.97
1689.19
199.32 214.20136.98
-163.80
677.71
-117.34
-500.00
0.00
500.00
1000.00
1500.00
2000.00
08-Feb 11-Feb 12-Feb 13-Feb 14-Feb 15-Feb 18-Feb 19-Feb 20-Feb 21-Feb
9
BHARTIARTL 7213000 8643000 19.83 0.43 0.31 -0.12 31.46 38.68 7.22
DLF 15474000 14617000 -5.54 0.58 0.93 0.35 35.24 42.23 6.99
HINDALCO 36538000 36188000 -0.96 0.35 0.31 -0.04 37.15 41.35 4.20
HINDUNILVR 5888000 5684500 -3.46 0.71 0.85 0.14 18.84 20.40 1.56
ICICIBANK 8753750 9756750 11.46 0.30 0.29 -0.01 28.72 31.63 2.91
IDEA 9892000 10056000 1.66 0.75 0.71 -0.04 35.79 33.03 -2.76
INFY 2557250 2723375 6.50 1.23 1.39 0.16 16.19 17.57 1.38
ITC 18302000 20272000 10.76 1.27 1.03 -0.24 21.12 25.39 4.27
JPASSOCIAT 79564000 65040000 -18.25 0.37 0.38 0.01 50.48 50.77 0.29
NTPC 26360000 22814000 -13.45 0.40 0.35 -0.05 16.08 22.15 6.07
ONGC 9812000 9456000 -3.63 0.31 0.36 0.05 34.31 28.64 -5.67
RANBAXY 6771500 6545500 -3.34 0.28 0.34 0.06 33.72 34.02 0.30
RCOM 53464000 54540000 2.01 0.39 0.35 -0.04 59.77 61.84 2.07
RELIANCE 9894000 9098500 -8.04 0.34 0.31 -0.03 23.03 26.10 3.07
S&P CNX NIFTY 14800900 16173850 9.28 0.98 0.81 -0.17 13.92 16.10 2.18
SAIL 17832000 19332000 8.41 0.34 0.32 -0.02 31.08 38.88 7.80
SBIN 5590375 4855750 -13.14 0.53 0.48 -0.05 28.64 29.32 0.68
TATASTEEL 16296000 17585000 7.91 0.45 0.36 -0.09 29.29 34.43 5.14
UNITECH 79670000 68320000 -14.25 0.41 0.36 -0.05 70.67 82.13 11.46
IMPORTANT INDICATORS OF NIFTY AND OTHER ACTIVE FUTURE CONTRACTS
OPEN INTEREST PCR RATIO IMPLIED VOLATILITY
SCRIPTS PREV. CURRENT % PREV. CURRENT PREV. CURRENT WEEK WEEK CHANGE WEEK WEEK CHANGE WEEK WEEK CHANGE
DERIVATIVES
Put Call Ratio Analysis : The Put-Call open interest ratio of Nifty has decreased
to 0.81 from 0.98. At the end of the week, the maximum stocks had a negative of
change in put call open interest ratio.
Implied Volatility Analysis : The Implied Volatility (IV) for Nifty futures this week
has increased to 16.10% from 13.92%. The IV of the stock futures has changed this
week ranging from -5.67% to 11.46%.
Open Interest Analysis : The open interest for the index at the end of this week
has increased by 9.28% as compared to the previous week. All future stocks saw
changes in their open interest ranging from -18.25% to 19.83%. BHARTIARTL has
the maximum increase in open interest as compared to other stocks.
Statistical Analysis·
Open 5889.70 High 5974.40
Low 5846.60 Close 5853.45
NIFTY & IV CHART NIFTY ANALYSIS
®
13
14
15
16
17
5800
5900
6000
6100
15-Feb 18-Feb 19-Feb 20-Feb
Nifty Close IV
10
Bullions counter can witness some lower level buying after the recent sell
off seen due to reduced safe haven demand due to rise in greenback which
kept the pressure on the prices. In near term weakness in local currency
rupee will support the prices. Gold may trade in the range of $1540-1640 in
COMEX and 29100-30300 in MCX. White metal silver can trade in the range of
52500-56000. Recently gold silver ratio has increased from 52.2 to 54.9 as
silver fell at faster pace than gold. This ratio can further excel towards 55.5
in near term. Hedge funds and other big speculators slashed their bullish
bets on gold which had lost some of its luster this year. Net long contracts of
gold traded on the COMEX exchange of New York fell by $2.7 billion, or about
19 percent. Moreover India's government may further raise import duties on
gold or put a cap on purchases in a bid to rein in the current account deficit
in the 2013/14 budget. According to World Gold Council” Indian gold
demand could rise nearly 12 percent to as much as 965 tonnes in 2013”.
Recently Federal Reserve's Open Market Committee minutes from early
January meeting created massive sell off in the bullion market. Those
minutes stated that U.S. economic conditions are improving to the point
that some FOMC members think its massive asset purchasing program
(quantitative easing) may have to be changed soon. The FOMC will further
address the issue at its next meeting in March.
BULLIONS
ENERGY COMPLEX
Crude oil prices are expected to continue last week weakness as profit booking
will be seen because prices have increased at very quick pace in recent months
due to geopolitical tensions and signs of global economic recovery. But now the
skepticism about QE3 and increasing supplies can suppress the prices. Crude
oil can trade in the range of 5000-5250 in MCX and $90 to $97 in NYMEX.
Meanwhile the Brent and WTI spread narrowed down from 23 to below 21. U.S.
oil demand fell in January, despite a rise in gasoline consumption. January
petroleum demand dipped 1.7 percent from a year earlier to 17.962 million
barrels per day. Crude stockpiles at Cushing, Oklahoma, the delivery point for
New York futures, climbed 417,000 barrels to 50.7 million barrels recently.
Refineries operated at 82.9 percent of capacity last week, the lowest level
since March. According to the UN nuclear watchdog “Iran has begun installing
advanced centrifuges at its main uranium enrichment plant”. Natural gas
prices can trade on choppy note on mixed fundamentals. Current movement
will depend upon weather conditions and storage levels. Recently Energy
Information Administration reported that 127 billion cubic feet of gas was
withdrawn from storage in line with expectations of a drop of 122 bcf. The drop
in storage levels was less than the decline of 155 bcf a year earlier and below
the five-year average of 140 bcf. Meantime, weather forecasts show
widespread below-normal temperatures into the first week of the month.
Soybean futures (Mar) is expected to take support above 3240 levels. Factors
such as rupee depreciation, sustained demand from millers amid falling
supplies at the spot markets will add cushion to the beans. U.S soybean futures
(May) will possibly remain stable taking support above 1430 levels. Market
participants are optimistic that export sales will surge in days to come on signs
of improved demand from China. U.S. exporters sold 120,000 metric tonnes of
soybeans to China (for delivery to China by Aug. 31), as reported by the U.S.
Department of Agriculture. Furthermore, factors like disappointment with
Argentina harvest & port strike in Brazil creating a vessel bottleneck to for
shipments may keep the downside capped, despite the recent sell-off in global
commodity markets. CPO futures (Mar) is likely to maintain its upside & test
490 levels. The rupee is expected to appreciate further, which might make
imports costlier. On Bursa Malaysia Derivatives, the counter is facing a
resistance near 2600 levels. Exports of palm oil from Malaysian ports have to
improve to offset the higher inventories pegged at 2.58 million tonnes.
Shipments will be taxed at 4.5% next month as the reference price was set at
2,306.11 ringgit ($745) a metric ton. Any upside momentum in mustard futures
(Apr) may remain capped 3510 levels. Rising arrivals & slack buying due to high
moisture content in new crop may keep the counter in bearish zone.
OIL AND OILSEEDS
Base metals may remain sideways. The recovery in housing sector in US will
provide the support to the base metals prices. Sales of previously owned
homes increased in January and an index of leading indicators climbed for a
second month as the rebound in housing helped to broaden the U.S. expansion.
Improving home sales combined with dwindling inventory spurred the biggest
advance in property values since 2005, helping mend household finances.
Copper may move in the range of 420-440. According to International Copper
Study Group (ICSG) “world refined copper market was in a 513,000 tonne
deficit from January to November last year, compared with a deficit of
260,000 tonnes in the same period in 2011”. Aluminum prices may trade in the
range of 109-114 while Lead can trade in the range of 125-130. In China the
daily average output of Aluminum was unchanged from the previous month at
56,800 tonnes. Production in January was 1.76 million tonnes, down from
1.762 million in December. Several big banks are unwinding the lucrative
financing deals that tie up millions of tonnes of aluminium as collateral in
warehouses, but the activity is flourishing as eager rivals enter it or expand.
Zinc may hover in the range of 113-117. Nickel prices can trade in the range of
900-950 in MCX. Nickel climbing the most in three weeks after data showed
orders to remove the metal from warehouses increased.
BASE METALS
Turmeric futures (Apr) is likely to slip downside further towards 5850 levels.
Bearish sentiments prevailing at the spot markets due to lack of upcountry
orders may keep the upside capped near 6450 levels. The new crop of the
number 8 and Mysore varieties have started arriving at the Erode market. In
the current scenario, distressed selling due to falling prices is taking a toll over
the counter. Chilli futures (Apr) attracting higher open interest is expected to
extend its downfall towards 6400 levels. Increase in open interest along with a
decrease in price is indicating that short positions are being built up.
Fundamentally, harvest has started gathering its pace from Karnataka,
wherein Byadagi chillies arrival has begun. On the contrary, in Guntur, market
average daily arrivals are being reported around 50,000 bags. The bearish
trend in cardamom futures (Mar) may continue & any short covering may
remain limited near 1040 levels. Reports of imports from Guatemala along
with weather being favorable over growing regions have added negative
sentiments. Pepper futures (Mar) is expected to hold the gains & test 39000
levels. In days to come, the strong domestic demand coupled with severe
shortage of labour for harvesting may keep the prices firm. Jeera futures are
likely to remain in bearish zone owing to selling pressure of new crop coming
on the spot markets. Fresh arrivals are being reported from Saurashtra region;
new crop arrival will start after 10 – 15 days from Porbandar .
SPICES
OTHER COMMODITIES
Sugar futures are likely to consolidate with upside getting capped near 3215
levels. Market participants are cautious ahead of budget this week as various
steps are expected to be taken by the government relating to excise duty &
de-control. Moreover, there are reports that exports from Indian ports may
not happen over years to come, as international prices are quoting lesser than
the domestic prices. Global prices are likely to come under further pressure
with new season sugar supplies starting in Brazil from April. Kapas futures
(Apr) is expected to maintain its bullish bias & test 980-990 levels. The news
that government has decided to continue with current cotton exports policy
may continue to add positive sentiments to the counter. The fundamentals of
international market reports that China is planning to issue more cotton
import quotas to export-dependent textile mills. The U.S. Department of
Agriculture estimated that China's total world-wide imports would reach 14
million bales of cotton in the current marketing year, a 12% increase from its
forecast in January. Chana futures (Apr) is likely to trade with a negative bias
& remain below 3520 levels. The reports of imports from Australia and
Tanzania, adding to carry over stocks in major producing areas has increased
the selling pressure over the counter. There are reports that imports of chana
in the month of January increased to 2.31 lakh metric tonnes as compared to
1.83 lakh metric tonnes during the previous month.
®
Closing as on 21.02.13
11
NOTES : 1) Buy / Sell 25% of Commodity at S1/R1 respectively & rest 75% at S2/R2 respectively.2) S1 & S2 indicate first support & second support & R1 & R 2 indicate first resistance & second resistance. 3) Sometimes you will find the stop loss to be too far but if we change the stop loss once, we will find more strength coming into the commodity. At the moment, the stop loss will be far as we are seeing the graphs on weekly
basis and taking a long-term view and not a short-term view.4) These levels should not be confused with the daily trend sheet, which is sent every morning by e-mail in the name of Daily report- commodities.
TECHNICAL RECOMMENDATIONS
EXCHANGE CONTRACT CLOSING DATE TREND
CHANGED
NCDEX SOYABEAN (MARCH) 3330.50 21.02.13 SIDEWAYS - - - - - -
NCDEX JEERA (APRIL) 13367.00 10.01.13 DOWN 13882.50 - 14600.00 15000.00 15500.00
NCDEX PEPPER(MARCH) 37995.00 14.02.13 UP 36130.00 35500.00 - 34500.00 - 33500.00
NCDEX RED CHILLI (MARCH) 6598.00 10.01.13 UP 6390.00 6300.00 - 6200.00 - 6100.00
NCDEX RM SEEDS (APRIL) 3454.00 10.01.13 DOWN 3516.00 - 3700.00 - 3800.00 3900.00
MCX MENTHA OIL (MARCH) 1285.80 23.01.13 SIDEWAYS - - - - - -
MCX CARDAMOM (MARCH) 985.90 22.11.12 UP 941.00 980.00 - 950.00 - 910.00
MCX SILVER (MARCH) 54112.00 20.12.12 DOWN 57351.00 - 57500.00 - 58500.00 60000.00
MCX GOLD (APRIL) 29742.00 14.02.13 DOWN 30463.00 - 30800.00 - 31100.00 31400.00
MCX COPPER (APRIL) 435.30 20.12.12 DOWN 432.95 - 450.00 - 455.00 460.00
MCX LEAD (MARCH) 127.10 17.01.13 SIDEWAYS - - - - - -
MCX ZINC (MARCH) 115.50 17.01.13 SIDEWAYS - - - - - -
MCX NICKEL(MARCH) 920.30 21.02.13 DOWN 920.30 - 980.00 - 1000.00 1020.00
MCX ALUMINUM(MARCH) 112.95 21.02.13 DOWN 112.95 - 118.00 - 120.00 122.00
MCX CRUDE OIL (MARCH) 5102.00 03.01.13 UP 5080.00 5050.00 - 4950.00 - 4850.00
MCX NATURAL GAS (MARCH) 182.10 03.01.13 DOWN 176.50 - 190.00 - 195.00 200.00
TREND RATE TREND S1 R1 S2 R2 CLOSING
PRICE CHANGED STOP/LOSS*
TREND SHEET
COMMODITY
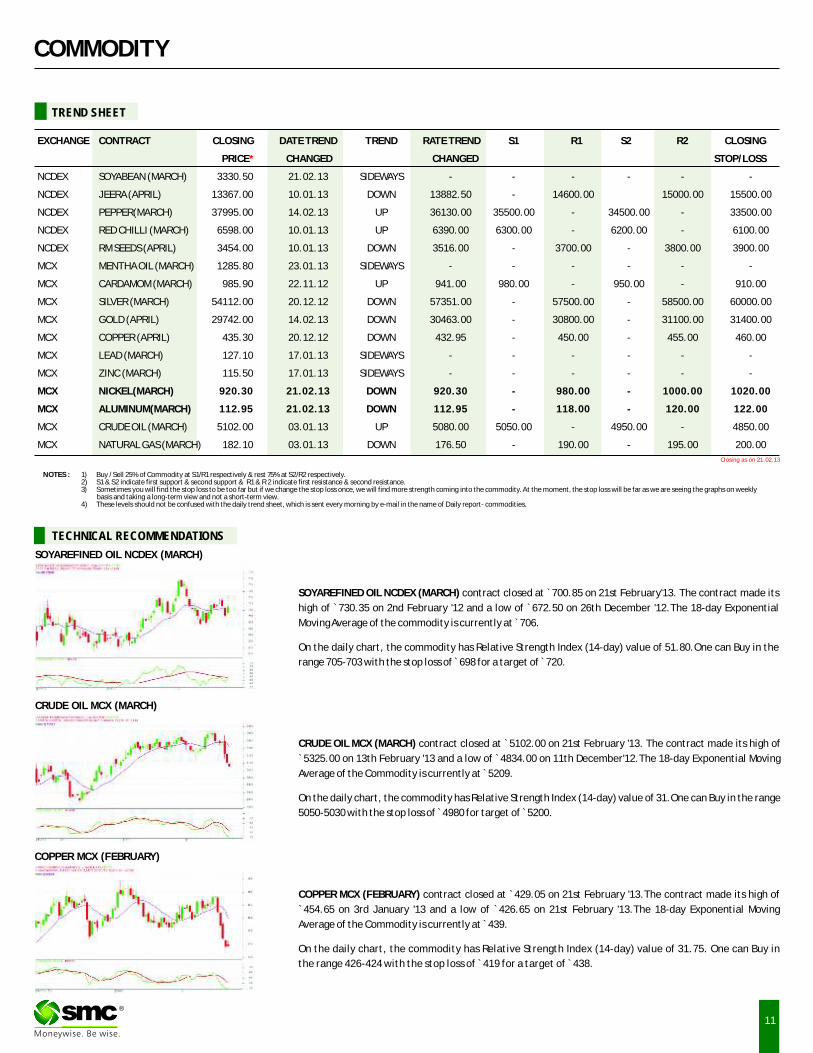
SOYAREFINED OIL NCDEX (MARCH) contract closed at ̀ 700.85 on 21st February'13. The contract made its
high of `730.35 on 2nd February '12 and a low of `672.50 on 26th December '12.The 18-day Exponential
Moving Average of the commodity is currently at ̀ 706. On the daily chart, the commodity has Relative Strength Index (14-day) value of 51.80.One can Buy in the
range 705-703 with the stop loss of ̀ 698 for a target of ̀ 720.
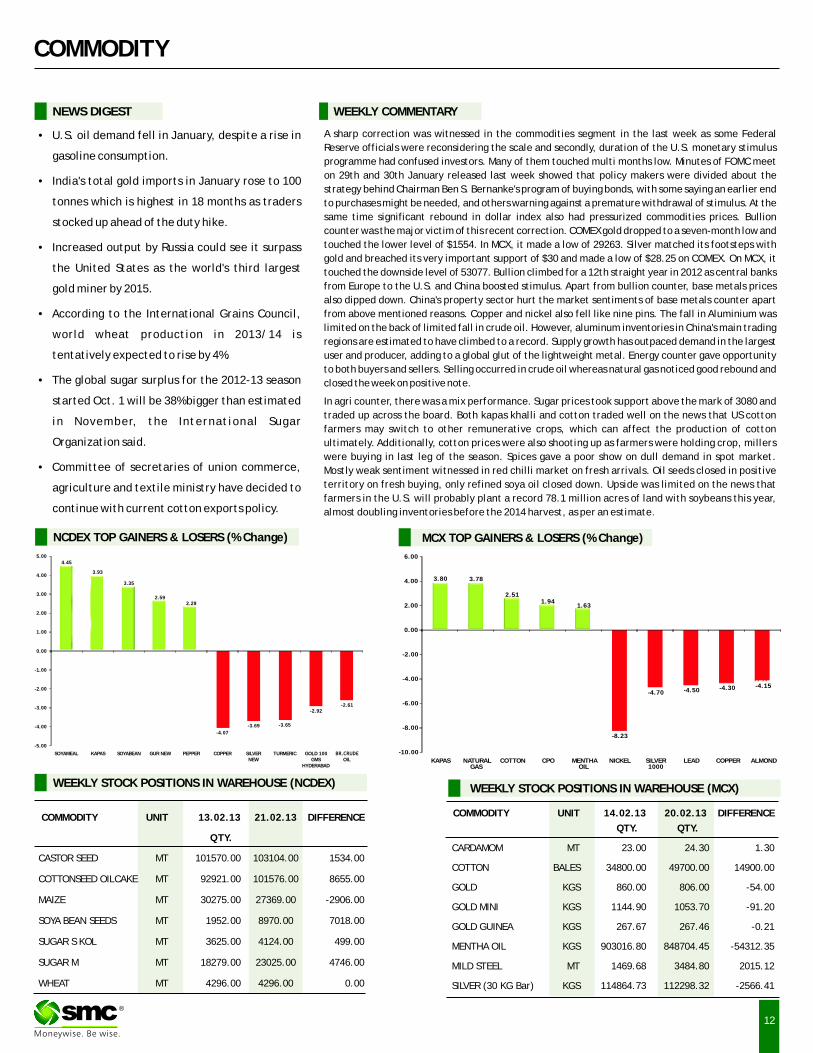
CRUDE OIL MCX (MARCH) contract closed at ̀ 5102.00 on 21st February '13. The contract made its high of
`5325.00 on 13th February '13 and a low of ̀ 4834.00 on 11th December'12.The 18-day Exponential Moving
Average of the Commodity is currently at ̀ 5209.
On the daily chart, the commodity has Relative Strength Index (14-day) value of 31.One can Buy in the range
5050-5030 with the stop loss of ̀ 4980 for target of ̀ 5200.
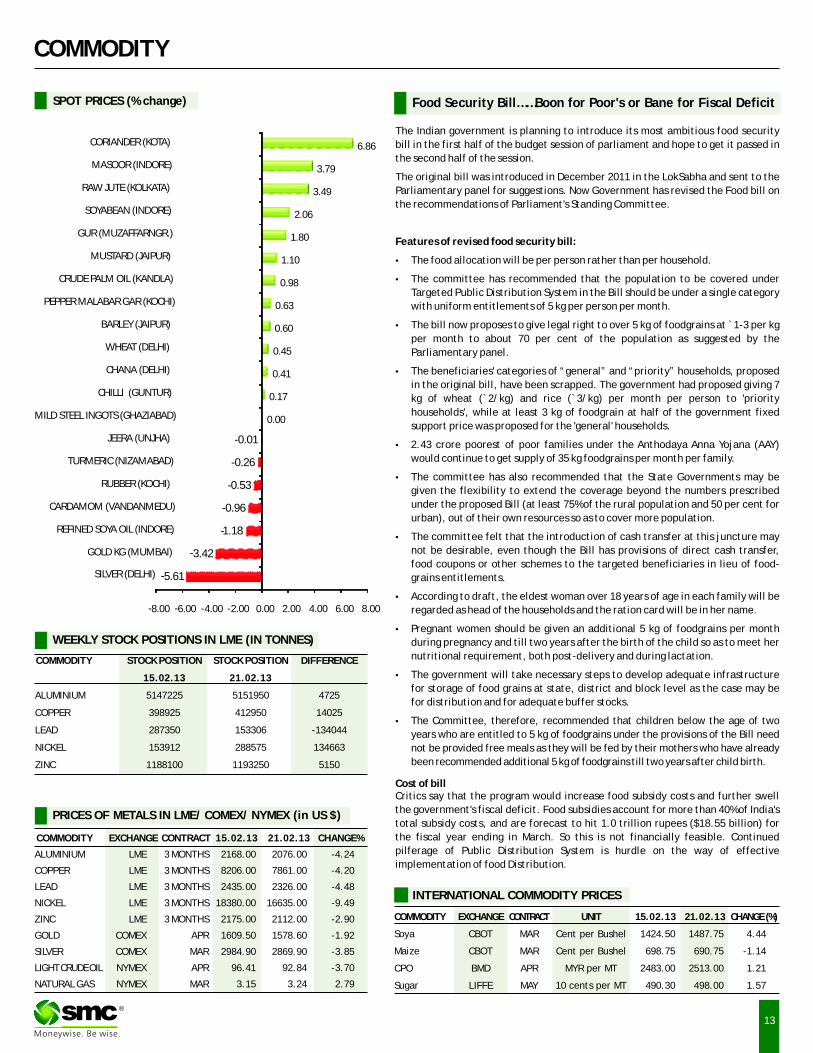
COPPER MCX (FEBRUARY) contract closed at `429.05 on 21st February '13.The contract made its high of
`454.65 on 3rd January '13 and a low of `426.65 on 21st February '13.The 18-day Exponential Moving
Average of the Commodity is currently at ̀ 439.
On the daily chart, the commodity has Relative Strength Index (14-day) value of 31.75. One can Buy in
the range 426-424 with the stop loss of ̀ 419 for a target of ̀ 438.
®
SOYAREFINED OIL NCDEX (MARCH)
CRUDE OIL MCX (MARCH)
COPPER MCX (FEBRUARY)
12
COMMODITY
NEWS DIGEST
A sharp correction was witnessed in the commodities segment in the last week as some Federal
Reserve officials were reconsidering the scale and secondly, duration of the U.S. monetary stimulus
programme had confused investors. Many of them touched multi months low. Minutes of FOMC meet
on 29th and 30th January released last week showed that policy makers were divided about the
strategy behind Chairman Ben S. Bernanke's program of buying bonds, with some saying an earlier end
to purchases might be needed, and others warning against a premature withdrawal of stimulus. At the
same time significant rebound in dollar index also had pressurized commodities prices. Bullion
counter was the major victim of this recent correction. COMEX gold dropped to a seven-month low and
touched the lower level of $1554. In MCX, it made a low of 29263. Silver matched its footsteps with
gold and breached its very important support of $30 and made a low of $28.25 on COMEX. On MCX, it
touched the downside level of 53077. Bullion climbed for a 12th straight year in 2012 as central banks
from Europe to the U.S. and China boosted stimulus. Apart from bullion counter, base metals prices
also dipped down. China's property sector hurt the market sentiments of base metals counter apart
from above mentioned reasons. Copper and nickel also fell like nine pins. The fall in Aluminium was
limited on the back of limited fall in crude oil. However, aluminum inventories in China's main trading
regions are estimated to have climbed to a record. Supply growth has outpaced demand in the largest
user and producer, adding to a global glut of the lightweight metal. Energy counter gave opportunity
to both buyers and sellers. Selling occurred in crude oil whereas natural gas noticed good rebound and
closed the week on positive note.
In agri counter, there was a mix performance. Sugar prices took support above the mark of 3080 and
traded up across the board. Both kapas khalli and cotton traded well on the news that US cotton
farmers may switch to other remunerative crops, which can affect the production of cotton
ultimately. Additionally, cotton prices were also shooting up as farmers were holding crop, millers
were buying in last leg of the season. Spices gave a poor show on dull demand in spot market.
Mostly weak sentiment witnessed in red chilli market on fresh arrivals. Oil seeds closed in positive
territory on fresh buying, only refined soya oil closed down. Upside was limited on the news that
farmers in the U.S. will probably plant a record 78.1 million acres of land with soybeans this year,
almost doubling inventories before the 2014 harvest, as per an estimate.
WEEKLY COMMENTARY
WEEKLY STOCK POSITIONS IN WAREHOUSE (NCDEX)
COMMODITY UNIT 13.02.13 21.02.13 DIFFERENCE
QTY.
CASTOR SEED MT 101570.00 103104.00 1534.00
COTTONSEED OILCAKE MT 92921.00 101576.00 8655.00
MAIZE MT 30275.00 27369.00 -2906.00
SOYA BEAN SEEDS MT 1952.00 8970.00 7018.00
SUGAR S KOL MT 3625.00 4124.00 499.00
SUGAR M MT 18279.00 23025.00 4746.00
WHEAT MT 4296.00 4296.00 0.00
COMMODITY UNIT 14.02.13 20.02.13 DIFFERENCE
QTY. QTY.
CARDAMOM MT 23.00 24.30 1.30
COTTON BALES 34800.00 49700.00 14900.00
GOLD KGS 860.00 806.00 -54.00
GOLD MINI KGS 1144.90 1053.70 -91.20
GOLD GUINEA KGS 267.67 267.46 -0.21
MENTHA OIL KGS 903016.80 848704.45 -54312.35
MILD STEEL MT 1469.68 3484.80 2015.12
SILVER (30 KG Bar) KGS 114864.73 112298.32 -2566.41
·U.S. oil demand fell in January, despite a rise in
gasoline consumption.
·India's total gold imports in January rose to 100
tonnes which is highest in 18 months as traders
stocked up ahead of the duty hike.
·Increased output by Russia could see it surpass
the United States as the world's third largest
gold miner by 2015.
·According to the International Grains Council,
world wheat production in 2013/14 is
tentatively expected to rise by 4%.
·The global sugar surplus for the 2012-13 season
started Oct. 1 will be 38% bigger than estimated
in November, the International Sugar
Organization said.
·Committee of secretaries of union commerce,
agriculture and textile ministry have decided to
continue with current cotton exports policy.
WEEKLY STOCK POSITIONS IN WAREHOUSE (MCX)
®
NCDEX TOP GAINERS & LOSERS (% Change) MCX TOP GAINERS & LOSERS (% Change)
4.45
3.93
3.35
2.592.29
-4.07
-3.69 -3.65
-2.92-2.61
-5.00
-4.00
-3.00
-2.00
-1.00
0.00
1.00
2.00
3.00
4.00
5.00
SOYAMEAL KAPAS SOYABEAN GUR NEW PEPPER COPPER SILVER NEW
TURMERIC GOLD 100 GMS
HYDERABADOIL
3.80 3.78
2.511.94
1.63
-8.23
-4.70 -4.50 -4.30 -4.15
-10.00
-8.00
-6.00
-4.00
-2.00
0.00
2.00
4.00
6.00
KAPAS NATURAL GAS
COTTON CPO MENTHA OIL
NICKEL SILVER 1000
LEAD COPPER ALMOND
Food Security Bill……Boon for Poor's or Bane for Fiscal Deficit
13
SPOT PRICES (% change)
COMMODITY
WEEKLY STOCK POSITIONS IN LME (IN TONNES)
COMMODITY STOCK POSITION STOCK POSITION DIFFERENCE
15.02.13 21.02.13
ALUMINIUM 5147225 5151950 4725
COPPER 398925 412950 14025
LEAD 287350 153306 -134044
NICKEL 153912 288575 134663
ZINC 1188100 1193250 5150
INTERNATIONAL COMMODITY PRICES
COMMODITY EXCHANGE CONTRACT UNIT 15.02.13 21.02.13 CHANGE (%)
Soya CBOT MAR Cent per Bushel 1424.50 1487.75 4.44
Maize CBOT MAR Cent per Bushel 698.75 690.75 -1.14
CPO BMD APR MYR per MT 2483.00 2513.00 1.21
Sugar LIFFE MAY 10 cents per MT 490.30 498.00 1.57
COMMODITY EXCHANGE CONTRACT 15.02.13 21.02.13 CHANGE%
ALUMINIUM LME 3 MONTHS 2168.00 2076.00 -4.24
COPPER LME 3 MONTHS 8206.00 7861.00 -4.20
LEAD LME 3 MONTHS 2435.00 2326.00 -4.48
NICKEL LME 3 MONTHS 18380.00 16635.00 -9.49
ZINC LME 3 MONTHS 2175.00 2112.00 -2.90
GOLD COMEX APR 1609.50 1578.60 -1.92
SILVER COMEX MAR 2984.90 2869.90 -3.85
LIGHT CRUDE OIL NYMEX APR 96.41 92.84 -3.70
NATURAL GAS NYMEX MAR 3.15 3.24 2.79
PRICES OF METALS IN LME/ COMEX/ NYMEX (in US $)
The Indian government is planning to introduce its most ambitious food security
bill in the first half of the budget session of parliament and hope to get it passed in
the second half of the session.
The original bill was introduced in December 2011 in the LokSabha and sent to the
Parliamentary panel for suggestions. Now Government has revised the Food bill on
the recommendations of Parliament's Standing Committee.
Features of revised food security bill:
·The food allocation will be per person rather than per household.
·The committee has recommended that the population to be covered under
Targeted Public Distribution System in the Bill should be under a single category
with uniform entitlements of 5 kg per person per month.
·The bill now proposes to give legal right to over 5 kg of foodgrains at ̀ 1-3 per kg
per month to about 70 per cent of the population as suggested by the
Parliamentary panel.
·The beneficiaries' categories of “general” and “priority” households, proposed
in the original bill, have been scrapped. The government had proposed giving 7
kg of wheat (`2/kg) and rice (`3/kg) per month per person to 'priority
households', while at least 3 kg of foodgrain at half of the government fixed
support price was proposed for the 'general' households.
·2.43 crore poorest of poor families under the Anthodaya Anna Yojana (AAY)
would continue to get supply of 35 kg foodgrains per month per family.
·The committee has also recommended that the State Governments may be
given the flexibility to extend the coverage beyond the numbers prescribed
under the proposed Bill (at least 75% of the rural population and 50 per cent for
urban), out of their own resources so as to cover more population.
·The committee felt that the introduction of cash transfer at this juncture may
not be desirable, even though the Bill has provisions of direct cash transfer,
food coupons or other schemes to the targeted beneficiaries in lieu of food-
grains entitlements.
·According to draft, the eldest woman over 18 years of age in each family will be
regarded as head of the households and the ration card will be in her name.
·Pregnant women should be given an additional 5 kg of foodgrains per month
during pregnancy and till two years after the birth of the child so as to meet her
nutritional requirement, both post-delivery and during lactation.
·The government will take necessary steps to develop adequate infrastructure
for storage of food grains at state, district and block level as the case may be
for distribution and for adequate buffer stocks.
·The Committee, therefore, recommended that children below the age of two
years who are entitled to 5 kg of foodgrains under the provisions of the Bill need
not be provided free meals as they will be fed by their mothers who have already
been recommended additional 5 kg of foodgrains till two years after child birth.
Cost of billCritics say that the program would increase food subsidy costs and further swell
the government's fiscal deficit. Food subsidies account for more than 40% of India's
total subsidy costs, and are forecast to hit 1.0 trillion rupees ($18.55 billion) for
the fiscal year ending in March. So this is not financially feasible. Continued
pilferage of Public Distribution System is hurdle on the way of effective
implementation of food Distribution.
®
-5.61
-3.42
-1.18
-0.96
-0.53
-0.26
-0.01
0.00
0.17
0.41
0.45
0.60
0.63
0.98
1.10
1.80
2.06
3.49
3.79
6.86
-8.00 -6.00 -4.00 -2.00 0.00 2.00 4.00 6.00 8.00
SILVER (DELHI)
GOLD KG (MUMBAI)
REFINED SOYA OIL (INDORE)
CARDAMOM (VANDANMEDU)
RUBBER (KOCHI)
TURMERIC (NIZAMABAD)
JEERA (UNJHA)
MILD STEEL INGOTS (GHAZIABAD)
CHILLI (GUNTUR)
CHANA (DELHI)
WHEAT (DELHI)
BARLEY (JAIPUR)
PEPPER MALABAR GAR (KOCHI)
CRUDE PALM OIL (KANDLA)
MUSTARD (JAIPUR)
GUR (MUZAFFARNGR.)
SOYABEAN (INDORE)
RAW JUTE (KOLKATA)
MASOOR (INDORE)
CORIANDER (KOTA)
14
CURRENCY
Currency Table
Currency Pair Open High Low Close
USD/INR 53.91 54.61 53.79 54.47
EUR/INR 72.09 72.69 71.68 71.83
GBP/INR 83.61 84.40 82.30 83.06
JPY/INR 58.16 58.71 57.48 58.51
(Source: Thomson Reuters, Open: Friday (Prior) 9.00 AM IST, Close: Thursday 5.00 PM IST)
News Flows of last week
19th Feb: Manufacturing stumbled but seen regaining footing
19th Feb: U.S. home-builder sentiment slipped but hold near seven-year peak
20th Feb: Housing starts dropped in January, PPI up 0.2 percent
21st Feb: The pace of U.S. manufacturing growth slowed in February
21st Feb: U.S Consumer prices unchanged as gasoline falls
21st Feb: Fed's Williams: keep buying bonds well into 2nd half of 2013
21st Feb: Fed unlikely to curtail stimulus despite rising doubts
USD/INR (MARCH) contract closed at `54.84 on 21st February'13. The contract made its high of ̀ 59.60 on 28th June'12 and a low of ̀ 52.67 on 05th October'12.The 14-day Exponential Moving Average of the USD/INR is currently at ̀ 54.40
On the daily chart, the USD/INR has Relative Strength Index (14-day) value of 56.65. One can Buy around 54.45 for a target of ̀ 55.40 with the stop loss of ̀ 53.95.
EUR/INR (MARCH) contract closed at ̀ 72.20 on 21st February'13. The contract made its high of `73.96 on 14th January'13 and a low of `71.50 on 12th December'12.The 14-day Exponential Moving Average of the EUR/INR is currently at ̀ 72.57.
On the daily chart, EUR/INR has Relative Strength Index (14-day) value of 45.53. One can Sell around 72.13 for a target of ̀ 71.15 with the stop loss of ̀ 72.65
GBP/INR JPY/INR
JPY/INR (MARCH) contract closed at ̀ 58.94 on 21st February'13. The contract made
its high of `64.80 on 27th December'12 and a low of `56.97 on 06th February'13.The
14-day Exponential Moving Average of the JPY/INR is currently at ̀ 58.60.
On the daily chart, JPY/INR has Relative Strength Index (14-day) value of 43.02. One
can sell below 58.50 for a target of ̀ 57.50 with the stop loss of ̀ 59.00.
GBP/INR (MARCH) contract closed at `83.43 on 21st February'13. The contract made its high of `90.50 on 21st December'12 and a low of `82.81 on 21st February'13. The 14-day Exponential Moving Average of the GBP/INR is currently at `84.29.
On the daily chart, GBP/INR has Relative Strength Index (14-day) value of 33.60. One can Buy above 84.00 for a target of ̀ 85.00 with the stop loss of ̀ 83.50
USD/INR EUR/INR
Market Stance
The Indian rupee fell last week and witnessed its worst single day fall in one-and-
a-half months on Thursday as global risk aversion pushed local stocks sharply
lower, with the currency awaiting cues from the federal budget next week.
Global risk assets were ummelled as world share markets fell and the dollar and
safe-haven assets rose, a day after minutes of the Federal Reserve's last policy
meeting cast doubts over how much longer the U.S. central bank would stick to
its stimulus plan. The sell-off was reflected in Indian markets as local shares fell
their most in nearly seven months, raising concerns about whether there will be
continued inflows into equities that have largely buoyed the rupee so far.
However, volumes continued to be thin as there was little participation from
state-run banks in the two day nationwide strike. Moreover we expect rupee to
trade in range of 54.25-54.75 up till federal budget.
Economic gauge for the next week
Date Currency Event PREVIOUS26-Feb: GBP GBP Nationwide House Prices s.a. (MoM) 0.50%26-Feb: USD USD Consumer Confidence 58.627-Feb: GBP GBP Gross Domestic Product (QoQ) -0.30%27-Feb: GBP GBP Gross Domestic Product (YoY) 0.00%27-Feb: USD USD Durable Goods Orders 4.60%28-Feb: EUR EUR German Unemployment Rate s.a. 6.80%28-Feb: EUR EUR German Unemployment Change -16K28-Feb: EUR EUR Euro-Zone Consumer Price Index - Core (YoY) 1.50%28-Feb: EUR EUR Euro-Zone Consumer Price Index (YoY) 2.00%28-Feb: EUR EUR German Consumer Price Index (YoY)28-Feb: EUR EUR German Consumer Price Index - EU Harmonised (YoY)28-Feb: USD USD Gross Domestic Product (Annualized) -0.10%28-Feb: USD USD Gross Domestic Product Price Index 0.60%01-Mar: USD USD Personal Consumption Expenditure Core (YoY) 1.40%01-Mar: USD USD U. of Michigan Confidence 76.301-Mar: USD USD ISM Manufacturing 53.1
Technical Recommendation
®
IPOIPO
INDIAN IPO NEWS
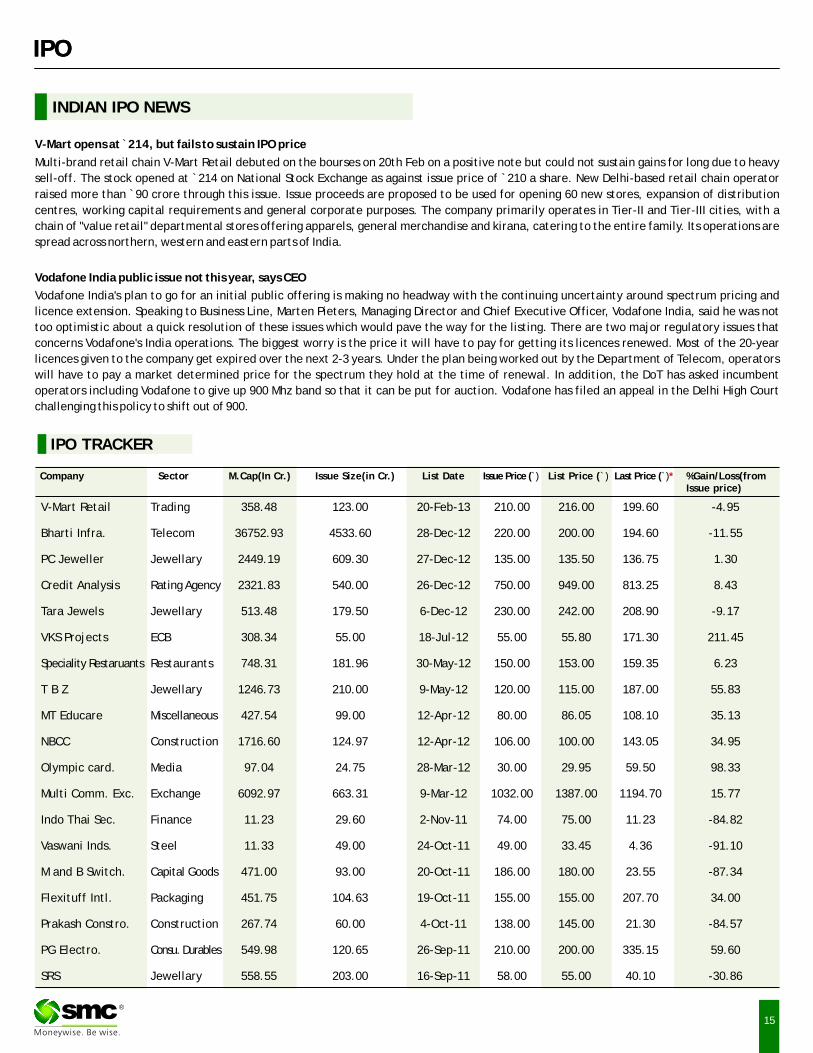
V-Mart opens at ̀ 214, but fails to sustain IPO price
Multi-brand retail chain V-Mart Retail debuted on the bourses on 20th Feb on a positive note but could not sustain gains for long due to heavy
sell-off. The stock opened at `214 on National Stock Exchange as against issue price of `210 a share. New Delhi-based retail chain operator
raised more than `90 crore through this issue. Issue proceeds are proposed to be used for opening 60 new stores, expansion of distribution
centres, working capital requirements and general corporate purposes. The company primarily operates in Tier-II and Tier-III cities, with a
chain of "value retail" departmental stores offering apparels, general merchandise and kirana, catering to the entire family. Its operations are
spread across northern, western and eastern parts of India.
Vodafone India public issue not this year, says CEO
Vodafone India's plan to go for an initial public offering is making no headway with the continuing uncertainty around spectrum pricing and
licence extension. Speaking to Business Line, Marten Pieters, Managing Director and Chief Executive Officer, Vodafone India, said he was not
too optimistic about a quick resolution of these issues which would pave the way for the listing. There are two major regulatory issues that
concerns Vodafone's India operations. The biggest worry is the price it will have to pay for getting its licences renewed. Most of the 20-year
licences given to the company get expired over the next 2-3 years. Under the plan being worked out by the Department of Telecom, operators
will have to pay a market determined price for the spectrum they hold at the time of renewal. In addition, the DoT has asked incumbent
operators including Vodafone to give up 900 Mhz band so that it can be put for auction. Vodafone has filed an appeal in the Delhi High Court
challenging this policy to shift out of 900.
V-Mart Retail Trading 358.48 123.00 20-Feb-13 210.00 216.00 199.60 -4.95
Bharti Infra. Telecom 36752.93 4533.60 28-Dec-12 220.00 200.00 194.60 -11.55
PC Jeweller Jewellary 2449.19 609.30 27-Dec-12 135.00 135.50 136.75 1.30
Credit Analysis Rating Agency 2321.83 540.00 26-Dec-12 750.00 949.00 813.25 8.43
Tara Jewels Jewellary 513.48 179.50 6-Dec-12 230.00 242.00 208.90 -9.17
VKS Projects ECB 308.34 55.00 18-Jul-12 55.00 55.80 171.30 211.45
Speciality Restaruants Restaurants 748.31 181.96 30-May-12 150.00 153.00 159.35 6.23
T B Z Jewellary 1246.73 210.00 9-May-12 120.00 115.00 187.00 55.83
MT Educare Miscellaneous 427.54 99.00 12-Apr-12 80.00 86.05 108.10 35.13
NBCC Construction 1716.60 124.97 12-Apr-12 106.00 100.00 143.05 34.95
Olympic card. Media 97.04 24.75 28-Mar-12 30.00 29.95 59.50 98.33
Multi Comm. Exc. Exchange 6092.97 663.31 9-Mar-12 1032.00 1387.00 1194.70 15.77
Indo Thai Sec. Finance 11.23 29.60 2-Nov-11 74.00 75.00 11.23 -84.82
Vaswani Inds. Steel 11.33 49.00 24-Oct-11 49.00 33.45 4.36 -91.10
M and B Switch. Capital Goods 471.00 93.00 20-Oct-11 186.00 180.00 23.55 -87.34
Flexituff Intl. Packaging 451.75 104.63 19-Oct-11 155.00 155.00 207.70 34.00
Prakash Constro. Construction 267.74 60.00 4-Oct-11 138.00 145.00 21.30 -84.57
PG Electro. Consu. Durables 549.98 120.65 26-Sep-11 210.00 200.00 335.15 59.60
SRS Jewellary 558.55 203.00 16-Sep-11 58.00 55.00 40.10 -30.86
IPO TRACKER
Company Sector M.Cap(In Cr.) Issue Size(in Cr.) List Date Issue Price (̀ ) List Price (`) Last Price (̀ ) %Gain/Loss(from Issue price)
*
15
®
®
MUTUAL FUND
17
NEWS
®
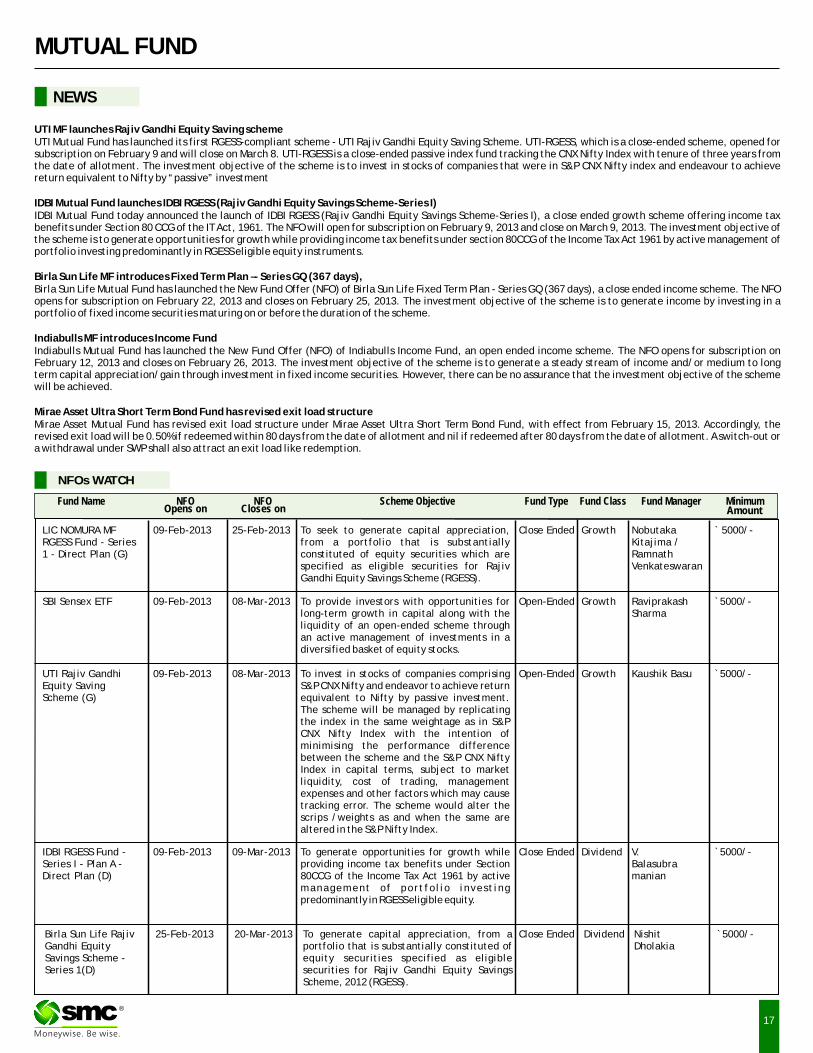
UTI MF launches Rajiv Gandhi Equity Saving schemeUTI Mutual Fund has launched its first RGESS-compliant scheme - UTI Rajiv Gandhi Equity Saving Scheme. UTI-RGESS, which is a close-ended scheme, opened for subscription on February 9 and will close on March 8. UTI-RGESS is a close-ended passive index fund tracking the CNX Nifty Index with tenure of three years from the date of allotment. The investment objective of the scheme is to invest in stocks of companies that were in S&P CNX Nifty index and endeavour to achieve return equivalent to Nifty by “passive” investment
IDBI Mutual Fund launches IDBI RGESS (Rajiv Gandhi Equity Savings Scheme-Series I)IDBI Mutual Fund today announced the launch of IDBI RGESS (Rajiv Gandhi Equity Savings Scheme-Series I), a close ended growth scheme offering income tax benefits under Section 80 CCG of the IT Act, 1961. The NFO will open for subscription on February 9, 2013 and close on March 9, 2013. The investment objective of the scheme is to generate opportunities for growth while providing income tax benefits under section 80CCG of the Income Tax Act 1961 by active management of portfolio investing predominantly in RGESS eligible equity instruments.
Birla Sun Life MF introduces Fixed Term Plan –- Series GQ (367 days),Birla Sun Life Mutual Fund has launched the New Fund Offer (NFO) of Birla Sun Life Fixed Term Plan - Series GQ (367 days), a close ended income scheme. The NFO opens for subscription on February 22, 2013 and closes on February 25, 2013. The investment objective of the scheme is to generate income by investing in a portfolio of fixed income securities maturing on or before the duration of the scheme.
Indiabulls MF introduces Income FundIndiabulls Mutual Fund has launched the New Fund Offer (NFO) of Indiabulls Income Fund, an open ended income scheme. The NFO opens for subscription on February 12, 2013 and closes on February 26, 2013. The investment objective of the scheme is to generate a steady stream of income and/or medium to long term capital appreciation/gain through investment in fixed income securities. However, there can be no assurance that the investment objective of the scheme will be achieved.
Mirae Asset Ultra Short Term Bond Fund has revised exit load structure Mirae Asset Mutual Fund has revised exit load structure under Mirae Asset Ultra Short Term Bond Fund, with effect from February 15, 2013. Accordingly, the revised exit load will be 0.50% if redeemed within 80 days from the date of allotment and nil if redeemed after 80 days from the date of allotment. A switch-out or a withdrawal under SWP shall also attract an exit load like redemption.
NFOs WATCH
Fund Name NFO NFO Scheme Objective Fund Type Fund Class Fund Manager MinimumOpens on Closes on Amount
09-Feb-2013 25-Feb-2013 Close Ended Growth ` 5000/-LIC NOMURA MF RGESS Fund - Series 1 - Direct Plan (G)
Nobutaka Kitajima / Ramnath Venkateswaran
To seek to generate capital appreciation, from a portfolio that is substantially constituted of equity securities which are specified as eligible securities for Rajiv Gandhi Equity Savings Scheme (RGESS).
09-Feb-2013 08-Mar-2013 Open-Ended Growth `5000/-SBI Sensex ETF Raviprakash Sharma
To provide investors with opportunities for long-term growth in capital along with the liquidity of an open-ended scheme through an active management of investments in a diversified basket of equity stocks.
09-Feb-2013 08-Mar-2013 Open-Ended Growth `5000/-UTI Rajiv Gandhi Equity Saving Scheme (G)
Kaushik BasuTo invest in stocks of companies comprising S&P CNX Nifty and endeavor to achieve return equivalent to Nifty by passive investment. The scheme will be managed by replicating the index in the same weightage as in S&P CNX Nifty Index with the intention of minimising the performance difference between the scheme and the S&P CNX Nifty Index in capital terms, subject to market liquidity, cost of trading, management expenses and other factors which may cause tracking error. The scheme would alter the scrips /weights as and when the same are altered in the S&P Nifty Index.
09-Feb-2013 09-Mar-2013 Close Ended Dividend `5000/-IDBI RGESS Fund - Series I - Plan A - Direct Plan (D)
V. Balasubramanian
To generate opportunities for growth while providing income tax benefits under Section 80CCG of the Income Tax Act 1961 by active management of portfol io investing predominantly in RGESS eligible equity.
25-Feb-2013 20-Mar-2013 Close Ended Dividend `5000/-Birla Sun Life Rajiv Gandhi Equity Savings Scheme - Series 1(D)
Nishit Dholakia
To generate capital appreciation, from a portfolio that is substantially constituted of equity securities specified as eligible securities for Rajiv Gandhi Equity Savings Scheme, 2012 (RGESS).
18
MUTUAL FUND Performance Charts
Returns (%) Risk Market Cap (%)
Scheme Name NAV Launch AUM 3M 6M 1Y 3Y Since Std.Dev Beta Jenson LARGE MID SMALL DEBT &
(`) Date (` Cr.) Launch CAP CAP CAP OTHER
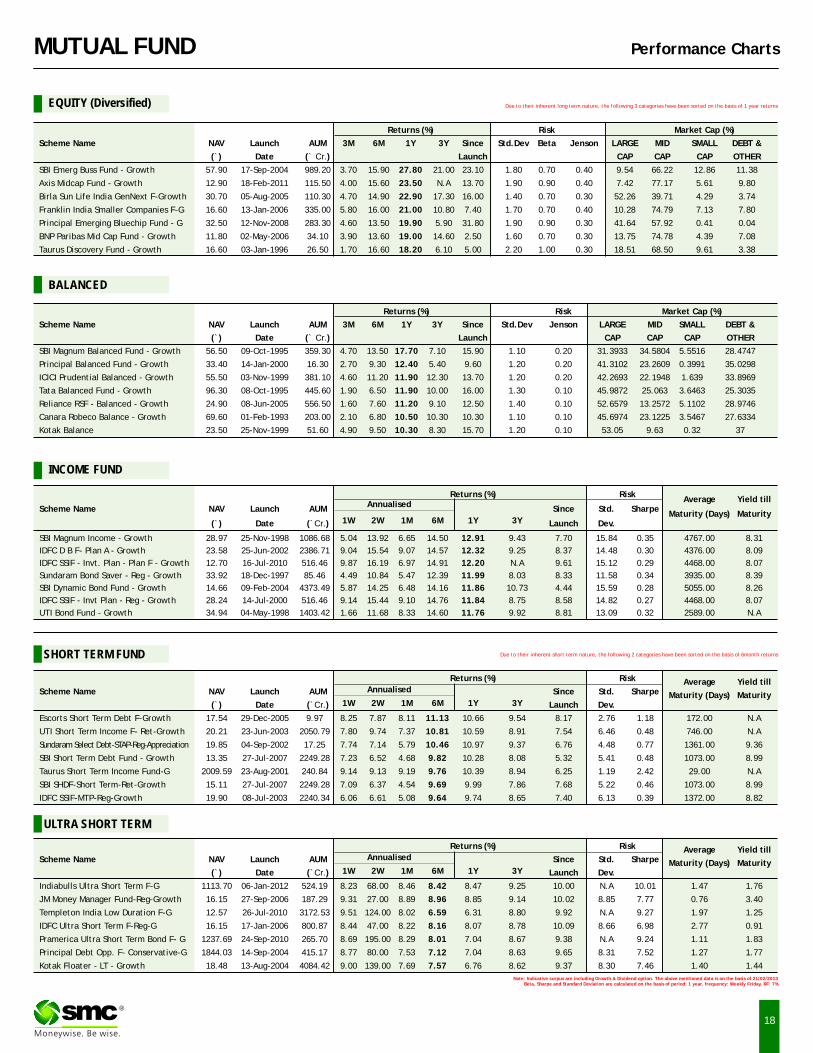
SBI Emerg Buss Fund - Growth 57.90 17-Sep-2004 989.20 3.70 15.90 27.80 21.00 23.10 1.80 0.70 0.40 9.54 66.22 12.86 11.38
Axis Midcap Fund - Growth 12.90 18-Feb-2011 115.50 4.00 15.60 23.50 N.A 13.70 1.90 0.90 0.40 7.42 77.17 5.61 9.80
Birla Sun Life India GenNext F-Growth 30.70 05-Aug-2005 110.30 4.70 14.90 22.90 17.30 16.00 1.40 0.70 0.30 52.26 39.71 4.29 3.74
Franklin India Smaller Companies F-G 16.60 13-Jan-2006 335.00 5.80 16.00 21.00 10.80 7.40 1.70 0.70 0.40 10.28 74.79 7.13 7.80
Principal Emerging Bluechip Fund - G 32.50 12-Nov-2008 283.30 4.60 13.50 19.90 5.90 31.80 1.90 0.90 0.30 41.64 57.92 0.41 0.04
BNP Paribas Mid Cap Fund - Growth 11.80 02-May-2006 34.10 3.90 13.60 19.00 14.60 2.50 1.60 0.70 0.30 13.75 74.78 4.39 7.08
Taurus Discovery Fund - Growth 16.60 03-Jan-1996 26.50 1.70 16.60 18.20 6.10 5.00 2.20 1.00 0.30 18.51 68.50 9.61 3.38
EQUITY (Diversified)
BALANCED
INCOME FUND
Note: Indicative corpus are including Growth & Dividend option. The above mentioned data is on the basis of 21/02/2013Beta, Sharpe and Standard Deviation are calculated on the basis of period: 1 year, frequency: Weekly Friday, RF: 7%
ULTRA SHORT TERM
SHORT TERM FUND
Due to their inherent long term nature, the following 3 categories have been sorted on the basis of 1 year returns
Due to their inherent short term nature, the following 2 categories have been sorted on the basis of 6month returns
Returns (%) Risk Market Cap (%)
Scheme Name NAV Launch AUM 3M 6M 1Y 3Y Since Std.Dev Jenson LARGE MID SMALL DEBT &
(`) Date (` Cr.) Launch CAP CAP CAP OTHER
SBI Magnum Balanced Fund - Growth 56.50 09-Oct-1995 359.30 4.70 13.50 17.70 7.10 15.90 1.10 0.20 31.3933 34.5804 5.5516 28.4747
Principal Balanced Fund - Growth 33.40 14-Jan-2000 16.30 2.70 9.30 12.40 5.40 9.60 1.20 0.20 41.3102 23.2609 0.3991 35.0298
ICICI Prudential Balanced - Growth 55.50 03-Nov-1999 381.10 4.60 11.20 11.90 12.30 13.70 1.20 0.20 42.2693 22.1948 1.639 33.8969
Tata Balanced Fund - Growth 96.30 08-Oct-1995 445.60 1.90 6.50 11.90 10.00 16.00 1.30 0.10 45.9872 25.063 3.6463 25.3035
Reliance RSF - Balanced - Growth 24.90 08-Jun-2005 556.50 1.60 7.60 11.20 9.10 12.50 1.40 0.10 52.6579 13.2572 5.1102 28.9746
Canara Robeco Balance - Growth 69.60 01-Feb-1993 203.00 2.10 6.80 10.50 10.30 10.30 1.10 0.10 45.6974 23.1225 3.5467 27.6334
Kotak Balance 23.50 25-Nov-1999 51.60 4.90 9.50 10.30 8.30 15.70 1.20 0.10 53.05 9.63 0.32 37
Returns (%) RiskAverage Yield till
Scheme Name NAV Launch AUM Since Std. SharpeMaturity (Days) Maturity
1W 2W 1M 6M 1Y 3Y(`) Date (`Cr.) Launch Dev.
SBI Magnum Income - Growth 28.97 25-Nov-1998 1086.68 5.04 13.92 6.65 14.50 12.91 9.43 7.70 15.84 0.35 4767.00 8.31
IDFC D B F- Plan A - Growth 23.58 25-Jun-2002 2386.71 9.04 15.54 9.07 14.57 12.32 9.25 8.37 14.48 0.30 4376.00 8.09
IDFC SSIF - Invt. Plan - Plan F - Growth 12.70 16-Jul-2010 516.46 9.87 16.19 6.97 14.91 12.20 N.A 9.61 15.12 0.29 4468.00 8.07
Sundaram Bond Saver - Reg - Growth 33.92 18-Dec-1997 85.46 4.49 10.84 5.47 12.39 11.99 8.03 8.33 11.58 0.34 3935.00 8.39
SBI Dynamic Bond Fund - Growth 14.66 09-Feb-2004 4373.49 5.87 14.25 6.48 14.16 11.86 10.73 4.44 15.59 0.28 5055.00 8.26
IDFC SSIF - Invt Plan - Reg - Growth 28.24 14-Jul-2000 516.46 9.14 15.44 9.10 14.76 11.84 8.75 8.58 14.82 0.27 4468.00 8.07
UTI Bond Fund - Growth 34.94 04-May-1998 1403.42 1.66 11.68 8.33 14.60 11.76 9.92 8.81 13.09 0.32 2589.00 N.A
Annualised
Returns (%) Risk Average Yield tillScheme Name NAV Launch AUM Since Std. Sharpe Maturity (Days) Maturity
1W 2W 1M 6M 1Y 3Y(`) Date (`Cr.) Launch Dev.
Escorts Short Term Debt F-Growth 17.54 29-Dec-2005 9.97 8.25 7.87 8.11 11.13 10.66 9.54 8.17 2.76 1.18 172.00 N.A
UTI Short Term Income F- Ret-Growth 20.21 23-Jun-2003 2050.79 7.80 9.74 7.37 10.81 10.59 8.91 7.54 6.46 0.48 746.00 N.A
Sundaram Select Debt-STAP-Reg-Appreciation 19.85 04-Sep-2002 17.25 7.74 7.14 5.79 10.46 10.97 9.37 6.76 4.48 0.77 1361.00 9.36
SBI Short Term Debt Fund - Growth 13.35 27-Jul-2007 2249.28 7.23 6.52 4.68 9.82 10.28 8.08 5.32 5.41 0.48 1073.00 8.99
Taurus Short Term Income Fund-G 2009.59 23-Aug-2001 240.84 9.14 9.13 9.19 9.76 10.39 8.94 6.25 1.19 2.42 29.00 N.A
SBI SHDF-Short Term-Ret-Growth 15.11 27-Jul-2007 2249.28 7.09 6.37 4.54 9.69 9.99 7.86 7.68 5.22 0.46 1073.00 8.99
IDFC SSIF-MTP-Reg-Growth 19.90 08-Jul-2003 2240.34 6.06 6.61 5.08 9.64 9.74 8.65 7.40 6.13 0.39 1372.00 8.82
Annualised
Returns (%) Risk Average Yield tillScheme Name NAV Launch AUM Since Std. Sharpe Maturity (Days) Maturity
1W 2W 1M 6M 1Y 3Y(`) Date (`Cr.) Launch Dev.
Indiabulls Ultra Short Term F-G 1113.70 06-Jan-2012 524.19 8.23 68.00 8.46 8.42 8.47 9.25 10.00 N.A 10.01 1.47 1.76
JM Money Manager Fund-Reg-Growth 16.15 27-Sep-2006 187.29 9.31 27.00 8.89 8.96 8.85 9.14 10.02 8.85 7.77 0.76 3.40
Templeton India Low Duration F-G 12.57 26-Jul-2010 3172.53 9.51 124.00 8.02 6.59 6.31 8.80 9.92 N.A 9.27 1.97 1.25
IDFC Ultra Short Term F-Reg-G 16.15 17-Jan-2006 800.87 8.44 47.00 8.22 8.16 8.07 8.78 10.09 8.66 6.98 2.77 0.91
Pramerica Ultra Short Term Bond F- G 1237.69 24-Sep-2010 265.70 8.69 195.00 8.29 8.01 7.04 8.67 9.38 N.A 9.24 1.11 1.83
Principal Debt Opp. F- Conservative-G 1844.03 14-Sep-2004 415.17 8.77 80.00 7.53 7.12 7.04 8.63 9.65 8.31 7.52 1.27 1.77
Kotak Floater - LT - Growth 18.48 13-Aug-2004 4084.42 9.00 139.00 7.69 7.57 6.76 8.62 9.37 8.30 7.46 1.40 1.44
Annualised
®

Mr S C Aggarwal (CMD, SMC Group) sharing his thougths during ASSOCHAM's 2nd National Conference on Corporate Compliance & Role of Independent Directors held at New Delhi
Mr Mahesh C Gupta (Vice CMD, SMC Group) sharing his thoughts with the elite gathering during ASSOCHAM's 11th National Conference on Commodity Futures Market held at New Delhi