Embed Size (px)
Citation preview

A WATER SMART PLAN FOR DONCASTER HILL – TRANSFORMING A PRINCIPAL ACTIVITY CENTRE INTO A KEY
COMPONANT OF A SUSTAINABLE CITY Peter Coombes1, Karrena Bethke2, Alan Cullen3, Andrew Allan4, Jamie Comley5 and Francis Pamminger6
1 Bonacci Water; 50 Hoddle street, Abbottsford, Victoria. [email protected] MWH; Level 21, 28 Freshwater Place, Southbank, Victoria 3 Cullen Capital; Level 14, 50 Queen Street, Melbourne, Victoria. 4 Manningham City Council; 699 Doncaster Road, Doncaster, Victoria 5 Melbourne Water Corporation; 100 Wellington Parade, East Melbourne, Victoria 6 Yarra Valley Water; Lucknow Street, Mitcham, Victoria Abstract The Doncaster Hill Principal Activity Centre (PAC) occupies a land area of 58 ha in Victoria, Australia. It is proposed to redevelop the PAC as a higher density project to accommodate some of Melbourne’s expected population growth. Importantly, Manningham City Council (MCC), Melbourne Water Corporation (MWC) and Yarra Valley Water (YVW) have signed a Memorandum of Understanding (MoU) that defines the vision for the PAC. This study has utilised a unique integrated systems approach to analysing the performance of a range of integrated water cycle management (IWCM) options for the PAC. This type of analysis is dependent on detailed inputs including water demands, topography, urban planning and hydrological design to create an efficient IWCM strategy. A range of combined Options for IWCM were analysed to inform the decision making process. These Options were found to provide reductions in mains water demands, sewerage discharges, and considerable reductions in the requirement for water, sewerage and stormwater infrastructure that overwhelm the costs of providing and operating the infrastructure. These strategies also provided the greatest reduction in greenhouse gas emissions and nutrient loads. An integrated systems approach to infrastructure planning and design will reduce the water, sewer and stormwater infrastructure needed to service the development. The best mix of water management options includes wastewater reuse or stormwater harvesting, rainwater harvesting, water efficient appliances and WSUD that avoids the need for larger regional strategies to provide certainty about future urban water supplies. Doncaster Hill PAC can be redeveloped with a reduced carbon footprint by adopting infrastructure planning principles that make use of all available water sources from within the development before relying on large external infrastructure upgrades. A localised infrastructure solution also provides increased flexibility in the timing and rate of development. The provision of an IWCM strategy that incorporates wastewater treatment plants and rainwater harvesting located within the PAC will allow timely allocation of financial resources and infrastructure to the project. The MoU partners have since agreed to implement an IWCM strategy and the delivery of the first buildings in the PAC includes the strategy – a significant achievement that has produced a brown field IWCM strategy of national significance. 1. INTRODUCTION The Doncaster Hill Smart Water Project aims to produce an integrated water cycle management (IWCM) strategy for the Doncaster Hill area in Victoria that is more environmentally sustainable than traditional planning methods, and accordingly provide a template for others to use in future planning.

Manningham City Council (MCC), Melbourne Water Corporation (MWC) and Yarra Valley Water (YVW) have committed to this project via a Memorandum of Understanding (MoU) which includes an agreed set of principles and a program designed to consider and implement long term and sustainable planning for water management within the Doncaster Hill Principal Activity Centre (PAC). The Doncaster Hill redevelopment area consists of about 58 ha of land located along the major transport intersection of Doncaster, Williamsons and Tram Roads. This land forms the Doncaster Hill Principal Activity Centre and is made up of seven unique precincts (Figure 1). The agreed vision for Doncaster Hill includes the creation of a “state of the art’, contemporary sustainable, high density, mixed use urban village.
Golf Club
Figure Error! No text of specified style in document.: The Seven Precincts within the Doncaster Hill PAC
The Doncaster Hill Strategy looks to maximise sustainability and environmental protection aspects of the development within the framework of the Victorian state government planning provisions and strategies for metropolitan growth, including the Victorian Government’s Melbourne 2030 and the new Melbourne @ 5 million policies. The focus of these goals is to provide reductions in energy and water consumption relative to traditional development strategies. The Doncaster Hill area is expected to include housing for 8,300 residents and provide 10,000 employment opportunities by 2030. This development process has already begun with 200 apartments already constructed, approval gained for construction of a further 1,200 dwellings and completion of a $600 million Westfields shopping complex in one of the Precincts. This project makes a necessary contribution to providing more sustainable growth for metropolitan Melbourne by investigating more sustainable or optimum approaches to provide water cycle services and associated water infrastructure options. Manningham City Council engaged the partnership of Bonacci Water, MWH and Cullen Capital to develop an integrated water cycle management strategy for the redevelopment that combines current best practice stormwater management with reductions in mains water use and wastewater discharges. The analysis also considers greenhouse gas emissions, costs and benefits. Options investigated included reuse of wastewater from new treatment plants located within the development to supply toilet flushing, garden watering and open space irrigation. Stormwater harvesting, rainwater tanks that replace onsite detention (OSD), water sensitive urban design (WSUD) and the use of water efficient buildings was also investigated.

These Options were compared to the Business as Usual (BaU) case that assumes that mains water will be delivered to the development from regional water resources including desalination and all wastewater is discharged from Doncaster Hill to Yarra Valley Water’s sewerage reticulation system which ultimately discharges to Melbourne Water’s wastewater treatment facilities. The BaU case also assumes discharge of all stormwater, via onsite detention (OSD) systems, to the existing drainage systems. 2. OBJECTIVES A series of workshops were held to identify key objectives for the Doncaster Hill PAC including minimising mains water demands, discharge of sewage, carbon footprint and costs of the development whilst protecting the environment. Input from MoU partners MCC, YVW and MWC (who co-ordinated the contribution of other interested parties), was complied and utilised by the project team in the workshops as shown in Table 1.
Table 1: Objectives for Urban Water Cycle Management at the Doncaster Hill PAC Criteria Objectives or targets Effective Impervious areas Not greater than 5% Building form Green Star 6 or equivalent Suspended solids 80% reduction in average annual urban loads Total phosphorus 60% reduction in average annual urban loads Total nitrogen 45% reduction in average annual urban loads Litter No litter discharging to waterways Peak stormwater discharges Reduce all peak discharges to levels expected for 35% impervious
areas Stormwater runoff days Average annual days maintained at Pre-European levels Water demands Net self sufficiency Sewage discharges Net self sufficiency Salinity Return the salinity of waterways and soils to pre-European levels Energy No increase in energy demands in comparison to BaU Carbon Carbon neutral Climate change All water cycle systems resilient when subject to the high emissions
scenario for 2070 The infrastructure system that delivers these services should feature, where possible, reduced greenhouse gas emissions and low operating and maintenance costs. Objectives and targets for water management were developed for the PAC in accordance with the vision for a sustainable development and included MCC Planning policies - “Water15 Sustainable Water Management Plan (2005-2015)” and “Strategic Water Management Plan (2008)”. The agreed objectives represent current best practice for source control, protection of the health and amenity of waterway ecosystems, mitigation of flooding and minimising the impacts of development on the water cycle. The targets aim to mitigate water cycle impacts to pre-urban levels where possible. Objectives for managing building form and limiting effective impervious areas are also relate to managing stormwater impacts and demands for water at source. Reductions in the effective impervious areas at the allotment or sub-precinct scale will mitigate impacts on waterway health (Walsh, 2004; Walsh et al., 2009). 3. OPTIONS This study examined a range of alternative options for water cycle management at the Doncaster Hill PAC as shown in Table 2. The base case (BaU) assumes that mains water will be the sole source of water supply to Doncaster Hill. The BaU case assumes that potable water will be freed up in the Greater Melbourne water supply system by construction of the Wonthaggi desalination plant and the Food Bowl Modernisation project. All sewage generated by Doncaster Hill will discharge to the existing trunk sewerage system. The PAC

will utilise the existing traditional drainage infrastructure including onsite detention used to reduce stormwater peak discharges to the magnitudes expected for sites with only 35% impervious areas. It is expected that the building form in the BaU option will achieve a water efficiency equivalent to a Green Star 2 standard.
Table 2: Key to Options Option Abbreviatio
n Description
0 BaU and stormwater BaU - mains water supply, traditional sewerage infrastructure, and moderate level of water efficiency
1 WEA (1) ngs at Water Efficient Appliances with BaU - all buildings and dwelliDoncaster Hill include the equivalent of Green Star 6 appliances
2 RWT (2)
levels in tanks are low. Rainwater systems designed to replace
Rain Water Tanks with BAU - rainwater collected from roofs of all buildings to supply toilet flushing, laundry and garden watering. Each rainwater supply system will include a small first flush device (20 L) and a mains water bypass system for backup during periods when water OSD.
3 RWT_WW (3) r harvesting
WEA and RWT with the use of building or Precinct scale wastewater treatment plants that supply outdoor water uses. Rainwatesupply toilets in each building cluster via a 3rd pipe system
4 WW (4) use strategy to supply toilet WEA and BaU with a local wastewater re(via a 2rd pipe system) and outdoor uses
5 RWT_WW (5)
system within
WEA and RWT and the use of a Membrane bioreactor (MBR) wastewater treatment plant with ultra-filtration (UF) to supply toilet via a 2rd pipe system within buildings and outdoor uses in each building cluster or Precinct. Rainwater harvesting within each dwelling cluster supplies laundry and hot water uses (via 3th pipe buildings). Rainwater systems designed to replace OSD.
6 RG_WW (6)
dry and hot water uses. Rainwater systems
Includes WEA and RWT with the use of a Membrane bioreactor (MBR) wastewater treatment plant with ultra-filtration (UF) located within the Golf Course to supply Class A treated wastewater for toilet flushing and outdoor uses via a third pipe network. The whole of Doncaster Hill recycled water strategy will harvest wastewater from the trunk sewerage main at the Golf Course. The wastewater supply will be supplemented by stormwater harvested from a constructed wetland. Rainwater will supply laundesigned to replace OSD.
7 RG_SW (7)
ter harvesting strategy. Rainwater systems designed to replace OSD.
Option 7 is similar to Option 6 except that the primary source of water for the third pipe system is drawn from stormwater runoff harvested atthe Golf Course. Wastewater is utilised to supplement the stormwa
4. METHODS
emands, topography, urban planning and hydrological design to create an efficient CM strategy.
to disclose the often hidden benefits of IWCM and WSUD strategies (Coombes d Kuczera, 2004).
This study has utilised an integrated systems approach to analysing the performance of a range of IWCM options for the Doncaster Hill PAC. This type of analysis is dependent on detailed inputs including water dIW The Doncaster Hill PAC has development controls specified in the Doncaster Hill Strategy (MCC, 2004). This allowed assessment of the density of development, proportions of impervious surfaces and water demands. It is important to have an interactive process between urban planners and designers of water cycle systems an

The study combined the hydrological model (WUFS) from the University of Newcastle, the PURRS (Probabilistic Urban Rainwater and wastewater Reuse Simulator) water demand model by Coombes (2006), the water quality model MUSIC and the network linear program WATHNET (Kuczera, 1994). Analysis of the impacts of urban development on waterway ecosystem health was conducted using the continuous simulation model MUSIC from eWater CRC, the hydrological model (WUFS) and the water balance model (PURRS). 4.1 Stormwater quality The MUSIC model was used to analyse and assess the environmental benefits of each stormwater management option as defined by best practice guidelines. The rainfall record utilised in the analysis of stormwater quality is shown in Table 2.
Table 4.1: Rainfall Record Used in the Analysis of Stormwater Quality and Flows Record Start date End date Annual rainfall
(mm/yr) Length (years)
Croydon 1/04/1965 30/11/2001 803 37 Monthly average daily evaporation data from the Melbourne RO station from the Bureau of Meteorology was also used in the analysis. 4.2 Continuous simulation and water balance The PURRS model was utilised to derive water use, the performance of rainwater harvesting, demand for treated wastewater and performance of OSD facilities. A more complete description of the PURRS model is provided by Coombes (2006). Continuous simulation (using PURRS) was also used to determine a no worsening of stormwater peak discharges for all storm events up to and including 100 year ARI. These design parameters serve the multiple purposes of protecting waterway health, improving the amenity of waterways and mitigating local flooding. Performance of the water supply, stormwater flows, sewage disposal and wastewater reuse systems at each building cluster were simulated at a 6 minute time step over a 99 year period that includes many significant droughts. The Croydon daily rainfall record shown in Figure 2 was used to develop a synthetic pluviograph (6 minute) rainfall record that was used in PURRS.
0
200
400
600
800
1000
1200
1400
1910 1920 1930 1940 1950 1960 1970 1980 1990 2000 2010
Rai
nfal
l (m
m/y
r)
Year
Rain10 year moving average

Figure 2: The long rainfall sequence used in the analysis
The long term sequence of rainfall at Croydon displays a natural variation of rainfall depths that includes a cycle of wet and dry periods which may better describe rainfall processes than speculation about rapid changes in rainfall depths as a result of climate change. This phenomenon is known as hydrological persistence (Whiting et al., 2006). Figure 2 reveals that the longer rainfall record at Croydon includes a number of droughts. This study has adopted climate change scenarios derived by CSIRO from recent IPCC summaries of global climate models (CSIRO, 2007; IPCC, 2007). The high emissions scenario has been adopted to account for the continuing growth in global emissions. Expected seasonal changes in temperature and rainfall will have a moderate impact on analysis of water balances including rainwater and stormwater harvesting, stormwater quality and outdoor water demands. The climate change scenarios shown in Table 3 were used in the analysis of water balances.
Table 3: Estimated Changes in Temperature from the High Emissions Scenario Change in temperature (°C) Change in rainfall (%)
Season 2030 2070 2030 2070
Spring +0.8 +2.6 -7 -21 Summer +0.9 +3.0 -2 -7 Autumn +0.8 +2.6 -2 -5 Winter +0.7 +2.1 -4 -11
The potential for climate change is expected to increase rainfall intensity and have a significant impact on peak stormwater discharges at the site. The expected seasonal changes in rainfall intensity shown in Table 4 have been included in the analysis.
Table 4: Estimated changes in Rainfall Intensity Change in rainfall intensity (%)
Season 2030 2070
Spring +0.6 +7.4
Summer +2.7 +16.3
Autumn +1.1 +7.0
Winter +2.3 +17.0
The maximum increase in rainfall intensity of 17% in 2070 has been derived from Table 4 and used in the hydrological analysis of stormwater runoff. Simulation of sub-daily indoor uses in the PURRS model are based on the values for water use derived from demographic data from Australian Bureau of Statistics and water use data from Department of Sustainability and Environment; the distributions of water end uses and diurnal patterns. This study has modified the distribution of indoor water uses reported by Roberts (2006), Bonacci Water (2007) and Green Star rating tools (GBC, 2009) for use in PURRS as shown in Table 5.
Table 5: Proportion of Water End Uses for Different Land Uses Proportion of water end uses (%)
End use Residential Commercial Industrial Education Health
Kitchen 10 12 12 5 10 Laundry 21 2 2 5 10

Toilet 18 64 64 80 34 Bathroom 24 8 8 5 36 Hot water 27 14 14 5 10
The framework of behavioural and climatic drivers defined by Coombes et al. (2000) defines the daily simulation of water use in PURRS. Outdoor water use in public open space and on non-residential properties was derived from an average annual irrigation demand of 12 mm/week that was dependent on rainfall, temperature and cumulative dry days. The magnitude of outdoor water use and irrigation is dependent on climate processes. 4.3 Hydrological analysis Each building cluster was designed to ensure a no worsening of stormwater peak discharges in comparison to development with 35% coverage of impervious surfaces. The assessment of the stormwater runoff characteristics of the site in the existing and developed states was undertaken using WUFS (Water Urban Flow Simulator) by Kuczera et al. (2000). The more simplistic Rational Method calculations were not employed in this study (other than for calibration purposes) because this type of method does not account for the volumes of rainfall in storm events and the range of initial conditions that impact on stormwater runoff. Using the WUFS model, details of the building clusters and design storm parameters from Australian Rainfall and Runoff (EA, 2001) the performance of stormwater management at each building was analysed. The intensity frequency duration (IFD) data used in the hydrology model to simulate the performance is shown in Table 6. The expected changes in rainfall intensity due to climate change have also been included in this analysis.
Table 6: IFD Data for the Doncaster Hill Activity Centre Rainfall intensity (mm/hour) for a given duration (hours) ARI (years)
1 hour 12 hours 72 hours 2 19 4.1 1.3 50 40.5 7.9 2.25
Design storms were generated for all storm durations using a skew of 0.36 and temporal pattern region 1 as defined from Australian Rainfall and Runoff. 4.4 Systems analysis Regional water demand data for the Doncaster Hill Activity Centre was combined with daily rainfall from Croydon and evaporation from the Melbourne in the WATHNET model. Performance of the water supply, stormwater runoff, sewage disposal and wastewater reuse systems at the different catchments within the Doncaster Hill Activity Centre and Greater Melbourne were simulated at a daily time step over a 99 year period. This allowed analysis of flow regimes in trunk infrastructure; assessment for regional sewage discharges, stormwater runoff and water demands; and recognition of synergistic outcomes. 4.5 Economic and financial analysis It is important to include a mechanism in the economic analysis to capture the value of not requiring regional water, sewerage and stormwater services. The majority of the economic analysis in the water industry does not account for this benefit whilst including the full cost of alternatives. A dwelling that provides some of its own water resources from (say) rainwater, water efficient appliances and reuse of wastewater does not have to purchase these services from utilities whereas a dwelling without water saving measures must purchase all water cycle services from utilities.
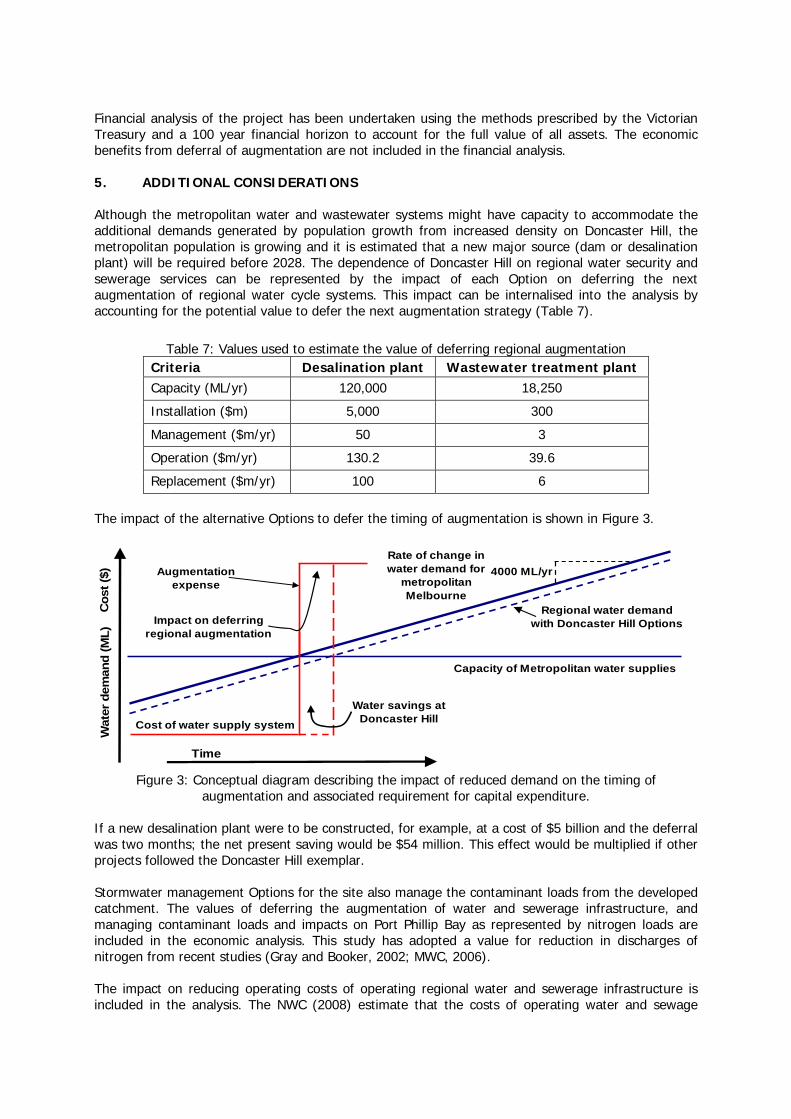
Financial analysis of the project has been undertaken using the methods prescribed by the Victorian Treasury and a 100 year financial horizon to account for the full value of all assets. The economic benefits from deferral of augmentation are not included in the financial analysis. 5. ADDITIONAL CONSIDERATIONS Although the metropolitan water and wastewater systems might have capacity to accommodate the additional demands generated by population growth from increased density on Doncaster Hill, the metropolitan population is growing and it is estimated that a new major source (dam or desalination plant) will be required before 2028. The dependence of Doncaster Hill on regional water security and sewerage services can be represented by the impact of each Option on deferring the next augmentation of regional water cycle systems. This impact can be internalised into the analysis by accounting for the potential value to defer the next augmentation strategy (Table 7).
Table 7: Values used to estimate the value of deferring regional augmentation
Criteria Desalination plant Wastewater treatment plant Capacity (ML/yr) 120,000 18,250
Installation ($m) 5,000 300
Management ($m/yr) 50 3
Operation ($m/yr) 130.2 39.6
Replacement ($m/yr) 100 6
The impact of the alternative Options to defer the timing of augmentation is shown in Figure 3.
4000 ML/yrRate of change in water demand for
metropolitan Melbourne
Water savings at Doncaster Hill
Regional water demand with Doncaster Hill Options
Capacity of Metropolitan water supplies
Augmentationexpense
Impact on deferring regional augmentation
Time
Cos
t ($)
Wat
er d
eman
d (M
L)
Cost of water supply system
Figure 3: Conceptual diagram describing the impact of reduced demand on the timing of
augmentation and associated requirement for capital expenditure.
If a new desalination plant were to be constructed, for example, at a cost of $5 billion and the deferral was two months; the net present saving would be $54 million. This effect would be multiplied if other projects followed the Doncaster Hill exemplar. Stormwater management Options for the site also manage the contaminant loads from the developed catchment. The values of deferring the augmentation of water and sewerage infrastructure, and managing contaminant loads and impacts on Port Phillip Bay as represented by nitrogen loads are included in the economic analysis. This study has adopted a value for reduction in discharges of nitrogen from recent studies (Gray and Booker, 2002; MWC, 2006). The impact on reducing operating costs of operating regional water and sewerage infrastructure is included in the analysis. The NWC (2008) estimate that the costs of operating water and sewage

system was $380/ML and $491/ML, respectively. The value of ultimately deferring the costs of regional augmentation and operation has been included in the economic analysis to represent the impact of Doncaster Hill on regional systems. In situations where there is perceived surplus capacity in regional water resources, it is commonly claimed that there are no benefits from reducing water use. However, the reality is that each additional unit of water consumption inevitably draws society towards the next augmentation of regional water supply systems and diminishes the opportunity for alternative developments. Clearly, saving water in one development presents additional development opportunities elsewhere. These opportunities need to be assigned a value to internalise the benefits that accrue to society. This study has evaluated the opportunity value of saving water at the Doncaster Hill project that will allow development elsewhere to utilise the available capacity in the trunk distribution systems. The average water use of detached dwellings in the area of 127 kL/yr, a development density of 15 allotments/ha and a residual land value of $1 m/ha was utilised to develop the opportunity value of saving water at Doncaster Hill. This opportunity value is $293,686 for each ML of deferred use of infrastructure capacity. The planned water future for Greater Melbourne and most Australian capital cities is dependent on high energy strategies including desalination and transport of water across long distances. The full energy costs of desalination and long distance transport strategies must be counted in contrast to the common practice of justifying high energy water strategies by claiming that use of green energy will neutralise energy impacts. Our plans to mitigate the impacts of climate change must avoid creating further increases in the causes of climate change by the adoption of high energy strategies. The full energy impacts of Greater Melbourne’s water future should be counted for two important reasons; firstly the delivery of “green power” to water solutions is not usually guaranteed or included in the economic assessment of a project, and secondly; green energy options should be utilised to reduce our society’s greenhouse emissions in preference to justifying otherwise non-optimum water strategies. It is expected that the contributions to greenhouse gas emissions from Greater Melbourne’s planned water future will be as follows: • Existing water supply and distribution infrastructure – the energy requirements based on
reporting by Melbourne Water within the NWC’s National Performance Report on urban water utilities.
• Wonthaggi Desalination Plant – total energy use is a combination of the operation requirements
of the plant and the pumping requirements to transport water to the Cardinia reservoir. • North-South Pipeline – energy requirements for pumping required from the Golbourn River
intake point in Yea to the distribution reservoirs in the south. This includes the additional energy required for pumping from Preston to the Dandenongs to accommodate the North-South Pipeline flows. The energy use for this pumping scheme is in the order of an additional 8,000 MWh/annum.
The energy profile of water supply from the regional water network for a demand of 600 GL/annum is shown in Figure 4.

62.5%375 GL/annum
105 GWh/annum
12.5%75 GL/annum
116 GWh/annum+ 8 GWh/annum
25%150 GL/annum
1032 GWh/annum
Melbourne Existing Wonthaggi Desalination Plant North-South Pipeline
Figure 4: Characteristics of Melbourne’s water supply
The average energy profile for the existing water supply and distribution system is approximately 0.279 MWh/ML. The new supply options with higher energy use increases the average energy profile to approximately 2.102 MWh/ML. The potential impacts of climate change will have significant impacts on human and natural systems. There is a need to adapt our cities to be resilient in response to climate change and to reduce emissions of greenhouse gasses to mitigate further changes in climate regimes. This study has evaluated energy uses of key water cycle infrastructure to assess the impacts of each Option on greenhouse gas emissions. The translation factor of 1.22 kg CO2 for each kWh of energy use for Victoria published by the Department of Climate Change was utilised in this analysis (DoCC, 2009). Thus the average greenhouse emissions for Melbourne’s mains water supply were determined to be 2.564 tonnes/ML. The pumping energy of various elements of trunk infrastructure in the various Options was determined to be 1,068 kWh for each ML of water flows. The energy use of the regional wastewater system was estimated from NWC (2007) to be 264 kWh for each ML for wastewater discharge. 6. RESULTS The mains water demands for each Option are shown in Figure 5

0
100,000
200,000
300,000
400,000
500,000
600,000
700,000
800,000
BAU WEA (1) RWT (2) RWT_WW (3) WW (4) RWT_WW (5) RG_WW (6) RG_SW (7)
Option
Wat
er D
eman
d (
kL/y
r)Precinct 1 Precinct 2
Precinct 3 Precinct 4
Precinct 5 Precinct 6
Precinct 7 Doncaster Hill
Figure 5: Results for mains water demands
Figure 5 reveals that significant mains water savings can be achieved by use of an IWCM strategy. Use of water efficient appliances reduced average annual water demands by 32% and combined strategies produces considerable reductions in average annual mains water demands. A combination of rainwater tanks and water efficient appliances provides a 44% reduction in mains water demands. The IWCM options that include rainwater tanks used to supply household laundry and hot water uses, wastewater reuse for toilet and outdoor uses, and water efficient appliances generates a 64% reduction in mains water demands. Importantly, this Option has reduced average annual water demands to a level that would significantly reduce the size and extent of water transfer mains and associated infrastructure to Doncaster Hill. A large decrease in water usage was achieved by incorporating water efficient appliances in the options (Options 1 to 7) and the use of rainwater tanks (Options 2, 3, 5, 6 and 7). The largest overall saving in mains water demands were achieved by adopting IWCM that included a centralised treatment plant for either wastewater or stormwater re-use (Options 6 and 7). The sewage discharges for each Option are shown in Figure 6.
0
100,000
200,000
300,000
400,000
500,000
600,000
700,000
BAU
WEA (1)
RWT (2)
RWT_WW (3
)
WW (4)
RWT_WW (5
)RG_W
W (6)
RG_SW (7
)
Option
Sew
er D
isch
arge
(kL/
yr)
Precinct 1 Precinct 2
Precinct 3 Precinct 4
Precinct 5 Precinct 6
Precinct 7 Doncaster Hill
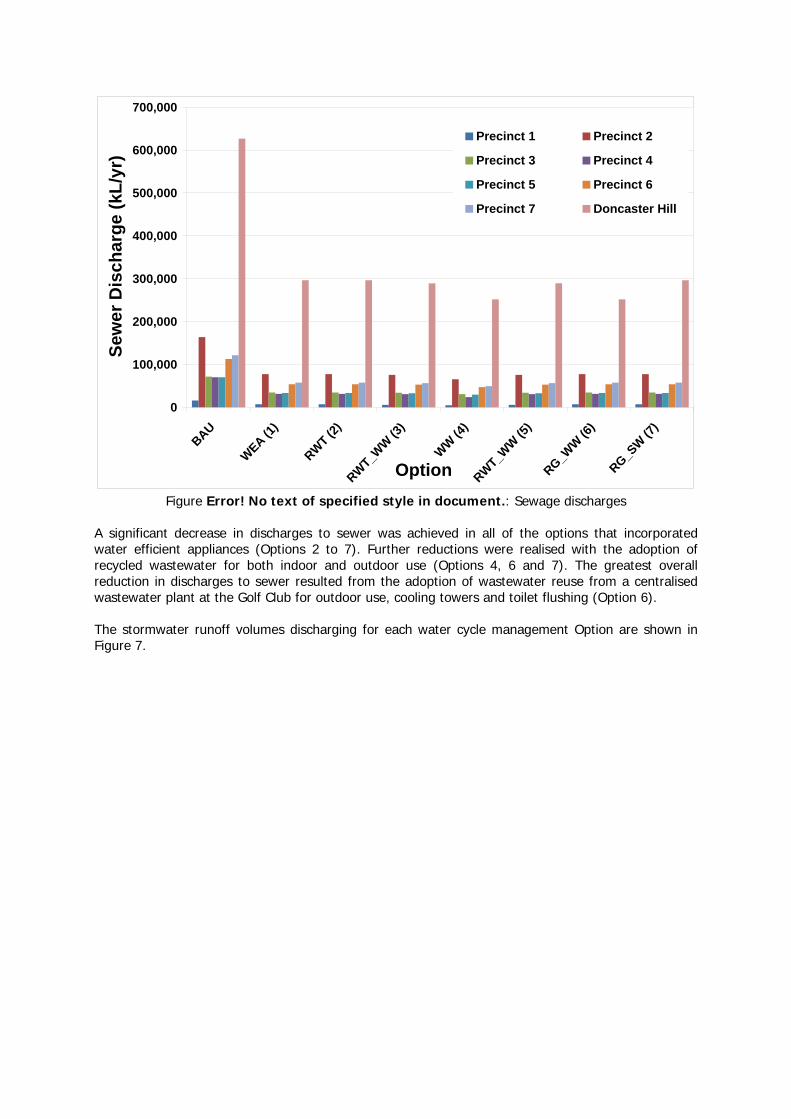
Figure Error! No text of specified style in document.: Sewage discharges
A significant decrease in discharges to sewer was achieved in all of the options that incorporated water efficient appliances (Options 2 to 7). Further reductions were realised with the adoption of recycled wastewater for both indoor and outdoor use (Options 4, 6 and 7). The greatest overall reduction in discharges to sewer resulted from the adoption of wastewater reuse from a centralised wastewater plant at the Golf Club for outdoor use, cooling towers and toilet flushing (Option 6). The stormwater runoff volumes discharging for each water cycle management Option are shown in Figure 7.
0
50000
100000
150000
200000
250000
300000
BAU
WEA (1)
RWT (2)
RWT_WW (3)
WW (4)
RWT_WW (5)
RG_WW (6)
RG_SW (7)
Option
Stormwater run
off v
olum
es (k
L/yr)
Precinct 1
Precinct 2
Precinct 3
Precinct 4
Precinct 5
Precinct 6
Precinct 7
Doncaster Hill
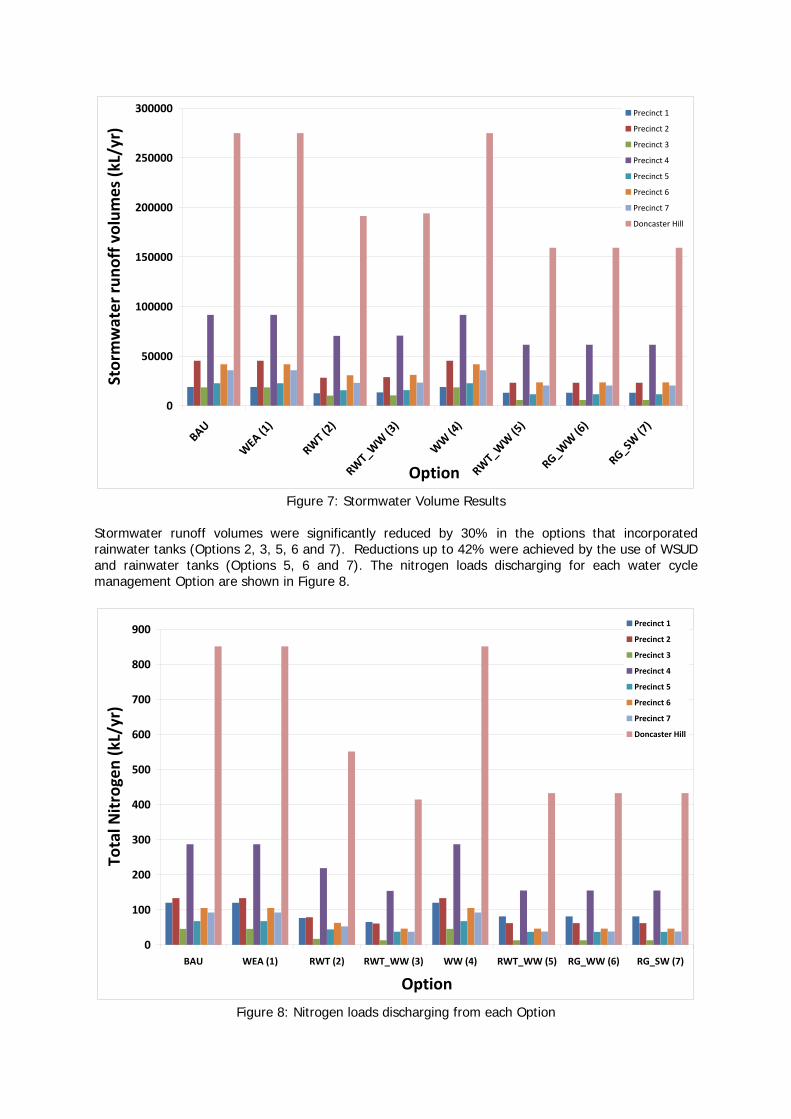
Figure 7: Stormwater Volume Results
Stormwater runoff volumes were significantly reduced by 30% in the options that incorporated rainwater tanks (Options 2, 3, 5, 6 and 7). Reductions up to 42% were achieved by the use of WSUD and rainwater tanks (Options 5, 6 and 7). The nitrogen loads discharging for each water cycle management Option are shown in Figure 8.
0
100
200
300
400
500
600
700
800
900
BAU WEA (1) RWT (2) RWT_WW (3) WW (4) RWT_WW (5) RG_WW (6) RG_SW (7)
Option
Total N
itrogen (kL/yr)
Precinct 1
Precinct 2
Precinct 3
Precinct 4
Precinct 5
Precinct 6
Precinct 7
Doncaster Hill
Figure 8: Nitrogen loads discharging from each Option

The options that significantly reduced discharges of total nitrogen loads were those that included rainwater tanks (Option 2, 3, 5, 6 and 7). Options that included rainwater tanks and WSUD produced the greatest reductions in nitrogen loads. The capital and operating costs, opportunity and augmentation benefits, and operating benefits for each Option was included in the economic analysis. The economic values of the opportunity and augmentation criteria are substantial – these values dominate the economic assessment. Option 6 has the greatest capital and operating benefits. The internal rates of return from the financial analysis of each of the Options are summarised in Figure 9.
0
20
40
60
80
100
120
140
WEA (1)
RWT (2)
RWT_WW (3
)
WW (4)
RWT_WW (5
)
RG_WW (6
)
RG_SW (7
)
Option
Inte
rnal
rate
of r
etur
n (%
)
2009 prices2009 - 2012 prices
Figure 9: Financial results for each Option
Figure 9 show that all options provide a positive net income and Internal Rate of Return (IRR). While some options produce lower IRR than recommended by the Victorian Treasury these values are changed when the pricing of external services increases as revealed by the results of the new pricing regimes by the Essential Services Commission. In addition, business models can be optimised to improve income or costs and include financial contributions received for the social and environmental benefits. The elements of the economic analysis are shown separately below to highlight the significance of different inputs to the analysis. A “traditional analysis” of the Options that is limited to capital and operating costs is shown in Figure 10.

Figure 10: NPV – capital and operating costs only
Figure 10 shows that Options 6 and 7 with regional wastewater reuse and stormwater harvesting has the greatest Net Present Costs whilst Options 1 and 2 that include water efficient appliances and rainwater tanks have the lowest Net present Costs. This type of limited analysis shows that all Options are more expensive than BAU because most of the benefits of alternatives are not counted. The economic benefits of the avoided costs of purchasing mains water and centralised sewage services are also included in analysis shown in Figure 11.
Figure 11: NPV – capital and operating costs plus the value of water savings

Figure 11 reveals that including the avoided costs of purchasing regional water and sewage services in the analysis results in a positive NPV for all Options except Option 7 which includes regional stormwater harvesting. The greatest NPV is generated by Option 2 that includes water efficient appliances and rainwater harvesting.
The results of the economic analysis of each Option that includes capital and operating costs, benefits from avoiding purchasing water and sewage services, and augmentation and opportunity costs are presented in Figure 12.
0
20
40
60
80
100
120
140
160
180
WEA (1)
RWT (2)
RWT_WW (3
)
WW (4)
RWT_WW (5
)
RG_WW (6
)
RG_SW (7
)
Option
NPV
($m
)
Figure 12: Net Present Value of Options (difference from BAU)
Figure 12 reveals that all Options generate significant benefits to society that are dominated by the deferral of the requirement to augment the regional water, stormwater and sewage systems servicing Greater Melbourne. The opportunity value created by avoiding the use of infrastructure capacity within the system is also substantial. Option 6 provides the greatest benefits that are derived from an integrated water cycle management strategy that includes water efficient appliances, rainwater harvesting as a replacement for OSD, and wastewater reuse via a Doncaster Hill third pipe system. Note that the wastewater reuse strategy is topped up from regional stormwater harvesting. The greenhouse gas emissions from each of the strategies for Doncaster Hill are shown in Figure 13.

0
500
1000
1500
2000
2500
BAU
WEA (1)
RWT (2)
RWT_WW (3
)
WW (4)
RWT_WW (5
)
RG_WW (6
)
RG_SW (7
)
Option
Gre
enho
use
gas
emis
sion
s (to
nnes
/yr)
Doncaster Hill
Figure 13: Greenhouse gas emissions
Figure 13 reveals that all alternative Options provide large reductions in greenhouse emissions in comparison to the BaU Option. These significant reductions in greenhouse emissions are driven by decreased dependence on regional water sources such as desalination and long pipelines that have high energy demands, and on the use of water efficient appliances that reduce water use and energy demands. The use of the water efficient appliances in buildings at a level equivalent to a 6 star rating (for example: GreenStar) dominates reductions in greenhouse gas emissions. Part of these reductions can be attributed to reductions in the energy required to heat water that result from lower water demands for hot water. Options 6 and 7 generate the greatest reductions in greenhouse gas emissions. 7. DISCUSSION This study utilised the systems integration of water balance, water cycle network, hydrology and water quality models at sufficient detail to reveal the wide range of opportunities available for IWCM at Doncaster Hill. Input from MCC, YVW and MWC were incorporated into the development of objectives. A summary of the performance of each Option against the multiple objectives applied in the analysis is given in Table 8. These results are shown as the change from the BaU Option (Option 0) for each of the seven options analysed.

Table 8: Summary of multiple objectives
Difference from BAU (%) Criteria Option
0 Option
1 Option
2 Option
3 Option
4 Option
5 Option
6 Option
7
Water Demands 0 -32% -44% -45% -53% -49% -64% -64%
Sewage Discharge 0 -29% -29% -31% -54% -31% -54% -29%
Stormwater Volume 0 -5% -30% -29% -5% -42% -42% -42%
Nutrient Loads 0 0% -35% -51% 0% -49% -49% -49%
GHG 0 -32% -41% -41% -44% -45% -53% -53%
IRR (%) 0 25 59 9 7 7 7 4 IRR (%) new prices 0 51 123 21 17 15 14 10 NPV ($m) 0 73.5 99.4 96.9 114 105 139 134.9
Table 8 shows that the benefits derived from the Options were generally largest for Options that incorporated IWCM strategies (Options 5, 6 and 7). These values were used in a workshop with the MoU partners to decide on the preferred strategy. The relative importance of the various criteria derived by the group is shown in Figure 14.
0%
2%
4%
6%
8%
10%
12%
14%
16%
Fina
ncia
l cos
t
Ben
efits
Gre
enho
use
Gas
Stor
mw
ater
Pollu
tion
Expo
rt
Stre
am H
ealth
Def
erra
l of
Infr
astr
uctu
re
Buy
in
Loca
l am
enity
-im
prov
emen
ts
Red
uced
Wat
erIm
port
Red
uced
Was
tew
ater
Expo
rt
Criteria
Rel
ativ
e im
port
ance
Figure 14: Relative importance of criteria in decision making for Doncaster Hill
Figure 14 reveals that the two most important criteria in the decision making process were reduced water demands and improvement in the health of streams whilst the least important criteria were financial costs and deferral of infrastructure. The voting for the Options is shown in Figure 15.

0%
5%
10%
15%
20%
25%
30%
35%
7 IWCM +
CentralisedStormwaterHarvesting
6 IWCM +
centralisedwastewater
reuse
5 Local
WastewaterReuse andRainwaterHarvesting
3 Local
WastewaterOutdoor
Reuse andRainwaterHarvesting
4 Local
WastewaterToilet andOutdoorReuse
2 RainwaterHarvesting
1 Water
EfficientAppliances
0 BAU
Stre
ngth
of p
refe
renc
e
Figure 15: Voting for Options by MoU partners and others
Figure 15 shows that the IWCM strategy in Option 7 that includes stormwater harvesting was preferred by the voting group. The MoU partners have since agreed to implement the majority of Option 7 and the delivery of the first buildings in the PAC includes the strategy – a significant achievement that has produced a brown field IWCM strategy of national significance. 8. CONCLUSIONS The Doncaster Hill PAC was planned as a water efficient, environmentally progressive and sustainable community with enhanced lifestyle and amenity to meet a range of community sustainability goals. An integrated systems approach to infrastructure planning and design will reduce the water, sewer and stormwater infrastructure needed to service the development. The best mix of water management options includes wastewater reuse or stormwater harvesting, rainwater harvesting, water efficient appliances and WSUD that avoids the need for larger regional strategies to provide certainty about future urban water supplies. Doncaster Hill PAC can be redeveloped with a reduced carbon footprint by adopting infrastructure planning principles that make use of all available water sources from within the development before relying on large external infrastructure upgrades. A localised infrastructure solution also provides increased flexibility in the timing and rate of development. This study has analysed a large number of combined Options for IWCM and informed the decision making process with reductions in wastewater discharges, water demands, stormwater volumes, greenhouse gases and nutrients. The strategies with the highest economic values included the following elements: • WSUD • Reuse of wastewater or stormwater from a local MBR treatment plant via a third pipe
distribution network for household, commercial, school and open space uses. • Water efficient washing machines, showers, toilets and taps • Rainwater harvesting within building clusters to replace OSD These Options were found to provide reductions in mains water demands, sewerage discharges, and considerable reductions in the requirement for water, sewerage and stormwater infrastructure that

overwhelm the costs of providing and operating the infrastructure. These strategies also provided the greatest reduction in greenhouse gas emissions and nutrient loads. The provision of an IWCM strategy that incorporates wastewater treatment plants and rainwater harvesting located within the PAC will allow timely allocation of financial resources and infrastructure to the project. The outcomes of this study have led to the following suite of recommendations to maximise the benefits of adoption of an IWCM strategy:
• Include additional pipe systems in the building design • Incorporate high efficiency washing machines into the developer’s packages • Allow use of rainwater harvesting systems to replace OSD • Streamline the approvals process between MCC, YVW and MWC to provide certainty to
developers about timing
9. REFERENCES Bonacci Water (2008). Rainwater tank evaluation study for Greater Melbourne. Report for Department
of Sustainability and Environment. Coombes P. J., G. Kuczera and J.D. Kalma, 2000. A behavioural model for prediction of exhouse water
demand, 3rd International Hydrology and Water Resource Symposium, 793-798, Perth, Australia. Coombes P.J., and G. Kuczera, (2004). Integrated water cycle management – moving toward systems
understanding. 2nd International conference on Water Sensitive Urban Design. Engineers Australia. Melbourne.
Coombes P.J., (2006). Integrated water cycle management using PURRS version 7.2. Urban Water Cycle Solutions.
CSIRO (2007). Climate change in Australia. www.climatechangeinaustralia.com.auDCC, (2009). National Greenhouse Account Factors. Department of Climate Change GBC (2009). www.gbca.org.au/greenstar/ratingtools. Website of the Green Building Council Gray S., and N. Booker (2002). Contaminant flows in urban residential water systems. Urban Water. 4.
331-346. Kuczera, G. (1994). Water supply headworks simulation using network linear programming. Advances
in Engineering Software. Vol. 14. 55-60. Kuczera, G., Williams, B., Binning, P. and Lambert, M., (2000). An education web site for free water
engineering software. 3rd International Hydrology and Water Resources Symposium. Institution of Engineers Australia. Perth. Western Australia. 1048 – 1053.
IPCC (2007). Fourth assessment report. www.ipcc.chMCC, (2004). Doncaster Hill Strategy. Manningham City Council. MWC (2006). Stormwater quality offsets – a guide to developers. Melbourne Water Corporation. NWC (2008). National performance report 2006 – 2007: urban water utilities. Australian Government National Water Commission and Water Services Association of Australia. Roberts P., (2006). End use research in Melbourne suburbs. Water. Australian Water Association. 51-
55. Walsh C.J. (2004). Protection of instream biota from urban impacts: minimize catchment
imperviousness or improve drainage design? Marine and Freshwater Research. 55, 317-326. Walsh C. J., Joshphar Kunapo (2009). The importance of upland flow paths in determining urban
effects on stream ecosystems. Journal of the North American Benthological Society 28(4):977-990. Whiting J., M. Lambert and A. Metcalf (2006). Identifying persistence in rainfall and streamflow
extremes and other hydrological variables. 30th Hydrology and Water Resources Symposium. Engineers Australia. Launceston, Australia.