Embed Size (px)
Citation preview
Friendly Societies of Australia Incorporated Level 11, 35 Clarence Street, Sydney NSW 2000
ARBN 067 828 513
A Road Map to Greater National Savings
and Increased Budget Revenue
Submission to the Financial System Inquiry
March 2014

CONTENTS EXECUTIVE SUMMARY Page 4
INTRODUCTION Page 5
Friendly society history and role
Friendly society licensing and regulation
Friendly society savings and insurance products
Life-event savings – ACFS Research Paper
Policy case for insurance bonds in medium to long–term financial adequacy
Challenges of Australia’s changing demographics
TAXATION OF FINANCIAL ARRANGEMENTS Page 8
Recommendation 1 - Reduce the tax rate on friendly society investments from 30% to 20%
History of tax rate adjustments to attract savings to insurance bonds
Positive tax revenue measures
Generation of new tax revenues
Industry support for a reduction of insurance bonds tax rate
Recommendation 2 - Introduce a government co-contribution
scheme for friendly society education plans
Increasing education participation rates
Target post-secondary education
Scheme integrity
Incentives to introduce a scheme
Size of challenge
Success of other government co-contribution schemes
Recommendation 3 - Immediately restore an appropriate tax-free threshold on taxable benefits paid to minors under friendly society education savings plans
Unintended consequences of government reforms
Impact of future scholarship plans
Negligible budget impact
PHILOSOPHIES, PRINCIPLES AND OBJECTIVES Page 16
“Twin peaks” regulatory model
Effectiveness of regulation
The performance of the regulators
Red tape
Regulatory impact statements
Overly prescriptive regulation
Coordination of regulation across government
Timely implementation of reforms
Parliamentary oversight of APRA
Controlling the growth of APRA levies
CONCLUSION Page 22
APPENDIX 1 Page 23
Overview of friendly society savings and insurance products


FSA submission to the Financial System Inquiry, March 2014 Page 4
EXECUTIVE SUMMARY The Friendly Societies of Australia (FSA) welcomes the opportunity to contribute our priorities to the 2014 Financial System Inquiry. The FSA is the industry association that represents 10 of
Australia’s 12 APRA-registered friendly societies. Friendly societies assist Australians to plan and set aside personal savings to fund future life-events through the provision of savings, investment and insurance products. This submission makes three recommendations in the section titled TAXATION OF FINANCIAL ARRANGEMENTS in response to the Inquiry’s terms of reference number 6. These
recommendations can foster greater self-reliance, address the nation’s debt challenges, and counter the deficiencies in the non-superannuation savings pool. We believe these recommendations are entirely consistent with the themes expressed in the Treasurer’s speech, The End of the Age of Entitlement. If adopted, these recommendations will lead to a reduction in government social welfare spending, create tax revenue positive measures, and Australians will be better placed to adequately fund
their future needs. The FSA recommends:
1. a reduction in the tax rate on friendly society investments from 30% to 20% to increase
private savings to enable individuals to better provide for life-events, address the significant lack of tax neutrality in concessions favouring superannuation over insurance bonds, and respond to the fact that Australia’s superannuation savings pool of some $1.6 trillion generates, in absolute and relative terms, too little tax revenue from this vast asset pool;
2. the introduction of a government co-contribution scheme for friendly society education savings
plans for Australian families to assist and encourage this form of savings; and
3. the immediate restoration of an appropriate tax-free threshold on taxable benefits paid to minors under friendly society education savings plans which are currently taxed at punitive rates as high as 66% due to an unintended outcome of tax changes by the previous
government when it removed access to the low income tax offset.
The FSA’s recommendations:
• represent a coherent and measured response to structural challenges as highlighted in the most recent Mid-year Economic and Fiscal Outlook;
• can assist to manage the growing reliance on government funded social welfare due to Australia’s ageing population;
• are tax revenue positive measures, the scale of which will be significantly increased if the recommended reduction to the tax rate on friendly society insurance bonds is extended to insurance bonds issued by mainstream life insurance offices;
• will boost Australia’s long-term education capacity;
• increase workplace productivity and participation rates;
• up-skill Australia’s workforce; and
• expand employment opportunities and subsequent earnings capacity.
Professor Kevin Davis, panel member of the Financial System Inquiry, has previously undertaken preliminary costings of recommendations 1 and 2 through the Australian Centre for Financial Studies (ACFS) and a copy of this research is attached.
This submission also proposes a range of policy options, for consideration, in the section titled PHILOSOPHIES, PRINCIPLES AND OBJECTIVES in response to the terms of reference number 2 (5) that, we believe, can improve the regulatory framework under which friendly societies operate.

FSA submission to the Financial System Inquiry, March 2014 Page 5
INTRODUCTION
Friendly society history and role First established by community groups in the 1830s, friendly societies have evolved into customer-focused financial service providers that help Australians become financially independent and plan for life-events through the provision of savings, investment and insurance products. The sole focus of friendly societies is to assist and promote Australians to:
• fund future common and foreseeable life-events, such as home deposits and ownership, raising and educating children, sinking funds to pay debt, health and aged-care, job loss provisions, private child care funding, and support for aged parents or family members with disabilities;
• better prepare for difficult financial times that inevitably arise at some point in their lives; and
• improve and sustain financial and social standards via self-reliance and a savings culture that does not resort to social welfare dependency in the first instance.
To promote this ethos and personal savings culture, friendly societies commit to:
• providing low-fee savings products that represent good value, are easily understood, meet an express customer need and are inclusive to all levels of society;
• maintaining high customer service standards;
• furthering the financial literacy of Australians, and educating them about the benefits of
prudent medium-term savings and the need for financial security derived from self-generated financial provisions; and
• upholding core principles of mutual self-help, support and co-operation.
FSA members serve the savings, investment and insurance needs of more than 800,000 Australians.1 As at June 2013, the industry held total funds under management of almost $6.3 billion2. The sector is diverse in nature – Australia’s largest friendly society is Lifeplan Australia Friendly Society with funds under management of almost $2 billion and 169,000 customers. The smallest is NobleOak Life Limited with about $12 million funds under management and
approximately 5,500 customers.
Friendly society licensing and regulation Friendly societies are:
• financial institutions regulated by the Australian Prudential Regulation Authority (APRA) under the Life Insurance Act 1995 (Life Act);
• corporations and Australian financial services licensees regulated by the Australian Securities
and Investments Commission (ASIC) under the Corporations Act 2001; and
• reporting entities regulated by the Australian Transaction Reports and Analysis Centre under the Anti-Money Laundering and Counter-Terrorism Financing Act 2006.
All friendly societies supervised by APRA are registered as life insurance companies under the Life Act, which authorises them to conduct various classes of life insurance business structured within their corporate entity using the friendly society ‘benefit fund’ structures. Their products seek to enable individuals to undertake a discretionary, targeted savings strategy mindful of their future life-events.
Friendly society savings and insurance products These products primarily take three forms:
1. insurance bonds used for savings to fund and provide for life-events;
2. funeral bonds to cover future funeral expenses; and
3. scholarship plans which are designed for education savings for the benefit of children nominated under the plans.
1 COBA industry figures, 2013 2 APRA Statistics, Annual Friendly Society Bulletin, June 2013
FSA submission to the Financial System Inquiry, March 2014 Page 6
Friendly societies are the main issuer of insurance bonds, alongside the larger mainstream life offices, and are the sole issuer of scholarship plans and funeral bonds in the Australian market today. Refer to APPENDIX 1 for a more detailed overview of friendly society savings and insurance products.
Life-event savings – ACFS Research Paper
In August 2011, the Australian Centre for Financial Studies (ACFS)3 released a research report
Private Saving: The Role of Life Event Products4 commissioned on behalf of the FSA. The report highlighted that the financial challenges, such as financing education, housing, health and retirement, can be met, in part, through an adequate, sustainable savings pool or in other cases, modest government support. Conversely, a shortfall in these areas will directly impact the range of opportunities available to an individual over their lifetime. Importantly, and in line with this submission, the report concluded that the insurance bond
framework, offered by Australian friendly societies, is the best mechanism to prevent medium-term savings shortfalls. However, there is a disincentive for low to middle income earners to use these products. The FSA has developed policy recommendations to address this disincentive, drawing on the report’s recommendations, alongside the industry’s existing policy priorities.
Policy case for insurance bonds in medium to long-term financial adequacy The ACFS research observed that “households face a range of possible life events, such as education, health, housing and retirement, which can require significant expenditures for which they are often inadequately prepared by way of saving or insurance”.
The ACFS suggests that government tax policy can also be structured to influence both savings and the design of financial products to assist people in providing for their own pre-retirement welfare. Its paper noted that “there has been less attention paid to how government policy can best be designed for assisting individuals in preparing for other life events. Indeed, the tax incentives given for superannuation may have impeded the development and growth of other financial products well suited for non-retirement life event preparation”.
At a policy level, the ACFS research stated “insurance bonds are a good example of a ‘partnership model’ in which individuals accumulate savings to meet expenditures and where some government contribution is involved via the tax concessions provided”. “It is also possible for that contribution to be achieved by government matching or co-contributions. However, at the current tax rate applied to friendly societies, the attractiveness of
these products to low income individuals as a wealth accumulation vehicle is reduced”. The ACFS research pointed to the insurance bond framework as a long-standing, simple, low-advice mechanism that has the potential to increase household savings and financial wellbeing. However, the ACFS also made the following observation: “The Henry Review (2009) highlighted the lack of neutrality in the tax treatment of various savings products. With the dominance of the
superannuation system in public policy, incentives to encourage individuals to be financially self-reliant and plan for the future through non-superannuation vehicles have gradually dissipated”. The Henry Tax Review, in its report to Government in December 2009 explained the impact of the tax and transfer system in this and other areas, arguing that “living standards are also undermined by tax settings that discourage people from making choices that would yield greater lifetime wellbeing.”5
“There [under the tax and transfer system] would be clear incentives for people to improve their lifetime opportunities through workforce participation, investing in education or saving.”6
3 The ACFS is a not-for-profit consortium of Monash University, the University of Melbourne, RMIT University and Finsia, specialising in leading edge finance and investment research. 4 Australian Centre for Financial Studies, Private Saving: The Role of Life Event Products 5 Australia’s Future Tax System, Part One, p24 6 Australia’s Future Tax System, Part One, p26

FSA submission to the Financial System Inquiry, March 2014 Page 7
The ACFS research drew a key conclusion that “to enhance the use of this investment vehicle, and also to counterbalance the preferential tax treatment given to a range of other investment strategies, there is merit in considering changes to the current tax and legislative treatment of friendly societies and insurance bonds”.
Challenges of Australia’s changing demographics The FSA contends that inadequate discretionary savings among Australians is a major challenge to securing the economic and social wellbeing of individuals and communities. This challenge will be exacerbated given the dynamic pace of change to Australia’s demographics. According to the November 2013 research paper, Still Kicking7, Australia will have 1.8 million
people aged over 85 in 2050, one in four people aged over 65 by 2056, one million people with dementia by 2050, and 85,000 more aged care places will be required in the next decade. The need for Australians to better prepare to support their aged and health care needs in the coming years is critically important. If Australia fails to do so, the demands on the budget, for aged care alone, will be significant, ongoing and growing.
The ACFS paper makes these persuasive points that “government regulatory and tax policies should, at least, not impede the development and take-up of financial products which help individuals and families to prepare financially for life cycle events. But also relevant is the view that an “asset accumulation” approach to welfare policy is worth exploring further, using tax/transfer policies and grants to encourage individuals to accumulate financial assets can lead to greater private responsibility for dealing with possible life cycle events, rather than reliance upon
government welfare”. Given financial advice is unaffordable for many people, the FSA argues that insurance bonds issued by friendly societies are, as the ACFS observed, “simple financial products designed to deal with significant life events, and which can be explained simply to individuals, offer an advantage in that they can be achieved through low-cost, one-off advice associated with that products, rather than requiring expensive, on-going relationship advice”.
The FSA believes that the insurance bond framework is a well-developed, mature mechanism that, with an easily implemented and straight forward tax-rate adjustment, will:
• strengthen the medium-term financial adequacy of a wider group of people than the current
financial services framework provides for; and
• increase the range of social and economic opportunities available to Australians through a growing and sustainable savings pool.
7 http://www.percapita.org.au/_dbase_upl/Still%20Kicking.pdf

FSA submission to the Financial System Inquiry, March 2014 Page 8
TAXATION OF FINANCIAL ARRANGEMENTS
Terms of reference 6 The Inquiry will examine the taxation of financial arrangements, products or institutions to the extent these impinge on the efficient and effective allocation of capital by the financial system, and provide observations that could inform the Tax White Paper.
RECOMMENDATION 1 – To increase tax revenue, reduce pressures on Government
welfare expenditure and encourage individuals to prepare for major life-event expenditures in areas such as education, health and aged-care, the FSA recommends a reduction in the tax rate of friendly society investments from 30% to 20%.
Friendly society (and mainstream life office) insurance bonds over recent decades have been subjected to major competitive disadvantage relative to superannuation with respect to the tax rates on both contributions and fund earnings.
While concessional superannuation contributions attract a tax rate, and insurance bond contributions do not, concessional superannuation draws on pre-tax income, whereas insurance bonds draw on after-tax income or savings. Even at 32.5%, the main MTR of many working Australians, superannuation contributions enjoy substantial advantages of being taxed at less than half that rate, 15%.
Fund earnings in an insurance bond are taxed at 30%, while earnings on superannuation are subject to a maximum tax rate of 15%. The superannuation tax rate of earnings can be reduced to 10% if realised capital gains for assets are held longer than 12 months. The superannuation tax rate can also be reduced to nil, when in pension mode. Our recommended 20% tax rate on earnings lies sufficiently below the main MTR of most working Australians and above the maximum superannuation rate of 15%. It will widen the attractiveness of insurance bonds to virtually
everyone above a minimum wage – currently $32,354.40.8 Insurance bonds offer a platform for financial adequacy throughout an individual’s life prior to retirement, however at the current tax rate of 30%, lack the universal appeal needed to ensure they are a sustainable option. To ensure competitive neutrality across the sector, we believe that insurance bonds issued by the mainstream life offices under the Life Act should also equally be subject to this reduced tax rate.
History of tax rate adjustments to attract savings to insurance bonds Friendly society issued insurance bonds are taxed under the life insurance fund tax rate specified in Section 23A of the Income Tax Rates Act 1986. Since the early 1980s, there have been substantial changes to the tax treatment of friendly societies. The tax treatment of friendly societies remains at a
competitive disadvantage relative to other savings products. Precedents exist to reduce the life insurance tax rate, as shown in the table below. Table 1: Taxation of Friendly Societies
Period
Tax Rate
(Life Insurance and corporate funds)
Tax Rate
(Complying superannuation and deferred annuity funds)
Tax Rate
(Immediate annuity and superannuation pension funds)
Until 1982-83 Zero Zero Zero
1983-84 to 1987-88
20% Zero Zero
1988-89 to 1993-94
30% 15% Zero
1994-95 to 2000-01
33% 15% Zero
2001-02 onwards 30% 15% Zero Source: Australian Centre for Financial Studies, Private Saving: The Role of Life Event Products
8 Currently, the full-time minimum wage is $16.37 per hour or $622.20 per week -
http://www.fairwork.gov.au/pay/national-minimum-wage/pages/default.aspx
FSA submission to the Financial System Inquiry, March 2014 Page 9
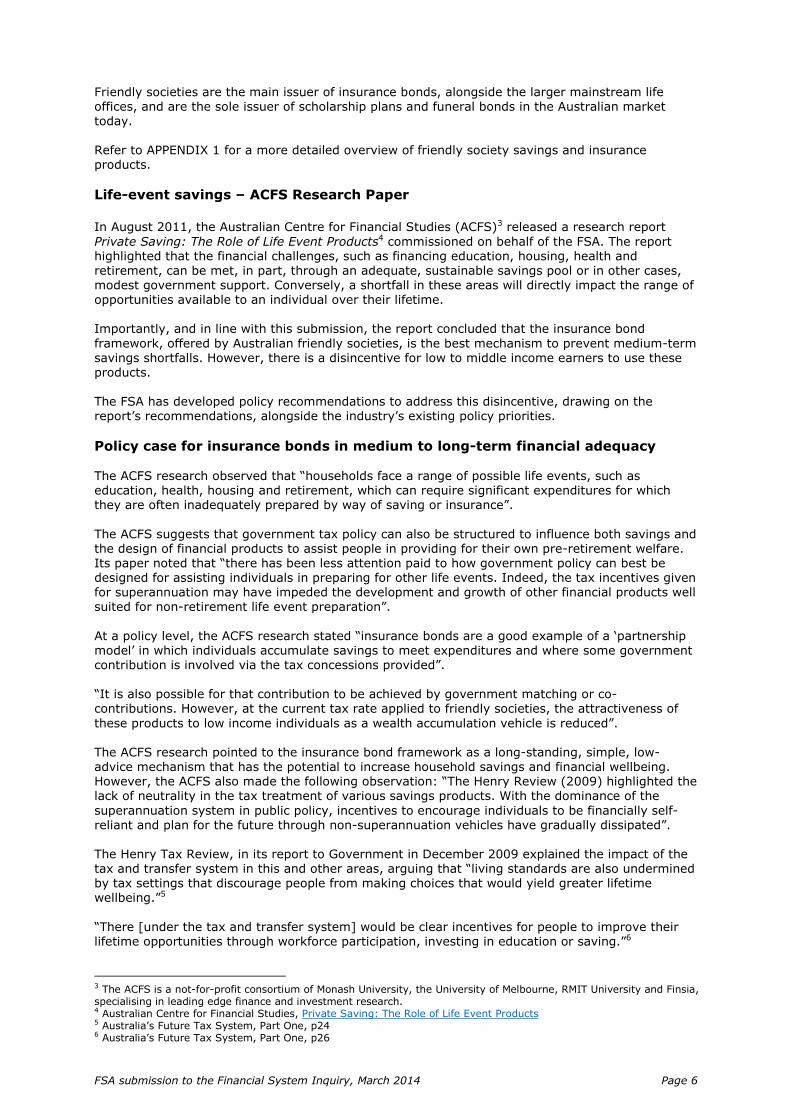
Note the tax treatment of friendly societies is uncoupled to the tax rate applied to Australian companies. While both are currently coincidently taxed at 30%, there has been a significant difference in applicable rates in the past, as shown in Table 2. The case to reduce the tax rate that applies to a friendly society life insurance business should have no bearing on discussions about the adequacy of the current company tax rate.
Table 2: Comparative tax treatment of Friendly Societies and Companies
Source: COBA, January 2014
The FSA contends that a reduced tax rate of 20% should equally apply to all friendly society product categories, given they are all tax-paid life-event products.
Positive tax revenue measures The FSA contends that a reduced tax rate on insurance bonds will have a net positive impact on government tax generated revenue. Too much of the nation’s private savings are being channelled into superannuation for retirement purposes, and not enough savings are allocated to fund pre-retirement life-events.
The crux of the argument relies on the simple fact that the bulk of Australia’s financial system – that is $1.6 trillion plus of assets in superannuation – generates in absolute and relative terms too little tax revenue from this immense asset pool. Additionally, superannuation can suffer various elements of leakage and can also suffer the “double dip” by allowing lump sums to be taken and spent, with consequent demand on the age pension.
We believe diverting a portion of the savings flow away from superannuation and into insurance bonds will immediately deliver additional revenue to government, given the former is taxed at a maximum of 15% and the latter would be subject to a 20% tax rate. Voluntary salary sacrifice contributions (as distinct from compulsory employer contributions) make up a significant proportion of total flows into superannuation, and a proportion of this would be expected to be redirected into life products if the relative tax rates were to change. Salary
sacrificed contributions to superannuation were estimated to total $12 billion in 2007.9 The FSA contends that many Australians will view a smaller tax rate differential (such as 15% versus 20%) as insufficient to lock into voluntary superannuation, which is primarily directed to fund one life event, namely retirement. In contrast, contributions to an insurance bond are accessible for any number of life events a person may reasonably expect to encounter – with savings then freed-up to plan for. It is not unreasonable to expect that changing the tax treatment
of life products would result in some reallocation of savings away from voluntary superannuation and towards life products. If this policy shift resulted in say, just 2.5% of voluntary salary sacrificed contributions being redirected to life products, we estimate that the positive impact on the Budget would be around $75 million per annum, more than fully offsetting the direct cost of the policy.
9 ASFA, Employer Contributions to Superannuation in Excess of 9% of Wages, 2010, p3
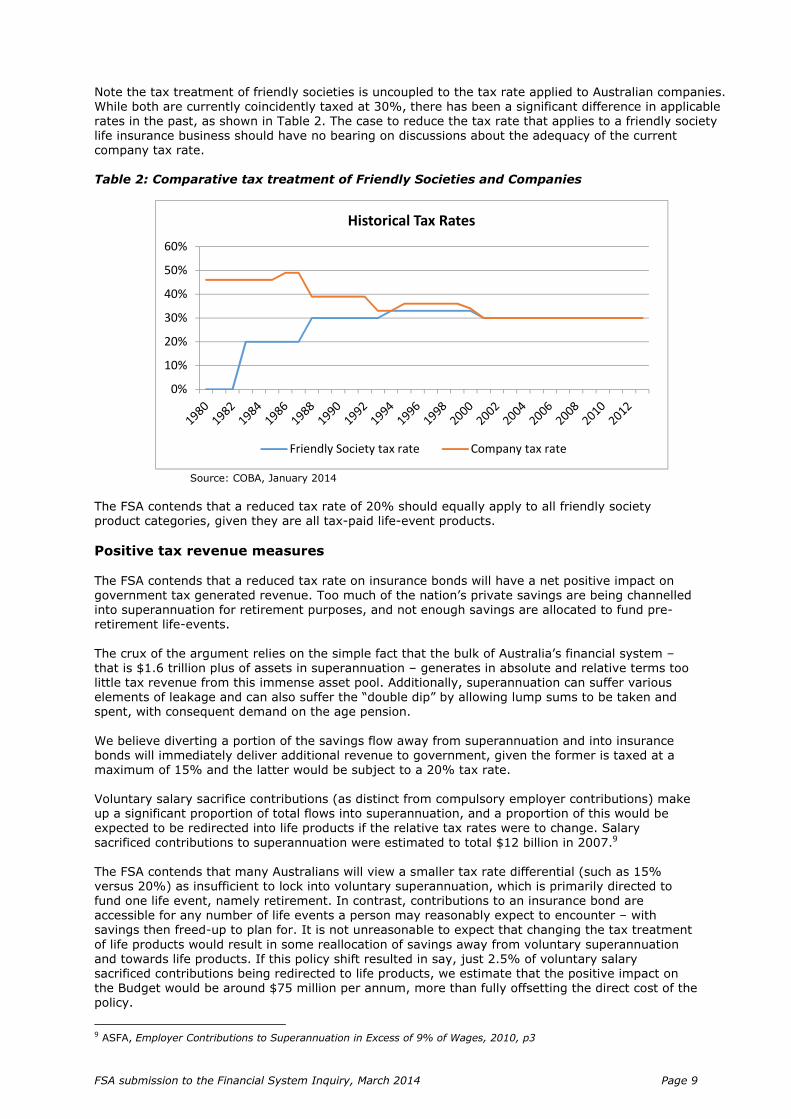
0%
10%
20%
30%
40%
50%
60%
Historical Tax Rates
Friendly Society tax rate Company tax rate

FSA submission to the Financial System Inquiry, March 2014 Page 10
We estimate that this policy change would result in the following savings to the Budget bottom line over the forward estimates: Table 3 – Budget impact of reducing tax rate to 20% from 1 July 2014
2013-14 ($m)
2014-15 ($m)
2015-16 ($m)
2016-17 ($m)
2017-18 ($m)
Direct cost 0 -64.1 -66.7 -69.3 -72.1
Offsetting saving 0 75.2 80.2 83.4 86.7
Net saving 0 11.1 13.5 14.1 14.6
Generation of new tax revenues
FSA contends that a lower tax rate should generate new tax revenues from new insurance bonds made for intergenerational purposes, such as grandparents establishing insurance bonds for grandchildren. These investments might otherwise be lost from the government’s tax revenue by estate distribution and spending, or become subject to reduced tax arrangements offered by testamentary and discretionary trusts, for example. Further, for individuals on higher MTRs, using tax-paid insurance bonds will deliver a markedly
improved outcome for government revenue, as opposed to use of tax minimisation strategies such as negative gearing, funds shifted offshore, or possibly tax avoidance. While more applicable to high income earners, insurance bonds taxed at 20% will, we believe, encourage retired people to use these products to re-invest a portion of their superannuation income streams, such as pensions and annuities, which cannot be re-contributed to
superannuation. Without such an incentive, savings from superannuation income could be held in other tax structures, reducing government revenue. The medium-term savings vehicle that insurance bonds offer is not irrelevant to this age group. Those who are currently 65 have an average life expectancy of 84 for men and 87 for women10, giving them the “time” to take advantage of a ten year investment horizon.
In addition, increasing the uptake of insurance bonds will grow Australia’s savings pool by capturing funds that cannot be held in superannuation, and may be at risk of not being directed into a structured savings platform. Superannuation also lacks universal coverage across the whole community. This includes no, or limited, coverage for non-working surviving spouse monies, superannuation age limit and work-
test related contribution restrictions, and expatriates returning to Australia facing superannuation contribution limits. The FSA considers insurance bonds taxed at 20% represent the next best tax arrangement to non-concessional superannuation contributions. Increasing the up-take of insurance bonds will generate a higher rate of return to government, when compared to superannuation tax arrangements.
Given the longstanding and effective nature of tax collection through friendly society investment products, introducing incentives to divert an appropriate portion of savings away from superannuation and into these products is justified given the improved tax revenue outcome for government. Due to the rapidly ageing population, people are increasingly downsizing the family home as part of
the transition to a retirement village, or aged care accommodation. In light of the capital gains tax free status of the family home, introducing incentives to use friendly society insurance bonds to save this growing source of funds is, in the FSA’s opinion, an entirely reasonable proposition. As covered earlier in our submission, this policy change would be expected to reduce pressures on government expenditure by increasing incentives for individuals to be better prepared to fund their own life-events, especially the cost of education, home
ownership, health and aged care and periods of unemployment, through increased personal savings. Reducing reliance on government services and safety nets is
10 ABS 4125.0, Gender Indicators - Australia

FSA submission to the Financial System Inquiry, March 2014 Page 11
consistent with the themes expressed in the Treasurer’s speech, The End of the Age of Entitlement.11
Industry support for a reduction of insurance bonds tax rate
The call to reduce the tax rate that applied to insurance bonds from 30% to 20% had the support of the entire life insurance sector. In its October 2008 submission to the Henry Tax Review, the Investment and Financial Services Association (IFSA) recommended “the introduction of a 20% concessional tax rate for life insurance companies in respect of their ordinary life insurance savings policies.”12 Consistent with the FSA’s position, IFSA noted that “such a tax concession would encourage
medium to long-term savings but not detract from the additional tax concession of long-term superannuation savings, which is taxed at 15%.”13
RECOMMENDATION 2 - To achieve increased educational outcomes, the FSA recommends
the introduction of a Government co-contribution scheme for friendly society education plans.
The FSA sees a strong case for a government co-contribution scheme that stimulates education saving within the community. Despite active marketing of scholarship plans by the friendly society industry, this form of savings remains low. By illustration, in 2010-11, Australians personally spent around $36 billion on education14
but only a fraction of that ($270 million15
or 0.8%) was met through structured education savings plans.
The objective of this proposal is to focus public attention on the benefits of education savings and provide an incentive that increases household savings activity. The scheme would be available to all households that make contributions to a scholarship plan16
issued by a friendly society and would adopt the basic characteristics of a contribution amount, a cap and eligibility rules.
Increasing education participation rates A much larger pool of savings for education funding could emerge within a relatively short period of time. This will help address lower education participation rates, particularly among low and middle income households, and widen the range of education pathways available to young adults when
their plans mature. Several international studies support the positive effects of financial resources for improved education participation.171819 A scholarship plan owner (usually a parent, grandparent or another sponsor) could participate in the scheme on a child-by-child basis over a fixed, five year period that commences within the first two years after the birth of a child, with government matching, dollar-for-dollar annual
contributions up to a maximum of $500 per year.
Target post-secondary education The scheme should specifically target post-secondary education be that tertiary study, TAFE or other forms of skills and vocational training. This can be achieved by preserving the co-contribution
made by government (both the capital and income component) until the time the student beneficiary reaches a minimum school leaving age of 17.
11 http://www.joehockey.com/media-files/speeches/ContentPieces/100/download.pdf 12 IFSA Submission, Henry Tax Review, page 20 13 Ibid. 14 ABS 15 Total earnings paid to scholarship plan beneficiaries, 2010 16 As defined under the Income Tax Assessment Act 1997 subsection 995-1(1) 17 “Determinants of Undergraduate Student Drop Out Rates in a University Business Studies Department”, Roger Bennett, Journal of Further and Higher Education, Volume 27, Issue 2, 2003 18 “Come and stay a while: does financial aid effect retention conditioned on enrollment at a large public university?”, Larry D Singell Jr., Economics of Education Review, Volume 23, Issue 5, October 2004, Pages 459–471 19 “Simulating the Longitudinal Effects of Changes in Financial Aid on Student Departure from College”, Stephen L. DesJardins, Dennis A. Ahlburg and Brian P. McCall, The Journal of Human Resources, Vol. 37, No. 3 (Summer, 2002), pp. 653-679

FSA submission to the Financial System Inquiry, March 2014 Page 12
We believe that by increasing the uptake of scholarship plans, more Australians will be motivated and encouraged, and have the financial means, to achieve further educational outcomes. Primary and secondary education is accessed through the public education system, and therefore less of a “barrier to entry” or needing more encouragement and support, unlike post-secondary education options. The FSA believes that the benefits of such a scheme is likely to be more
pronounced for lower socio-economic groups, given that means to pursue higher education are expected to be more limited. The focus on post-secondary education will also assist a long term–planning horizon for improving national educational outcomes.
Scheme integrity
There should be no restrictions on withdrawing personal contributions made by the plan owner at an earlier time. Scholarship plans are designed to fund education expenses across all levels of schooling and this flexibility must be maintained. However, creating a ‘lock-in’ period of a proportion of these savings, over a child’s entire schooling life, will allow sufficient time for the amount of the co-contribution to generate a sufficient amount of earnings.
The integrity of the scheme would be maintained via the existing ATO-defined ‘sole purpose test’ for friendly society scholarship plans, which removes the existing concessional tax treatment on earnings if they are not used for legitimate education expenditure.20
There are other considerations that would need to be discussed with industry as part of a
consultation process, such as entry and exit rules (particularly around any unused contribution amounts), timing and eligibility. The FSA reiterates that the existing tax regime specifically established for scholarship plans back in 2003 is well-placed to address any major tax integrity concerns and facilitate a relatively easy design and implementation phase of the scheme.
Incentives to introduce a scheme There are several compelling reasons to introduce incentive-based measures that encourage education savings. A family that builds a sustainable pool of education funds can increase their financial adequacy and in turn:
• provide a family member with a higher level of education, such as a tertiary degree, that may otherwise have been unaffordable;
• unlock new education pathways, such as TAFE study or vocational education and training; • increase a family member’s level of education support, such as tutoring and coaching or exam
preparation;
• relieve financial pressure by using savings to cover ancillary education costs (such as uniforms, travel, computers or textbooks) or smoothing the impact of education costs over time; and
• encourage families to diligently plan and budget for the education funding of their children.
These are significant benefits at an individual level, with flow on collective benefits for Australian
society. A large pool of national education savings could potentially:
• boost Australia’s long-term education capacity; • increase workplace productivity and participation rates; • up-skill Australia’s workforce; and
• expand employment opportunities and subsequent earnings capacity.
“A well-educated and well-trained population is essential for the social and economic well-being of countries and individuals. Education plays a key role in providing individuals with the knowledge, skill and competencies needed to participate effectively in society and in the economy. Education also contributes to an expansion of scientific and cultural knowledge. The level of educational attainment of the population is a commonly used proxy for the stock of “human capital”, that is,
the skills available in the population and labour force”21.
20 Under tax law, if the earnings under these plans are not used for legitimate education expenses, then the 30% tax paid at a fund level applies to these earnings and is assessed in the hands of the parent investor, not the child. Where the investor is on a higher tax bracket than 30%, further tax is payable. 21 Education at a Glance 2007 – Organisation for Economic Co-operation and Development (OECD) Indicators

FSA submission to the Financial System Inquiry, March 2014 Page 13
According to the OECD, education expenditure in Australia, as a percentage of GDP, is below the OECD member country average, with countries like Mexico, Israel, Iceland, Denmark, New Zealand and Chile investing a greater proportion of their national wealth into education22. The FSA believes that a greater private pool of savings can help improve our international competitiveness while mitigating the need for this to be funded entirely by Government revenues. Indeed, the OECD has stated that “establishing innovative financing and student support policies that mobilise additional
public and private funding in ways that better reflect the social and private benefits of tertiary education will certainly be part of the answer”23. Table 4 – International comparison of expenditure on educational institutions
The FSA believes that education participation rates are a function of access and opportunity, which is driven by individual affordability, means and motivation that comes from having committed a personal financial outlay to support their goals. A national program of education savings could mitigate, or even overcome affordability problems and make a wide range of education pathways available to more people, regardless of
their socio-economic backgrounds and beyond what government welfare support can currently sustain.
Size of challenge Illustrating the size of this challenge, 2011 ABS Census data reveals that half the Australian
population had not yet achieved education qualifications beyond high school and 17% held a bachelor qualification. Currently, the friendly society industry manages over $1.6 billion in education savings on behalf of 190,000 students up to tertiary age. Depending on the level of schooling, students can have, on average, $9,000-$14,000 in funds to put towards their education.
22 Education at a Glance 2013 – OECD Indicators 23 Education at a Glance 2007 – OECD Indicators

FSA submission to the Financial System Inquiry, March 2014 Page 14
These are healthy numbers in real terms however when viewed against the wider population, the current pool of funds equates to around $230 for every child and young adult in Australia between the age of 0-24 years, providing an insight into how small Australia’s education savings rate is in relative terms. In the latest AMP.NATSEM Income and Wealth Report: Smarter Australians, which explores
education and innovation in Australia, education was found to be among the top 15 expenditure items for Australian families and in the last six years, average family spending on preschool and primary school education had risen by 79% and spending on secondary education increased even more at 101%. The same report showed that the ratio of government to private expenditure on education had increased substantially between 1984 and 2011. In 1991, Australians spent the same amount on
their education as government; now, government expenditure is 65% higher than private expenditure (2011) and rising each year. If incentive-based reforms are successful in encouraging a higher rate of private discretionary savings to fund education expenses, it is reasonable to expect a commensurate easing in household financial pressure and a gradual fall in reliance on government support for education.
Success of other Government co-contribution schemes Government co-contribution schemes are driven by these principles and have been used as a ‘stimulus’ in a number of areas of national concern, including health, retirement and housing, however one is yet to be considered for education.
The success of the superannuation co-contribution scheme indicates that Australians may respond to a similar scheme for education. Over the three years from 2008-2011, 1.35 million Australians on low to middle incomes utilised the super co-contribution scheme, a significant reaction given the long-term nature of retirement savings. Education savings are medium-term, discretionary savings vehicles. This means that people using
these vehicles realise the benefits of their investment earlier than superannuation, have active control over their savings and therefore have a greater level of personal involvement. The FSA believes this will have a significant influence on the success of an education co-contribution scheme, perhaps even greater than that seen with superannuation (in relative terms).
RECOMMENDATION 3 – To remove the unintended negative tax impact on education
plans, the FSA recommends the immediate restoration of an appropriate tax-free threshold on taxable education benefits paid to minors under friendly society education plans.
The lack of any meaningful tax-free threshold and the high rate of tax on income earned by minors from scholarship plans is an unintended consequence that stemmed from the removal of the low
income tax offset (LITO) from non-work income earned by minors in 2011. While the original policy behind this measure was sound (it would prevent high income earners from accessing the tax offset via the transfer of income to a child), it triggered a major jump in a minor’s tax rate on any income24
they withdrew from a scholarship plan.
Unintended consequences of government reforms On 1 July 2011, the tax rate increased from 0% to 66% for earnings between $416 and $1,307, and from 0% to 45% on all earnings once total income went above that. This has a significant impact on students who are taxed on benefits received from a friendly society scholarship plan. At the time of the change, nearly 60,000 Australian children under the age of 18 had in place a family-sponsored scholarship plan accumulating education savings on their behalf.
These plans were established by families on the understanding that the government’s concessional tax treatment would remain, only to later find that the final earnings payment would be much lower should they decide to withdraw.
24 Where assessable in the hands of a student who is a minor (under Division 6AA rules) and not in the hands of a sponsoring adult - Tax Laws Amendments (2011 Measures No $) Bill 2011, Explanatory Memorandum, ch2.

FSA submission to the Financial System Inquiry, March 2014 Page 15
Impact of future scholarship plans Industry evidence between 1 July 2011 and 30 June 2012 points to a concerning combination of a spike in plan closures and substantially slower product take up. One fund with around 6,500 members saw 600 investors withdraw completely in the first 12 months after the changes, and
experienced a drop of 33% in new members over the same period, well outside normal behaviour patterns. This is further strong evidence that Australians are responsive to tax changes, whether they provide an incentive, or as was the case in 2011, a disincentive. There are only two friendly societies that offer scholarship plans in Australia. A third had commenced offering such plans three months prior to the changes but has since closed this product line.
The FSA believes that the future of scholarship plans in the under 18 year old market is under a cloud, and the specific tax benefits introduced by government years ago have all but been inadvertently reversed. This is a very unfortunate outcome for thousands of Australian families. Scholarship plans are unique – they are the only dedicated education savings vehicle in the market today, and by law25,
can only be offered by a friendly society. Their tax integrity is upheld through a sole purpose test that removes any taxation concessions if earnings are not used for their intended education purposes.
Negligible budget impact With the LITO all but removed, government should announce a new tax-free threshold for these vehicles as a priority, set at $3,333 (the same as originally applied) and indexed annually in line with the CPI for education. We believe the cost to the budget revenue from this change would be negligible. The flow-on adverse impact on scholarship plan earnings of the LITO changes was an unintended consequence
to reforms to other areas of the taxation framework. The FSA believes that it is unlikely that the small revenue gain from an increased tax rate applicable to these plans was counted by the government at the time the changes were implemented. Therefore, the FSA believes there are no further revenue implications under this proposal.
25 Section 995.1 of the Income Tax Assessment Act 1997 defines a scholarship plan as a life insurance policy issued by a friendly society for the sole purpose of providing benefits to help in the education of nominated beneficiaries.
FSA submission to the Financial System Inquiry, March 2014 Page 16
PHILOSOPHIES, PRINCIPLES AND OBJECTIVES Terms of reference 2 The Inquiry will refresh the philosophy, principles and objectives underpinning the development of
a well-functioning financial system, including: 5. the role, objectives, funding and performance of financial regulators…
“Twin peaks” regulatory model
The FSA believes the current “twin peaks” model provides an effective framework for regulating the financial system in Australia, and should be maintained into the foreseeable future. We consider a major strength of Australia’s regulatory system is the ability of APRA and ASIC to independently perform their prudential, and corporate, markets and financial services regulation, respectively.
Effectiveness of regulation Friendly societies operate in a highly regulated environment. However, the small relatively size of the friendly society sector when compared to the larger mainstream life insurance companies who, as at December 2013, had total assets of almost $274 billion26, means that our sector bears a higher cost from regulation in relative terms. At the same time, our sector represents the lower financial system risk.
Because of these factors, it is particularly important that Government and regulators give appropriate consideration to the impact of regulatory change on this sector. The FSA contends that effective regulation will promote a competitive and stable financial system that contributes to Australia's productivity growth, and will benefit consumers by maintaining choice and reducing pressure on costs.
Policy Options - Effectiveness of regulation To achieve these outcomes, we believe a principles-based approach should be taken in the future development of financial services regulation, which:
• recognises the differences in size and scale of regulated institutions; • coordinates regulations across regulators and ensures alignment between regulations; • ensures appropriate transition processes for the implementation of new regulation; • increases consumers’ understanding of the rationale and benefits of regulatory requirements.
The performance of the regulators In looking at the burden imposed by regulations, the Productivity Commission found that, “regulator culture is crucial,” and that how businesses experience regulation “has as much to do with the engagement approaches of regulators as it does with the regulations.”27 The fundamental issue is how tight controls should be in promoting consistency and accountability
versus how much discretion should be granted in promoting flexibility and innovation. Fixed (inflexible) rules reduce decision uncertainty for regulated entities and compliance uncertainty for regulators but do not necessarily lead to optimal outcomes in dynamic environments. APRA most recent stakeholder survey found that this was an area of relative weakness in APRA’s performance, with a higher than average number of respondents disagreeing with the statement that “APRA meets its stated approach of being consistent in its supervision.” Similarly, an ASIC
stakeholder survey from 2013 found that one of the regulator’s weakest areas was “clearly communicating what ASIC is doing.” 28
Policy Options - The performance of the regulators
One way to positively influence the performance and approach of the regulators would be to monitor and report on customer performance benchmarks. Currently, regulator surveys of their stakeholders go some way towards achieving this outcome.
26 APRA Statistics, Quarterly Life Insurance Performance, December 2013 27 Productivity Commission, Regulator Engagement with Small Business, September 2013, p. 2. 28 ASIC, Stakeholder Survey 2013, September 2013.

FSA submission to the Financial System Inquiry, March 2014 Page 17
These surveys could be strengthened by collecting stakeholder data on the timeliness, costs, commercial impacts, regulator consistency and stakeholder satisfaction around their dealings with regulators.
Monitoring performance against benchmarks and linking executive key performance indicators to these benchmarks could be one way to encourage better outcomes. Consideration should be given about the merits of establishing an independent body to construct, measure and report on regulator performance, particularly in relation to industry participant experience.
Another way of improving confidence in the regulator’s approach would be to improve transparency and consistency around decision making and the application of prudential standards and regulatory guidance.
Red tape The Government has committed to “cut $1 billion a year in red and green tape”29, and has announced a range of initiatives to support this overall goal, including:
• creating a dedicated unit within each department and agency that is charged with driving red tape reduction;
• linking the remuneration of senior public servants to quantified and proven reductions in red tape;
• including annual red tape reduction targets in the performance criteria to be considered in determining the re-appointment of departmental secretaries;
• requiring all Cabinet submission to include a Regulatory Impact Statement and ensuring they quantify the costs to business and/or the community of new regulations; and
• annual reporting to Parliament on red and green tape reduction.
The Business Council of Australia has emphasised the need for reform of the regulators, noting that “delivering on the Government’s commitment will also require greater pressure to be applied on regulators to ensure that they balance effective enforcement with greater efficiency to reduce the cost and burden on regulated parties,” and that “while our key regulators must be independent, they must also operate in an environment with incentives to better understand business and minimise regulatory burdens.”30
This is an area where regulators can improve their performance – one of the four key weaknesses identified in ASIC’s 2013 stakeholder survey was the regulator’s ineffectiveness in “reducing the red tape associated with compliance.”31 Similarly, of the 45 questions asked in APRA’s 2013 stakeholder survey, stakeholders found APRA’s performance weakest when it came to ensuring that “changes to APRA’s prudential framework consider the costs of regulation imposed on industry.”32
Policy Options – Red Tape
Unless regulators are given the resources and incentives to delivery red tape reductions, improvements are unlikely to be made. In this regard, commitments the Government has made in relation to departmental performance could also be applied to individual regulatory agencies.
Regular reporting of red tape reductions could help demonstrate to industry that the Government is making progress in reducing compliance burdens. Regulators could be required to quantify the costs to industry of all new regulations and regulatory reductions, and publish this information on a regular basis. In addition to seeking to remove unnecessary regulations, the regulatory burden on business can
be reduced by improving the quality of regulations that are retained. Moving towards more principles based “outcome-focused” regulations and harmonising regulatory obligations can help to reduce the “red tape” aspects of existing regulations. Ultimately the impact of ineffective regulation is felt in the regulated enterprises. An independent body could be given responsibility to make recommendations to Government where there is clear
‘wastage’ in the regulatory system, where costly undertakings produce little regulatory benefit.
29 Media Release, The Coalition’s policy to boost productivity and reduce regulation. 30 Business Council of Australia, Improving Regulation Requires Sharper Focus on Regulators, 22 November 2013. 31 ASIC, Stakeholder Survey 2013, September 2013. 32 APRA, APRA Stakeholder Survey – 2013, Report of overall findings, July 2013, p. 2.

FSA submission to the Financial System Inquiry, March 2014 Page 18
Regulatory impact statements Regulatory impact statements (RISs) are an integral part of the regulatory development process and should provide stakeholders with an important opportunity to provide feedback before new regulations are finalised.
According to its annual reports, APRA currently complies with the Government’s policy on best practice regulation. APRA also notes that it fully meets the requirements of the Office of Best Practice Regulation for RISs on new legislative instruments. However, it may be beneficial for APRA to give greater focus to the RIS development process. For example, APRA does not consult with industry on the RIS content, which means that stakeholders
do not have an opportunity to comment on the costing assumptions being used by APRA. While APRA publishes RISs, it does not publish preliminary assessments. Where a regulatory change is more minor, a preliminary assessment is often completed in place of a RIS. Publishing these documents could improve transparency.
Policy Options – Regulatory impact statements
The FSA believes that RISs provide valuable insight into the regulator’s thinking about a proposed regulatory reform. There may be value in consulting with industry or allowing industry to view the draft RIS to gain insight into the regulator’s approach changes to regulations.
Overly prescriptive regulation APRA has stated that its supervisory approach “allows institutions to use a variety of approaches to comply with high-level principles, rather than APRA seeking to direct an institution through detailed prescription.”33 However, APRA’s stakeholder surveys would suggest that the regulator could improve its performance in this area. In the latest survey, levels of stakeholder agreement were relatively low
when it came to the following two statements:
• “APRA's prudential standards are based on principles rather than detailed prescription“; and
• “During supervisory visits to your organisation, APRA supervisors focus on principles rather
than detailed prescription.”
“Outcome–focused” regulation is generally accepted to be more effective than prescriptive regulation as it allows regulated institutions to achieve the desired policy outcome in the most cost effective way. For smaller and less complex financial institutions, such as friendly societies, prescriptive standards can be very costly, and a simpler solution can often be found which is capable of delivering a similarly robust outcome. While APRA has acknowledged the value of flexibility in applying the prudential standards, it appears that more could be done to provide flexibility in practice, and clear and transparent accountability on APRA to adhere to the principles-
based approach.
Policy Options – Overly prescriptive regulation
Consideration should be given to the merits of ensuring each prudential standard explicitly provides APRA with the power to approve exceptions to regulatory obligations for individual regulated entities where the associated risk cannot justify the relative regulatory burden.
Coordination of regulation across government The regulatory and supervisory powers of APRA and ASIC are well understood by regulated entities. These powers are based on enabling legislation and extensive prudential standards and regulatory guidance issued by the regulators. Regulated entities construct business operations and
strategies to comply with these frameworks. However, the implementation of other government programs can have direct and unintended consequences on business operations of regulated entities. For example, the Department of Immigration and Border Protection (DIBP) implemented the Significant Investor Visa (SIV) Program on 24 November 2012.
33 APRA, Corporate Brochure – Protecting Australia’s depositors, insurance policyholders and superannuation fund members.

FSA submission to the Financial System Inquiry, March 2014 Page 19
The program aims to provide a new visa pathway for migrant investors coming to Australia, and requires a $5 million investment by the visa holder in a range of complying investments, including ASIC regulated managed funds with a mandate for investing in Australia. The FSA contends that insurance bonds issued by friendly societies are not only within the spirit of the Government’s intention for complying investments, but have other qualities that enhance their
suitability with respect to the SIV program. In this respect, friendly society insurance bonds are: • regulated by ASIC and APRA; • managed by Australian Financial Services Licensees that have a mandate to manage funds in
Australia; • subject to the same product disclosure regime under the Corporations Act 2001 that applies to
managed fund investments; and • compliant with SIV program investment requirements of at least $5 million for a minimum
period of four years.
Because the DIBP did not consult with friendly societies prior to commencing the SIV program, societies are excluded from the program because of a misalignment of the requirements of the
Corporations Act 2001 and the definition of a managed fund within the Migration Amendment Regulation 2012. This policy oversight has resulted in friendly societies having to turn away prospective investors, representing a loss of tens of millions of dollars of investment in the sector. While the department has indicated its commitment to rectify this oversight, friendly societies continue to be excluded from competing in the SIV market, some 16 months after the program commenced. In its current form, there is a clear lack of competitive neutrality in the SIV program
that continues to penalise friendly societies for no sound policy rationale. Enabling friendly society investments to participate in the program will ensure a level playing field in relation to other providers of complying investments.
Policy Options - Coordination of regulation across government
Consideration should be given to implementing a whole of government process, coordinated by the Office of Best Practice Regulation, to ensure alignment between regulations and government programs, particularly for agencies that have no direct responsibilities with financial service providers.
Timely implementation of reforms
Regulators often provide financial institutions with very little time to implement changes to the regulatory framework, which creates confusion and imposes additional and unnecessary costs. Forcing entities to make last minute changes to meet unrealistic implementation deadlines will inevitably impose higher costs than if implementation was managed in a more orderly fashion. Rushing implementation also makes it more difficult for organisations to properly understand the new regulatory obligations before they take effect, and staff training can be compromised as a result.
The cost of implementation of legislation is significant. Changes to business systems, processes and staff roles cannot be made quickly or easily, and collectively come at a high cost. In addition, the impact on ‘business as usual’ capabilities is significantly impacted due to the time and effort required to manage reforms projects to ensure timely compliance. Changes to legislation usually requires amendment to member facing documentation which then needs to be re-printed and old versions destroyed.
It is not uncommon for regulators to impose new regulations on the sector with extremely short lead times. For example, the final FoFA regulations were released on Friday 28 June 2013, with the regulations taking effect from the following Monday. The FATCA legislation with the Inter-Governmental Agreement between the US and Australia is yet to be published and Australian legislation is yet to be written, however the requirement to comply with the FATCA legislation
commences 1 July 2014.
Policy Options - Timely implementation of reforms To allow regulated entities to undertake the orderly implementation of legislative and regulatory
reforms, consideration should be given to requiring regulators to provide a minimum 12 month transitional period between the release of final reforms and their commencement date.

FSA submission to the Financial System Inquiry, March 2014 Page 20
Parliamentary oversight of APRA ASIC and RBA regularly appear before Parliamentary Committees which are able to question their performance.
ASIC appears before the Parliamentary Joint Committee on Corporations and Financial Services, an arrangement which is formalised in ASIC’s enabling legislation. The RBA appears twice a year before the House of Representatives Standing Committee on Economics. This arrangement is set out in RBA’s Statement on the Conduct of Monetary Policy. No similar arrangement exists in relation to APRA, despite the House of Representatives Economics Committee noting in 1997 that:
“The relationship between the RBA and the APRA will be critical for effective and efficient regulation of the financial services industry. The Committee believes that continued parliamentary scrutiny of both monetary policy and prudential supervision will assist in ensuring the success of the new arrangements. As this Committee has been providing that oversight of prudential supervision and monetary policy over the last five years, the Committee considers it desirable to put in place a similar arrangement for the APRA to that
established under the Treasurer's Statement on the Conduct of Monetary Policy. If the Parliament is to be satisfied that the Bank and the APRA are working together effectively, it is essential that both bodies appear before this Committee on a regular basis.”
and recommending:
"That the Australian Prudential Regulatory Authority be required to appear before the House of Representatives Standing Committee on Financial Institutions and Public Administration at a public hearing once a year to report on prudential supervision of the financial services industry."
Policy Options - Parliamentary oversight of APRA
Requiring APRA to regularly appear before the House of Representatives Standing Committee on Financial Institutions and Public Administration would improve the organisation’s transparency and help provide the Parliament with assurance that APRA is performing its role effectively. It would also be consistent with the approach taken with ASIC and the RBA.
Controlling the growth of APRA levies
Currently, APRA is entirely funded through levies collected from the institutions it regulates. At the same time, the Government is responsible for approving increases in APRA’s budget each year. Under this arrangement, the Government has very little incentive to ensure that the costs of prudential regulation are efficient and that over-regulation does not occur, given that increases in APRA’s costs have no impact on the government’s budget.
The rapid growth in APRA’s budget since its establishment would suggest that government focus on APRA’s costs has been limited. After rapidly scaling up staffing levels in the years following its establishment, APRA reached its target staffing level in 2005-06, and APRA’s budget could have been expected to remain relatively stable from this point onwards. Instead, APRA’s costs have increased from $92.1 million in 2005-0634 to an estimated $130.4 million in 2013-14,35 representing an average annual increase of five per cent and growing at twice the rate of inflation.
Given industry pays the levy, it has a strong incentive to ensure that the costs of the regulator are efficient. Indeed, the original explanatory memorandum to the levies Bills from 199836 notes that one of the advantages of imposing levies is that: “this method of funding may also tend to encourage the institutions paying the levy to act as a constraint on empire building or other excessive cost increases on the part of the regulator.” However, it is impossible for industry to exert any influence over APRA’s overall funding level given
that this is approved by Government and is not open to industry consultation.
34 APRA, 2006 Annual Report, p. 80. 35 Treasury & APRA, Financial Industry Levies for 2013-14, p. 5. 36 Explanatory Memorandum, Financial Sector Levy Bills 1998

FSA submission to the Financial System Inquiry, March 2014 Page 21
While under-regulation is in no one’s interest, it is equally important that a mechanism exists which reduces the incentive for the sector to be over-regulated. As noted in the Government’s Cost Recovery Guidelines “while cost recovery can promote efficiency by instilling cost consciousness in the agency and its customers, poorly designed arrangements can create incentives for ‘cost padding’ and inefficiency.”37
The current situation creates a triple effect on costs to industry:
• APRA levies on regulated entities are increasing faster than CPI; • permanent stepped-up compliance costs on entities; and • temporary diversion of organisational resources from productive activities in order to meet
unreasonable timeframes.
Policy Options - Controlling the growth of APRA levies One way to better align incentives could be for growth in industry funding of APRA to be capped at
a certain level (for example CPI), with all increases above this to be met by the Government or through cost containment in APRA. Such an approach would ensure that the party responsible for approving APRA’s budget also had an incentive to control their costs.
37 Dept. of Finance and Administration, Australian Government Cost Recovery Guidelines, July 2005, p. 47.

FSA submission to the Financial System Inquiry, March 2014 Page 22
CONCLUSION This submission presents targeted, fiscally-responsible recommendations that, if adopted, will improve the financial and social wellbeing of Australians.
These recommendations will also reduce the financial burden on government to provide a range of services into the future. This is particularly significant in the context of Australia’s changing demographics, and given the fact that Australians are living longer, and the ageing population is rapidly growing. The FSA believes government should recognise the benefits that an increase in medium to longer-
term savings could deliver to our society, and implement reforms that will encourage people to utilise specific mechanisms best-suited to the task. We believe the insurance bond tax framework is the best mechanism for this purpose, and can deliver significant benefits across a number of levels.
Financially, insurance bonds can:
• help increase overall national savings by encouraging a savings culture, mindful of the fact that there are several life-events to fund, and not just retirement alone;
• boost private household wealth through a reduction in debt reliance and the smoothing expenditure on key life-events over time; and
• increase financial literacy levels across a wide age group due to the planned, intergenerational, discretionary nature of the product.
Socially, insurance bonds and education plans can:
• increase the employment opportunities available to Australians by facilitating access to a higher
standard of education; and
• reduce reliance on government and social welfare by encouraging personal responsibility.
In terms of tax revenue generation, insurance bonds can:
• increase government tax revenue by diverting some discretionary savings away from
superannuation (including zero taxed income streams) to a greater tax rate of 20% in a high
integrity tax-paid framework;
• attract new savings at the 20% tax-paid rate, especially on intergeneration transfers;
• improve government revenue drain by reducing the level of government funded welfare
reliance as a result of more Australians by self-provisioning using friendly society life-event
products.
The FSA contends that its recommendations will address medium to longer term budget risks, and adequately respond to the need for incentives to encourage people to save for life-events that superannuation savings cannot, or should not, fund. In addition, the range of policy options outlined in this submission will, we believe, improve the
framework under which friendly societies are regulated, particularly in relation to the:
• effectiveness of regulation;
• performance of the regulators;
• reduction of red tape;
• principles-based regulation;
• coordination of regulation across government;
• timely implementation of reforms;
• parliamentary oversight of APRA; and
• control the growth of APRA levies.
To discuss any aspect of this submission please contact: Jim Aliferis
Senior Adviser, Policy & Public Affairs 02 8035 8442; [email protected]
Friendly Societies of Australia Incorporated
ARBN 067 828 513 Level 11, 35 Clarence Street, Sydney NSW 2000 GPO Box 4686, Sydney NSW 2001

FSA submission to the Financial System Inquiry, March 2014 Page 23
APPENDIX 1
Overview of friendly society savings and insurance products Insurance bonds are also known as investment bonds. They are relatively simple multi-purpose life-event savings vehicles that are used to prepare and lock-in self-funding for a wide range of life-events including: home deposits and ownership, raising and educating children, sinking funds to
pay debt, health and aged-care contingencies, job loss provisions, private child care funding, and support for aged parents or family members with disabilities. Insurance bonds operate under a ‘tax-paid’ framework, in that earnings within each benefit fund (whether capital or income) are internally taxed at the rate of 30%. They are growth accumulation investments. They do not distribute assessable income each year -
all gains, (both income and capital) are automatically reinvested in each of the bond’s benefit fund portfolios. This means the pool of investable funds is bigger, (due to the personal tax savings) and investment compounding benefits are amplified in each portfolio’s “tax-paid” investment environment. The modern insurance bond is typically structured to give investors access to a menu of investment
options, often using underlying managed funds. In comparison to older style single option “capital guaranteed” insurance bonds, this radically changes the bond’s performance capabilities. Modern insurance bonds generally offer a menu of fund investment options that are usually unit linked. It is generally left to investors to construct their bond’s own portfolio mix across the options available on the bond’s menu. These typically offer varying risk exposure across most investment asset classes.
Insurance bonds are designed for medium to longer-term savings, with a tax incentive to hold a bond for at least 10 years, because the earnings component of withdrawals after that period is tax-free to the investor, although continuing to be tax-paid at fund level. Any investment growth generated by a bond and accessed in withdrawals prior to the 10 year point is personally tax assessable to the recipient at his or her marginal tax rate (MTR) - and a 30%
personal tax offset is available within that period. Distributions to insurance bond owners, their nominated beneficiaries, or via their estates at an insurance bond’s maturity due to death of the nominated life insured are personally tax-free distributions at any time – pre or post 10 years.
A 125% further contribution rule allows for ongoing contributions into the fund over the life of the bond. Whilst this is designed to encourage ongoing savings, it also operates as a tax integrity measure. For many investors, especially but not limited to, older Australians, insurance bonds have a ‘set-and forget’ appeal – with tax payments and reporting (of on-going bond earnings growth) taken care of by the friendly society.
Funeral bonds, also known as funeral policies, are special-purpose products designed to accumulate funds to cover the cost of a funeral. Funeral bonds are sometimes assigned to a Funeral Director as part of a fixed price funeral plan. Funeral bonds are also tax-paid and generally provide capital guaranteed benefits, but with limits on contribution amounts under the sole purpose test for tax purposes, and under prescribed
annually-indexed thresholds for social security means test purposes, with the amount of the bond only accessible and paid on death of the life insured to fund a funeral. Unlike insurance bonds, they operate under a ‘tax debt model’ whereby on-going earnings are taxed at fund level, and the earnings component of the funeral benefit, when paid out, is provided a deduction, which effectively increases the value of the benefits paid, by the tax benefit value of
the claimable deduction. The earnings component of benefits received by an entitled recipient, typically the trustee of an estate, is assessable.

FSA submission to the Financial System Inquiry, March 2014 Page 24
Where benefits are paid to a Funeral Director instead, via assignment or nomination, tax is payable as a business receipt. Transitional tax rules apply in the case of funeral bonds issued prior to 1 January 2003.
Scholarship plans, also known as education savings plans, are special purpose products. Plans operate subject to a sole purpose tax test, and contributions are made to help fund the education expenses of nominated students. Unlike insurance bonds, but like funeral bonds, they operate under a ‘tax debt model’ whereby on-
going earnings are taxed at fund level, and the earnings component of benefits paid out is provided as a deduction, which effectively increases the value of the education benefits paid, by the tax benefit value of the claimable deduction. The earnings component of benefits received by an entitled recipient, typically the student, is assessable. Transitional tax rules apply in the case of scholarship plans issued prior to 1 January 2003.
Scholarship plans have a tax treatment more equitable for people on lower incomes and are more popular among this demographic. A 2008 study undertaken by the largest issuer of scholarship plans in Australia, the Australian Scholarships Group, showed that:
• only 2.3% of new contributors had a household income of over $100,000; and • 68.7% of new contributors had a household income between $52,500 and $78,800.

An independent report prepared for Abacus by the Australian Centre for Financial Studies. Principal authors are Professor Kevin Davis (Research Director) and Mr Martin Jenkinson (Research Officer).
Changing the Tax Treatment of Life
Event Products:
Costing the Effects 26th October, 2012

Changing the Tax Treatment of Life Event Products: Costing the Effects
2
1. Introduction
Currently life-event financial products, education bonds and insurance bonds, are subject to
taxation on income within the fund operated by providers friendly societies) at a tax rate of 30
per cent. That tax rate applies to income such as interest or dividends on assets held as well as
to realized capital gains – regardless of the time for which the asset has been held. This is in
contrast to the general tax treatment of capital gains which effectively applies a reduced tax to
long term capital gains (where the holding period is greater than 12 months), by only including
a fraction of the capital gain in taxable income.1
The objective of this note is to determine the likely consequences of changing the taxation rate
applied to these products from the current 30 per cent to 20 per cent. It examines:
a) the direct budgetary consequences – assuming no change in the amount invested in
these products, and allowing for the tax rate change to apply to existing investments or
only new investments
b) the likely consequences for the increased scale of investment in these products,
recognizing that possible consequences of a tax reduction involve an increase in total
saving which is directed to these products and/or a shift in the composition of savings
away from other financial products, including alternative long term savings
arrangements such as voluntary contributions to superannuation which involve greater
tax-concessionality, but greater restrictions on accessibility to meet specific needs.
c) potential budgetary consequences
i. allowing for increased investment in the products;
ii. from increased savings in these forms leading to reduced government
expenditures because of investor self-financing of certain expenditures rather
than reliance on government financing.
1 It should be noted that friendly society bonds and life office bonds are treated the same under the same Tax
Laws.

Changing the Tax Treatment of Life Event Products: Costing the Effects
3
There are no published official figures for the amounts outstanding for the various types of
financial products offered by friendly societies. In aggregate, net policy liabilities (encompassing
insurance bonds, education bonds, funeral bonds etc) were $5.411 billion at June 2012, having
been relatively stagnant around that level since the start of the millennium. During the 1980s
the size of the sector had grown to over $9 billion at the start of the 1990s before stagnating
and declining from the mid-1990s to around current levels at the end of that decade. One
factor contributing to that stagnation and decline was an increase in the tax rate applied to
Friendly Societies from 20 per cent to 30 per cent in 1988.

Changing the Tax Treatment of Life Event Products: Costing the Effects
4
2. Insurance Bond Asset Allocation, Income and Effective Tax Rates
Of total assets held by Friendly Societies ($5.85 billion at June 2012), around 80 per cent are
invested via the friendly society benefit fund structure in underlying unit trusts, which are
predominantly invested in equities.2 It thus seems reasonable to assume that the asset
portfolios backing insurance bond products are approximately 25 per cent in bonds and money
market securities generating interest income and 75 per cent in equity type products
generating dividends (which are largely franked) and capital gains.3
To calculate the average tax rate paid by the fund, we assume that the fixed interest return is 4
per cent p.a. and that the equity return is 10 per cent p.a. for all stocks (regardless of whether
they pay franked or unfranked dividends) comprising part dividend yield and part capital gain
yield. For ease of interpretation we consider a portfolio value of $100.
To illustrate the range of effects a change in tax rates could have, four scenarios are considered
below. With a 25 /75 portfolio allocation to fixed interest and equities respectively, the
portfolio average rate of return before tax is (0.25 x 0.04 + 0.75 x 0.10) = 8.5 per cent p.a. The
two alternative portfolio allocations provide the same pre-tax return.
Franked Dividend Stock Portfolio
share
Unfranked Dividend Stock Portfolio Share
Dividend yield
Capital Gain yield
Pre-tax Total Return
Scenario 1 75.0% 0.0% 5% 5% 8.5%
Scenario 2 75.0% 0.0% 4% 6% 8.5%
Scenario 3 50.0% 25.0% 5% 5% 8.5%
Scenario 4 50.0% 25.0% 4% 6% 8.5%
For scenarios 1 and 3, the 10 per cent rate of return of both the franked and unfranked
dividends are comprised of 5 per cent dividend income and 5 per cent capital gain. For
scenarios 2 and 4 the split is 4 per cent and 6 per cent respectively.
2 Source ABS Cat.No 5655.0 Managed Funds, Australia
3 Some of the unit trust investments will be in property related vehicles – for current purposes it is adequate to
treat those as equivalent to investments in stocks paying unfranked dividends.

Changing the Tax Treatment of Life Event Products: Costing the Effects
5
If these scenarios are applied to a portfolio size of $100, with $25 invested in fixed interest
(earning 4 per cent p.a.) and $75 in equities, the returns generated are outlined below.
Interest Franked
Dividends Unfranked Dividends
Capital Gains Pre-tax total return
Scenario 1 $1 $3.75 $0 $3.75 $8.5
Scenario 2 $1 $3 $0 $4.5 $8.5
Scenario 3 $1 $2.5 $1.25 $3.75 $8.5
Scenario 4 $1 $2 $1 $4.5 $8.5
The fund pays tax at a rate of 30 per cent on interest, unfranked dividends and capital gains,
but zero tax on franked dividend cash income because of use of franking credits. For scenario 1,
tax paid is therefore 0.3 x (1 + 3.75) = 1.425 on an income of 8.5 which corresponds to an
effective tax rate of approximately 16.8 per cent.4 The respective tax rates for the alternate
scenarios are shown in the table below.
Tax Payments
Interest Franked Dividends
Unfranked Dividends
Capital Gains Total Tax Tax Rate
Scenario 1 0.3 0 0 1.125 1.425 16.76%
Scenario 2 0.3 0 0 1.35 1.65 19.41%
Scenario 3 0.3 0 0.375 1.125 1.80 21.18%
Scenario 4 0.3 0 0.3 1.35 1.95 22.94%
It is important to emphasize that the tax rates shown in the table are on the cash income
received by the fund. If franking credits are added to the income stream the tax rate on that
grossed-up income is 30 per cent. It is also worth comparing the tax rates on cash income
shown in the table with those applying to the cash income of an individual who invested
directly in the same assets. Using scenario 1 as an example, an individual on a 30 per cent
marginal tax rate would pay only half as much capital gains tax, ie $ 0.5625 rather than $1.125
(due to the concessional rate of tax on long term capital gains). Total tax paid would thus be
$0.8625 giving an individual tax rate on cash income of $8.50 of around 10 per cent –
significantly below the tax rate shown for the insurance bond.
4 This, and subsequent calculations assume that the fund realizes long term capital gains each year. In practice,
realization will be deferred creating a further tax benefit and small reduction in the effective tax rate.

Changing the Tax Treatment of Life Event Products: Costing the Effects
6
It is worth noting one complication arising from the structure of education bonds, which is
relevant for estimates of the effects of tax rate changes. Withdrawals from education bonds
involve tax paid on earnings in the fund being recouped by the investor and added (with the
earnings amount) to their taxable income.

Changing the Tax Treatment of Life Event Products: Costing the Effects
7
3. The Effect of a Tax Rate Change
The first calculation is to determine what will happen to tax revenue if the tax rate on friendly
societies is reduced to 20 per cent. One consequence may be that the portfolio allocation of the
societies shifts away from fixed interest to equities and within equities towards higher dividend
yield, lower capital gain, stocks. Assume initially no such portfolio composition shift. This shift
will be driven by investors changing menu selections rather than by the societies.
The difference between the corporate tax rate of 30 per cent and the proposed 20 per cent rate
for insurance bonds complicates the tax calculation, which we explain in the context of Scenario
1. Taxation of interest income at 20 per cent rate is now 0.2 x $1 = $0.20. Franked dividend cash
income of $3.75 will lead to a tax rebate of 0.375/0.7 = -$0.5357 (calculated by grossing up the
cash dividend by 1/(1-tc) and noting that tax payable is 3.75(tp – tc) / (1-tc).5 Capital gains
taxation will be 0.2 x 3.75 =$ 0.75. Thus total tax paid is now 0.2 - 0.5357 + 0.75 = total tax of
$0.41, on a pre-tax income of $8.5 which corresponds to an effective tax rate of 4.87 per cent.
(Note that for a superannuation fund with the same portfolio, and with a tax rate of 15 per cent
and only 2/3 of long term capital gains taxable the effective tax rate would be negative). The
corresponding tax break-down after the reduction in the insurance bond tax rate for the
alternative scenarios is provided in the table below.
Tax Payments (at tax rate of 20 per cent)
Interest Franked Dividends Unfranked Dividends Capital Gains Total Tax Tax Rate
Scenario 1 0.2 -0.54 0 0.75 0.41 4.87%
Scenario 2 0.2 -0.43 0 0.9 0.67 7.90%
Scenario 3 0.2 -0.36 0.25 0.75 0.84 9.92%
Scenario 4 0.2 -0.29 0.2 0.9 1.01 11.93%
Using the current total funds under management in investment bond structures of
approximately $6.6 billion6 total pre-tax income using the assumed rates of return above would
be 0.085*6.6 billion = $561 million p.a. Total tax revenue based on the statutory tax rate of 30
per cent giving an effective tax rate of 16.8 per cent would be $94.05 million. Changing the
5 Where tp is the tax rate of the friendly society and tc is the corporate tax rate.
6 Investment Bonds Report, Plan for Life Actuaries & Researchers, 2012

Changing the Tax Treatment of Life Event Products: Costing the Effects
8
statutory tax rate to 20 per cent, giving rise to an effective tax rate of 4.87 per cent, would
reduce tax revenue to $27.343 million.7
Total Insurance Bond Investments 6.6 Billion
Total Return on Insurance Bonds 0.561 Billion
Tax Revenue Change: (assuming pre-tax rate of return of 8.5% on portfolio of $6.6 billion)
Tax Revenue at 30% tax Rate
Tax Revenue at 20% tax rate
Tax Reduction $mill
Scenario 1 94.050 27.343 66.71
Scenario 2 108.900 44.314 64.59
Scenario 3 118.800 55.629 63.17
Scenario 4 128.700 66.943 61.76
A ball-park estimate of the cost to the budget, assuming no change in portfolio composition
or change in scale of the sector of reducing the statutory tax rate from 30 to 20 per cent is
thus $60-70 million p.a.
There is a minor caveat to the results above arising from the particular characteristics on
education bonds. In the case of education bonds, withdrawals lead to investors recouping the
tax paid on earnings within the fund, with that amount included with the earnings amount in
the recipient’s assessable income. Changing the tax rate from 30 to 20 per cent would mean
that the gross amount received would be relatively unchanged, but would include a higher
earnings component and less recoupment of tax. Thus lower tax inflows from earnings of the
fund would be offset by lower tax outflows when the education bond is redeemed, suggesting
that the main effect is a change in the timing of tax flows rather than a change in aggregate.
Thus while a reduction in the tax rate would have initial consequences for budget revenue as
7 In the case of education bonds, withdrawals lead to investors recouping the tax paid on earnings within the fund,
with that amount included with the earnings amount in the recipient’s assessable income. Changing the tax rate from 30 to 20 per cent would mean that the gross amount received would be relatively unchanged, but would include a higher earnings component and less recoupment of tax. Thus lower tax inflows from earnings of the fund would be offset by lower tax outflows when the education bond is redeemed, suggesting that the main effect is a change in the timing of tax flows rather than a change in aggregate.

Changing the Tax Treatment of Life Event Products: Costing the Effects
9
outlined above, this would be largely offset at a later time when the bonds mature, withdrawals
are made, and lower reimbursements of tax are required.
The consequences of a reduced tax rate in the case of education bonds appears to be
primarily a reduction in current tax revenue which will be offset by a reduced reimbursement
of tax when bonds are redeemed. In a long run steady state, when the tax change has been in
effect for some time, these effects should tend to net out, implying no significant change in
tax revenue.

Changing the Tax Treatment of Life Event Products: Costing the Effects
10
4. Investor Responsiveness to Tax Changes
The immediate cost to the budget of lowering the tax rate on insurance bonds could be
reduced quite substantially by (a) applying the lower tax rate only to new investments rather
than to existing investments (b) phasing in the reduction in the tax rate over some period of
time such as 4 years. Option (a) would undoubtedly create some complications in that (i)
segregated funds and accounting thereof would appear to be required for pre-tax-change
products and post-tax-change products, while (ii) current investors in existing products would
be faced with a choice of whether to continue contributions to those products or commence
investing in new products with a longer term maturity date.
It would be expected that a lower tax rate applied to these financial products would increase
the amount invested in them. Because it involves a change in relative tax rates of different
financial products it seems unlikely that there would be a substantial effect on aggregate saving
– with most effects occurring from a substitution effect between financial products. A likely
absence of a significant aggregate savings effect is also suggested by the fact that the financial
products involved constitute a relatively small part of overall household financial wealth.
However, there are two factors which may prompt an aggregate savings response. Behavioural
finance suggests that individuals may operate separate mental accounts, such as for long term
savings, special purpose saving, general saving etc. In that case, because the financial products
involved are targeted special purpose savings and/or long term, enhanced returns (due to
lower taxation) may lead to some increase in savings for that purpose at the expense of
reduced consumption rather than reductions in other saving. Another effect may arise from the
constraints imposed by legislation on the scale of contributions into tax-preferred
superannuation savings. In the absence of, or limited competitiveness of, other long-term tax
preferred vehicles, individuals may consume rather than save amounts in excess of the
maximum allowable. Improving the tax benefits from long term savings outside of
superannuation may lead to an increase in total saving.
It nevertheless appears likely that the main source of increased investment in these products
would be substitution from other financial products, primarily fixed interest products or direct
investments in equities or managed funds outside of superannuation. The amount of

Changing the Tax Treatment of Life Event Products: Costing the Effects
11
substitution from other financial products into insurance bonds will depend somewhat to the
tax benefits that insurance bonds can offer. For the following example investors are grouped
into tax groups based on the brackets outlined in the table below.
High Medium Low
Tax Rate 45.00% 30.00% 20.00%
For simplicity, we assume that any increase in insurance bond investments involves a change
from holding equities directly to investing in equities through an insurance bond. The table
below illustrates the case where a stock pays a franked dividend of $5 and the investor has
realized long term capital gains of $5 (of which only half is subject to taxation in the case of an
individual investor).
Tax payments on Stock Return of $5 franked dividend and $5 long-term capital gain
Individual Investor Insurance Bond
Tax rate 45 % 30 % 20 % 30% 20%
Franked Dividend 1.071 0.000 -0.714 0.000 -0.714
Long Term Capital Gain 1.125 0.750 0.500 1.500 1.000
Total Tax paid 2.196 0.750 -0.214 1.500 0.286
The total effect on tax revenue consists of two parts: the change in revenue from taxation of
assets currently held in insurance bonds and the change in tax revenue from investors switching
into insurance bonds.
When the insurance bond tax rate is 30%, the high (45%) tax rate payers are the only investors
for whom it is advantageous to hold equities through the insurance bond structure. If the
investment bond tax rate is reduced to 20%, there is a reduction in tax revenue (on a stock
return of $10) of 1.214 (1.5-.286) associated with equity investments of high tax rate individuals
currently held through the insurance bond. If such high tax rate investors shift from direct
holdings to investment via the insurance bond, the cost to tax revenue is 1.91 (2.196-0.286).
Individuals with a 30% tax rate would now find it advantageous to shift out of direct equity
holdings and into indirect holdings via insurance bonds and this equates to a .464 reduction in
tax revenue (.75-.286).

Changing the Tax Treatment of Life Event Products: Costing the Effects
12
Thus, the cost to tax revenue from increased investment in insurance bonds will depend upon
what proportions of that increase come from investors in different tax brackets.
Suppose, for example, the lower tax rates lead to an increase in investments of $1 billion from
individuals on tax rates of 45% and $1 billion from investors on tax rate of 30%. Assuming
equity returns of 5% franked dividends and long term capital gains of 5%, (or $50 million each
of dividends and capital gains on a $1 billion investment). Since the cost of the assumed change
in the tax rate was calculated above as $1.91 and $0.464 on a $10 return for such shifts in
investments, the tax revenue cost would be $(1.91 + 0.464)*10 million = $23.4 million p.a. (To
this must be added the tax cost of the lower tax rate on existing insurance bond investments
calculated earlier of approximately $50 million p.a.)
Is an increased investment in insurance bonds of $2 billion as assumed a realistic figure given
the tax changes assumed? According to the figures explored in scenarios 1 to 4, the tax change
leads to a percentage increase in the after tax return on insurance bonds of around 14 per
cent.8 An increase of $2 billion on a current stock of around $5.7 billion is a percentage increase
of around 35 per cent. This involves an elasticity of supply of around 2.5, which although high
may be consistent with past experience, and should also be interpreted as a long run
equilibrium – after gradual adjustment over several years.
The best historical reference point that we have to determine the sensitivity of investment in
friendly society funds under management to changes in tax rates is around the date of January
1st 1988. On this day the tax rate imposed on friendly societies was changed from 20 per cent to
30 per cent. The tax rate had been changed from zero to 20 per cent in 1983-84, and the sector
grew rapidly from the early 1980s.
The chart below shows how the total assets held by Friendly Societies responded to three
separate tax rate changes.
8 The percentage change in the after tax rate of return is calculated as (1-tnew)/(1-told)-1, where tnew and told
refer to the new and old tax rates of 0.20 and 0.30 respectively.

Changing the Tax Treatment of Life Event Products: Costing the Effects
13
Figure 1 Total Assets Held By Friendly Societies – 1953-2012
Source: Reserve Bank of Australia, Occasional Paper No. 8
It is instructive to compare the growth rates of Friendly Society assets prior to and after the tax
rate change at the start of 1988. In the five years ending June 1988, the average growth rate
was 46.0 per cent p.a. In the subsequent six years to June 1994, the average growth rate was
7.7 per cent p.a. Had the pre 1988 growth rate continued, Friendly Society assets at June 1994
would have been $13.50 billion compared to the $9.09 billion actually achieved, or a difference
of over $4 billion. While there are significant differences between financial market conditions
(including in market rates and thus rates of return credited to insurance bonds and contributing
to asset growth) and alternative investment options (including superannuation) these figures
are suggestive of a significant elasticity in response to investment specific tax changes.
Further suggestive evidence of high sensitivity to relative tax changes on financial assets can be
found from the experience of 2006-7 when significant tax changes were introduced for
superannuation. Contributions into superannuation in that year increased from $74,823 million
in 2005-6 to $161,791 million, before declining to $116,332 million the following year. That tax
change involved a one-off opportunity for tax preferred investment, but also involved some
ongoing tax concessions.
Based on these observations, an assumed increase in Friendly Society Assets of $2 billion
(achieved gradually over several years) as a result of a reduction in the tax rate from 30 to 20
per cent does not seem unreasonable.
0.00
1.00
2.00
3.00
4.00
5.00
6.00
7.00
8.00
9.00
10.00
1953
1955
1957
1959
1961
1963
1965
1967
1969
1971
1973
1975
1977
(h
)
1979
1981
1983
(i)
1985
1987
1989
(c)
1991
1993
1995
1997
1999
2001
2003
2005
2007
2009
2011
2013
Tota
l Ass
ets
(Bill
ion
)
Total Assets held by Friendly Societies
0 % tax rate implemented
20 % tax rate implemented
30 % tax rate implemented10 Years after tax rate reduction

Changing the Tax Treatment of Life Event Products: Costing the Effects
14
The cost to tax revenue from increased investment in insurance bonds resulting from a
reduction in the tax rate from 30 to 20 per cent is likely to be below $25 million p.a. This
calculation assumes an immediate one-off increase in amounts invested in insurance bonds of
$2 billion. In practice it can expected that there will be a gradual adjustment and
correspondingly low cost to tax revenues until the adjustment is completed.

Changing the Tax Treatment of Life Event Products: Costing the Effects
15
5. Potential Tax and Expenditure Savings
The funds accumulated in insurance bonds, education bonds and other life-event financial
products are intended to flow into private expenditures of particular types, some of which may
otherwise be subsidized by government tax concessions or welfare payments. Saving for
retirement and education expenses are two such areas.
The table below provides an excerpt of the federal treasuries estimated expenditures across
three relevant sectors.
Sector Amount ($ mill) Percent of Total
Education 29,259 7.83%
Health 61,168 16.37%
Social Security and Welfare 126,879 33.95%
Other 156,365 41.85%
Total Budget for Education, Health and Social Security 217,306 58.15%
Source: Budget 2011-2012, Australian Government
When estimating the potential reductions in government expenditures we must consider the
timing of withdrawals of funds by the insurance bond holders. If there is an eventual increase in
the total stock of insurance bonds of $2 billion in a steady state, it could be expected that
eventually there will be around $200 million withdrawals p.a. (This is based on the 10 year
maturity of insurance bonds and the assumption that in a steady state, new inflows equal
withdrawals).9
The next estimate that has to be made is what proportion of the withdrawals from insurance
bonds would be allocated to services such as education, health and social security and could
therefore lead to lower government expenditures or tax expenditures. Without surveying
investors in insurance bonds it is not possible to calculate this figure however for illustrative
purposes we will assume that 30 per cent of withdrawals are used on services where potential
government support is involved. Some part of this expenditure may have otherwise occurred
out of other private savings, and only some part of those expenditures will lead to reductions in
9 The above calculation is simplified by assuming that the return earned by the insurance bond is equal to the rate
of inflation. If, as would be expected in reality, the return is higher than inflation the present value of the average return would be higher than $200 million per annum.

Changing the Tax Treatment of Life Event Products: Costing the Effects
16
government outlays or tax expenditures. It is impossible, within the scope of this report to
derive estimates of these potential amounts with any degree of confidence. But it might be
expected that overall, 5 per cent of withdrawals (or $10 million p.a.) lead to offsetting
reductions in government budget costs. Note that there is a timing difference in such
government budget benefits since they occur when funds are withdrawn on maturity from
insurance bonds, whereas tax concessions for investment occur during the accumulation phase.
While there may be some ultimate tax benefits or expenditure savings for the government
budget from an increase in investment in insurance bonds, this is likely to be relatively small,
but would provide some offset to tax concessions for such investments.

An independent report prepared for Abacus by the Australian Centre for Financial Studies.
Principal authors are Professor Kevin Davis (Research Director) and Mr Martin Jenkinson
(Research Officer).
An Education Bond Co-contribution
Scheme:
Estimating the Budgetary Cost
12th December, 2012

An Education Bond Co-Contribution Scheme: Estimating the Budgetary Cost
P a g e | 2
1. The Education Bond Co-contribution Scheme
It has been proposed that the Federal Government should consider introducing a co-contribution
scheme whereby Australians who invest funds in an Education Scholarship plan would receive a
capped government co-contribution. The objective is to encourage private saving for provision of
education needs of children, and recognises the rationale for financial incentives to encourage such
forward planning.
The proposal involves the Government providing matching funding of up to $500 p.a., for a period of
five years, for contributions made by a family (or relatives) on behalf of children under seven years
of age. The version of the scheme presented in this report is based on the scheme being available to
all households however the scheme could also include eligibility requirements based on parental
income.1 Co-contributions would be paid by the government one year in arrears.
The budgetary costs are of two types. One is the direct co-contribution amounts. The second is the
extent of tax concessions arising from the taxation rate applied to earnings of the fund. This aspect is
complicated by two factors. First, it is necessary to estimate the additional budgetary cost arising
from the extent to which fund balances are higher than they would otherwise be in the absence of
the scheme. (Some households may have made contributions in the absence of the scheme). The
second complication is that the “tax cost” depends upon the size of fund balances and the difference
between the tax rate applied to earnings in the fund and that which would have been applied if the
household had held assets personally. As explained in the box below, this calculation is complicated.
Estimating the Tax Cost
Consider an individual who saves and contributes $500, If instead they had not participated but
invested that amount on personal account, the tax on earnings would be tp.r.(500), where r is the
earnings rate and tp is the personal tax rate. If they participate, the tax payable will be tf.r (1000),
where tf is the fund tax rate and the fund balance of $1,000 reflects the additional government co-
contribution. (It is assumed for simplicity that the earnings rate is the same in both cases). However,
the nature of scheme eligibility is such that participants would have personal marginal tax rates of 30
per cent or less (and generally less). Assume for simplicity that the average tp is 20 per cent (and it
could be substantially less, particularly once concessional tax treatment of capital gains is taken into
account). Then if the fund tax rate tf is 30 per cent, and assuming a return on assets of 6 per cent,
the government will receive tax revenue of 0.3 x 0.06 x $1000 = $18. In the alternative case where
the individual held $500 on personal account, the tax revenue would be 0.2 x 0.06 x $500 = $6.
There is thus some recoupment of the government’s co-contribution amount because of the higher
tax rate applied to earnings. However, because the tax paid within the fund is reimbursed to the
scheme participant when funds are withdrawn and used for eligible education purposes, this is
primarily a bringing forward of tax revenues. In the example above, the $18 tax revenue would be
offset at a later date by reimbursement of this amount (as taxable income) to the beneficiary. The
overall tax effect will depend on the marginal tax rate of the beneficiary.
1 An eligibility requirement would limit the scheme to children whose parents are classified as low to middle
income. Low income could be defined as personal income of less than $37,000, while middle income could be defined as income of less than $80,000.

An Education Bond Co-Contribution Scheme: Estimating the Budgetary Cost
P a g e | 3
Because of these considerable complications, and in the absence of sufficient information about
future tax rates applicable to beneficiaries, we think it appropriate to assume that the tax effects net
out to zero.
Two further complications also need to be noted. First, the calculation above assumes that the effect
of the scheme is primarily a reallocation of asset holdings, such that the differential tax rate is the
main effect. However, if the scheme induces extra saving and investment by individuals, the tax
receipts from investment earnings in the alternative case would be zero. Second, some participants
in the scheme may have also contributed funds in the absence of the scheme, in which case the only
tax effect is the tax revenue on fund earnings on the co-contribution amount (which are ultimately
reimbursed). These further complications also suggest that, in the absence of more detailed
information, it is appropriate to ignore the tax effects.
2. Basis for Assumptions
To estimate the direct co-contribution amounts, we make the following assumptions. First, we take
the number of births in 2011 from ABS data as our benchmark and project births for subsequent
years by assuming a growth rate of 1.25%.
Table 1 Total Number of Births 2006-2011
2006 2007 2008 2009 2010 2011
Births 265,949 285,213 296,621 295,738 297,903 301,617
Birth Growth Rates 7.24% 4.00% -0.30% 0.73% 1.25%
Source: Australian Bureau of Statistics, CAT: 3301.0 - Births, Australia, 2011
It is assumed that the scheme starts in 2013. We assume that 40% of births are to low-income
families,40% to middle income families and 20% to high income families. This is based on the
average age of child bearing adults and the average income of those age brackets. These proportions
would appear to be reasonable given that the figures provided in Tables 2 and 3 show that almost all
babies are born to mothers aged below 40 and accounting for the upward bias of using mean rather
than median values for average annual incomes.
Table 2 Births, Nuptiality and age of mother, Australia–2011
24 17.48%
25 21.76%
26 26.70%
27 32.38%
28 38.70%
29 45.38%
30 52.11%
31 59.02%
32 65.52%
33 71.57%
34 77.11%
35 82.11%

An Education Bond Co-Contribution Scheme: Estimating the Budgetary Cost
P a g e | 4
36 86.50%
37 90.16%
38 93.17%
39 95.55%
40 97.24%
Source: ABS, CAT 3301.0 - 2011 Births, Australia, 2011
Table 3 Average Annual Income by Age Bracket
20–24 $36,868
25–29 $52,260
30–34 $62,192
35–39 $63,544
Source: ABS, CAT 6310.0 - Employee Earnings, Benefits and Trade Union Membership, Australia, August 2011
We then assume that 11% of low-income eligible families and 15% of middle income families decide
to participate. These figures are based on the percentage of eligible low and middle income earners
(as defined by the income brackets stated above) who participated in the superannuation co-
contribution scheme. Due to high income earners not being eligible for the superannuation co-
contribution scheme there is no such precedent on which to derive the proportion of high income
earners who are likely to use the scheme. However, due to the modest take up of scholarship plans
amongst high income earners we have assumed that 15 per cent of high income earners would
utilise this scheme. We also assume that the initial year of participation in the scheme is spread
equally over the three years following birth.
Table 4 Superannuation Co-contributors
2010
Total low income superannuation co-contributors 367,616
Total middle income superannuation co-contributors 661,200
Source: Derived from ATO, Super co-contributions reports for 1 July 2010 to 30 June 2011
Table 5 Total Low and Middle Income Earners 2010
2010
Total Low Income Earners 3,255,100.0
Total Middle Income Earners 4,336,800.0
Source: Australian Bureau of Statistics, CAT: 6306.0 - Employee Earnings and Hours, Australia, May 2010
Percentage of low-income earners utilising superannuation co-contribution 11.29%
Percentage of middle-income earners utilising superannuation co-contribution 15.25%
Proportion of High Income Families that Utilise Scheme 15.25%

An Education Bond Co-Contribution Scheme: Estimating the Budgetary Cost
P a g e | 5
When determining the average contribution of scheme participants, two scenarios are presented.
The first assumes an average contribution of $350 for all income brackets2. The second, and perhaps
more realistic scenario, is that marginal contributors to the scheme do so solely because of the co-
contribution incentive and therefore middle income and high income earners contribute the full
$500 each year while lower income earners contribute $350 annually. The table below provides a list
of other macro-assumptions that were used when determining the budgetary costs and marginal
increase in savings that are expected to be generated as a result of the scheme. The rate of return
on education bonds used for calculations is an after-tax real return of 4% which is consistent with
the target returns on balanced account options in many large superannuation funds.3 A key
assumption that is made when calculating the overall pool of funds generated through the scheme is
that no withdrawals are made from the balances of account holders by the year 2022. This is a
reasonable assumption given that the sole purpose test for the co-contribution states the funds are
to be used only for secondary education onward, implying that a child must be around 13 years old
before withdrawals begin.
Number of Total Births (2013) 309,205
Growth in Births 1.25%
Education Bonds Real After Tax Rate of Return 4.00%
3. Budgetary Costs and Increases in Education Savings: Scenario 1
The premise for scenario 1 is that both low and middle income earners have a maximum
government co-contribution of $500. However, in a similar fashion to the take up of the
superannuation co-contribution scheme, the average annual contribution utilises only 70% of this
amount.4 A summary of the assumptions used are listed in the tables below.
Table 6 Assumptions for low-income Australians
Proportion of Births to Low Income Families 40.00%
Maximum Government Contribution 500
Average Annual Contribution per-family (Annual) 350
Proportion of Low Income Families that Utilise Scheme 11%
Table 7 Assumptions for middle-income Australians
Proportion of Births to Middle Income Families 40.00%
Maximum Government Contribution 500
Average Contribution per-family (Annual) 350
Proportion of Middle Income Families that Utilise Scheme 15%
2 This is calculated as 70% of the maximum contribution, a ratio that coincides with the average co-
contribution of superannuation co-contributors across 2009 and 2010 (ATO, 2011) 3 For example, Australian Super targets CPI + 4% on their balanced investment option.
http://www.australiansuper.com/investments-and-performance/super-investment-choices/premixed-investment-choice/balanced.aspx 4 It is also assumed that individuals will continue to contribute to their education bond investment account
beyond the initial five years in which they are eligible for the co-contribution

An Education Bond Co-Contribution Scheme: Estimating the Budgetary Cost
P a g e | 6
Table 8 Assumptions for high-income Australians
Proportion of Births to High Income Families 20.00%
Maximum Government Contribution 500
Average Contribution per-family (Annual) 350
Proportion of High Income Families that Utilise Scheme 15%
Based on the figures above, the total budgetary cost for government is expected to begin at $5
million dollars in 2014 (remembering that co-contributions are made one year in arrears) to reach a
steady state of around $75 million dollars by 2020.5 Note that the annual government cost equals
the private contribution of the prior year for the first five years but stabilizes thereafter, while the
private contributions continue to grow. The increase in education savings balances directly
attributable to the scheme is expected to increase annual private contributions into education
savings products by around $140 million per annum (in constant dollar terms) by 2022. A complete
working of this is provided in Appendix 1.
Table 9 Effects of Co-Contributions scheme (Scenario 1)
Years
Annual Budgetary Cost for Government
Cumulative Cost for Government
Annual Private Contributions
Total Balance in Education Savings Products
2013 $0 $0 $4,911,789 $5,108,261
2014 $4,911,789 $4,911,789 $14,796,765 $25,809,487
2015 $14,796,765 $19,708,554 $29,717,091 $72,931,946
2016 $29,717,091 $49,425,645 $44,823,922 $152,339,499
2017 $44,823,922 $94,249,568 $60,119,589 $264,657,053
2018 $60,119,589 $154,369,156 $75,606,451 $410,304,836
2019 $70,694,662 $225,063,818 $91,286,899 $584,591,570
2020 $76,490,134 $301,553,952 $107,163,352 $782,562,665
2021 $77,446,261 $379,000,213 $123,238,261 $999,193,412
2022 $78,414,339 $457,414,552 $139,514,107 $1,234,504,226
4. Budgetary Costs and Increases in Education Savings: Scenario 2
In this section we consider the effects of changing particular assumptions underlying the estimates.
Specifically we assume that high-income and middle income earners participating in the co-
contribution education bond scheme do so with the intention of utilising the maximum $500 co-
contribution amount, rather than the 75% figure used in the previous scenario. Low-income earners
continue to have an average annual contribution of $350.
5 The budgetary cost will continue to grow slightly from this figure due to the assumed continued growth in birth rates.

An Education Bond Co-Contribution Scheme: Estimating the Budgetary Cost
P a g e | 7
Table 10 Assumptions for low-income Australians
Proportion of Births to Low Income Families 40.00%
Maximum Government Contribution 500
Average Annual Contribution per-family (Annual) 350
Proportion of Low Income Families that Utilise Scheme 11%
Table 11 Assumptions for middle-income Australians
Proportion of Births to Middle Income Families 40.00%
Maximum Government Contribution 500
Average Contribution per-family (Annual) 500
Proportion of Middle Income Families that Utilise Scheme 15%
Table 12 Assumptions for high-income Australians
Proportion of Births to High Income Families 20.00%
Maximum Government Contribution 500
Average Contribution per-family (Annual) 500
Proportion of High Income Families that Utilise Scheme 15%
It can be seen from Table 13 that the effect of this change is that the total annual budgetary cost
incurred by government will reach a steady state of around $100 million dollars an increase of
approximately $25 million from the figure projected in Scenario 1. The change in assumptions also
means that the amount of annual private contributions will increase to approximately $180 million
by 2022, leading to a total balance in education savings products of around $1.6 billion.
Table 13 Effects of Co-contribution scheme (Scenario 2)
Years
Annual Budgetary Cost for Government
Cumulative Cost for Government
Annual Private Contributions
Total Balance in Education Savings Products
2013 $0 $0 $6,343,821 $6,597,574
2014 $6,343,821 $6,343,821 $19,110,760 $33,334,241
2015 $19,110,760 $25,454,581 $38,381,107 $94,195,250
2016 $38,381,107 $63,835,688 $57,892,334 $196,754,069
2017 $57,892,334 $121,728,022 $77,647,450 $341,817,797
2018 $77,647,450 $199,375,472 $97,649,506 $529,929,181
2019 $91,305,685 $290,681,157 $117,901,587 $755,029,199
2020 $98,790,827 $389,471,985 $138,406,820 $1,010,718,753
2021 $100,025,712 $489,497,697 $159,168,367 $1,290,508,178
2022 $101,276,034 $590,773,731 $180,189,435 $1,594,423,842

An Education Bond Co-Contribution Scheme: Estimating the Budgetary Cost
P a g e | 8
A ball-park estimate of the steady state direct budgetary cost of the proposed co-
contribution scheme is between $80 - $100 million p.a. Based on the same assumptions
the scheme is likely to result in an increased pool of education savings of between $1.2
and $1.6 billion dollars by 2022.
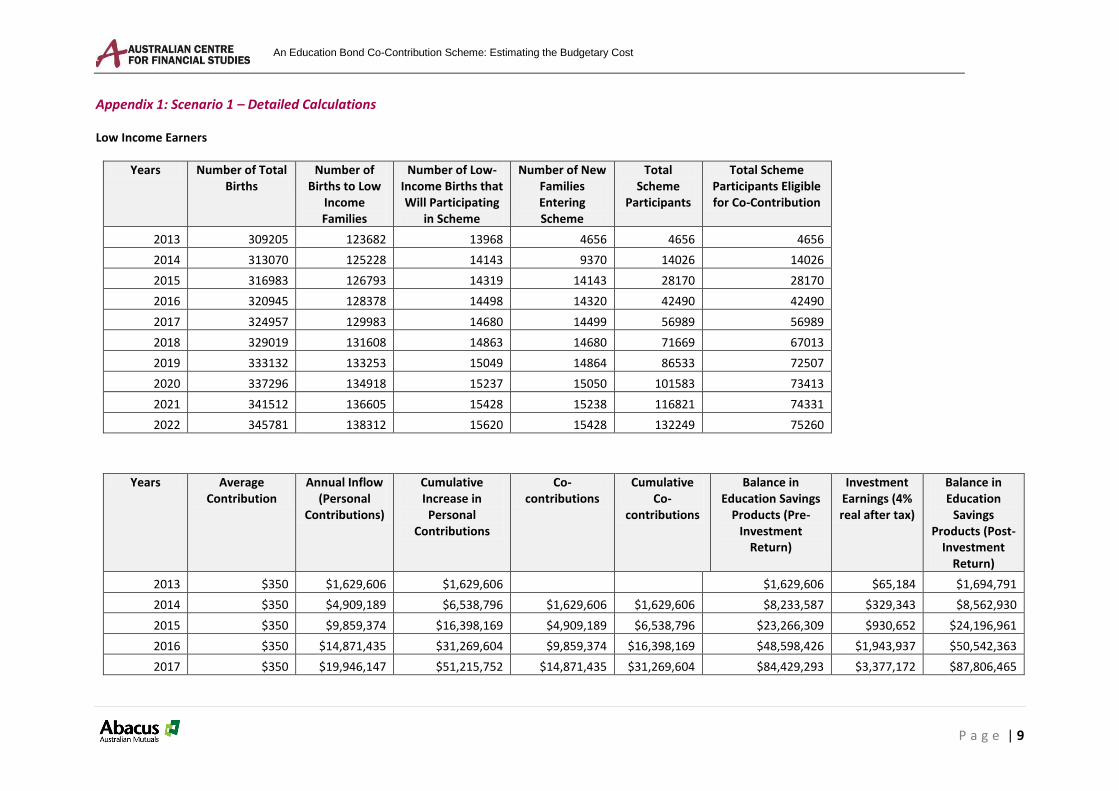
An Education Bond Co-Contribution Scheme: Estimating the Budgetary Cost
P a g e | 9
Appendix 1: Scenario 1 – Detailed Calculations
Low Income Earners
Years Number of Total Births
Number of Births to Low
Income Families
Number of Low-Income Births that Will Participating
in Scheme
Number of New Families Entering Scheme
Total Scheme
Participants
Total Scheme Participants Eligible for Co-Contribution
2013 309205 123682 13968 4656 4656 4656 2014 313070 125228 14143 9370 14026 14026 2015 316983 126793 14319 14143 28170 28170 2016 320945 128378 14498 14320 42490 42490 2017 324957 129983 14680 14499 56989 56989 2018 329019 131608 14863 14680 71669 67013 2019 333132 133253 15049 14864 86533 72507 2020 337296 134918 15237 15050 101583 73413 2021 341512 136605 15428 15238 116821 74331 2022 345781 138312 15620 15428 132249 75260
Years Average Contribution
Annual Inflow (Personal
Contributions)
Cumulative Increase in Personal
Contributions
Co-contributions
Cumulative Co-
contributions
Balance in Education Savings
Products (Pre-Investment
Return)
Investment Earnings (4% real after tax)
Balance in Education
Savings Products (Post-
Investment Return)
2013 $350 $1,629,606 $1,629,606 $1,629,606 $65,184 $1,694,791
2014 $350 $4,909,189 $6,538,796 $1,629,606 $1,629,606 $8,233,587 $329,343 $8,562,930
2015 $350 $9,859,374 $16,398,169 $4,909,189 $6,538,796 $23,266,309 $930,652 $24,196,961
2016 $350 $14,871,435 $31,269,604 $9,859,374 $16,398,169 $48,598,426 $1,943,937 $50,542,363
2017 $350 $19,946,147 $51,215,752 $14,871,435 $31,269,604 $84,429,293 $3,377,172 $87,806,465

An Education Bond Co-Contribution Scheme: Estimating the Budgetary Cost
P a g e | 10
2018 $350 $25,084,293 $76,300,045 $19,946,147 $51,215,752 $130,892,968 $5,235,719 $136,128,687
2019 $350 $30,286,666 $106,586,711 $23,454,687 $74,670,439 $186,492,869 $7,459,715 $193,952,584
2020 $350 $35,554,069 $142,140,780 $25,377,477 $100,047,91
6 $249,648,411 $9,985,936 $259,634,347
2021 $350 $40,887,314 $183,028,095 $25,694,695 $125,742,61
1 $318,756,642 $12,750,266 $331,506,908
2022 $350 $46,287,224.9
2 $229,315,320 $26,015,879 $151,758,49
0 $393,824,076 $15,752,963 $409,577,039
Middle Income Earners
Years Number of Total Births
Number of Births to Middle Income Families
Number of Middle-Income
Births that Will
Participating in Scheme
Number of New Families
Entering Scheme
Total Scheme
Participants
Total Scheme Participants Eligible for Co-Contribution
2013 309205 123682 18857 6286 6286 6286 2014 313070 125228 19093 12650 18935 18935 2015 316983 126793 19331 19094 38029 38029 2016 320945 128378 19573 19332 57361 57361 2017 324957 129983 19818 19574 76935 76935 2018 329019 131608 20065 19819 96754 90468 2019 333132 133253 20316 20066 116820 97884 2020 337296 134918 20570 20317 137137 99108 2021 341512 136605 20827 20571 157708 100347 2022 345781 138312 21087 20828 178536 101601

An Education Bond Co-Contribution Scheme: Estimating the Budgetary Cost
P a g e | 11
Years Average Contribution
Annual Inflow (Personal
Contributions)
Cumulative Increase in Personal
Contributions
Co-contributions
Cumulative Co-
contributions
Balance in Education Savings Products (Pre-
Investment Return)
Investment Earnings (4% real
after tax)
Balance in Education
Savings Products
(Post-Investment
Return)
2013 $350 $2,199,967 $2,199,967 $2,199,967 $87,999 $2,287,965
2014 $350 $6,627,400 $8,827,366 $2,199,967 $2,199,967 $11,115,332 $444,613 $11,559,945
2015 $350 $13,310,142 $22,137,509 $6,627,400 $8,827,366 $31,409,489 $1,256,380 $32,665,868
2016 $350 $20,076,419 $42,213,928 $13,310,142 $22,137,509 $65,607,817 $2,624,313 $68,232,129
2017 $350 $26,927,275 $69,141,203 $20,076,419 $42,213,928 $113,979,444 $4,559,178 $118,538,622
2018 $350 $33,863,766 $103,004,969 $26,927,275 $69,141,203 $176,705,350 $7,068,214 $183,773,564
2019 $350 $40,886,963 $143,891,932 $31,663,799 $100,805,002 $251,765,148 $10,070,606 $261,835,754
2020 $350 $47,997,950 $191,889,882 $34,259,563 $135,064,565 $337,025,054 $13,481,002 $350,506,056
2021 $350 $55,197,825 $247,087,707 $34,687,808 $169,752,373 $430,321,083 $17,212,843 $447,533,926
2022 $350 $62,487,698 $309,575,405 $35,121,405 $204,873,779 $531,662,027 $21,266,481 $552,928,508
Years Number of Total Births
Number of Births to High
Income Families
Number of High-Income Births that
Will Participating
in Scheme
Number of New Families
Entering Scheme
Total Scheme
Participants
Total Scheme
Participants Eligible for
Co-Contribution
2013 309205 61841 9276 3092 3092 3092 2014 313070 62614 9392 6223 9315 9315 2015 316983 63397 9509 9393 18707 18707 2016 320945 64189 9628 9510 28217 28217 2017 324957 64991 9749 9629 37846 37846 2018 329019 65804 9871 9749 47595 44503 2019 333132 66626 9994 9871 57466 48152

An Education Bond Co-Contribution Scheme: Estimating the Budgetary Cost
P a g e | 12
2020 337296 67459 10119 9994 67461 48754 2021 341512 68302 10245 10119 77580 49363 2022 345781 69156 10373 10246 87826 49980
Years Average Contribution
Annual Inflow (Personal
Contributions)
Cumulative Increase in Personal
Contributions
Co-contributions
Cumulative Co-
contributions
Balance in Education
Savings Products
(Pre-Investment
Return)
Investment Earnings (4% real
after tax)
Balance in Education
Savings Products
(Post-Investment
Return)
2013 $350 $1,082,216 $1,082,216 $1,082,216 $43,289 $1,125,505
2014 $350 $3,260,176 $4,342,391 $1,082,216 $1,082,216 $5,467,896 $218,716 $5,686,612
2015 $350 $6,547,575 $10,889,967 $3,260,176 $4,342,391 $15,451,074 $618,043 $16,069,117
2016 $350 $9,876,068 $20,766,035 $6,547,575 $10,889,967 $32,274,045 $1,290,962 $33,565,007
2017 $350 $13,246,167 $34,012,202 $9,876,068 $20,766,035 $56,069,198 $2,242,768 $58,311,966
2018 $350 $16,658,392 $50,670,593 $13,246,167 $34,012,202 $86,925,563 $3,477,023 $90,402,585
2019 $350 $20,113,269 $70,783,862 $15,576,176 $49,588,377 $123,849,262 $4,953,970 $128,803,233
2020 $350 $23,611,333 $94,395,195 $16,853,094 $66,441,471 $165,790,637 $6,631,625 $172,422,262
2021 $350 $27,153,122 $121,548,318 $17,063,757 $83,505,228 $211,685,171 $8,467,407 $220,152,578
2022 $350 $30,739,184 $152,287,502 $17,277,054 $100,782,283 $261,537,191 $10,461,488 $271,998,679

An Education Bond Co-Contribution Scheme: Estimating the Budgetary Cost
P a g e | 13
Government Budget Cost
Budget Cost for Providing Scheme to Low Income Earners
Years Direct Budget Costs (Co-contributions)
Tax Costs
Total Cost for Government
Cumulative Cost for Government
2013 $0 $0 $0 $0
2014 $1,629,606 $0 $1,629,606 $1,629,606
2015 $4,909,189 $0 $4,909,189 $6,538,796
2016 $9,859,374 $0 $9,859,374 $16,398,169
2017 $14,871,435 $0 $14,871,435 $31,269,604
2018 $19,946,147 $0 $19,946,147 $51,215,752
2019 $23,454,687 $0 $23,454,687 $74,670,439
2020 $25,377,477 $0 $25,377,477 $100,047,916
2021 $25,694,695 $0 $25,694,695 $125,742,611
2022 $26,015,879 $0 $26,015,879 $151,758,490
Budget Cost for Providing Scheme to Middle Income Earners
Years Direct Budget Costs (Co-contributions)
Tax Costs
Total Cost for Government
Cumulative Cost for Government
2013 $0 $0 $0 $0
2014 $2,199,967 $0 $2,199,967 $2,199,967
2015 $6,627,400 $0 $6,627,400 $8,827,366
2016 $13,310,142 $0 $13,310,142 $22,137,509
2017 $20,076,419 $0 $20,076,419 $42,213,928
2018 $26,927,275 $0 $26,927,275 $69,141,203

An Education Bond Co-Contribution Scheme: Estimating the Budgetary Cost
P a g e | 14
2019 $31,663,799 $0 $31,663,799 $100,805,002
2020 $34,259,563 $0 $34,259,563 $135,064,565
2021 $34,687,808 $0 $34,687,808 $169,752,373
2022 $35,121,405 $0 $35,121,405 $204,873,779
Budget Cost for Providing Scheme to High Income Earners
Years Direct Budget Costs (Co-contributions)
Tax Costs
Total Cost for Government
Cumulative Cost for Government
2013 $0 $0 $0 $0
2014 $1,082,216 $0 $1,082,216 $1,082,216
2015 $3,260,176 $0 $3,260,176 $4,342,391
2016 $6,547,575 $0 $6,547,575 $10,889,967
2017 $9,876,068 $0 $9,876,068 $20,766,035
2018 $13,246,167 $0 $13,246,167 $34,012,202
2019 $15,576,176 $0 $15,576,176 $49,588,377
2020 $16,853,094 $0 $16,853,094 $66,441,471
2021 $17,063,757 $0 $17,063,757 $83,505,228
2022 $17,277,054 $0 $17,277,054 $100,782,283

An Education Bond Co-Contribution Scheme: Estimating the Budgetary Cost
P a g e | 15
Effects of Co-contribution scheme
Years Annual Budgetary Cost for Government
Cumulative Cost for Government
Annual Private Contributions
Total Balance in Education Savings Products
2013 $0 $0 $4,911,789 $5,108,261
2014 $4,911,789 $4,911,789 $14,796,765 $25,809,487
2015 $14,796,765 $19,708,554 $29,717,091 $72,931,946
2016 $29,717,091 $49,425,645 $44,823,922 $152,339,499
2017 $44,823,922 $94,249,568 $60,119,589 $264,657,053
2018 $60,119,589 $154,369,156 $75,606,451 $410,304,836
2019 $70,694,662 $225,063,818 $91,286,899 $584,591,570
2020 $76,490,134 $301,553,952 $107,163,352 $782,562,665
2021 $77,446,261 $379,000,213 $123,238,261 $999,193,412
2022 $78,414,339 $457,414,552 $139,514,107 $1,234,504,226