Embed Size (px)
DESCRIPTION
Increased Investment and Savings Scenarios. PSB Act 61 Workshop December 1, 2005 Blair Hamilton. Cost estimates and savings projections and are very preliminary Scenarios assume a decision by the end of first quarter and implementation ramp-up beginning mid-year 2006 - PowerPoint PPT Presentation
Citation preview
Increased Investment and
Savings ScenariosPSB Act 61 Workshop
December 1, 2005
Blair Hamilton
Disclaimer
•Cost estimates and savings projections and are very preliminary
•Scenarios assume a decision by the end of first quarter and implementation ramp-up beginning mid-year 2006
•Scenarios are based on current policy direction (no changes in focus, scope or objectives)
•In these scenarios, services and initiatives continue to be focused statewide, but there may be some variance from current projections in geographic or customer group equity – this has not been explored
•No economic screening has been done as part of developing these scenarios
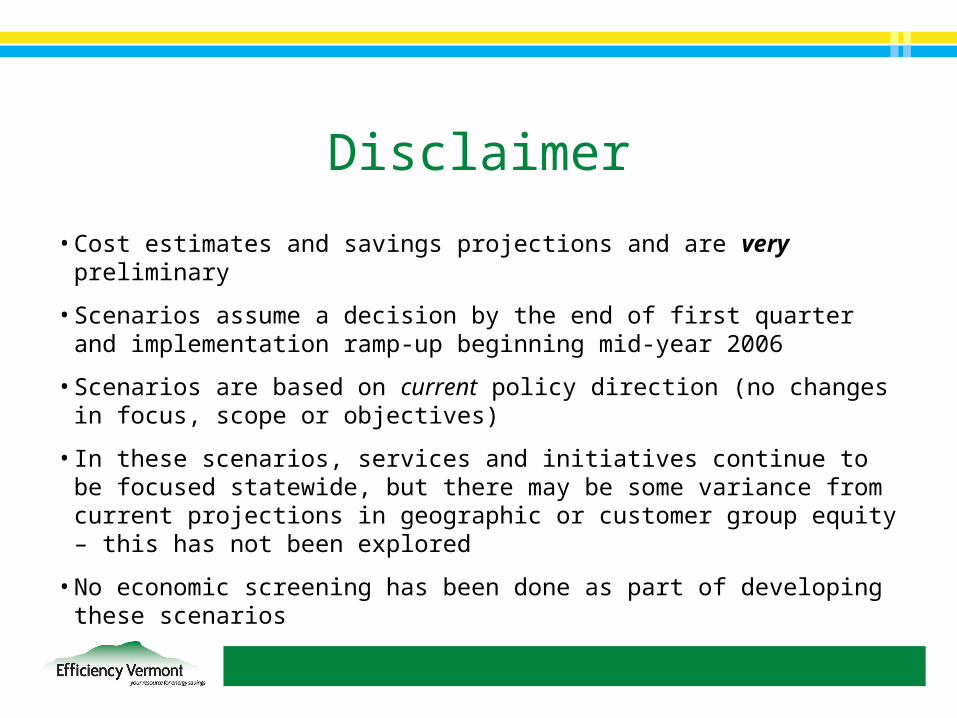
Scenario 1•Ramp-up of existing strategies, services and initiatives•Both more participants and more depth of savings per
participant•Particular emphasis on:
• More discretionary retrofit in existing businesses• More with largest accounts (accounts over 1MW) • More “account management”• More facility operational efficiency / retro-commissioning• CFL sales increased by 25% over current plans• Some targeted refrigerator replacement and electric
water heater fuel switching• Accelerated ramp-up of Home performance with Energy
Star and pool pump initiative• Additional low-income Weatherization units
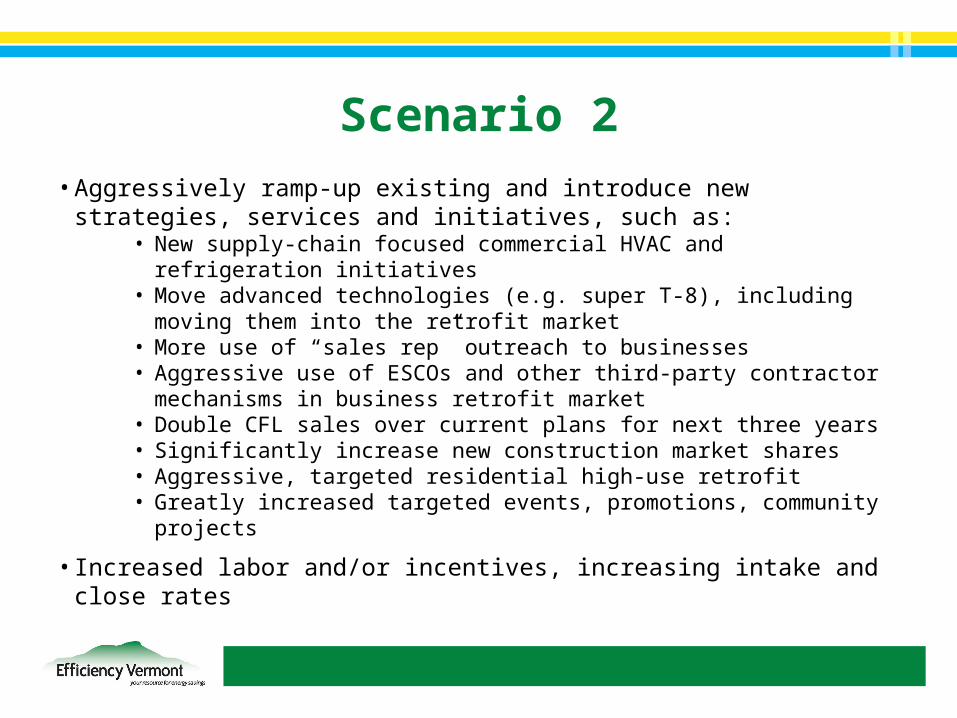
Scenario 2•Aggressively ramp-up existing and introduce new strategies,
services and initiatives, such as:• New supply-chain focused commercial HVAC and refrigeration
initiatives• Move advanced technologies (e.g. super T-8), including moving
them into the retrofit market• More use of “sales rep” outreach to businesses• Aggressive use of ESCOs and other third-party contractor
mechanisms in business retrofit market• Double CFL sales over current plans for next three years• Significantly increase new construction market shares• Aggressive, targeted residential high-use retrofit• Greatly increased targeted events, promotions, community
projects
• Increased labor and/or incentives, increasing intake and close rates

Investment (Million $) 2006 2007 2008 TOTAL
Current EVT Contract $15.8 $16.7 $17.3 $49.8
Scenario 1 Increment $1.5 $3.5 $5.8 $10.7
Scenario 1 Total $17.2 $20.2 $23.1 $60.5
% Increase 9% 21% 33% 22%
Scenario 1
Savings (GWh) 2006 2007 2008 TOTAL
Current EVT Contract 58 68 78 204
Scenario 1 Increment 5 12 25 43
Scenario 1 Total 63 80 103 247
% Increase 9% 17% 33% 21%
ALL VALUES ARE VERY PRELIMINARY ESTIMATES, ±10%
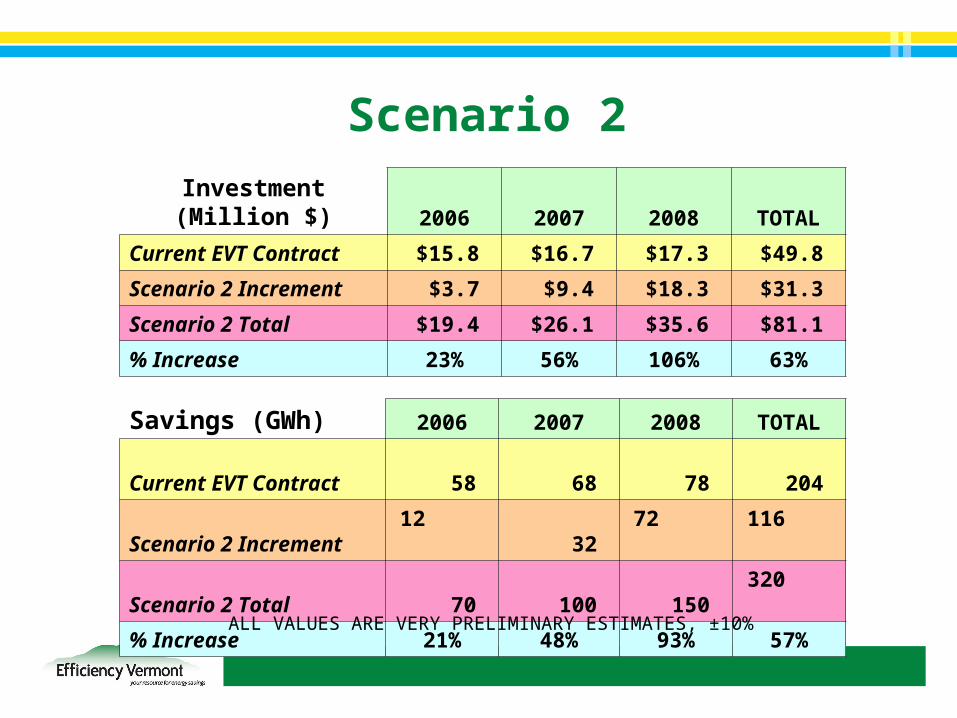
Investment (Million $) 2006 2007 2008 TOTAL
Current EVT Contract $15.8 $16.7 $17.3 $49.8
Scenario 2 Increment $3.7 $9.4 $18.3 $31.3
Scenario 2 Total $19.4 $26.1 $35.6 $81.1
% Increase 23% 56% 106% 63%
Scenario 2
Savings (GWh) 2006 2007 2008 TOTAL
Current EVT Contract 58 68 78 204
Scenario 2 Increment 12 32 72 116
Scenario 2 Total 70 100 150 320
% Increase 21% 48% 93% 57%
ALL VALUES ARE VERY PRELIMINARY ESTIMATES, ±10%
4,900
5,000
5,100
5,200
5,300
5,400
5,500
5,600
5,700
5,800
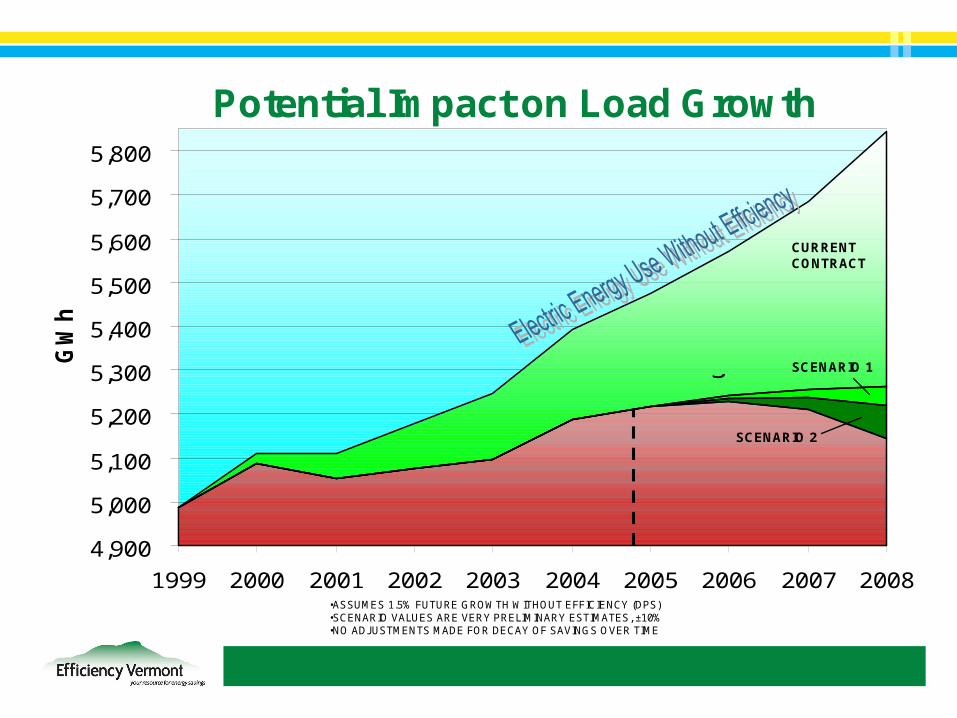
1999 2000 2001 2002 2003 2004 2005 2006 2007 2008
GW
h Efficiency Savings
Actual Statewide Electric Use Projections
CURRENT CONTRACT
SCENARIO 1
SCENARIO 2
Potential Impact on Load Growth
•ASSUMES 1.5% FUTURE GROWTH WITHOUT EFFICIENCY (DPS)•SCENARIO VALUES ARE VERY PRELIMINARY ESTIMATES, ±10%•NO ADJUSTMENTS MADE FOR DECAY OF SAVINGS OVER TIME
0.0%
2.0%
4.0%
6.0%
8.0%
10.0%
12.0%
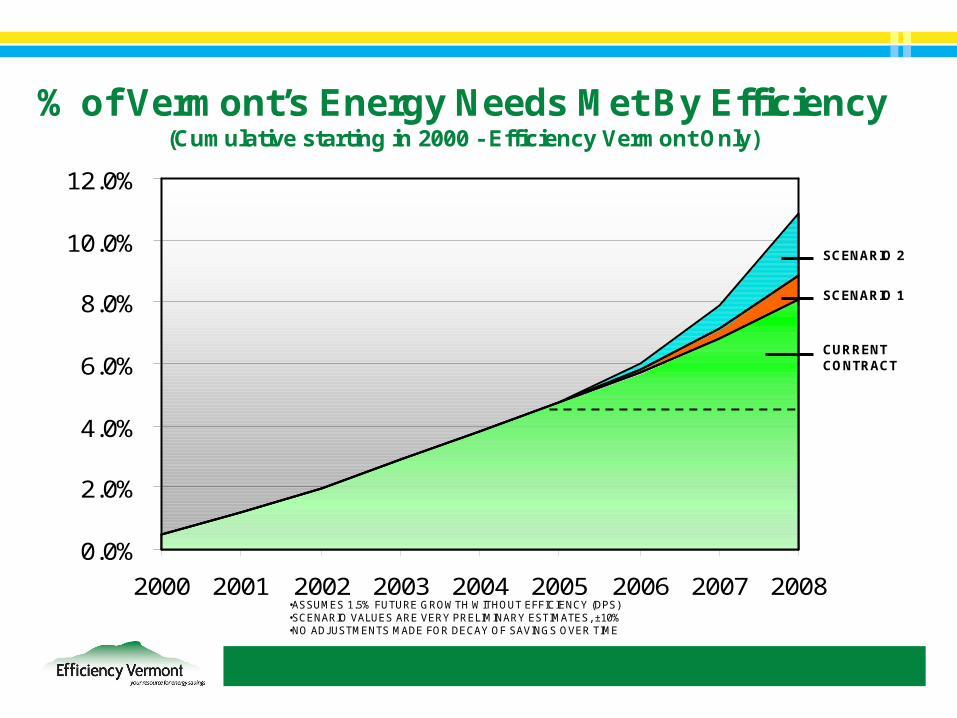
2000 2001 2002 2003 2004 2005 2006 2007 2008
% of Vermont’s Energy Needs Met By Efficiency(Cumulative starting in 2000 - Efficiency Vermont Only)
CURRENT CONTRACT
SCENARIO 1
SCENARIO 2
•ASSUMES 1.5% FUTURE GROWTH WITHOUT EFFICIENCY (DPS)•SCENARIO VALUES ARE VERY PRELIMINARY ESTIMATES, ±10%•NO ADJUSTMENTS MADE FOR DECAY OF SAVINGS OVER TIME