Embed Size (px)
Citation preview

RESPONSE TO INTERIM REPORT
Appendix A:
Australian Bankers’ Association: International
Australian Bankers’ Association: International
comparability of capital ratios of Australia’s major
banks
Australian Bankers’ Association: International
comparability of capital ratios of Australia’s major
PwC
August 2014


www.pwc.com.au
AustralianBankers’Association:Internationalcomparability ofcapital ratios ofAustralia’s majorbanks
Australian Bankers'
Association
August 2014

Australian Bankers' AssociationPwC 2
Contents
1 Overview 3
1.1 Purpose 3
1.2 Background 3
1.3 Overall results 3
2 Our methodology 5
2.1 What is the best way to measure capital ratios on a consistent basis across banks? 5
2.2 Which banks or groups of banks should be used for comparison purposes? 6
2.3 What is the appropriate balance date to use? 6
2.4 Approaches to measuring bank capital ratios 7
2.5 Total capital ratio 7
2.6 Leverage ratio 7
3 Summary of results 8
3.1 Estimating Australian major bank capital ratios 8
3.2 Australian banks’ Internationally comparable CET1 ratios 9
3.3 Where do Australian major banks sit within an international peer group? 10
3.4 How do Australian major banks compare to advanced banks in other jurisdictions? 12
4 Identification and analysis of differences in calculating CET1 ratios 16
4.1 Identifying differences and areas of judgement 16
4.2 Explanation of the key differences identified in Figure 1 (Impact of differences in theapplication of the Basel Framework) 18
Appendix A Australian major banks - detailed analysis of differences between Australian CET1(APRA) and International comparable CET1 ratio 20
Appendix B Summary of differences and related adjustments 23
Appendix C Areas where APRA’s approach to calculating CET1 differs from RCAP (Australia) andother adjustments for international comparability 25
Appendix D Areas of difference between Australia and peer group jurisdictions (refers to section3.4) 28
Appendix E Analysis of international jurisdictions RCAPs 30
Appendix F Extracts of rules pertaining to differences 33
Appendix G Names of Australian banks and jurisdictional peers used in this analysis 52
Appendix H Glossary 53
Appendix I Bibliography 55

Australian Bankers' AssociationPwC 3
1 Overview
1.1 PurposeThe Australian Bankers’ Association (ABA) has engaged PwC Australia to measure current levels of capitalheld by the four major Australian banks under the Basel Committee on Banking Supervision (BCBS) BaselFramework1 and in relation to capital held by banks in other jurisdictions. We have done this usingconfidential data supplied by Australian banks to the ABA, together with input from PwC banking specialistsboth here in Australia and in overseas markets. This reports sets out our findings.
1.2 BackgroundCapital is fundamental to all businesses. This is particularly the case in banking, where the core businesses ofborrowing and lending, payments, and trading all depend on capital as a marker of confidence to customers,counterparties and investors, and as a buffer for losses and unexpected events.
Reflecting the complexity of banking, the calculation and valuation of capital and estimation of capital ratiosin banks is also very complex. This especially reflects the fact that the calculation of many elements of bankcapital ratios requires judgment about risk, and so often a high degree of subjectivity is also involved.
Complexity also arises from the efforts by global regulators over the last three decades to ensure minimumstandards for the amount of capital which banks are required to hold are calculated and applied, to the extentpossible, on a consistent basis across countries. However, ultimately the regulation of banks is a matter ofnational sovereignty and so the global standards explicitly allow for national discretion in the way the rulesare applied. In addition there have been many changes to the Basel Framework in recent years and countriesare proceeding at different speeds in the application of these changes. Further, different countries adoptdifferent accounting standards and this is another source of complexity and difference in relation to thecalculation of capital, albeit that there has been significant convergence in recent years.
Finally, while capital is an important measure of balance sheet strength, it is only one measure of overall riskfor a bank and always needs to be interpreted in a wider context. For instance, systemic risks, levels of creditconcentration or legal uncertainty may vary significantly between banks and across different countries.
1.3 Overall resultsIt is clear to us that the four Australian major banks are well capitalized relative to both the global standardsand by comparison with banks regulated in many other jurisdictions. This is widely agreed.
Based on the data provided to us by the Australian banks, our best judgment is that, on average, the fourAustralian banks are at or above the 75th percentile of bank capital relative to the most appropriatecomparator set of global banks.
Some Australian major banks are unambiguously in the top quartile in terms of capital, others are closer tothe 75th percentile but are still well above the median. Our overall summary calculation gives a weightedaverage Common Equity Tier 1 (CET1) ratio in the range of 11.5 per cent to 12.5 per cent, and as best as wecan judge this is at or above the 75th percentile (see page 10). The estimates of risk weighted assets have ajudgemental component and this, in context of Figure 1 (see page 8) explains our conclusion that a range isappropriate.
Hence, our best judgment is that, on average, the Australian banks are at or above the 75th percentile of bankcapital relative to the most appropriate comparator set of global banks.
We have not been asked to consider what levels of capital are appropriate.
1 Basel Framework includes Basel II, Basel 2.5 and Basel III and refers a number of documents. Refer to the BCBS, Regulatory Consistency Assessment
Programme (RCAP): Assessment of Basel III regulations – Canada, BIS, 2014, Annex 3: List of capital standards under the Basel Framework used forassessment.

Overview
Australian Bankers' AssociationPwC 4
PwC’s role
Independence and objectivityThis report is not an audit. In compiling it we have issued instructions and data templates, via the ABA, tothe participating banks, conducted analytical review over the data produced and through the ABA challengedindividual banks to ensure that as far as possible the adjustments have been prepared fairly and reasonablyand on a consistent basis. We have also compared the banks’ results to externally reported information suchas Pillar 3 reports, analyst reports and other relevant national and international information.
The views expressed in the report are those of PwC.
Use of our ReportThis report has been prepared for the sole purpose of supporting the ABA in preparing its second roundsubmission to the Financial System Inquiry 2014 (FSI). This report must not be used for any other purposeincluding that it may not be attached to third party submissions to the FSI.
Declaration of InterestsIn Australia, PwC operates across all financial services sectors, and works with a high proportion of globaland domestic financial institutions. The nature of our business requires the highest levels of objectivity andindependence, and we have sought to reflect those standards in this document.
Given that this report has been sought by the ABA in the context of the second-round submission to the FSI,we disclose that we have advised a number of other clients, both formally and informally, on the preparationsfor their previous submissions to the FSI. We also note that PwC, both domestically and globally, hasbenefitted from the strong growth in the financial services sector in recent decades, including through thegrowing global complexity of bank capital and other regulations.
PwC’s submission to the FSI (dated 31 March 2014) can be found at:http://www.pwc.com.au/industry/financial-services/publications/funding-australias-future.htm. PwC isalso providing a full-time professional secondee to the FSI during 2014, at no cost to the Inquiry orGovernment.
We also note that we provide advice to all the Australian banks discussed in this report. We are the externalauditor of the ABA and two of the Australian major banks.

Australian Bankers' AssociationPwC 5
2 Our methodology
The objective of this study is to assess the current capital ratios of Australia’s four major banks (“the majors”)using the Basel Framework so that they can be compared on a like-for-like basis with banks in otherjurisdictions. It is therefore very important to be precise about the basis of these comparisons. This involvesanswering three questions:
What is the best way to measure capital ratios on a consistent basis across banks?
Which banks or groups of banks should be used for comparison purposes?
What is the appropriate balance date to use?
2.1 What is the best way to measure capital ratios on aconsistent basis across banks?
At the ABA’s request, our study is concerned with the Basel III CET1, on a fully implemented basis (i.e.applying Basel III capital requirements as if they applied in full already). We have considered three ways tomeasure CET1 for these purposes:
1 Measurement using applicable national rules – e.g. CET1 (APRA), CET1 (UK) etc.
As noted above, national regulators have discretion in relation to the application of the Basel Frameworkin their jurisdiction and so this measure reflects full implementation of the Basel Framework in thatjurisdiction.
This measure is appropriate for answering a question like “how would the Australian major banks bemeasured under the Canadian rules and how do they compare to the Canadian banks on that basis?” Inthis instance we would refer to the calculation as CET1 (Canada).
2 Measurement using Basel Framework rules - CET1 (Basel Framework)2
This refers to the application of the rules as set out exactly in the Basel Framework (before any nationaldiscretion is applied). This methodology seeks to quantify all differences which have been highlighted inthe BCBS Regulatory Consistency Assessment Programme report (RCAP) for a particular jurisdiction toproduce a comparable set of ratios. For Australia, the RCAP report was published in March 20143. Thisratio is in principle similar to the “BCBS internationally harmonised” ratios which are self-reported bymany banks, albeit with a greater range of adjustments (as identified by the March 2014 RCAP).
3 Measurement using Basel Framework rules and further adjusting for national regulatory treatmentswhich would impact on how those rules are implemented in that jurisdiction by comparison tointernational norms - Internationally comparable CET1. This refers to a methodology which startswith CET1 (Basel Framework) and further adjusts for other recognised differences (such as riskmodelling parameters and national discretions) which are applied at a local level by comparison toaverage international settings. This is more judgemental and harder to quantify precisely, however, theBCBS has published information which allows some level of “normalisation”.
Reflecting this more complete treatment, we believe that the Internationally comparable CET1measure is generally a preferable measure to the CET1 (Basel Framework) measure. We use thismeasure for answering a question like “where do the Australian banks sit in comparison to banks drawnfrom many different countries?”
Refer to section 4 and appendix B for further discussion about individual adjustments and the degree ofjudgement and subjectivity involved in calculating them.
2 BCBS, Basel III: A global regulatory framework for more resilient banks and banking systems, BIS, December 2010 (rev. June 2011)
3 BCBS, Regulatory Consistency Assessment Program (RCAP): Assessment of Basel III regulations - Australia, BIS, March 2014

Our methodology
Australian Bankers' AssociationPwC 6
2.2 Which banks or groups of banks should be used forcomparison purposes?
One way to address this would be to consider the question: “how would the Australian banks be measuredunder the Canadian rules and how do they compare to the Canadian banks on that basis?”. To answer this,we have chosen six jurisdictions - Canada, Europe (using Germany as a proxy), United Kingdom,Switzerland, Singapore and Japan. We have chosen these six jurisdictions because they represent a relativelywide spread of countries across the globe broadly relevant to Australia, and which are well advanced in theimplementation of Basel III, including having had an RCAP review undertaken which gives an independentassessment of the extent of national discretion. We have not chosen the US because the US banking system isgenerally less advanced in applying the full Basel Framework. Further jurisdictions could be examined if theABA believes that would be useful.
In order to answer the different question: “where do the Australian banks sit in comparison to banks drawnfrom many different countries?”, we have chosen the published Basel III ratios for Global SystemicallyImportant Banks (G-SIBs)4 and Domestic Systemically Important Banks (D-SIBs)5 from the six selectedjurisdictions noted above.
The FSI Interim Report6 uses BCBS data7 covering 102 banks, from 27 countries, including small banks(down to Euro 3bn of capital) as well as large banks, and with a wide range of capital ratios (from 2.5 per centto 20.2 per cent). Without access to the underlying data for the individual banks in the survey, we (PwC)need to be cautious in making judgements. However, from our understanding of global banking there is arisk that the wide range of capital ratios is driven by smaller banks in less relevant jurisdictions. We also notethat the data is now over one year old. We would certainly welcome the opportunity to have access to the fullpopulation of that BCBS data.
It is also important to note that the data provided by the Australian major banks included in the BCBS studyis not on a strictly comparable basis because it only adjusts for the capital differences and does not adjust forthe majority of the risk weighted asset differences noted in this report.
While our study uses data from a smaller group of banks by comparison to the FSI Interim Report, we aresatisfied that that our sample represents an appropriate group of peer banks against which to compare theAustralian major banks.
Our study has a narrower range of observed Internationally comparable CET1 ratios, and therefore does notinclude banks with extremely high or extremely low capital ratios, observed in the BCBS larger population.Nevertheless the median CET1 ratio in the BCBS study is 10 per cent, which is very similar to the median inour chosen group of 10.4 per cent. The 75th percentile of the BCBS group is 11.7 percent by comparison to 11.4per cent for this study.
Refer to appendix G for a detailed listing of the Australian banks and jurisdictional peers used in thisanalysis.
2.3 What is the appropriate balance date to use?We have chosen to carry out this study using the most recently available data of capital information. We havecollected information from the Australian banks as at their most recent half year or year-end balance date.
We have also collected data from international peer banks using the most recently available information sothat the comparisons are on a like-for-like basis.
4 BCBS, Global systemically important banks: updated assessment methodology and the higher loss absorbency requirement, BIS, July 2013
5 BCBS, A framework for dealing with domestic systemically important banks, BIS, October 2012
6 FSI, The Financial System Inquiry 2014 (Murray): Interim Report, Australian Government, chapter Post –GFC Regulatory Response, Stability,section.3-36 to 3-37, July 2014
7 BCBS, Basel III Monitoring Report, Statistical Annex: Table A3, BIS, March 2014

Our methodology
Australian Bankers' AssociationPwC 7
2.4 Approaches to measuring bank capital ratiosThe Basel Framework adopts a standard approach to calculating risk weighted assets based oninternationally relevant criteria. However it also acknowledges that larger, more sophisticated banks, withbetter quality risk data and modelling expertise are able to produce their own risk weighting factors whichbetter reflect how they manage risks. Under the Basel Framework such banks can apply to their nationalregulator to use their own models for producing risk weighted assets. Banks which have been accredited touse their own models for calculating risk weighted assets are referred to as advanced banks. There are in turntwo Internal Ratings-based (IRB) approaches to credit risk; the Advanced (AIRB) and Foundation (FIRB).We adopt this terminology in this report for banks which have received accreditation from AustralianPrudential Regulation Authority (APRA) to use their own risk models. The four Australian major banks applythe AIRB approach for credit risk to the vast majority of their portfolios.
In implementing the Basel Framework, national regulators are expected to build conservatism into theirrespective financial systems by including buffers in the risk assessments under Pillar 1 and to address bankspecific risks by requiring banks to operate above the BCBS minimum required capital ratios under Pillar 2.The approach taken will impact the comparability of reported capital ratios both between banks with in acountry and between countries.
2.5 Total capital ratioAs instructed by the ABA, this study has focused on CET1. Wider measures of capital (Tier 1 and Total Capitalratios) are also required to be monitored and managed under the Basel Framework.
Comparative assessments of these wider ratios for Australian banks on a fully implemented Basel III basisare complicated by the fact that different jurisdictions are at different stages in confirming the rules whichwould apply to different bank capital instruments in the event of a bank approaching insolvency. InAustralia, for instance, banks have only recently started the process of replacing their Basel II instrumentswith new instruments compliant with the Basel III rules in this regard. The fact that both confirmation ofthe rules and consequent implementations are at such different stages in different jurisdictions makescomparisons other than for CET1 ratios much more challenging and beyond the scope of this report.
2.6 Leverage ratioThe Leverage ratio is also required to be calculated and managed under Basel III from 2018 onwards. This isan alternative way of representing capital levels and may show a different picture by comparison to CET1.APRA has not yet issued their detailed rules governing how the Leverage ratio should be calculated and it hasnot therefore been practical to compare Leverage ratios for Australian banks by comparison to their globalpeers in this study.

Australian Bankers' AssociationPwC 8
3 Summary of results
3.1 Estimating Australian major bank capital ratiosFigure 1 below sets out our analysis of the weighted average CET1 ratio for the four Australian major banksexpressed on a CET1 (APRA), CET1 (Basel Framework) and an Internationally comparable CET1basis, based on the latest available information. The table also shows a similar analysis undertaken by APRA,based on earlier information, which was included in APRA’s submission to the FSI8.
Figure 1: Impact of differences in the application of the Basel Framework on CET1(APRA) ratios
PwC Study, August2014
APRA submission tothe FSI, March 2014
(NoteD)
Impacton CET1
ratio(bps)
Weightedaverageratio (%)
Impacton CET1
ratio(bps)
Weightedaverageratio (%)
CET1 (APRA) ratio (Note A) 8.76 8.28
Adjustments to align with Basel III
Add back capital deductions not requiredunder Basel III
1 109 113
Reduce risk weightings for credit risk(residential mortgages and specialised lendingexposures)
2 96 61
Reverse capital charge for interest rate riskin the banking book
3 30 28
Adjustment for less conservative APRAstandards
4 (8) (22)
Standardised risk weights 5 12
Total adjustment 240 180
Actual CET1 uplift (Note B) 2.79 1.89
CET1 (Basel Framework) ratio (Note C) 11.55 10.17
Additional areas where credit risk estimatesare more conservative in Australia bycomparison to norms adopted in otherjurisdictions
6 114 n/a
Internationally comparable CET1 ratio 12.69
Source: Individual bank data, PwC analysis, 2014. Roundings have been applied above and throughout this report.Note A: CET1 ratio (APRA) per the PwC study is based on the most recent half-year or year-end balance date, whereas
APRA's figures are for earlier dates.Note B: The items are not additive as the impact on the CET1 ratio of each item is calculated independently of the
impact of the other items.Note C: Includes RCAP differences.Note D: Refer to section 4.2 for explanation on adjustments.
Adjustments to risk weighted assets (items 2 and 6) by their nature are more subjective, and hence the rangeof 11.5 per cent to 12.5 per cent expressed in our overall conclusion.
8APRA, Financial System Inquiry: Submission, APRA, March 2014

Summary of results
Australian Bankers' AssociationPwC 9
The other main points to note are:
our preferred measure of capital Internationally comparable CET1, shows the four major Australian bankshave a weighted average ratio of 12.69 per cent;
a number of the uplift factors from CET1 (APRA) to CET1 (Basel Framework) in the PwC and APRAcalculations are broadly comparable, the main exception being allowance for those factors where APRAstandards are less conservative. We expect these differences are likely to be explained by this study usingmore recent data (and possibly a wider group of banks being used by APRA);
our calculation of the Internationally comparable CET1 ratio shows a further 114bp uplift for the fourmajor banks to take the weighted average ratio to 12.69 per cent.
As usual, we need to avoid a sense of false precision and interpret these numbers in the context of thesubjectivity and judgements involved. We believe that, in total, the analysis should best be interpreted as aweighted average CET1 ratio in the range of 11.5 per cent to 12.5 per cent for Australian major banks.
3.2 Australian banks’ Internationally comparableCET1 ratios
Figure 2 summarises the data from Figure 1 above, for the four Australian banks in our study.
Whilst there is an uplift in the capital ratio for all the banks when measured on an Internationallycomparable basis, the quantum of the uplift varies from bank to bank as it is dependent on the individualbanks’ own particular circumstances including asset mix and risk appetite, as well as modelling assumptionsand data.
Figure 2: Major banks’ Internationally comparable CET1 ratios
Source: Individual bank data, PwC analysis, 2014.Note: See definitions in section 2.1.
0.00%
2.00%
4.00%
6.00%
8.00%
10.00%
12.00%
14.00%
16.00%
ANZ CBA NAB WBCCET1 (APRA) ratio CET1 (Basel Framework) ratio Internationally comparable CET1 ratio
12.19%
13.98%
11.67%
13.07%

Summary of results
Australian Bankers' AssociationPwC 10
3.3 Where do Australian major banks sit within aninternational peer group?
The most objective way to answer this question available to PwC is to compare our Internationallycomparable CET1 ratio for the four Australian major banks with the closest equivalent data for a peer groupof overseas banks, taking into account known differences in those offshore banks.
Figure 3: International peer group Internationally comparable CET1 ratios
(Refer to the following page for notes)
Rank Bank (Note 3)Total assets
(AUD bn) Date
Internationallycomparable
CET1 (Note 2)
1 Nordea (Note 4) 983 30.06.2014 15.82%
2 Commonwealth Bank of Australia 791 30.06.2014 13.98%
3 UBS AG 1,175 30.06.2014 13.50%
4 Rabobank Group 1,040 31.12.2013 13.50%
5 Danske Bank 638 30.06.2014 13.20%
6 Westpac Banking Corporation 729 31.03.2014 13.07%
7 Intesa Sanpaolo (Note 4) 909 30.06.2014 12.99%
8 State Street Corporation 299 30.06.2014 12.80%
9 DBS Group Holdings Ltd. 355 30.06.2014 12.20%
10 Australia and New Zealand Banking Group 738 31.03.2014 12.19%
11 National Australia Bank Ltd. 846 31.03.2014 11.67%
12 Deutsche Bank AG (Note 4) 2,418 30.06.2014 11.64%
13 HSBC Holdings Plc. (Note 4) 2,920 30.06.2014 11.43%
14 Oversea-Chinese Banking Corporation Limited 296 30.06.2014 11.30%
15 Natixis (owned 70% by Groupe BPCE) 795 30.06.2014 11.20%
16 Groupe BPCE 1,631 30.06.2014 11.10%
17 Lloyds Banking Group PLC 1,531 30.06.2014 11.10%
18 China Construction Bank (Note 1) 2,800 31.03.2014 11.10%
19 Industrial and Commercial Bank of China Limited(Note 1)
3,424 31.03.2014 10.90%
20 Standard Chartered Bank (Note 4) 732 30.06.2014 10.87%
21 Citigroup 2,025 30.06.2014 10.60%
22 Societe Generale (Note 4) 1,920 30.06.2014 10.51%
23 ING Group 1,409 30.06.2014 10.50%
24 Morgan Stanley 876 31.12.2013 10.50%
25 Mitsubishi UFG 2,657 31.03.2014 10.40%
26 UniCredit (Note 4) 1,217 30.06.2014 10.40%
27 BNP Paribas (Note 4) 2,768 30.06.2014 10.30%
28 Sumitomo Mitsui Financial Group 1,706 31.03.2014 10.30%
29 Royal Bank of Scotland Group PLC 1,834 30.06.2014 10.10%
30 Wells Fargo 1,695 30.06.2014 10.10%
31 Barclays PLC (Note 4) 2,385 30.06.2014 10.04%
32 Bank of Communications (Note 1) 1,037 31.03.2014 10.04%
33 Banco Bilbao Vizcaya Argentaria 896 30.06.2014 10.00%
34 Bank of New York Mellon 425 30.06.2014 10.00%
35 Canadian Imperial Bank of Commerce 390 30.04.2014 10.00%
36 Credit Agricole S.A 2,204 30.06.2014 9.90%
37 Bank of America 2,302 30.06.2014 9.90%
38 JP Morgan Chase 2,672 30.06.2014 9.80%
39 Goldman Sachs 912 31.12.2013 9.80%

Summary of results
Australian Bankers' AssociationPwC 11
Rank Bank (Note 3)Total assets
(AUD bn) Date
Internationallycomparable
CET1 (Note 2)
40 Bank of Nova Scotia 778 30.04.2014 9.80%
41 Royal Bank of Canada 881 30.04.2014 9.70%
42 Bank of Montreal 572 30.04.2014 9.70%
43 Bank of China (Note 1) 2,621 31.03.2014 9.58%
44 Credit Suisse Group 1,066 30.06.2014 9.50%
45 Agricultural Bank of China (Note 1) 2,658 31.03.2014 9.48%
46 Commerzbank AG 846 30.06.2014 9.40%
47 Toronto Dominion Bank 881 30.04.2014 9.20%
48 China Merchants Bank (Note 1) 764 31.03.2014 9.09%
49 Banco do Brasil 674 30.06.2014 8.77%
50 National Bank of Canada 191 30.06.2014 8.70%
51 Mizuho FG (Note 1) 1,842 31.03.2014 8.60%
52 China Minsheng Banking Corporation (Note 1) 602 31.03.2014 8.50%
Source: Individual bank data, PwC analysis 2014.Note 1: CET1 for Chinese banks - Calculated in accordance with the Administrative Measures for the Capital of
Commercial Banks (Provisional) which is used as the comparable proxy for comparison to the CET1 (fully-loaded).
Note 2: Recalculated for Australian major banks to adjust for RCAP and other differences.Note 3: The list of banks comprises of global banks with total assets of over A$ 600bn, G-SIBs published by the
Financial Stability Board in November 2011 and November 2013, D-SIBs which have been announced by localregulators (Canada, Singapore and Switzerland) and which have disclosed fully implemented Basel III capitaladequacy ratios or sufficient public disclosure for a comparable estimate. Adequate public disclosure wasunavailable for Banco Santander, Banque Populaire CdE, United Overseas Bank, Raiffeisen, Zurich CantonalBank, Banque Cantonale Vaudoise, Industrial Bank, Shanghai Pudong Development Bank, China CITIC Bankas at the date of this report.
Note 4: Foreseeable dividend deducted in reported fully-loaded CET1 has been added back to obtain the Internationallycomparable CET1 ratio. See appendix D for further details.
Note 5: There are other potentially applicable adjustments for some international banks which are not included abovedue to insufficient available information.
In interpreting this chart, please note that we have been able to drill into the data for the Australian banks toa much greater degree than we have for the offshore comparator group. Nonetheless with proper allowancefor these uncertainties, we believe that the data as set above sustains the conclusion that, on average, theAustralian banks are at or above the 75th percentile of bank capital relative to the most appropriatecomparator set of global banks. This conclusion would be sustained even if one takes the lower end ofour 11.5 per cent - 12.5 per cent estimated range.

Summary of results
Australian Bankers' AssociationPwC 12
3.4 How do Australian major banks compare toadvanced banks in other jurisdictions?
In this section we apply applicable national rules to the Australian banks for the six jurisdictions identified insection 2.2. The principle differences between Australia and the jurisdictions below are summarised inappendix D.
We have noted for information purposes the expected levels of CET1 which may be required followingimplementation of domestic systemically important banks (D-SIBs) frameworks. The expected level of CET1post implementation has been added to each jurisdiction graph. It should be noted that in some cases theCET1 ratios are based on recommendations or preliminary guidance. In Australia, APRA’s D-SIB frameworkincludes a 1 per cent buffer (to make an 8 per cent expected CET1 ratio, inclusive of the capital conservationbuffer of 2.5 per cent).
3.4.1 CanadaReflecting the analysis in Appendix D and Appendix E, we have not identified any adjustments that need tobe made to the Internationally comparable CET1 ratio for the Australian banks in calculating their CET1(Canada) ratio.
However, when comparing to banks in Canada, account needs to be taken of structural differences in the wayLenders Mortgage Insurance (LMI) works. In Canada, mortgages may be insured with the Canada Mortgageand Housing Association, which is fully guaranteed by the Canadian government and are afforded the zerorisk weight of the sovereign. The Canadian regulator also allows zero risk weights where a mortgage iscomprehensively insured by a private sector mortgage insurer that has a backstop guarantee provided by theCanadian government. In Australia, LMI insurance is not taken into account by IRB banks when modellingrisk weights for residential mortgages that are insured. Given that a substantial number of Canadianmortgages are LMI insured, it follows that the capital ratios for Canadian banks are not directly comparableto those of the Australian banks. This is a structural difference which is not appropriate to adjust for in thiscomparative study.
Figure 4: Australian and Canadian banks on a CET1 (Canada) basis
Source: Individual bank data, PwC analysis, 2014.Refer to appendix G for abbreviated terms.
0.00%
2.00%
4.00%
6.00%
8.00%
10.00%
12.00%
14.00%
16.00%
CBA WBC ANZ NAB CIBC BNS BMO RBC TD
CE
T1
rati
o
Australia Canada Min (inc buffers)

Summary of results
Australian Bankers' AssociationPwC 13
3.4.2 GermanyReflecting the analysis in Appendix D and Appendix E, we noted the following adjustment that needs to bemade to the Internationally comparable CET1 ratio for the Australian banks in calculating their CET1(Germany) ratio. Foreseeable dividends are deducted from capital when calculating their CET1 ratio, thisreduces the capital ratio. In calculating the CET1 (Germany) ratio for Australian banks, a similar adjustmenthas been applied to reflect the dividend declared or expected out of current period earnings.
Figure 5: Australian and German banks on a CET1 (Germany) basis
Source: Individual bank data, PwC analysis, 2014.Refer to appendix G for abbreviated terms.
3.4.3 United Kingdom (UK)Reflecting the analysis in Appendix D and Appendix E, we noted the following adjustments that need to bemade to the Internationally comparable CET1 ratio for the Australian banks in calculating their CET1 (UK)ratio:
Deduct foreseeable dividends from the capital base (reduces capital ratio);
Apply a 45 per cent LGD floor to sovereign exposures (reduces capital ratio); and
Apply the supervisory slotting approach (with BCBS defined risk weights) to a portion of the specialisedlending portfolio (reduces capital ratio).
Figure 6: Australian and UK banks on a CET1 (UK) basis
Source: Individual bank data, PwC analysis, 2014.Refer to appendix G for abbreviated terms.
0.00%
2.00%
4.00%
6.00%
8.00%
10.00%
12.00%
14.00%
CBA WBC ANZ DBK NAB CBK
CE
T1
rati
o
Australia Germany Min (inc buffers)
0.00%
2.00%
4.00%
6.00%
8.00%
10.00%
12.00%
14.00%
CBA HSBC ANZ WBC LLOY SCB NAB RBS BARC
CE
T1
rati
o
Australia UK Min (inc buffers)

Summary of results
Australian Bankers' AssociationPwC 14
3.4.4 SingaporeReflecting the analysis in Appendix D and Appendix E, we noted the following adjustment that needs to bemade to the Internationally comparable CET1 ratio for the Australian banks in calculating their CET1(Singapore) ratio.
The supervisory slotting approach for Specialised Lending (with BCBS defined risk weights) is applied to aportion of the specialised lending portfolio, this reduces the capital ratio. In calculating the CET1 (Singapore)ratio for Australian banks, a similar adjustment has been applied to the specialised lending portfolio.
As noted in section 4.1.2, there are structural differences between Australia and Singapore in relation tomortgages.
Figure 7: Australian and Singaporean banks on a CET1 (Singapore) basis
Source: Individual bank data, PwC analysis, 2014.Refer to appendix G for abbreviated terms.
3.4.5 SwitzerlandReflecting the analysis in Appendix D and Appendix E, we have not identified any adjustments that need tobe made to the Internationally comparable CET1 ratio for the Australian banks in calculating their CET1(Swiss) ratio.
Figure 8: Australian and Swiss banks on a CET1 (Swiss) basis
Source: Individual bank data, PwC analysis, 2014.Refer to appendix G for abbreviated terms.
0.00%
2.00%
4.00%
6.00%
8.00%
10.00%
12.00%
14.00%
CBA DBS WBC ANZ NAB OCBC
CE
T1
rati
o
Australia Singapore Min (inc buffers)
0.00%
2.00%
4.00%
6.00%
8.00%
10.00%
12.00%
14.00%
16.00%
CBA UBS WBC ANZ NAB Credit Suisse
CE
T1
rati
o
Australia Switzlerland Min (inc buffers)

Summary of results
Australian Bankers' AssociationPwC 15
3.4.6 JapanReflecting the analysis in Appendix D and Appendix E, we have not identified any adjustments that need tobe made to the Internationally comparable CET1 ratio for the Australian banks in calculating their CET1(Japanese) ratio.
According to the BCBS’s progress report on Basel III implementation (April 2014), a D-SIB approach is stillbeing developed.
Figure 9: Australian and Japanese banks on a CET1 (Japanese) basis
Source: Individual bank data, PwC analysis, 2014.Refer to appendix G for abbreviated terms.
0.00%
2.00%
4.00%
6.00%
8.00%
10.00%
12.00%
14.00%
16.00%
CBA WBC ANZ NAB MUFG SMTH
CE
T1
rati
o
Australia Japan

Australian Bankers' AssociationPwC 16
4 Identification and analysis ofdifferences in calculatingCET1 ratios
4.1 Identifying differences and areas of judgement
4.1.1 Overall approach to identifying differences in CET1 ratio calculationsWe identified differences in approach to implementing the Basel Framework from a variety of sources:
a The BCBS (March 2014) Regulatory Consistency Assessment Programme (RCAP), Assessment ofBasel III regulations – Australia, which identified:
i. twenty-seven areas where APRA was considered to be more conservative than the Basel Framework(not all of these were considered to be material differences), and
ii. three areas where APRA was considered to be (potentially) materially less conservative than theBasel Framework.
b RCAP assessment reports issued by the BCBS for other countries; Canada, Brazil, China, Switzerland,Singapore, European Union, Japan and the United States (all conducted between October 2012 andJune 2014).
c BCBS’ thematic study9 which analysed risk weighted assets for credit risk in the banking book (this isdiscussed in section 4.1.2. below).
d We also researched literature, considered other methods for calculating capital adopted by ratingagencies and consulted the PwC international network. The PwC international network also assisted usin gaining an understanding of the nature of differences identified in their jurisdictions, the overallapproach adopted by their respective regulators in implementing the Basel Framework and relevantstructural aspects of their banking industry.
The full list of identified differences was categorised as follows:
Category A – RCAP (Australia) findings where APRA is considered to be more conservative than theBasel Framework. Some of these adjustments are not applicable to the CET1 ratio for advanced banks andothers were considered to be immaterial. For more information refer to appendices B and C.
Category B – Potentially material RCAP (Australia) findings where APRA is considered to be lessconservative than the Basel Framework. For more information refer to appendices B and C.
Category C – Other adjustments identified from other RCAP reports, reviewing other banks reportedinformation and reaching out to the PwC international network. These are discussed in more detail insection 4.1.2 below.
Appendices B to F contain a complete list of all differences we considered, detailed descriptions of individualdifferences and our assessment of the applicability of each difference to calculating CET1 ratios.
9 BCBS RCAP Analysis of credit risk weighted assets in the banking book, July 2013

Identification and analysis of differences in calculating CET1 ratios
Australian Bankers' AssociationPwC 17
4.1.2 Credit risk weighted assets - Australia’s model outcomes compared tointernational norms
Credit risk is the major contributor to risk weighted assets for Australian banks and can be a cause ofmeasureable inconsistencies between the International comparable CET1 ratios for Australian banks andglobal peers.
AIRB banks use their own data and models to generate the factors used to risk weight their assets. Individualbank models are subject to approval by their national regulator. National regulators can set limits whenapplying risk factors and require specific assumptions to be built into the models. Both individual bankmodelling assumptions and the way national regulators implement the Basel Framework introducedifferences which need to be considered when making comparisons.
Residential Mortgage Loss Given Default (LGD) floorsWhen introducing Basel II, the BCBS10 set an LGD floor of 10 per cent on residential mortgages due to a lackof long-term historical data relating losses arising in periods of financial stress. This floor prevents banksfrom setting the LGD assumption too low. APRA has used its national discretion to impose a higher, 20 percent, LGD floor on residential mortgages in Australia. This 20 per cent LGD floor assumption gives rise toAustralian banks holding more capital against their mortgage book than banks in other jurisdictions. This isfurther exacerbated by the tendency for Australian banks to hold a higher proportion of residential mortgageassets than in other jurisdictions.
In order to allow for this impact in our analysis, we have required the Australian AIRB banks to apply a 15per cent flat LGD to their residential mortgage books. For most banks that have modelled their portfoliosusing a 10 per cent LGD floor, the results show LGD’s higher than 10 per cent, however these are notaccredited models and so not judged to be a prudent basis for our estimate. Taking into considerationstructural differences such as the higher loan-to-value ratios (LVRs) between Australia and other countriessuch as Singapore (where LVRs cannot exceed 80 per cent for first properties)11 and Canada (where there is agovernment based LMI scheme), in our judgement we consider a 15 per cent flat LGD assumption to be areasonable proxy. A 1 per cent change in the mortgage LGD assumption represents 7 bps change in theaverage CET1 ratio.
Unsecured corporate lending (LGD)In a number of jurisdictions banks have found it difficult to achieve full AIRB accreditation for theirunsecured corporate lending portfolios due in part to a lack of reliable loss data over a sufficient time period.In keeping with the Basel Framework, banks in this situation use the FIRB approach for determining riskweighted assets for the portfolio. The FIRB approach uses a 45 per cent LGD modelling assumption forunsecured corporate exposures.
The BCBS (July 2013) RCAP report, Analysis of risk-weighted assets for credit risk in the banking book12,confirmed that variation in LGDs for corporate exposures in the hypothetical portfolio is a driver ofinconsistency in the comparability of risk weightings.
As unsecured corporate loans are a significant portfolio relative to overall balance sheet size for Australianbanks, differences in this modelling assumption would be expected to impact the overall internationalcomparability of the capital ratio.
To negate this impact in our analysis we have required the Australian banks to model their risk weightedassets for unsecured corporate exposures adopting the FIRB approach of using a 45 per cent LGD. In ourjudgement, given that approximately half of the international peer group currently use the FIRB approach,we consider this to be a reasonable measure to bring the Australian banks more in line with banks in otherjurisdictions.
10BCBS, Basel II: International Convergence of Capital Measurement and Capital Standards, BIS, June 2006
11 More specific guidance is outlined in Monetary Authority of Singapore (MAS), MAS Notice 632, Residential Property Loans, MAS, para 30(t), February2014
12BCBS, Regulatory Consistency Assessment Programme (RCAP) Analysis of risk-weighted assets for credit risk in the banking book, BIS, July 2013

Identification and analysis of differences in calculating CET1 ratios
Australian Bankers' AssociationPwC 18
Undrawn corporate lending (EAD)Another area of inconsistency in international comparability of risk weighted assets identified by the BCBSRCAP thematic report was the assessment of exposure at default (EAD) for undrawn commitments (referredto as credit conversion factors, or CCF in the Basel Framework). The BCBS report identified that ‘for AIRBbanks, the average conversion factor applied to undrawn commitments is roughly 50 per cent; this can becontrasted with the 75 per cent CCF for such commitments under the FIRB approach’13. We understand thatAustralian AIRB banks use higher conversion factors for the EAD relating to undrawn commitments,typically 100 per cent.
In order to negate the impact of higher EADs for undrawn commitments, in our judgement we consider itreasonable to apply the FIRB conversion factor of 75 per cent to the undrawn commitments in the AIRBbanks’ corporate loan books.
4.2 Explanation of the key differences identified inFigure 1 (Impact of differences in the application of theBasel Framework)
A complete list of all differences identified and considered in this study can be found in appendices C and D.
The following table further analyses the major adjustments reflected in Figure 1: Impact of differences in theapplication of the Basel Framework on CET1 (APRA) ratios, section 3.
Description
Weightedaverage
impact onCET1 (APRA)
(bps)
Ref App.B Major banks
Differences between APRA prudential standards and the Basel Framework
1 Capital deductionsAPRA requires 100 per cent deductions from capital for deferred tax assets,intangibles relating to capitalised expenses and all investments (e.g. financialinstitutions, funds management and insurance subsidiaries). The Basel Frameworkallows a concessional threshold before these deductions apply. Assets below thethreshold can be risk weighted.
A3, A4, A5
109
Credit risk weightings
2 Mortgage Loss Given Default (LGD) 20 per cent floorThe Basel Framework imposes a 10 per cent floor in downturn LGD models used forresidential mortgages, whereas APRA imposes a 20 per cent floor. In our judgement,a 15 per cent flat LGD is a reasonable proxy. Refer to section 4.1.2 above.
A1
40
2 Specialised LendingAPRA rules for ‘specialised lending’ (corporate lending to project finance, certain realestate exposures, commodity finance etc) are more conservative than those containedin the Basel Framework and/or which are applied by most other prominentjurisdictions included in this study
A2
50
3 Interest rate risk in the banking book (IRRBB)APRA’s rules require the inclusion of IRRBB within the Pillar 1 risk weighted assetsframework for banks using AIRB approaches; IRRBB is not required to be assessedunder Pillar 1 in the Basel Framework. It is highlighted as a risk that may be takeninto account in assessing Pillar 2 capital ratios.
A11
30
13 BCBS, Regulatory Consistency Assessment Programme (RCAP) Analysis of risk-weighted assets for credit risk in the banking book, BIS, p.46, July2013

Identification and analysis of differences in calculating CET1 ratios
Australian Bankers' AssociationPwC 19
Description
Weightedaverage
impact onCET1 (APRA)
(bps)
4 Scaling factor related to specialised lending exposuresAPRA does not apply the 1.06 scaling factor for risk weighted assets calculated underthe IRB approach, to specialised lending assets classes, as prescribed in the BaselFramework.
B2
(7)
4 Non owner occupied home loansThe RCAP rated APRA’s approach to residential mortgage exposures eligible for retailtreatment under the IRB approach as a potentially material deviation, as APRA doesnot include an owner-occupancy constraint. A literal interpretation of the relevantparagraph in the Basel Framework can exclude non-owner occupied exposures. APRAcommented in its response that its view is that the paragraph is ambiguous and alarge number of other Basel Committee member jurisdictions have implemented therelevant paragraph in the same manner as APRA. Further commentary of this issue iscontained on pages 14 to 15 of the BCBS RCAP (Singapore), March 2013.
The banks in the study group were requested to quantify this potential deviation. Insome cases, banks calculated an increase in risk weighted assets and in another case areduction. None of the adjustments was more than 10 basis points and because of thedifficulties in agreeing a consistent methodology for the adjustment, no adjustmentwas included for this item in the final analysis. Given APRA’s comments about otherBasel Committee member jurisdictions adopting a similar approach, this appears tobe reasonable in the context of this study.
B3
n/a
5 Standardised risk weightsSome advanced banks have retail portfolios that are assessed using the .Standardisedapproach. APRA applies more conservative risk weights than the Basel Framework forsome standardised retail exposures.
A6
11
Other areas where credit risk estimates are more conservative in Australia by comparison tonorms adopted in other countries
6 Unsecured corporate lending LGDIn our judgement, we consider it reasonable to apply the assumption of 45 per centLGD, given that approximately half of the international peer group currently use theFIRB approach, which applies this assumption. This brings Australian banks more inline with banks in other jurisdictions. Refer to section 4.1.2 above.
C2
79
6 Undrawn corporate lending EADIn our judgement we consider it reasonable to apply the FIRB conversion factor of 75per cent to the undrawn commitments in the AIRB banks corporate loan books. Referto section 4.1.2 above.
C1
31
This concludes the mainbody of our report

Australian Bankers' AssociationPwC 20
Appendix A Australian major banks - detailed analysis ofdifferences between Australian CET1 (APRA) and Internationalcomparable CET1 ratio
Table A1 – Summary of CET1 adjustments (in per cent)*Ref. ANZ CBA NAB WBC Weighted
Average31/03/2014 30/06/2014 31/03/2014 31/03/2014
CET1 (APRA) ratio 8.33% 9.30% 8.64% 8.82% 8.76%Category A adjustments: APRA more conservativeMortgage LGD (20% floor) A1 0.32% 0.55% 0.28% 0.47% 0.40%Specialised lending A2 0.32% 0.70% 0.34% 0.69% 0.50%Intangible assets A3 0.15% 0.10% 0.03% 0.27% 0.14%Equity holdings A4 0.84% 0.80% 0.51% 0.36% 0.63%Deferred tax assets A5 0.20% 0.26% 0.33% 0.52% 0.32%Standardised – retail exposures A6 0.02% 0.12% 0.20% 0.09% 0.11%Margin lending A7 0.00% 0.02% 0.00% 0.02% 0.01%Currency threshold adjustments A8 0.01% 0.06% 0.04% 0.08% 0.05%Operational risk A9 0.00% 0.00% 0.06% 0.00% 0.01%Counterparty credit risk A10 0.00% 0.00% 0.00% 0.00% 0.00%IRRBB A11 0.40% 0.43% 0.16% 0.24% 0.30%Category B adjustments: APRA less conservativeInvestment in own shares B1 0.00% (0.05%) 0.00% 0.00% (0.01%)Specialised lending – scaling factor B2 (0.04%) (0.08%) (0.07%) (0.09%) (0.07%)Investment home loans B3 n/a n/a n/a n/a n/aTotal adjustment (standalone) 2.21% 2.91% 1.88% 2.64% 2.40%CET1 (Basel Framework) ratio 10.76% 12.78% 10.80% 12.00% 11.55%CET1 uplift 2.43% 3.48% 2.16% 3.18% 2.79%
Self-reported internationally harmonised CET1 ratio 10.50% 12.10% 10.46% 11.26% 11.06%
Additional adjustmentsUndrawn corporate lending EAD C1 0.34% 0.32% 0.23% 0.36% 0.31%Unsecured corporate lending LGD C2 1.02% 0.83% 0.61% 0.67% 0.79%Total adjustment (standalone) 1.37% 1.15% 0.84% 1.02% 1.09%Internationally comparable CET1 ratio 12.19% 13.98% 11.67% 13.07% 12.69%
Source: Individual bank data, PwC analysis, 2014.*Note: Refer to appendix B for more detail.Refer to appendix G for abbreviated terms.
Australian major banks - detailed analysis of differences between Australian CET1 (APRA) and International comparable CET1 ratio
Australian Bankers' AssociationPwC 21
Table A2 – Summary of CET1 adjustments (in A$ billions)Capital and RWA values have been rounded to the nearest $ billion. All totals and capital ratios have been rounded to 2 decimal places from source data.(Refer to the following page for notes)
ANZ CBA NAB WBCAs at: 31/03/2014 30/06/2014 31/03/2014 31/03/2014
$ billions Ref Capital RWA Capital RWA Capital RWA Capital RWA
CET1 (APRA) 30.0 360.7 31.4 337.7 31.7 367.2 28.5 322.5Category A adjustments: APRA more conservative
Mortgage LGD (20% floor) A1 0.0 (13.3) 0.0 (19.0) 0.0 (11.7) 0.0 (16.3)Specialised lending A2 0.0 (13.2) 0.0 (23.7) 0.0 (13.8) 0.0 (23.4)Intangible assets A3 0.6 1.0 0.4 0.4 0.1 0.2 1.0 1.1Equity holdings A4 4.0 10.4 3.8 11.0 2.4 6.1 1.7 5.9Deferred tax assets A5 0.9 2.3 1.2 2.9 1.5 3.9 2.2 5.5Standardised – retail exposures A6 0.0 (0.8) 0.0 (4.4) 0.0 (8.5) 0.0 (3.3)Margin lending A7 0.0 (0.0) 0.0 (0.7) 0.0 (0.2) 0.0 (0.6)Currency threshold adjustments A8 0.0 (0.6) 0.0 (2.1) 0.0 (1.7) 0.0 (2.9)Operational risk A9 0.0 0.0 0.0 0.0 0.0 (2.4) 0.0 0.0Counterparty credit risk A10 0.0 0.0 0.0 0.0 0.0 (0.0) 0.0 0.0IRRBB A11 0.0 (16.4) 0.0 (14.8) 0.0 (6.8) 0.0 (8.5)
Category B adjustments: APRA less conservativeInvestment in own shares B1 0.0 0.0 (0.2) 0.0 0.0 0.0 0.0 0.0Specialised lending – scaling factor B2 0.0 1.7 0.0 2.9 0.0 2.8 0.0 3.2Investment home loans B3 0.0 0.0 0.0 0.0 0.0 0.0 0.0 0.0
Adjustment for expected loss* 0.1 0.0 0.5 0.0 0.4 0.0 0.7 0.0Total adjustment 5.7 (28.8) 5.7 (47.3) 4.5 (32.0) 5.5 (39.3)CET1 (Basel Framework) 35.7 331.9 37.1 290.4 36.2 335.2 34.0 283.2CET1 ratio (Basel Framework) 10.76% 12.78% 10.80% 12.00%
Category C adjustmentsUndrawn corporate lending EAD C1 0.0 (10.2) 0.0 (7.1) 0.0 (6.8) 0.0 (8.2)Unsecured corporate lending LGD C2 0.0 (28.8) 0.0 (17.8) 0.0 (18.0) 0.0 (14.9)
Total other 0.0 (39.1) 0.0 (24.9) 0.0 (24.9) 0.0 (23.1)Internationally comparable CET1 / RWA 35.7 292.8 37.1 265.6 36.2 310.3 34.0 260.1Internationally comparable CET1 ratio** 12.19% 13.98% 11.67% 13.07%
Table A2 continues on the following page.

Australian major banks - detailed analysis of differences between Australian CET1 (APRA) and International comparable CET1 ratio
Australian Bankers' AssociationPwC 22
ANZ CBA NAB WBCAs at: 31/03/2014 30/06/2014 31/03/2014 31/03/2014
$ billions Ref Capital RWA Capital RWA Capital RWA Capital RWA
Other jurisdiction specific adjustments from International comparable CET1 ratiosUK AdjustmentTotal adjustment (standalone) (1.9) 9.2 (3.5) 16.7 (2.3) 8.8 (2.8) 19.3CET1 (UK) 33.8 302.0 33.6 282.2 33.9 319.1 31.2 279.5CET1 ratio (UK) 11.20% 11.90% 10.61% 11.16%
Singapore AdjustmentTotal adjustment (standalone) 0.0 7.6 0.0 14.6 0.0 4.5 0.0 15.3CET1 (Singapore) 35.7 300.5 37.1 280.1 36.2 314.9 34.0 275.5CET1 ratio (Singapore) 11.88% 13.25% 11.50% 12.34%
Germany AdjustmentTotal adjustment (standalone) (1.9) 0.0 (3.5) 0.0 (2.3) 0.0 (2.8) 0.0CET1 (Germany) 33.8 292.8 33.6 265.6 33.9 310.3 31.2 260.1CET1 ratio (Germany) 11.55% 12.65% 10.91% 11.99%
Source: Individual bank data, PwC analysis, 2014.Refer to appendix G for abbreviated terms.*Note: Any adjustment to risk weighted assets also potentially reduces expected loss (EL), which in turn may reduce the deduction taken by Australian major banks for the excess of
expected loss over eligible provisions. We have made one single adjustment to reduce this EL deduction, rather than allocating the benefit to specific adjustments. The total ELadd back to CET1 is limited to the deduction already taken in APRA reporting. The impact in table A1 (in bps) of this item is included in the cumulative capital ratio, and so is areconciling item between the sum of stand-alone adjustments and the cumulative impact.
**Note: The ratios for CET1 (Canada), CET1 (Swiss) and CET1 (Japanese) are equal to the Internationally comparable CET1 ratio above.
Australian Bankers' AssociationPwC 23
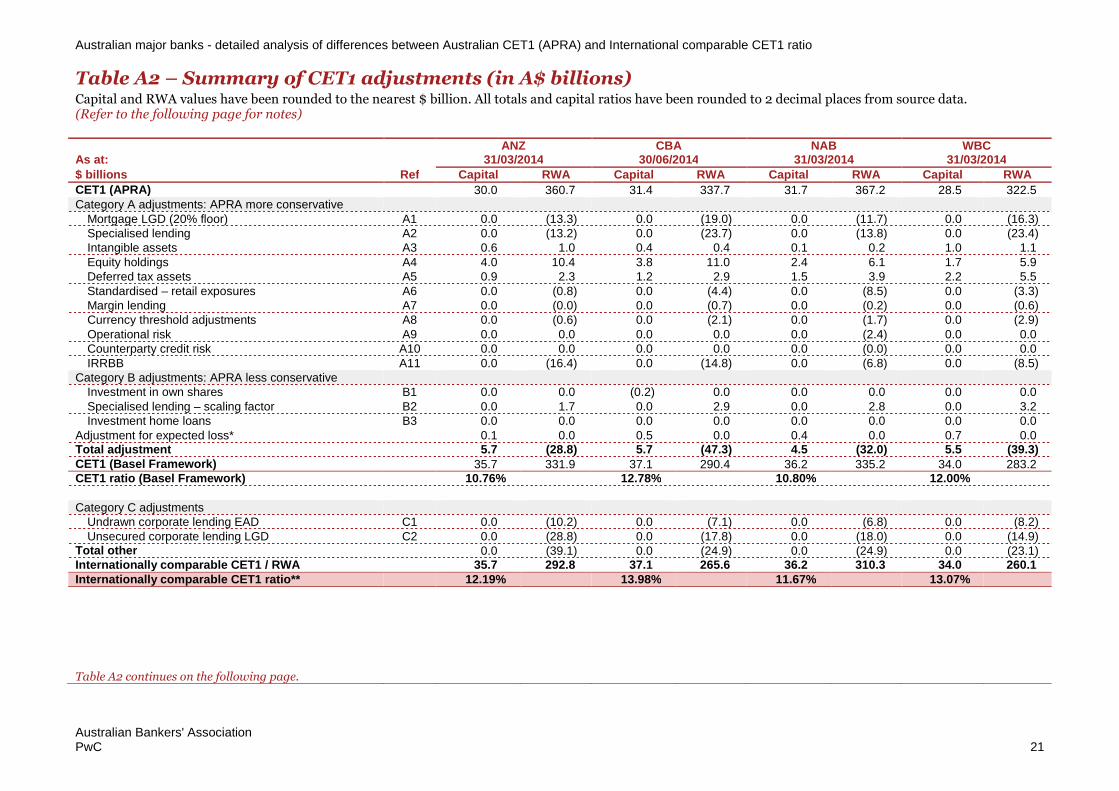
Appendix B Summary of differences and related adjustments
*Ref Description Nature of adjustment Primary impactDegree ofjudgement required
Category A: APRA more conservative
A1 Mortgage LGD (20% floor) Reduce LGD floor from 20 per cent floor to 15 per cent flat for residentialmortgage portfolios.
↓RWA
A2 Specialised lending Move loan portfolio(s) from supervisory slotting to IRB approach ↓RWA
A3 Intangible assets Add back to CET1 additional deductions as required by APRA (e.g. capitalisedexpenses).
↑Capital
A4 Equity holdings Add back to CET1 additional deductions as required by APRA. ↑RWA↑Capital
A5 Deferred tax assets Add back to CET1 additional deductions as required by APRA. ↑RWA ↑Capital
A6 Standardised – retail exposures Reduce risk weights to 35 per cent for residential mortgages; and 100 per cent to75 per cent for other retail loans.
↓RWA
A7 Margin lending Reduce risk weight below APRA 20 per cent (standardised portfolios). ↓RWA
A8 Currency threshold adjustments Increasing $A threshold for inclusion in retail/SME portfolios. ↓RWA
A9 Operational risk Remove more conservative loss definitions and modelling assumptions. ↓RWA
A10 Counterparty credit risk Reduce EAD for some counterparty credit risk. ↓RWA
A11 IRRBB Remove IRRBB risk weighted assets from Pillar 1 capital requirements. ↓RWA
Category B: APRA less conservative (material or potentially material)
B1 Investment in own shares Additional deductions for selected own shares held by group members. ↓Capital
B2 Specialised lending – scalingfactor
Apply 1.06 scaling factor for specialised lending. ↑RWA

Summary of differences and related adjustments
Australian Bankers' AssociationPwC 24
*Ref Description Nature of adjustment Primary impactDegree ofjudgement required
Category C: Other adjustments
C1 Undrawn corporate lending EAD Reduce EAD on corporate undrawn exposures to 75 per cent. ↓RWA
C2 Unsecured corporate lending LGD Reduce LGD to 45 per cent for unsecured corporate credit. ↓RWA
C3 Sovereign LGD floor 45% Increase LGD to 45 per cent for sovereign exposures. ↑RWA
C4 Foreseeable dividend Deduct foreseeable dividend from CET1. ↓Capital
*Note: Refer to appendices C and D for more detail.
KEY
Primary impact Degree of judgement required
This represents the impact of the adjustment on the capital ratio. Each adjustments includes an element of judgement to be made when quantifying its'impact on either the capital base or the risk weighted asset. The degree of judgementrequired is indicated using the scale below:
Improve capital ratio (decrease risk weighted assets or increase capital base) Lower
Reduce capital ratio (increase risk weighted asset or decrease capital base) Higher
Note: The table above indicates the primary impact.
Australian Bankers' AssociationPwC 25
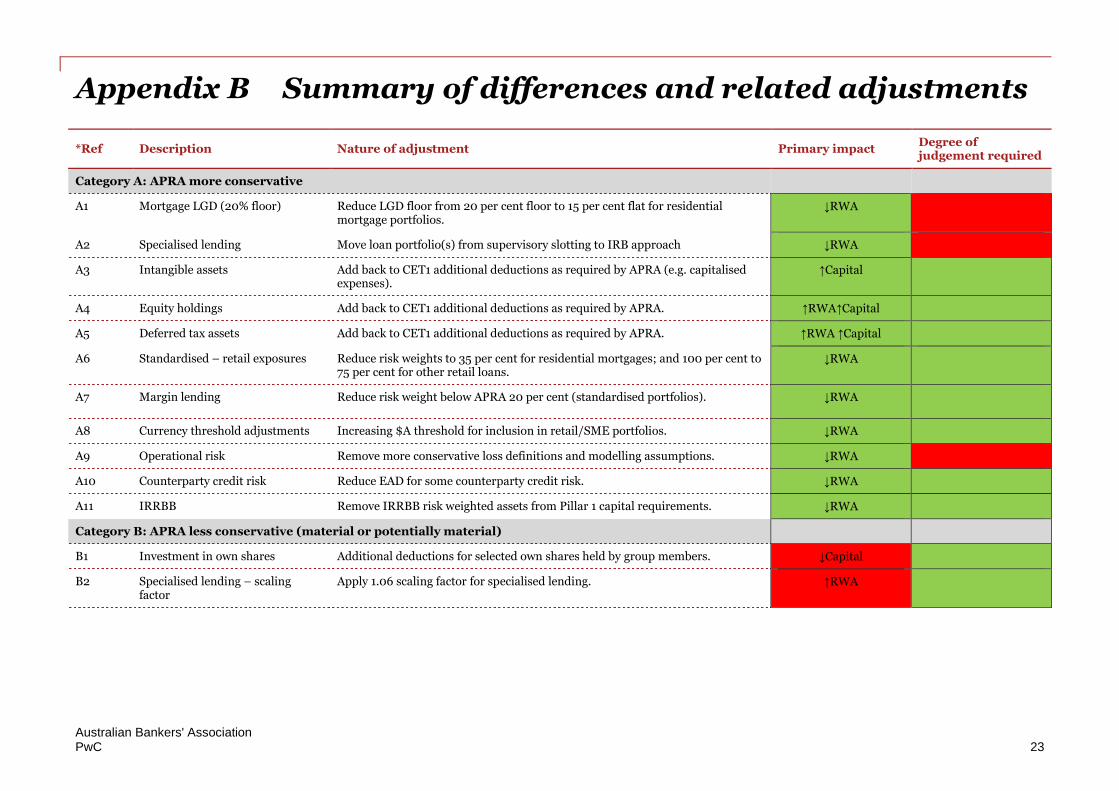
Appendix C Areas where APRA’s approach to calculatingCET1 differs from RCAP (Australia) and other adjustments forinternational comparability
The table below details the list of differences where APRA adopts a more conservative approach than the BCBS minimum capital requirements (“Category A”). A“more conservative” approach is deemed to be those differences leading to higher risk weighted assets or lower capital base.
In addition, these differences having been assessed as being applicable to the four major banks, and which are material or potentially material, have therefore beenconsidered in the analysis (items marked with ).
Those differences identified as immaterial have not been examined further. Furthermore, any differences not applicable (n/a) to the four major banks for thepurposes of this study, have also been identified. For full details on the treatment of these differences in the analysis performed, refer to the “Approach” section inappendix E.
Category A: APRA more conservative
Ref DescriptionSource Ref:
RCAP Applicability
A1 Mortgage LGD - 20% floor P.17
A2 Specialised lending – prescribe slotting approach P.17
A3 Intangible assets – additional deductions 10.1
Own shares trading limits – additional deductions 10.2 Immaterial
A4 Reciprocal cross-holdings – additional deductions 10.3
A4 Equity holdings (financial entities) – additional deductions 10.4
A5 Deferred tax assets – additional deductions 10.5
Basel III capital ratios transitional arrangements - not applied 10.6 n/a
Basel III capital instruments transitional arrangements - not applied 10.7 n/a
Basel III capital buffers transitional arrangements – not applied 10.8 n/a

Areas where APRA’s approach to calculating CET1 differs from RCAP (Australia) and other adjustments for international comparability
Australian Bankers' AssociationPwC 26
Ref DescriptionSource Ref:
RCAP Applicability
A6 Standardised retail exposures – risk weight 100% 10.9
A6 Standardised retail mortgage risk – risk weight ≥ 35% 10.10
A7 Margin lending exposures - risk weight ≥ 20% 10.11
A7 Margin lending – IRB approach not allowed 10.12
A8 Small business exposures - threshold of $1M 10.13
A8 Retail revolving exposure – threshold of $100K 10.14
A8 SMEs– $50M turnover threshold 10.15
Foundation IRB - other collateral not recognised 10.16 FIRB banks only
Foundation IRB - 100% CCF for commitments etc 10.17 FIRB banks only
Excess eligible provisions – not included in capital 10.18 Total capital only
Securitisation originating bank– wider definition 10.19 Immaterial
Securitisation implicit support– additional prohibitions 10.20 Immaterial
Operational risk foreign bank subsidiaries – additional conditions 10.21 n/a
Operational risk AMA criteria 10.22 Immaterial
A9 Operational risk AMA quantitative standards 10.23 Low materiality (only quantifiedby one bank)
A9 Operational Risk - fraud related losses 10.24 Low materiality (only quantifiedby one bank)
A10 Counterparty Credit Risk -EAD > 0 10.25 Low materiality (only quantifiedby one bank)
Correlation trading portfolio 10.26 Immaterial
A11 IRRBB - Pillar 1 inclusion 10.27
Areas where APRA’s approach to calculating CET1 differs from RCAP (Australia) and other adjustments for international comparability
Australian Bankers' AssociationPwC 27
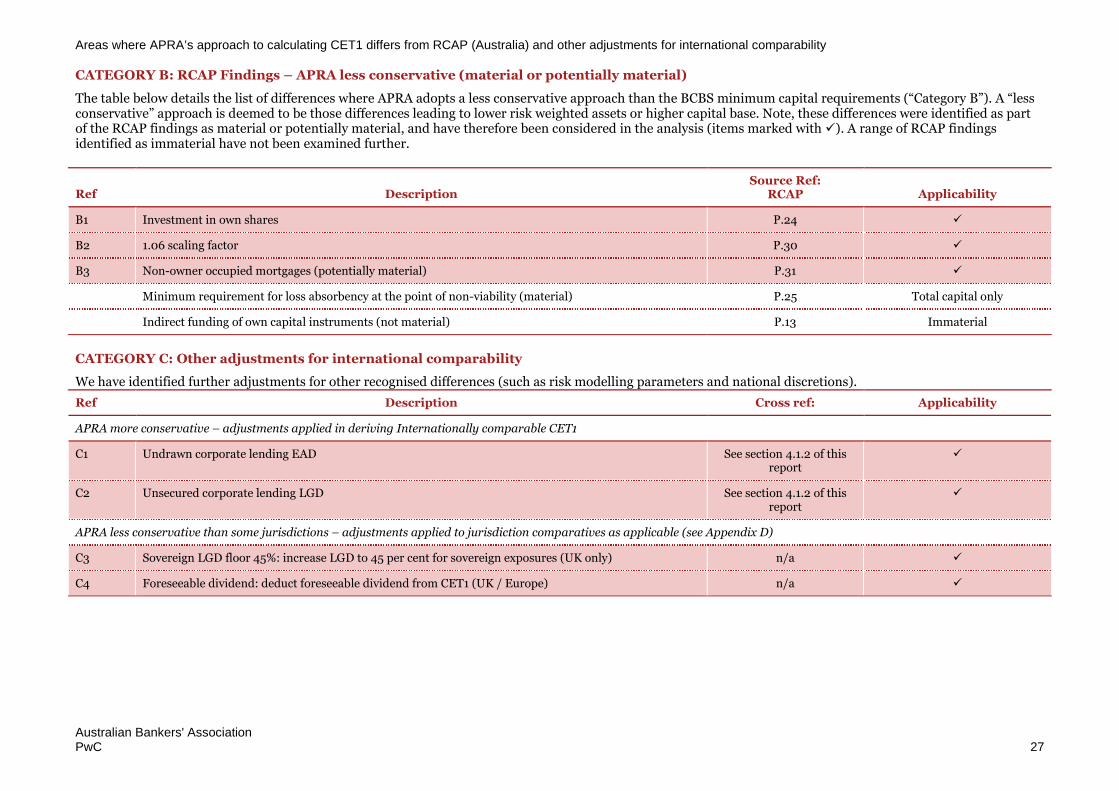
CATEGORY B: RCAP Findings – APRA less conservative (material or potentially material)
The table below details the list of differences where APRA adopts a less conservative approach than the BCBS minimum capital requirements (“Category B”). A “lessconservative” approach is deemed to be those differences leading to lower risk weighted assets or higher capital base. Note, these differences were identified as partof the RCAP findings as material or potentially material, and have therefore been considered in the analysis (items marked with ). A range of RCAP findingsidentified as immaterial have not been examined further.
Ref DescriptionSource Ref:
RCAP Applicability
B1 Investment in own shares P.24
B2 1.06 scaling factor P.30
B3 Non-owner occupied mortgages (potentially material) P.31
Minimum requirement for loss absorbency at the point of non-viability (material) P.25 Total capital only
Indirect funding of own capital instruments (not material) P.13 Immaterial
CATEGORY C: Other adjustments for international comparability
We have identified further adjustments for other recognised differences (such as risk modelling parameters and national discretions).
Ref Description Cross ref: Applicability
APRA more conservative – adjustments applied in deriving Internationally comparable CET1
C1 Undrawn corporate lending EAD See section 4.1.2 of thisreport
C2 Unsecured corporate lending LGD See section 4.1.2 of thisreport
APRA less conservative than some jurisdictions – adjustments applied to jurisdiction comparatives as applicable (see Appendix D)
C3 Sovereign LGD floor 45%: increase LGD to 45 per cent for sovereign exposures (UK only) n/a
C4 Foreseeable dividend: deduct foreseeable dividend from CET1 (UK / Europe) n/a

Australian Bankers' AssociationPwC 28
Appendix D Areas of difference between Australia and peergroup jurisdictions (refers to section 3.4)
Table D1 – Jurisdiction specific material differences
*Ref Description Australia UK Germany Switzerland Canada Singapore Japan
APRA more conservative
A1 LGD mortgage floor 20% 10% 10% 10% 10% 10% 10%
A2 Slotting required for specialisedlending
Y: additionallyAPRA risk weightsmore conservative
than BCBS
Partial: incomeproducing real-
estate only.
UK risk weightsequivalent to
BCBS
N N N Y: apply BCBSrisk weights
N
A4 Equity holdings: full deduction,no threshold treatment
Y N N N N N N
A5 Deferred tax assets: fulldeduction, no thresholdtreatment
Y N N N N N N
A12 IRRBB: included in Pillar 1RWAs
Y N N N N N N
C1 EAD for undrawn corporate Y N N N N N N
C2 LGD for unsecured corporate Y N N N N N N
APRA less conservative
C3 Sovereign LGD floor of 45% N Y N N N N N
C4 Deduct foreseeable dividend N Y Y N N N N

Areas of difference between Australia and peer group jurisdictions (refers to section 3.4)
Australian Bankers' AssociationPwC 29
Table D2 – Foreseeable dividend adjustments appliedThe table below summarises the foreseeable dividend adjustments which have been applied in Figure 3. Not all banks who deduct foreseeable dividends publish theimpact of this adjustment on fully loaded CET1. In such cases we have used the adjustment disclosed to transitional CET1 and applied to fully loaded CET1. Thedifference is likely to be negligible.
BankReported fully loaded
CET1Foreseeable dividend
adjustmentInternationally comparable
CET1
Nordea 15.20% 0.62% 15.82%
Intesa Sanpaolo 12.90% 0.09% 12.99%
Deutsche Bank AG 11.50% 0.14% 11.64%
HSBC Holdings Plc. 11.30% 0.13% 11.43%
Standard Chartered 10.70% 0.17% 10.87%
Societe Generale 10.20% 0.31% 10.51%
UniCredit 10.37% 0.03% 10.40%
BNP Paribas 10.00% 0.30% 10.30%
Barclays 9.90% 0.14% 10.04%

Australian Bankers' AssociationPwC 30
Appendix E Analysis of international jurisdictions RCAPs
Jurisdictions which we have used for comparison purposes have had RCAP Reports completed. In this Appendix we have summarised the findings from those RCAPsfor two purposes: (i) findings where a jurisdiction has not fully applied the Basel Framework (and so APRA may be more conservative if they have fully applied theFramework) and (ii) areas where that jurisdiction has been identified as being more conservative than the Basel Framework (and where APRA may be lessconservative than that jurisdiction if they have applied the Basel minimum). We have assessed each finding and assessed whether it is a factor which requiresadjustment in this study.
Canada (June 2014)RCAP differencesArea Finding PwC Comment
Definition of capital
Inclusion of Preference Share Capital Does not require preferred shares (accounted as liabilities & incl. in Additional Tier 1) toinclude the automatic conversion trigger at the capital ratio of 5.125 per cent of riskweighted assets (as required by Basel).
The focus of this report is on fully implementedCET1. Accordingly no adjustment has been madefor this item.
Areas where the Canadian rules are stricter than the Basel minimumArea Finding PwC Comment
Definition of capital and transitionalarrangements
Office of the Superintendent of Financial Institutions (OSFI) expects all bankinginstitutions to attain target capital ratios equal to or greater than the 2019 capital ratiosfrom 2013.
Equivalent to APRA. Does not impact calculationof disclosed capital ratios. No adjustment made.
The Canadian Capital Adequacy Requirements (CAR) Guideline requires that anydiscretionary repurchases of common shares are subject to the prior approval of theSuperintendent.
Does not impact calculation of disclosed capitalratios. No adjustment made.
Paragraphs 16 and 29 of the CAR Guideline require that amendments to the terms andconditions of additional Tier 1 and Tier 2 instruments are subject to the prior approval ofthe Superintendent.
Does not impact calculation of disclosed capitalratios. Not applicable to CET1. No adjustmentmade.
Counterparty credit risk (Annex 4) OSFI’s expectation that banks will provide documented justification for their use of twodifferent pricing models, in the case where the pricing model used to calculatecounterparty credit risk exposure is different to the pricing model used to calculatemarket risk over a short horizon.
Qualitative requirement. Does not impactcalculation of disclosed capital ratios. Noadjustment made.
OSFI’s expectation that banks will provide documented justification for their choice ofcalibration methods, when two different calibration methods are used for differentparameters within the effective expected positive exposure model.
Qualitative requirement. Does not impactcalculation of disclosed capital ratios. Noadjustment made.
Market Risk OSFI does not allow banks using the Standardised Approach to include unrated securitiesin the “qualifying” category for the computation of interest rate risk.
Australian major banks are advanced. Notapplicable. No adjustment made.
OSFI does not fully implement the futures-related arbitrage strategies that attract lowermarket risk capital charges.
OFSI approach similar to APRA. No adjustmentmade.

Analysis of international jurisdictions RCAPs
Australian Bankers' AssociationPwC 31
Switzerland (June 2013)Areas where the Swiss rules are potentially less strict than the Basel minimumThe RCAP process identified 10 “negative deviations” from the Basel text for the “International Approach”, which had not yet been rectified by amendments to theSwiss rules at the time of the assessment. The RCAP measured the cumulative average impact of these items on CET1 as 5bps. We consider this immaterial for thisexercise.
Areas where the Swiss rules are stricter than the Basel minimumNone noted in the RCAP.
Europe (includes Germany: preliminary report October 2012)Areas where the EU rules are potentially less strict than the Basel minimumThe RCAP process identified a number of material and potentially material findings. The EU has challenged a number of the findings, and the assessment remainspreliminary. We have not made any additional adjustments to reflect these findings (which may increase Australian major bank capital ratios in comparison to EUinstitutions).
Areas where the European rules are stricter than the Basel minimumArea Finding PwC Comment
Credit risk: IRB Basel allows the risk weight for short-term, self-liquidating letters of credit with unratedbanks to be lower than the risk weight of the bank’s sovereign of incorporation; theCapital Requirements Regulation (CRR) does not include a similar provision.
Negligible
Analysis of international jurisdictions RCAPs
Australian Bankers' AssociationPwC 32
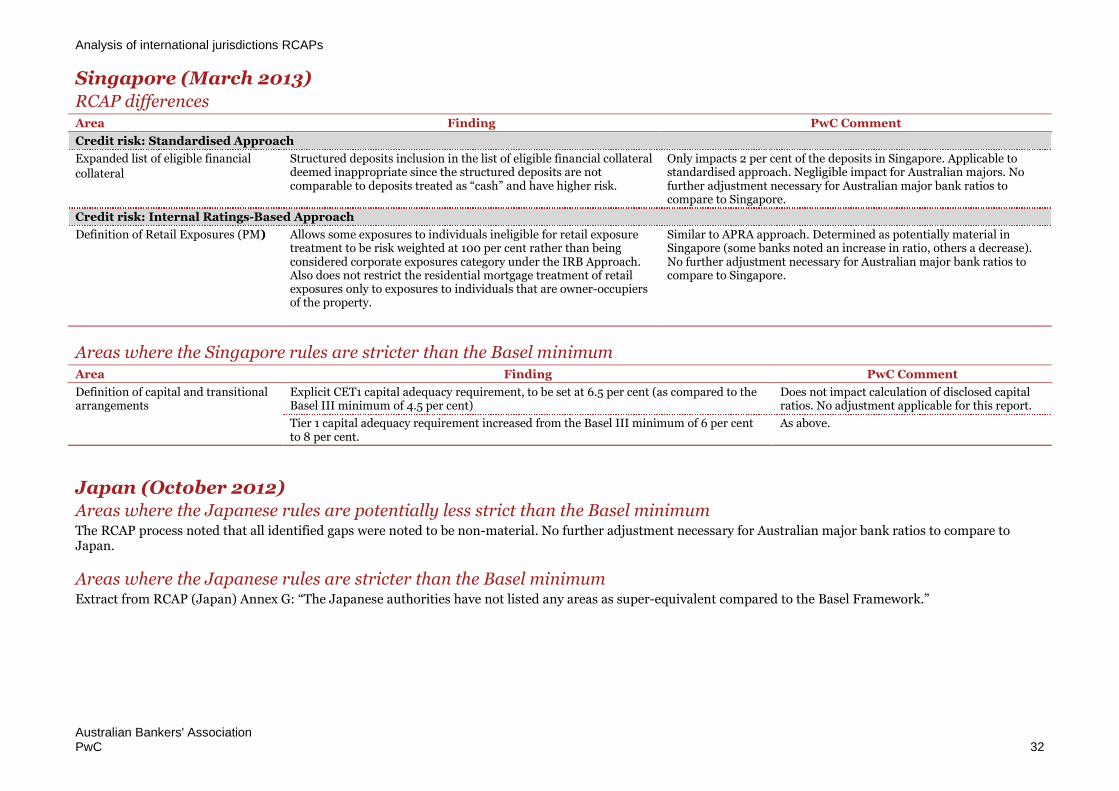
Singapore (March 2013)RCAP differencesArea Finding PwC Comment
Credit risk: Standardised Approach
Expanded list of eligible financial
collateral
Structured deposits inclusion in the list of eligible financial collateraldeemed inappropriate since the structured deposits are notcomparable to deposits treated as “cash” and have higher risk.
Only impacts 2 per cent of the deposits in Singapore. Applicable tostandardised approach. Negligible impact for Australian majors. Nofurther adjustment necessary for Australian major bank ratios tocompare to Singapore.
Credit risk: Internal Ratings-Based Approach
Definition of Retail Exposures (PM) Allows some exposures to individuals ineligible for retail exposuretreatment to be risk weighted at 100 per cent rather than beingconsidered corporate exposures category under the IRB Approach.Also does not restrict the residential mortgage treatment of retailexposures only to exposures to individuals that are owner-occupiersof the property.
Similar to APRA approach. Determined as potentially material inSingapore (some banks noted an increase in ratio, others a decrease).No further adjustment necessary for Australian major bank ratios tocompare to Singapore.
Areas where the Singapore rules are stricter than the Basel minimumArea Finding PwC Comment
Definition of capital and transitionalarrangements
Explicit CET1 capital adequacy requirement, to be set at 6.5 per cent (as compared to theBasel III minimum of 4.5 per cent)
Does not impact calculation of disclosed capitalratios. No adjustment applicable for this report.
Tier 1 capital adequacy requirement increased from the Basel III minimum of 6 per centto 8 per cent.
As above.
Japan (October 2012)Areas where the Japanese rules are potentially less strict than the Basel minimumThe RCAP process noted that all identified gaps were noted to be non-material. No further adjustment necessary for Australian major bank ratios to compare toJapan.
Areas where the Japanese rules are stricter than the Basel minimumExtract from RCAP (Japan) Annex G: “The Japanese authorities have not listed any areas as super-equivalent compared to the Basel Framework.”

Australian Bankers' AssociationPwC 33
Appendix F Extracts of rules pertaining to differences
The table below explains the differences between APRA’s implementation of Basel and the core Basel text, together with the approach we have adopted in this study.“APRA v BCBS differences” are extracted directly from the BCBS’s RCAP (Australia).
RCAP/ PwCRefs. Description Basel Ref. APRA v BCBS difference Approach taken in this study
Main Findings: Credit risk: Internal Ratings-Based approach
RCAPpg.17
A1
Mortgage LGD- 20% floor
Basel II para 266:
Owing to the potential for very long-run cycles in house priceswhich short-term data may not adequately capture, duringthis transition period, LGDs for retail exposures secured byresidential properties cannot be set below 10% for any sub-segment of exposures to which the formula in paragraph 328is applied. During the transition period the Committee willreview the potential need for continuation of this floor.
Basel Framework prescribes a 10% floorfor loss-given default of exposures securedby residential mortgages that must beapplied at the sub segment of exposures towhich the risk weight asset formula isapplied. APRA prescribes a 20% floor. Thisfloor, however, is applied at the portfoliolevel. While this is not strictly inconformity with the letter and intent of theBasel Framework, the risk that loss-given-default estimates for sub-segments ofexposures declining below the Basel 10%floor is deemed immaterial.
Apply a flat LGD assumption. See section4.1.2 for further discussion of approach.
RCAPpg.17
A2
Specialisedlending –prescribeslottingapproach
Basel II para 215 and 275:
215. Under the IRB approach, banks must categorise banking-book exposures into broad classes of assets with differentunderlying risk characteristics, subject to the definitions setout below. The classes of assets are (a) corporate, (b)sovereign, (c) bank, (d) retail, and (e) equity. Within thecorporate asset class, five sub-classes of specialised lendingare separately identified. Within the retail asset class, threesub classes are separately identified. Within the corporate andretail asset classes, a distinct treatment for purchasedreceivables may also apply provided certain conditions aremet.
275. Banks that do not meet the requirements for theestimation of PD under the corporate IRB approach will berequired to map their internal grades to five supervisorycategories, each of which is associated with a specific riskweight.
APRA took a decision not to allow anyinternal modelling of the specialisedlending (SL) risk parameters and toprescribe the more conservative slottingapproach for all SL sub-asset classes.
The difference between the risk weightedasset calculated using the supervisoryslotting methodology and the risk weightedasset calculated using participant banksinternal corporate models was deductedfrom the regulatory risk weighted asset.
The following modelling assumptions wereused :
Current internally calculated PD, LGDand EAD
Exposures were moved to theCorporate Other curve or the OtherSME curve depending on theircharacteristics.
It is noted that the supervisory slottingapproach is a method defined by the Basel

Extracts of rules pertaining to differences
Australian Bankers' AssociationPwC 34
RCAP/ PwCRefs. Description Basel Ref. APRA v BCBS difference Approach taken in this study
Framework, and so arguably not adeparture. However, as noted in RCAP(Australia), the unavailability of internalmodelling approaches for this portfolio isan area of APRA conservatism.Additionally, many comparablejurisdictions (except Singapore) permit theuse of internal modelling for SL. We havetherefore concluded that it is appropriateto estimate the impact on risk weightedassets of using AIRB rather than slottingfor this portfolio.
Definition of capital and transitional arrangements
RCAPAnnex10.1
A3
Intangibleassets –additionaldeductions
Basel III para 67:
Goodwill and all other intangibles must be deducted in thecalculation of Common Equity Tier 1, including any goodwillincluded in the valuation of significant investments in thecapital of banking, financial and insurance entities that areoutside the scope of regulatory consolidation. With theexception of mortgage servicing rights, the full amount is to bededucted net of any associated deferred tax liability whichwould be extinguished if the intangible assets becomeimpaired or derecognised under the relevant accountingstandards. The amount to be deducted in respect of mortgageservicing rights is set out in the threshold deductions sectionbelow.
Basel requires exposures classified asintangible assets under InternationalFinancial Reporting Standards to bededucted from Common Equity Tier 1(CET1) capital. In addition to theseexposures, APRA requires the deductionfrom CET1 capital of certain other itemswhich APRA deems should be treated in asimilar fashion to intangibles (for example,capitalised expenses, capitalisedtransaction costs and mortgage servicingrights).
Add back to CET1 the additionaldeductions required by APRA.
These items were identified from thefollowing items included in capitaladequacy reports submitted to APRA(ARF110).
2.6.1. Loan and lease origination fees andcommissions paid to mortgage originatorsand brokers
2.6.2. Costs associated with debt raisings
2.6.3. Costs associated with issuing capitalinstruments
2.6.5. Securitisation start-up costs
2.6.6. Other capitalised expenses
The above items were added to riskweighted assets, calculated at a risk weightof 100 per cent.
RCAPAnnex
10.2
n/a
Own sharestrading limits –additionaldeductions
Basel III para 78:
All of a bank’s investments in its own common shares,whether held directly or indirectly, will be deducted in thecalculation of Common Equity Tier 1 (unless alreadyderecognised under the relevant accounting standards). Inaddition, any own stock which the bank could be contractually
Basel requires that banks deductinvestments in own shares (treasury stock)from CET1 capital. APRA also requires thededuction of any unused portion of anytrading limits in own shares that have beenagreed with APRA.
Participant banks calculated the portion ofunused trading limits in their own shareswhich are deducted from CET1. This itemwas deemed immaterial, and so noadjustment to add back to CET1 has beenapplied in this study.

Extracts of rules pertaining to differences
Australian Bankers' AssociationPwC 35
RCAP/ PwCRefs. Description Basel Ref. APRA v BCBS difference Approach taken in this study
obliged to purchase should be deducted in the calculation ofCommon Equity Tier 1. The treatment described will applyirrespective of the location of the exposure in the bankingbook or the trading book. In addition:
Gross long positions may be deducted net of shortpositions in the same underlying exposure only if the shortpositions involve no counterparty risk.
Banks should look through holdings of index securities todeduct exposures to own shares. However, gross longpositions in own shares resulting from holdings of indexsecurities may be netted against short position in ownshares resulting from short positions in the sameunderlying index. In such cases the short positions mayinvolve counterparty risk (which will be subject to therelevant counterparty credit risk charge).
This deduction is necessary to avoid the double counting of abank’s own capital. Certain accounting regimes do not permitthe recognition of treasury stock and so this deduction is onlyrelevant where recognition on the balance sheet is permitted.The treatment seeks to remove the double counting that arisesfrom direct holdings, indirect holdings via index funds andpotential future holdings as a result of contractual obligationsto purchase own shares.
Following the same approach outlined above, banks mustdeduct investments in their own Additional Tier 1 in thecalculation of their Additional Tier 1 capital and must deductinvestments in their own Tier 2 in the calculation of their Tier2 capital.
RCAPAnnex
10.3
A4
Reciprocalcross-holdings– additionaldeductions
Basel III para 79:
Reciprocal cross holdings of capital that are designed toartificially inflate the capital position of banks will bededucted in full. Banks must apply a “correspondingdeduction approach” to such investments in the capital ofother banks, other financial institutions and insuranceentities. This means the deduction should be applied to thesame component of capital for which the capital would qualifyif it was issued by the bank itself.
Basel requires reciprocal cross-holdings inthe capital of banking, financial andinsurance entities to be deducted fromCET1 capital. APRA requires the fulldeduction of all holdings of capital ofbanking, financial and insurance entities,regardless of whether they are reciprocal.
Any reciprocal cross holdings as disclosedon participant banks QIS were deductedfrom CET1.
Other deductions (not reciprocal) aretreated as below.

Extracts of rules pertaining to differences
Australian Bankers' AssociationPwC 36
RCAP/ PwCRefs. Description Basel Ref. APRA v BCBS difference Approach taken in this study
RCAPAnnex
10.4
A4
Equityholdings(financialentities) –additionaldeductions
Basel III para 80–81:80. The regulatory adjustment described in this sectionapplies to investments in the capital of banking, financial andinsurance entities that are outside the scope of regulatoryconsolidation and where the bank does not own more than10% of the issued common share capital of the entity. Inaddition: Investments include direct, indirect and synthetic holdings
of capital instruments. For example, banks should lookthrough holdings of index securities to determine theirunderlying holdings of capital.
Holdings in both the banking book and trading book are tobe included. Capital includes common stock and all othertypes of cash and synthetic capital instruments (e.g.subordinated debt). It is the net long position that is to beincluded (i.e. the gross long position net of short positionsin the same underlying exposure where the maturity of theshort position either matches the maturity of the longposition or has a residual maturity of at least one year).
Underwriting positions held for five working days or lesscan be excluded. Underwriting positions held for longerthan five working days must be included.
If the capital instrument of the entity in which the bankhas invested does not meet the criteria for CommonEquity Tier 1, Additional Tier 1, or Tier 2 capital of thebank, the capital is to be considered common shares forthe purposes of this regulatory adjustment.
National discretion applies to allow banks, with priorsupervisory approval, to exclude temporarily certaininvestments where these have been made in the context ofresolving or providing financial assistance to reorganise adistressed institution.
81. If the total of all holdings listed above in aggregate exceed10% of the bank’s common equity (after applying all otherregulatory adjustments in full listed prior to this one) then theamount above 10% is required to be deducted, applying acorresponding deduction approach. This means the deductionshould be applied to the same component of capital for whichthe capital would qualify if it was issued by the bank itself.Accordingly, the amount to be deducted from common equityshould be calculated as the total of all holdings which in
Basel does not require the deduction of theaggregate amount of investments in thecapital of banking, financial and insuranceentities in which the bank owns less than10% of the issued share capital of eachentity where this (aggregate) amount isless than 10% of the bank’s adjusted CET1capital. APRA requires the full amount ofsuch investments to be deducted fromCET1 capital.
The portion of equity investments infinancial and insurance entities below the10 per cent threshold, as identified in eachparticipant banks’ QIS, was added back toCET1. A corresponding adjustment wasadded to risk weighted asset based onBasel defined risk weights.

Extracts of rules pertaining to differences
Australian Bankers' AssociationPwC 37
RCAP/ PwCRefs. Description Basel Ref. APRA v BCBS difference Approach taken in this study
aggregate exceed 10% of the bank’s common equity (as perabove) multiplied by the common equity holdings as apercentage of the total capital holdings. This would result in acommon equity deduction which corresponds to theproportion of total capital holdings held in common equity.Similarly, the amount to be deducted from Additional Tier 1capital should be calculated as the total of all holdings whichin aggregate exceed 10% of the bank’s common equity (as perabove) multiplied by the Additional Tier 1 capital holdings asa percentage of the total capital holdings. The amount to bededucted from Tier 2 capital should be calculated as the totalof all holdings which in aggregate exceed 10% of the bank’scommon equity (as per above) multiplied by the Tier 2 capitalholdings as a percentage of the total capital holdings.
RCAPAnnex
10.5
A5
Deferred taxassets –additionaldeductions
Basel III para 87–89:87. Instead of a full deduction, the following items may eachreceive limited recognition when calculating Common EquityTier 1, with recognition capped at 10% of the bank’s commonequity (after the application of all regulatory adjustments setout in paragraphs 67 to 85): Significant investments in the common shares of
unconsolidated financial institutions (banks, insuranceand other financial entities) as referred to in paragraph84;
Mortgage servicing rights (MSRs); and DTAs that arise from temporary differences.88. On 1 January 2013, a bank must deduct the amount bywhich the aggregate of the three items above exceeds 15% ofits common equity component of Tier 1 (calculated prior tothe deduction of these items but after application of all otherregulatory adjustments applied in the calculation of CommonEquity Tier 1). The items included in the 15% aggregate limitare subject to full disclosure. As of 1 January 2018, thecalculation of the 15% limit will be subject to the followingtreatment: the amount of the three items that remainsrecognised after the application of all regulatory adjustmentsmust not exceed 15% of the CET1 capital, calculated after allregulatory adjustments. See Annex 2 for an example.89. The amount of the three items that are not deducted in thecalculation of Common Equity Tier 1 will be risk weighted at250%.
APRA did not adopt the thresholddeduction approach for deferred tax assetsfor temporary differences, significantinvestments in unconsolidated financialentities and mortgage servicing rights.Instead, these exposures must be deductedin full from CET1 capital.
The portion of Deferred Tax Assets withinthe Basel threshold as calculated in theparticipant banks QIS was added back toCET1; a corresponding addition was addedto risk weighted assets, at a weighting of250 per cent.

Extracts of rules pertaining to differences
Australian Bankers' AssociationPwC 38
RCAP/ PwCRefs. Description Basel Ref. APRA v BCBS difference Approach taken in this study
RCAPAnnex
10.6
n/a
Basel IIIcapital ratiostransitionalarrangements -not applied
Basel III para 94:
The transitional arrangements for implementing the newstandards will help to ensure that the banking sector can meetthe higher capital standards through reasonable earningsretention and capital raising, while still supporting lending tothe economy. The transitional arrangements include:
a) National implementation by member countries will beginon 1 January 2013. Member countries must translate therules into national laws and regulations before this date.As of 1 January 2013, banks will be required to meet thefollowing new minimum requirements in relation to riskweighted assets (RWAs):
– 3.5% Common Equity Tier 1/RWAs;
– 4.5% Tier 1 capital/RWAs, and
– 8.0% total capital/RWAs.
b) The minimum Common Equity Tier 1 and Tier 1requirements will be phased in between 1 January 2013and 1 January 2015. On 1 January 2013, the minimumCommon Equity Tier 1 requirement will rise from thecurrent 2% level to 3.5%. The Tier 1 capital requirementwill rise from 4% to 4.5%. On 1 January 2014, banks willhave to meet a 4% minimum Common Equity Tier 1requirement and a Tier 1 requirement of 5.5%. On 1January 2015, banks will have to meet the 4.5% CommonEquity Tier 1 and the 6% Tier 1 requirements. The totalcapital requirement remains at the existing level of 8.0%and so does not need to be phased in. The differencebetween the total capital requirement of 8.0% and theTier 1 requirement can be met with Tier 2 and higherforms of capital.
See Basel III for paras (c) -(g) for further details oftransitional arrangements.
APRA did not provide transition for theBasel III minimum capital ratios,regulatory adjustments (deductions) or thetreatment of minority interest and othercapital held by third parties. Theserequirements came into effect on 1 January2013.
This area of conservatism impacts absolutelevels of capital required, but does notimpact the actual calculation of a disclosedratio for comparison purposes.
Additionally the focus of this report is on afull implementation basis.
Accordingly no adjustment has been madefor this item.
RCAPAnnex
10.7
n/a
Basel IIIcapitalinstrumentstransitionalarrangements -not applied
Basel III para 95–96:
95. Capital instruments that do not meet the criteria forinclusion in Common Equity Tier 1 will be excluded fromCommon Equity Tier 1 as of 1 January 2013. However,instruments meeting the following three conditions will bephased out over the same horizon described in paragraph
Basel details transitional arrangements forcapital instruments issued before 1January 2013. APRA had more stringenttransitional arrangements for capitalinstruments issued before this date.
The focus of this report is on fullyimplemented CET1.
Accordingly no adjustment has been madefor this item.

Extracts of rules pertaining to differences
Australian Bankers' AssociationPwC 39
RCAP/ PwCRefs. Description Basel Ref. APRA v BCBS difference Approach taken in this study
94(g): (1) they are issued by a non-joint stock company33; (2)they are treated as equity under the prevailing accountingstandards; and (3) they receive unlimited recognition as partof Tier 1 capital under current national banking law.
96. Only those instruments issued before 12 September 2010qualify for the above transition arrangements.
RCAPAnnex
10.8
n/a
Basel IIIcapital bufferstransitionalarrangements– not applied
Basel III para 133–135 and 150:
133. The capital conservation buffer will be phased in between1 January 2016 and year end 2018 becoming fully effective on1 January 2019. It will begin at 0.625% of RWAs on 1 January2016 and increase each subsequent year by an additional0.625 percentage points, to reach its final level of 2.5% ofRWAs on 1 January 2019. Countries that experience excessivecredit growth should consider accelerating the build up of thecapital conservation buffer and the countercyclical buffer.National authorities have the discretion to impose shortertransition periods and should do so where appropriate.
134. Banks that already meet the minimum ratio requirementduring the transition period but remain below the 7%Common Equity Tier 1 target (minimum plus conservationbuffer) should maintain prudent earnings retention policieswith a view to meeting the conservation buffer as soon asreasonably possible.
135. The division of the buffer into quartiles that determinethe minimum capital conservation ratios will begin on 1January 2016. These quartiles will expand as the capitalconservation buffer is phased in and will take into account anycountercyclical buffer in effect during this period.
150. The countercyclical buffer regime will be phased-in inparallel with the capital conservation buffer between 1January 2016 and year end 2018 becoming fully effective on 1January 2019. This means that the maximum countercyclicalbuffer requirement will begin at 0.625% of RWAs on 1January 2016 and increase each subsequent year by anadditional 0.625 percentage points, to reach its finalmaximum of 2.5% of RWAs on 1 January 2019. Countries thatexperience excessive credit growth during this transitionperiod will consider accelerating the build up of the capitalconservation buffer and the countercyclical buffer. In
APRA will not implement the transitionalarrangements for the capital conservationand countercyclical capital buffers.Authorised deposit-taking institutions(ADIs) will be required to meet these infull from 1 January 2016.
This area of conservatism impacts absolutelevels of capital required, but does notimpact the actual calculation of a disclosedratio for comparison purposes.
Additionally the focus of this report is on afull implementation basis.
Accordingly no adjustment has been madefor this item.

Extracts of rules pertaining to differences
Australian Bankers' AssociationPwC 40
RCAP/ PwCRefs. Description Basel Ref. APRA v BCBS difference Approach taken in this study
addition, jurisdictions may choose to implement largercountercyclical buffer requirements. In such cases thereciprocity provisions of the regime will not apply to theadditional amounts or earlier time-frames.
Credit risk: Standardised Approach
RCAPAnnex
10.9
A6
Retailexposures –risk weight100%
Basel II para 69:
69. Claims that qualify under the criteria listed in paragraph70 may be considered as retail claims for regulatory capitalpurposes and included in a regulatory retail portfolio.Exposures included in such a portfolio may be risk-weightedat 75%, except as provided in paragraph 75 for past due loans.
APRA did not adopt the 75% risk weightfor retail exposures; such exposures arerisk weighted at 100%.
Reduce risk weighting to 75 per cent onrelevant portfolios subject to thestandardised approach.
RCAPAnnex
10.10
A6
Retailmortgage risk– risk weight ≥ 35%
Basel II para 72:
72. Lending fully secured by mortgages on residentialproperty that is or will be occupied by the borrower, or that isrented, will be risk weighted at 35%. In applying the 35%weight, the supervisory authorities should satisfy themselves,according to their national arrangements for the provision ofhousing finance, that this concessionary weight is appliedrestrictively for residential purposes and in accordance withstrict prudential criteria, such as the existence of substantialmargin of additional security over the amount of the loanbased on strict valuation rules. Supervisors should increasethe standard risk weight where they judge the criteria are notmet.
Basel allows claims secured by residentialproperty to be risk weighted at 35%. APRAintroduced a residential mortgage riskweight matrix whereby the risk weights forexposures secured by residential propertyrange from 35% to 100%.
Reduce risk weighting to 35 per cent onrelevant portfolios subject to thestandardised approach.
RCAPAnnex
10.11
A7
Margin lendingexposures -risk weight ≥ 20%
Basel II Credit risk mitigation:
145. The following collateral instruments are eligible forrecognition in the simple approach:
a) Cash (as well as certificates of deposit or comparableinstruments issued by the lending bank) on deposit withthe bank which is incurring the counterparty exposure
b) Gold.c) Debt securities rated by a recognised external credit
assessment institution where these are either:
– at least BB- when issued by sovereigns or PSEs that aretreated as sovereigns by the national supervisor; or
– at least BBB- when issued by other entities (including
Basel II credit risk mitigation techniqueswould generally result in a minimal capitalcharge for margin lending exposures.Instead, APRA has set a 20% risk weightfor margin lending exposures secured bylisted instruments on recognisedexchanges (unless subject to deductionunder APS 111). Otherwise (e.g. where theunderlying instruments are unlisted) theADI must treat the exposure as a securedloan (unless subject to deduction underAPS 111).
Reduce risk weighting to reflect impact ofapplying qualifying collateral to marginlending in line with Basel text.

Extracts of rules pertaining to differences
Australian Bankers' AssociationPwC 41
RCAP/ PwCRefs. Description Basel Ref. APRA v BCBS difference Approach taken in this study
banks and securities firms); or
– at least A-3/P-3 for short-term debt instruments.
d) Debt securities not rated by a recognised external creditassessment institution where these are:
– issued by a bank; and
– listed on a recognised exchange; and
– classified as senior debt; and
– all rated issues of the same seniority by the issuingbank must be rated at least BBB- or A-3/P-3 by arecognised external credit assessment institution; and
– the bank holding the securities as collateral has noinformation to suggest that the issue justifies a ratingbelow BBB- or A-3/P-3 (as applicable); and
– the supervisor is sufficiently confident about themarket liquidity of the security.
e) Equities (including convertible bonds) that are includedin a main index.
f) Undertakings for Collective Investments in TransferableSecurities (UCITS) and mutual funds where:
– a price for the units is publicly quoted daily; and
– the UCITS/mutual fund is limited to investing in theinstruments listed in this paragraph
Note: RCAP refers to Basel II ‘Credit Risk Mitigation’ as therelevant Basel reference. Only Basel II paragraph 145 hasbeen included in this table.
Credit risk: Internal Ratings-Based approach
RCAPAnnex
10.12
A7
Margin lending– IRBapproach notallowed
Basel II para 215:Under the IRB approach, banks must categorise banking-bookexposures into broad classes of assets with differentunderlying risk characteristics, subject to the definitions setout below. The classes of assets are (a) corporate, (b)sovereign, (c) bank, (d) retail, and (e) equity. Within thecorporate asset class, five sub-classes of specialised lendingare separately identified. Within the retail asset class, threesub-classes are separately identified. Within the corporate andretail asset classes, a distinct treatment for purchasedreceivables may also apply provided certain conditions aremet.
Under the Basel IRB approach, banks mustcategorise banking book exposures intofive broad asset classes: (a) corporate, (b)sovereign, (c) bank, (d) retail and (e)equity. APRA does not include marginlending exposures in these IRB portfolios.The risk weights for such exposures are thesame as under APRA’s standardisedapproach (refer to item 11 above). Thisresults in a considerably higher capitalcharge than would be expected under theBasel IRB treatment.
As APRA does not permit inclusion ofmargin lending in the IRB portfolioparticipant banks were not able to quantifythe risk weighted asset impact if theseexposures to be measured using the IRBapproach. The impact was quantifiedunder the standardised approach in item 11above.

Extracts of rules pertaining to differences
Australian Bankers' AssociationPwC 42
RCAP/ PwCRefs. Description Basel Ref. APRA v BCBS difference Approach taken in this study
RCAPAnnex
10.13
A8
Small businessexposures -threshold of$1M
Basel II para 232:
The exposure must be one of a large pool of exposures, whichare managed by the bank on a pooled basis. Supervisors maychoose to set a minimum number of exposures within a poolfor exposures in that pool to be treated as retail.
Small business exposures below €1 million may be treatedas retail exposures if the bank treats such exposures in itsinternal risk management systems consistently over timeand in the same manner as other retail exposures. Thisrequires that such an exposure be originated in a similarmanner to other retail exposures. Furthermore, it mustnot be managed individually in a way comparable tocorporate exposures, but rather as part of a portfoliosegment or pool of exposures with similar riskcharacteristics for purposes of risk assessment andquantification. However, this does not preclude retailexposures from being treated individually at some stagesof the risk management process. The fact that an exposureis rated individually does not by itself deny the eligibilityas a retail exposure.
Basel II set a threshold of EUR 1 millionfor small business exposures to be includedin the retail portfolio. APRA converted thisthreshold to Australian dollars on a 1:1basis (effectively setting a lowerthreshold).
Participant banks calculated the riskweighted asset impact if the current retailthreshold was increased to $1.6m from$1m.
RCAPAnnex
10.14
A8
Retailrevolvingexposure –threshold of$100K
Basel II para 234:
All of the following criteria must be satisfied for a sub-portfolio to be treated as a qualifying revolving retail exposure(QRRE). These criteria must be applied at a sub-portfoliolevel consistent with the bank’s segmentation of its retailactivities generally. Segmentation at the national or countrylevel (or below) should be the general rule.
a) The exposures are revolving, unsecured, anduncommitted (both contractually and in practice). In thiscontext, revolving exposures are defined as those wherecustomers’ outstanding balances are permitted tofluctuate based on their decisions to borrow and repay,up to a limit established by the bank.
b) The exposures are to individuals.c) The maximum exposure to a single individual in the sub-
portfolio is €100,000 or less.d) Because the asset correlation assumptions for the QRRE
risk weight function are markedly below those for theother retail risk weight function at low PD values, banks
Basel II sets the maximum exposure to asingle individual in the qualifyingrevolving retail sub-portfolio at EUR 1million. APRA converted this threshold toAustralian dollars on a 1:1 basis (effectivelysetting a lower threshold). In addition,APRA does not allow exposures forbusiness purposes to be included in thequalifying revolving retail portfolio. Such(otherwise qualifying) exposures fall intothe other retail portfolio (or possibly thecorporate portfolio), which results in ahigher capital requirement.
Note: Error noted in RCAP - per Basel IIpara 234: maximum exposure to singleindividual in the sub-portfolio is €100,000or less.
Participant banks calculated the riskweighted asset impact if the current retailthreshold was increased to $160k from$100k.

Extracts of rules pertaining to differences
Australian Bankers' AssociationPwC 43
RCAP/ PwCRefs. Description Basel Ref. APRA v BCBS difference Approach taken in this study
must demonstrate that the use of the QRRE risk weightfunction is constrained to portfolios that have exhibitedlow volatility of loss rates, relative to their average level ofloss rates, especially within the low PD bands.Supervisors will review the relative volatility of loss ratesacross the QRRE subportfolios, as well as the aggregateQRRE portfolio, and intend to share information on thetypical characteristics of QRRE loss rates acrossjurisdictions.
e) Data on loss rates for the sub-portfolio must be retainedin order to allow analysis of the volatility of loss rates.
f) The supervisor must concur that treatment as aqualifying revolving retail exposure is consistent with theunderlying risk characteristics of the sub-portfolio.
RCAPAnnex
10.15
A8
SMEs– $50Mturnoverthreshold
Basel II para 273:
Under the IRB approach for corporate credits, banks will bepermitted to separately distinguish exposures to SMEborrowers (defined as corporate exposures where the reportedsales for the consolidated group of which the firm is a part isless than €50 million) from those to large firms. A firm-sizeadjustment (i.e. 0.04 x (1 – (S – 5) / 45)) is made to thecorporate risk weight formula for exposures to SMEborrowers. S is expressed as total annual sales in millions ofeuros with values of S falling in the range of equal to or lessthan €50 million or greater than or equal to €5 million.Reported sales of less than €5 million will be treated as if theywere equivalent to €5 million for the purposes of the firm-sizeadjustment for SME borrowers.
The Basel II firm size adjustment for smalland medium-sized entities that are riskweighted on the corporate curve cuts outfor firms with turnover above EUR 50million. APRA converted this threshold toAustralian dollars on a 1:1 basis (effectivelysetting a lower threshold).
Participant banks calculated the impact onRWAs of increasing the SME thresholdfrom $50m turnover to $80m.
RCAPAnnex
10.16
n/a
FoundationIRB - othercollateral notrecognised
Basel II para 295 :
The methodology for determining the effective LGD under thefoundation approach for cases where banks have takeneligible IRB collateral to secure a corporate exposure is asfollows.
Exposures where the minimum eligibility requirementsare met, but the ratio of the current value of the collateralreceived (C) to the current value of the exposure (E) isbelow a threshold level of C* (i.e. the required minimumcollateralisation level for the exposure) would receive theappropriate LGD for unsecured exposures or those
Although Basel II allows other collateral tobe recognised under the foundation IRBapproach, APRA does not recognise othercollateral in these circumstances. UnderAPRA’s standards, if collateral does notmeet the requirements for eligible financialcollateral, financial receivables orresidential or commercial real estate, theexposure must be considered unsecuredand assigned a higher loss-given-defaultestimate under the foundation IRBapproach.
No participant banks use the FoundationIRB approach for these portfolios – noadjustment made for this item.

Extracts of rules pertaining to differences
Australian Bankers' AssociationPwC 44
RCAP/ PwCRefs. Description Basel Ref. APRA v BCBS difference Approach taken in this study
secured by collateral which is not eligible financialcollateral or eligible IRB collateral.
Exposures where the ratio of C to E exceeds a second,higher threshold level of C** (i.e. the required level ofover-collateralisation for full LGD recognition) would beassigned an LGD according to the following table.
The following table displays the applicable LGD and requiredover collateralisation levels for the secured parts of seniorexposures:
(Also see paras 521–522)
RCAPAnnex
10.17
n/a
FoundationIRB - 100%CCF forcommitmentsetc
Basel II para 312:
312. A CCF of 75% will be applied to commitments, NIFs andRUFs regardless of the maturity of the underlying facility.This does not apply to those facilities which are uncommitted,that are unconditionally cancellable, or that effectivelyprovide for automatic cancellation, for example due todeterioration in a borrower’s creditworthiness, at any time bythe bank without prior notice. A CCF of 0% will be applied tothese facilities.
(also see paras 366–367 for purchased receivables)
Under the foundation IRB approach, banksmay assign a 75% credit conversion factorfor commitments, note issuance facilitiesand revolving underwriting facilities.APRA has set the standard supervisorycredit conversion factor to 100% for suchexposures.
No participant banks use the FoundationIRB approach for these portfolios – noadjustment made for this item.
RCAPAnnex
10.18
n/a
Excess eligibleprovisions –not included incapital
Basel II para 384–385 (and 43):
384. As specified in paragraph 43, banks using the IRBapproach must compare the total amount of total eligibleprovisions (as defined in paragraph 380) with the total ELamount as calculated within the IRB approach (as defined inparagraph 375). In addition, paragraph 42 outlines thetreatment for that portion of a bank that is subject to thestandardised approach to credit risk when the bank uses boththe standardised and IRB approaches.
385. Where the calculated EL amount is lower than theprovisions of the bank, its supervisors must consider whetherthe EL fully reflects the conditions in the market in which itoperates before allowing the difference to be included in Tier2 capital. If specific provisions exceed the EL amount ondefaulted assets this assessment also needs to be made beforeusing the difference to offset the EL amount on non-defaultedassets.
Banks must compare the total amount ofeligible provisions with a total expectedloss amount. Where the expected lossamount is less than the provision amount,Basel says that the difference may beincluded in Tier 2 capital subject tosupervisors’ satisfaction that the bank’sexpected loss fully reflects the conditionsin the market. APRA is arguably moreconservative in that prohibits any excessprovision related to defaulted exposures tobe included in Tier 2 capital.
This impacts Total Capital. An impact forthis difference was not calculated for thisstudy as the focus is on CET1.
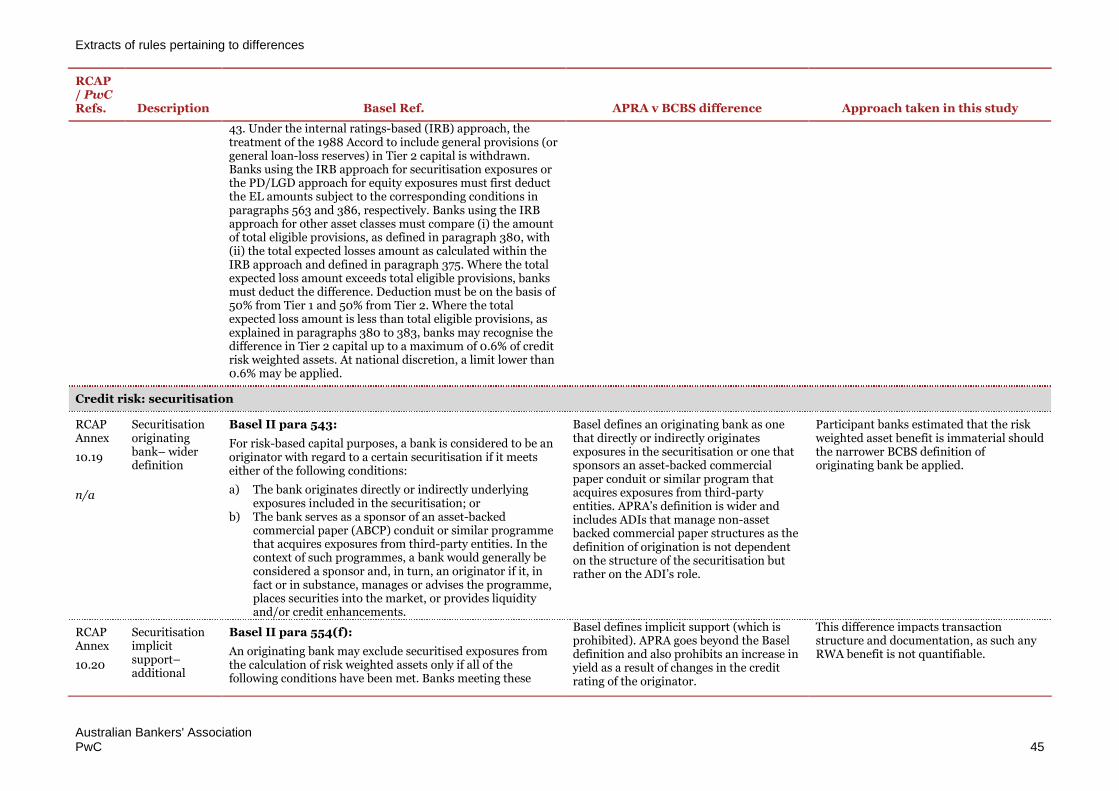
Extracts of rules pertaining to differences
Australian Bankers' AssociationPwC 45
RCAP/ PwCRefs. Description Basel Ref. APRA v BCBS difference Approach taken in this study
43. Under the internal ratings-based (IRB) approach, thetreatment of the 1988 Accord to include general provisions (orgeneral loan-loss reserves) in Tier 2 capital is withdrawn.Banks using the IRB approach for securitisation exposures orthe PD/LGD approach for equity exposures must first deductthe EL amounts subject to the corresponding conditions inparagraphs 563 and 386, respectively. Banks using the IRBapproach for other asset classes must compare (i) the amountof total eligible provisions, as defined in paragraph 380, with(ii) the total expected losses amount as calculated within theIRB approach and defined in paragraph 375. Where the totalexpected loss amount exceeds total eligible provisions, banksmust deduct the difference. Deduction must be on the basis of50% from Tier 1 and 50% from Tier 2. Where the totalexpected loss amount is less than total eligible provisions, asexplained in paragraphs 380 to 383, banks may recognise thedifference in Tier 2 capital up to a maximum of 0.6% of creditrisk weighted assets. At national discretion, a limit lower than0.6% may be applied.
Credit risk: securitisation
RCAPAnnex
10.19
n/a
Securitisationoriginatingbank– widerdefinition
Basel II para 543:
For risk-based capital purposes, a bank is considered to be anoriginator with regard to a certain securitisation if it meetseither of the following conditions:
a) The bank originates directly or indirectly underlyingexposures included in the securitisation; or
b) The bank serves as a sponsor of an asset-backedcommercial paper (ABCP) conduit or similar programmethat acquires exposures from third-party entities. In thecontext of such programmes, a bank would generally beconsidered a sponsor and, in turn, an originator if it, infact or in substance, manages or advises the programme,places securities into the market, or provides liquidityand/or credit enhancements.
Basel defines an originating bank as onethat directly or indirectly originatesexposures in the securitisation or one thatsponsors an asset-backed commercialpaper conduit or similar program thatacquires exposures from third-partyentities. APRA’s definition is wider andincludes ADIs that manage non-assetbacked commercial paper structures as thedefinition of origination is not dependenton the structure of the securitisation butrather on the ADI’s role.
Participant banks estimated that the riskweighted asset benefit is immaterial shouldthe narrower BCBS definition oforiginating bank be applied.
RCAPAnnex
10.20
Securitisationimplicitsupport–additional
Basel II para 554(f):
An originating bank may exclude securitised exposures fromthe calculation of risk weighted assets only if all of thefollowing conditions have been met. Banks meeting these
Basel defines implicit support (which isprohibited). APRA goes beyond the Baseldefinition and also prohibits an increase inyield as a result of changes in the creditrating of the originator.
This difference impacts transactionstructure and documentation, as such anyRWA benefit is not quantifiable.

Extracts of rules pertaining to differences
Australian Bankers' AssociationPwC 46
RCAP/ PwCRefs. Description Basel Ref. APRA v BCBS difference Approach taken in this study
n/a prohibitions conditions must still hold regulatory capital against anysecuritisation exposures they retain.
f) The securitisation does not contain clauses that (i)require the originating bank to alter systematically theunderlying exposures such that the pool’s weightedaverage credit quality is improved unless this is achievedby selling assets to independent and unaffiliated thirdparties at market prices; (ii) allow for increases in aretained first loss position or credit enhancementprovided by the originating bank after the transaction’sinception; or (iii) increase the yield payable to partiesother than the originating bank, such as investors andthird-party providers of credit enhancements, in responseto a deterioration in the credit quality of the underlyingpool.
Operational risk: Advanced Measurement Approaches
RCAPAnnex
10.21
n/a
Foreign banksubsidiaries –additionalconditions
Basel II para 656:
A bank adopting the AMA may, with the approval of its hostsupervisors and the support of its home supervisor, use anallocation mechanism for the purpose of determining theregulatory capital requirement for internationally activebanking subsidiaries that are not deemed to be significantrelative to the overall banking group but are themselvessubject to this Framework in accordance with Part 1.Supervisory approval would be conditional on the bankdemonstrating to the satisfaction of the relevant supervisorsthat the allocation mechanism for these subsidiaries isappropriate and can be supported empirically. The board ofdirectors and senior management of each subsidiary areresponsible for conducting their own assessment of thesubsidiary’s operational risks and controls and ensuring thesubsidiary is adequately capitalised in respect of those risks.
Basel allows foreign bank subsidiaries touse the parent bank’s allocationmechanism for the purpose of determiningthe regulatory capital requirement foroperational risk at that level if the hostregulator accepts the mechanism. APRAhas set out detailed conditions and criteriaa foreign bank subsidiary must satisfybefore its allocation mechanism isrecognised for regulatory capital purposes.This includes requirements aroundsufficiency of allocated capital, appropriaterisk-sensitivity of the allocationmechanism, controls on data andgovernance and the operational riskmanagement framework aligning to theAdvanced Measurement Approaches(AMA) (not simply the allocationmechanism). APRA also requires that thehome supervisor’s requirements (relatingto the AMA) are sufficiently similar tothose of APRA.
Not applicable - none of the participantbanks are subsidiaries of foreign parentbanks.

Extracts of rules pertaining to differences
Australian Bankers' AssociationPwC 47
RCAP/ PwCRefs. Description Basel Ref. APRA v BCBS difference Approach taken in this study
RCAPAnnex
10.22
n/a
Operationalrisk AMAcriteria
Basel II para 664:
664. In order to qualify for use of the AMA a bank must satisfyits supervisor that, at a minimum:
Its board of directors and senior management, asappropriate, are actively involved in the oversight of theoperational risk management framework;
It has an operational risk management system that isconceptually sound and is implemented with integrity;and
It has sufficient resources in the use of the approach in themajor business lines as well as the control and audit areas.
Basel II includes specific risk managementand governance criteria for use of theAMA. APRA’s requirements are in somerespects more precise and detailedincluding specific requirements relating toBoard and senior managementresponsibilities and the operational riskmanagement function.
This difference is seen procedural innature and as such not quantifiable inRWA or capital terms.
RCAPAnnex
10.23
A9
Operationalrisk AMAquantitativestandards
Basel II para 667–668:
667. Given the continuing evolution of analytical approachesfor operational risk, the Committee is not specifying theapproach or distributional assumptions used to generate theoperational risk measure for regulatory capital purposes.However, a bank must be able to demonstrate that itsapproach captures potentially severe ‘tail’ loss events.Whatever approach is used, a bank must demonstrate that itsoperational risk measure meets a soundness standardcomparable to that of the internal ratings based approach forcredit risk, (i.e. comparable to a one year holding period and a99.9th percentile confidence interval).
668. The Committee recognises that the AMA soundnessstandard provides significant flexibility to banks in thedevelopment of an operational risk measurement andmanagement system. However, in the development of thesesystems, banks must have and maintain rigorous proceduresfor operational risk model development and independentmodel validation. Prior to implementation, the Committeewill review evolving industry practices regarding credible andconsistent estimates of potential operational losses. It will alsoreview accumulated data, and the level of capitalrequirements estimated by the AMA, and may refine itsproposals if appropriate.
Basel II sets quantitative standardsregarding AMA soundness. APRA explicitlyrequires a number of elements regardingconservatism in modelling choices andassumptions including comprehensive andrigorous sensitivity analysis. Theserequirements are also applied to changesto the operational risk measurementsystem. APRA also requires ADIs toconsider and document evolving industrypractices in assessing its own practices.
Participant banks were asked to quantifythe impact of not applying the APRAconservatism in modelling assumptions.

Extracts of rules pertaining to differences
Australian Bankers' AssociationPwC 48
RCAP/ PwCRefs. Description Basel Ref. APRA v BCBS difference Approach taken in this study
RCAPAnnex
10.24
A9
OperationalRisk - fraudrelated losses
Basel II para 673:
To qualify for regulatory capital purposes, a bank’s internalloss collection processes must meet the following standards:
To assist in supervisory validation, a bank must be able tomap its historical internal loss data into the relevant level1 supervisory categories defined in Annexes 8 and 9 and toprovide these data to supervisors upon request. It musthave documented, objective criteria for allocating losses tothe specified business lines and event types. However, it isleft to the bank to decide the extent to which it appliesthese categorisations in its internal operational riskmeasurement system.
A bank’s internal loss data must be comprehensive in thatit captures all material activities and exposures from allappropriate sub-systems and geographic locations. A bankmust be able to justify that any excluded activities orexposures, both individually and in combination, wouldnot have a material impact on the overall risk estimates. Abank must have an appropriate de minimis gross lossthreshold for internal loss data collection, for example€10,000. The appropriate threshold may vary somewhatbetween banks, and within a bank across business linesand/or event types. However, particular thresholds shouldbe broadly consistent with those used by peer banks.
Aside from information on gross loss amounts, a bankshould collect information about the date of the event, anyrecoveries of gross loss amounts, as well as somedescriptive information about the drivers or causes of theloss event. The level of detail of any descriptiveinformation should be commensurate with the size of thegross loss amount.
A bank must develop specific criteria for assigning lossdata arising from an event in a centralised function (e.g.an information technology department) or an activity thatspans more than one business line, as well as from relatedevents over time.
Operational risk losses that are related to credit risk andhave historically been included in banks’ credit riskdatabases (e.g. collateral management failures) will
Basel provides guidance on operationalrisk losses that are related to credit risk. Inaddition to the Basel guidance, APRArequires fraud perpetrated by parties otherthan the borrower to be treated asoperational risk (rather than credit-related) for the purpose of determiningregulatory capital.
Participant banks were asked to quantifythe impact of not applying the APRArequirement of allocating fraudperpetrated by parties other thanborrowers of the bank.

Extracts of rules pertaining to differences
Australian Bankers' AssociationPwC 49
RCAP/ PwCRefs. Description Basel Ref. APRA v BCBS difference Approach taken in this study
continue to be treated as credit risk for the purposes ofcalculating minimum regulatory capital under thisFramework. Therefore, such losses will not be subject tothe operational risk capital charge.109 Nevertheless, forthe purposes of internal operational risk management,banks must identify all material operational risk lossesconsistent with the scope of the definition of operationalrisk (as set out in paragraph 644 and the loss event typesoutlined in Annex 9), including those related to credit risk.Such material operational risk-related credit risk lossesshould be flagged separately within a bank’s internaloperational risk database. The materiality of these lossesmay vary between banks, and within a bank acrossbusiness lines and/or event types. Materiality thresholdsshould be broadly consistent with those used by peerbanks.
Operational risk losses that are related to market risk aretreated as operational risk for the purposes of calculatingminimum regulatory capital under this Framework andwill therefore be subject to the operational risk capitalcharge.
Counterparty credit risk
RCAPAnnex
10.25
A10
CounterpartyCredit Risk -EAD > 0
Basel II Annex 4 para 7–8:
7. Under all of the three methods identified in this Annex,when a bank purchases credit derivative protection against abanking book exposure, or against a counterparty credit riskexposure, it will determine its capital requirement for thehedged exposure subject to the criteria and general rules forthe recognition of credit derivatives, i.e. substitution or doubledefault rules as appropriate. Where these rules apply, theexposure amount or EAD for counterparty credit risk fromsuch instruments is zero.
8. The exposure amount or EAD for counterparty credit risk iszero for sold credit default swaps in the banking book wherethey are treated in the framework as a guarantee provided bythe bank and subject to a credit risk charge for the fullnotional amount.
Basel sets the exposure at default estimatefor counterparty credit risk for creditderivative protection at zero. APRAimposes a more stringent requirement asthe exposure at default amount for suchexposures is not set at zero.
Participant banks were asked to quantifythe risk weighted asset impact of changingthe EAD for credit derivative protection atzero.

Extracts of rules pertaining to differences
Australian Bankers' AssociationPwC 50
RCAP/ PwCRefs. Description Basel Ref. APRA v BCBS difference Approach taken in this study
Market risk
RCAPAnnex
10.26
n/a
Correlationtradingportfolio
Revisions to the Basel II market risk framework(updated December 2010):
Paragraph 709(ii) of the Basel II Framework will be changedas follows, and a new paragraph 709(ii-1-) will be introduced.Changed and new wording is underlined.
709(ii). The minimum capital requirement is expressed interms of two separately calculated charges, one applying tothe “specific risk” of each security, whether it is a short or along position, and the other to the interest rate risk in theportfolio (termed “general market risk”) where long and shortpositions in different securities or instruments can be offset.The bank must, however, determine the specific risk capitalcharge for the correlation trading portfolio as follows: Thebank computes (i) the total specific risk capital charges thatwould apply just to the net long positions from the net longcorrelation trading exposures combined, and (ii) the totalspecific risk capital charges that would apply just to the netshort positions from the net short correlation tradingexposures combined. The larger of these total amounts is thenthe specific risk capital charge for the correlation tradingportfolio.
Given that managing a correlation tradingportfolio introduces additional complexityand risk, ADIs must seek APRA’s approvalin order to use the more favourable capitaltreatment.
Participant banks were asked to quantifythe impact of applying more favourableBCBS treatment for correlation tradingportfolios. Participants determined theimpact was not material.
Pillar 2
RCAPAnnex
10.27
A11
IRRBB - Pillar1 inclusion
Basel II para 763–764:
763. The revised guidance on interest rate risk recognisesbanks’ internal systems as the principal tool for themeasurement of interest rate risk in the banking book and thesupervisory response. To facilitate supervisors’ monitoring ofinterest rate risk exposures across institutions, banks wouldhave to provide the results of their internal measurementsystems, expressed in terms of economic value relative tocapital, using a standardised interest rate shock.
764. If supervisors determine that banks are not holdingcapital commensurate with the level of interest rate risk, theymust require the bank to reduce its risk, to hold a specificadditional amount of capital or some combination of the two.Supervisors should be particularly attentive to the sufficiency
Basel includes interest rate risk in thebanking book (IRRBB) as a Pillar 2consideration. APRA requires a mandatoryPillar 1 capital charge for IRRBB for thoseADIs using the IRB approach to credit riskand the AMA for operational risk.
The current Pillar 1 IRRBB risk weightedasset was reduced to zero.

Extracts of rules pertaining to differences
Australian Bankers' AssociationPwC 51
RCAP/ PwCRefs. Description Basel Ref. APRA v BCBS difference Approach taken in this study
of capital of ‘outlier banks’ where economic value declines bymore than 20% of the sum of Tier 1 and Tier 2 capital as aresult of a standardised interest rate shock (200 basis points)or its equivalent, as described in the supporting documentPrinciples for the Management and Supervision of InterestRate Risk.

Australian Bankers' AssociationPwC 52
Appendix G Names of Australian banks and jurisdictionalpeers used in this analysis
Australian major banks
No. Bank full name Abbreviation
1 Australia and New Zealand Banking Group ANZ
2 Commonwealth Bank of Australia CBA
3 National Australia Bank Ltd. NAB
4 Westpac Banking Corporation WBC
Jurisdictional peers in Canada, Singapore, UK, Japan, Switzerland and Germany
No. Jurisdiction Bank full name Abbreviation
1 Canada Royal Bank Canada RBC
2 Canada Toronto-Dominion Bank TD
3 Canada The Bank of Nova Scotia BNS
4 Canada Bank of Montreal BMO
5 Canada Canadian Imperial Bank of Commerce CIBC
6 Singapore DBS Group Holdings Ltd DBS
7 Singapore Oversea-Chinese Banking Corporation Limited OCBC
8 UK HSBC Holdings PLC HSBC
9 UK Barclays PLC BARC
10 UK Royal Bank of Scotland Group PLC RBS
11 UK Lloyds Banking Group PLC LLOY
12 UK Standard Chartered Bank SCB
13 Japan Mitsubishi UFJ Financial Group Inc. MUFG
14 Japan Sumitomo Mitsui Trust Holdings Inc. SMTH
15 Switzerland Credit Suisse Group AG Credit Suisse
16 Switzerland UBS Group AG UBS
17 Germany Deutsche Bank AG DBK
18 Germany Commerzbank AG CBK

Australian Bankers' AssociationPwC 53
Appendix H Glossary
ABA Australian Bankers' Association
ABCP Asset-backed commercial paper
ADC Acquisition, development and construction
ADI Authorised deposit-taking institution
Advanced banks Banks which have been accredited to use their own models for calculating risk weighted assets
AIRB (or Advanced IRB) Advanced internal ratings-based approach
AMA Advanced measurement approaches
APRA Australian Prudential Regulation Authority
Basel Framework Basel Framework includes Basel II, Basel 2.5 and Basel III and refers a number of documents. Refer to the BCBS’ Regulatory ConsistencyAssessment Programme (RCAP), Assessment of Basel III regulations – Canada June 2014, Annex 3: List of capital standards under theBasel Framework used for assessment.
BCBS Basel Committee on Banking Supervision
BIS Bank for International Settlements
CAR Canadian Capital Adequacy Requirements
CCF Credit conversion factor
CET1 Common Equity Tier 1
CET1 (APRA) Measurement using applicable Australian rules
CET1 (Basel Framework) Measurement using Basel Framework rules
CET1 (Canadian) Australian and Canadian banks on a CET1 (Canadian) basis
CET1 (German) Australian and German banks on a CET1 (German) basis
CET1 (Japanese) Australian and Japanese banks on a CET1 (Japanese) basis
CET1 (Singaporean) Australian and Singaporean banks on a CET1 (Singaporean) basis
CET1 (Swiss) Australian and Swiss banks on a CET1 (Swiss) basis
CET1 (UK) Australian and UK banks on a CET1 (UK) basis
CRR Capital Requirements Regulation
D-SIB Domestic systemically important bank
DTAs Deferred tax assets
EAD Exposure at default
EL Expected loss
FIRB (or Foundation IRB) Foundation internal ratings-based approach

Glossary
Australian Bankers' AssociationPwC 54
FSI Financial System Inquiry
G-SIB Global systemically important bank
HVCRE High-volatility commercial real estate
Internationally comparable CET1 Measurement using Basel Framework rules and allowing for national regulatory treatments which would impact on how those rules areimplemented in that jurisdiction by comparison to international norms
IRB Internal Ratings-Based
IRRBB Interest rate risk in the banking book
LGD Loss-given-default
LVR Loan to value ratio
MSR Mortgage servicing rights
NIF Note issuance facility
OSFI Office of the Superintendent of Financial Institutions
PD Probability of default
PSE Public sector entity
QRRE Qualifying revolving retail exposures
RCAP Regulatory Consistency Assessment Programme
RUF Revolving underwriting facility
RWA Risk weighted assets
SL Specialised lending
SME Small- and medium-sized entity
UCITS Undertakings for collective investments in transferable securities

Australian Bankers' AssociationPwC 55
Appendix I Bibliography
Australia and New Zealand Banking Group (ANZ), 2014, Debt Investor Update: Half year results, ANZ, retrieved Aug-14,http://www.debtinvestors.anz.com/phoenix.zhtml?c=248688&p=debt-presentation14
Australia and New Zealand Banking Group (ANZ), 2014, Basel III Pillar 3 Disclosure, ANZ, retrieved Aug-14,http://www.shareholder.anz.com/sites/default/files/ANZ%27s%20March%202014%20Pillar%203%20Disclosure.pdf
Australian Prudential Regulation Authority (APRA), 2014, Financial System Inquiry: Submission, APRA, retrieved Aug-14,http://apra.gov.au/Submissions/Documents/APRA-2014-FSI-Submission-FINAL.pdf
Bank of Montreal, 2014, Supplementary Regulatory Capital Disclosure, Bank of Montreal, retrieved Aug-14, http://www.bmo.com/ir/qtrinfo/1/2014-q2/Supp%20Reg%20Capital%20Disclosure%20Q2%202014.pdf
Barclays PLC (BARC), 2013, Building the ‘Go-To’ bank, BARC, retrieved Aug-14,http://reports.barclays.com/ar13/servicepages/downloads/files/barclays_pillar_3_report_2013.pdf
BCBS, 2014, Basel III Monitoring Report, BIS, retrieved Aug-14, http://www.bis.org/publ/bcbs278.pdf
BCBS, 2014, Regulatory Consistency Assessment Programme (RCAP) Assessment of Basel III regulations – Canada, BIS, retrieved Aug-14,http://www.bis.org/bcbs/implementation/l2_ca.pdf
BCBS, 2014, Regulatory Consistency Assessment Programme (RCAP) Assessment of Basel III regulations – Australia, BIS, retrieved Aug-14,http://www.bis.org/bcbs/implementation/l2_au.pdf
BCBS, 2013, Global systemically important banks: updated assessment methodology and the higher loss absorbency requirement, BIS, retrieved Aug-14,http://www.bis.org/publ/bcbs255.pdf
BCBS, 2013, Regulatory Consistency Assessment Programme (RCAP) Assessment of Basel III regulations – Singapore, BIS, retrieved Aug-14,http://www.bis.org/bcbs/implementation/l2_sg.pdf
BCBS, 2013, Regulatory Consistency Assessment Programme (RCAP) Assessment of Basel III regulations – Switzerland, BIS, retrieved Aug-14,http://www.bis.org/bcbs/implementation/l2_ch.pdf
BCBS, 2013, Regulatory Consistency Assessment Programme (RCAP) Assessment of Basel III regulations – China, BIS, retrieved Aug-14,http://www.bis.org/bcbs/implementation/l2_cn.pdf
BCBS, 2013, Regulatory Consistency Assessment Programme (RCAP) – Second report on risk-weighted assets for market risk in the trading book, BIS, retrievedAug-14, http://www.bis.org/publ/bcbs267.pdf
BCBS, 2013, Basel III Regulatory Consistency Assessment Programme (RCAP), BIS, retrieved Aug-14, http://www.bis.org/publ/bcbs264.pdf
BCBS, 2013, Progress report on implementation of the Basel regulatory framework, BIS, retrieved Aug-14, http://www.bis.org/publ/bcbs263.pdf
BCBS, 2013, Regulatory Consistency Assessment Programme (RCAP) Analysis of risk-weighted assets for credit risk in the banking book, Aug-14,http://www.bis.org/publ/bcbs256.pdf

Bibliography
Australian Bankers' AssociationPwC 56
BCBS, 2013 (rev 2013), Regulatory consistency assessment programme (RCAP) – Analysis of risk-weighted assets for market risk, BIS, retrieved Aug-14,http://www.bis.org/publ/bcbs240.pdf
BCBS, 2012, Basel III regulatory consistency assessment programme, BIS, retrieved Aug-14, http://www.bis.org/publ/bcbs216.pdf
BCBS, 2012, A framework for dealing with domestic systemically important banks, BIS, retrieved Aug-14, http://www.bis.org/publ/bcbs233.pdf
BCBS, 2012, Basel III regulatory consistency assessment (Level 2) Preliminary report: European Union, BIS, retrieved Aug-14,http://www.bis.org/bcbs/implementation/l2_eu.pdf
BCBS, 2012, Basel III regulatory consistency assessment (Level 2) Japan, BIS, retrieved Aug-14, http://www.bis.org/bcbs/implementation/l2_jp.pdf
BCBS, 2012, Basel III regulatory consistency assessment (Level 2) Preliminary report: United States of America, BIS, retrieved Aug-14,http://www.bis.org/bcbs/implementation/l2_us.pdf
BCBS, 2010 (rev 2011), Basel III: A global regulatory framework for more resilient banks and banking systems, BIS, retrieved Aug-14,http://www.bis.org/publ/bcbs189.pdf
BCBS, 2006, Basel II: International Convergence of Capital Measurement and Capital Standards, BIS, retrieved Aug-14, http://www.bis.org/publ/bcbs128.pdf
Canadian Imperial Bank of Commerce (CIBC), 2014, Supplementary Regulatory Capital Disclosure, CIBC, retrieved Aug-14,https://www.cibc.com/ca/pdf/investor/q214disclosure.pdf
Commerzbank AG (CBK), 2014, Figures – Facts – Targets, CBK, retrieved Aug-14,https://www.commerzbank.com/media/aktionaere/service/archive/konzern/2014_2/Figures_Facts_Targets_Q2-2014.pdf
Commerzbank AG (CBK), 2014, Interim Report as of June 30, 2014, CBK, retrieved Aug-14,https://www.commerzbank.com/media/aktionaere/service/archive/konzern/2014_2/Zwischenbericht_Q2_2014_englisch.pdf
Commonwealth Bank of Australia (CBA), 2014, Results Presentation: For the full year ended 30 June 2014, CBA, retrieved Aug-14,https://www.commbank.com.au/content/dam/commbank/about-us/shareholders/pdfs/results/fy14_results_presentation.pdf
Credit Suisse Group AG (Credit Suisse), 2014, Financial Report 2Q14, Credit Suisse, retrieved Aug-14, https://www.credit-suisse.com/media/cc/docs/investors/csg-financialreport-2q14.pdf
DBS Group Holdings Ltd (DBK), 2014, Second quarter 2014 Financial Performance Summary, DBK, retrieved Aug-14,http://www.dbs.com/investor/2014/2Q14_performance_summary.pdf
Deutsche Bank AG, 2014, Interim Report as of June 30, 2014, Deutsche Bank AG, retrieved Aug-14, https://www.deutsche-bank.de/medien/en/downloads/DB_Interim_Report_2Q2014.pdf
Financial Services Authority, 2010, Internal ratings-based probability of default models for income-producing real estate portfolios, Financial Services Authority,retrieved Aug-14, http://www.fsa.gov.uk/pubs/guidance/fg10_02.pdf
Financial Stability Board, 2013, 2013 update of group of global systemically important banks (G-SIBs), Financial Stability Board, retrieved Aug-14,http://www.financialstabilityboard.org/publications/r_131111.pdf
Frodsham, M & Gimblett, K., 2012, The Slotting Approach to IPRE Risk Weighted Capital A UK Simulation Study Using IPD Data, IPD, retrieved Aug-14,http://www.msci.com/resources/pdfs/IPD-UK-Slotting-Paper-September-2012.pdf

Bibliography
Australian Bankers' AssociationPwC 57
FSI, 2014, The Financial System Inquiry 2014 (Murray): Interim Report, Australian Government, retrieved Aug-14, http://fsi.gov.au/publications/
HSBC Holdings PLC (HSBC), 2013, Capital and Risk Management Pillar 3 Disclosures at 31 December 2013, HSBC, retrieved Aug-14,http://www.hsbc.com/investor-relations/financial-and-regulatory-reports
HSBC Holdings PLC (HSBC), 2013, Annual Report and Accounts 2013, HSBC, retrieved Aug-14, http://www.hsbc.com/investor-relations/financial-and-regulatory-reports/annual-report-and-accounts-2013
Lloyds Banking Group PLC (LLOY), 2013, Pillar 3 Disclosures 2013, LLOY, retrieved Aug-14,http://www.lloydsbankinggroup.com/globalassets/documents/investors/2013/2013_lbg_pillar3_disclosures.pdf
Mitsubhishi UFJ Financial Group Inc. (MUFG), 2014, Financial Highlights under Japanese GAAP for Fiscal Year Ended March 31, 2014, MUFG, retrieved Aug-14,http://mufg.marsflag.com/en_all/search.x?q=financial+highlights+may+2014&ie=iso-8859-1&page=1&unitid=en_all#3
Monetary Authority of Singapore (MAS), 2014, MAS Notice 632, Residential Property Loans, MAS, retrieved Aug-14,http://www.mas.gov.sg/~/media/MAS/Regulations%20and%20Financial%20Stability/Regulations%20Guidance%20and%20Licensing/Commercial%20Banks/Regulations%20Guidance%20and%20Licensing/Notices/MAS%20Notice%20632_10%20Feb%202014.pdf
Monetary Authority of Singapore (MAS), 2012, MAS Notice 637 on risk based capital adequacy requirements for banks, MAS, retrieved Aug-14,http://www.mas.gov.sg/~/media/MAS/Regulations%20and%20Financial%20Stability/Regulations%20Guidance%20and%20Licensing/Commercial%20Banks/Regulations%20Guidance%20and%20Licensing/Notices/MAS%20Notice%20637_14%20Sept%202012.ashx
Morningstar Institutional Equity Research, 2011, Basel III Around the World, Morningstar Institutional Equity Research, retrieved Aug-14,http://news.morningstareurope.com/news/im/Basel%20III_20110414_Peters.pdf
National Australia Bank Ltd. (NAB), 2014, Half Year Results: Investor Presentation, NAB, retrieved Aug-14, http://www.nab.com.au/content/dam/nab/about-us/shareholder-centre/financial-results/documents/2014-half-year-results-investor-presentation.pdf
National Australia Bank Ltd. (NAB), 2014, Pillar 3 Report: Incorporating the requirements of APS 330, Half Year Update as at 31 March 2014, NAB, retrieved Aug-14, http://www.nab.com.au/content/dam/nab/about-us/shareholder-centre/regulatory-disclosures/documents/march-2014-pillar-3-report.pdf
Oversea-Chinese Banking Corporation Limited (OCBC), 2014, Media release: OCBC Group Reports Record Second Quarter 2014 Net Profit after Tax of S$921million, OCBC, retrieved Aug-14, http://www.ocbc.com/assets/pdf/Media/2014/Aug/OCBC%202Q14%20Media%20Release.pdf
Oversea-Chinese Banking Corporation Limited (OCBC), 2013, Pillar 3 Disclosures (OCBC Group – As at 31 December 2013), OCBC, retrieved Aug-14,http://www.ocbc.com/assets/pdf/Capital%20and%20Regulatory%20Disclosures/Pillar%203%20Quantitative%20Disclosures/As%20of%2031%20Dec%202013/Pillar%203%20Disclosures%20as%20at%2031%20Dec%202013.pdf
Radley & Associates, 2013, Potential Effects of the Slotting Capital Regime on UK Commercial Property Lending, Radley & Associates, retrieved Aug-14,http://www.promsinvestor.com/publications/Potential%20Effects%20of%20the%20Slotting%20Capital%20Regime%20on%20UK%20Commercial%20Property%20Lending.pdf
Royal Bank Canada (RBC), 2014, Supplementary Financial Information, Q2 2014, RBC, retrieved Aug-14, http://www.rbc.com/investorrelations/pdf/q214supp.pdf
Royal Bank of Scotland Group PLC (RBS), 2013, Annual Report and Accounts 2013, RBS, retrieved Aug-14, http://www.investors.rbs.com/results-centre/annual-report-subsidiary-results/2013.aspx

Bibliography
Australian Bankers' AssociationPwC 58
Royal Bank of Scotland Group PLC (RBS), 2013, Pillar 3 Report 2013, RBS, retrieved Aug-14, http://investors.rbs.com/~/media/Files/R/RBS-IR/2013-reports/pillar-3-2013-final.pdf
Standard & Poors Financial Services LLC (S&P), 2011, Standard & Poor's Risk-Adjusted Capital Framework Provides Insight Into Basel III, S&P, retrieved Aug-14,http://img.en25.com/Web/StandardandPoors/StandardPoorsRiskAdjustedCapitalFrameworkProvidesInsightIntoBaselIII_6_9_11.pdf
Standard & Poors Financial Services LLC (S&P), 2009, Standard and Poor's Risk-Adjusted Capital Framework For Financial Institutions, S&P, retrieved Aug-14,http://www.financialexecutives.org/eweb/upload/FEI/Standard%20and%20Poor's%20Risk-Adjusted%20Capital%20Framework%20For%20Financial%20Institutions_21-Apr-09.pdf
Standard Chartered Bank (SCB), 2013, Annual Report 2013, SCB, retrieved Aug-14, http://reports.standardchartered.com/annual-report-2013/pdf/2013-Annual-Report.pdf
Sumitomo Mitsui Trust Holdings Inc. (SMTH), 2014, Composition of capital as of March 31, 2014, SMTH, retrieved Aug-14,http://www.smth.jp/en/ir/basel/1403/1403_hd_01.pdf
Sumitomo Mitsui Trust Holdings Inc. (SMTH), 2014, IR Material for 1QFY2014, SMTH, retrieved Aug-14, http://www.smth.jp/en/ir/presentation/E140731.pdf
The Bank of Nova Scotia (BNS), 2014, Supplementary Regulatory Capital Disclosure, BNS, retrieved Aug-14,http://www.scotiabank.com/ca/en/files/14/05/BNS_Q2-14_Supplementary_Regulatory_Capital_Dislosures.pdf
Toronto-Dominion Bank (TD), 2014, TD Bank Group Reports, Second Quarter 2014 Results: Report to Shareholders, TD, retrieved Aug-14,http://www.td.com/document/PDF/investor/2014/2014-Q2_Report_to_Shareholders_F_EN.pdf
UBS Group AG (UBS), 2014, Second Quarter 2014 Report, UBS, retrieved Aug-14,http://www.ubs.com/global/en/about_ubs/investor_relations/quarterly_reporting/2014.html
Westpac Banking Corporation (WBC), 2014, First half 2014 Financial Results, WBC, retrieved Aug-14,http://www.westpac.com.au/docs/pdf/aw/ic/140509_Final_IDP_Presentation_1H14.pdf
Westpac Banking Corporation (WBC), 2014, Basel III Pillar 3, March 2014, WBC, retrieved Aug-14,http://www.westpac.com.au/docs/pdf/aw/ic/Pillar_3_report_for_31_March_2014.pdf