Embed Size (px)
Citation preview
PERGAMON Social Science & Medicine 50 (2000) 673-687
SOCIAL SCIENCE --&- MEDICINE
A multilevel analysis of income inequality and cardiovascular disease risk factors
Ana V. Diez-Rouxa.*, Bruce G. ink^, Mary E. NorthridgeC aDivision of General Medicine, Columbio College of Physicians and Surgeons, and Division of Epidemiology, Cohunbia University
School of Public Health, USA b ~ i v i r w n of Epidemiology, Columbia University School of Public Healrh and Epidemiology of Mental Dirorders, New York State
Psychiatric Institute, USA 'Harlem Center for Health Promotion and Disease Prevention, Colwnbia University School of Public Health/Harlem Hospital Center,
USA
Abstract
Recent research has suggested that inequality in the distribution of income is associated with increased mortality, even after accounting for average income levels. Using data from the Behavioral Risk Factor Surveillance System (BRFSS), we investigated whether inequality in the distribution of income within US states is related to the prevalence of four cardiovascular disease risk factors (body mass index (BMI), history of hypertension, sedentarism. and smoking). Multilevel models (including both state-level and individual-level variables) were used to examine associations of state inequality with risk factor levels before and after adjustment for individual-level income. For three of the four risk factors investigated (BMI, hypertension, and sedentarism), state inequality was associated with increased risk factor levels, particularly at low income levels (annual household incomes <$25,000), with associations persisting after adjustment for individual-level income. Inequality was also positively associated with smoking, but associations were either stronger or only present at higher income levels. Associations of inequality with the outcomes were statistically significant in women but not in men. Although not conclusive, findings for three of the four risk factors are suggestive of a contextual effect of income inequality, particularly among persons with lower incomes. 0 2000 Elsevier Science Ltd. All rights reserved.
Keyworb: Income inequality; Cardiovascular diseases; Cardiovascular risk factors; Socioeconomic factors
Introduction is strongly patterned by social position. This has led to the characterization of socioeconomic status as a "fun-
It has long been known that within countries, health damental" social cause of disease, one whose impact on morbidity and mortality tends to re-emerge at different times and in different places (Link and Phelan, 1995). Recent research has suggested that
* Corresponding author. Division of General Medicine, Columbia Presbyterian Medical Center, 622 West 16gth Street
social inequality per se (i.e., the existence of inequality
pH 9 East Rm 105, New York, NY ,0032, USA, + 1- in the society or group to which a person and
212-305-5097; fax: + 1-212-305-9349. not only a person's absolute position in the socioeco- E-mi l address; [email protected] nomic spectrum, may be related to health. Over the
(A.V. Diez-Roux). last few years several studies have found that countries
0277-9536/00/$ - see front matter 0 2000 Elsevier Science Ltd. All rights reserved. PII: SO277-9536(99)00320-2

674 A. V. Diez-Roux et at. / Sociat Sc ,ience & Medicine 50 (2000) 673-687
with large inequalities in the distribution of income have significantly worse health outcomes than those with more egalitarian distributions, even after control- ling for country-level GNP or average income (McIsaac and Wilkinson, 1997; Rodgers, 1979; Steckel, 1995; van Doorslaer et al., 1997; Waldman, 1992; Wennemo, 1993; Wilkinson, 1986, 1990, 1992, 1996). Moreover, recent research has suggested that the re- lation between income inequality and mortality is also present across areas within countries (Ben Shlomo et al., 1996; Kaplan et al., 1996a; Kennedy et al., 1996a; Lynch et al., 1998). Ben-Shlomo et al. (1996) found that in England, variation in deprivation within small- areas (local authorities) was associated with mortality after controlling for absolute levels of deprivation. Kaplan et al. (1996a) and Kennedy et al. (1996a) docu- mented significant associations between state-level indi- cators of income inequality and state-level mortality rates within the United States, with associations per- sisting after controlling for state poverty levels or me- dian household income, and Lynch et al. (1998) found that increased income inequality is associated with increased mortality across 282 US metropolitan areas, even after stratifying by per capita income.
However, the purported relation between income inequality and health has been challenged on several grounds (Judge, 1995; Judge et al., 1998), including the validity of the measures of income and income distri- bution used and the ability of existing studies to ade- quately control for ecological confounders. An additional, and perhaps more basic methodological cri- tique, is the argument that the observed ecological as- sociation is the aggregated consequence of the non- linear relationship between income and health at the individual level (Gravelle, 1998). As a result of this nonlinear relationship, in which the association between better health and higher income weakens pro- gressively as income increases, redistribution of income from higher to lower income levels necessarily results in greater improvements in health a t lower income levels with relatively minor reductions in health at higher income levels, leading to an overall improve- ment in aggregate health (Judge et al., 1998; Gravelle, 1998). Consequently, the relation between income inequality and mortality at the country level may arise from compositional differences between countries in the income of their inhabitants, rather than from a contextual effect of income inequality per se on health. If the ecological association between income inequality and mortality results from compositional differences across groups (e.g. countries or states) in the individ- ual-level income of their members, the observed eco- logical associations would be the group-level manifestation of a previously established and well documented individual-level relationship within countries. On the other hand, the confirmation of a
true contextual effect of living in an unequal society could suggest new mediating mechanisms though which income inequality may be related to health.
Because previous studies of income inequality and health outcomes have generally been limited to ecologi- cal associations, they have been unable to adequately distinguish compositional from contextual effects (Duncan et al., 1998). In other words, it is unclear whether the associations of group-level income inequal- ity with health outcomes are confounded by levels of individual-level income (since adjustment for an eco- logical summary such as median income does not elim- inate the possibility of important differences in the distribution of individual-level income across groups). In addition, if there is indeed a contextual effect of income inequality, it is unclear whether this effect is the same in persons of different individual-level income levels. One would expect the effects of income inequal- ity to be greater at lower than at higher income levels, since lower income persons may be more vulnerable to the potential psychosocial (Wilkinson, 1997a) or ma- terial (for example investment-related (Kaplan et al., 1996a)) consequenes of living in an unequal society. The investigation of these questions requires analyses incorporating both group-level and individual-level variables.
Cardiovascular diseases (CVD) account for a large percentage of all-cause mortality and are the leading cause of death in industrialized nations. In studies of individuals, CVD morbidity and mortality have been shown to be strongly patterned by socioeconomic pos- ition (Kaplan and Keil, 1993). Cardiovascular diseases therefore provide an interesthg model for investigating the relation between inequality and health. In their ecological analyses, Kennedy et al. (1996a) found that the Robin Hood index (an indicator of income inequality) was associated with coronary heart disease mortality. Kaplan et al. (1996a) documented associ- ations between the percentage of total household income received by the less well-off 50% of households and two cardiovascular risk factors: smoking and sedentary lifestyle. However, due to their ecological nature, both studies were unable to investigate whether the effects of inequality on health outcomes and beha- viors are independent of absolute levels of individual- level income, or varies by individual income.
Using multilevel models (Bryk and Raudenbush, 1992; Duncan et al., 1998; Goldstein, 1995; Mason et al., 1983; Wong and Mason 1985) and data from the 1990 US Census and the 1990 Behavioral Risk Factor Surveillance System (BRFSS), we examined the re- lation between state income inequality and the preva- lence of four well-established CVD risk factors - body mass index (BMI), smoking, sedentarism, and history of high blood pressure - across 44 US states, before and after controlling for absolute levels of indi-

A.V. Diez-Roux et al. / Social Scienc e & Medicine 50 (2000) 673487 675
vidual income. Based on previous research on the health effects of income inequality we derived three hy- potheses. First, that income inequality in states is as- sociated with the prevalence of CVD risk factors. Evidence consistent with this hypothesis would provide support for the idea that inequality affects cardiovascu- lar disease mortality because it links inequality to con- ditions known to put individuals at risk for cardiovascular disease. Second, we hypothesized that the effects of inequality on CVD risk factors should be greater at lower than at higher income levels. The idea is that income inequality is not equally detrimental to all, and that those at the bottom of the social hierar- chy are likely to be more vulnerable to the health effects of inequality than those at the top. Existing ideas about why income inequality may be linked to health - such as the relative deprivation (Wilkinson, 1997a) and the investment in human capital (Kaplan et al., 1996a) hypotheses - would predict that people with relatively low incomes would be the ones most adversely affected by living in an unequal society. Finally we hypothesized that associations between inequality and CVD risk factors will persist after con- trolling for individual-level income. Consistent with the idea that inequality per se is harmful to health, it fol- lows that such an effect should operate independently of the economic resources of individuals. Evidence consistent with our three hypotheses would provide strong support for previous research on the health effects of income inequality. Consistent failure to sup- port our hypotheses would imply that, if a contextual effect of income inequality on mortality exists, it is not mediated through the cardiovascular risk factors we investigated.
Methods
Sources of data and study population
Information on state-specific risk factor levels and individual-level (household) income was obtained from the Center for Disease Control and Prevention's (CDC's) Behavioral Risk Factor Surveillance System (BRFSS). The BRFSS is a continuous, state-based sur- veillance system that collects information on risk fac-
'We initially chose to report results for the Robin Hood index because Kennedy et al. (1996a) previously reported that it was related to coronary heart disease mortality in the US States (Kennedy et al., 1996a). A subsequent correction to their original publication (Kennedy et al., 1996b) noted that both the Gini coefficient and the Robin Hood index were simi- larly related to coronary heart disease mortality, which is con- sistent with our findings regarding CVD risk factors.
tors for disease each year (Remington et al., 1988). Using random-digit-dialing telephone survey tech- niques, each state selects a probability sample of its noninstitutionalized adult population 2 18 years of age with telephones. One adult resident is randomly chosen from each selected household. In most states, samples are selected using a multistage cluster design procedure based on the Waksberg method (Waksberg, 1978). The information used in the present analyses was collected as part of the core component of the BRFSS in all participating states in 1990 (Siege1 et al., 1993). Body mass index (BMI) was calculated based on self- reported weight and height as weight (kg) divided by height squared (m2). Current smokers were those who reported smoking 100 cigarettes in their entire lives, and were smoking regularly at the time of the survey. Persons were classified as having a history of high blood pressure if they had ever been told by a doctor, nurse or other health professional that they had high blood pressure. Respondents were classified as seden- tary if they reported no physical activity or reported performing physical activity for 20 min or less, fewer than 3 times per week. Participants were asked to select their annual household income from all sources from a list of 7 categories: <$10,000, $10-14,999; $15-19,999; $20-24,999; $25-34,999; $35-50,000; > $50,000. Self-reported racelethnicity was categorized as non-Hispanic white, non-Hispanic black, Hispanic, and other.
Information on state income distributions (i-e. the distribution of households into 25 income categories, median household income, and total aggregate income for each state) was obtained from the 1990 US Census. These data were used to calculate three indicators of income inequality (the Robin Hood index, the Gini coefficient, and the percent of total household income received by the less well off 50% of households) using income distribution software developed by E. Welniak (unpublished software, United State Census Bureau 1988). The calculation and characteristics of these different indicators of income inequality have been recently reviewed (Kawachi and Kennedy 1997a), and all three indicators were found to be highly correlated. These three indicators were selected a priori because they had been previously investigated in reports relat- ing state income inequality to mortality in the United States (Kaplan et al., 1996a; Kennedy et al., 1996a). Because results for all outcomes were virtually identical for all three indicators of income inequality, results for only one of the indicators (the Robin Hood index) are reported here. The Robin Hood index is defined as the proportion of aggregate income that must be redistrib- uted from households above the mean to those below the mean to achieve equality in the distribution of income (Kawachi and Kennedy, 1997a)'.
A total of 81,557 persons distributed in 44 states
676 A. V. Diez-Roux el al. / Social Science & Medicine 50 (2000) 673487
and Washington D.C. participated in the 1990 BRFSS. 81i = + Qi
Participation rates ranged from 64.1 to 97.3%. Washington D.C. residents (n = 1493) were excluded fiZi = Y20 from the present analyses because inequality measures were not available in the 1990 census. An additional where Q is the state-level Robin-Hood index. 399 respondents with no information on age and 9131 The inclusion of an error term in the second stage respondents with no information on household income equations (in this case, q,i in Eq. (2)) allows for were also excluded leaving a total of 70,534 persons sampling variability in the micro regression coefficients, (86.5% of the total sample) available for analysis. and also implies that the macro-level equations are not
deterministic (Mason, 199 1). In addition, the inclusion Statistical methods
In order to allow for potential differences in the as- sociations in men and women, all analyses were strati- fied by gender. The relationship between state inequality and risk factor levels (hypothesis 1) was in- itially explored by plotting mean risk factor levels by state Robin Hood index. Interactions between Robin Hood index and individual-level income (hypothesis 2) were investigated by plotting mean risk factor levels by state and individual-level income, and estimating the associations between individual-level income and risk factors separately for states at or above, and for states below, the median Robin Hood index. All estimates of means and prevalence rates were weighted using final
of macro errors also allows for the possibility that ob- servations within states may be correlated even after accounting for the variables included in the models. This avoids violating the assumption of independence of observations, and standard errors are correctly esti- mated. The second-level errors (q,J are assumed to be randomly distributed with variance G. In our models, both the state specific intercept (BoJ, and the state- specific slope associated with individual-level income @,J were modeled as a function of state income inequality (Eqs. (2) and (3)). However, a random com- ponent (LQ) was only included for the intercept term. Because the variance of the random slope associated with individual-level income did not differ significantly from 0 in nearly all models (indicating little or no re-
weights provided with the BRFSS data to compensate sidual variation in the effects of individual-level income for variation in respondents' probability of selection, across states after accounting for state inequality) and for disproportionate selection of population subgroups the inclusion of a random slope also made convergence relative to the state's population, and for non-re- dficult in several of the models, no random com- sponse. ponent was included in Eq. (3). The effect of age was
After exploratory analyses, regression models were modeled as constant across states (Eq. (4)). In order to used to investigate associations of state inequality with control for the potential confounding effect of median risk factor levels before and after adjustment for indi- household income, models were re-run after including vidual-level income, as well as the interactions between state median income in Eq. (2). state inequality and individual-level income (hypoth- By replacing (2) and (3) in (1) we obtain: eses 1-3). Multilevel models (Bryk and Raudenbush,
r j - YOO + Y o l Q i + ~ l o l i j + y l lQi4 j + ~2oAij + aoi + eij 1992; Duncan et al., 1998; Goldstein, 1995; Mason et F. - al., 1983; Wong and Mason, 1985) were used to (5) . , account for the two-level structure of the data (individ- uals nested within states). The models fitted can be This is a mixed effects model in which the intercept is conceptualized as follows. In the first stage (individual- level), a separate individual level regression is defined for each state.
% = Boi + P l i l i j + P2Aij + eij eij iid- N(0, a2) (1)
where qj is the continuous outcome variable for the jth person in the ith state (e.g. BMT), lij is the individ- ual-level income variable (household income as col- lected in the BRFSS), and Aij is age. In a second stage (state-level) the state-specific coefficients may be mod- eled as a function of state-level variables (in this case, inequality in the distribution of income within states).
modeled as random. Analogous logistic models were fitted for binary dependent variables (Wong and Mason, 1985).
All models were fitted using SAS Proc Mixed (SAS Institute Inc., Carey, NC) for continuous dependent variables and the SAS macro GLIMMIX for binary dependent variables (Littell et al., 1996). Because our intent was to estimate associations between state inequality and outcomes in the study sample rather than to provide estimates of the prevalence of risk fac- tors in the general population, sample weights were not used in the multivariate analysis. (Nonetheless, weighted analyses were conducted for the continuous outcome (BMT) and the results were virtually identical to the unweighted findings).The BRFSS uses cluster sampling, with clusters being telephone prefixes. As the

Table 1 Characteristics of the study population by categories of state income inequality (based on the Robin Hood index), BRFSS and US Census 1990
State-level characteristics Individual-level characteristics of BRFSS samplesa
Quartiles of Mean Mean median Annual household income (US$) Percent white income Robin household Percentage distribution non-Hispanic inequalityb Hood income
index (US$) Men Women Men Women
< $15,000 $15,000-24,999 $25,000-50,000 > $50,000 < $15,000 $15,000-24,999 $25,000-50,000 > $50,000 (n = 6127) (n = 6992) (n = 11752) (n = 5775) (n = 13375) (n = 8935) (n = 12475) (n = 5103)
- ---
I (Lowest) 28.34 31,825 17.3 21.6 41.9 19.3 27.6 21.6 35.6 15.2 87.7 88.0 I1 29.61 28,244 17.6 23.2 32.2 19.6 27.1 23.9 34.7 14.3 88.8 89.2 I11 30.66 30,596 18.1 19.0 38.4 24.5 26.6 20.9 34.3 18.2 78.6 77.6 TV (Highest) 32.52 24,450 22.4 22.9 36.0 18.6 32.3 21.0 31.3 15.4 75.5 73.9
"Proportions are weighted using BRFSS sample weights. Robin Hood cutoffs and states in each quartile are as follows: Lowest: Robin Hood I 29.03: New Hampshire, Pennsylvania, Utah, Vermont, Wisconsin, Delaware,
Maryland, Maine, Iowa, Hawaii, Indiana. 11: 29.03 < Robin Hood 1 30.13: Washington, Nebraska, Minnesotta, Idaho, North Dakota, Rhode Island, Oregon, South Dakota, Colorado, Virginia, Ohio. 111: 30.13 < Robin Hood < 31.52: Montana, Massachusetts, North Carolina, South Carolina, Connecticut, Michigan, Illinois, Arizona, Missouri, California, Georgia. Highest: Robin Hood 2 31.52: Florida, New Mexico, Oklahoma, Tennessee, West Virginia, Texas, Kentucky, Alabama, New York, Mississippi, Louisiana.

678 A.V. Diez-Roux el al. / Social Science & Medicine 50 (2000) 673687
Mean body mass Index (BMI) by state Robln Hood index . Percent hype~msion by state Robln Hood hdex In men end tmm~ h men and women
W e RoMn Hood Index stale Robln Hood M i
Percent sedentary by state Robln Hood lndex in men end women
Percent wmnt smokers by state Robln Hood lndex h rnm and mrnsn
1
Stah Robin Hood hdex State Robln Hood Index
035- 034 - 0.n - 032- on- 0.33 -
All estimatcr arc weiphted using BRFSS weights.
. •
Mm: Dots. Solid linck ICW-~UU'CS -ion line. Women: Circles. Dashed line is least-sq- regression line.
011 -
Fig. 1. Mean body mass index, percent with a history of high blood pressure, percent sedentary, and percent smokers by state Robin Hood index in men and women.
number of observations per cluster is small (median of 2), only minor effects of within cluster correlation are expected. We accounted for clustering by allowing the intercept to also vary randomly across clusters within each state (a three-level model). The inclusion of this additional level led to virtually identical estimates to those obtained from two-level models in the models we could test. We therefore chose to present results from the simpler two-level models (individuals nested within states).
The variances of the random intercepts differed sig- nificantly from 0 in all models (using approximate standard errors of the estimates based upon the assumption that they are asymptotically normal) (Littel et al., 1996), implying some residual variation across states which was unaccounted for by the vari- ables in the models. However, this test for significance of covariance parameters has been questioned because of its reliance on the normal and large sample approxi- mation (Singer, 1999). Therefore, results regarding

A. V. Diez-Roux el al. / Social Science & Medicine 50 (2000) 673-687
Mean body mess index (BMq by incane categoly Man strained stetO Robin Hoad In&
Percent hypettenslm by income category Men atmtMed by We Robin Hood lrder
21 '
C
0 3 - 0 s - I
OU:9 TI -, 0.a 0
I
f
* 0
? 0 C
0
0 1 0.10 -* a -! , Mi- o i
I 'r I I I I I I MI- ??I-- 1 ; 4 I .m.r 0 -U rC.m m - U =-.I- --ID. P m m rU m-- I-- m - U I-- =-I- O--
Individual - lwel annual i n m cabgory II@WJSI-W annual imfm d W
Percent sedentafy by income category Men sh&d by state Robin Hood hda
Individual - level mnual income category
Percent smokhg by l m e categwy Man SmWd by stale Robin Hood index
All estimates arc weighted using BRFSS wcigho. Each marker rcpmcnu a sta~e and income caw go^. Doa, solid least squares regression line: wares with Kobln Hood index 50th pcrcmtllc or mom. Circles. dashed least squues rcpession ILe: slates with Robin Hmd index below 50th percentile.
Fig. 2. Mean risk factor levels by individual-level income and state, and slopes associated with individual-level income, separately for states with Robin Hood indices above and below the median - men.
statistical significance of the random intercept variance should be interpreted with caution. We tested the assumption of normally distributed macro errors by examining the distribution of aoi in our models and found no evidence that this assumption was violated. Another important assumption of multilevel models is that the macro errors are uncorrelated with the indi- vidual-level covariates in the model. The existence of such correlation may suggest model misspecification and omission of important covariates (Hausman, 1978). In our data, correlations between macro errors
and individual-level predictors (individual level income and age) were near 0 for all models examined.
Results
The final study population was comprised of 30,646 men and 39,888 women distributed in 44 states. Median sample sizes by state were 655 for men (range 287-1435) and 842 for women (range 437-1757). Robin Hood indices for the 44 states ranged from
A.V. Diez-Roux et al. / Social Science & Medicine 50 (2000) 673687

A.V. Diez-Roux er al. / Social Science & Medicine 50 (2000) 673687

A.V. Diez-Roux et al. / Social Science & Medicine 50 (2000) 673687 683
Figs. 2 (men) and 3 (women) show slopes in mean risk factor levels by individual-level income separately for states at or above the Robin Hood median, and for states below the Robin Hood median. The purpose of these figures is to explore whether associations of in- dividual-level income with the outcomes differ by state inequality or analogously whether the effects of state income inequality differ by individual-level income (i.e. the interaction between individual-level income and state income inequality). This exploratory analysis is limited by the fact that only two broad categories of income inequality are compared. The relatively small number of states in the analyses makes the comparison of more divergent (and therefore smaller) categories of income inequality (e.g. top fifth and bottom fifth) unreliable. However, the figures shown serve as an in- itial exploratory investigation of whether inequality effects may differ by individual-level income before examining the more complex multilevel models which include the Robin Hood index as a continuous vari- able. In men (Fig. 2), increasing individual-level income was associated with increasing BMI, and with decreasing hypertension, percent sedentary, and per- cent smokers. The slope of increasing BMI by increas- ing individual-level income was slightly weaker in high inequality than in low inequality states. The decreasing trends in hypertension and sedentarism associated with individual-level income were slightly stronger in more unequal than in more egalitarian states. In contrast, the slope of decreasing smoking was slightly less pro- nounced in more unequal states. In women (Fig. 3), increasing individual-level income was associated with decreasing levels of all four risk factors. For BMI, hypertension, and sedentarism, trends by individual- level income were stronger in more unequal states. Similar to patterns observed in men, the decreasing trend in smoking associated with increasing individual- level income was slightly weaker in more unequal states.
The patterns described above, i.e. consistent differ- ences in slopes associated with individual-level income in the two categories of state income inequality, suggest that interactions between income inequality and individual-level income may be present. In both men and women, increased state inequality was associ- ated with increased BMI and history of high blood pressure in the lowest categories of individual-level income, but was either not associated or was negatively associated with risk factor levels at the highest income categories. Similarly, in both genders, state inequality was positively associated with sedentarism across cat- egories of individual-level income, but associations were stronger at the lower than at the higher income levels. Conversely, associations of income inequality with smoking were slightly stronger at higher income than at lower income levels.
The multilevel model shown in Eq. (S), or its logistic variant, was fitted for all outcomes for men and women separately. The interaction term between indi- vidual-level income and state inequality (as continuous variables) was statistically significant (P < 0.05) for all models except BMI and smoking in men. The sign of the interaction term was consistent with the patterns described in Figs. 2 and 3 for each outcome. Consequently, because both exploratory and regression analyses suggested a possible interaction effect (and because our large sample size made it feasible), we chose to present final results of the multilevel models stratified by individual-level income. Interaction terms between individual-level income and state inequality were not included in these stratitied models.
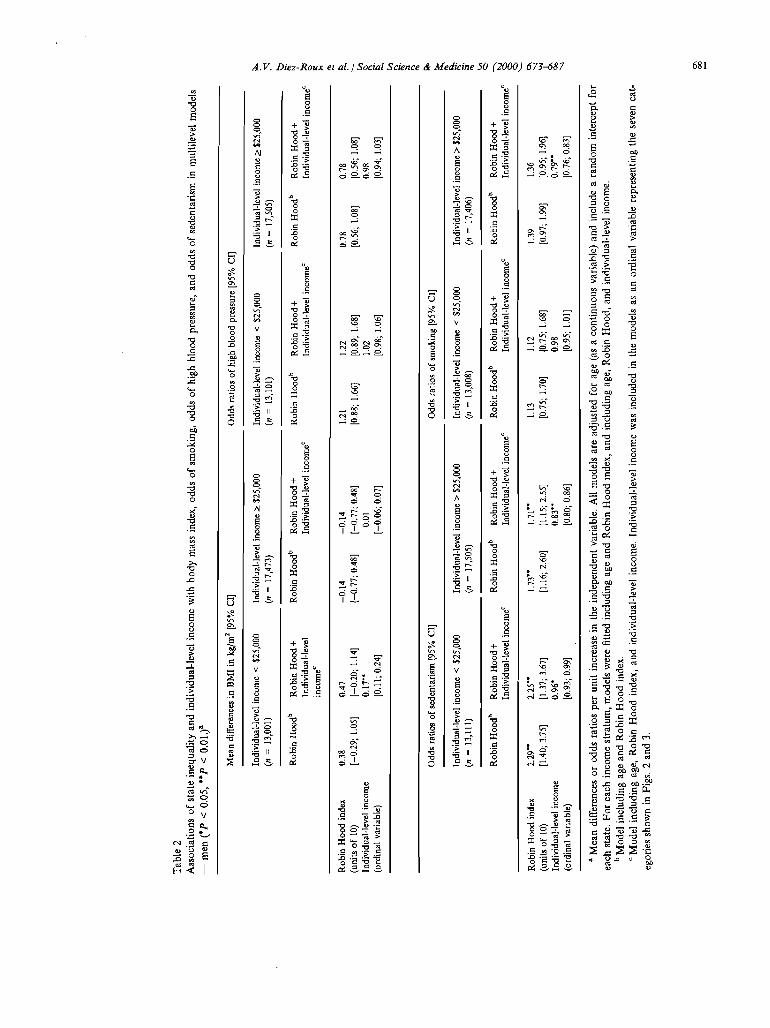
Estimates of associations between the Robin Hood index and each of the four outcomes derived from stra- tified multilevel models, before and after adjustment for individual-level income, are shown in Table 2 (men) and Table 3 (women). In both men and women, BMI and the odds of having a history of high blood pressure were positively associated with state inequality among persons with individual-level incomes below $25,000, but were negatively associated with state inequality among persons with individual-level incomes of $25,000 or more. Sedentarism was significantly as- sociated with state inequality across categories of indi- vidual-level income, but associations were slightly stronger at lower than at higher income levels. The odds of smoking were positively associated with state inequality among persons with incomes of $25,000 or more, and associations were weaker (in men) or even negative (in women) in persons with incomes below 825,000. Associations of state inequality with sedentar- ism were statistically significant ( P < 0.05) in both genders. For the remaining three outcomes (BMI, smoking, and high blood pressure), associations were only statistically significant in women.
Additional adjustment for median state income did not substantially alter the patterns described above, nor did adjustment for the racetethnicity of individuals within states (white non-Hispanic, black Non- Hispanic, Hispanic, and other). The sole exception was the association of inequality with BMI in women, which became weakly negative at lower individual-level income levels (mean difference: -0.1 1 95 % confidence limits (CL) -0.70 to 0.49), and more strongly negative at higher income levels (mean difference: -0.95 CL - 1.54 to -0.36), after adjustment for racetethnicity.
Discussion
Our results are suggestive, albeit not conclusive, regarding the contextual effects of income inequality on the prevalence of CVD risk factors. For three of

684 A. V. Diez-Roux et al. / Social Science & Medicine 50 (2000) 673687
the four risk factors investigated, positive associations of income inequality with risk factor levels were stron- ger (or only present) at relatively low levels of individ- ual-level income. Inequality was positively associated with BMI and the odds of high blood pressure at low income levels, but negatively (and weakly) associated with these risk factors at high income levels. Similarly, although inequality was positively associated with sedentarism across categories of individual-level income, associations were stronger among those with lower individual-level incomes. The opposite pattern was observed for smoking: inequality was positively as- sociated with smoking at higher income levels but as- sociations were weaker (or even negative) at lower income levels. Results for BMI, self-reported hyperten- sion and sedentarism were therefore consistent with our three hypotheses. Findings for smoking were con- sistent with an inequality effect which persists after adjustment for individual-level income, but were not supportive of a greater inequality effect at lower income levels (in fact, the opposite was true).
Although the patterns described above are generally consistent with an effect of inequality on risk factor prevalences which persists after controlling for individ- ual-level income, several factors hamper our ability to draw definite conclusions. Similar patterns were docu- mented in both genders, but with the exception of sedentarism, associations were only statistically signifi- cant in women. The lack of statistical significance for several of the outcomes in men may have to do with the weaker effects observed in men generally. We have no clear explanation for this gender difference. Moreover, associations of income inequality with risk factor levels were not very strong, even in women bar- ticularly if restricted to the relatively narrow range of variation in income inequality observed in the sample). Finally, findings for smoking were inconsistent with the other risk factors examined in that, although inequality was associated with increased smoking after adjustment for individual-level income, associations were stronger a t higher than at lower income levels in men and were only present at higher income levels in women. Several of the states with high inequality rates were also Southern states in which the prevalence of smoking is generally higher than in the rest of the country. It is possible that in these states the inverse association between individual-level income and smok- ing is attenuated, and as a result, state-level income inequality appears to be more strongly associated with smoking at higher than at lower income levels.
Several mechanisms have been postulated as me- diators of the relation between income inequality and health (Lynch and Kaplan, 1997). Wilkinson has argued that the relationship between income inequality and health outcomes is the result of the effect of rela- tive deprivation on health (people's perception of their
position in relation to others) and is primarily mediated through psychosocial pathways (e.g. the direct physiological effects of chronic stress, or the indirect effects of stress on behaviors such as smoking, drinking, and overeating) (Brunner, 1997; Wilkinson, 1997a). It has also been suggested that inequality may be related to health through its effects on levels of social cohesion (Kawachi and Kennedy, 1997b; Kawachi et al., 1997). Others have argued that associ- ations of inequality with health outcomes are likely to result from structural differences related to investment in human, physical, health and social infrastructure between more egalitarian and less egalitarian societies (Kaplan et al., 1996a). For example, Kaplan et al. (1996a) have shown that in the United States, less ega- litarian states tend to devote a smaller proportion of total spending on education and medical care and have higher school drop out rates, lower literacy rates, and higher proportions of uninsured. Any (or all) of these mechanisms could mediate the possible relation between income inequality and cardiovascular risk fac- tors, particularly in the lower income groups. Psychosocial factors could potentially affect rates of smoking, overeating, hypertension, and physical ac- tivity. In addition, less egalitarian states may invest fewer resources in creating environments conducive to developing and maintaining "healthy" behaviors, and may also invest less in health education and preventive care.
An important strength of our study is the ability to examine the effects of inequality after controlling for absolute levels of individual income (thus teasing apart the effects of context and composition), and also exam- ine differences in the effects of inequality across per- sons of different income levels. Fiscella and Franks (1997) reported no association between county-level in- dicators of inequality and all-cause mortality after con- trolling for individual-level income. Our analyses were based on statelevel inequality. If the effects of inequal- ity are in part mediated through differences in state policies and investment in human resources, state, rather than county, may be the more appropriate unit of analysis. In addition, Fiscella and Frank do not report the investigation of interactions between inequality and individual-level income. Kennedy et al. (1998) have recently examined the effects of state income inequality on self-rated health after adjustment for individual-level income. Consistent with our results, they found that persons living in the more unequal states were more likely to report fair or poor health after adjustment, and that this effect was stronger (and perhaps only present) in the lower income groups.
The use of multilevel analysis also raises the more complex question of whether the effects of income inequality on health should be estimated before or after adjustment for absolute levels of individual

A. V . Diez-Roux er al. / Social Sc :ience & Medicine 50 (2000) 673687 685
income (Wilkinson, 1997b). The total effects of income inequality on health may be mediated through two interrelated mechanisms. On one hand, the presence of income inequality in a group necessarily implies differ- ences in absolute income among its members. These differences in absolute levels of income between indi- viduals lead to the well-documented gradients in health by socioeconomic position within groups (e.g. countries or states). On the other hand, another; issue (and the topic addressed by this paper) is whether the presence of hequality itself in the griiup or society to which a person belongs i s related to individuals' health, regardless of their absolute income level (through the effects of relative deprivation or other mechanisms). Answering the latter question requires controlling for, or at least stratifying by, individual- level income (i.e. comparing persons of similar absol- ute income living in societies with different degrees of inequality). It is also true, as noted by Wilkinson (1997b) that the gradient within countries may itself result not from absolute, but from relative differences between individuals (i.e. how individuals perceive themselves relative to others). Nevertheless, it still holds that, if there is indeed a relative deprivation effect, persons of a given income living in a less egali- tarian group should have worse health outcomes than persons of similar income living in more egalitarian so- cieties (because the burden of relative deprivation is likely to be greater in the former than the latter). Consequently, the effects of inequality should persist after stratifying by, or otherwise controlling for, indi- vidual-level income. Of course, the analytical separ- ation of these two mechanisms (i.e the effects of absolute and relative differences) may be theoretically interesting but is also artificial, because both are inex- tricably linked. In reality, adjusting inequality effects for individual-level income necessarily leads to an underestlrnation of the total inequality effect on health.
Another important issue in examining the contextual effects of income inequality on health is that inequality be measured at the level at which it is relevant, based on the mechanisms through which it is presumed to operate. For example, if what matters for health is income relutzve to the population of the country as a whole, and one is using smaller areas within the country as the units for which inequality is assessed and adjusting for individual-level income, one may effectively "adjust away" a true country-level inequal- ity effect. Thus, if states are not the relevant units of analysis, by examining associations of state inequality with the outcomes after controlling for individual-level income we may in fact be adjusting away an important contextual effect of country-level inequality on health. Another problem related to the possibility of over- adjustment arises in relation to the need to control for racelethnicity. In our analyses, further adjustment for
racelethnicity had virtually no effect on results (with the exception of BMI in women). In any case, because racetethnic differences may result in part from income inequality (or income inequality may result in part from racial discrimination), we chose to present unad- justed estimates.
In interpreting our results, one should bear in mind that the variation in inequality indicators across states was small (27.1-34.1%), and that, within the context of the overall inequality of US society (which is likely to permeate all geographic areas in the country), small differences in inequality across states are likely to be less important in shaping health outcomes than the much more pronounced differences in inequality that can be found across different societies or countries. This may partly explain our failure to document stron- ger and statistically significant associations.
In our analyses, the patterns of associations observed were very similar for all three measures of inequality examined. Moreover they remained virtually identical after adjustment for median state income, as an additional summary measure of state wealth. However, we did not attempt to tease apart the effects of inequality from those of other state level character- istics causally or non-causally associated with it. h ad- dition, there has been some criticism of the use of US census derived measures of income inequality because they do not fully take into account the impact of taxes, transfers, and household size (Judge, 1996). Work by Kaplan et al. (1996b) and Kennedy et al. (1996b) has found that correction for these factors had virtually no impact on associations of state inequality with mortality (Lynch and Kaplan, 1997).
Finally, our examination of the effects of inequality on the prevalence of cardiovascular risk factors was limited by the information collected by the BRFSS. Self-reported smoking and self-reported height and weight are routinely used in surveys and cohort studies of cardiovascular disease, and have been shown to be reasonably valid measures in the literature (Bowlin et al., 1993). On the other hand, self-reported history of high blood pressure has many limitations. Bowlin et al. (1993) found that the sensitivity of self-reported his- tory of high blood pressure as an indicator of hyper- tension was only 43%. Measurement error associated with the assessment of hypertension may explain our failure to document stronger associations with this out- come in some subgroups.
As noted by Lynch and Kaplan (1997), among the major challenges facing research on income inequality and health are: (1) understanding and modeling the separate and joint effects of absolute income and income distribution; and (2) specifying the pathways through which income distribution impacts health. Despite the caveats and limitations noted above, our analyses are suggestive of a contextual effect of state
686 A.V. Diez-Roux er al. / Social Science & Medicine 50 (2000) 673487
income inequality on risk factor levels, especially among persons of lower income. These risk factors could potentially mediate a part of the association between income inequality and health outcomes pre- viously documented by ecological studies (Kaplan et al., 1996a; Kennedy et al., 1996a), and more recently by individual-level analyses (Kennedy et al., 1998). However, a variety of other mediating mechanisms which were not explored in these analyses could also be involved. In investigating the relation between income inequality and health, one may choose to focus on different sections of the continuum linking inequal- ity to the health of individuals. One approach is to in- vestigate the relationship betweea inequality and state- level factors closely related to inequality which may mediate its effect such as investment in human capital or social cohesion, as has been done by Kaplan et al. (1996a) and Kennedy et al. (1996a). Another approach is to focus on the relationship between inequality and factors more proximally associated with individual- level outcomes (such as risk factors) as we have done. Both approaches are important, and if inequality truly does affect health, both will be needed to understand why it does.
Our results suggest that income inequality may exert a contextual effect on CVD risk factor prevalences, and that the effect of income inequality may differ by income levels. A more conclusive investigation of the contextual effects of inequality on health will require more detailed specification and subsequent testing of the mechanisms involved, and definition of the contex- tual unit for which inequality will be measured based on the mechanisms hypothesized to operate.
Acknowledgements
We would like to thank Sharon Schwartz and Jo Phelan for their helpful comments on an earlier version of this manuscript. Dr Diez-Roux is supported in part by a FIRST award (R29 HL59386-01) from the National Heart Lung and Blood Institute of the National Institutes of Health. Dr Link is supported in part by a Health Policy Investigator Award from the Robert Wood Johnson Foundation. Dr Northridge is supported in part by a grant for the Harlem Health Promotion Center from the Centers for Disease Control and Prevention (U4SCCUZ09663).
References
Ben Shlomo, Y., White, I.R., Marmot, M., 1996. Does the variation in the socioeconomic characteristics of an area affect mortality? . BMJ 312, 1013-1014.
Bowlin, S.J., MoniU, B.D., Nafziger, A.N., Jenkins, P.L.,
Lewis, C., Pearson, T.A., 1993. Validity of cardiovascular disease risk factors assessed by telephone survey: The Behavioral Risk Factor Survey. J. Clin. Epidemiol. 46, 561-571.
Bmnner, E., 1997. Stress and the biology of inequality. BMJ 314, 1472-1476.
Bryk, A,, Raudenbush, S., 1992. Hierarchial Linear Models: Applications and Data Analysis Methods. Sage Publications, Newbury Park CA.
Duncan, C., Jones, K., Moon, G., 1998. Context, compo- sition, and heterogeneity: using multilevel models in health research. Soc. Sci. Med. 46, 97-1 17.
Fiscella, K., Franks, P., 1997. Poverty or income inequality as predictor of mortality: longitudinal cohort study. BMJ 314, 1724-1728.
Goldstein, H., 1995. Multilevel Statistical Models. Halstead Press, New York.
Gravelle, H., 1998. How much of the relation between popu- lation mortality and unequal distribution of income is a statistical artefact? . BMJ 316, 382-385.
Hausman, J.A., 1978. Specification tests in econometrics. Econometrica 46, 1251-1268.
Judge, K., 1995. Income distribution and life expectancy: a critical apparaisal. BMJ 31 1, 1282-1285.
Judge, K., 1996. Income and mortality in the United States. BMJ 313, 1206 (Letter to the editor).
Judge, K., Mulligan, J., Benzeval, M., 1998. Income inequal- ity and population health. Soc. Sci. Med. 46, 567-579.
Kaplan, G.A., Keil, J.E., 1993. Socioeconomic factors and cardiovascular disease: a review of the literature. Circulation 88, 1973-1998.
Kaplan, G.A., Pamuk, E.R., Lynch, J.W., Cohen, R.D., Balfour, J.L., 1996a. Inequality in income and mortality in the United States: analysis of mortality and potential path- ways. BMJ 312, 999-1003.
Kaplan, G.A., Lynch, J.W., Pamuk, E.R., Cohen, R.D., Balfour, J.L., 1996b. Income and mortality in the United States. BMJ 313, 1207 (Letter to the editor).
Kawachi, I., Kennedy, B.P., 1997a. The relationship of income inequality to mortality - does the choice of indi- cator matter? . Soc. Sci. Med. 45, 1121-1127.
Kawachi, I., Kennedy, B.P., 1997b. Health and social cohe- sion. Why care about income inequality?. BMJ 314, 1037- 1040.
Kawachi, I., Kennedy, B.P., Lochner, K., Prothrow-Stith, D., 1997. Social capital, income inequality, and mortality. Am. J. Public Health 87, 1491-1498.
Kennedy, B.P., Kawachi, I., Prothrow-Stith, D., 1996a. Income distribution and mortality: cross sectional ecologi- cal study of the Robin Hood index in the United States. BMJ 312, 1004-1007.
Kennedy, B.P., Kawachi, I., Prothrow-Stith, D., 1996b. Income and mortality in the United States (Letter to the editor) 13, 1207.
Kennedy, B.P., Kawach, I., Glass, R., Prothrow-Stith, D., 1998. Income distrubution, socioeconomic status and self rated health in the United States: a multilevel analysis. BMJ 31,917-921.
Link, B., Phelan, J., 1995. Social conditions as fundamental causes of disease. I. Health Soc. Behav. Extra issue, 80- 94.

A.V. Diez-Roux et al. i Social Sc
Littell, R.C., Milliken, GA., Stroup, W.W., Wolhger, R.D., 1996. SAS System for Mixed Models. SAS Institute Inc, Cary, NC.
Lynch, J., Kaplan, G.A., 1997. Understanding how inequality in the distribution of income affects health. J. Health P S Y C ~ O ~ . 2,297-304.
Lynch, J.W., Kaplan, GA. , Pamuk, E.R., Cohen, R.D., Heck, K.E., Balfour, J.R., Yen, I.H., 1998. Income inequality and mortality in metropolitan areas in the United States. Am. J. Public Health 88, 1074-1080.
Mason, W.M., Wong, G.W., Entwisle, B., 1983. Contextual analysis through the multilevel linear model. In: Leinhardt, S. (Ed.), Sociological Methodology 1983-1984. Josey Bass, San Francisco, pp. 72-103.
Mason, W., 1991. Problems in quantitative comparative analysis: ugly ducklings are to swans as ugly scatter plots are to . . .? In: Huber, J. (Ed.), Macro-micro Linkanes in Sociology. Sage ~ubticatibns; Newbury Park, CA, pp. 231-243.
McIsaac, S., Wilkinson, R.G., 1997. Income distribution and cause-pecific mortality. European Journal of Public Health 7, 45-53.
Remington, P.L., Smith, M.Y., Williamson, D.F., Anada, R.F., Gentry, E.M., Higelin, G.C., 1988. Design, charac- teristics, and usefulness of State-based Behavioral Risk Factor Surveillance: 1981-87. Public Health Reports 103, 366-375.
Rodgers, G.B., 1979. Income and inequality as determinants of mortality: an international cross-sectional analysis. Population Studies 33, 343-351.
Siegel, P.Z., Frazier, E.L., Mariolis, P., Brackbill, R.M., Smith, C., 1993. Behavioral risk factor surveillance 1993. Monitoring progress toward the National Year 2000 Objectives. MMWR 42 (SS-4), 1-19.
:ience & Medicine 50 (2000) 673687 687
Singer, J., 1999. Using SAS Proc Mixed to fit multilevel models, hierarchichal models, and individual growth models. J. Educat. Behav. Stat. in press.
Steckel, R.H., 1995. Stature and the standard of living. Journal of Economic Literature 33, 1903-1940.
van Doorslaer, E., Wagstaff, A., Bleichrodt, H., Calonge, S., Gerdtham, U.G., Gerfin, M., 1997. Socioeconomic inequalities in health: some international comparisons. J. Health Econ. 16, 93-1 12.
Waksberg, J.S., 1978. Sampling methods for random digit dialing. J. Am. Stat. Assoc. 73, 40-46.
Waldman, R.J., 1992. Income distribution and infant mor- tality. Quarterly Journal of Economics 107, 1283-1302.
Wennemo, I., 1993. Infant mortality, public policy and inequality - a comparison of 18 industrialized countries 1950-85. Sociology of Health and Illness IS, 429446.
Wilkinson, R.G. (Ed.), 1986. Income and mortality. In: Class and Health: Research and Longitudinal Data. Tavistock, London.
Wilkinson, R.G., 1990. Income distribution and mortality: a "natural" experiment. Sociology of Health and Illness 12, 391412.
Wilkinson, R.G., 1992. Income distribution and life expect- ancy. BMJ 30, 165-168.
Wilkinson, R.G., 1996. Unhealthy Societies: The Al3ictions of Inequality. Routledge, New York.
Wilkinson, R.G., 1997a. Health inequalities: relative or absol- ute material standards? . BMJ 314, 591-595.
Wilkinson, R.G., 1997b. Commentary: income inequality summarises the health burden of individual relative depri- vation. BMJ 314, 1727-1728.
Wong, G.Y ., Mason, W.M., 1985. The hierarchichal logistic regression model for multilevel analysis. J. Am. Stat. Assoc. 80, 5 13-524.