Embed Size (px)
Citation preview
HAL Id: hal-00300948https://hal.archives-ouvertes.fr/hal-00300948
Submitted on 28 Oct 2002
HAL is a multi-disciplinary open accessarchive for the deposit and dissemination of sci-entific research documents, whether they are pub-lished or not. The documents may come fromteaching and research institutions in France orabroad, or from public or private research centers.
L’archive ouverte pluridisciplinaire HAL, estdestinée au dépôt et à la diffusion de documentsscientifiques de niveau recherche, publiés ou non,émanant des établissements d’enseignement et derecherche français ou étrangers, des laboratoirespublics ou privés.
A model for particle formation and growth in theatmosphere with molecular resolution in size
K. E. J. Lehtinen, M. Kulmala
To cite this version:K. E. J. Lehtinen, M. Kulmala. A model for particle formation and growth in the atmosphere withmolecular resolution in size. Atmospheric Chemistry and Physics Discussions, European GeosciencesUnion, 2002, 2 (5), pp.1791-1807. �hal-00300948�
ACPD2, 1791–1807, 2002
Particle formationand growth in the
atmosphere
K. E. J. Lehtinen andM. Kulmala
Title Page
Abstract Introduction
Conclusions References
Tables Figures
J I
J I
Back Close
Full Screen / Esc
Print Version
Interactive Discussion
c© EGU 2002
Atmos. Chem. Phys. Discuss., 2, 1791–1807, 2002www.atmos-chem-phys.org/acpd/2/1791/c© European Geosciences Union 2002
AtmosphericChemistry
and PhysicsDiscussions
A model for particle formation and growthin the atmosphere with molecularresolution in sizeK. E. J. Lehtinen and M. Kulmala
Helsinki University, Dept. Physical Sciences, P.O. Box 64, 00014 Univ. of Helsinki, Finland
Received: 23 August 2002 – Accepted: 18 October 2002 – Published: 28 October 2002
Correspondence to: K. E. J. Lehtinen ([email protected])
1791
ACPD2, 1791–1807, 2002
Particle formationand growth in the
atmosphere
K. E. J. Lehtinen andM. Kulmala
Title Page
Abstract Introduction
Conclusions References
Tables Figures
J I
J I
Back Close
Full Screen / Esc
Print Version
Interactive Discussion
c© EGU 2002
Abstract
The formation and growth of atmospheric aerosol particles is considered using an exactdiscrete method with molecular resolution in size space. The method is immune tonumerical diffusion problems that are a nuisance for typical simulation methods usinga sectional representation for the particle size distribution. For condensational growth,5
a slight modification is proposed for the Fuchs-Sutugin expression, which improves theprediction of the growth rate of nano-sized particles by as much as a factor of two.The presented method is applied to particle formation in a Finnish Boreal forest and isshown to capture the essential features of the dynamics quite nicely. Furthermore, it isshown that the growth of the particles is roughly linear, which means that the amount10
of condensable vapour is constant (of the order 1013 1/m3).
1. Introduction
The formation and growth of atmospheric aerosols has recently received growing ex-perimental and theoretical interest due to climate and health related effects of fine par-ticles (Charlson and Wigley, 1994; Dockery and Pope, 1994). The increased aerosol15
concentrations are largely due to secondary particle production, i.e. homogeneousnucleation and subsequent growth from vapours. Instrument techniques for measur-ing freshly formed particle concentrations have been recently developed, and particleswith a diameter of about 3 nm can be detected. These small particles have been foundin the free troposphere (Clarke, 1992; Schroder and Strom, 1997; Raes et al., 1997),20
in the marine boundary layer (Covert et al., 1992; Hoppel et al., 1994; O’Dowd et al.,1999), in the vicinity of evaporating clouds (Hegg et al., 1991), in Arctic areas (Wieden-sohler et al., 1996; Pirjola et al., 1998), in urban areas and in stack plumes (Kerminenand Wexler, 1996), in continental boundary layer (Birmilli and Wiedensohler, 2000) andrecently also in boreal forests (Makela et al., 1997; Kulmala et al., 1998, 2001a).25
The freshly formed aerosols become climatically important only if they are able to
1792
ACPD2, 1791–1807, 2002
Particle formationand growth in the
atmosphere
K. E. J. Lehtinen andM. Kulmala
Title Page
Abstract Introduction
Conclusions References
Tables Figures
J I
J I
Back Close
Full Screen / Esc
Print Version
Interactive Discussion
c© EGU 2002
grow to sizes of 50 nm and larger. Particles in this size range can act as cloud con-densation nuclei, and therefore they may contribute to the so-called indirect aerosolcooling effect of the climate. Furthermore, if the particles grow to sizes above 100 nm,they become to scatter light very efficiently, and have thereby a direct cooling effecton the climate. Whether or not the new particles ever reach these sizes is to a large5
extent decided while they are still smaller than 10 nm (Kulmala et al., 2000, 2001b).Due to their Brownian movement, particles with diameters of a few nm coagulate veryefficiently with larger particles, which implies that the freshly nucleated particles haveto grow fairly rapidly (within a few hours) past the 10 nm limit or they will be lost in thecollision processes (Kulmala et al., 2000). Such growth is possible only if there is a10
supersaturated vapour present at concentrations above 107 molecules per cubic cen-timeter of air (Kulmala et al., 2001b). In order to determine the climatic importance ofatmospheric nucleation events, we need to know what are the vapours causing the par-ticle growth, what are the chemical mechanisms controlling their formation, and whatif any is the anthropogenic influence on their concentrations. At the moment, we only15
know that the growth of particles after continental nucleation events is with high proba-bility caused by organic vapours (O’Dowd et al., 2002). The longest time sequence ofobservations is from Hyytiala (61◦51′ N 24◦17′ E) in Finland, where measurements witha differential mobility particle sizer (DMPS), measures the aerosol number concentra-tion from 3–610 nm dry diameter), begun in January 1996. Up to May 2002 there were20
around 300 days with nucleation. The particle formation is usually observed in thelate morning as the appearance of 3 nm particles at the lower size range of the DMPS(Makela at al., 1997, Kulmala et al., 2001a).
In this paper we consider the condensational growth of freshly nucleated particles.The methodology includes three novel techniques: (1) an improved model in free25
molecular regime condensation, based on a simple modification to the well knownFuchs-Sutugin expression (Fuchs and Sutugin, 1971) (2) a discrete method for solvingthe general dynamic equation (GDE, Friedlander, 2000) for the particle size distribution,that is free of numerical discretization errors and (3) analysis of the time evolution of
1793
ACPD2, 1791–1807, 2002
Particle formationand growth in the
atmosphere
K. E. J. Lehtinen andM. Kulmala
Title Page
Abstract Introduction
Conclusions References
Tables Figures
J I
J I
Back Close
Full Screen / Esc
Print Version
Interactive Discussion
c© EGU 2002
point wise values of the measured particle size distribution to validate the assumptionof a constant concentration of condensable vapour, resulting in linear growth in termsof particle diameter.
2. Theory
2.1. Free-molecular condensation5
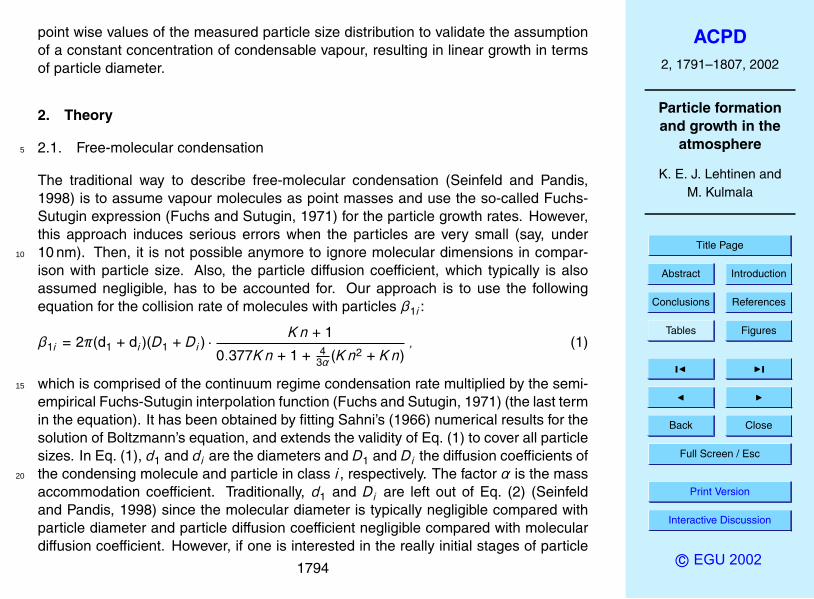
The traditional way to describe free-molecular condensation (Seinfeld and Pandis,1998) is to assume vapour molecules as point masses and use the so-called Fuchs-Sutugin expression (Fuchs and Sutugin, 1971) for the particle growth rates. However,this approach induces serious errors when the particles are very small (say, under10 nm). Then, it is not possible anymore to ignore molecular dimensions in compar-10
ison with particle size. Also, the particle diffusion coefficient, which typically is alsoassumed negligible, has to be accounted for. Our approach is to use the followingequation for the collision rate of molecules with particles β1i :
β1i = 2π(d1 + di )(D1 + Di ) ·Kn + 1
0.377Kn + 1 + 43α (Kn2 + Kn)
, (1)
which is comprised of the continuum regime condensation rate multiplied by the semi-15
empirical Fuchs-Sutugin interpolation function (Fuchs and Sutugin, 1971) (the last termin the equation). It has been obtained by fitting Sahni’s (1966) numerical results for thesolution of Boltzmann’s equation, and extends the validity of Eq. (1) to cover all particlesizes. In Eq. (1), d1 and di are the diameters and D1 and Di the diffusion coefficients ofthe condensing molecule and particle in class i , respectively. The factor α is the mass20
accommodation coefficient. Traditionally, d1 and Di are left out of Eq. (2) (Seinfeldand Pandis, 1998) since the molecular diameter is typically negligible compared withparticle diameter and particle diffusion coefficient negligible compared with moleculardiffusion coefficient. However, if one is interested in the really initial stages of particle
1794
ACPD2, 1791–1807, 2002
Particle formationand growth in the
atmosphere
K. E. J. Lehtinen andM. Kulmala
Title Page
Abstract Introduction
Conclusions References
Tables Figures
J I
J I
Back Close
Full Screen / Esc
Print Version
Interactive Discussion
c© EGU 2002
growth, i.e. when their diameters are of order 1 nm, such approximations are obviouslynot possible.
In this formulation, to obtain correct asymptotical behaviour in the small particle limit,the Knudsen number Kn should be defined as
Kn =2λ
(d1 + di )(2)
5
in which the mean free path of the condensation process is
λ =3(D1 + Di )√
c21 + c
2i
. (3)
Again, the difference to the standard way is that now the molecular dimensions aswell as particle diffusion are not neglected.
2.2. Discrete solution of the size distribution10
Next, we turn to the issue of solving the particle size distribution in detail. The aerosolgeneral dynamic equation (Friedlander, 2000) is typically solved using either a sec-tional method with fixed sections or with moving sections. The idea behind the sectionalmethod is to approximate the particle size distribution with a histogram. Then, the var-ious aerosol dynamical processes (nucleation, condensation, coagulation, deposition,15
transport) are treated by modelling the concentration and/or location of each section.Using fixed sections is naturally ideal for nucleation and coagulation processes. How-ever, for condensation/evaporation this method has a serious drawback, numerical dif-fusion (Zhang et al., 1999) It can be circumvented by using moving sections - then,however, we might encounter a situation in which there are no sections in a size range20
of importance (for example, the size of nucleating particles). In this paper, we presentan approach that has neither of the abovementioned drawbacks: the size sectionsare fixed but the spacing is done molecule-by-molecule. Then, the actual physics of
1795
ACPD2, 1791–1807, 2002
Particle formationand growth in the
atmosphere
K. E. J. Lehtinen andM. Kulmala
Title Page
Abstract Introduction
Conclusions References
Tables Figures
J I
J I
Back Close
Full Screen / Esc
Print Version
Interactive Discussion
c© EGU 2002
the problem are mimicked in detail, and provided that the computational burden is notinsuperable, the method should, in principle, be free of any discretization errors.
The dynamics of nucleation mode particle size distribution is simulated using a dis-crete coagulation scheme with appropriate sources:
dN1
dt= I1 − k∗Ik∗ − N1
∞∑i=k∗
β1iNi (4a)5
dNk∗
dt= Ik∗ − β1k∗N1Nk∗ − Nk∗
∞∑i=k∗
βk∗,iNk∗Ni (4b)
dNk
dt= β1,k−1N1Nk−1 +
12
k−k∗∑i=k∗
βi ,k−iNiNk−i − β1kN1Nk −Nk
∞∑i=k∗
βikNi (k > k∗) (4c)
using the Fuchs expression (20) for the collision frequency functions βi j . In our ap-proach, we select class 1 to represent molecules. I1 is a source rate for the molecules.Class k∗ represents the smallest stable particles, with Ik∗ as their nucleation rate. The10
particle dynamics, in addition to the nucleation source, is driven by coagulation andcondensation/evaporation. In this method, condensation is treated as collisions withclass 1, and is thus free of any numerical diffusion problems. The condensation ratesβ1i are calculated from the modified Fuchs-Sutugin expressions as explained above.
3. Results15
An important practical system to investigate the improved growth expression is thegrowth of particles from nucleation size (say 1 nm in diameter) to 3 nm. The reasonfor this is that available particle size distribution measurement instrumentation typicallyhas a cut-off at 3 nm. This means that when trying to obtain the particle nucleationrate from these measurements, one has to back-calculate down to 1 nm (Kulmala et20
1796
ACPD2, 1791–1807, 2002
Particle formationand growth in the
atmosphere
K. E. J. Lehtinen andM. Kulmala
Title Page
Abstract Introduction
Conclusions References
Tables Figures
J I
J I
Back Close
Full Screen / Esc
Print Version
Interactive Discussion
c© EGU 2002
al., 2001b; Kerminen and Kulmala, 2002). As soon as the particles have been formed,they grow by condensation to larger sizes, but at the same time their concentration isdiminished because of collisions with other particles (coagulation). Thus, to get the cor-rect nucleation rate from experimental data, it is essential to know the condensationalgrowth rate in detail.5
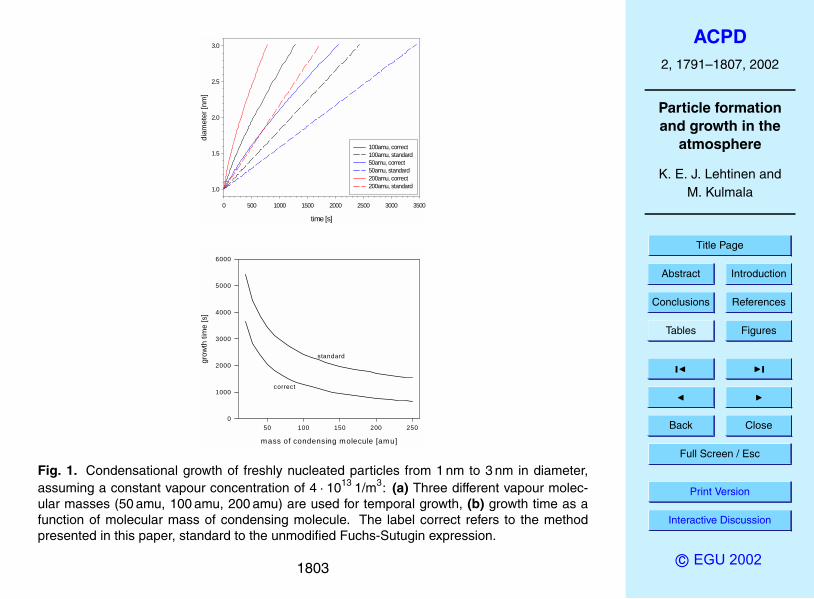
In the atmosphere, in many cases, it is not known what is the vapour that is con-densing onto the freshly nucleated particles, thus causing their growth to observablesizes. The parameters affecting the growth rate are mainly the vapour molecular massand diameter. In our sample calculations, we thus use several different values for themolecular mass, thus not specifying any detailed species. In Fig. 1, the growth of a10
particle of density 1000 kg/m3 is simulated. The condensed material is also assumedto be of the same density, with molecular mass of 50, 100 and 200 amu. The vapourconcentration is assumed constant (4 ·1013 1/m3). The standard Fuchs-Sutugin resultsare shown with dotted lines and the results obtained using the corrected model withsolid lines. As seen in Fig. 1, it is obvious that particle growth is faster with a vapour15
with larger molecular size. Also, there is a significant difference in growth rates, whenusing the corrected expressions compared with the standard Fuchs-Sutugin model,especially at the initial stages of growth when the particle is still very small. Figure 1ashows the evolution of the particle diameter with time for various values of the molecu-lar mass and Fig. 1b the growth time as a function of vapour molecular mass. In growth20
time from 1 nm to 3 nm, errors more than 100% can be obtained, if the molecular di-mensions and the particle diffusion coefficient are neglected. It must be noted thateach simulation is based on assuming constant vapour concentration during growth,and that the same value is used for each run using different molecular masses
To demonstrate the usefulness of the presented method, we show two simulation re-25
sults of nucleation events from Hyytiala measurement station in Finland, in which clearbursts of particle formation, accompanied with subsequent growth, were observedabove a boreal forest. One of the events (20 May 1998) was simulated previously byKulmala et al. (2000), but using a sectional method with a geometrical spacing of size
1797
ACPD2, 1791–1807, 2002
Particle formationand growth in the
atmosphere
K. E. J. Lehtinen andM. Kulmala
Title Page
Abstract Introduction
Conclusions References
Tables Figures
J I
J I
Back Close
Full Screen / Esc
Print Version
Interactive Discussion
c© EGU 2002
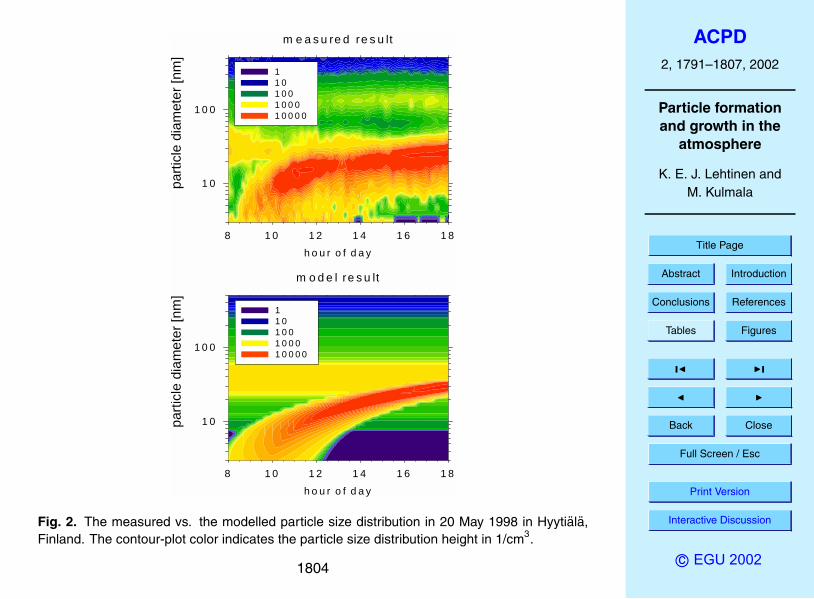
classes. The qualitative agreement between the experiment and the simulation wassatisfactory. However, the used sectional method suffers from numerical diffusion andthe size distribution narrowing effect, often present in particle growth driven by vapourcondensation, is destroyed. The new result, using the discrete method is shown inFig. 2, together with the experimental result. When compared with the previous model5
by Kulmala et al. (2000) there is one very noticeable difference. Now, the maximumvalues for the distribution density function are not located at 3 nm (bottom of figure) asis the case for the simulation with numerical diffusion. Instead, now the distribution isfirst broader, but gradually evolves to a more narrow but higher distribution.
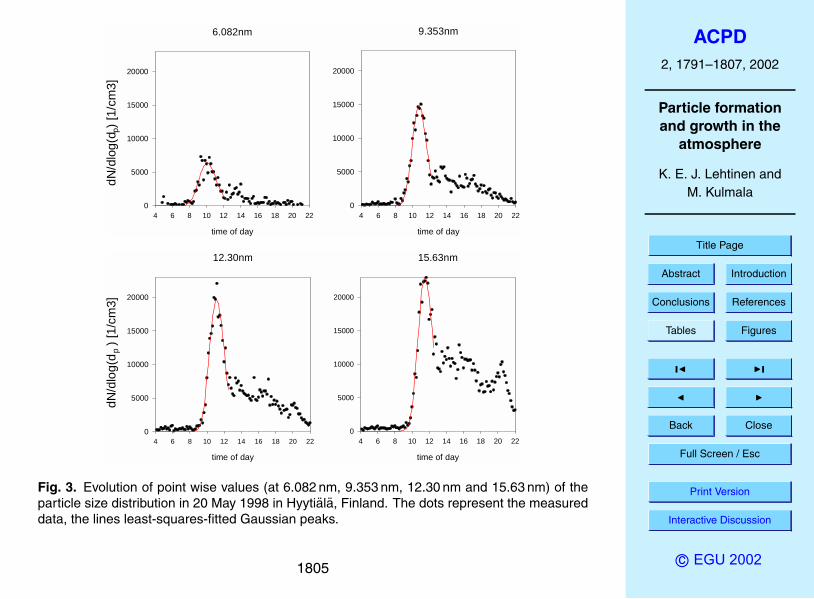
The phenomenon can be seen even more clearly, when the experimental results (for10
20 May 1998) are presented as in Fig. 3, in which the point wise values of the size distri-bution are presented for four different particle diameters (6.082 nm, 9.353 nm, 12.30 nmand 15.83 nm), as a function of time. The values correspond to different classes of theparticle-sizing instrument. In all curves the region left of the peak corresponds to earlystages in which the nucleation burst has not even started or growth has not propa-15
gated to the size of interest yet. Then the concentration starts increasing and reachesits maximum when the actual maximum of the nucleation mode size distribution is atthe corresponding location. The region right to the peak corresponds to time when thepeak has already passed the corresponding size. There are, however some particlespresent, which most probably come from mixing of air. The model assumes a homoge-20
nous air parcel, in contrast to the experimental set-up in which the measuring locationis fixed but the air around it moves.
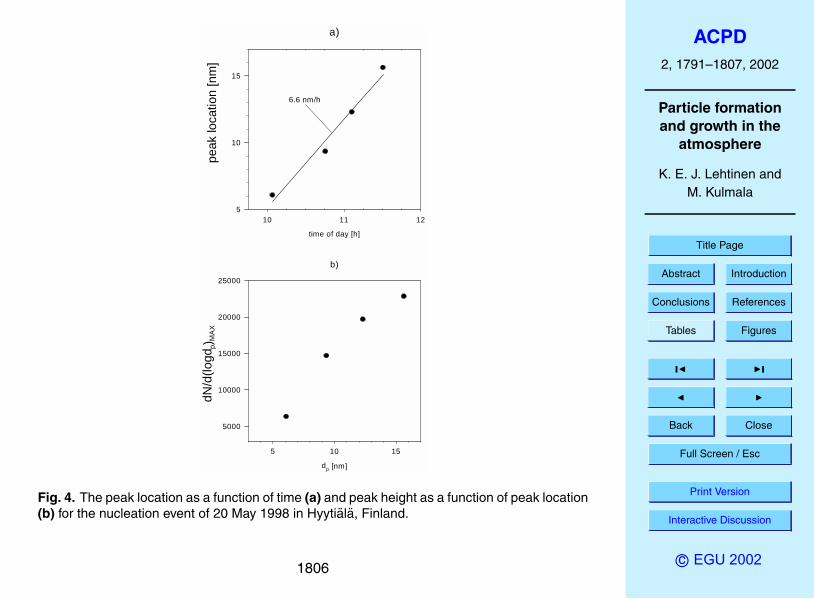
From the data presented Fig. 3, it is possible to analyse the experimental growth pro-cess further. In Fig. 4a the location of the size distribution peak is shown as a functionof time, and in Fig. 4b the height of the peak is shown as a function of corresponding25
particle diameter. From Eq. (1) it is straightforward to deduce that the growth rate ofparticles in the kinetic regime is almost independent of size, resulting in linear growth(see, e.g. Seinfeld and Pandis, 1998). Based on Fig. 4a, growth indeed is linear, sup-porting theory as well as the assumption that the amount of vapour contributing to the
1798
ACPD2, 1791–1807, 2002
Particle formationand growth in the
atmosphere
K. E. J. Lehtinen andM. Kulmala
Title Page
Abstract Introduction
Conclusions References
Tables Figures
J I
J I
Back Close
Full Screen / Esc
Print Version
Interactive Discussion
c© EGU 2002
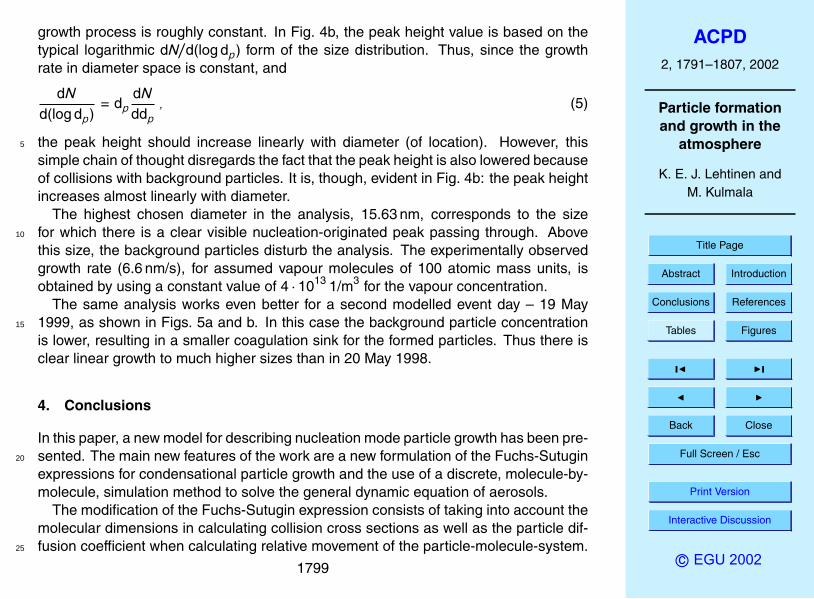
growth process is roughly constant. In Fig. 4b, the peak height value is based on thetypical logarithmic dN/d(log dp) form of the size distribution. Thus, since the growthrate in diameter space is constant, and
dNd(log dp)
= dpdNddp
, (5)
the peak height should increase linearly with diameter (of location). However, this5
simple chain of thought disregards the fact that the peak height is also lowered becauseof collisions with background particles. It is, though, evident in Fig. 4b: the peak heightincreases almost linearly with diameter.
The highest chosen diameter in the analysis, 15.63 nm, corresponds to the sizefor which there is a clear visible nucleation-originated peak passing through. Above10
this size, the background particles disturb the analysis. The experimentally observedgrowth rate (6.6 nm/s), for assumed vapour molecules of 100 atomic mass units, isobtained by using a constant value of 4 · 1013 1/m3 for the vapour concentration.
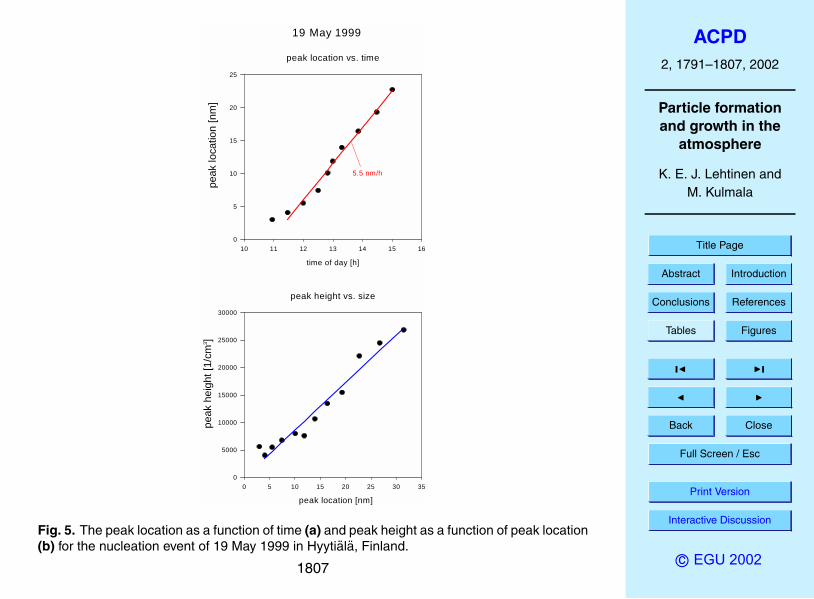
The same analysis works even better for a second modelled event day – 19 May1999, as shown in Figs. 5a and b. In this case the background particle concentration15
is lower, resulting in a smaller coagulation sink for the formed particles. Thus there isclear linear growth to much higher sizes than in 20 May 1998.
4. Conclusions
In this paper, a new model for describing nucleation mode particle growth has been pre-sented. The main new features of the work are a new formulation of the Fuchs-Sutugin20
expressions for condensational particle growth and the use of a discrete, molecule-by-molecule, simulation method to solve the general dynamic equation of aerosols.
The modification of the Fuchs-Sutugin expression consists of taking into account themolecular dimensions in calculating collision cross sections as well as the particle dif-fusion coefficient when calculating relative movement of the particle-molecule-system.25
1799
ACPD2, 1791–1807, 2002
Particle formationand growth in the
atmosphere
K. E. J. Lehtinen andM. Kulmala
Title Page
Abstract Introduction
Conclusions References
Tables Figures
J I
J I
Back Close
Full Screen / Esc
Print Version
Interactive Discussion
c© EGU 2002
There is, in principle, nothing novel in this. It is qualitatively how particle-particle colli-sion frequency functions have been calculated for a long time. However, for condensa-tion it is very typical to use the Fuchs-Sutugin expressions instead of collision theory.It is shown that these effects are far from negligible. For instance, when calculatingparticle growth from 1 nm to 3 nm, the effect can be more than a factor of two! For5
many formation-growth occurrences in the nature, the molecules responsible for con-densational growth can be complex organic or other rather large molecules. Then it isincreasingly important to take the above-mentioned effects into account, as shown inthe sample calculations of this paper.
The discrete method used in this paper has the advantage of being very easy to10
program and being free of artificial numerical diffusion problems, that are so oftenpresent in sectional models used in particle size distribution studies. The reason isthat, in principle, all physically possible particle sizes are chosen to be size classes. Ofcourse the method is computationally heavy, but as shown in this paper, still feasiblefor covering the entire nucleation mode dynamics. A comparison with a real natural15
nucleation-growth event over a boreal forest in Finland, the method seems to capturethe key qualitative behaviour of such a system. Furthermore, the method can be usedto validate more approximate but faster methods, in which nucleation, condensationand coagulation are simultaneously present. Analytical solutions for such systems arenon-existent, thus a method free of discretisation errors is certainly of value for such20
validation studies.
References
Birmilli, W. and Wiedensohler, A.: New particle formation in the continental boundary layer:Meteorological and gas phase parameter influence, Geophys. Res. Lett., 27, 3325, 2000.
Charlson, R. J. and Wigley, T. M. L.: Sulphate aerosol and climatic change, Scientific American,25
270, 48–57, 1994.
1800
ACPD2, 1791–1807, 2002
Particle formationand growth in the
atmosphere
K. E. J. Lehtinen andM. Kulmala
Title Page
Abstract Introduction
Conclusions References
Tables Figures
J I
J I
Back Close
Full Screen / Esc
Print Version
Interactive Discussion
c© EGU 2002
Clarke, A. D.: Atmospheric nuclei in the remote free troposphere, J. Atmos. Chem., 14, 479–488, 1992.
Covert, D. S., Kapustin, V. N., Quinn, P. K., and Bates, T. S.: New particle formation in themarine boundary layer, J. Geophys. Res., 97, 20 581–20 587, 1992.
Dockery, D. W. and Pope, C. A.: Acute respiratory effects of particulate air pollution, Annu. Rev.5
Public. Health, 15, 107–132, 1994.Friedlander, S. K.: Smoke Dust and Haze, Oxford University Press, 2000.Fuchs, N. A. and Sutugin, A. G.: in: Topics in current aerosol research (Part 2), (Eds) Hidy, G.
M., and Brock, J. R., Pergamon, New York, 1971.Hegg, D. A., Radke, L. F. and Hobbs, P. V.: Measurements of Aitken nuclei and cloud condensa-10
tion nuclei in the marine atmosphere and their relation to the DMS-cloud-climate hypothesis,J. Geophys. Res., 96, 18 727–18 733, 1991.
Hoppel, W. A., Frick, G. M., Fitzgerand, J. W., and Larson, R. E.: Marine boundary layermeasurements of new particle formation and the effects nonprecipitating clouds have onaerosol size distribution, J. Geophys. Res., 99, 14 443–14 459, 1994.15
Kerminen, N.-M. amd Kulmala, M.: Analytical formulae connecting the “real” and the “appar-ent” nucleation rate and the nuclei number concentration for atmospheric nucleation events,Aerosol Science, 33, 609–622, 2002.
Kerminen, V.-M. and Wexler, A. S.: The occurrence of sulfuric acid-water nucleation in plumes:Urban environment, Tellus, 48B, 65–82, 1996.20
Kulmala M., Pirjola L., and Makela J. M.: Stable sulphate clusters as a source of new atmo-spheric particles, Nature, 404, 66–69, 2000.
Kulmala, M., Toivonen, A., Makela, J. M., and Laaksonen A.: Analysis of the growth of nucle-ation mode particles observed in Boreal forest, Tellus 50B, 449–462, 1998.
Kulmala, M., Hameri, K., Aalto, P., Makela, J. M., Pirjola, L., Nilsson, E. D., Buzorius, G.,25
Rannik, U., Dal Maso, M., Seidl, W., Hoffmann, T., Jansson, R., Hansson, H.-C., Viisanen,Y., Laaksonen, A., and O’Dowd, C. D.: Overview of the international project on Biogenicaerosol formation in the boreal forest (BIOFOR), Tellus 53B, 324–343, 2001a.
Kulmala M., Dal Maso, M., Makela, J. M., Pirjola, L., Vakeva, M., Aalto, P., Miikkulainen, P.,Hameri, K., and O’Dowd, C. D.: On the formation, growth and composition of nucleation30
mode particles, Tellus 53B, 479–490, 2001b.Makela, J. M., Aalto, P., Jokinen, V., Pohja, T., Nissinen, A., Palmroth, S., Markkanen, T.,
Seitsonen, K., Lihavainen, H., and Kulmala, M.: Observations of ultrafine aerosol particle
1801
ACPD2, 1791–1807, 2002
Particle formationand growth in the
atmosphere
K. E. J. Lehtinen andM. Kulmala
Title Page
Abstract Introduction
Conclusions References
Tables Figures
J I
J I
Back Close
Full Screen / Esc
Print Version
Interactive Discussion
c© EGU 2002
formation and growth in boreal forest, Geophys. Res. Lett., 24, 1219–1222, 1997.O’Dowd, C., McFiggins, G., Creasey, D. J., Pirjola, L., Hoell, C., Smith, M. H., Allan, B. J., Plane,
J. M. C., Heard, D. E., Lee, J. D., Pilling, M. J., and Kulmala, M.: On the photochemicalproduction of new particles in the coastal boundary layer, Geophys. Res. Lett., 26, 1707–1710, 1999.5
O’Dowd, C., Aalto, P., Hameri, K., Kulmala, M., and Hoffmann T.: Atmospheric particles fromorganic vapours, Nature, 416, 497–498, 2002.
Pirjola, L., Laaksonen, A., Aalto, P., and Kulmala, M.: Sulfate aerosol formation in the Arcticboundary layer, J. Geophys. Res., 103, 8309–8322, 1998.
Raes, F., Van Dingenen, R., Cuevas, E., Van Velthoven, P. F. J., and Prospero, J. M.: Ob-10
servations of aerosols in the free troposphere and marine boundary layer of the subtropicalNortheast Atlantic: Discussion of processes determining their size distribution, J. Geophys.Res., 102, 21 315–21 328, 1997.
Schroder, F. and Strom, J.: Aircraft measurements of submicrometer aerosol particles (> 7 nm)in the midlatitude free troposphere and tropopause region, Atmos. Res., 44, 333–356, 1997.15
Sahni, D. C.: The effect of a black sphere on the flux distribution of an infinite moderator, J.Nucl. Energy 20, 915–920, 1966.
Seinfeld, J. H. and Pandis, S. N.: Atmospheric Chemistry and Physics, Wiley, New York, 1998.Wiedensohler, A., Covert, D. S., Swietlicki, E., Aalto, P., Heintzenberg, J., and Leck, C.: Occur-
rence of an ultrafine particle mode less than 20 nm in diameter in the marine boundary layer20
during Arctic summer and autumn, Tellus, 48B, 213–222, 1996.Zhang, Y., Seigneur, C., Seinfeld, J. H., Jacobson, M. Z., and Binkowski, F.: Simulation of
aerosol dynamics: a comparative review of algorithms used in air quality models, AerosolSci. Tech. 31, 487–514, 1999.
25
1802
ACPD2, 1791–1807, 2002
Particle formationand growth in the
atmosphere
K. E. J. Lehtinen andM. Kulmala
Title Page
Abstract Introduction
Conclusions References
Tables Figures
J I
J I
Back Close
Full Screen / Esc
Print Version
Interactive Discussion
c© EGU 2002
time [s]
0 500 1000 1500 2000 2500 3000 3500di
amet
er [n
m]
1.0
1.5
2.0
2.5
3.0
100amu, correct100amu, standard50amu, correct50amu, standard200amu, correct200amu, standard
mass of condensing molecule [amu]
50 100 150 200 250
grow
th ti
me
[s]
0
1000
2000
3000
4000
5000
6000
standard
correct
Fig. 1. Condensational growth of freshly nucleated particles from 1 nm to 3 nm in diameter,assuming a constant vapour concentration of 4 · 1013 1/m3: (a) Three different vapour molec-ular masses (50 amu, 100 amu, 200 amu) are used for temporal growth, (b) growth time as afunction of molecular mass of condensing molecule. The label correct refers to the methodpresented in this paper, standard to the unmodified Fuchs-Sutugin expression.
1803
ACPD2, 1791–1807, 2002
Particle formationand growth in the
atmosphere
K. E. J. Lehtinen andM. Kulmala
Title Page
Abstract Introduction
Conclusions References
Tables Figures
J I
J I
Back Close
Full Screen / Esc
Print Version
Interactive Discussion
c© EGU 2002
m o d e l re s u lt
h o u r o f d a y8 1 0 1 2 1 4 1 6 1 8
parti
cle
diam
eter
[nm
]
1 0
1 0 0
1 1 0 1 0 0 1 0 0 0 1 0 0 0 0
m e a s u re d re s u lt
h o u r o f d a y8 1 0 1 2 1 4 1 6 1 8
parti
cle
diam
eter
[nm
]1 0
1 0 0
1 1 0 1 0 0 1 0 0 0 1 0 0 0 0
Fig. 2. The measured vs. the modelled particle size distribution in 20 May 1998 in Hyytiala,Finland. The contour-plot color indicates the particle size distribution height in 1/cm3.
1804
ACPD2, 1791–1807, 2002
Particle formationand growth in the
atmosphere
K. E. J. Lehtinen andM. Kulmala
Title Page
Abstract Introduction
Conclusions References
Tables Figures
J I
J I
Back Close
Full Screen / Esc
Print Version
Interactive Discussion
c© EGU 2002
6.082nm
time of day
4 6 8 10 12 14 16 18 20 22
dN/d
log(
d p) [
1/cm
3]
0
5000
10000
15000
20000
9.353nm
time of day
4 6 8 10 12 14 16 18 20 220
5000
10000
15000
20000
12.30nm
time of day
4 6 8 10 12 14 16 18 20 22
dN/d
log(
d p) [
1/cm
3]
0
5000
10000
15000
20000
15.63nm
time of day
4 6 8 10 12 14 16 18 20 220
5000
10000
15000
20000
Fig. 3. Evolution of point wise values (at 6.082 nm, 9.353 nm, 12.30 nm and 15.63 nm) of the
particle size distribution in 20 May 1998 in Hyytiala, Finland. The dots represent the measureddata, the lines least-squares-fitted Gaussian peaks.
1805
ACPD2, 1791–1807, 2002
Particle formationand growth in the
atmosphere
K. E. J. Lehtinen andM. Kulmala
Title Page
Abstract Introduction
Conclusions References
Tables Figures
J I
J I
Back Close
Full Screen / Esc
Print Version
Interactive Discussion
c© EGU 2002
b)
dp [nm]
5 10 15
dN/d
(logd
p) MA
X
5000
10000
15000
20000
25000
a)
time of day [h]
10 11 12pe
ak lo
catio
n [n
m]
5
10
15
6.6 nm/h
Fig. 4. The peak location as a function of time (a) and peak height as a function of peak location
(b) for the nucleation event of 20 May 1998 in Hyytiala, Finland.
1806
ACPD2, 1791–1807, 2002
Particle formationand growth in the
atmosphere
K. E. J. Lehtinen andM. Kulmala
Title Page
Abstract Introduction
Conclusions References
Tables Figures
J I
J I
Back Close
Full Screen / Esc
Print Version
Interactive Discussion
c© EGU 2002
19 May 1999
peak location vs. time
time of day [h]
10 11 12 13 14 15 16
peak
loca
tion
[nm
]
0
5
10
15
20
25
peak height vs. size
peak location [nm]0 5 10 15 20 25 30 35
peak
hei
ght [
1/cm
3 ]
0
5000
10000
15000
20000
25000
30000
5.5 nm/h
Fig. 5. The peak location as a function of time (a) and peak height as a function of peak location
(b) for the nucleation event of 19 May 1999 in Hyytiala, Finland.
1807