Embed Size (px)
Citation preview

Atmosphere 2020, 11, 79; doi:10.3390/atmos11010079 www.mdpi.com/journal/atmosphere
Article
Characterization of Urban New Particle Formation in Amman—Jordan Tareq Hussein 1,2,*, Nahid Atashi 2,3, Larisa Sogacheva 4, Simo Hakala 2, Lubna Dada 2, Tuukka Petäjä 2 and Markku Kulmala 2
1 Department of Physics, The University of Jordan, Amman 11942, Jordan 2 Institute for Atmospheric and Earth System Research (INAR)/Physics, Faculty of Science, University of
Helsinki, PL 64, FI-00014 UHEL Helsinki, Finland; [email protected] or [email protected] (N.A.); [email protected] (S.H.); [email protected] (L.D.); [email protected] (T.P.); [email protected] (M.K.)
3 Department of Physical Geography, Faculty of Geographical Science and Planning, University of Isfahan, Isfahan 8174673441, Iran
4 Finnish Meteorological Institute, Climate Change Programme, FI-00101 Helsinki, Finland; [email protected]
* Correspondence: [email protected] or [email protected]
Received: 30 November 2019; Accepted: 7 January 2020; Published: 9 January 2020
Abstract: We characterized new particle formation (NPF) events in the urban background of Amman during August 2016–July 2017. The monthly mean of submicron particle number concentration was 1.2 × 10⁴–3.7 × 104 cm−3 (exhibited seasonal, weekly, and diurnal variation). Nucleation mode (10–15 nm) concentration was 0.7 × 10³–1.1 × 103 cm−3 during daytime with a sharp peak (1.1 × 10³–1.8 × 103 cm−3) around noon. We identified 110 NPF events (≈34% of all days) of which 55 showed a decreasing mode diameter after growth. The NPF event occurrence was higher in summer than in winter, and events were accompanied with air mass back trajectories crossing over the Eastern Mediterranean. The mean nucleation rate (J10) was 1.9 ± 1.1 cm−3 s−1 (monthly mean 1.6–2.7 cm−3 s−1) and the mean growth rate was 6.8 ± 3.1 nm/h (4.1–8.8 nm/h). The formation rate did not have a seasonal pattern, but the growth rate had a seasonal variation (maximum around August and minimum in winter). The mean condensable vapor source rate was 4.1 ± 2.2 × 10⁵ molecules/cm3 s (2.6–6.9 × 10⁵ molecules/cm3 s) with a seasonal pattern (maximum around August). The mean condensation sink was 8.9 ± 3.3 × 10⁻³ s−1 (6.4–14.8 × 10⁻³ s−1) with a seasonal pattern (minimum around June and maximum in winter).
Keywords: formation rate; growth rate; condensation sink; vapor source rate; particle number size distribution; seasonal
1. Introduction
Aerosol particles have direct and indirect impacts on Earth’s climate and public health [1–7]. Thus, it is important to understand their sources and sinks in terms of formation, transformation, and removal processes in the atmosphere in addition to their physical and chemical properties.
Aerosol particles originate from several sources including natural and anthropogenic ones. New particle formation (NPF), which is the gas-to-particle conversion, is a major source of aerosol particles that can grow to sizes where they can act as cloud condensation nuclei and further affect the climate [8–10]. NPF has been observed in different environments including the free troposphere; high mountains; arctic, and sub-arctic, and remote boreal forests; industrialized and agricultural areas; suburban, urban regions, and heavily polluted megacities; and coastal areas [11–68]. The spatial scale and time-span of NPF event occurrence were also considered in few studies by including multiple locations and combining the analysis with air mass back trajectories [59,64,65,67,69,70]. Hussein et al.
Atmosphere 2020, 11, 79 2 of 20
[64] reported that many NPF events can simultaneously occur over a spatial scale less than 2000 km in Scandinavian conditions and very few can be observed beyond that scale covering the Finnish Lapland and southern Sweden. A similar study also confirmed such large spatial scale (120–850 km) of NPF events occurrence in the Eastern part of North America [69].
Sulfuric acid, which originates from the oxidation of SO2, is known to be the most common precursor in NPF due to its low volatility and especially when stabilized by a mediator base such as NH3 and amines [29,71–74]. These precursor vapors are found to be abundant in the urban atmosphere. In general, NPF events exhibit a ‘banana’ shape attributed to the continuous growth of the nucleation mode particles [75]. Recently, NPF events in some urban locations have been characterized by a decreasing mode diameter in the afternoon [50,51,68].
NPF events are usually characterized by their frequency, intensity (i.e., formation rate), and growth rate of the newly formed particles. These characteristics vary according to the environmental conditions [26,76]. The frequency of NPF events varies seasonally in different places; but in general, they seem to be less frequent in the winter. In some locations, NPF events are most frequent in the spring and autumn seasons, while in other locations they are most frequent during summer [26]. Nieminen et al. [76] reported that the highest NPF frequency of up to 75% was observed in Beijing and Botsalano, which are urban and rural locations, respectively. This comparison shows the complexity of atmospheric mechanisms in different environments.
The literature is rich with numerous studies focusing on NPF events and their characteristics in many places around the globe. However, few studies have been conducted around the Mediterranean Sea [35,43–50,77,78] and even fewer are related to environments in the Middle East [51,52]. Therefore, in this study, we are aiming at characterizing NPF events in the urban background of Amman based on one year (1 August 2016–31 July 2017) intensive measurement campaign of fine particle number size distribution. The characterization included classification of NPF events, frequency of occurrence, formation rate, growth rate, condensation sink, and condensable vapor source rate during the observed NPF events. We also co-analyzed the origin of air masses arriving at the measurement site. This investigation was a continuation of our extensive analysis of the measured particle number size distributions in Amman (Jordan) where we previously investigated the spatiotemporal variation of the fine and coarse aerosols [79–87]. According to our knowledge, this study included the longest dataset of measured particle number size distributions at an urban background site in the Middle East and North Africa region (MENA).
2. Materials and Methods
2.1. Aerosol Measurements and Experimental Setup
The long-term aerosol measurement (particle number size distribution) was performed during 1 August 2016–31 July 2017 at the Aerosol Laboratory, which was located on the third floor of the Department of Physics, the University of Jordan. The University of Jordan campus area can be described as an urban background site in the northern part of Amman, Jordan (Figure S1). The detailed measurement was previously described in detailed by Hussein et al. [79]; here we give a brief description.
The particle number size distribution was measured with a scanning mobility particle sizer (NanoScan SMPS 3910, TSI, MN, USA) and an optical particle sizer (OPS 3330, TSI, MN, USA). The SMPS had an electric mobility particle diameter range 10–420 nm (13 channels) scanned with 60 s (45 s upscan and 15 s downscan). The SMPS inlet flow rate was 0.75 lpm (±20%) whereas the sample flow rate was 0.25 lpm (±10%). The OPS had an optical particle diameter range 0.3–10 µm (13 channels, TSI default particle size bins). The dead-time correction was applied in the OPS operation. The OPS sampling time-resolution was 5 min with a flow rate ≈1 lpm.
The sampling inlet consisted of short Tygon tubes (4 mm inner diameter) connected to a diffusion drier (TSI model 3062-NC), which was used to dry conditions of aerosol sampling. The main inlet (≈1 m long and 8 mm inner diameter) was led through the wall to sample the outdoor air aerosols. The aerosol transport efficiency through the aerosol inlet was estimated experimentally and
Atmosphere 2020, 11, 79 3 of 20
the aerosol data was corrected accordingly. The aerosol transport efficiency through the aerosol inlet assembly was determined experimentally: ambient aerosol sampling alternatively with and without sampling inlet (Figure S2). The penetration efficiency was ≈47% for 10 nm, ≈93% for 0.3 µm, and ≈40% for 10 µm particles. Accordingly, the particle number size distributions were corrected for losses in the tubing and the diffusion drier.
2.2. Characterization of New Particle Formation
2.2.1. Classification Scheme
The classification of new particle formation (NPF) events was based on the scheme described by Hussein et al. [40] that was originally developed for urban areas and applied for Helsinki, Finland. An NPF event is identified if a distinctly new mode of aerosol particles is observed in the nucleation mode size range (diameter < 25 nm) for, at least, several hours and it must show a growth pattern. An additional criterion is the possibility to quantify basic characteristics such as the particle growth rate (GR) and formation rate (J10). Therefore, the evolving nucleation mode should be clearly distinguishable for a sufficient time period to ensure that we have enough data points for the quantitative analysis. For comparison and control purposes when studying reasons leading to NPF events, time periods without NPF events were also of great interest. We classified days as “non-events” whenever a growing mode was not observed. However, many days did not fulfill the criteria for either an event or a non-event; instead “undefined” was introduced.
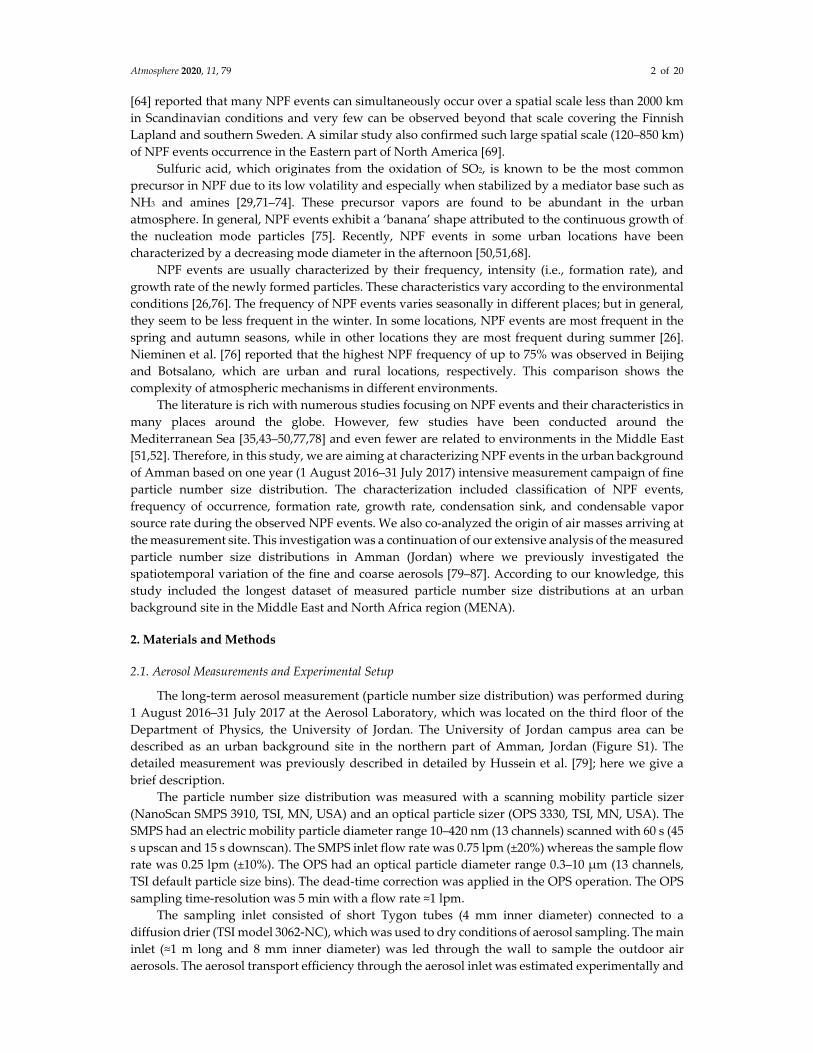
We classified the particle number size distributions visually on daily basis. In order to make the classification more accurate, we also visualized the geometric mean diameters of the lognormal modes that were used to fit the individual particle number size distributions. Figure 1 shows two examples of clear NPF events that were observed on 2 and 26 September 2016.
Figure 1. Examples of new particle formation (NPF) events: (a) Type I with continuous growth (b) Type II with growth and shrinkage. The events are illustrated by plotting the particle number size distribution spectrum (a,b) and number concentrations of three particle size fractions (c,d). The circles on the particle number size distribution spectrum indicate the geometric mean diameter of the modes and the size of the circle is proportional to the mode number concentration.

Atmosphere 2020, 11, 79 4 of 20
Prior to the classification, days with missing data (and also inaccurate measurement) for a time period longer than 3 h during a day were removed from the data pool as we cannot make sure that no particle formation is occurring during that period. However, if a day showed a clear NPF event, it was classified as such despite the existence of gaps in the data.
It should be noticed here that our manual/visual classification scheme can be limited due to user influence and limitations in the aerosol observation at our site. A manual/visual scheme may not obey numerically defined or reproducible criteria. However, the time period of the aerosol database included in this study was not long enough to warrant developing a numerical classification scheme. Although, numerical classification schemes can be more relevant and accurate when comparison with our observations is needed [88].
2.2.2. Estimation of the Growth Rate and Formation Rate
There are several methods to estimate the aerosol particle growth and formation rates [21,55,89–92], here we follow the approach by Hussein et al. [40] because it is straightforward, and it copes well with fluctuating data.
The growth rate (GR) can be estimated by fitting the temporal variation of the geometric mean diameter of the newly formed particles (i.e., nucleation mode) to a first-order polynomial. If it seemed that the determination of the nucleation mode (here 10 nm < Dp < 25 nm) growth rate was highly unreliable, the day was disregarded from further analysis. It should be noted that in the urban atmosphere, a significant number of nucleation mode particles also exist outside the active NPF hours. These particles can have a varying, although assumedly minor, effect on the estimated growth rates and most likely a slightly increasing effect on the estimated formation rates. It is important to keep the presence of these effects in mind although they cannot be reliably quantified from the measurements.
The formation rate (J10) was defined as the flux of particles past a certain diameter (Dp) due to growth from small particles. According to Kulmala et al. [26], J10 can be estimated as follows 𝐽 = 𝑁 + 𝐹 + 𝐹 , (1)
where Nnuc is the nucleation mode (here, diameter in the range 10–25 nm) particle number concentration, FCoag is the loss rate of the nucleation mode particles due to coagulation, and Fgrowth is the flux of particles out from the nucleation mode particle size range due to growth. In this study we calculated the formation rate of 10 nm particles using the diameter range 10–25 nm. The presented formation rates are mean/median formation rates over time periods where the NPF was observed to take place.
The nucleation mode particle number concentration (Nnuc) is obtained by directly integrating the measured number concentrations of aerosol particles according to 𝑁 = 𝑛 𝐷 𝑑𝐷 , (2)
where Dp,min is the smallest particle diameter in the measured particle number distribution nN(Dp). The second term (FCoag) in Equation (1) was calculated according as 𝐹 = 𝐶𝑜𝑎𝑔𝑆 𝑁 , (3)
where CoagSnuc is the coagulation sink of the measured particle number size distribution. Here we considered the reference diameter for the coagulation sink to be the geometric mean diameter of the nucleation mode, i.e., 𝐶𝑜𝑎𝑔𝑆 𝐷 | , = 𝐾 𝐷 ,𝐷 𝑛 𝐷 𝑑𝐷 , (4)
where K(Dp’,Dp) is the coagulation coefficient of particles with diameters Dp and Dp’ according to Fuchs [93] and nN(Dp) is the measured particle number distribution [dN/d(Dp)].
The third term (Fgrowth) in Equation (1) represents the growth rate out of the nucleation mode according to

Atmosphere 2020, 11, 79 5 of 20
𝐹 = ∆ , (5)
where GR is the growth rate of the nucleation mode particles, Nnuc is again the nucleation mode particle number concentration, and ΔDp is the particle diameter range of the nucleation mode.
2.2.3. Condensable Vapor
The change rate of the condensable vapors in the atmosphere can be expressed mathematically according to = 𝑄 − 𝐶𝑆 × 𝐶, (6)
where C [molecules/cm3] is the condensable vapor concentration in the atmosphere, Q (molecules/cm3 s) is the condensable vapor source rate, and CS [s−1] is the condensation sink. At a steady-state condition Equation (6) yields 𝑄 = 𝐶𝑆 × 𝐶. (7)
Here, the concentration of the condensable vapors can be obtained from the growth rate of aerosol particles [91]. In practice, the growth rate depends on the amounts of condensable vapors in the atmosphere. Assuming the physical properties of the condensable vapors are similar to those of sulphuric acid and their pressure is higher than the saturation vapor pressure at the particle surface [91], the vapor concentrations (cm−3) can be related to the growth rate (nm/h) according to 𝐶 = . × . (8)
The condensation sink (CS) in Equation (7) is estimated from the measured particle number size distribution 𝐶𝑆 = 2𝜋 ∑ 𝛽 𝐷 𝐷 𝑁 𝐷 , (9)
where β is the transitional correction factor, Dp is the particle diameter, and N is their number concentration.
2.2.4. Multi-Lognormal Fitting of the Particle Number Size Distribution
The multi-lognormal distribution function, which is the sum of several lognormal modes, has been considered as the most suitable mathematical function to parameterize the particle number size distribution [94]. Each lognormal mode is defined by a geometric mean diameter (Dpg), a geometric standard deviation (σg), and a number concentration (N) as follows
𝑛 ← = ∑ √ , 𝑒 ,, , (10)
where the left-hand-side represents the measured particle number size distribution and the right–hand-side is the multi-lognormal distribution function [95]. Note that here the particle number size distribution, defined by Equation (10), is related to the particle number distribution (nN(Dp)), which was introduced in Equations (4), (5) and (9), according to 𝑛 𝐷 ← = → 𝑛 𝐷 . (11)
In this study, we used our automatic fitting algorithm (DO-FIT, [96]) to find the suitable number of modes needed to best-fit the measured particle number size distribution.

Atmosphere 2020, 11, 79 6 of 20
2.3. Supporting Data
2.3.1. Weather Conditions
The weather conditions were measured on site with a weather station (WH-1080, Clas Ohlson: Art.no. 36-3242). The weather data included (time resolution 5-min average) ambient temperature (−40–65 °C, resolution 0.1 °C), absolute pressure (918.7–1079.9 hPa, resolution 0.3 hPa), relative humidity (10%–99%, resolution 1%), wind speed (1–160 km/h) and direction (16 equal divisions), and precipitation (0–9999 mm, resolution 0.3 mm below 1000 mm and 1 mm over 1000 mm).
During the measurement period (based on the daily averages; Figure S3), the temperature varied between 1 and 32 °C with an overall average 18 ± 8 °C and the absolute pressure varied between 893 and 910 hPa with an overall average 900 ± 4 hPa. The overall average value of the relative humidity was 53% ± 21% whereas that of the wind speed was 5 ± 3 km/h (maximum value was about 14 km/h). The accumulated rain amount during measurement period was about 550 mm.
2.3.2. Back Trajectories
Air mass back trajectories were calculated by using HYSPLIT model [97–99] to follow the origin and path of air masses that arrived at the measurement site. Four-day back trajectories were calculated for each hour at arrival heights 100, 500, and 1500 m.
3. Results and Discussion
3.1. An Overview of the Mean Concentrations
Particle size characterization was recently investigated and presented in our previous study by Hussein et al. [79]. Here, we only recall the overall mean concentrations (Figure S4). The submicron particle number concentration (PNSub) had a seasonal variation: monthly means 3.3 × 10⁴–3.7 × 104 cm−3 during winter (December–February) and 1.2 × 10⁴–1.6 × 104 cm−3 during summer and early spring (June–September). According to the daily mean PNSub, the highest concentration was about 6.5 × 104 cm−3 and the lowest was about as low as 7.7 × 103 cm−3.
The PNSub also exhibited a diurnal pattern and weekly cycle with higher concentrations during workdays (Sunday–Thursday) than weekends (Friday and Saturday) (Figure 2a). These temporal variation characteristics resemble the influence of anthropogenic sources (mainly traffic) and were affected by local meteorological conditions (temperature, wind speed, and relative humidity). Based on the particle number concentrations, most of the submicron particles (about 93%) were within the ultrafine particle (UFP) diameter range (Dp < 0.1 µm).
The first particle channel (diameter 10–15 nm) in the SMPS can be used to investigate the NPF-related concentrations (here denoted as PNNPF). Although this size range seems to be affected by other sources such as traffic emissions [100]; (see Figure 1 right panel at around 6 LT). The average diurnal pattern of PNNPF was characterized by high concentrations (0.7 × 10³–1.1 × 103 cm−3) during the daytime and a sharp peak slightly before noon, which was attributed to actual NPF events (Figure 2b). The lowest concentration of this particle size fraction was ≈320 cm−3 and it was observed between midnight and morning; specifically between 03:00 and 04:00. The most interesting feature of the PNNPF diurnal pattern is the sharp peak, which was observed on ≈34% of the measurement days. This peak value of the PNNPF concentration was in the range 1.5 × 10³–1.8 × 103 cm−3 on workdays and ≈1.1 × 103 cm−3 on weekend days and it spanned from around 09:00 to 13:00. As such, the occurrence of NPF events clearly influenced the dynamic behavior of urban aerosol particles in the urban atmosphere in Amman as follows: (1) changing the daily pattern of the UFP number concentrations and (2) changing the modal structure of urban aerosol particles.

Atmosphere 2020, 11, 79 7 of 20
Figure 2. Overall diurnal pattern and weekly cycle of the (a) total submicron particle number concentration (PNSub) and (b) number concentration in the first channel (diameter 10–15 nm); the vertical dashed lines are aligned at noon time.
Figure 1 illustrates two different types of NPF events, in terms of growth patterns, observed in the urban atmosphere in Amman, Jordan:
[Type I] a well-distinguished mode with continuously increasing mode geometric mean diameter (GMD) until it disappeared; there were 55 events
[Type II] a well-distinguished mode with its GMD initially increased and then decreased at a later time before it disappeared; there were 55 events
In both types, the starting time of the NPF event was, in general, around 10:00 when the nucleation mode particle concentration suddenly increased. In addition, the newly formed particles grew to the Aitken mode size range (0.025–0.1 µm). During Type I NPF events, the newly formed particles often continued their growth slowly through the Aitken mode size range while they rarely reached the accumulation mode size range (0.1–1 mm). During Type II NPF events, the newly formed particle mode grew reaching a maximum diameter close to the lower end of the Aitken mode size range, after which the mode diameter started decreasing, again reaching the nucleation mode size range (below 25 nm). Note that, the growth rate (GR) during the early stage of Type I NPF events was faster than that in Type II NPF events. Type I NPF events are widely observed in many other environments including urban regions [26]. In the literature, type II NPF events are less frequently [50,51,68,78,101]. The observed NPF in this study had an average time-span of less than 9 h. Some indirect results indicated that variations in the formation and growth rates of nucleated particles during their atmospheric transport could be a driving force of shrinkage for particles of very small sizes and on specific occasions.
In the urban atmosphere of Budapest, Salma et al. [68] reported Type II events and called them “arch-shaped” NPF events characterized by a growth phase followed by a shrinkage phase. These events were observed in 4.5% of the observed NPF events. According to their observations, the shrinkage phase took about 1.5 h with a mean shrinkage rate of −3.8 ± 1.0 nm/h. They linked this shrinkage phenomena to changes in local atmospheric conditions: (1) global radiation, (2) the gas-phase H2SO4 concentration through its proxy, and (3) in few cases atmospheric mixing. At subtropical conditions in Taiwan, the particle shrinkage rates ranged from −5.1 to −7.6 nm/h [101].
As suggested by many other studies, the observation of NPF events during the daytime indicates that solar radiation and air mixing are probably important factors [102]. Besides solar radiation, it

Atmosphere 2020, 11, 79 8 of 20
was also noticed that NPF events were associated with above-average ozone concentrations but were independent of PM2.5 [60]. It was also reported that NPF occurred at lower condensation sink, lower RH, higher solar radiation, and higher temperature [59].
In Amman, the main source of air pollution is traffic emissions in addition to local-scale residential heating in the winter. The traffic fleet is composed of a mixture of personal cars (operating on gasoline engine) and heavy duty and low duty transport (minibus and pickups, which are mainly equipped with diesel engines). The gasoline used in Jordan is unleaded fuel 90 and 95 octane whereas the diesel is not a high grade and it has high content of sulfur [103]. Therefore, it is expected that traffic emissions in Amman includes high contents of SO2, which is believed to be one of the main precursors (i.e., H2SO4) that have major role in NPF events in the urban atmosphere [26,29,41,58,66,71,101,104–106].
3.2. Frequency of New Particle Formation (NPF) Events
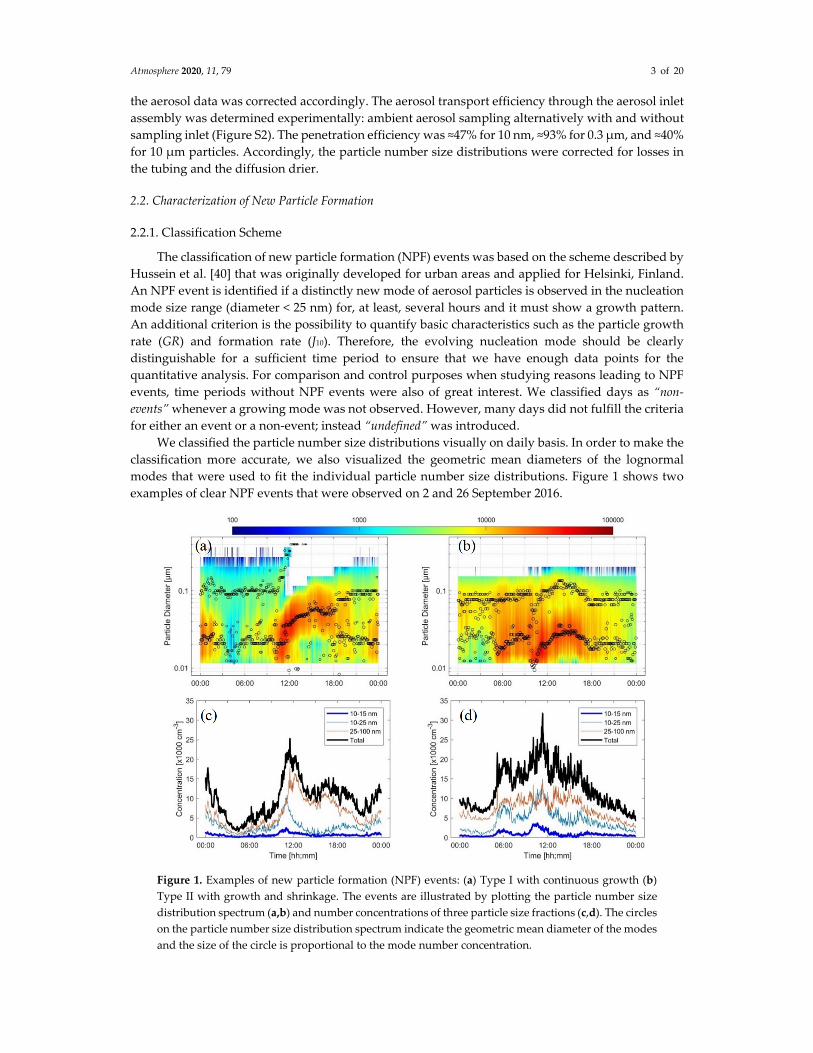
Throughout the measurement period (365 days) we had 326 days of good quality data. We identified 110 days with NPF events (Figure 3 and Table 1), yielding an NPF frequency of about 34%. Most of the NPF events were observed during May (19 events) and June (17 events). Only two NPF events were observed in November, which also had 11 days of missing/bad data. Consequently, we expect that NPF events in the urban atmosphere in the Eastern Mediterranean have a seasonal cycle with high probability during the summer.
Table 1. New particle formation events, non-event, undetermined, and bad/missing data.
Year Month Event
Und. Non-Event Bad/Missing Type I Type II Total
2017
January 5 0 5 8 17 1 February 2 3 5 5 15 3
March 7 4 11 6 14 0 April 9 1 10 9 6 5 May 8 11 19 8 4 0 June 6 11 17 8 5 0 July 3 8 11 15 3 2
2016
August 2 8 10 12 5 4 September 4 6 10 9 9 2
October 4 0 4 5 15 7 November 2 0 2 3 14 11 December 3 3 6 3 18 4
Recently, Nieminen et al. [76] presented a systematic review about NPF events in different environments including polar, high altitude, remote, rural, and urban regions. According to this review, the NPF events seasonal occurrence was 31%, 27%, 20%, and 8% during March–May (spring), June–August (summer), September–November (autumn), and December–February (winter); respectively. The occurrence frequency was higher in the urban and rural environments than polar, high altitude, and remote environments.
This NPF frequency in Amman has a rather similar seasonal variation as that observed in urban atmosphere in central European urban environments (such as Budapest and Vienna) [60,67], but it is different than what was reported in some other urban environments; for example, in Helsinki the NPF events were observed with higher probability in spring and autumn than in summer [40]. On the eastern part of Crete island (Finokalia station, April 2008–April 2009), the NPF events were more frequent during the winter than summer [77]. With a long-term (2008–2018) observation on the same site, the seasonal variation of NPF event occurrence had higher frequency during the spring and autumn than during the summer and winter [46].

Atmosphere 2020, 11, 79 9 of 20
(a)
(b)
Figure 3. Occurrence of new particle formation events, non-event, undefined, and bad/missing data (i.e., no-data): (a) frequency and (b) monthly percentage.
In a more comprehensive investigation for NPF events in the urban atmosphere of Budapest [66], the monthly mean frequency showed temporal variation that was prominently variable from year to year. In general, the NPF event frequency had an absolute/local minimum in January (5.6%) and August (21%) and an absolute/local maximum in April (40%) and September (31%). The NPF pattern was found to depend on multivariate relationships and complex interplay among influencing factors that included air temperature (January is the coldest month, while August is the warmest month) and enhanced emissions of biogenic VOCs in springtime (March–April) and early autumn (September).
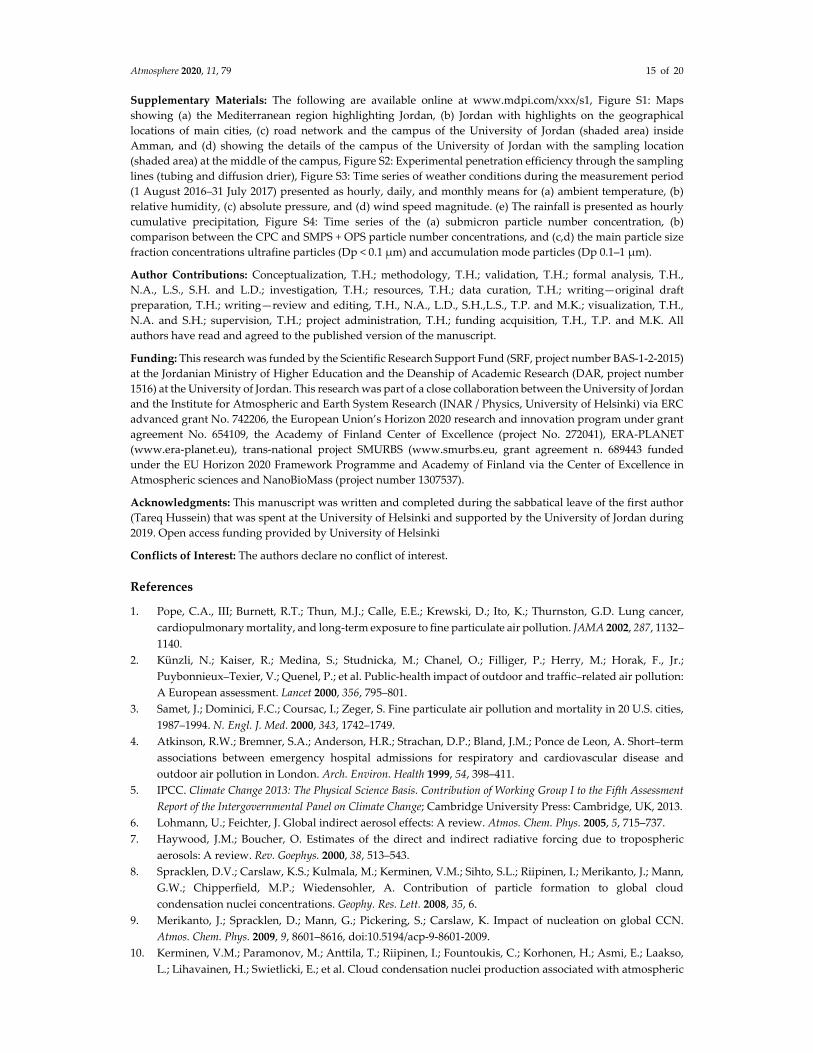
We also investigated the occurrence of NPF events during long-range transport (LRT) episodes. Our investigations revealed that the occurrence of NPF events in Amman was not affected by the occurrence of Sand and Dust Storm (SDS) episodes. Based on the back-trajectory analysis with the HYSPLIT model (4-day hourly back trajectories with arrival height of 100 m), the back trajectories air masses crossing map (Figure 4a) showed that during NPF events we observed air masses from North Africa (i.e., Saharan SDS), North Saudi Arabia, and the Middle East (i.e., Levant SDS). During the NPF events, the predominant air masses were tracked back along the Eastern Mediterranean region: (1) started from the Bosporus (Strait of Istanbul), which connects the Black Sea with Sea of Marmara, and the Aegean Sea, (2) crossing over the Eastern Mediterranean Sea between Crete and Cyprus before reaching Amman. Consequently, such air masses are considered marine (only a small fraction was continental before arrival) where extensive ship lines operated in the Eastern part of the Mediterranean Sea. It is worth comparing the back trajectories crossings during days when NPF events were not observed (i.e., Non-Event days). During Non-Event days (Figure 4b), the air mass source regions were more spread out than those during NPF event days, and the predominant path originating from the Bosporus was less probable. In addition, during Non-Event days, the air masses had a higher probability to originate from the continental areas in the Middle East as well as along the Red Sea.
07
142128
Jan Feb Mar Apr May Jun Jul Aug Sep Oct Nov Dec
# Da
ys
0102030405060708090
100
Jan Feb Mar Apr May Jun Jul Aug Sep Oct Nov Dec
Perc
ent
Event Undefined No-Event No-Data

Atmosphere 2020, 11, 79 10 of 20
(a)
(b)
Figure 4. Back trajectories (96 h backward) crossing map during (a) new particle formation (NPF) events and (b) no-events days. The back trajectories were calculated for each hour at arrival height 100 m in Amman (measurement location). The color contour represents the back trajectories crossing frequency in each grid cell (resolution 0.5°).
3.3. Characterization of the NPF Events
The characteristic Formation rate J10, growth rate GR, condensation sink CS, and condensable vapor source rate Q during the observed NPF events are listed in Table 2. The overall mean J10 was 1.9 ± 1.1 cm−3 s−1 with a monthly mean variation in the range 1.6–2.7 cm−3 s−1. The overall mean GR was 6.8 ± 3.1 nm/h with a monthly mean variation in the range 4.1–8.8 nm/h. The J10 did not have a clear seasonal pattern but the GR had a clear seasonal pattern with maximum around August and minimum during the winter (Figure 5).

Atmosphere 2020, 11, 79 11 of 20
Table 2. Formation rate (J10 [particles/cm3 s]), growth rate (GR (nm/h)), condensation sink (CS (×10−3 s−1)), and condensable vapor source rate (Q (×105 molecules/cm3 s)).
Year Month J10 GR CS Q
Mean Stdev Mean Stdev Mean Stdev Mean Stdev
2017
January 2.7 1.3 5.6 1.5 13.3 5.0 4.6 1.1 February 1.6 0.7 4.1 1.4 11.8 4.6 3.4 1.6
March 1.9 0.9 5.5 1.4 10.8 3.3 3.3 0.8 April 1.8 0.9 6.1 3.9 8.3 2.1 4.2 3.1 May 2.1 1.2 7.0 3.7 6.9 1.4 3.7 2.1 June 1.8 1.2 6.8 2.4 6.4 1.1 3.6 1.6 July 2.4 1.2 8.1 2.7 7.5 1.2 5.0 1.6
2016
August 1.6 0.5 8.8 3.1 9.0 1.6 6.9 2.1 September 1.9 1.5 8.5 3.9 8.7 0.7 6.4 3.0
October 1.8 0.4 7.1 2.7 10.3 1.8 4.6 1.4 November 1.6 0.5 4.9 1.4 14.8 3.2 3.1 0.7 December 1.6 0.4 4.3 1.2 13.9 5.2 2.6 1.0
(a)
(b)
Figure 5. Yearly pattern of the (a) observed formation rate (J10) and (b) modal growth rate during NPF events. The bars represent the standard deviation and the number above represents the number of observations during that month.
The overall mean Q was 4.1 ± 2.2 × 10⁵ molecules/cm3s and had a monthly mean in the range 2.6–6.9 × 10⁵ molecules/cm3s with a clear seasonal pattern (maximum around August and rather constant value in the range 2.6–4.5 × 10⁵ molecules/cm3s (Figure 6), similar to values reported in literature [107]. As for CS, the overall mean was 8.9 ± 3.3 × 10⁻³ s−1 (characteristic vapor lifetime of about 3.27 min). The monthly mean value of the CS was in the range 6.4–14.8 × 10⁻³ s−1 and it had a clear seasonal pattern with a minimum around June and a maximum in winter (Figure 6). The somewhat opposite seasonal patterns in Q and CS suggest that the high growth rates during summer are a result of both

Atmosphere 2020, 11, 79 12 of 20
higher vapor emissions and lower condensation sink. The lower condensation sink might be related to a higher boundary layer during summer, while the cause of the emission maximum is more speculative. Some possible explanations would be emissions from vegetation or residential air conditioning during the warmest months.
According to the systematic review by Nieminen et al. [76], the formation rate and growth rate in rural and urban environments were higher than in polar, high altitude, and remote environments. The median (and range) formation rate (cm−3 s−1) among all sites (in total 36) was 0.61 (0.04–8.4), 0.46 (0.008–6.6), 0.42 (0.002–5.9), and 0.46 (0.02–5.9) during March–May (spring), June–August (summer), September–November (autumn), and December–February (winter), respectively. The growth rate [nm/h] was in the range 0.8–9.2, 1.1–7.3, 0.5–10.9, and 0.8–10.7 during March–May (spring), June–August (summer), September–November (autumn), and December–February (winter), respectively.
As we pointed out in the introduction, there have been few studies about NPF events around the Mediterranean Sea [35,43–50,77,78]. On the north-eastern part of Crete island (Finokalia station, costal, April 2008–April 2009), the mean GR was 5.2 ± 3.4 nm/h [77]. Based on their long-term observation (2008–2018) on the same site, the mean J9 was 0.9 cm−3 s−1 and the GR was about 5 nm/h [46]. On the north-western part of Crete (June 2009–June 2010) at the Akrotiri station (costal/rural/suburban), mean GR was 6 nm/h and the formation rate was 13 cm−3 s−1 [49]. The relationships between GR, J10, and Q are presented in Figure 7.
Figure 6. Yearly pattern of (a) the condensation sink (CS) and (b) the condensable vapor source rate (Q) during NPF events. The error bars represent the standard deviation.

Atmosphere 2020, 11, 79 13 of 20
(a)
(b)
Figure 7. Correlation plots (a) condensable vapor source rate (Q) (daily means) versus modal growth rate (GR) during NPF events and (b) formation rate (J10) (daily means) versus growth rate (GR) during NPF events.
On Cyprus Island, which is the closest location to our location and shares similar air mass back trajectories [45,48], the NPF events were characterized during March 2015. During this period, the GR was found to be 2.8–5 nm/h and the J3 was 5–11.4 cm−3 s−1 [45]. In Helsinki we previously reported J10 as 0.9 cm−3 s−1 and GR as 3.8 nm/h [40]. In the urban atmosphere of Budapest [66], the monthly distributions for J6 (range 3–7 cm−3 s−1), GR10 (range 6–9 nm/h), H2SO4 proxy, and SO2 did not follow the monthly pattern of the event occurrence frequency. Instead, the J6, GR10, and H2SO4 proxy exhibited larger values during the summer months, and the temporal changes over the other months were smooth and did not show distinctive features. The growth curves of nucleated particles were usually superimposed on the characteristic diurnal pattern of road traffic direct emissions. In their one year (2009) investigation in the urban atmosphere of Budapest [41], the GR6 was 2.0–13.3 nm/h (mean 7.7 ± 2.4 nm/h). It was also suggested that the GR6 was higher in summer than in winter. In the same study, J6 was 1.65–12.5 cm−3 s−1 (mean 4.2 ± 2.5 cm−3 s−1). These reported observations in Budapest showed that the occurrence of NPF events and their seasonal characteristics vary from year to year; indicating that continuous and long-term measurements are recommended in order to have a better insight about NPF events. That was also revealed in their NPF events characteristics comparison between urban and rural sites [67], where they showed that the urban NPF events require higher formation rates and growth rates to be realized, by mean factors of 2 and 1.6, respectively, than the regional NPF events. For example, at the rural site K-Puszta, J6 was 1.9 ± 1.5 cm−3 s−1 and GR6 was 4.8 ± 2.3 nm/h as reported in year 2009 (versus urban J6 = 4.2 ± 2.5 cm−3 s−1 and GR6 = 7.7 ± 2.4 nm/h) and J6 = 1.8 ± 1.4 cm−3 s−1 and GR6 = 4.2 ± 2.1 nm/h in 2013 (versus near-city background J6 = 2.1 ± 1.5 cm−3 s−1 and GR6 = 5.1 ± 1.5 nm/h).
The formation and growth rates were also reported in Chinese urban environments [61,62]. Nearby an urban site on Lanzhou mountains (June–July 2006) [63], the GR was 1.96–16.97 nm/h (mean

Atmosphere 2020, 11, 79 14 of 20
4.4 nm/h) and J10 was 1.8–7.1 cm−3 s−1 (mean 4.3 cm−3 s−1). In Nanjing (June–July 2006) [62], GR was 7.6 nm/h and J10 was 3.7 cm−3 s−1 (mean 4.3 cm−3 s−1). In Qingdao (April-May 2010) [61], J5 was 2.4–56.9 cm−3s−1 (mean 13.3 cm−3 s−1) and GR was in the range 2–11.8 nm/h. These values in Qingdao were compared to those reported in Toronto (May 2009) [61], where J5 was 1.3–15.4 cm−3 s−1 (mean 7.1 cm−3 s−1) and GR was in the range 1.1–8.3 nm/h.
In Singapore [58], the newly formed particles in the urban background did not show signs of growth during July–August 2008 and January–February 2009; J5 = 18.8 ± 14 cm−3 s−1 (range 5.8–43.5 cm−3 s−1). In two urban environments (Pune and Kanpur) in India [59], J5 was 7.2 ± 3.3 cm−3 s−1 (range 3.5–13.9 cm−3 s−1) and GR was 6.5 ± 1.2 nm/h (range 3.4–7.6 nm/h) in Pune during April–May 2013 and J5 was 1.5 ± 1.0 cm−3 s−1 (range 0.4–3.2 cm−3 s−1) and GR was 8.7 ± 3.2 nm/h (range 5.2–13.3 nm/h) in Kanpur during April–May 2012.
4. Conclusions
While the literature is rich with numerous studies focusing on new particle formation (NPF) events and their characteristics in many places around the globe, few studies were conducted around the Mediterranean Sea and even fewer were related to environments in the Middle East. In this study, we characterized NPF events in the urban background of Amman based on the one year (1 August 2016–31 July 2017) intensive measurement campaign of fine particle number size distribution. The characterization included classification of NPF events, frequency of occurrence, formation rate (J10), and growth rate (GR). According to our knowledge, this study included the longest dataset of measured particle number size distributions at an urban background site in the Middle East.
The submicron particle number concentration (PNSub) had a seasonal variation: monthly means 3.3 × 10⁴–3.7 × 104 cm−3 during December–February and 1.2 × 10⁴–1.6 × 104 cm−3 during June–September. The PNSub also exhibited a diurnal pattern and weekly cycle with higher concentrations during workdays (Sunday–Thursday) than weekends (Friday and Saturday), which resembled the influence of anthropogenic sources (mainly traffic). Most of the submicron particles (about 93%) were within the ultrafine particle (UFP) diameter range (Dp < 0.1 µm).
The particle number concentrations with the diameter range 10–15 nm (PNNPF) was used to investigate the NPF formation. The average diurnal pattern of PNNPF was characterized by high concentrations (0.7 × 10³–1.1 × 103 cm−3) during the daytime and a sharp peak slightly before noon, which was attributed to actual NPF events. This sharp peak in PNNPF was observed on ≈34% of the measurement days. This peak value of the PNNPF concentration was in the range 1.5 × 10³–1.8 × 103 cm−3 on workdays and ≈1.1 × 103 cm−3 on weekend days and it spanned from around 09:00 to 13:00.
We identified two types of NPF events based on the growth patterns. Type I with a well-distinguished mode continuously growing until it disappeared (in total 55 events). Type II with newly formed particle mode initially grew and then shrank at a later time before it disappeared (in total 55 events). While Type I has been reported in almost all environments worldwide, Type II was observed on few locations. The NPF events were observed with higher frequency during the summer than during the winter and they were accompanied with air mass back trajectories crossing over the Eastern Mediterranean region: started from the Bosporus (Strait of Istanbul) and crossing over the Eastern Mediterranean Sea between Crete and Cyprus before reaching Amman.
According to our analysis, the mean J10 was 1.9 ± 1.1 cm−3 s−1 (monthly mean variation in the range 1.6–2.7 cm−3 s−1) and the mean GR was 6.8 ± 3.1 nm/h (range 4.1–8.8 nm/h). J10 did not have a clear seasonal pattern but the GR had a clear seasonal pattern with the maximum around August and minimum during the winter. The mean Q was 4.1 ± 2.2 ×10⁵ molecules/cm3 s (range 2.6–6.9 × 10⁵ molecules/cm3s) with a clear seasonal pattern (maximum around August). The mean CS was 8.9 ± 3.3 × 10⁻³ s−1 (range 6.4–14.8 × 10⁻³ s−1) with a clear seasonal pattern (minimum around June and maximum in winter).
Atmosphere 2020, 11, 79 15 of 20
Supplementary Materials: The following are available online at www.mdpi.com/xxx/s1, Figure S1: Maps showing (a) the Mediterranean region highlighting Jordan, (b) Jordan with highlights on the geographical locations of main cities, (c) road network and the campus of the University of Jordan (shaded area) inside Amman, and (d) showing the details of the campus of the University of Jordan with the sampling location (shaded area) at the middle of the campus, Figure S2: Experimental penetration efficiency through the sampling lines (tubing and diffusion drier), Figure S3: Time series of weather conditions during the measurement period (1 August 2016–31 July 2017) presented as hourly, daily, and monthly means for (a) ambient temperature, (b) relative humidity, (c) absolute pressure, and (d) wind speed magnitude. (e) The rainfall is presented as hourly cumulative precipitation, Figure S4: Time series of the (a) submicron particle number concentration, (b) comparison between the CPC and SMPS + OPS particle number concentrations, and (c,d) the main particle size fraction concentrations ultrafine particles (Dp < 0.1 µm) and accumulation mode particles (Dp 0.1–1 µm).
Author Contributions: Conceptualization, T.H.; methodology, T.H.; validation, T.H.; formal analysis, T.H., N.A., L.S., S.H. and L.D.; investigation, T.H.; resources, T.H.; data curation, T.H.; writing—original draft preparation, T.H.; writing—review and editing, T.H., N.A., L.D., S.H.,L.S., T.P. and M.K.; visualization, T.H., N.A. and S.H.; supervision, T.H.; project administration, T.H.; funding acquisition, T.H., T.P. and M.K. All authors have read and agreed to the published version of the manuscript.
Funding: This research was funded by the Scientific Research Support Fund (SRF, project number BAS-1-2-2015) at the Jordanian Ministry of Higher Education and the Deanship of Academic Research (DAR, project number 1516) at the University of Jordan. This research was part of a close collaboration between the University of Jordan and the Institute for Atmospheric and Earth System Research (INAR / Physics, University of Helsinki) via ERC advanced grant No. 742206, the European Union’s Horizon 2020 research and innovation program under grant agreement No. 654109, the Academy of Finland Center of Excellence (project No. 272041), ERA-PLANET (www.era-planet.eu), trans-national project SMURBS (www.smurbs.eu, grant agreement n. 689443 funded under the EU Horizon 2020 Framework Programme and Academy of Finland via the Center of Excellence in Atmospheric sciences and NanoBioMass (project number 1307537).
Acknowledgments: This manuscript was written and completed during the sabbatical leave of the first author (Tareq Hussein) that was spent at the University of Helsinki and supported by the University of Jordan during 2019. Open access funding provided by University of Helsinki
Conflicts of Interest: The authors declare no conflict of interest.
References
1. Pope, C.A., III; Burnett, R.T.; Thun, M.J.; Calle, E.E.; Krewski, D.; Ito, K.; Thurnston, G.D. Lung cancer, cardiopulmonary mortality, and long-term exposure to fine particulate air pollution. JAMA 2002, 287, 1132–1140.
2. Künzli, N.; Kaiser, R.; Medina, S.; Studnicka, M.; Chanel, O.; Filliger, P.; Herry, M.; Horak, F., Jr.; Puybonnieux–Texier, V.; Quenel, P.; et al. Public-health impact of outdoor and traffic–related air pollution: A European assessment. Lancet 2000, 356, 795–801.
3. Samet, J.; Dominici, F.C.; Coursac, I.; Zeger, S. Fine particulate air pollution and mortality in 20 U.S. cities, 1987–1994. N. Engl. J. Med. 2000, 343, 1742–1749.
4. Atkinson, R.W.; Bremner, S.A.; Anderson, H.R.; Strachan, D.P.; Bland, J.M.; Ponce de Leon, A. Short–term associations between emergency hospital admissions for respiratory and cardiovascular disease and outdoor air pollution in London. Arch. Environ. Health 1999, 54, 398–411.
5. IPCC. Climate Change 2013: The Physical Science Basis. Contribution of Working Group I to the Fifth Assessment Report of the Intergovernmental Panel on Climate Change; Cambridge University Press: Cambridge, UK, 2013.
6. Lohmann, U.; Feichter, J. Global indirect aerosol effects: A review. Atmos. Chem. Phys. 2005, 5, 715–737. 7. Haywood, J.M.; Boucher, O. Estimates of the direct and indirect radiative forcing due to tropospheric
aerosols: A review. Rev. Goephys. 2000, 38, 513–543. 8. Spracklen, D.V.; Carslaw, K.S.; Kulmala, M.; Kerminen, V.M.; Sihto, S.L.; Riipinen, I.; Merikanto, J.; Mann,
G.W.; Chipperfield, M.P.; Wiedensohler, A. Contribution of particle formation to global cloud condensation nuclei concentrations. Geophy. Res. Lett. 2008, 35, 6.
9. Merikanto, J.; Spracklen, D.; Mann, G.; Pickering, S.; Carslaw, K. Impact of nucleation on global CCN. Atmos. Chem. Phys. 2009, 9, 8601–8616, doi:10.5194/acp-9-8601-2009.
10. Kerminen, V.M.; Paramonov, M.; Anttila, T.; Riipinen, I.; Fountoukis, C.; Korhonen, H.; Asmi, E.; Laakso, L.; Lihavainen, H.; Swietlicki, E.; et al. Cloud condensation nuclei production associated with atmospheric

Atmosphere 2020, 11, 79 16 of 20
nucleation: A synthesis based on existing literature and new results. Atmos. Chem. Phys. 2012, 12, 12037–12059, doi:10.5194/acp-12-12037-2012.
11. Hoffman, D. J. Twenty years of balloon–borne tropospheric aerosol measurements at Laramie, Wyoming. J. Geophys. Res. 1993, 98D, 12753–12766.
12. Perry, K.D.; Hobbs, P.V. Further evidence for particle nucleation in clean air adjacent to marine cumulus clouds. J. Geophys. Res. 1994, 99D, 22803–22818.
13. Hoppel, W.A.; Frick, G.M.; Fitzgerald, J.W.; Larson, R.E. Marine boundary layer measurements of new particle formation and the effects nonprecipitating clouds have on aerosol size distribution. J. Geophys. Res. 1994, 99D, 14443–14459.
14. Clarke, A.D.; Davis, D.; Kapustin, V.N.; Eisele, F.; Chen, G.; Paluch, I.; Lenschow, D.; Bandy, A.R.; Thornton, D.; Moore, K.; et al. Particle nucleation in the tropical boundary layer and its coupling to marine sulfur sources. Science 1998, 282, 89–92.
15. Clarke, A.D.; Kapustin, V.N.; Eisele, F.L.; Weber, R.J.; McMurry, P.H. Particle production near marine clouds: Sulfuric acid and predictions from classical binary nucleation. Geophys. Res. Lett. 1999, 26, 2425–2428.
16. Clarke, A.D.; Eisele, F.; Kapustin, V.N.; Moore, K.; Tanner, D.; Mauldin, L.; Litchy, M.; Lienert, B.; Carroll, M.A.; Albercook, G. Nucleation in the equatorial free troposphere: Favorable environments during PEM-tropics. J. Geophys. Res. 1999, 104D, 5735–5744.
17. Nyeki, S.; Kalberer, M.; Lugauer, M.; Weingartner, E.; Petzold, A.; Schr.oder, F.; Colbeck, I.; Baltensperger, U. Condensation Nuclei (CN) and ultrafine CN in the free troposphere to 12 km: A case study over the Jungfraujoch high–alpine research station. Geophys. Res. Lett. 1999, 14, 2195–2198.
18. Keil, A.; Wendisch, M. Bursts of Aitken mode and ultrafine particles observed at the top of continental boundary layer clouds. J. Aerosol Sci. 2001, 32, 649–660.
19. Weber, R.J.; Moore, K.; Kapustin, V.; Clarke, A.; Mauldin, R.L.; Kosciuch, E.; Cantrell, C.; Eisele, F.; Andersson, B.; Thornhill, L. Nucleation in the equatorial pacific during PEM tropics B: Enhanced boundary layer H2SO4 but no particle production. J. Geophys. Res. 2001, 106D, 32767–32776.
20. Twohy, C.H.; Clement, C.F.; Gandrud, B.W.; Weinheimer, A.J.; Campos, T.L.; Baumgardner, D.; Brune, W.H.; Faloona, I.; Sachse, G.W.; Vay, S.A.; et al. Deep convection as a source of new particles in the midlatitude upper troposphere. J. Geophys. Res. 2002, 107D, doi: 10.1029/2001JD000323.
21. Weber, R.J.; McMurry, P.H.; Eisele, F.L.; Tanner, J. Measurement of expected nucleation precursor species and 3–500-nm diameter particles at Mauna Loa observatory, Hawaii. J. Atmos. Sci. 1995, 52, 2242–2257.
22. Weber, R.J.; Marti, J.J.; McMurry, P.H.; Eisele, F.L.; Tanner, D.J.; Jefferson, A. Measured atmospheric new particle formation rates: Implications for nucleation mechanisms. Chem. Eng. Comm. 1996, 151, 53–64.
23. Weber, R.J.; Marti, J.J.; McMurry, P.H.; Eisele, F.L.; Tanner, D.J.; Jefferson, A. Measurements of new particle formation and ultrafine particle growth rates at a clean continental site. J. Geophys. Res. 1997, 102D, 4375–4385.
24. Venzac, H.; Sellegri, K.; Laj, P. Nucleation events detected at the high altitude site of the Puy de Dôme Research Station, France. Boreal Environ. Res. 2007, 12, 345–360.
25. Mäkelä, J.M.; Aalto, P.; Jokinen, V.; Pohja, T.; Nissinen, A.; Palmroth, S.; Markkanen, T.; Seitsonen, K.; Lihavainen, H.; Kulmala, M. Observations of ultrafine aerosol particle formation and growth in boreal forest. Geophys. Res. Lett. 1997, 24, 1219–1222.
26. Kulmala, M.; Vehkamäki, H.; Petäjä, T.; Dal Maso, M.; Lauri, A.; Kerminen, V.M.; Birmili, W.; McMurry, P.H. Formation and growth rates of ultrafine atmospheric particles: A review of observations. J. Aerosol Sci. 2004, 35, 143–176, doi:10.1016/j.jaerosci.2003.10.003.
27. Kulmala, M.; Riipinen, I.; Sipilä, M.; Manninen, H.E.; Petäjä, T.; Junninen, H.; Dal Maso, M.; Mordas, G.; Mirme, A.; Vana, M.; et al. Toward Direct Measurement of Atmospheric Nucleation. Science 2007, 318, 89–92.
28. Vehkamäki, H.; Dal Maso, M.; Hussein, T.; Flanagan, R.; Hyvärinen, A.; Lauros, J.; Merikanto, J.; Mönkkönen, P.; Pihlatie, M.; Salminen, K.; et al. Atmospheric particle formation events at Värriö measurement station in Finnish Lapland 1998–2002. Atmos. Chem. Phys. 2004, 4, 2015–2023.
29. Sipilä, M.; Berndt, T.; Petäjä, T.; Brus, D.; Vanhanen, J.; Stratmann, F.; Patokoski, J.; Mauldin, R.L.; Hyvärinen, A.P.; Lihavainen, H.; et al. The Role of Sulfuric Acid in Atmospheric Nucleation. Science 2010, 327, 1243–1246, doi:10.1126/science.1180315.

Atmosphere 2020, 11, 79 17 of 20
30. Birmili, W.; Wiedensohler, A. New particle formation in the continental boundary layer: Meteorological and gas phase parameter influence. Geophys. Res. Lett. 2000, 27, 3325–3328.
31. Birmili, W.; Berresheim, H.; Plass-D.ulmer, C.; Elste, T.; Gilge, S.; Wiedensohler, A.; Uhrner, U. The Hohenpeissenberg aerosol formation experiment (HAFEX): A long-term study including size-resolved aerosol, H2SO4, OH, and monoterpenes measurements. Atmos. Chem. Phys. 2003, 3, 361–376.
32. Woo, K.S.; Chen, D.R.; Pui, D.Y.H.; McMurry, P.H. Measurements of Atlanta aerosol size distributions: Observations of ultrafine particle events. Aerosol Sci. Tech. 2001, 34, 75–87.
33. Stanier, C.O.; Khlystov, A.Y.; Pandis, S.N. Investigation of nucleation bursts during the Pittsburgh air quality study. In Abstracts of the Sixth International Aerosol Conference, AGU: Washington, DC, USA, 2002; pp. 1291–1292.
34. Shi, Q. Continuous Measurements of 3 nm to 10 m Aerosol Size Distributions in St. Louis. Master’s Thesis, University of Minnesota, Minneapolis, MN, 2003.
35. Petäjä, T.; Kerminen, V.M.; Dal Maso, M.; Junninen, H.; Koponen, I.K.; Hussein, T.; Aalto, P.P.;Ronopoulos, S.; Robin, D.; Hämeri, K.; et al. Sub-micron atmospheric aerosols in the surroundings of Marseille and Athens: physical characterization and new particle formation. Atmos. Chem. Phys. 2007, 7, 2705–2720.
36. Qian, S.; Sakurai, S.; McMurry, P.H. Characteristics of regional nucleation events in urban East St. Louis. Atmos. Environ. 2007, 41, 4119–4127.
37. Kerminen, V.M.; Chen, X.; Vakkari, V.; Petäjä, T.; Kulmala, M.; Bianchi, F. Atmospheric new particle formation and growth: Review of field observations. Environ. Res. Lett. 2018, 13, 103003, doi:10.1088/1748-9326/aadf3c.
38. Yao, L.; Garmash, O.; Bianchi, F.; Zheng, J.; Yan, C.; Kontkanen, J.; Junninen, H.; Mazon, S.B.; Ehn, M.; Paasonen, P.; et al. Atmospheric new particle formation from sulfuric acid and amines in a Chinese megacity. Science 2018, 361, 278–281, doi:10.1126/science.aao4839.
39. Chu, B.; Kerminen, V.M.; Bianchi, F.; Yan, C.; Petäjä, T.; Kulmala, M. Atmospheric new particle formation in China. Atmos. Chem. Phys. 2019, 19, 115–138, doi:10.5194/acp-19-115-2019.
40. Hussein, T.; Martikainen, J.; Junninen, H.; Sogacheva, L.; Wagner, R.; Dal Maso, M.; Riipinen, I.; Aalto, P.P.; Kulmala, M. Observation of Regional New Particle Formation in the Urban Atmosphere. Tellus B 2008, 60, 509–521.
41. Salma, I.; Borsos, T.; Weidinger, T.; Alato, P.; Hussein, T.; Dal Maso, M.; Kulmala, M. Production, growth and properties of ultrafine atmospheric aerosol particles in an urban environment. Atmos. Chem. Phys. 2011, 11, 1339–1353.
42. O’Dowd, C.D.; McFiggans, G.; Greasey, D.J.; Pirjola, L.; Hoell, C.; Smith, M.H.; Allan, B.J.; Plane, J.M.C.; Heard, D.E.; Lee, J.D.; et al. On the photochemical production of new particles in the coastal boundary layer. Geophys. Res. Lett. 1999, 26, 1707–1710.
43. Kalkavouras, P.; Bossioli, E.; Bezantakos, S.; Bougiatioti, A.; Kalivitis, N.; Stavroulas, I.; Kouvarakis, G.; Protonotariou, A.P.; Dandou, A.; Biskos, G.; et al. New particle formation in the southern Aegean Sea during the Etesians: Importance for CCN production and cloud droplet number. Atmos. Chem. Phys. 2017, 17, 175–192.
44. Berland, K.; Rose, C.; Pey, J.; Culot, A.; Freney, E.; Kalivitis, N.; Kouvarakis, G.; Cerro, J.C.; Mallet, M.; Sartelet, K.; et al. Spatial extent of new particle formation events over the Mediterranean Basin from multiple ground-based and airborne measurements. Atmos. Chem. Phys. 2017, 17, 9567–9583.
45. Debevec, C.; Sauvage, S.; Gros, V.; Sellegri, K.; Sciare, J.; Pikridas, M.; Stavroulas, I.; Leonardis, T.; Gaudion, V.; Depelchin, L.; et al. Driving parameters of biogenic volatile organic compounds and consequences on new particle formation observed at an eastern Mediterranean background site. Atmos. Chem. Phys. 2018, 18, 14297–14325.
46. Kalivitis, N.; Kerminen, V.M.; Kouvarakis, G.; Stavroulas, I.; Tzitzikalaki, E.; Kalkavouras, P.; Daskalakis, N.; Myriokefalitakis, S.; Bougiatioti, A.; Manninen, H.E.; et al. Formation and growth of atmospheric nanoparticles in the Eastern Mediterranean: results from long-term measurements and process simulations. Atmos. Chem. Phys. 2019, 19, 2671–2686.
47. Majdi, M.; Sartelet, K.; Lanzafame, G.M.; Couvidat, F.; Kim, Y.; Chrit, M.; Turquety, S. Precursors and formation of secondary organic aerosols from wildfires in the Euro-Mediterranean region. Atmos. Chem. Phys. 2019, 19, 5543–5569.

Atmosphere 2020, 11, 79 18 of 20
48. Gong, X.; Wex, H.; Müller, T.; Wiedensohler, A.; Höhler, K.; Kandler, K.; Ma, N.; Dietel, B.; Schiebel, T.; Möhler, O.; et al. Characterization of aerosol properties at Cyprus, focusing on cloud condensation nuclei and ice-nucleating particles. Atmos. Chem. Phys. 2019, 19, 10883–10900.
49. Kopanakis, I.; Chatoutsidou, S.E.; Torseth, K.; Glytsos, T.; Lazaridis, M. Particle number size distribution in the eastern Mediterranean: Formation and growth rates of ultrafine airborne atmospheric particles. Atmos. Environ. 2013, 77, 790–802.
50. Alonso-Blanco, E.; Gómez-Moreno, F.J.; Núñez, L.; Pujadas, M.; Cusack, M.; Artíñano, B. Aerosol particle shrinkage event phenomenology in a South European suburban area during 2009–2015. Atmos. Environ. 2017, 160, 154–164, doi:10.1016/j.atmosenv.2017.04.013.
51. Hakala, S.; Alghamdi, M.A.; Paasonen, P.; Vakkari, V.; Khoder, M.; Neitola, K.; Dada, L.; Abdelmaksoud, A.S.; Al-Jeelani, H.; Shabbaj, I.I.; et al. New particle formation, growth and apparent shrinkage at a rural background site in western Saudi Arabia. Atmos. Chem. Phys. 2019, 19, 10537–10555.
52. Lihavainen, H.; Alghamdi, M.A.; Hyvärinen, A.P.; Hussein, T.; Aaltonen, V.; Abdelmaksoud, A.S.; Al-Jeelani, H.; Almazroui, M.; Almehmadi, F.M.; Al Zawad, F.M.; et al. Aerosols Physical properties at Hada Al Sham, Western Saudi Arabia. Atmos. Environ. 2016, 135, 109–117.
53. Han, Y.; Iwamoto, Y.; Nakayama, T.; Kawamura, K.; Hussein, T.; Mochida, M. Observation of new particle formation over a mid-latitude forest facing the North Pacific. Atmos. Environ. 2013, 64, 77–84.
54. Deng, Y.; Kagami, S.; Ogawa, S.; Kawana, K.; Nakayama, T.; Kubodera, R.; Adachi, K.; Hussein, T.; Miyazaki, Y.; Mochida, M. Hygroscopicity of organic aerosols and their contributions to CCN concentrations over a mid-latitude forest in Japan. J. Geophys. Res.: Atmos. 2018, 123, 9703–9723.
55. Siingh, D.; Gautam, A.S.; Buchunde, P.S.; Kamra, A.K. Classification of the new particle formation events observed at a tropical site, Pune, India. Atmos. Environ. 2018, 190, 10–22.
56. Jun, Y.S.; Jeong, C.H.; Sabaliauskas, K.; Leaitch, W.R.; Evans, G.J. A year–long comparison of particle formation events at paired urban and rural locations. Atmos. Poll. Res. 2014, 5, 447–454.
57. Lyu, X.P.; Guo, H.; Cheng, H.R.; Wang, D.W. New particle formation and growth at a suburban site and a background site in Hong Kong. Chemosphere 2018, 193, 664–674.
58. Betha, R.; Spracklen, D.V.; Balasubramanian, R. Observations of new aerosol particle formation in a tropical urban atmosphere. Atmos. Environ. 2013, 71, 340–351.
59. Kanawade, V.P.; Tripathi, S.N.; Siingh, D.; Gautam, A.S.; Srivastava, A.K.; Kamra, A.K.; Soni, V.K.; Sethi, V. Observations of new particle formation at two distinct Indian subcontinental urban locations. Atmos. Environ. 2014, 96, 370–379.
60. Wonaschütz A.; Demattio, A.; Wagner, R.; Burkart, J.; Zíkova, N.; Vodicka, P.; Ludwig, W.; Steiner, G.; Schwarz, J.; Hitzenberger, R. Seasonality of new particle formation in Vienna, Austria—Influence of air mass origin and aerosol chemical composition. Atmos. Environ. 2015, 118, 118–126.
61. Zhu, Y.; Sabaliauskas, K.; Liu, X.; Meng, H.; Gao, H.; Jeong, C.-H.; Evans, G.J.; Yao, X. Comparative analysis of new particle formation events in less and severely polluted urban atmosphere. Atmos. Environ. 2014, 98, 655–664.
62. An, J.; Wang, H.; Shen, L.; Zhu, B.; Zou, J.; Gao, J.; Kang, H. Characteristics of new particle formation events in Nanjing, China: Effect of water-soluble ions. Atmos. Environ. 2015, 108, 32–40.
63. Gao, J.; Chai, F.; Wang, T.; Wang, W. Particle number size distribution and new particle formation (NPF) in Lanzhou, Western China. Particuology 2011, 9, 611–618.
64. Hussein, T.; Junninen, H.; Tunved, P.; Kristensson, A.; Dal Maso, M.; Riipinen, I.; Aalto, P.P.; Hansson, H.-C.; Swietlicki, E.; Kulmala, M. Time-span and spatial-scale of regional new particle formation events over Finland and Southern Finland. Atmos. Chem. Phys. 2009, 9, 4699–4716.
65. Kim, Y.; Yoon, S.-C.; Kim, S.-W.; Kim, K.-Y.; Lim, H.-C.; Ryu, J. Observation of new particle formation and growth events in Asian continental outflow. Atmos. Environ. 2013, 64, 160–168.
66. Salma, I.; Németh, Z. Dynamic and timing properties of new aerosol particle formation and consecutive growth events. Atmos. Chem. Phys. 2019, 19, 5835–5852.
67. Salma, I.; Németh, Z.; Kerminen, V.-M.; Aalto, P.; Nieminen, T.; Weidinger, T.; Molnár, Á.; Imre, K.; Kulmala, M. Regional effect on urban atmospheric nucleation. Atmos. Chem. Phys. 2016, 16, 8715–8728.
68. Salma, I.; Németh, Z.; Weidinger, T.; Kovács, B.; Kristóf, G. Measurement, growth types and shrinkage of newly formed aerosol particles at an urban research platform. Atmos. Chem. Phys. 2016, 16, 7837–7851.
69. Crippa, P.; Pryor, S.C. Spatial and temporal scales of new particle formation events in eastern North America. Atmos. Environ. 2013, 75, 257–264.

Atmosphere 2020, 11, 79 19 of 20
70. Németh, Z.; Rosati, B.; Zíková, N.; Salma, I.; Bozó, L.; de España, C.D.; Schwarz, J.; Ždímal, V.; Wonaschütz, A. Comparison of atmospheric new particle formation events in three Central European cities. Atmos. Environ. 2018, 178, 191–197.
71. Sihto, S.-L.; Kulmala, M.; Kerminen, V.-M.; Maso, M.D.; Petäjä, T.; Riipinen, I.; Korhonen, H.; Arnold, F.; Janson, R.; Boy, M.J.A.C.; et al. Atmospheric sulphuric acid and aerosol formation: implications from atmospheric measurements for nucleation and early growth mechanisms. Atmos. Chem. Phys. 2006, 6, 4079–4091, https://doi.org/10.5194/acp-6-4079-2006.
72. Riccobono, F.; Rondo, L.; Sipila, M.; Barmet, P.; Curtius, J.; Dommen, J.; Ehn, M.; Ehrhart, S.; Kulmala, M.; Kurten, A.; et al. Contribution of sulfuric acid and oxidized organic compounds to particle formation and growth. Atmos. Chem. Phys. 2012, 12, 9427–9439, doi:10.5194/acp-12-9427-2012.
73. Kirkby, J.; Duplissy, J.; Sengupta, K.; Frege, C.; Gordon, H.; Williamson, C.; Heinritzi, M.; Simon, M.; Yan, C.; Almeida, J.; et al. Ion-induced nucleation of pure biogenic particles. Nature 2016, 533, 521–526, doi:10.1038/nature17953.
74. Lehtipalo, K.; Yan, C.; Dada, L.; Bianchi, F.; Xiao, M.; Wagner, R.; Stolzenburg, D.; Ahonen, L.R.; Amorim, A.; Baccarini, A.; et al. Multicomponent new particle formation from sulfuric acid, ammonia, and biogenic vapors. Sci. Adv. 2018, 4, eaau5363, doi:10.1126/sciadv.aau5363.
75. Kulmala, M.; Petaja, T.; Nieminen, T.; Sipila, M.; Manninen, H.E.; Lehtipalo, K.; Dal Maso, M.; Aalto, P.P.; Junninen, H.; Paasonen, P.; et al. Measurement of the nucleation of atmospheric aerosol particles. Nat. Protoc. 2012, 7, 1651–1667, doi:10.1038/nprot.2012.091.
76. Nieminen, T.; Kerminen, V.M.; Petäjä, T.; Aalto, P.P.; Arshinov, M.; Asmi, E.; Baltensperger, U.; Beddows, D.C.S.; Beukes, J.P.; Collins, D.; et al. Global analysis of continental boundary layer new particle formation based on long-term measurements. Atmos. Chem. Phys. 2018, 18, 14737–14756, doi:10.5194/acp-18-14737-2018.
77. Pikridas, M.; Riipinen, I.; Hildebrandt, L.; Kostenidou, E.; Manninen, H.; Mihalopoulos, N.; Kalivitis, N.; Burkhart, J.F.; Stohl, A.; Kulmala, M.; et al. New particle formation at a remote site in the eastern Mediterranean. J. Geophys. Res. Atmos. 2012, 117, D12205, doi:10.1029/2012jd017570.
78. Cusack, M.; Alastuey, A.; Querol, X.S. Case studies of new particle formation and evaporation processes in the western Mediterranean regional background. Atmospheric Enviro. 2013, 81, 651–659.
79. Hussein, T.; Dada, L.; Hakala, S.; Petäjä, T.; Kulmala, M. Urban Aerosols Particle Size Characterization in Eastern Mediterranean Conditions. Atmosphere 2019, 10, 710.
80. Hussein, T.; Saleh, S.S.A.; dos Santos, V.N.; Abdullah, H.; Boor, B.E. Black Carbon and Particulate Matter Concentrations in Eastern Mediterranean Urban Conditions—An Assessment Based on Integrated Stationary and Mobile Observations. Atmosphere 2019, 10, 323.
81. Saleh, S.S.A.; Shilbayeh, Z.; Alkattan, H.; Al-Refie, M.R.; Jaghbeir, O.; Hussein, T. Temporal Variations of Submicron Particle Number Concentrations at an Urban Background Site in Amman—Jordan. Jordan J. Earth Environ. Sci. 2019, 10, 37–44.
82. Hussein, T.; Sogacheva, L.; Petäjä, T. Accumulation and Coarse Modes Particle Concentrations during Dew Formation and Precipitation. Aerosol Air Qual. Res. 2018, 18, 2929–2938.
83. Hussein, T.; Juwhari, H.; Al Kuisi, M.; Alkattan, H.; Lahlouh, B.; Al-Hunaiti, A. Accumulation and Coarse Modes Aerosols Concentrations and Carbonaceous Contents in the Urban Background Atmosphere in Amman—Jordan. Arab. J. Geosci. 2018, 11, 617.
84. Hussein, T.; Betar, A. Size-Fractionated Number and Mass Concentrations in the Urban Background Atmosphere during Spring 2014 in Amman—Jordan. Jordan J. Phys. 2017, 10, 51–60.
85. Hussein, T.; Boor, B.E.; dos Santos, V.N.; Kangasluoma, J.; Petäjä, T.; Lihavainen, H. Mobile Aerosol Measurement in the Eastern Mediterranean—A Utilization of Portable Instruments. Aerosol Air Qual. Res. 2017, 17, 1875–1886.
86. Hussein, T.; Halayka, M.; Abu Al-Ruz, R.; Abdullah, H.; Mølgaard, B.; Petäjä, T. Fine Particle Number Concentrations in Amman and Zarqa during Spring 2014. Jordan J. Phys. 2016, 9, 31–46.
87. Hussein, T.; Abu Al-Ruz, R.; Petäjä, T.; Junninen, H.; Arafah, D.-E.; Hämeri, K.; Kulmala, M. Local air pollution versus short–range transported dust episodes: A comparative study for submicron particle number concentration. Aerosol Air Qual. Res. 2011, 11, 109–119.
88. Heintzenberg, J.; Wehner, B.; Birmili, W. "How to find bananas in the atmospheric aerosol": New approach for analyzing atmospheric nucleation and growth events. Tellus B 2007, 59, 273–282.

Atmosphere 2020, 11, 79 20 of 20
89. Dal Maso, M.; Kulmala, M.; Riipinen, I.; Wagner, R.; Hussein, T.; Aalto, P.P.; Lehtinen, K.E.J. Formation and growth of fresh atmospheric aerosols: eight years of aerosol size distribution data from SMEAR II, Hyytiälä, Finland. Boreal Environ. Res. 2005, 10, 323–336.
90. Lehtinen, K.; Kulmala, M. A model for particle formation and growth in the atmosphere with molecular resolution in size. Atmos. Chem. Phys. 2003, 3, 251–258.
91. Kulmala, M.; Dal Maso, M.; Mäkelä, J.M.; Pirjola, L.; Väkevä, M.; Aalto, P.; Miikkulainen, P.; Hämeri, K.; O’Dowd, C.D. On the formation, growth and composition of nucleation mode particles. Tellus B 2001, 53B, 479–490.
92. Mäkelä, J.M.; Dal Maso, M.; Pirjola, L.; Keronen, P.; Laakso, L.; Kulmala, M.; Laaksonen, A. Characteristics of the atmospheric particle formation events observed at a boreal forest site in southern Finland. Boreal Env. Res. 2000, 5, 299–313.
93. Fuchs, N.A. The Mechanics of Aerosols; Dover Publication: New York, NY, USA, 1964. 94. Whitby, K.H. The physical characteristics of sulfur aerosols. Atmos. Environ. 1978, 12, 135–159. 95. Seinfeld, H.S.; Pandis, S.N. Atmospheric Chemistry and Physics: From Air Pollution to Climate Change, 2nd ed.;
John Wiley & Sons: New York, NY, USA, 1998. 96. Hussein, T.; Dal Maso, M.; Petäjä, T.; Koponen, I.K.; Paatero, P.; Aalto, P.P.; Hämeri, K.; Kulmala, M.
Evaluation of an automatic algorithm for fitting the particle number size distributions. Boreal Environ. Res. 2005, 10, 337–355.
97. Draxler, R.; Hess, G.D. Description of the HYSPLIT_4 modeling system, NOAA Tech. Memo. ERL ARL-224: Maryland, MD, USA 1997.
98. Draxler, R.; Stunder, B.; Rolph, G.; Stein, A.; Taylor, A. HYSPLIT4 User’s Guide. Available online: http://www.arl.noaa.gov/documents/reports/hysplit_user_guide.pdf (accessed on 08.January.2020).
99. Stein, A.F.; Draxler, R.; Rolph, G.D.; Stunder, B.J.B.; Cohen, M.D.; Ngan, F. Noaa's hysplit atmospheric transport and dispersion modeling system. Bull. Am. Meteorol. Soc. 2015, 96, 2059–2077.
100. Olin, M.; Kuuluvainen, H.; Aurela, M.; Kalliokoski, J.; Kuittinen, N.; Isotalo, M.; Timonen, H.J.; Niemi, J.V.; Rönkkö, T.; Dal Maso, M. Traffic-originated nanocluster emission exceeds H2SO4-driven photochemical new particle formation in an urban area. Atmos. Chem. Phys. Discuss. 2020, 20, 1–13, doi:10.5194/acp-2019-458.
101. Young, L.H.; Lee, S.-H.; Kanawade, V.P.; Hsiao, T.-C. ; Lee, Y.L.; Hwang, B.-F.; Liou, Y.-J.; Hsu, H.-T.; Tsai, P.-J. New particle growth and shrinkage observed in subtropical environments, Atmos. Chem. Phys. 2013, 13, 547–564.
102. Nilsson, E.D.; Kulmala, M. The potential for atmospheric mixing processes to enhance the binary nucleation rate. J. Geophys. Res. 1998, 103, 1381–1389.
103. Hamdi, M.R.; Bdour, A.; Tarawneh, Z. Diesel quality in Jordan: impacts and industrial emissions on urban air quality. Environ. Eng. Sci. 2008, 25, 1333–1343.
104. Lee, S.-H.; Gordon, H.; Yu, H.; Lehtipalo, K.; Haley, R.; Li, Y.; Zhang, R. New Particle Formation in the Atmosphere: From Molecular Clusters to Global Climate. J. Geophys. Res. Atmos. 2019, 124, 7098–7146
105. Dai, L.; Wang, H.; Zhou, L.; An, J.; Tang, L.; Lu, C.; Yan, W.; Liu, R.; Kong, S.; Chen, M.; et al. Regional and local new particle formation events observed in the Yangtze River Delta region, China, J. Geophys. Res. Atmos. 2017, 122, 2389–2402.
106. Erupe, M.E.; Benson, D.R.; Li, J.; Young, L.-H.; Verheggen, B.; Al-Refai, M.; Tahboub, O.; Cunningham, V.; Frimpong, F.; Viggiano, A.A.; et al. Correlation of aerosol nucleation rate with sulfuric acid and ammonia in Kent Ohio: an atmospheric observation, J. Geophys. Res. 2010, 115, D23216.
107. Kulmala, M.; Petäjä, T.; Mönkkänen, P.; Koponen, I.K.; Dal Maso, M.; Aalto, P.P.; Lehtinen, K.E.J.; Kerminen, V.-M. On the growth of nucleation mode particles: source rates of condensable vapour in polluted and clean environments. Atmos. Chem. Phys. 2005, 5, 409–416, SRef-ID:1680-7324/acp/2005-5-409.
© 2020 by the authors. Licensee MDPI, Basel, Switzerland. This article is an open access article distributed under the terms and conditions of the Creative Commons Attribution (CC BY) license (http://creativecommons.org/licenses/by/4.0/).