Embed Size (px)
Citation preview
New particle formation from photooxidation
of diiodomethane (CH2I2)
Jose L. Jimenez,1,2 Roya Bahreini,3 David R. Cocker III,3,4 Hong Zhuang,3
Varuntida Varutbangkul,5 Richard C. Flagan,1 John H. Seinfeld,1 Colin D. O’Dowd,6,7
and Thorsten Hoffmann8
Received 16 April 2002; revised 25 November 2002; accepted 4 March 2003; published 30 May 2003.
[1] Photolysis of CH2I2 in the presence of O3 has been proposed as a mechanism leadingto intense new particle formation in coastal areas. We report here a comprehensivelaboratory chamber study of this system. Rapid homogeneous nucleation was observedover three orders of magnitude in CH2I2 mixing ratio, down to a level of 15 ppt (�4 � 108
molec. cm�3) comparable to the directly measured total gas-phase iodine speciesconcentrations in coastal areas. After the nucleation burst, the observed aerosol dynamicsin the chamber was dominated by condensation of additional vapors onto existing particlesand particle coagulation. Particles formed under dry conditions are fractal agglomerateswith mass fractal dimension, Df � 1.8–2.5. Higher relative humidity (65%) does notchange the nucleation or growth behavior from that under dry conditions, but results inmore compact and dense particles (Df � 2.7). On the basis of the known gas-phasechemistry, OIO is the most likely gas-phase species to produce the observed nucleationand aerosol growth; however, the current understanding of this chemistry is very likelyincomplete. Chemical analysis of the aerosol using an Aerodyne Aerosol MassSpectrometer reveals that the particles are composed mainly of iodine oxides but alsocontain water and/or iodine oxyacids. The system studied here can produce nucleationevents as intense as those observed in coastal areas. On the basis of comparison betweenthe particle composition, hygroscopicity, and nucleation and growth rates observed incoastal nucleation and in the experiments reported here, it is likely that photooxidation ofCH2I2, probably aided by other organic iodine compounds, is the mechanism leading tothe observed new particle formation in the west coast of Ireland. INDEX TERMS: 0305
Atmospheric Composition and Structure: Aerosols and particles (0345, 4801); 0312 Atmospheric Composition
and Structure: Air/sea constituent fluxes (3339, 4504); 0315 Atmospheric Composition and Structure:
Biosphere/atmosphere interactions; 0322 Atmospheric Composition and Structure: Constituent sources and
sinks; 0365 Atmospheric Composition and Structure: Troposphere—composition and chemistry; KEYWORDS:
coastal aerosols, new particle formation, nucleation, aerosol mass spectrometer, smog chamber
Citation: Jimenez, J. L., R. Bahreini, D. R. Cocker III, H. Zhuang, V. Varutbangkul, R. C. Flagan, J. H. Seinfeld, C. D. O’Dowd, and
T. Hoffmann, New particle formation from photooxidation of diiodomethane (CH2I2), J. Geophys. Res., 108(D10), 4318,
doi:10.1029/2002JD002452, 2003.
1. Introduction
[2] Homogeneous nucleation is a source of new particlesin the atmosphere. New particle formation has beenobserved in regions that have undergone cloud processing,forested areas, polluted air masses, the marine boundarylayer, Arctic areas, and coastal regions. In some instances,observed atmospheric new particle formation is consistentwith binary homogeneous nucleation of sulfuric acid andwater, while in others an additional mechanism needs to beinvoked, probably ternary homogeneous nucleation of sul-furic acid, ammonia, and water [Weber et al., 1999; Kulmalaet al., 2002].[3] Coastal zones have been known to be a locus of
significant new particle formation for more than a century[Aitken, 1897], but the study of this phenomenon has
JOURNAL OF GEOPHYSICAL RESEARCH, VOL. 108, NO. D10, 4318, doi:10.1029/2002JD002452, 2003
1Department of Environmental Science and Engineering and Depart-ment of Chemical Engineering, California Institute of Technology,Pasadena, California, USA.
2Now at Department of Chemistry and CIRES, University of Colorado,Boulder, Colorado, USA.
3Department of Environmental Science and Engineering, CaliforniaInstitute of Technology, Pasadena, California, USA.
4Now at Department of Chemical and Environmental Engineering,University of California, Riverside, California, USA.
5Department of Chemical Engineering, California Institute of Technol-ogy, Pasadena, California, USA.
6Department of Physics, University of Helsinki, Helsinki, Finland.7Also at Department of Physics, National University of Ireland, Galway,
Ireland.8Institute of Spectrochemistry and Applied Spectroscopy, Dortmund,
Germany.
Copyright 2003 by the American Geophysical Union.0148-0227/03/2002JD002452$09.00
AAC 5 - 1
intensified only recently [O’Dowd et al., 1998, 1999, 2002;Grenfell et al., 1999]. Evidence points to gaseous alkyliodides as precursors to particle production in this environ-ment [Laturnus, 1996; Alicke et al., 1999; Carpenter et al.,1999; Cox et al., 1999]. The 1998–99 PARFORCE cam-paign [O’Dowd et al., 2002], conducted on the west coast ofIreland, is the most intensive field study of coastal newparticle formation to date. Nucleation was observed at thislocation on most days, for all seasons, and all air masses.Aerosols formed by this mechanism are estimated to sig-nificantly increase both direct scattering and CCN concen-trations. Observations at this location point to the possiblerole of diiodomethane (CH2I2) in the measured new particleformation.[4] CH2I2 is the most abundant of the measured iodine-
containing compounds released by macroalgae [Makela etal., 2002] and appears to be the most important compoundcontrolling the influx of iodine atoms into the coastalboundary layer [Carpenter et al., 1999]. CH2I2 is rapidlyphotolyzed by sunlight reaching the Earth’s surface. Severalstudies have developed gas-phase atmospheric oxidationmechanisms for iodine species [Sander et al., 1997; Vogtet al., 1999; McFiggans et al., 2000], but the molecularroutes leading to new particle formation and particle growthhave not been unequivocally established. The evidencepointing to the role of CH2I2 in the observed nucleationincluded: (1) CH2I2 and IO (the latter is produced fromCH2I2) showed coherence with the tidal cycle, which in turnwas strongly correlated with the nucleation events; (2) Solarradiation was also needed for nucleation to occur, which isconsistent with a mechanism based on CH2I2 photolysis; (3)Iodine was always observed in the nucleation mode par-ticles, while sulfur was detected only some of the time, andchlorine or bromine were never present; (4) Ultrafineparticle hygroscopic growth factors indicated very lowsolubility, which rules out sulfate aerosol; (5) NeitherH2SO4, VOCs, nor any species associated with pollutedair masses can explain the observed nucleation and growth.[5] Kulmala et al. [2002] conclude from a modeling
study that new particle formation from ternary nucleationof H2SO4-NH3-H2O could have occurred almost continu-ously during PARFORCE, but there was insufficient vaporphase H2SO4 to grow the particles to observable sizes. Theysuggest that while the new particle formation may be due toH2SO4-NH3-H2O, another species is responsible for thegrowth of these particles to detectable sizes, thus decouplingthe nucleation and particle growth mechanisms. If thecondensing species cannot nucleate on its own, new particleformation may not occur at other coastal areas where thesame condensable species are present, if the H2SO4-NH3-H2O system does not provide the initial nuclei.[6] On the basis of laboratory experiments, Hoffmann et
al. [2001] demonstrated that rapid particle formation occursafter photolysis of CH2I2 in the presence of O3. On the basisof measurements of the chemical composition of particlesformed, these authors suggested that self-nucleation ofiodine dioxide (OIO) may be an effective mechanism ofnew particle formation in coastal regions. However, theirexperimental setup was not well suited for a quantitativestudy of this system.[7] Laboratory chamber experiments provide the ability
to study aerosol nucleation and growth under well-con-
trolled conditions of temperature, humidity, preexistingparticles, precursor gas-phase concentrations, and radiation[Cocker et al., 2001]. Following the work of Hoffmann etal. [2001], we present here a comprehensive quantitativelaboratory chamber investigation of particle formation fromphotolysis of CH2I2 in the presence of ozone. Measurementsare carried out on particle formation and growth under bothdry and moderately humid conditions, as well as on thehygroscopicity and chemical composition of the aerosolsproduced. The goals of this work are to characterize thechemical routes leading to new particles, the rates of particleformation and growth, the properties of the aerosols formed,and to evaluate whether this mechanism could be respon-sible for the strong nucleation events observed in thePARFORCE campaign. In section 2 we describe the exper-imental system, including the laboratory chamber facility,and the instrumentation for particle number, size, composi-tion, and hygroscopicity measurement. The experimentalobservations are summarized in section 3, while a detailedinterpretation of the size distribution measurements is pre-sented in section 4. Section 5 describes the results of adetailed gas-phase and aerosol uptake model for the cham-ber, and compares the results of the model with theexperimental data. Finally, section 6 provides an integratedinterpretation of the data in terms of the aerosol chemistry,and section 7 compares the results of this study with thoseof the PARFORCE field study.
2. Experimental Description
[8] Aerosol formation from the direct photolysis of CH2I2in the presence of O3 was investigated in the Caltech indoorchamber. This facility has been described in detail previ-ously [Cocker et al., 2001]. Briefly, the Caltech indoorfacility consists of dual, 28 m3 chambers illuminated by 3001.22 m fluorescent blacklights (Sylvania 350BL), which areused to simulate the UV and near UV regions of ambientsunlight (W. Carter et al., Final report to National Renew-able Energy Laboratory, available at ftp://ftp.cert.ucr.edu/pub/carter/pubs/explrept.pdf). The UV and visible lightintensity was measured with a portable spectroradiometer(LI-1800, LI-COR, Lincoln, Nebraska), which had beencalibrated at the factory immediately before these measure-ments. The UV intensity at the peak of 354 nm was 2.9 Wm�2 nm�1, with the relative spectral dependence describedin Cocker et al. [2001]. The estimated photolysis rate ofNO2 was 0.6 min�1. This is in good agreement withprevious measurements in this chamber for aged lights,and corresponds to about 1.2 times the maximum rate atthe Earth’s surface with a solar zenith angle of 0�. Thereaction chamber was originally filled with clean dry air at1 atm and 20�C. Air temperature inside the chamber andsurrounding the equipment and the sample lines was main-tained at 20�C ± 2�C. A dilute solution of CH2I2 in C6F6was prepared and injected into a glass flask with a microlitersyringe. The solution was evaporated and introduced intothe bag by flowing clean particle-free dry air over thesolution on the flask, and aiding the process with slightheating. For humid experiments, water vapor was injectedinto the chamber to reach the desired RH of 65% ± 5%. Fordry experiments RH was less than 2% ± 1%, below thedetection limit of the available hygrometer. Initial ozone
AAC 5 - 2 JIMENEZ ET AL.: NEW PARTICLE FORMATION FROM DIIODOMETHANE
mixing ratios were 100 ppb ± 20 ppb. The UV lights wereturned on after all components were well mixed in thechamber. Repetition of some experiments indicated a repro-ducibility of ±15% or better. This level of reproducibility isnot as good as that achieved for secondary organic aerosolformation experiments conducted previously in the samefacility. A possible explanation may be derived from ourexperimental observation that CH2I2 (and probably some ofits reaction products as well) is a ‘‘sticky’’ substance, that is,it has a significantly larger tendency to attach to surfaces,such as injection lines and chamber walls, than the non-halogenated organics involved in secondary organic aerosolstudies.
2.1. CH2I2 (Surrogate) Concentration Measurement
[9] An FID gas chromatograph (GC, Hewlett Packard,Model 5890, Series II) was used to check the initialconcentration of CH2I2 after injection of this species beforebeginning each experiment. Since CH2I2 would not elute onthe capillary column in the GC, which was optimized foranalysis of nonpolar or slightly polar hydrocarbons, the GCwas used to measure the concentration of C6F6 as asurrogate of the CH2I2 concentration. The GC was cali-brated by preparing known gas-phase C6F6 concentrationsby injecting known amounts of C6F6 into a small Teflonbag, and then sampling the small bag into the GC. Theactual concentration of CH2I2 in the chamber was deducedfrom monitoring the response of the GC to C6F6 in thebeginning of each experiment (before the UV lights wereswitched on) and using the calibration equation. The CH2I2concentration estimated in this manner was on average�8% ± 4% of the concentration predicted from the amountof solution injected, the solution concentration, and thevolume of the chamber.
2.2. Particle Number and Size DistributionMeasurements
[10] Particle size distributions were measured by a scan-ning electrical mobility spectrometer (SEMS) [Wang andFlagan, 1989]. The SEMS is equipped with a TSI model3077 85Kr neutralizer (TSI Inc., St. Paul, Minn.), a longcolumn cylindrical differential mobility analyzer (TSI3071), and a condensation particle counter (CPC, TSI3760). The DMA was operated with sheath and excessflows of 2.5 LPM, and polydisperse and monodisperseflows of 0.25 LPM. By changing the voltage of the DMAexponentially between �30 and �7000 V, a mobilityspectrum was obtained every 90 s over particle diametersranging from 25 nm to 700 nm.[11] Newly formed particles from homogeneous nuclea-
tion have diameters less than 25 nm, below the detectionlimit of the SEMS as operated in this study. Moreover, thenumber concentrations of nucleated particles may exceedthe maximum concentrations and change faster than thisSEMS can measure. For these reasons, independent particlenumber concentrations were recorded using a TSI CPC3025 and a TSI CPC 3010. The detection efficiencies ofthese CPCs are 50% for particles of 3 and 10 nm, respec-tively [TSI, 1996; Hameri et al., 2002]. The smallestdetectable particles are about 2 nm and 6 nm for the CPC3025 and 3010, respectively [Hameri et al., 2002]. Particlecoincidence in the CPCs was minimized by diluting the
sampled aerosol stream by a factor of 1000. This extendedthe measurement range up to 107 and 108 cm�3 for the CPC3010 and CPC 3025, respectively. The detection efficienciesof the CPC 3025 as operated here are estimated at 0.17%,8.4%, 30%, and 88% for particles of sizes 3, 6, 10, and50 nm, respectively. The low detection efficiencies at thesmall size limit are due to diffusion losses in the tubing fromthe point of sampling, through the dilution system, to theCPC, and, to a lesser extent, to the lower efficiency of theCPC itself for small particle sizes [Hinds, 1999; Hameri etal., 2002]. In the first moments after nucleation starts in thechamber, the CPC 3010 does not detect any particles whilethe CPC 3025 does. Given the size detection limits of bothCPCs and the detection efficiency of the CPC 3025 at thosesizes, we estimate that the concentrations reported by theCPC 3025 during this initial phase should be multiplied by afactor between 12 and 600 to determine the actual concen-tration. Because of the large uncertainties in the detectionefficiencies, all the CPC data are presented here withoutcorrection (as recorded).
2.3. Aerosol Mass Spectrometer (AMS)
[12] An Aerodyne Aerosol Mass Spectrometer [Jayne etal., 2000; Jimenez et al., 2003] was used to simultaneouslymonitor particle vacuum aerodynamic diameter and chem-ical composition. The AMS uses an aerodynamic lens tofocus the particles into a narrow beam that is then intro-duced into a high vacuum chamber while the air is differ-entially pumped. Volatile and semivolatile species in/on theparticles are vaporized on a heated, roughened molybdenumsurface under high vacuum (10�7 Torr) at about 600�C. Thevaporized species are then ionized by the impact of ener-getic electrons (70 eV). The ions formed are analyzed by aquadrupole mass spectrometer (QMA 430, Balzers Instru-ments, Balzers, Liechtenstein). Particle aerodynamic size isdetermined via particle time-of-flight, with the starting timeprovided by the opening time of a rotating beam chopperand the arrival time by the chemical detection. The AMScan produce two types of data: mass spectra of the speciespresent in/on the aerosol, without size information; andmass-weighed size distributions versus vacuum aerody-namic diameter (dM/dlogDva) of the aerosol at a series ofm/z peaks of the mass spectrometer.
2.4. Hygroscopicity Tandem DifferentialMobility Analyzer (HTDMA)
[13] A hygroscopicity tandem differential mobility ana-lyzer (HTDMA) was used to measure the response of theaerosol to changes in relative humidity. The HTDMA, basedon the original design of Rader and McMurry [1986],consists of a 85Kr neutralizer, a fixed voltage long columndifferential mobility analyzer (DMA model 3081, TSI Inc.)used to select a narrow size range of chamber aerosol (underthe humidity of the chamber), a cylindrical laminar flowchamber for aerosol humidification or dehumidification,followed by a second scanning long column DMA (TSImodel 3081) and condensation particle counter (CPC model3760A, TSI Inc.) operated as a SEMS [Cocker et al., 2001].This SEMS performed one full particle size scan every 75 s,while the sizes selected by the first DMA and/or the finalhumidity were changed every �10 min. Flow rates of2.5 LPM were used for both sheath and excess flows, and
JIMENEZ ET AL.: NEW PARTICLE FORMATION FROM DIIODOMETHANE AAC 5 - 3
0.25 LPM for both polydisperse and monodisperse aerosolflows. The classified aerosol was introduced on the center-line of the humidification chamber to minimize variations ofresidence time (10 s for the flow and configuration used).The data inversion algorithm used is described by Collins etal. [2002].
2.5. Summary of Experiments Performed
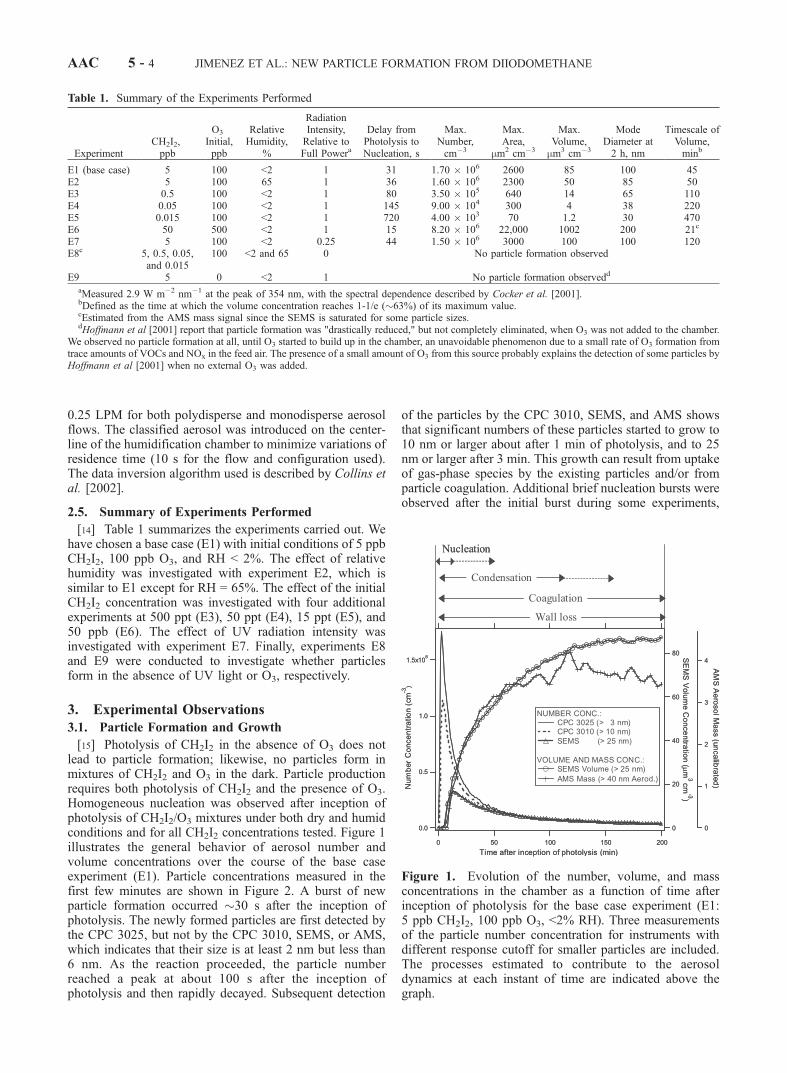
[14] Table 1 summarizes the experiments carried out. Wehave chosen a base case (E1) with initial conditions of 5 ppbCH2I2, 100 ppb O3, and RH < 2%. The effect of relativehumidity was investigated with experiment E2, which issimilar to E1 except for RH = 65%. The effect of the initialCH2I2 concentration was investigated with four additionalexperiments at 500 ppt (E3), 50 ppt (E4), 15 ppt (E5), and50 ppb (E6). The effect of UV radiation intensity wasinvestigated with experiment E7. Finally, experiments E8and E9 were conducted to investigate whether particlesform in the absence of UV light or O3, respectively.
3. Experimental Observations
3.1. Particle Formation and Growth
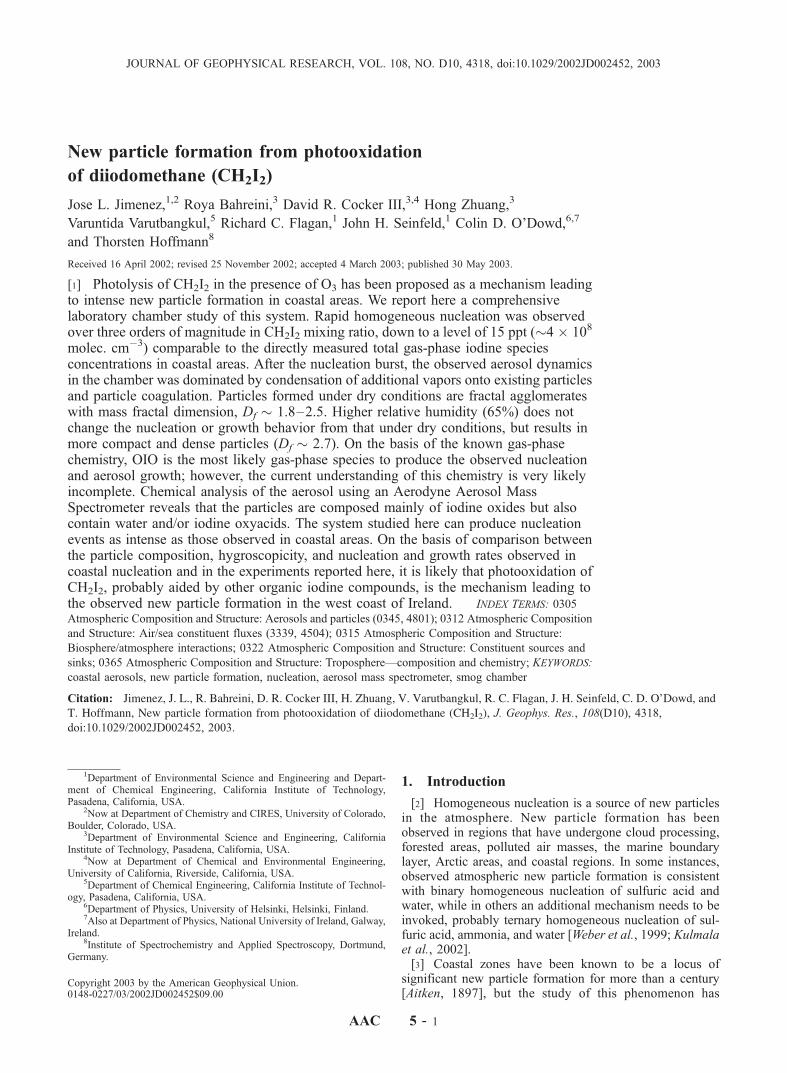
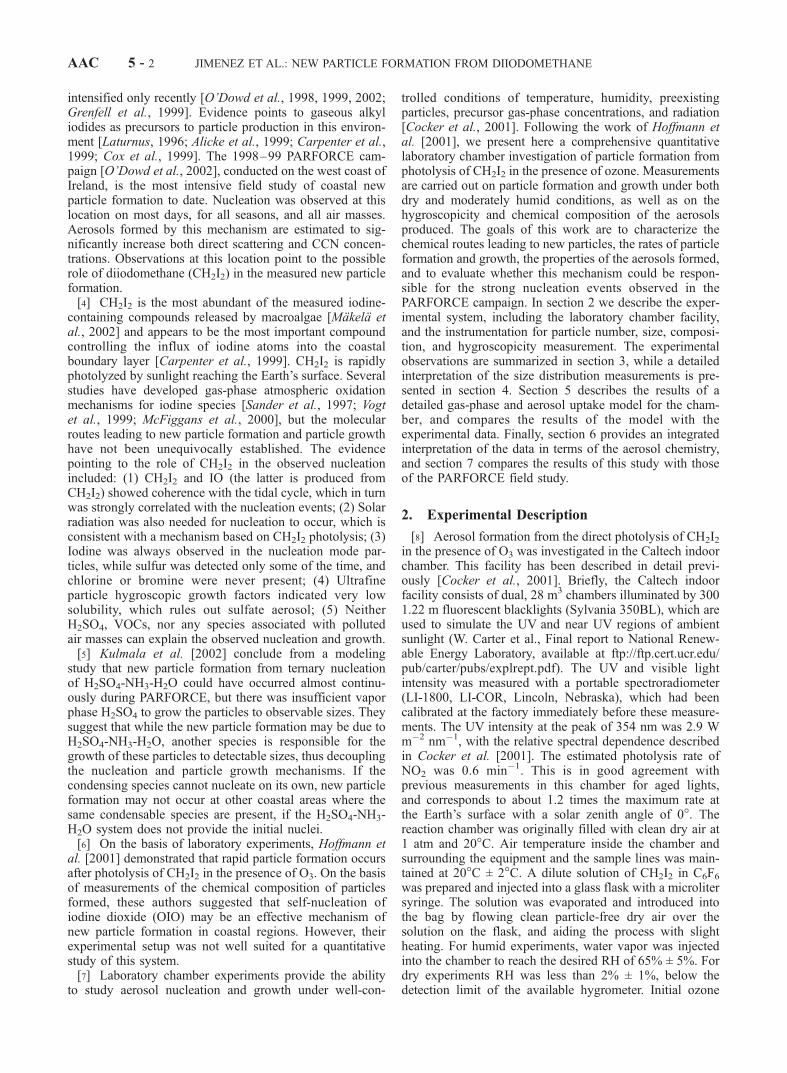
[15] Photolysis of CH2I2 in the absence of O3 does notlead to particle formation; likewise, no particles form inmixtures of CH2I2 and O3 in the dark. Particle productionrequires both photolysis of CH2I2 and the presence of O3.Homogeneous nucleation was observed after inception ofphotolysis of CH2I2/O3 mixtures under both dry and humidconditions and for all CH2I2 concentrations tested. Figure 1illustrates the general behavior of aerosol number andvolume concentrations over the course of the base caseexperiment (E1). Particle concentrations measured in thefirst few minutes are shown in Figure 2. A burst of newparticle formation occurred �30 s after the inception ofphotolysis. The newly formed particles are first detected bythe CPC 3025, but not by the CPC 3010, SEMS, or AMS,which indicates that their size is at least 2 nm but less than6 nm. As the reaction proceeded, the particle numberreached a peak at about 100 s after the inception ofphotolysis and then rapidly decayed. Subsequent detection
of the particles by the CPC 3010, SEMS, and AMS showsthat significant numbers of these particles started to grow to10 nm or larger about after 1 min of photolysis, and to 25nm or larger after 3 min. This growth can result from uptakeof gas-phase species by the existing particles and/or fromparticle coagulation. Additional brief nucleation bursts wereobserved after the initial burst during some experiments,
Table 1. Summary of the Experiments Performed
ExperimentCH2I2,ppb
O3
Initial,ppb
RelativeHumidity,
%
RadiationIntensity,Relative toFull Powera
Delay fromPhotolysis toNucleation, s
Max.Number,cm�3
Max.Area,
mm2 cm�3
Max.Volume,mm3 cm�3
ModeDiameter at2 h, nm
Timescale ofVolume,minb
E1 (base case) 5 100 <2 1 31 1.70 � 106 2600 85 100 45E2 5 100 65 1 36 1.60 � 106 2300 50 85 50E3 0.5 100 <2 1 80 3.50 � 105 640 14 65 110E4 0.05 100 <2 1 145 9.00 � 104 300 4 38 220E5 0.015 100 <2 1 720 4.00 � 103 70 1.2 30 470E6 50 500 <2 1 15 8.20 � 106 22,000 1002 200 21c
E7 5 100 <2 0.25 44 1.50 � 106 3000 100 100 120E8c 5, 0.5, 0.05,
and 0.015100 <2 and 65 0 No particle formation observed
E9 5 0 <2 1 No particle formation observedd
aMeasured 2.9 W m�2 nm�1 at the peak of 354 nm, with the spectral dependence described by Cocker et al. [2001].bDefined as the time at which the volume concentration reaches 1-1/e (�63%) of its maximum value.cEstimated from the AMS mass signal since the SEMS is saturated for some particle sizes.dHoffmann et al [2001] report that particle formation was "drastically reduced," but not completely eliminated, when O3 was not added to the chamber.
We observed no particle formation at all, until O3 started to build up in the chamber, an unavoidable phenomenon due to a small rate of O3 formation fromtrace amounts of VOCs and NOx in the feed air. The presence of a small amount of O3 from this source probably explains the detection of some particles byHoffmann et al [2001] when no external O3 was added.
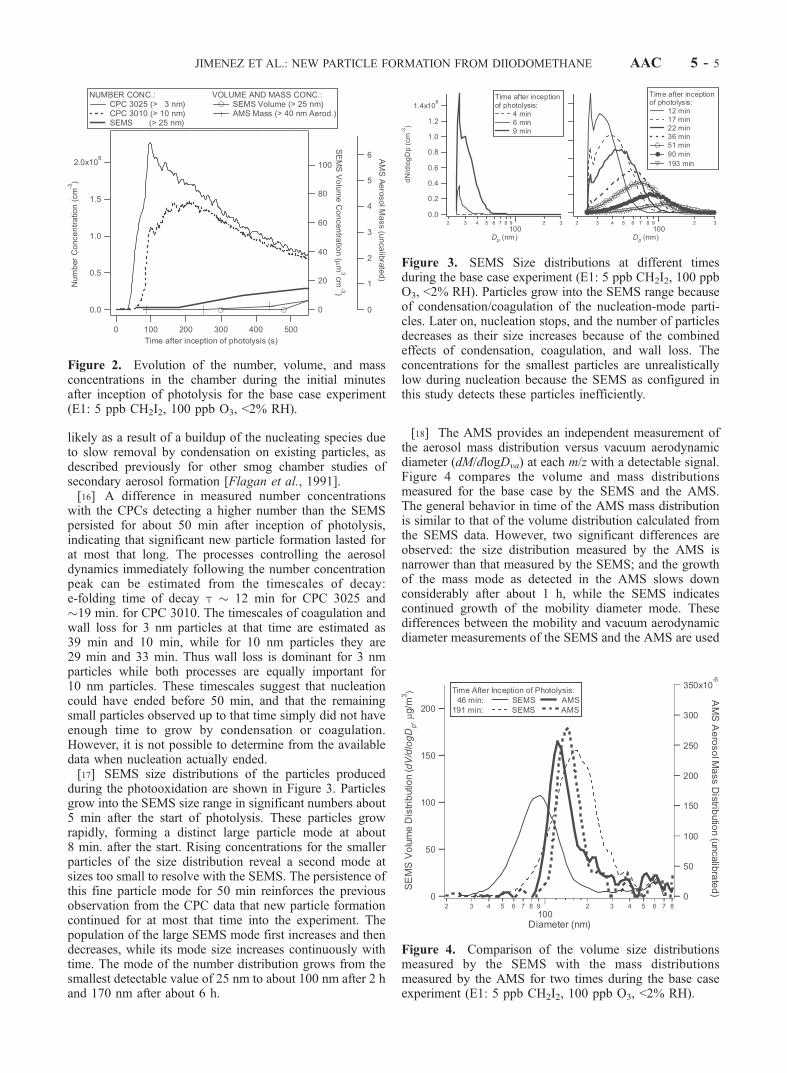
Figure 1. Evolution of the number, volume, and massconcentrations in the chamber as a function of time afterinception of photolysis for the base case experiment (E1:5 ppb CH2I2, 100 ppb O3, <2% RH). Three measurementsof the particle number concentration for instruments withdifferent response cutoff for smaller particles are included.The processes estimated to contribute to the aerosoldynamics at each instant of time are indicated above thegraph.
AAC 5 - 4 JIMENEZ ET AL.: NEW PARTICLE FORMATION FROM DIIODOMETHANE
likely as a result of a buildup of the nucleating species dueto slow removal by condensation on existing particles, asdescribed previously for other smog chamber studies ofsecondary aerosol formation [Flagan et al., 1991].[16] A difference in measured number concentrations
with the CPCs detecting a higher number than the SEMSpersisted for about 50 min after inception of photolysis,indicating that significant new particle formation lasted forat most that long. The processes controlling the aerosoldynamics immediately following the number concentrationpeak can be estimated from the timescales of decay:e-folding time of decay t � 12 min for CPC 3025 and�19 min. for CPC 3010. The timescales of coagulation andwall loss for 3 nm particles at that time are estimated as39 min and 10 min, while for 10 nm particles they are29 min and 33 min. Thus wall loss is dominant for 3 nmparticles while both processes are equally important for10 nm particles. These timescales suggest that nucleationcould have ended before 50 min, and that the remainingsmall particles observed up to that time simply did not haveenough time to grow by condensation or coagulation.However, it is not possible to determine from the availabledata when nucleation actually ended.[17] SEMS size distributions of the particles produced
during the photooxidation are shown in Figure 3. Particlesgrow into the SEMS size range in significant numbers about5 min after the start of photolysis. These particles growrapidly, forming a distinct large particle mode at about8 min. after the start. Rising concentrations for the smallerparticles of the size distribution reveal a second mode atsizes too small to resolve with the SEMS. The persistence ofthis fine particle mode for 50 min reinforces the previousobservation from the CPC data that new particle formationcontinued for at most that time into the experiment. Thepopulation of the large SEMS mode first increases and thendecreases, while its mode size increases continuously withtime. The mode of the number distribution grows from thesmallest detectable value of 25 nm to about 100 nm after 2 hand 170 nm after about 6 h.
[18] The AMS provides an independent measurement ofthe aerosol mass distribution versus vacuum aerodynamicdiameter (dM/dlogDva) at each m/z with a detectable signal.Figure 4 compares the volume and mass distributionsmeasured for the base case by the SEMS and the AMS.The general behavior in time of the AMS mass distributionis similar to that of the volume distribution calculated fromthe SEMS data. However, two significant differences areobserved: the size distribution measured by the AMS isnarrower than that measured by the SEMS; and the growthof the mass mode as detected in the AMS slows downconsiderably after about 1 h, while the SEMS indicatescontinued growth of the mobility diameter mode. Thesedifferences between the mobility and vacuum aerodynamicdiameter measurements of the SEMS and the AMS are used
Figure 2. Evolution of the number, volume, and massconcentrations in the chamber during the initial minutesafter inception of photolysis for the base case experiment(E1: 5 ppb CH2I2, 100 ppb O3, <2% RH).
Figure 3. SEMS Size distributions at different timesduring the base case experiment (E1: 5 ppb CH2I2, 100 ppbO3, <2% RH). Particles grow into the SEMS range becauseof condensation/coagulation of the nucleation-mode parti-cles. Later on, nucleation stops, and the number of particlesdecreases as their size increases because of the combinedeffects of condensation, coagulation, and wall loss. Theconcentrations for the smallest particles are unrealisticallylow during nucleation because the SEMS as configured inthis study detects these particles inefficiently.
Figure 4. Comparison of the volume size distributionsmeasured by the SEMS with the mass distributionsmeasured by the AMS for two times during the base caseexperiment (E1: 5 ppb CH2I2, 100 ppb O3, <2% RH).
JIMENEZ ET AL.: NEW PARTICLE FORMATION FROM DIIODOMETHANE AAC 5 - 5
below to estimate particle effective density. The reason forthe broader size distribution on the SEMS as compared tothe AMS may be due to the particles being fractal agglom-erates (see section 4). The particles spend a much longertime inside the SEMS column while being size-classified(seconds) than in the AMS expansion that imparts them asize-dependent velocity (<1 ms). Under these circumstan-ces, it is likely that the diffusional broadening of thedistribution due to particle shape is greater in the SEMSbecause of the longer time available.[19] The total aerosol volume concentration was obtained
from the SEMS size distributions (assuming dense sphericalparticles) while a signal proportional to aerosol mass wasobtained from the AMS; both are also shown in Figures 1and 2. Since total particle volume is dominated by thelargest particles, once about half of the particles have grownabove the SEMS detection limit of 25 nm mobility diameter(t > 20 min), the error due to the volume of particles belowthis limit diminishes rapidly. The particle volume increasedwith t � 45 min, much more slowly than the particlenumber concentration, and reached a maximum value ofabout 85 mm3 cm�3 after about 150 min. The particle massconcentration measured by the AMS starts to rise a fewminutes earlier than the SEMS volume, an observation thatis exploited in section 4.1 to determine the effective densityof the particles detected at this time. Later, the evolution ofthe AMS aerosol mass signal is close to that of the volumecalculated from the SEMS data for about 80 min, but itlevels off earlier than the SEMS volume. After nucleationceased, the observed increase in particle volume and mass isa result of condensation of additional vapors onto theexisting particles. The later discrepancy between the SEMSand AMS may indicate that while condensation has endedafter about 80 min, the apparent particle volume stillincreases because of the production of agglomerate particlesby coagulation.[20] The main results of the parametric experiments are
summarized in Table 1. The effect of relative humidity onthe particle formation process was investigated with anexperiment identical to the base case except for the moder-
ately humid condition (RH = 65%, Exp. E2). No significantdifference was observed in the nucleation delay, initialparticle number burst, the shape of the particle volumeand mass versus time, or the shape of the SEMS and AMSsize distributions compared to those of the dry case. Themain difference is that the apparent particle volume (assum-ing dense spherical particles) calculated from the SEMSdata for the humid experiment is about half of that of the dryexperiment. Although the number concentrations and theshape of the size distribution are similar under both con-ditions, the mobility diameter of the particles is smallerunder humid conditions, resulting in the observed differencein the volume. The vacuum aerodynamic diameter modemeasured by the AMS, however, is larger than for the drycase. Both of these observations suggest that the particlesare more dense and compact in the humid experiment thanin the dry experiment, an issue that is explored further insection 4.[21] Varying the initial concentration of CH2I2 over
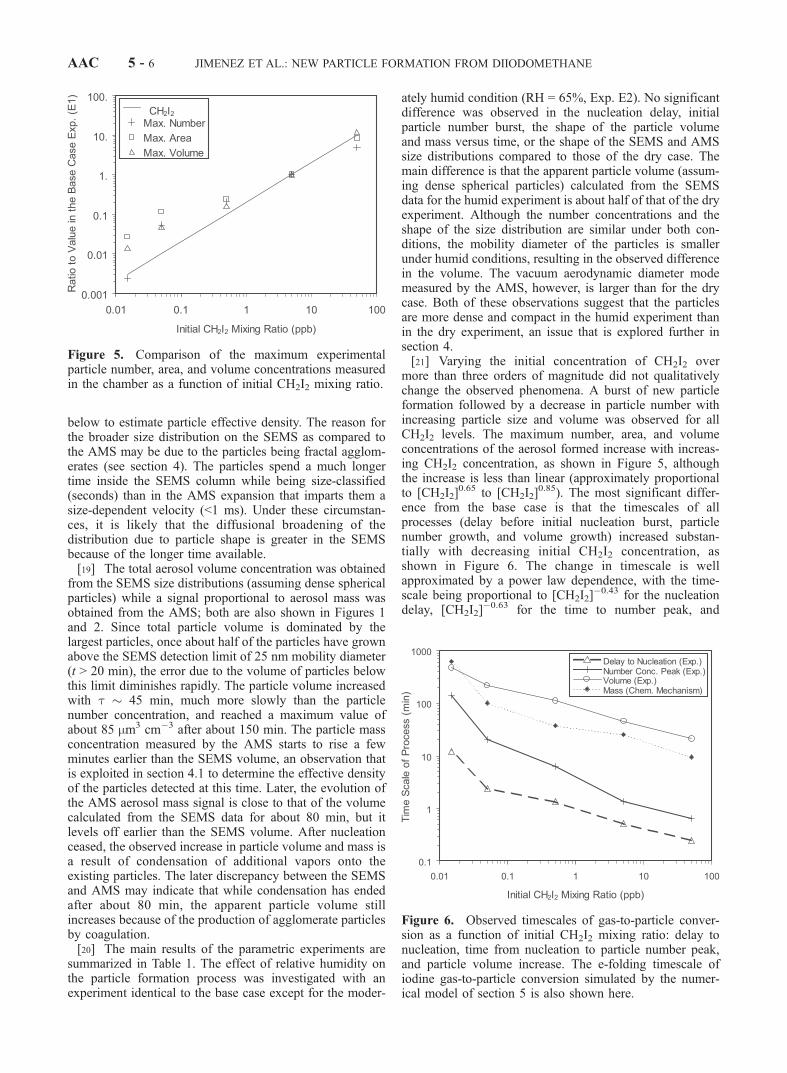
more than three orders of magnitude did not qualitativelychange the observed phenomena. A burst of new particleformation followed by a decrease in particle number withincreasing particle size and volume was observed for allCH2I2 levels. The maximum number, area, and volumeconcentrations of the aerosol formed increase with increas-ing CH2I2 concentration, as shown in Figure 5, althoughthe increase is less than linear (approximately proportionalto [CH2I2]
0.65 to [CH2I2]0.85). The most significant differ-
ence from the base case is that the timescales of allprocesses (delay before initial nucleation burst, particlenumber growth, and volume growth) increased substan-tially with decreasing initial CH2I2 concentration, asshown in Figure 6. The change in timescale is wellapproximated by a power law dependence, with the time-scale being proportional to [CH2I2]
�0.43 for the nucleationdelay, [CH2I2]
�0.63 for the time to number peak, and
Figure 5. Comparison of the maximum experimentalparticle number, area, and volume concentrations measuredin the chamber as a function of initial CH2I2 mixing ratio.
Figure 6. Observed timescales of gas-to-particle conver-sion as a function of initial CH2I2 mixing ratio: delay tonucleation, time from nucleation to particle number peak,and particle volume increase. The e-folding timescale ofiodine gas-to-particle conversion simulated by the numer-ical model of section 5 is also shown here.
AAC 5 - 6 JIMENEZ ET AL.: NEW PARTICLE FORMATION FROM DIIODOMETHANE
[CH2I2]�0.37 for the volume growth. For the lowest CH2I2
concentration (E5) the timescale of particle volume growthwas about 8 h, and consequently its dynamics in thechamber are significantly affected by particle (and prob-ably gas) loss to the chamber walls.[22] Varying the intensity of the UV radiation (E7) to 1/4
of the base case increased the nucleation delay, the time toreach the peak of particle number concentration, and thetimescale of aerosol volume by factors of 1.5, 2.4, and 2.7,respectively. The amount of aerosol formed was verysimilar to that of the base case.
3.2. Hygroscopic Properties
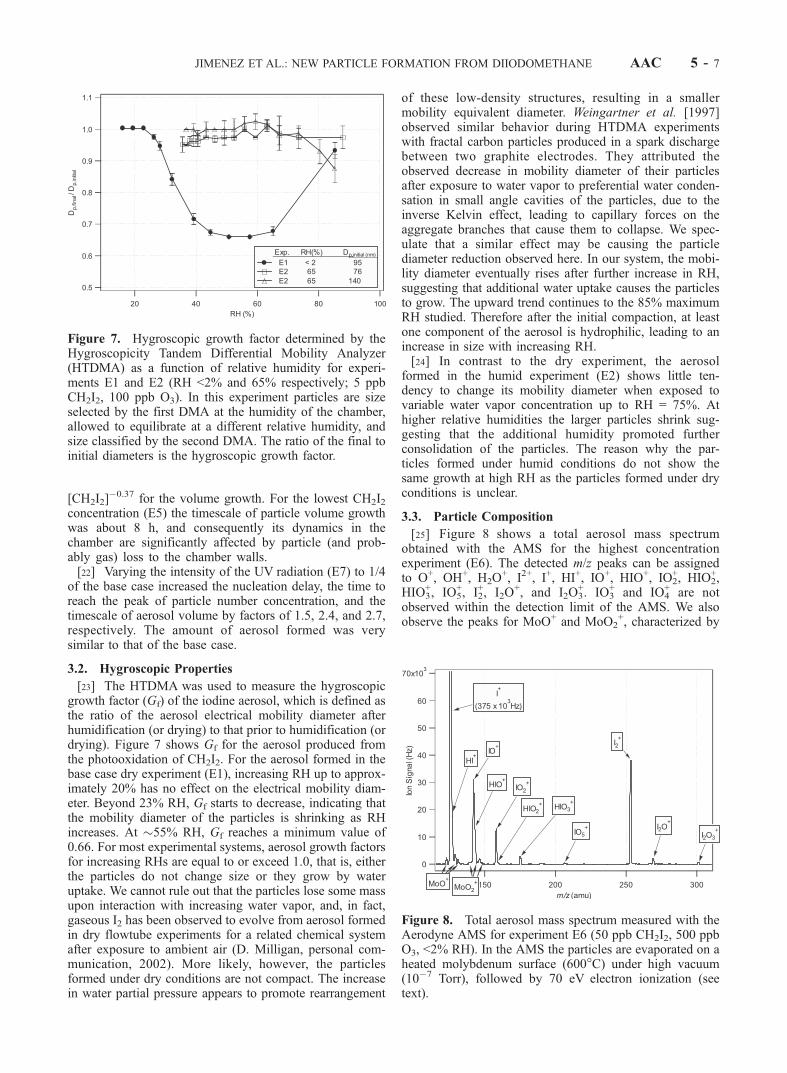
[23] The HTDMA was used to measure the hygroscopicgrowth factor (Gf) of the iodine aerosol, which is defined asthe ratio of the aerosol electrical mobility diameter afterhumidification (or drying) to that prior to humidification (ordrying). Figure 7 shows Gf for the aerosol produced fromthe photooxidation of CH2I2. For the aerosol formed in thebase case dry experiment (E1), increasing RH up to approx-imately 20% has no effect on the electrical mobility diam-eter. Beyond 23% RH, Gf starts to decrease, indicating thatthe mobility diameter of the particles is shrinking as RHincreases. At �55% RH, Gf reaches a minimum value of0.66. For most experimental systems, aerosol growth factorsfor increasing RHs are equal to or exceed 1.0, that is, eitherthe particles do not change size or they grow by wateruptake. We cannot rule out that the particles lose some massupon interaction with increasing water vapor, and, in fact,gaseous I2 has been observed to evolve from aerosol formedin dry flowtube experiments for a related chemical systemafter exposure to ambient air (D. Milligan, personal com-munication, 2002). More likely, however, the particlesformed under dry conditions are not compact. The increasein water partial pressure appears to promote rearrangement
of these low-density structures, resulting in a smallermobility equivalent diameter. Weingartner et al. [1997]observed similar behavior during HTDMA experimentswith fractal carbon particles produced in a spark dischargebetween two graphite electrodes. They attributed theobserved decrease in mobility diameter of their particlesafter exposure to water vapor to preferential water conden-sation in small angle cavities of the particles, due to theinverse Kelvin effect, leading to capillary forces on theaggregate branches that cause them to collapse. We spec-ulate that a similar effect may be causing the particlediameter reduction observed here. In our system, the mobi-lity diameter eventually rises after further increase in RH,suggesting that additional water uptake causes the particlesto grow. The upward trend continues to the 85% maximumRH studied. Therefore after the initial compaction, at leastone component of the aerosol is hydrophilic, leading to anincrease in size with increasing RH.[24] In contrast to the dry experiment, the aerosol
formed in the humid experiment (E2) shows little ten-dency to change its mobility diameter when exposed tovariable water vapor concentration up to RH = 75%. Athigher relative humidities the larger particles shrink sug-gesting that the additional humidity promoted furtherconsolidation of the particles. The reason why the par-ticles formed under humid conditions do not show thesame growth at high RH as the particles formed under dryconditions is unclear.
3.3. Particle Composition
[25] Figure 8 shows a total aerosol mass spectrumobtained with the AMS for the highest concentrationexperiment (E6). The detected m/z peaks can be assignedto O+, OH+, H2O
+, I2+, I+, HI+, IO+, HIO+, IO2+, HIO2
+,HIO3
+, IO5+, I2
+, I2O+, and I2O3
+. IO3+ and IO4
+ are notobserved within the detection limit of the AMS. We alsoobserve the peaks for MoO+ and MoO2
+, characterized by
Figure 7. Hygroscopic growth factor determined by theHygroscopicity Tandem Differential Mobility Analyzer(HTDMA) as a function of relative humidity for experi-ments E1 and E2 (RH <2% and 65% respectively; 5 ppbCH2I2, 100 ppb O3). In this experiment particles are sizeselected by the first DMA at the humidity of the chamber,allowed to equilibrate at a different relative humidity, andsize classified by the second DMA. The ratio of the final toinitial diameters is the hygroscopic growth factor.
Figure 8. Total aerosol mass spectrum measured with theAerodyne AMS for experiment E6 (50 ppb CH2I2, 500 ppbO3, <2% RH). In the AMS the particles are evaporated on aheated molybdenum surface (600�C) under high vacuum(10�7 Torr), followed by 70 eV electron ionization (seetext).
JIMENEZ ET AL.: NEW PARTICLE FORMATION FROM DIIODOMETHANE AAC 5 - 7
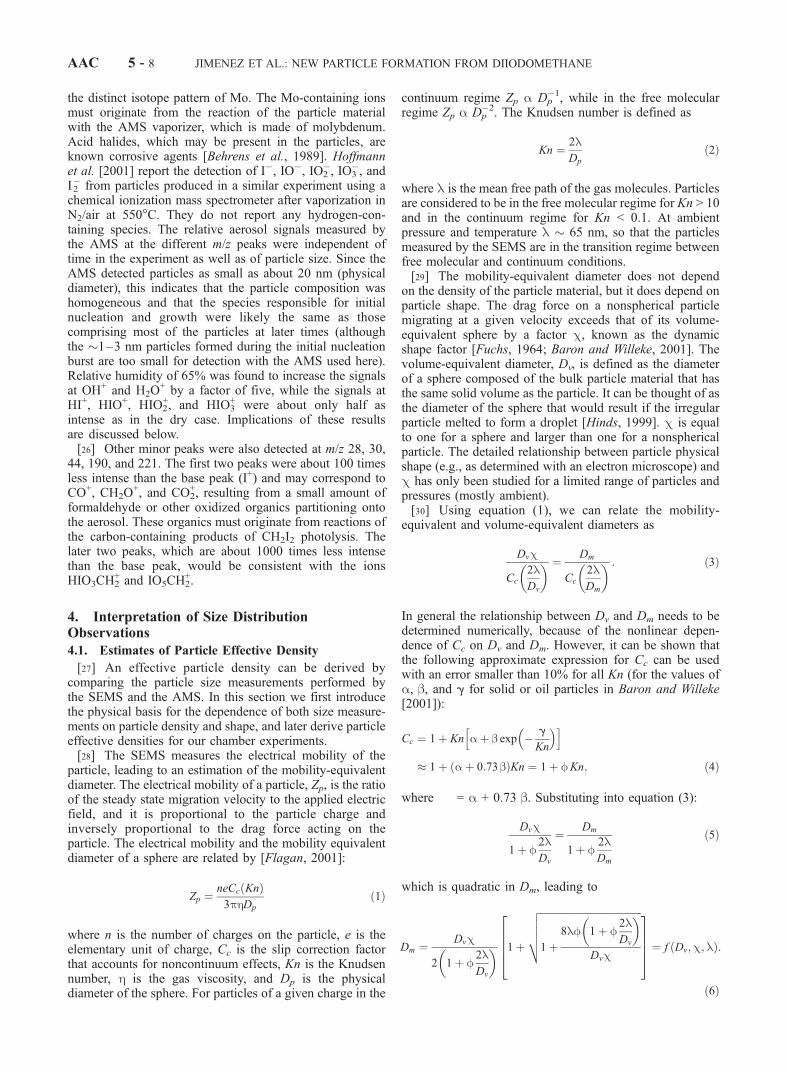
the distinct isotope pattern of Mo. The Mo-containing ionsmust originate from the reaction of the particle materialwith the AMS vaporizer, which is made of molybdenum.Acid halides, which may be present in the particles, areknown corrosive agents [Behrens et al., 1989]. Hoffmannet al. [2001] report the detection of I�, IO�, IO2
�, IO3�, and
I2� from particles produced in a similar experiment using achemical ionization mass spectrometer after vaporization inN2/air at 550�C. They do not report any hydrogen-con-taining species. The relative aerosol signals measured bythe AMS at the different m/z peaks were independent oftime in the experiment as well as of particle size. Since theAMS detected particles as small as about 20 nm (physicaldiameter), this indicates that the particle composition washomogeneous and that the species responsible for initialnucleation and growth were likely the same as thosecomprising most of the particles at later times (althoughthe �1–3 nm particles formed during the initial nucleationburst are too small for detection with the AMS used here).Relative humidity of 65% was found to increase the signalsat OH+ and H2O
+ by a factor of five, while the signals atHI+, HIO+, HIO2
+, and HIO3+ were about only half as
intense as in the dry case. Implications of these resultsare discussed below.[26] Other minor peaks were also detected at m/z 28, 30,
44, 190, and 221. The first two peaks were about 100 timesless intense than the base peak (I+) and may correspond toCO+, CH2O
+, and CO2+, resulting from a small amount of
formaldehyde or other oxidized organics partitioning ontothe aerosol. These organics must originate from reactions ofthe carbon-containing products of CH2I2 photolysis. Thelater two peaks, which are about 1000 times less intensethan the base peak, would be consistent with the ionsHIO3CH2
+ and IO5CH2+.
4. Interpretation of Size DistributionObservations
4.1. Estimates of Particle Effective Density
[27] An effective particle density can be derived bycomparing the particle size measurements performed bythe SEMS and the AMS. In this section we first introducethe physical basis for the dependence of both size measure-ments on particle density and shape, and later derive particleeffective densities for our chamber experiments.[28] The SEMS measures the electrical mobility of the
particle, leading to an estimation of the mobility-equivalentdiameter. The electrical mobility of a particle, Zp, is the ratioof the steady state migration velocity to the applied electricfield, and it is proportional to the particle charge andinversely proportional to the drag force acting on theparticle. The electrical mobility and the mobility equivalentdiameter of a sphere are related by [Flagan, 2001]:
Zp ¼neCc Knð Þ3phDp
ð1Þ
where n is the number of charges on the particle, e is theelementary unit of charge, Cc is the slip correction factorthat accounts for noncontinuum effects, Kn is the Knudsennumber, h is the gas viscosity, and Dp is the physicaldiameter of the sphere. For particles of a given charge in the
continuum regime Zp a Dp�1, while in the free molecular
regime Zp a Dp�2. The Knudsen number is defined as
Kn ¼ 2lDp
ð2Þ
where l is the mean free path of the gas molecules. Particlesare considered to be in the free molecular regime for Kn > 10and in the continuum regime for Kn < 0.1. At ambientpressure and temperature l � 65 nm, so that the particlesmeasured by the SEMS are in the transition regime betweenfree molecular and continuum conditions.[29] The mobility-equivalent diameter does not depend
on the density of the particle material, but it does depend onparticle shape. The drag force on a nonspherical particlemigrating at a given velocity exceeds that of its volume-equivalent sphere by a factor c, known as the dynamicshape factor [Fuchs, 1964; Baron and Willeke, 2001]. Thevolume-equivalent diameter, Dv, is defined as the diameterof a sphere composed of the bulk particle material that hasthe same solid volume as the particle. It can be thought of asthe diameter of the sphere that would result if the irregularparticle melted to form a droplet [Hinds, 1999]. c is equalto one for a sphere and larger than one for a nonsphericalparticle. The detailed relationship between particle physicalshape (e.g., as determined with an electron microscope) andc has only been studied for a limited range of particles andpressures (mostly ambient).[30] Using equation (1), we can relate the mobility-
equivalent and volume-equivalent diameters as
Dvc
Cc
2lDv
� � ¼ Dm
Cc
2lDm
� � : ð3Þ
In general the relationship between Dv and Dm needs to bedetermined numerically, because of the nonlinear depen-dence of Cc on Dv and Dm. However, it can be shown thatthe following approximate expression for Cc can be usedwith an error smaller than 10% for all Kn (for the values ofa, b, and g for solid or oil particles in Baron and Willeke[2001]):
Cc ¼ 1þ Kn aþ b exp � g
Kn
� �h i
� 1þ aþ 0:73 bð ÞKn ¼ 1þ fKn; ð4Þ
where � = a + 0.73 b. Substituting into equation (3):
Dvc
1þ f2lDv
¼ Dm
1þ f2lDm
ð5Þ
which is quadratic in Dm, leading to
Dm ¼ Dvc
2 1þ f2lDv
� � 1þ
ffiffiffiffiffiffiffiffiffiffiffiffiffiffiffiffiffiffiffiffiffiffiffiffiffiffiffiffiffiffiffiffiffiffiffiffiffiffiffiffiffi
1þ8lf 1þ f
2lDv
� �
Dvc
vuuut26664
37775 ¼ f ðDv;c;lÞ:
ð6Þ
AAC 5 - 8 JIMENEZ ET AL.: NEW PARTICLE FORMATION FROM DIIODOMETHANE
[31] The AMS measures the particle aerodynamic diam-eter by determining their terminal velocity after expansionfrom a pressure of about 2 mbar into vacuum. The relation-ship between the aerodynamic diameter, Da, and the vol-ume-equivalent diameter is [McMurry et al., 2002]:
D2aCc Dað Þ ¼ 1
crpr0D2
vCc Dvð Þ; ð7Þ
where rp is the density of the particle material, and r0 is theunit density (1 g cm�3). Because the mean free path at2 mbar is about 33 mm, all submicron particles are in thefree-molecular regime (Kn > 66) when acquiring a size-dependent velocity. Under these conditions we canapproximate the slip correction factor as
Cc Dð Þ ¼ 1þ Kn aþ b exp � g
Kn
� �h i� ðaþ bÞKn; ð8Þ
which leads to the following expression for the relationshipbetween aerodynamic diameter and volume-equivalentdiameter on the free-molecular regime:
Dva ¼rpr0
Dv
cv
¼rpr0
cv;invDv; ð9Þ
where we have introduced a new notation for the vacuumaerodynamic diameter (Dva) and the dynamic shape factor inthe free-molecular regime (cv), to highlight the differenceswith the more commonly used definitions of theseparameters which apply when the particles are in thetransition or continuum regimes. cv,inv is the vacuum-aerodynamic shape factor as defined for the AMS by Jayneet al. [2000]. cv,inv is the reciprocal of the dynamic shapefactor cv.[32] It is important to note that the vacuum aerodynamic
diameter measured by the AMS is different from theclassical aerodynamic diameter, which for a spherical par-ticle equals the product of the physical diameter and thesquare root of the specific gravity [Hinds, 1999]. Thisdiameter is measured when the expansion that imparts thesize-dependent velocity to the particles occurs when theparticles are in the continuum regime (Cc � 1). For examplethe TSI Aerodynamic Particle Sizer operates near 1 atm andreports the sizes of particles above �1 mm. Under theseconditions the classical aerodynamic diameter applies.[33] The effective particle density, reff is defined here as
the product of the unit density by the ratio of the vacuumaerodynamic and mobility diameters. reff would be thematerial density of a spherical particle with the samevacuum aerodynamic and mobility equivalent diameters asthe particles in our system. Combining equations (6) and(9):
reff ¼ r0Dva
Dm
¼ rpDv
cv f Dv;c;lð Þ : ð10Þ
Thus the effective particle density reported here is equal tothe material density for spherical particles. For nonsphericalparticles, the effective density is still proportional to thematerial density, but also depends on the particle shapethrough c and cv. Additional information besides Dm and
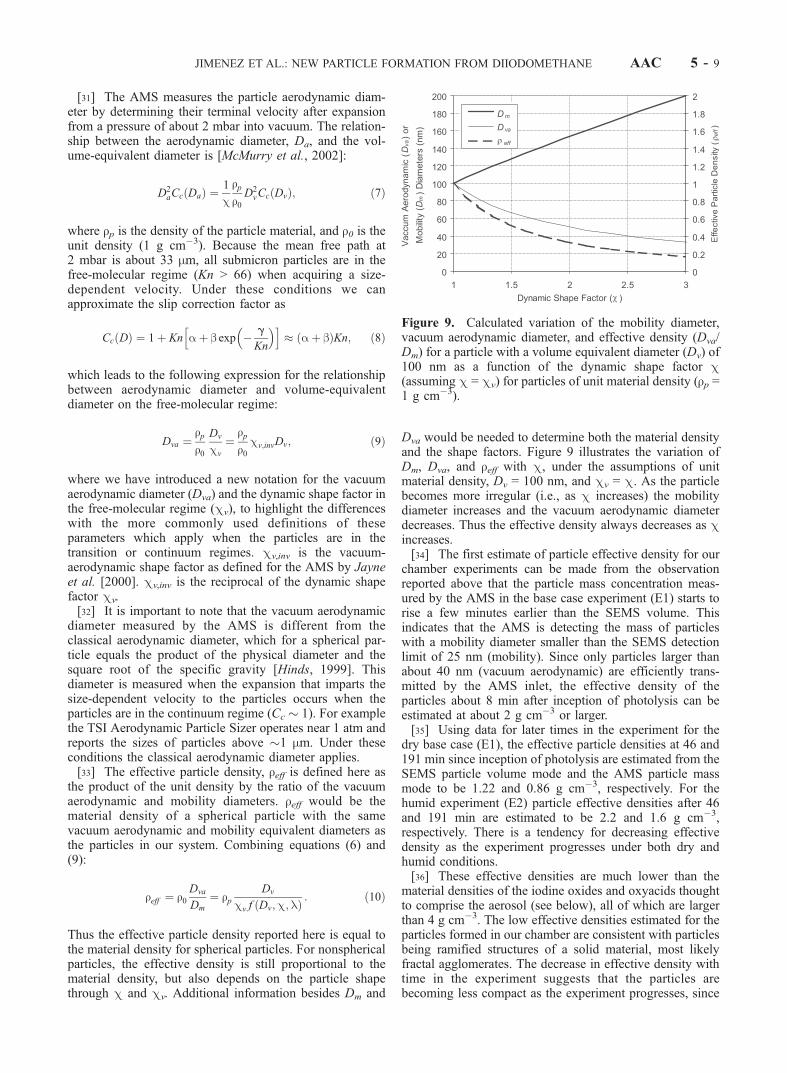
Dva would be needed to determine both the material densityand the shape factors. Figure 9 illustrates the variation ofDm, Dva, and reff with c, under the assumptions of unitmaterial density, Dv = 100 nm, and cv = c. As the particlebecomes more irregular (i.e., as c increases) the mobilitydiameter increases and the vacuum aerodynamic diameterdecreases. Thus the effective density always decreases as cincreases.[34] The first estimate of particle effective density for our
chamber experiments can be made from the observationreported above that the particle mass concentration meas-ured by the AMS in the base case experiment (E1) starts torise a few minutes earlier than the SEMS volume. Thisindicates that the AMS is detecting the mass of particleswith a mobility diameter smaller than the SEMS detectionlimit of 25 nm (mobility). Since only particles larger thanabout 40 nm (vacuum aerodynamic) are efficiently trans-mitted by the AMS inlet, the effective density of theparticles about 8 min after inception of photolysis can beestimated at about 2 g cm�3 or larger.[35] Using data for later times in the experiment for the
dry base case (E1), the effective particle densities at 46 and191 min since inception of photolysis are estimated from theSEMS particle volume mode and the AMS particle massmode to be 1.22 and 0.86 g cm�3, respectively. For thehumid experiment (E2) particle effective densities after 46and 191 min are estimated to be 2.2 and 1.6 g cm�3,respectively. There is a tendency for decreasing effectivedensity as the experiment progresses under both dry andhumid conditions.[36] These effective densities are much lower than the
material densities of the iodine oxides and oxyacids thoughtto comprise the aerosol (see below), all of which are largerthan 4 g cm�3. The low effective densities estimated for theparticles formed in our chamber are consistent with particlesbeing ramified structures of a solid material, most likelyfractal agglomerates. The decrease in effective density withtime in the experiment suggests that the particles arebecoming less compact as the experiment progresses, since
Figure 9. Calculated variation of the mobility diameter,vacuum aerodynamic diameter, and effective density (Dva/Dm) for a particle with a volume equivalent diameter (Dv) of100 nm as a function of the dynamic shape factor c(assuming c = cv) for particles of unit material density (rp =1 g cm�3).
JIMENEZ ET AL.: NEW PARTICLE FORMATION FROM DIIODOMETHANE AAC 5 - 9
the AMS indicates that the particle composition is notchanging. The higher particle effective density observedunder the humid experiment suggests that the structure hasbeen made more compact by the water present in thesystem. This conclusion is consistent with the HTDMAresults and with the decrease in the total apparent volumecalculated from the SEMS data for the humid experiment ascompared to the dry experiment.
4.2. Estimation of Particle Fractal Dimension
[37] Both the HTDMA results and the particle effectivedensity estimates suggest that the particles produced duringchamber experiments, especially those from under dryconditions, are not dense compact structures and that theymay be becoming less dense as the experiment progresses.It appears that coagulation produces agglomerates ofsmaller particles. The SEMS and AMS measurementsreveal that the aerosol volume and mass concentrationsand accompanying growth by condensation stop increasingafter about 100 to 150 min of photooxidation for experimentE1. After this time, coagulation is expected to dominateparticle growth, increasing the particle size and decreasingthe number concentration. Particle losses to the chamberwalls also contribute to the decreasing number concentra-tion, and are estimated to become the dominant lossmechanism by 7 hours after the onset of photolysis. Hencethe time between 2.5 and 5 h after the start of photolysis willbe probed to examine the role of coagulation and agglom-erate formation.[38] Growth of solid particles by coagulation often leads
to structures that exhibit similarities over a wide range ofscales. The masses of these so-called fractal structures scalewith their radius as
m � m1kr
r1
� �Df
; ð11Þ
where m1 and r1 are the mass and radius of the primaryparticles, and k is an empirically derived geometry constantof order unity [Wu and Friedlander, 1993; Sorensen andRoberts, 1997]. Thus the collision radius, r, is
r � r1m
km1
� � 1Df
ð12Þ
[39] Small values of Df indicate open, ramified structureswith large apparent volumes. For example, a linear chain ofprimary particles has a Df = 1, while Df = 3 corresponds toa solid sphere. Growth of agglomerate aerosols by Brow-nian coagulation with unit sticking probability results invalues of Df � 1.75–1.8 [Friedlander, 2000; Sorensen,2001]. This process is called diffusion-limited aggregation(DLA). Reaction limited aggregation (RLA), for Browniancoagulation with low sticking probability yields values of2.1–2.2. Higher fractal dimensions likely indicate that otherprocesses are influencing the particle structure, for example,coalescence.[40] We employ two techniques to estimate Df from the
experimental chamber data. The first method is based on theself-similar nature of the aerosol size distribution duringcoagulation. Under a wide range of collision frequency
functions, coagulation leads to a particle size distributionthat approaches an asymptotic form known as the self-preserving particle size distribution function [Friedlanderand Wang, 1966]. This distribution is expressed as y(h) =Vn(v, t)/N2, in which h = Nv/V, where h is the dimensionlessparticle volume, y is the dimensionless particle size distri-bution function, v is the particle volume (cm3), V is theparticle volume concentration (cm3 cm�3), N is the particlenumber concentration (cm�3) and n(v, t) is the particlenumber density function at time t (mm�3 cm�3). Theexistence of the self-preserving particle size distributioncan be tested by plotting the dimensionless particle sizedistribution, for example,
d N=Ntotð Þd Dp=Dp
� � ; ð13Þ
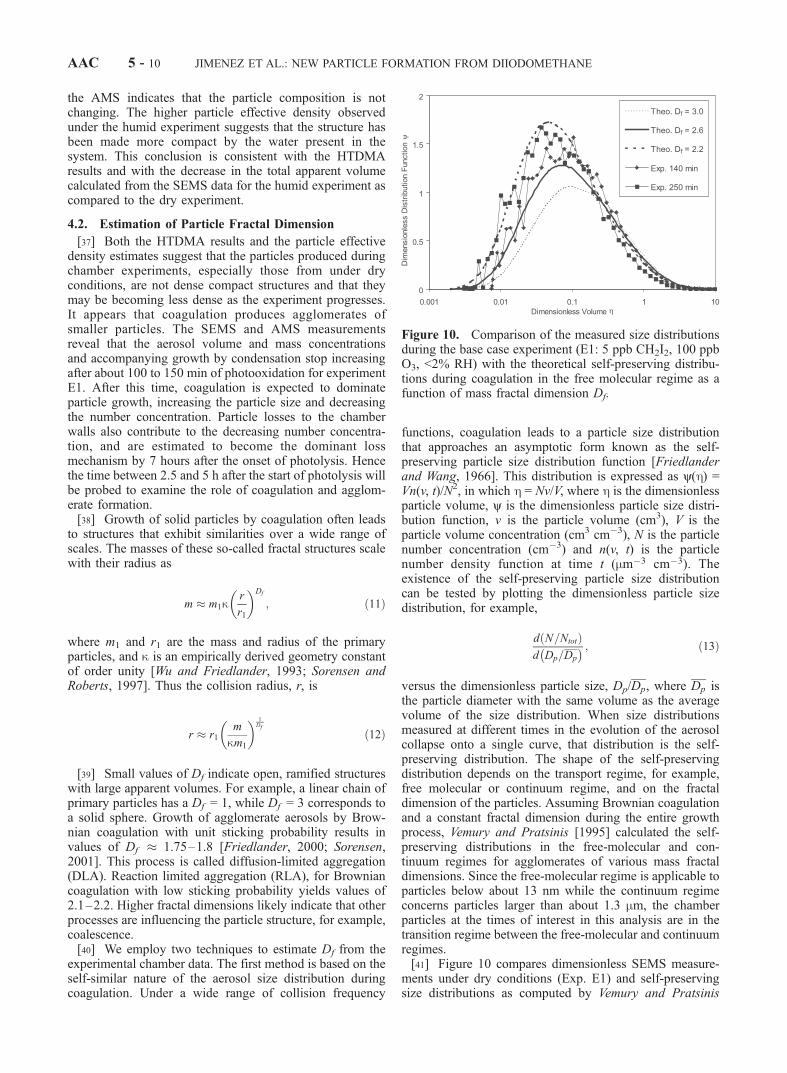
versus the dimensionless particle size, Dp/Dp, where Dp isthe particle diameter with the same volume as the averagevolume of the size distribution. When size distributionsmeasured at different times in the evolution of the aerosolcollapse onto a single curve, that distribution is the self-preserving distribution. The shape of the self-preservingdistribution depends on the transport regime, for example,free molecular or continuum regime, and on the fractaldimension of the particles. Assuming Brownian coagulationand a constant fractal dimension during the entire growthprocess, Vemury and Pratsinis [1995] calculated the self-preserving distributions in the free-molecular and con-tinuum regimes for agglomerates of various mass fractaldimensions. Since the free-molecular regime is applicable toparticles below about 13 nm while the continuum regimeconcerns particles larger than about 1.3 mm, the chamberparticles at the times of interest in this analysis are in thetransition regime between the free-molecular and continuumregimes.[41] Figure 10 compares dimensionless SEMS measure-
ments under dry conditions (Exp. E1) and self-preservingsize distributions as computed by Vemury and Pratsinis
Figure 10. Comparison of the measured size distributionsduring the base case experiment (E1: 5 ppb CH2I2, 100 ppbO3, <2% RH) with the theoretical self-preserving distribu-tions during coagulation in the free molecular regime as afunction of mass fractal dimension Df.
AAC 5 - 10 JIMENEZ ET AL.: NEW PARTICLE FORMATION FROM DIIODOMETHANE
[1995]. When coagulation is dominant, the measured sizedistributions closely approximate the self-preserving distri-bution of agglomerates in the free molecular regime with afractal dimension of �2.5. Deviations from the continuumregime distribution (not shown) are large. After �5 hours,Df appears to decrease to �2.3, probably reflecting thedevelopment of a more open agglomerate structure asparticles grow by coagulation, and consistent with the aboveobservation of reduced effective density as the experimentprogresses.[42] The size distributions observed under humid condi-
tions (Exp. E2, not shown) do not correspond to theself-preserving forms under either the free-molecular orcontinuum regimes. The difference must be due to a processother than coagulation. Wall losses are unlikely to differ sig-nificantly between dry and humid conditions. We speculatethat water vapor induces structural rearrangement on a time-scale comparable to that of coagulation, changing the coa-gulation kinetics and affecting the particle size distribution.[43] The second technique employed here allows estima-
tion of the particle fractal dimension by examining thedecay in the number concentration. Flagan and Lunden[1995] present an expression for the evolution of theaverage particle volume for an aerosol of fractal agglomer-ates at constant temperature in the free-molecular regime,which can be expressed as the relative number concentra-tion decay under those conditions as
NðtÞN0
¼ 1þ 22�n 6
5
3
2� nDf
� �t
tcoag
� � 1nDf
�32 ð14Þ
where N(t) is the number concentration at time t, N0 is theinitial number concentration, n = min (Df, 2), and tcoag isthe characteristic time for coagulation. Thus a plot of logN/N0 versus log t reveals the characteristic time forcoagulation from the break in the curve and the fractaldimension from the slope at long times. For times smallcompared to tcoag, the number concentration is close to N0.At much longer times, the number concentration decays
as t
1vDf
�32, so the slope in the log-log plot at long times reveals
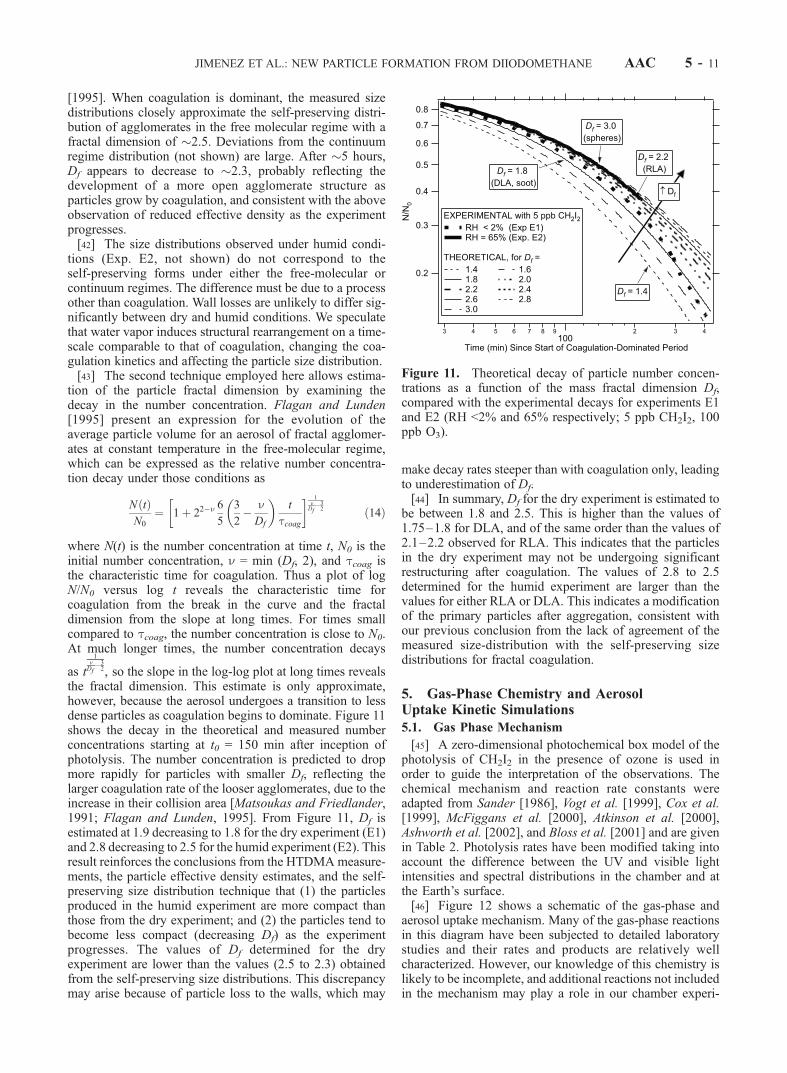
the fractal dimension. This estimate is only approximate,however, because the aerosol undergoes a transition to lessdense particles as coagulation begins to dominate. Figure 11shows the decay in the theoretical and measured numberconcentrations starting at t0 = 150 min after inception ofphotolysis. The number concentration is predicted to dropmore rapidly for particles with smaller Df, reflecting thelarger coagulation rate of the looser agglomerates, due to theincrease in their collision area [Matsoukas and Friedlander,1991; Flagan and Lunden, 1995]. From Figure 11, Df isestimated at 1.9 decreasing to 1.8 for the dry experiment (E1)and 2.8 decreasing to 2.5 for the humid experiment (E2). Thisresult reinforces the conclusions from the HTDMAmeasure-ments, the particle effective density estimates, and the self-preserving size distribution technique that (1) the particlesproduced in the humid experiment are more compact thanthose from the dry experiment; and (2) the particles tend tobecome less compact (decreasing Df) as the experimentprogresses. The values of Df determined for the dryexperiment are lower than the values (2.5 to 2.3) obtainedfrom the self-preserving size distributions. This discrepancymay arise because of particle loss to the walls, which may
make decay rates steeper than with coagulation only, leadingto underestimation of Df.[44] In summary, Df for the dry experiment is estimated to
be between 1.8 and 2.5. This is higher than the values of1.75–1.8 for DLA, and of the same order than the values of2.1–2.2 observed for RLA. This indicates that the particlesin the dry experiment may not be undergoing significantrestructuring after coagulation. The values of 2.8 to 2.5determined for the humid experiment are larger than thevalues for either RLA or DLA. This indicates a modificationof the primary particles after aggregation, consistent withour previous conclusion from the lack of agreement of themeasured size-distribution with the self-preserving sizedistributions for fractal coagulation.
5. Gas-Phase Chemistry and AerosolUptake Kinetic Simulations
5.1. Gas Phase Mechanism
[45] A zero-dimensional photochemical box model of thephotolysis of CH2I2 in the presence of ozone is used inorder to guide the interpretation of the observations. Thechemical mechanism and reaction rate constants wereadapted from Sander [1986], Vogt et al. [1999], Cox et al.[1999], McFiggans et al. [2000], Atkinson et al. [2000],Ashworth et al. [2002], and Bloss et al. [2001] and are givenin Table 2. Photolysis rates have been modified taking intoaccount the difference between the UV and visible lightintensities and spectral distributions in the chamber and atthe Earth’s surface.[46] Figure 12 shows a schematic of the gas-phase and
aerosol uptake mechanism. Many of the gas-phase reactionsin this diagram have been subjected to detailed laboratorystudies and their rates and products are relatively wellcharacterized. However, our knowledge of this chemistry islikely to be incomplete, and additional reactions not includedin the mechanism may play a role in our chamber experi-
Figure 11. Theoretical decay of particle number concen-trations as a function of the mass fractal dimension Df,compared with the experimental decays for experiments E1and E2 (RH <2% and 65% respectively; 5 ppb CH2I2, 100ppb O3).
JIMENEZ ET AL.: NEW PARTICLE FORMATION FROM DIIODOMETHANE AAC 5 - 11
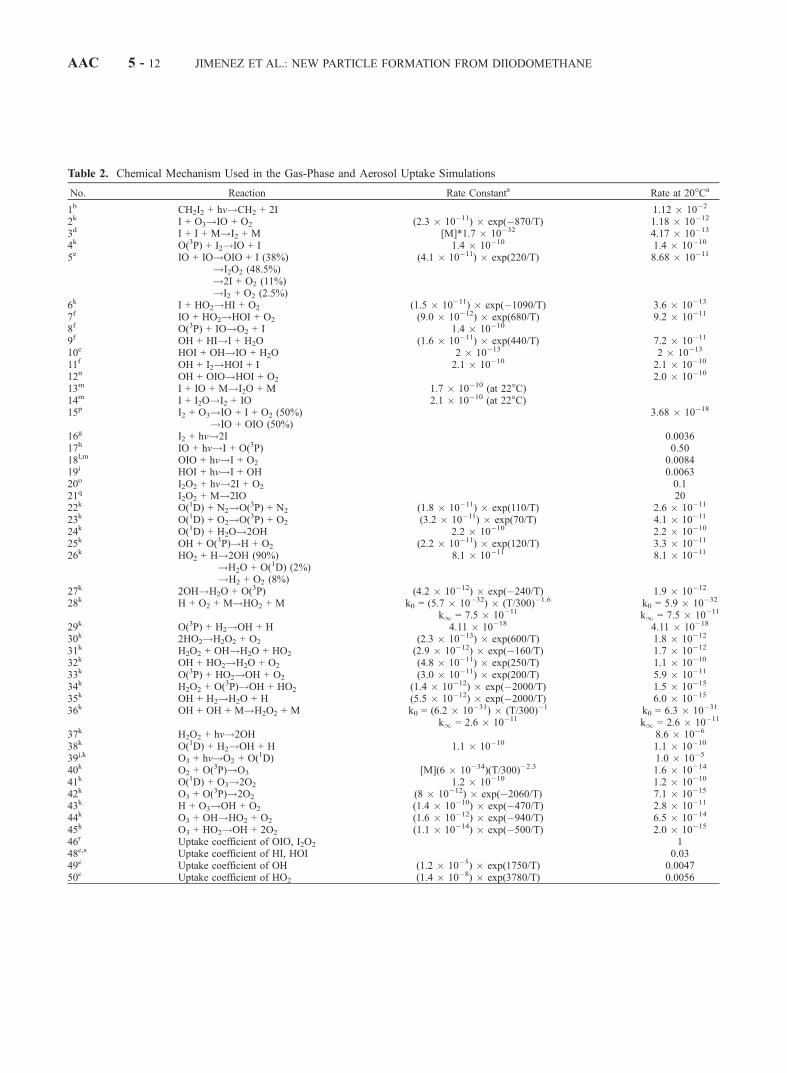
Table 2. Chemical Mechanism Used in the Gas-Phase and Aerosol Uptake Simulations
No. Reaction Rate Constanta Rate at 20�Ca
1b CH2I2 + hv!CH2 + 2I 1.12 � 10�2
2k I + O3!IO + O2 (2.3 � 10�11) � exp(�870/T) 1.18 � 10�12
3d I + I + M!I2 + M [M]*1.7 � 10�32 4.17 � 10�13
4k O(3P) + I2!IO + I 1.4 � 10�10 1.4 � 10�10
5e IO + IO!OIO + I (38%)!I2O2 (48.5%)!2I + O2 (11%)!I2 + O2 (2.5%)
(4.1 � 10�11) � exp(220/T) 8.68 � 10�11
6k I + HO2!HI + O2 (1.5 � 10�11) � exp(�1090/T) 3.6 � 10�13
7f IO + HO2!HOI + O2 (9.0 � 10�12) � exp(680/T) 9.2 � 10�11
8f O(3P) + IO!O2 + I 1.4 � 10�10
9f OH + HI!I + H2O (1.6 � 10�11) � exp(440/T) 7.2 � 10�11
10c HOI + OH!IO + H2O 2 � 10�13 2 � 10�13
11f OH + I2!HOI + I 2.1 � 10�10 2.1 � 10�10
12n OH + OIO!HOI + O2 2.0 � 10�10
13m I + IO + M!I2O + M 1.7 � 10�10 (at 22�C)14m I + I2O!I2 + IO 2.1 � 10�10 (at 22�C)15p I2 + O3!IO + I + O2 (50%)
!IO + OIO (50%)3.68 � 10�18
16g I2 + hv!2I 0.003617h IO + hv!I + O(3P) 0.5018l,m OIO + hv!I + O2 0.008419i HOI + hv!I + OH 0.006320o I2O2 + hv!2I + O2 0.121q I2O2 + M!2IO 2022k O(1D) + N2!O(3P) + N2 (1.8 � 10�11) � exp(110/T) 2.6 � 10�11
23k O(1D) + O2!O(3P) + O2 (3.2 � 10�11) � exp(70/T) 4.1 � 10�11
24k O(1D) + H2O!2OH 2.2 � 10�10 2.2 � 10�10
25k OH + O(3P)!H + O2 (2.2 � 10�11) � exp(120/T) 3.3 � 10�11
26k HO2 + H!2OH (90%)!H2O + O(1D) (2%)!H2 + O2 (8%)
8.1 � 10�11 8.1 � 10�11
27k 2OH!H2O + O(3P) (4.2 � 10�12) � exp(�240/T) 1.9 � 10�12
28k H + O2 + M!HO2 + M k0 = (5.7 � 10�32) � (T/300)�1.6 k0 = 5.9 � 10�32
k1 = 7.5 � 10�11 k1 = 7.5 � 10�11
29k O(3P) + H2!OH + H 4.11 � 10�18 4.11 � 10�18
30k 2HO2!H2O2 + O2 (2.3 � 10�13) � exp(600/T) 1.8 � 10�12
31k H2O2 + OH!H2O + HO2 (2.9 � 10�12) � exp(�160/T) 1.7 � 10�12
32k OH + HO2!H2O + O2 (4.8 � 10�11) � exp(250/T) 1.1 � 10�10
33k O(3P) + HO2!OH + O2 (3.0 � 10�11) � exp(200/T) 5.9 � 10�11
34k H2O2 + O(3P)!OH + HO2 (1.4 � 10�12) � exp(�2000/T) 1.5 � 10�15
35k OH + H2!H2O + H (5.5 � 10�12) � exp(�2000/T) 6.0 � 10�15
36k OH + OH + M!H2O2 + M k0 = (6.2 � 10�31) � (T/300)�1 k0 = 6.3 � 10�31
k1 = 2.6 � 10�11 k1 = 2.6 � 10�11
37k H2O2 + hv!2OH 8.6 � 10�6
38k O(1D) + H2!OH + H 1.1 � 10�10 1.1 � 10�10
39j,k O3 + hv!O2 + O(1D) 1.0 � 10�5
40k O2 + O(3P)!O3 [M](6 � 10�34)(T/300)�2.3 1.6 � 10�14
41k O(1D) + O3!2O2 1.2 � 10�10 1.2 � 10�10
42k O3 + O(3P)!2O2 (8 � 10�12) � exp(�2060/T) 7.1 � 10�15
43k H + O3!OH + O2 (1.4 � 10�10) � exp(�470/T) 2.8 � 10�11
44k O3 + OH!HO2 + O2 (1.6 � 10�12) � exp(�940/T) 6.5 � 10�14
45k O3 + HO2!OH + 2O2 (1.1 � 10�14) � exp(�500/T) 2.0 � 10�15
46r Uptake coefficient of OIO, I2O2 148c,s Uptake coefficient of HI, HOI 0.0349c Uptake coefficient of OH (1.2 � 10�5) � exp(1750/T) 0.004750c Uptake coefficient of HO2 (1.4 � 10�8) � exp(3780/T) 0.0056
AAC 5 - 12 JIMENEZ ET AL.: NEW PARTICLE FORMATION FROM DIIODOMETHANE
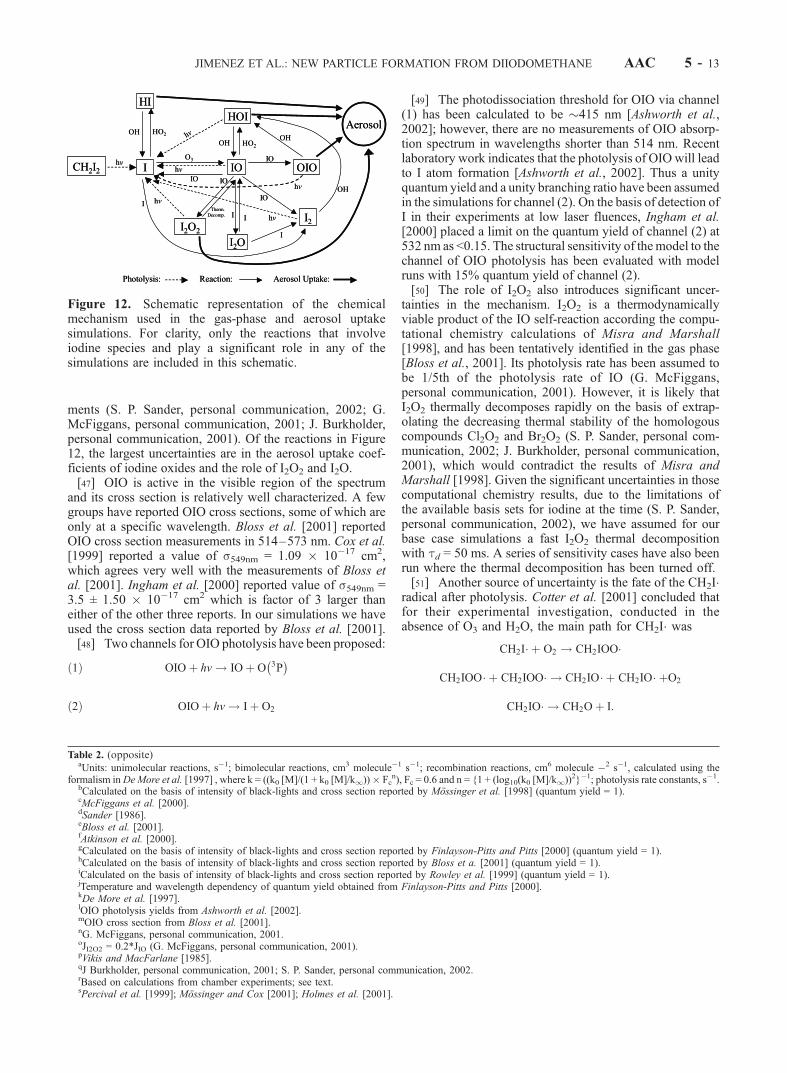
ments (S. P. Sander, personal communication, 2002; G.McFiggans, personal communication, 2001; J. Burkholder,personal communication, 2001). Of the reactions in Figure12, the largest uncertainties are in the aerosol uptake coef-ficients of iodine oxides and the role of I2O2 and I2O.[47] OIO is active in the visible region of the spectrum
and its cross section is relatively well characterized. A fewgroups have reported OIO cross sections, some of which areonly at a specific wavelength. Bloss et al. [2001] reportedOIO cross section measurements in 514–573 nm. Cox et al.[1999] reported a value of s549nm = 1.09 � 10�17 cm2,which agrees very well with the measurements of Bloss etal. [2001]. Ingham et al. [2000] reported value of s549nm =3.5 ± 1.50 � 10�17 cm2 which is factor of 3 larger thaneither of the other three reports. In our simulations we haveused the cross section data reported by Bloss et al. [2001].[48] Two channels for OIO photolysis have been proposed:
OIOþ hv ! IOþ O 3P� �
ð1Þ
OIOþ hv ! Iþ O2ð2Þ
[49] The photodissociation threshold for OIO via channel(1) has been calculated to be �415 nm [Ashworth et al.,2002]; however, there are no measurements of OIO absorp-tion spectrum in wavelengths shorter than 514 nm. Recentlaboratory work indicates that the photolysis of OIO will leadto I atom formation [Ashworth et al., 2002]. Thus a unityquantum yield and a unity branching ratio have been assumedin the simulations for channel (2). On the basis of detection ofI in their experiments at low laser fluences, Ingham et al.[2000] placed a limit on the quantum yield of channel (2) at532 nm as <0.15. The structural sensitivity of themodel to thechannel of OIO photolysis has been evaluated with modelruns with 15% quantum yield of channel (2).[50] The role of I2O2 also introduces significant uncer-
tainties in the mechanism. I2O2 is a thermodynamicallyviable product of the IO self-reaction according the compu-tational chemistry calculations of Misra and Marshall[1998], and has been tentatively identified in the gas phase[Bloss et al., 2001]. Its photolysis rate has been assumed tobe 1/5th of the photolysis rate of IO (G. McFiggans,personal communication, 2001). However, it is likely thatI2O2 thermally decomposes rapidly on the basis of extrap-olating the decreasing thermal stability of the homologouscompounds Cl2O2 and Br2O2 (S. P. Sander, personal com-munication, 2002; J. Burkholder, personal communication,2001), which would contradict the results of Misra andMarshall [1998]. Given the significant uncertainties in thosecomputational chemistry results, due to the limitations ofthe available basis sets for iodine at the time (S. P. Sander,personal communication, 2002), we have assumed for ourbase case simulations a fast I2O2 thermal decompositionwith td = 50 ms. A series of sensitivity cases have also beenrun where the thermal decomposition has been turned off.[51] Another source of uncertainty is the fate of the CH2I�
radical after photolysis. Cotter et al. [2001] concluded thatfor their experimental investigation, conducted in theabsence of O3 and H2O, the main path for CH2I� was
CH2I� þ O2 ! CH2IOO�
CH2IOO� þ CH2IOO� ! CH2IO� þ CH2IO� þO2
CH2IO� ! CH2Oþ I:
Table 2. (opposite)aUnits: unimolecular reactions, s�1; bimolecular reactions, cm3 molecule�1 s�1; recombination reactions, cm6 molecule �2 s�1, calculated using the
formalism inDeMore et al. [1997] , where k = ((k0 [M]/(1 + k0 [M]/k1))� Fcn), Fc = 0.6 and n = {1 + (log10(k0 [M]/k1))2}�1; photolysis rate constants, s�1.
bCalculated on the basis of intensity of black-lights and cross section reported by Mossinger et al. [1998] (quantum yield = 1).cMcFiggans et al. [2000].dSander [1986].eBloss et al. [2001].fAtkinson et al. [2000].gCalculated on the basis of intensity of black-lights and cross section reported by Finlayson-Pitts and Pitts [2000] (quantum yield = 1).hCalculated on the basis of intensity of black-lights and cross section reported by Bloss et a. [2001] (quantum yield = 1).iCalculated on the basis of intensity of black-lights and cross section reported by Rowley et al. [1999] (quantum yield = 1).jTemperature and wavelength dependency of quantum yield obtained from Finlayson-Pitts and Pitts [2000].kDe More et al. [1997].lOIO photolysis yields from Ashworth et al. [2002].mOIO cross section from Bloss et al. [2001].nG. McFiggans, personal communication, 2001.oJI2O2 = 0.2*JIO (G. McFiggans, personal communication, 2001).pVikis and MacFarlane [1985].qJ Burkholder, personal communication, 2001; S. P. Sander, personal communication, 2002.rBased on calculations from chamber experiments; see text.sPercival et al. [1999]; Mossinger and Cox [2001]; Holmes et al. [2001].
Figure 12. Schematic representation of the chemicalmechanism used in the gas-phase and aerosol uptakesimulations. For clarity, only the reactions that involveiodine species and play a significant role in any of thesimulations are included in this schematic.
JIMENEZ ET AL.: NEW PARTICLE FORMATION FROM DIIODOMETHANE AAC 5 - 13
[52] In the chamber, reactions with other species maycompete with self-reaction of the peroxy radical. In ourmechanism we have assumed that I is eventually releasedinto the gas phase in a timescale that is short compared tothat of CH2I2 photolysis. The formaldehyde produced willeither photolyze or react with OH to yield CO, H2, HO2, andH2O as final products [Seinfeld and Pandis, 1998]. A smallfraction may partition onto the aerosol [Jacob, 2000].[53] Finally, it is possible that the gas-phase I2 formed
participates in the aerosol growth. I2 is a solid with highvapor pressure (�0.2 Torr) at 20�C. The mechanism pre-dicts that most of the I atoms will form I2 when CH2I2 isphotolyzed in the absence of O3. However, no particleswere formed in the experiments under these conditions,from which we conclude that I2 is not responsible fornucleation in this system. It is possible in principle that I2does condense on the particles after nucleation, and we haveincluded this possibility as a mechanism variation study.
5.2. Aerosol Uptake Modeling
[54] For the purposes of calculating uptake of gas-phasespecies, the aerosol is represented in a semiempiricalmanner. Rather than trying to model particle nucleationand growth from first principles, we use the experimentallydetermined time-dependent size distribution as a basis forthe calculations. Uptake of gas phase species (OIO, I2O2,HI, HOI, OH, and HO2) onto the aerosol is calculated withthe transition regime mass transfer formulation of Dahneke[Seinfeld and Pandis, 1998]:
J ¼ Jc1þ Kn
1þ 2Kn 1þ Knð Þ=a ; ð15Þ
where J is the molecular flux (molec. s�1) of the condensingspecies for a given particle, a is the uptake coefficient of thespecies on the particle, Kn is the Knudsen number of theparticle, defined in this formulation as
Kn ¼ 4Dg
cADP
; ð16Þ
where Dg is the diffusion coefficient of the condensablespecies in air, cA is its average molecular velocity, and Jc isthe molecular flux in the continuum regime,
Jc ¼ 4pRpDg c1 � csð Þ; ð17Þ
where Rp is the particle radius, and c1 and cs are theconcentrations of the species in the bulk gas and at theparticle surface, respectively. For the simulations in thispaper, cs is assumed to be zero, and Dg is estimated for eachspecies on the basis of the diffusivity of molecules ofsimilar size and molecular weight in air. Then, equation (15)is integrated over the time-varying measured particle sizedistribution for each experiment.[55] No modification is needed to account for the influ-
ence of the fractal nature of the particles of the uptake of gas-phase species. Rogak et al. [1991] showed that spheres andagglomerates with the same mobility diameter have the sameuptake rates of 1.5 nm lead clusters, which they used as asurrogate for a gas-phase species. Since the SEMS measuresthe mobility-equivalent diameter of the fractal particles, theuptake on the present particles will be the same as onspherical particles with the same mobility distribution. Thus
equations (15) and (17) can be applied directly to theexperimentally determined mobility distribution.[56] The key parameter for the gas-to-particle mass trans-
fer is the uptake coefficient a of each species. McFiggans etal. [2000] estimated uptake coefficients of the order of 0.03for HI, HOI, OIO, and I2O2 onto aqueous aerosol, by tuningthose values in their model of iodine chemistry in themarine boundary layer to optimize the agreement of avail-able measurements. Studies of aerosol uptake of HOI andHI on ice, sodium halide salts, or sulfuric acid indicateuptake coefficients larger than 0.01 [Percival et al., 1999;Holmes et al., 2001; Mossinger and Cox, 2001]. However,such low uptake coefficients are not consistent with theobserved particle growth in the chamber immediately afternucleation. The molecular flux, Jk (molec. s�1) that can besupplied to a dense spherical particle in the free-molecularregime is [Seinfeld and Pandis, 1998]
Jk ¼ pR2pcAa c1 � csð Þ: ð18Þ
Applying equation (18) to the first 10 s of nucleation in thebase case (E1 and S1), Rp = 1.5 nm, cA = 200 m s�1, a =0.036, c1 = 0.18 ppb OIO (from the simulations), and cs =0, we obtain a flux of 0.24 molec. s�1. If we assume that theparticles detected by the CPC 3025 at that time have a sizeof 3 nm and are composed of pure OIO with the density ofI2O4 (4.2 g cm�3), a flux of about 22 molec. s�1 is neededto explain the rate of the observed nucleation burst. In orderfor both estimates to produce uptake rates of the same order-of-magnitude, the uptake coefficient needs to be of the orderof 1 for whichever species is responsible for the initialnucleation burst. On the basis of this constraint, we assumein our model that uptake coefficients for OIO and I2O2 are1.0, that is, that every collision of a gas-phase molecule ofthose species with a particle results in the incorporation ofthe molecule into the particle, while the uptake coefficientsof HOI and HI are assumed to be 0.03. Since the AMSindicates that the composition of the particles does notchange during the experiment or with particle size, weassume here that the uptake coefficients for all iodinespecies that partition into the aerosol do not change either.
5.3. Kinetic Simulations: Major Pathsand Timescale Analysis
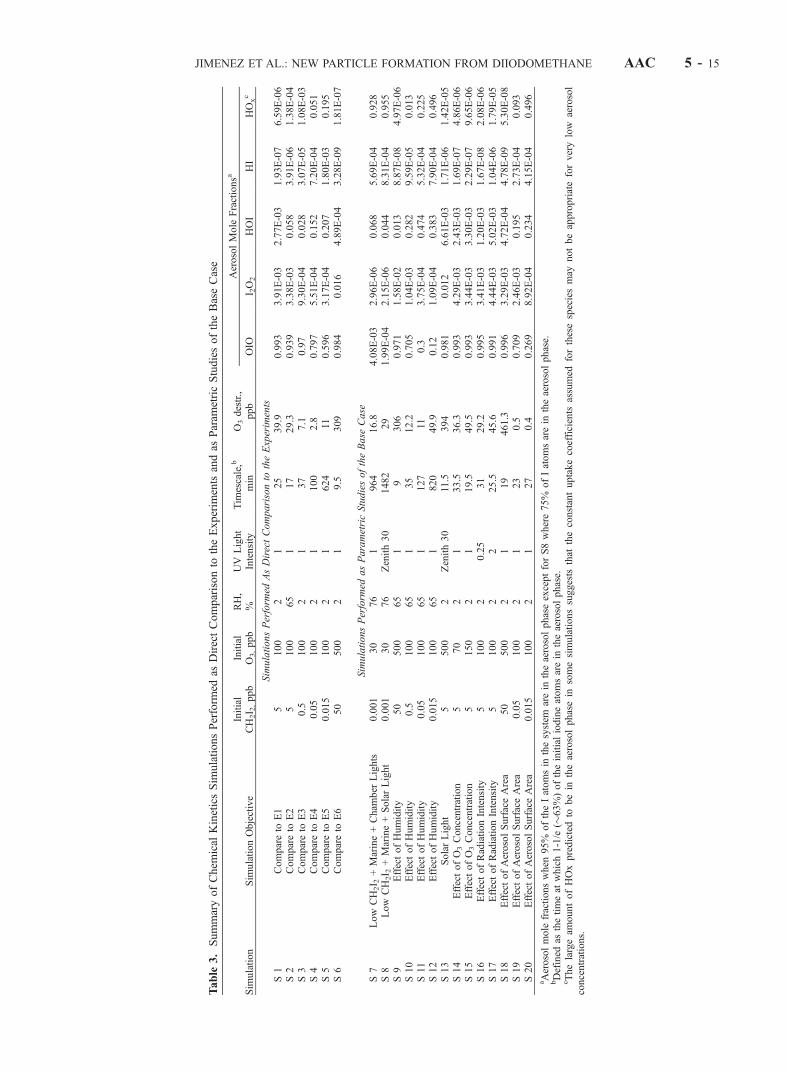
[57] The mechanism predicts that none of the iodine-containing species considered in the literature as susceptibleto being taken up into the aerosol (OIO, I2O2, HI, and HOI)is formed when either O3 or UV radiation is not present.This prediction is consistent with the lack of aerosolformation under these experimental conditions. The casessimulated and the main results are summarized in Tables 3and 4. We have chosen a base case simulation (S1) withinitial gas-phase CH2I2 and O3 mixing ratios of 5 and100 ppb, respectively, and 2% RH, corresponding to thebase case chamber experiment (E1). The predicted concen-trations of iodine-containing species for case S1 versus timeare shown in Figure 13.[58] We illustrate the importance and relative speed of the
different chemical paths with a timescale analysis here.Only the photolysis reactions have a fixed timescale, whilemolecule-molecule reactions as well as uptake processeschange in time as functions of the concentrations of theother reactant, and the particle size distribution, respec-
AAC 5 - 14 JIMENEZ ET AL.: NEW PARTICLE FORMATION FROM DIIODOMETHANE
Table
3.SummaryofChem
ical
KineticsSim
ulationsPerform
edas
DirectComparisonto
theExperim
entsandas
Param
etricStudiesoftheBaseCase
Sim
ulation
Sim
ulationObjective
Initial
CH2I 2,ppb
Initial
O3,ppb
RH,
%UV
Light
Intensity
Tim
escale,b
min
O3destr.,
ppb
AerosolMole
Fractionsa
OIO
I 2O2
HOI
HI
HOxc
SimulationsPerform
edAsDirectComparisonto
theExperiments
S1
Compareto
E1
5100
21
25
39.9
0.993
3.91E-03
2.77E-03
1.93E-07
6.59E-06
S2
Compareto
E2
5100
65
117
29.3
0.939
3.38E-03
0.058
3.91E-06
1.38E-04
S3
Compareto
E3
0.5
100
21
37
7.1
0.97
9.30E-04
0.028
3.07E-05
1.08E-03
S4
Compareto
E4
0.05
100
21
100
2.8
0.797
5.51E-04
0.152
7.20E-04
0.051
S5
Compareto
E5
0.015
100
21
624
110.596
3.17E-04
0.207
1.80E-03
0.195
S6
Compareto
E6
50
500
21
9.5
309
0.984
0.016
4.89E-04
3.28E-09
1.81E-07
SimulationsPerform
edasParametricStudiesoftheBase
Case
S7
Low
CH2I 2
+Marine+Cham
ber
Lights
0.001
30
76
1964
16.8
4.08E-03
2.96E-06
0.068
5.69E-04
0.928
S8
Low
CH2I 2
+Marine+SolarLight
0.001
30
76
Zenith30
1482
29
1.99E-04
2.15E-06
0.044
8.31E-04
0.955
S9
EffectofHumidity
50
500
65
19
306
0.971
1.58E-02
0.013
8.87E-08
4.97E-06
S10
EffectofHumidity
0.5
100
65
135
12.2
0.705
1.04E-03
0.282
9.59E-05
0.013
S11
EffectofHumidity
0.05
100
65
1127
110.3
3.75E-04
0.474
5.32E-04
0.225
S12
EffectofHumidity
0.015
100
65
1820
49.9
0.12
1.09E-04
0.383
7.90E-04
0.496
S13
SolarLight
5500
2Zenith30
11.5
394
0.981
0.012
6.61E-03
1.71E-06
1.42E-05
S14
EffectofO3Concentration
570
21
33.5
36.3
0.993
4.29E-03
2.43E-03
1.69E-07
4.86E-06
S15
EffectofO3Concentration
5150
21
19.5
49.5
0.993
3.44E-03
3.30E-03
2.29E-07
9.65E-06
S16
EffectofRadiationIntensity
5100
20.25
31
29.2
0.995
3.41E-03
1.20E-03
1.67E-08
2.08E-06
S17
EffectofRadiationIntensity
5100
22
25.5
45.6
0.991
4.44E-03
5.02E-03
1.04E-06
1.79E-05
S18
EffectofAerosolSurfaceArea
50
500
21
19
461.3
0.996
3.29E-03
4.72E-04
4.78E-09
5.30E-08
S19
EffectofAerosolSurfaceArea
0.05
100
21
23
0.5
0.709
2.46E-03
0.195
2.73E-04
0.093
S20
EffectofAerosolSurfaceArea
0.015
100
21
27
0.4
0.269
8.92E-04
0.234
4.15E-04
0.496
aAerosolmole
fractionswhen
95%
oftheIatomsin
thesystem
arein
theaerosolphaseexceptforS8where75%
ofIatomsarein
theaerosolphase.
bDefined
asthetimeat
which1-1/e
(�63%)oftheinitialiodineatomsarein
theaerosolphase.
cThelargeam
ountofHOxpredictedto
bein
theaerosolphasein
somesimulationssuggests
that
theconstantuptakecoefficients
assumed
forthesespeciesmay
notbeappropriateforverylow
aerosol
concentrations.
JIMENEZ ET AL.: NEW PARTICLE FORMATION FROM DIIODOMETHANE AAC 5 - 15
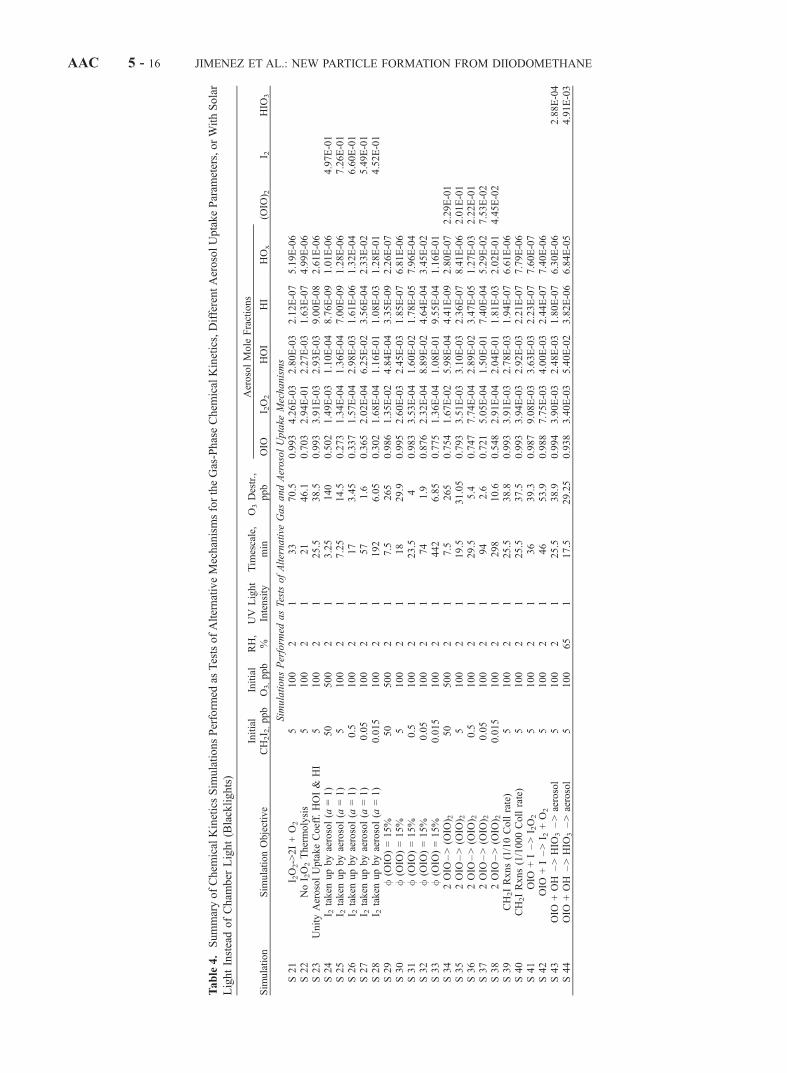
Table4.SummaryofChem
icalKineticsSim
ulationsPerform
edas
TestsofAlternativeMechanismsfortheGas-PhaseChem
icalKinetics,DifferentAerosolUptakeParam
eters,orWithSolar
LightInsteadofCham
ber
Light(Blacklights)
Sim
ulation
Sim
ulationObjective
Initial
CH2I 2,ppb
Initial
O3,ppb
RH,
%UV
Light
Intensity
Tim
escale,
min
O3Destr.,
ppb
AerosolMole
Fractions
OIO
I 2O2
HOI
HI
HOx
(OIO
) 2I 2
HIO
3
SimulationsPerform
edasTestsofAlternative
GasandAerosolUptake
Mechanisms
S21
I 2O2->2I+O2
5100
21
33
70.5
0.993
4.26E-03
2.80E-03
2.12E-07
5.19E-06
S22
NoI 2O2Thermolysis
5100
21
21
46.1
0.703
2.94E-01
2.27E-03
1.63E-07
4.99E-06
S23
UnityAerosolUptakeCoeff.HOI&
HI
5100
21
25.5
38.5
0.993
3.91E-03
2.93E-03
9.00E-08
2.61E-06
S24
I 2taken
upbyaerosol(a
=1)
50
500
21
3.25
140
0.502
1.49E-03
1.10E-04
8.76E-09
1.01E-06
4.97E-01
S25
I 2taken
upbyaerosol(a
=1)
5100
21
7.25
14.5
0.273
1.34E-04
1.36E-04
7.00E-09
1.28E-06
7.26E-01
S26
I 2taken
upbyaerosol(a
=1)
0.5
100
21
17
3.45
0.337
1.57E-04
2.98E-03
1.61E-06
1.32E-04
6.60E-01
S27
I 2taken
upbyaerosol(a
=1)
0.05
100
21
57
1.6
0.365
2.02E-04
6.25E-02
3.56E-04
2.33E-02
5.49E-01
S28
I 2taken
upbyaerosol(a
=1)
0.015
100
21
192
6.05
0.302
1.68E-04
1.16E-01
1.08E-03
1.28E-01
4.52E-01
S29
f(O
IO)=15%
50
500
21
7.5
265
0.986
1.35E-02
4.84E-04
3.35E-09
2.26E-07
S30
f(O
IO)=15%
5100
21
18
29.9
0.995
2.60E-03
2.45E-03
1.85E-07
6.81E-06
S31
f(O
IO)=15%
0.5
100
21
23.5
40.983
3.53E-04
1.60E-02
1.78E-05
7.96E-04
S32
f(O
IO)=15%
0.05
100
21
74
1.9
0.876
2.32E-04
8.89E-02
4.64E-04
3.45E-02
S33
f(O
IO)=15%
0.015
100
21
442
6.85
0.775
1.36E-04
1.08E-01
9.55E-04
1.16E-01
S34
2OIO
–>(O
IO) 2
50
500
21
7.5
265
0.754
1.67E-02
5.98E-04
4.41E-09
2.80E-07
2.29E-01
S35
2OIO
–>(O
IO) 2
5100
21
19.5
31.05
0.793
3.51E-03
3.10E-03
2.36E-07
8.41E-06
2.01E-01
S36
2OIO
–>(O
IO) 2
0.5
100
21
29.5
5.4
0.747
7.74E-04
2.89E-02
3.47E-05
1.27E-03
2.22E-01
S37
2OIO
–>(O
IO) 2
0.05
100
21
94
2.6
0.721
5.05E-04
1.50E-01
7.40E-04
5.29E-02
7.53E-02
S38
2OIO
–>(O
IO) 2
0.015
100
21
298
10.6
0.548
2.91E-04
2.04E-01
1.81E-03
2.02E-01
4.45E-02
S39
CH2IRxns(1/10Collrate)
5100
21
25.5
38.8
0.993
3.91E-03
2.78E-03
1.94E-07
6.61E-06
S40
CH2IRxns(1/1000Collrate)
5100
21
25.5
37.5
0.993
3.94E-03
2.92E-03
2.21E-07
7.79E-06
S41
OIO
+I–>I 2O2
5100
21
36
39.3
0.987
9.08E-03
3.63E-03
2.23E-07
7.60E-07
S42
OIO
+I–>I 2
+O2
5100
21
46
53.9
0.988
7.75E-03
4.00E-03
2.44E-07
7.40E-06
S43
OIO
+OH
–>HIO
3–>aerosol
5100
21
25.5
38.9
0.994
3.90E-03
2.48E-03
1.80E-07
6.30E-06
2.88E-04
S44
OIO
+OH
–>HIO
3–>aerosol
5100
65
117.5
29.25
0.938
3.40E-03
5.40E-02
3.82E-06
6.84E-05
4.91E-03
AAC 5 - 16 JIMENEZ ET AL.: NEW PARTICLE FORMATION FROM DIIODOMETHANE
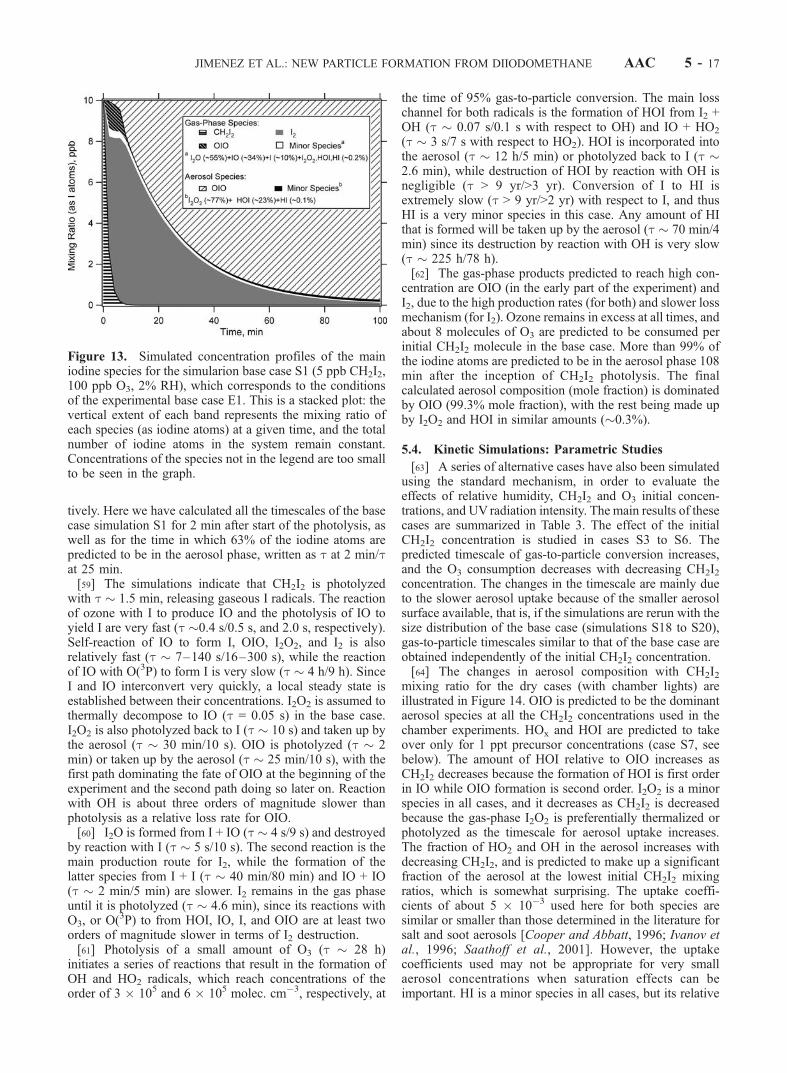
tively. Here we have calculated all the timescales of the basecase simulation S1 for 2 min after start of the photolysis, aswell as for the time in which 63% of the iodine atoms arepredicted to be in the aerosol phase, written as t at 2 min/tat 25 min.[59] The simulations indicate that CH2I2 is photolyzed
with t � 1.5 min, releasing gaseous I radicals. The reactionof ozone with I to produce IO and the photolysis of IO toyield I are very fast (t �0.4 s/0.5 s, and 2.0 s, respectively).Self-reaction of IO to form I, OIO, I2O2, and I2 is alsorelatively fast (t � 7–140 s/16–300 s), while the reactionof IO with O(3P) to form I is very slow (t � 4 h/9 h). SinceI and IO interconvert very quickly, a local steady state isestablished between their concentrations. I2O2 is assumed tothermally decompose to IO (t = 0.05 s) in the base case.I2O2 is also photolyzed back to I (t � 10 s) and taken up bythe aerosol (t � 30 min/10 s). OIO is photolyzed (t � 2min) or taken up by the aerosol (t � 25 min/10 s), with thefirst path dominating the fate of OIO at the beginning of theexperiment and the second path doing so later on. Reactionwith OH is about three orders of magnitude slower thanphotolysis as a relative loss rate for OIO.[60] I2O is formed from I + IO (t � 4 s/9 s) and destroyed
by reaction with I (t � 5 s/10 s). The second reaction is themain production route for I2, while the formation of thelatter species from I + I (t � 40 min/80 min) and IO + IO(t � 2 min/5 min) are slower. I2 remains in the gas phaseuntil it is photolyzed (t � 4.6 min), since its reactions withO3, or O(
3P) to from HOI, IO, I, and OIO are at least twoorders of magnitude slower in terms of I2 destruction.[61] Photolysis of a small amount of O3 (t � 28 h)
initiates a series of reactions that result in the formation ofOH and HO2 radicals, which reach concentrations of theorder of 3 � 105 and 6 � 105 molec. cm�3, respectively, at
the time of 95% gas-to-particle conversion. The main losschannel for both radicals is the formation of HOI from I2 +OH (t � 0.07 s/0.1 s with respect to OH) and IO + HO2
(t � 3 s/7 s with respect to HO2). HOI is incorporated intothe aerosol (t � 12 h/5 min) or photolyzed back to I (t �2.6 min), while destruction of HOI by reaction with OH isnegligible (t > 9 yr/>3 yr). Conversion of I to HI isextremely slow (t > 9 yr/>2 yr) with respect to I, and thusHI is a very minor species in this case. Any amount of HIthat is formed will be taken up by the aerosol (t � 70 min/4min) since its destruction by reaction with OH is very slow(t � 225 h/78 h).[62] The gas-phase products predicted to reach high con-
centration are OIO (in the early part of the experiment) andI2, due to the high production rates (for both) and slower lossmechanism (for I2). Ozone remains in excess at all times, andabout 8 molecules of O3 are predicted to be consumed perinitial CH2I2 molecule in the base case. More than 99% ofthe iodine atoms are predicted to be in the aerosol phase 108min after the inception of CH2I2 photolysis. The finalcalculated aerosol composition (mole fraction) is dominatedby OIO (99.3% mole fraction), with the rest being made upby I2O2 and HOI in similar amounts (�0.3%).
5.4. Kinetic Simulations: Parametric Studies
[63] A series of alternative cases have also been simulatedusing the standard mechanism, in order to evaluate theeffects of relative humidity, CH2I2 and O3 initial concen-trations, and UV radiation intensity. The main results of thesecases are summarized in Table 3. The effect of the initialCH2I2 concentration is studied in cases S3 to S6. Thepredicted timescale of gas-to-particle conversion increases,and the O3 consumption decreases with decreasing CH2I2concentration. The changes in the timescale are mainly dueto the slower aerosol uptake because of the smaller aerosolsurface available, that is, if the simulations are rerun with thesize distribution of the base case (simulations S18 to S20),gas-to-particle timescales similar to that of the base case areobtained independently of the initial CH2I2 concentration.[64] The changes in aerosol composition with CH2I2
mixing ratio for the dry cases (with chamber lights) areillustrated in Figure 14. OIO is predicted to be the dominantaerosol species at all the CH2I2 concentrations used in thechamber experiments. HOx and HOI are predicted to takeover only for 1 ppt precursor concentrations (case S7, seebelow). The amount of HOI relative to OIO increases asCH2I2 decreases because the formation of HOI is first orderin IO while OIO formation is second order. I2O2 is a minorspecies in all cases, and it decreases as CH2I2 is decreasedbecause the gas-phase I2O2 is preferentially thermalized orphotolyzed as the timescale for aerosol uptake increases.The fraction of HO2 and OH in the aerosol increases withdecreasing CH2I2, and is predicted to make up a significantfraction of the aerosol at the lowest initial CH2I2 mixingratios, which is somewhat surprising. The uptake coeffi-cients of about 5 � 10�3 used here for both species aresimilar or smaller than those determined in the literature forsalt and soot aerosols [Cooper and Abbatt, 1996; Ivanov etal., 1996; Saathoff et al., 2001]. However, the uptakecoefficients used may not be appropriate for very smallaerosol concentrations when saturation effects can beimportant. HI is a minor species in all cases, but its relative
Figure 13. Simulated concentration profiles of the mainiodine species for the simularion base case S1 (5 ppb CH2I2,100 ppb O3, 2% RH), which corresponds to the conditionsof the experimental base case E1. This is a stacked plot: thevertical extent of each band represents the mixing ratio ofeach species (as iodine atoms) at a given time, and the totalnumber of iodine atoms in the system remain constant.Concentrations of the species not in the legend are too smallto be seen in the graph.
JIMENEZ ET AL.: NEW PARTICLE FORMATION FROM DIIODOMETHANE AAC 5 - 17
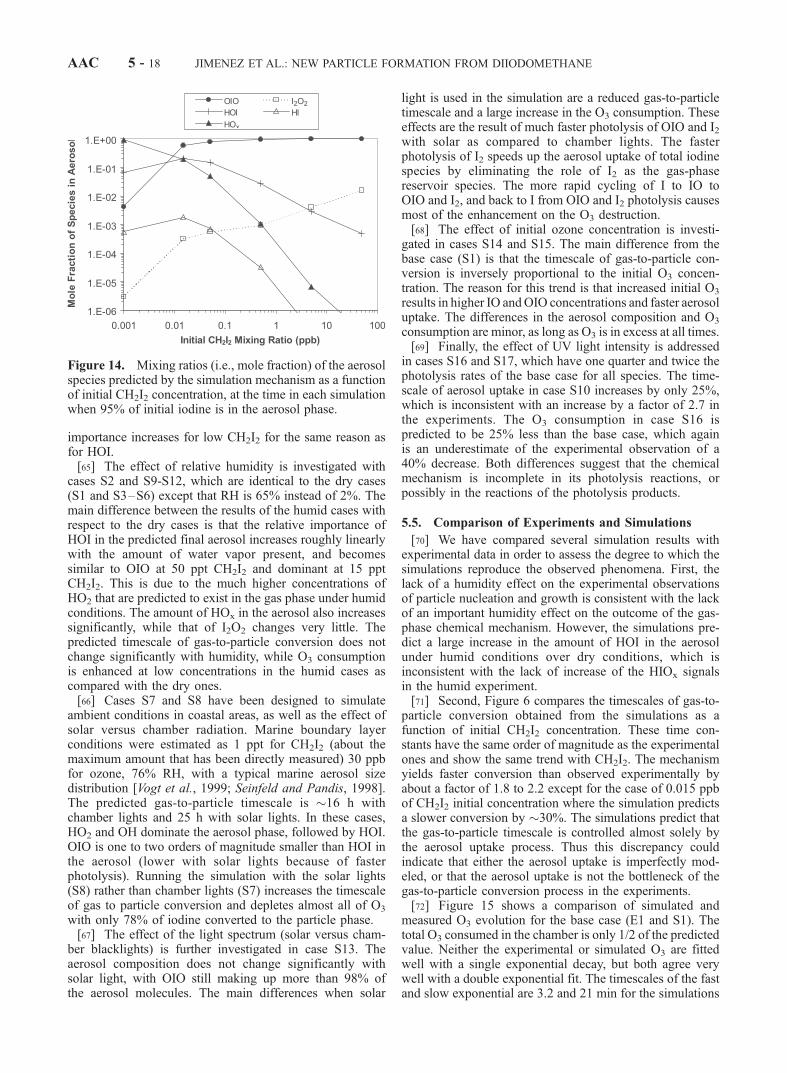
importance increases for low CH2I2 for the same reason asfor HOI.[65] The effect of relative humidity is investigated with
cases S2 and S9-S12, which are identical to the dry cases(S1 and S3–S6) except that RH is 65% instead of 2%. Themain difference between the results of the humid cases withrespect to the dry cases is that the relative importance ofHOI in the predicted final aerosol increases roughly linearlywith the amount of water vapor present, and becomessimilar to OIO at 50 ppt CH2I2 and dominant at 15 pptCH2I2. This is due to the much higher concentrations ofHO2 that are predicted to exist in the gas phase under humidconditions. The amount of HOx in the aerosol also increasessignificantly, while that of I2O2 changes very little. Thepredicted timescale of gas-to-particle conversion does notchange significantly with humidity, while O3 consumptionis enhanced at low concentrations in the humid cases ascompared with the dry ones.[66] Cases S7 and S8 have been designed to simulate
ambient conditions in coastal areas, as well as the effect ofsolar versus chamber radiation. Marine boundary layerconditions were estimated as 1 ppt for CH2I2 (about themaximum amount that has been directly measured) 30 ppbfor ozone, 76% RH, with a typical marine aerosol sizedistribution [Vogt et al., 1999; Seinfeld and Pandis, 1998].The predicted gas-to-particle timescale is �16 h withchamber lights and 25 h with solar lights. In these cases,HO2 and OH dominate the aerosol phase, followed by HOI.OIO is one to two orders of magnitude smaller than HOI inthe aerosol (lower with solar lights because of fasterphotolysis). Running the simulation with the solar lights(S8) rather than chamber lights (S7) increases the timescaleof gas to particle conversion and depletes almost all of O3
with only 78% of iodine converted to the particle phase.[67] The effect of the light spectrum (solar versus cham-
ber blacklights) is further investigated in case S13. Theaerosol composition does not change significantly withsolar light, with OIO still making up more than 98% ofthe aerosol molecules. The main differences when solar
light is used in the simulation are a reduced gas-to-particletimescale and a large increase in the O3 consumption. Theseeffects are the result of much faster photolysis of OIO and I2with solar as compared to chamber lights. The fasterphotolysis of I2 speeds up the aerosol uptake of total iodinespecies by eliminating the role of I2 as the gas-phasereservoir species. The more rapid cycling of I to IO toOIO and I2, and back to I from OIO and I2 photolysis causesmost of the enhancement on the O3 destruction.[68] The effect of initial ozone concentration is investi-
gated in cases S14 and S15. The main difference from thebase case (S1) is that the timescale of gas-to-particle con-version is inversely proportional to the initial O3 concen-tration. The reason for this trend is that increased initial O3
results in higher IO andOIO concentrations and faster aerosoluptake. The differences in the aerosol composition and O3
consumption are minor, as long as O3 is in excess at all times.[69] Finally, the effect of UV light intensity is addressed
in cases S16 and S17, which have one quarter and twice thephotolysis rates of the base case for all species. The time-scale of aerosol uptake in case S10 increases by only 25%,which is inconsistent with an increase by a factor of 2.7 inthe experiments. The O3 consumption in case S16 ispredicted to be 25% less than the base case, which againis an underestimate of the experimental observation of a40% decrease. Both differences suggest that the chemicalmechanism is incomplete in its photolysis reactions, orpossibly in the reactions of the photolysis products.
5.5. Comparison of Experiments and Simulations
[70] We have compared several simulation results withexperimental data in order to assess the degree to which thesimulations reproduce the observed phenomena. First, thelack of a humidity effect on the experimental observationsof particle nucleation and growth is consistent with the lackof an important humidity effect on the outcome of the gas-phase chemical mechanism. However, the simulations pre-dict a large increase in the amount of HOI in the aerosolunder humid conditions over dry conditions, which isinconsistent with the lack of increase of the HIOx signalsin the humid experiment.[71] Second, Figure 6 compares the timescales of gas-to-
particle conversion obtained from the simulations as afunction of initial CH2I2 concentration. These time con-stants have the same order of magnitude as the experimentalones and show the same trend with CH2I2. The mechanismyields faster conversion than observed experimentally byabout a factor of 1.8 to 2.2 except for the case of 0.015 ppbof CH2I2 initial concentration where the simulation predictsa slower conversion by �30%. The simulations predict thatthe gas-to-particle timescale is controlled almost solely bythe aerosol uptake process. Thus this discrepancy couldindicate that either the aerosol uptake is imperfectly mod-eled, or that the aerosol uptake is not the bottleneck of thegas-to-particle conversion process in the experiments.[72] Figure 15 shows a comparison of simulated and
measured O3 evolution for the base case (E1 and S1). Thetotal O3 consumed in the chamber is only 1/2 of the predictedvalue. Neither the experimental or simulated O3 are fittedwell with a single exponential decay, but both agree verywell with a double exponential fit. The timescales of the fastand slow exponential are 3.2 and 21 min for the simulations
Figure 14. Mixing ratios (i.e., mole fraction) of the aerosolspecies predicted by the simulation mechanism as a functionof initial CH2I2 concentration, at the time in each simulationwhen 95% of initial iodine is in the aerosol phase.
AAC 5 - 18 JIMENEZ ET AL.: NEW PARTICLE FORMATION FROM DIIODOMETHANE
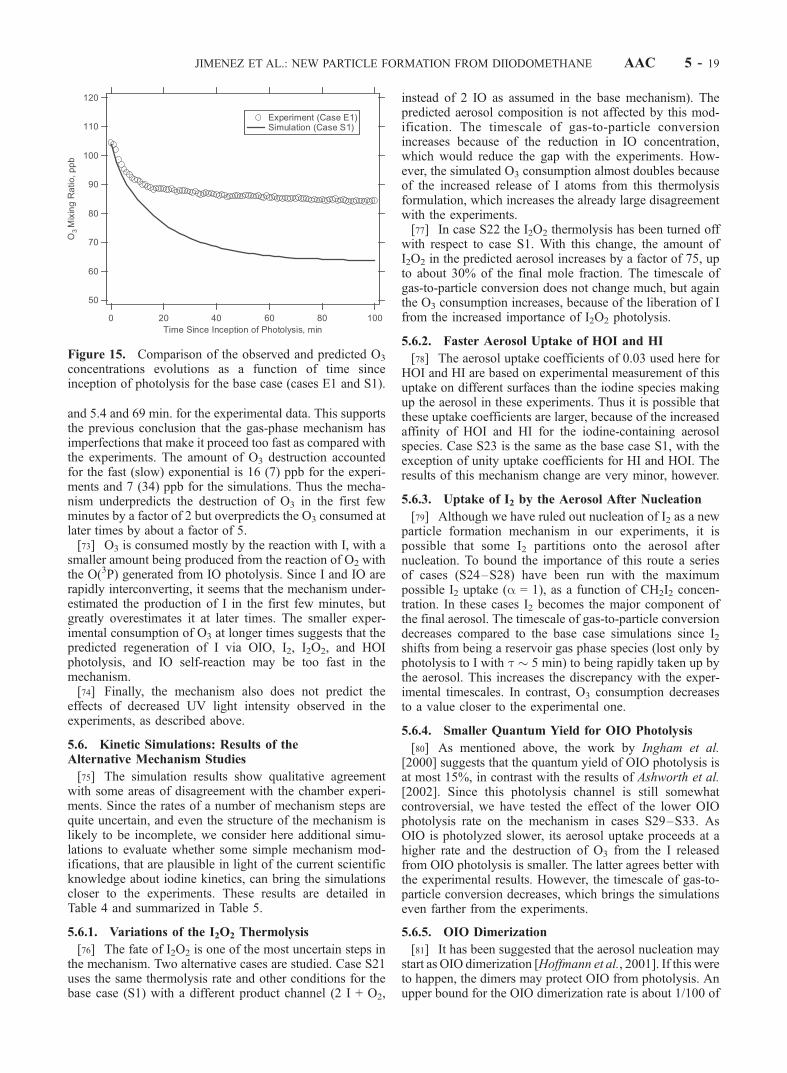
and 5.4 and 69 min. for the experimental data. This supportsthe previous conclusion that the gas-phase mechanism hasimperfections that make it proceed too fast as compared withthe experiments. The amount of O3 destruction accountedfor the fast (slow) exponential is 16 (7) ppb for the experi-ments and 7 (34) ppb for the simulations. Thus the mecha-nism underpredicts the destruction of O3 in the first fewminutes by a factor of 2 but overpredicts the O3 consumed atlater times by about a factor of 5.[73] O3 is consumed mostly by the reaction with I, with a
smaller amount being produced from the reaction of O2 withthe O(3P) generated from IO photolysis. Since I and IO arerapidly interconverting, it seems that the mechanism under-estimated the production of I in the first few minutes, butgreatly overestimates it at later times. The smaller exper-imental consumption of O3 at longer times suggests that thepredicted regeneration of I via OIO, I2, I2O2, and HOIphotolysis, and IO self-reaction may be too fast in themechanism.[74] Finally, the mechanism also does not predict the
effects of decreased UV light intensity observed in theexperiments, as described above.
5.6. Kinetic Simulations: Results of theAlternative Mechanism Studies
[75] The simulation results show qualitative agreementwith some areas of disagreement with the chamber experi-ments. Since the rates of a number of mechanism steps arequite uncertain, and even the structure of the mechanism islikely to be incomplete, we consider here additional simu-lations to evaluate whether some simple mechanism mod-ifications, that are plausible in light of the current scientificknowledge about iodine kinetics, can bring the simulationscloser to the experiments. These results are detailed inTable 4 and summarized in Table 5.
5.6.1. Variations of the I2O2 Thermolysis
[76] The fate of I2O2 is one of the most uncertain steps inthe mechanism. Two alternative cases are studied. Case S21uses the same thermolysis rate and other conditions for thebase case (S1) with a different product channel (2 I + O2,
instead of 2 IO as assumed in the base mechanism). Thepredicted aerosol composition is not affected by this mod-ification. The timescale of gas-to-particle conversionincreases because of the reduction in IO concentration,which would reduce the gap with the experiments. How-ever, the simulated O3 consumption almost doubles becauseof the increased release of I atoms from this thermolysisformulation, which increases the already large disagreementwith the experiments.[77] In case S22 the I2O2 thermolysis has been turned off
with respect to case S1. With this change, the amount ofI2O2 in the predicted aerosol increases by a factor of 75, upto about 30% of the final mole fraction. The timescale ofgas-to-particle conversion does not change much, but againthe O3 consumption increases, because of the liberation of Ifrom the increased importance of I2O2 photolysis.
5.6.2. Faster Aerosol Uptake of HOI and HI
[78] The aerosol uptake coefficients of 0.03 used here forHOI and HI are based on experimental measurement of thisuptake on different surfaces than the iodine species makingup the aerosol in these experiments. Thus it is possible thatthese uptake coefficients are larger, because of the increasedaffinity of HOI and HI for the iodine-containing aerosolspecies. Case S23 is the same as the base case S1, with theexception of unity uptake coefficients for HI and HOI. Theresults of this mechanism change are very minor, however.
5.6.3. Uptake of I2 by the Aerosol After Nucleation
[79] Although we have ruled out nucleation of I2 as a newparticle formation mechanism in our experiments, it ispossible that some I2 partitions onto the aerosol afternucleation. To bound the importance of this route a seriesof cases (S24–S28) have been run with the maximumpossible I2 uptake (a = 1), as a function of CH2I2 concen-tration. In these cases I2 becomes the major component ofthe final aerosol. The timescale of gas-to-particle conversiondecreases compared to the base case simulations since I2shifts from being a reservoir gas phase species (lost only byphotolysis to I with t � 5 min) to being rapidly taken up bythe aerosol. This increases the discrepancy with the exper-imental timescales. In contrast, O3 consumption decreasesto a value closer to the experimental one.
5.6.4. Smaller Quantum Yield for OIO Photolysis
[80] As mentioned above, the work by Ingham et al.[2000] suggests that the quantum yield of OIO photolysis isat most 15%, in contrast with the results of Ashworth et al.[2002]. Since this photolysis channel is still somewhatcontroversial, we have tested the effect of the lower OIOphotolysis rate on the mechanism in cases S29–S33. AsOIO is photolyzed slower, its aerosol uptake proceeds at ahigher rate and the destruction of O3 from the I releasedfrom OIO photolysis is smaller. The latter agrees better withthe experimental results. However, the timescale of gas-to-particle conversion decreases, which brings the simulationseven farther from the experiments.
5.6.5. OIO Dimerization
[81] It has been suggested that the aerosol nucleation maystart as OIO dimerization [Hoffmann et al., 2001]. If this wereto happen, the dimers may protect OIO from photolysis. Anupper bound for the OIO dimerization rate is about 1/100 of
Figure 15. Comparison of the observed and predicted O3
concentrations evolutions as a function of time sinceinception of photolysis for the base case (cases E1 and S1).
JIMENEZ ET AL.: NEW PARTICLE FORMATION FROM DIIODOMETHANE AAC 5 - 19
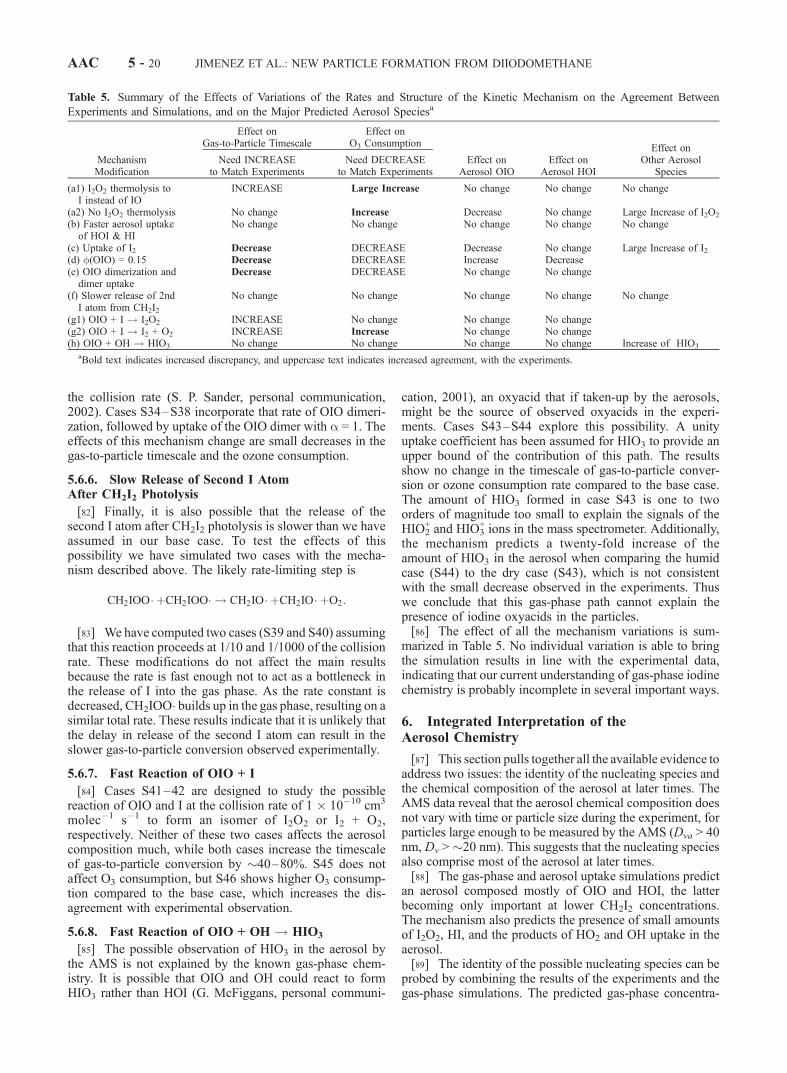
the collision rate (S. P. Sander, personal communication,2002). Cases S34–S38 incorporate that rate of OIO dimeri-zation, followed by uptake of the OIO dimer with a = 1. Theeffects of this mechanism change are small decreases in thegas-to-particle timescale and the ozone consumption.
5.6.6. Slow Release of Second I AtomAfter CH2I2 Photolysis
[82] Finally, it is also possible that the release of thesecond I atom after CH2I2 photolysis is slower than we haveassumed in our base case. To test the effects of thispossibility we have simulated two cases with the mecha-nism described above. The likely rate-limiting step is
CH2IOO� þCH2IOO� ! CH2IO� þCH2IO� þO2:
[83] We have computed two cases (S39 and S40) assumingthat this reaction proceeds at 1/10 and 1/1000 of the collisionrate. These modifications do not affect the main resultsbecause the rate is fast enough not to act as a bottleneck inthe release of I into the gas phase. As the rate constant isdecreased, CH2IOO� builds up in the gas phase, resulting on asimilar total rate. These results indicate that it is unlikely thatthe delay in release of the second I atom can result in theslower gas-to-particle conversion observed experimentally.
5.6.7. Fast Reaction of OIO + I
[84] Cases S41–42 are designed to study the possiblereaction of OIO and I at the collision rate of 1 � 10�10 cm3
molec�1 s�1 to form an isomer of I2O2 or I2 + O2,respectively. Neither of these two cases affects the aerosolcomposition much, while both cases increase the timescaleof gas-to-particle conversion by �40–80%. S45 does notaffect O3 consumption, but S46 shows higher O3 consump-tion compared to the base case, which increases the dis-agreement with experimental observation.
5.6.8. Fast Reaction of OIO + OH ! HIO3
[85] The possible observation of HIO3 in the aerosol bythe AMS is not explained by the known gas-phase chem-istry. It is possible that OIO and OH could react to formHIO3 rather than HOI (G. McFiggans, personal communi-
cation, 2001), an oxyacid that if taken-up by the aerosols,might be the source of observed oxyacids in the experi-ments. Cases S43–S44 explore this possibility. A unityuptake coefficient has been assumed for HIO3 to provide anupper bound of the contribution of this path. The resultsshow no change in the timescale of gas-to-particle conver-sion or ozone consumption rate compared to the base case.The amount of HIO3 formed in case S43 is one to twoorders of magnitude too small to explain the signals of theHIO2
+ and HIO3+ ions in the mass spectrometer. Additionally,
the mechanism predicts a twenty-fold increase of theamount of HIO3 in the aerosol when comparing the humidcase (S44) to the dry case (S43), which is not consistentwith the small decrease observed in the experiments. Thuswe conclude that this gas-phase path cannot explain thepresence of iodine oxyacids in the particles.[86] The effect of all the mechanism variations is sum-
marized in Table 5. No individual variation is able to bringthe simulation results in line with the experimental data,indicating that our current understanding of gas-phase iodinechemistry is probably incomplete in several important ways.
6. Integrated Interpretation of theAerosol Chemistry
[87] This section pulls together all the available evidence toaddress two issues: the identity of the nucleating species andthe chemical composition of the aerosol at later times. TheAMS data reveal that the aerosol chemical composition doesnot vary with time or particle size during the experiment, forparticles large enough to be measured by the AMS (Dva > 40nm, Dv > �20 nm). This suggests that the nucleating speciesalso comprise most of the aerosol at later times.[88] The gas-phase and aerosol uptake simulations predict
an aerosol composed mostly of OIO and HOI, the latterbecoming only important at lower CH2I2 concentrations.The mechanism also predicts the presence of small amountsof I2O2, HI, and the products of HO2 and OH uptake in theaerosol.[89] The identity of the possible nucleating species can be
probed by combining the results of the experiments and thegas-phase simulations. The predicted gas-phase concentra-
Table 5. Summary of the Effects of Variations of the Rates and Structure of the Kinetic Mechanism on the Agreement Between
Experiments and Simulations, and on the Major Predicted Aerosol Speciesa
MechanismModification
Effect onGas-to-Particle Timescale
Effect onO3 Consumption
Effect onAerosol OIO
Effect onAerosol HOI
Effect onOther Aerosol
SpeciesNeed INCREASE
to Match ExperimentsNeed DECREASE
to Match Experiments
(a1) I2O2 thermolysis toI instead of IO
INCREASE Large Increase No change No change No change
(a2) No I2O2 thermolysis No change Increase Decrease No change Large Increase of I2O2
(b) Faster aerosol uptakeof HOI & HI
No change No change No change No change No change
(c) Uptake of I2 Decrease DECREASE Decrease No change Large Increase of I2(d) f(OIO) = 0.15 Decrease DECREASE Increase Decrease(e) OIO dimerization and
dimer uptakeDecrease DECREASE No change No change
(f) Slower release of 2ndI atom from CH2I2
No change No change No change No change No change
(g1) OIO + I ! I2O2 INCREASE No change No change No change(g2) OIO + I ! I2 + O2 INCREASE Increase No change No change(h) OIO + OH ! HIO3 No change No change No change No change Increase of HIO3
aBold text indicates increased discrepancy, and uppercase text indicates increased agreement, with the experiments.
AAC 5 - 20 JIMENEZ ET AL.: NEW PARTICLE FORMATION FROM DIIODOMETHANE
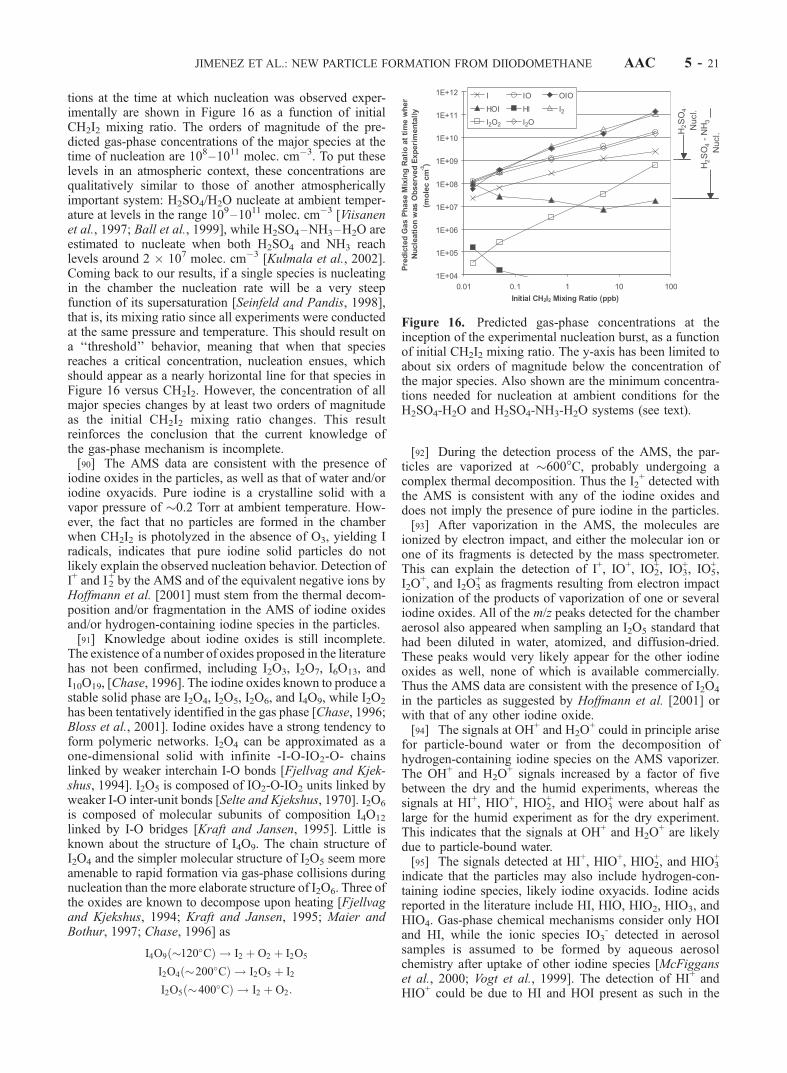
tions at the time at which nucleation was observed exper-imentally are shown in Figure 16 as a function of initialCH2I2 mixing ratio. The orders of magnitude of the pre-dicted gas-phase concentrations of the major species at thetime of nucleation are 108–1011 molec. cm�3. To put theselevels in an atmospheric context, these concentrations arequalitatively similar to those of another atmosphericallyimportant system: H2SO4/H2O nucleate at ambient temper-ature at levels in the range 109–1011 molec. cm�3 [Viisanenet al., 1997; Ball et al., 1999], while H2SO4–NH3–H2O areestimated to nucleate when both H2SO4 and NH3 reachlevels around 2 � 107 molec. cm�3 [Kulmala et al., 2002].Coming back to our results, if a single species is nucleatingin the chamber the nucleation rate will be a very steepfunction of its supersaturation [Seinfeld and Pandis, 1998],that is, its mixing ratio since all experiments were conductedat the same pressure and temperature. This should result ona ‘‘threshold’’ behavior, meaning that when that speciesreaches a critical concentration, nucleation ensues, whichshould appear as a nearly horizontal line for that species inFigure 16 versus CH2I2. However, the concentration of allmajor species changes by at least two orders of magnitudeas the initial CH2I2 mixing ratio changes. This resultreinforces the conclusion that the current knowledge ofthe gas-phase mechanism is incomplete.[90] The AMS data are consistent with the presence of
iodine oxides in the particles, as well as that of water and/oriodine oxyacids. Pure iodine is a crystalline solid with avapor pressure of �0.2 Torr at ambient temperature. How-ever, the fact that no particles are formed in the chamberwhen CH2I2 is photolyzed in the absence of O3, yielding Iradicals, indicates that pure iodine solid particles do notlikely explain the observed nucleation behavior. Detection ofI+ and I2
+ by the AMS and of the equivalent negative ions byHoffmann et al. [2001] must stem from the thermal decom-position and/or fragmentation in the AMS of iodine oxidesand/or hydrogen-containing iodine species in the particles.[91] Knowledge about iodine oxides is still incomplete.
The existence of a number of oxides proposed in the literaturehas not been confirmed, including I2O3, I2O7, I6O13, andI10O19, [Chase, 1996]. The iodine oxides known to produce astable solid phase are I2O4, I2O5, I2O6, and I4O9, while I2O2
has been tentatively identified in the gas phase [Chase, 1996;Bloss et al., 2001]. Iodine oxides have a strong tendency toform polymeric networks. I2O4 can be approximated as aone-dimensional solid with infinite -I-O-IO2-O- chainslinked by weaker interchain I-O bonds [Fjellvag and Kjek-shus, 1994]. I2O5 is composed of IO2-O-IO2 units linked byweaker I-O inter-unit bonds [Selte and Kjekshus, 1970]. I2O6
is composed of molecular subunits of composition I4O12
linked by I-O bridges [Kraft and Jansen, 1995]. Little isknown about the structure of I4O9. The chain structure ofI2O4 and the simpler molecular structure of I2O5 seem moreamenable to rapid formation via gas-phase collisions duringnucleation than the more elaborate structure of I2O6. Three ofthe oxides are known to decompose upon heating [Fjellvagand Kjekshus, 1994; Kraft and Jansen, 1995; Maier andBothur, 1997; Chase, 1996] as
I4O9 �120�Cð Þ ! I2 þ O2 þ I2O5
I2O4 �200�Cð Þ ! I2O5 þ I2
I2O5 �400�Cð Þ ! I2 þ O2:
[92] During the detection process of the AMS, the par-ticles are vaporized at �600�C, probably undergoing acomplex thermal decomposition. Thus the I2
+ detected withthe AMS is consistent with any of the iodine oxides anddoes not imply the presence of pure iodine in the particles.[93] After vaporization in the AMS, the molecules are
ionized by electron impact, and either the molecular ion orone of its fragments is detected by the mass spectrometer.This can explain the detection of I+, IO+, IO2
+, IO3+, IO5
+,I2O
+, and I2O3+ as fragments resulting from electron impact
ionization of the products of vaporization of one or severaliodine oxides. All of the m/z peaks detected for the chamberaerosol also appeared when sampling an I2O5 standard thathad been diluted in water, atomized, and diffusion-dried.These peaks would very likely appear for the other iodineoxides as well, none of which is available commercially.Thus the AMS data are consistent with the presence of I2O4
in the particles as suggested by Hoffmann et al. [2001] orwith that of any other iodine oxide.[94] The signals at OH+ and H2O
+ could in principle arisefor particle-bound water or from the decomposition ofhydrogen-containing iodine species on the AMS vaporizer.The OH+ and H2O
+ signals increased by a factor of fivebetween the dry and the humid experiments, whereas thesignals at HI+, HIO+, HIO2
+, and HIO3+ were about half as
large for the humid experiment as for the dry experiment.This indicates that the signals at OH+ and H2O
+ are likelydue to particle-bound water.[95] The signals detected at HI+, HIO+, HIO2
+, and HIO3+
indicate that the particles may also include hydrogen-con-taining iodine species, likely iodine oxyacids. Iodine acidsreported in the literature include HI, HIO, HIO2, HIO3, andHIO4. Gas-phase chemical mechanisms consider only HOIand HI, while the ionic species IO3
- detected in aerosolsamples is assumed to be formed by aqueous aerosolchemistry after uptake of other iodine species [McFigganset al., 2000; Vogt et al., 1999]. The detection of HI+ andHIO+ could be due to HI and HOI present as such in the
Figure 16. Predicted gas-phase concentrations at theinception of the experimental nucleation burst, as a functionof initial CH2I2 mixing ratio. The y-axis has been limited toabout six orders of magnitude below the concentration ofthe major species. Also shown are the minimum concentra-tions needed for nucleation at ambient conditions for theH2SO4-H2O and H2SO4-NH3-H2O systems (see text).
JIMENEZ ET AL.: NEW PARTICLE FORMATION FROM DIIODOMETHANE AAC 5 - 21
particles; however, their predicted aerosol concentrationsare too low to explain the signal intensities detected in theAMS. The AMS detection of HIO2
+ and HIO3+ indicates that
either larger oxyacids are present the particles (probablyHIO3), or that these are made on the AMS vaporizer froman iodine oxide and the particle-bound water. Both possi-bilities are plausible, though the former is more likely.Similar AMS signals were observed at HI+, HIO+, HIO2
+,and HIO3
+ when sampling I2O5 that had been dissolved inwater, a process that is known to produce HIO3 [Chase,1996]. The fact that Hoffmann et al. [2001] did not detectany hydrogen-containing ions is not necessarily inconsistentwith the presence of HIO3 in the particles, since the aerosolundergoes a much slower vaporization in their instrument at550�C, during which HIO3 can decompose by [Chase,1996]:
HIO3 �200�Cð Þ ! I2O5 þ H2O
Little is known about the chemical decomposition that mayoccur when the particles impact the AMS vaporizer. It ispossible that, if the particles are composed only of I2O4 andwater, part of the I2O4 thermally decomposes on the AMSvaporizer to I2O5, which in turn reacts with H2O to yield theobserved signals. However, the HIO3 formed should furtherdecompose at the higher temperatures of the AMSvaporizer.[96] If iodine oxyacids are present in the particles, their
origin cannot be explained by the known gas-phase chem-istry. Sunder and Vikis [1987] identified the solid productformed by the dark reaction of I2 with O3 under saturatedwater vapor conditions as HIO3; however, this reaction hadyielded only I4O9 when conducted under completely dryconditions [Sunder et al., 1985]. The detailed gas-phasechemical mechanism is not known in either case, but isthought to involve the direct reaction of I2 and O3 to form acyclic transition state that decomposes into either IO, I, andO2, or IO2 and IO, the latter path being nonnegligible [Vikisand MacFarlane, 1985]. Since the water vapor concentra-tion was very low in our dry experiments (RH < 2%), thechemistry leading to iodine oxyacids may have been differ-ent in our chamber than for the experiment of Sunder andVikis [1987]. The presence of larger oxyacids in the particlescould be a result of not yet known gas-phase chemistry or ofthe reaction of OH, HO2, and/or H2O with an iodine oxidein/on the particles. The reaction of OH and HO2 with theparticles cannot explain the observed intensity of HIOx
+
signals, given the uptake coefficients that we have assumed,and that are similar to those determined in previous studieson salt aerosols, as described above. However, the muchlarger radical uptake coefficients that have been measuredwhen a chemical reaction between the aerosol and theradical is involved [Bertram et al., 2001] could result inthe observed signals. Whichever is the actual formation pathof iodine oxyacids under dry conditions, it is possible anonaqueous path is responsible for some of the IO3
�
detected in coastal aerosol samples, contrary to the prevail-ing literature assumption.[97] The HTDMA results provide another constraint on
the aerosol composition. I2O5 and I4O9 are very hygro-scopic (the former is known to yield HIO3 in solution) whileI2O4 is not. There is no information on the hygroscopicity ofI2O6 or I2O2. The lack of hygroscopic growth of the aerosol
formed in the humid experiment is inconsistent with anaerosol composed of either I2O5 or I4O9, while it is con-sistent with an aerosol composed mainly of I2O4.[98] Table 6 summarizes all the available evidence about
nucleating and condensing species. We conclude that homo-geneous nucleation of OIO is the most likely mechanism forthe observed nucleation bursts. The particles formed underdry conditions are composed of iodine oxides, likely I2O4
with some iodine oxyacids, likely HIO3. A definitivechemical identification will necessitate the production of alarger mass of particles in a flow tube followed by an in situanalysis technique, for example, as described in Sunder andVikis [1987].
7. Comparison to PARFORCE Results
[99] While the mechanism studied in this paper is capableof producing very rapid and intense nucleation bursts, it isimportant to determine whether it is a good model for themechanism that produced the observed nucleation burstsduring the PARFORCE campaign described in the intro-duction [O’Dowd et al., 2002], from whose results themechanism tested in this paper was hypothesized. In thissection we evaluate this point by comparing the results ofthe chamber experiments presented in this paper with thoseof the PARFORCE campaign.[100] First, the chamber experiments indicate a lack of
hygroscopic growth (growth factor � 1.0) in the HTDMAfor particles formed under humid conditions. This is similarto the growth factors of 1.05 or less observed duringnucleation events at Mace Head under low H2SO4 concen-trations for 8–10 nm particles using a nano-HTDMA[Vakeva et al., 2002; O’Dowd et al., 2002]. These particleswere found to contain either only iodine, or iodine andsulfate, while larger particles had a significantly largersulfate to iodine ratio [Makela et al., 2002]. This suggeststhat the chemical composition of the newly formed particlesmay be the same in both cases. The low hygroscopicitypoints toward I2O4 as the major iodine oxide produced inboth cases.[101] Second, we can also compare the nucleation and
particle growth rates observed in the chamber with those
Table 6. Synthesis of Evidence on Aerosol Composition and
Identity of Nucleating Species
Source of Information Nucleating and/or Aerosol Species
Lack of nucleation whenO3 not present+ kinetic simulations
I and I2 are not the nucleating species
Chemical simulations OIO at high concentrationsHOI and OIO at low concentrations
Experimental nucleationdelay
OIO, IO, and I2O could be involvedin nucleation
HOI is less likely to be involvedI2O2 and HI are not involved
AMS IxOy and either/both H2O/HIO3
Crystalline structureand speed of nucleation
More likely I2O4 or I2O5
Less likely I2O6
Lack of hygroscopicgrowth in HTDMA
Most likely I2O4
Not likely I2O5 and/or I4O9
Summary OIO most likely responsible for nucleationI2O4 most likely dominant aerosol species
AAC 5 - 22 JIMENEZ ET AL.: NEW PARTICLE FORMATION FROM DIIODOMETHANE
observed during PARFORCE. During PARFORCE thesource rates of detectable sub-10 nm particles measuredwith a CPC array were 1–7 � 105 cm�3 s�1. The particlegrowth rates were estimated at 0.1–0.36 nm s�1 from theCPC data and at 0.005–0.5 nm s�1 with a model based onthe observations [Hameri et al., 2002; O’Dowd et al.,2002]. Since O3 and UV radiation will always be presentat Mace Head during the daytime periods when nucleationwas observed, we only need to determine the order ofmagnitude of CH2I2 (and other photolabile organic iodinespecies) during nucleation at PARFORCE to be able tocompare field and chamber observations. The condensablevapor concentrations needed to explain the observed growthwere estimated by two different models at 4–40 ppt and240–440 ppt [O’Dowd et al., 2002]. In measurementsperformed in coastal areas, mixing ratios of up to 6 pptIO, 3 ppt OIO, and 0.45 ppt CH2I2 have been reported[Alicke et al., 1999; Allan et al., 2001; Carpenter et al.,1999]. IO and OIO were detected with a long-path DOAStechnique and may have been one to two orders of magni-tude higher over the shore areas [O’Dowd et al., 2002], upto �60–600 and �30–300 ppt, respectively. Since CH2I2photolyzes with a timescale of a few minutes and wasmeasured with a slow instrument (1 h), while the nucleationbursts at PARFORCE changed with a timescale of seconds,it is possible that the flux of iodine atoms from its photolysisat PARFORCE was significantly larger than the reportedconcentration of 0.45 ppt. From all the available data weestimate that the amount of iodine present in gas-phasespecies that originate from CH2I2 is in the range 4–600 ppt.Thus we will use the results of the chamber experimentswith 15, 50, and 500 ppt CH2I2 (Exp. E3, E4 and E5) toprovide order-of-magnitude estimates of the nucleation andgrowth rates. The source rates of sub-10 nm particles in thechamber during those experiments are 103–106 cm�3 s�1,while the growth rates of the nucleated particles are 0.005–0.08 nm s�1. Thus the source and growth rates observed inthe chamber are reasonably consistent with those observedin the field experiments, given the large uncertaintiespresent in both sets of ultrafine particle measurements,and on the estimated precursor concentration at PAR-FORCE.[102] Kulmala et al. [2002] propose that the nucleation
and particle growth steps could have been decoupled duringPARFORCE, with H2SO4-NH3-H2O providing the nucleifor another species to condense on. Our laboratory resultsindicate that photooxidation of CH2I2 can result in nuclea-tion and particle growth rates similar to those observed incoastal areas, and thus that ternary nucleation of H2SO4-NH3-H2O need not be invoked.[103] Finally, the results in this paper provide an explan-
ation of the lack of correlation between O3 and particleformation during PARFORCE, with the exception of onestrong nucleation event in which O3 was noticeably reduced[O’Dowd et al., 2002]. The total O3 consumption predictedby the chemical mechanism for the chamber experimentsbetween 15 and 500 ppt CH2I2 is �2–7 ppb over a time-scale of 20 min. These estimates can be used as an upperbound of O3 destruction since the simulations overpredictthe measured O3 destruction for the 5 ppb experiments by afactor of 2 (Figure 15). From these results, we estimate anO3 destruction rate of at most 0.1–0.35 ppb min�1, which
would be difficult to detect on top of fluctuations on anatural background of the order of 30 ppb and the noise ofthe O3 analyzer itself. Also, since this chemical systemconsumes little O3 and is insensitive to the O3 concentration(as long as there is excess O3), it is unlikely that ozone willever be the limiting reactant. If CH2I2 (or other photolabileorganic iodine species) is available at concentrations of tensof ppt together with UV light, new particle formation willproceed.
8. Conclusions
[104] We have studied the photooxidation of CH2I2 in thepresence of O3 experimentally in the Caltech indoor cham-ber and by means of gas-phase chemical simulations. Wecan summarize the observed aerosol dynamics in the basecase experiment (Exp. E1, 5 ppb CH2I2, 100 ppb O3, RH <2%) as (1) a nucleation burst immediately after the inceptionof photolysis with its highest intensity for about 1 min, (2)condensation of additional vapors onto the nucleated par-ticles for a period of 1.5–2.5 h, (3) particle coagulation,which occurs after the nucleation burst and controls thedynamics from the point when condensation ceases, and (4)a size-dependent wall loss of particles, which is importantfor the freshly nucleated particles and later has a character-istic time of about 5 h. Particles formed under dry con-ditions are fractal agglomerates with mass fractaldimensions, Df � 1.8–2.5. Higher relative humidity doesnot alter the nucleation or growth behavior but results inmore compact and dense particles (Df � 2.5–2.8). The mainfeatures of this process do not change with decreasing initialCH2I2 concentration; however, the gas-to-particle conver-sion is slower, likely due to reduced aerosol surface foruptake.[105] On the basis of all the available information, the
most likely species that could be responsible for theobserved nucleation bursts and condensation growth isOIO. Chemical analysis of the particles is consistent withthe presence of iodine oxides, although the available evi-dence is inconclusive for any one of them. Water and/oriodine oxyacids, likely HIO3, are also present in theparticles. The acid may be formed in the gas phase or byreactions in/on the aerosol. Comparison between particlehygroscopicity, composition, and nucleation and growthrates observed in coastal measurements and in the presentexperiments suggest that photooxidation of CH2I2, possiblycoupled with other photolabile organic iodine species, is themechanism leading to the observed new particle formationon the west coast of Ireland. For CH2I2 concentrations oftens of ppt during daylight hours, new particle formationcan occur without the need for preexisting clusters fromspecies outside the iodine system.
[106] Acknowledgments. This work was supported by U. S. Depart-ment of Energy grant DE-FG03-01ER63099. The authors sincerely thankStan Sander, Kyle Bayes, and Daniel Milligan of the NASA Jet PropulsionLaboratory, Gordon McFiggans of UMIST, Mitchio Okumura and PaulWennberg of Caltech, Jim Burkholder and Joachim Curtius of the NOAAAeronomy Laboratory, and Xiao-Ying Yu of Colorado State University foruseful suggestions about iodine kinetics.
ReferencesAitken, J. A., On some nuclei of cloudy condensation, Trans. R. Soc.Edinburgh, XXXIX, 1897.
JIMENEZ ET AL.: NEW PARTICLE FORMATION FROM DIIODOMETHANE AAC 5 - 23
Alicke, B. K., K. Hebestreit, J. Stutz, and U. Platt, Iodine oxide in themarine boundary layer, Nature, 397, 572–573, 1999.
Allan, B. J., J. M. C. Plane, and G. McFiggans, Observations of OIO in theremote marine boundary layer,Geophys. Res. Lett., 28, 1945–1948, 2001.
Ashworth, S. H., B. J. Allan, and J. M. C. Plane, High resolution spectro-scopy of the OIO radical: Implications for the ozone-depleting potential ofiodine, Geophys. Res. Lett., 29(10), 1456, doi:10.1029/2001GL013851.2002.
Atkinson, R., D. L. Baulch, R. A. Cox, R. F. Hampson, J. A. Kerr, M. J.Rossi, and J. Troe, Evaluated kinetic and photochemical data for atmo-spheric chemistry: Supplement VIII, halogen species, J. Phys. Chem. Ref.Data, 29, 167–266, 2000.
Ball, S. M., D. R. Hanson, F. L. Eisele, and P. H. McMurry, Laboratorystudies of particle nucleation: Initial results for H2SO4, H2O, and NH3
vapors, J. Geophys. Res., 104, 23,709–23,718, 1999.Baron, P. A., and K. Willeke, Gas and particle motion, in Aerosol Measure-ment: Principles, Techniques, and Applications, edited by P. A. Baronand K. Willeke, John Wiley, New York, 2001.
Behrens, D., G. Kreysa, and R. Eskermann (Eds.), DECHEMA CorrosionHandbook: Corrosive Agents and Their Interaction with Materials,Volume 3, Acid Halides, Amine Salts, Bromides, Bromine, CarbonicAcid, Lithium Hydroxide, John Wiley, New York, 1989.
Bertram, A. K., A. Ivanov, M. Hunter, L. T. Molina, and M. J. Molina, TheReaction Probability of OH on Organic Surfaces of Tropospheric Interest,J. Phys. Chem. A, 105, 9415–9421, 2001.
Bloss, W. J., D. M. Rowley, R. A. Cox, and R. L. Jones, Kinetics andProducts of the IO Self-Reaction, J. Phys. Chem. A, 105, 7840–7854,2001.
Carpenter, L. J., W. T. Sturges, S. A. Penkett, P. S. Liss, B. Alicke,K. Hebestreit, and U. Platt, Short-lived alkyl iodides and bromides atMace Head, Ireland: Links to biogenic sources and halogen oxide pro-duction, J. Geophys. Res., 104, 1679–1689, 1999.
Chase, M. W., NIST-JANAF thermochemical tables for the iodine oxides,J. Phys. Chem. Ref. Data, 25, 1297–1340, 1996.
Cocker, D. R., R. C. Flagan, and J. H. Seinfeld, State-of-the-art chamberfacility for studying atmospheric aerosol chemistry, Environ. Sci. Tech-nol., 35, 2594–2601, 2001.
Collins, D. R., R. C. Flagan, and J. H. Seinfeld, Improved inversion ofscanning DMA data, Aerosol Sci. Technol., 36, 1–9, 2002.
Cooper, P. L., and J. P. D. Abbatt, Heterogeneous interactions of OH andHO2 radicals with surfaces characteristics of atmospheric particulate mat-ter, J. Phys. Chem., 100, 2249–2254, 1996.
Cotter, E. S. N., N. J. Booth, C. E. Canosa-Mas, and R. P. Wayne, Releaseof Iodine in the Atmospheric Oxidation of Alkyl Iodides and the Fates ofIodinated Alkoxy Radicals, Atmos. Environ., 35, 2169–2178, 2001.
Cox, R. A., W. J. Bloss, R. L. Jones, and D. M. Rowley, OIO and theatmospheric cycle of iodine, Geophys. Res. Lett., 26, 1857–1860, 1999.
De More, W. B., S. P. Sander, D. M. Golden, R. F. Hampson, M. J. Kurylo,C. J. Howard, A. R. Ravishankara, C. E. Kolb, and M. J. Molina, Che-mical kinetics and photochemical data for use in stratospheric modeling,evaluation 12, JPL Publ., 97-4, 1997.
Finlayson-Pitts, B. J., and J. N. Pitts, Chemistry of the Upper and LowerAtmosphere: Theory, Experiments and Applications, Academic, San Die-go, Calif., 2000.
Fjellvag, H., and A. Kjekshus, The crystal structure of I2O4 and its relationsto other iodine-oxygen-containing compounds, Acta Chem. Scandinavica,48, 815–822, 1994.
Flagan, R. C., and M. M. Lunden, Particle structure control in nanoparticlesynthesis from the vapor phase, Mater. Sci. Eng., A204, 113–124, 1995.
Flagan, R. C., Electrical techniques, in Aerosol Measurement: Principles,Techniques, and Applications, edited by P. A. Baron and K. Willeke, JohnWiley, New York, 2001.
Flagan, R. C., S.-C. Wang, F. Yin, J. H. Seinfeld, G. Reischi, W. Winkl-mayr, and R. Karch, Electrical mobility measurements of fine-particleformation during chamber studies of atmospheric photochemical reac-tions, Environ. Sci. Technol., 25, 883–890, 1991.
Friedlander, S. K., and C. S. Wang, The self-preserving distribution forcoagulation by Brownian motion, J. Colloid Interface Sci., 22, 126–132, 1966.
Friedlander, S. K., Smoke, Dust, and Haze: Fundamentals of Aerosol Dy-namics, 2nd ed., Oxford Univ. Press, New York, 2000.
Fuchs, N. A., The Mechanics of Aerosols, Pergamon, New York, 1964.Grenfell, J. L., R. M. Harrison, A. G. Allen, J. P. Shi, S. A. Penkett, andC. D. O’Dowd, An analysis of rapid increases in condensation nucleiconcentrations at a remote coastal site in western Ireland, J. Geophys.Res., 104, 13,771–13,780, 1999.
Hameri, K., C. D. O’Dowd, and C. Hoell, Evaluating measurements of newparticle concentrations, source rates, and spatial scales during coastalnucleation events using condensation particle counters, J. Geophys.Res., 107(D19), 8101, doi:10.1029/2001JD000411, 2002.
Hinds, W. C., Aerosol Technology, John Wiley, New York, 1999.Hoffmann, T., C. D. O’Dowd, and J. H. Seinfeld, Iodine oxides and newparticle formation in the coastal boundary layer, Geophys. Res. Lett., 28,1949–1952, 2001.
Holmes, N. S., J. W. Adams, and J. N. Crowley, Uptake and reaction ofHOI and IONO2 on frozen and dry NaCl/NaBr surfaces and H2SO4,Phys. Chem. Chem. Phys., 3, 1679–1687, 2001.
Ingham, T., M. Cameron, and J. N. Crowley, Photodissociation of IO (355nm) and OIO (532 nm): Quantum Yields for O(3P) and I(2PJ) Production,J. Phys. Chem., 104, 8001–8010, 2000.
Ivanov, A. V., Y. M. Gershenzon, F. Gratpanche, P. Devolver, and J.-P.Sawerysyn, Heterogeneous loss of OH on NaCl and NH4NO3 at tropo-spheric temperatures, Ann. Geophys., 14, 659–664, 1996.
Jacob, D. J., Heterogeneous chemistry and tropospheric ozone, Atmos. En-viron., 34, 2131–2159, 2000.
Jayne, J. T., D. C. Leard, X. Zhang, P. Davidovits, K. A. Smith, C. E. Kolb,and D. R. Worsnop, Development of an aerosol mass spectrometer forsize and composition: Analysis of submicron particles, Aerosol Sci. Tech-nol., 33, 49–70, 2000.
Jimenez, J. L., et al., Ambient aerosol sampling using the aerodyne aerosolmass spectrometer, J. Geophys., 108(D7), doi:10.1029/2001JD001213,2003.
Kraft, T., and M. Jansen, Synthesis and crystal structure of diiodine (V/VII)hexaoxide: An intermediate between a molecular and a polymer solid,J. Am. Chem. Soc., 117, 6795–6796, 1995.
Kulmala, M. A., P. Korhonen, I. Napari, A. Karlsson, H. Berresheim, andC. D. O’Dowd, Aerosol formation during PARFORCE: Ternary nuclea-tion of H2SO4, NH3, and H2O, J. Geophys. Res., 107(D9), 8111,doi:10.1029/2001JD000900, 2002.
Laturnus, F., Volatile halocarbons released from arctic macroalgae, Mar.Chem., 55, 359–366, 1996.
Maier, G., and A. Bothur, Matrix-isolation of iodine superoxide and iodinedioxide, Chem. Ber. Recueil., 130, 179–181, 1997.
Makela, J. M., T. Hoffmann, C. Holzke, M. Vakeva, T. Suni, T. Mattila, P. P.Aalto, U. Tapper, E. I. Kauppinen, and C. D. O’Dowd, Biogenic iodineemissions and identification of end-products in coastal ultrafine particlesduring nucleation bursts, J. Geophys. Res., 107(D19), 8110, doi:10.1029/2001JD000580, 2002.
Matsoukas, T., and S. K. Friedlander, , J. Colloid Interface Sci, 146, 495–506, 1991.
McFiggans, G., J. C. Plane, B. J. Allan, L. J. Carpenter, H. Coe, and C. D.O’Dowd, Modeling study of iodine chemistry in the marine boundarylayer, J. Geophys. Res., 105, 14,371–14,385, 2000.
McMurry, P. H., X. Wang, K. Park, and K. Ehara, The Relationship BetweenMass and Mobility for Atmospheric Particles: A New Technique for Mea-suring Particle Density, Aerosol Sci. Technol., 36, 227–238, 2002.
Misra, A., and P. Marshall, Computational investigations of iodine oxides,J. Phys. Chem. A, 102, 9056–9060, 1998.
Mossinger, J. C., and R. A. Cox, Heterogeneous Reaction of HOI withSodium Halide Salts, J. Phys. Chem. A., 105, 5165–5177, 2001.
Mossinger, J. C., D. E. Shallcross, and R. A. Cox, UV absorption cross-sections and atmospheric photolysis rates of CH2Br2, CH2I2 and CH2BrI,J. Chem. Soc. Faraday Trans., 94, 1391–1396, 1998.
O’Dowd, C. D., M. Geever, M. K. Hill, M. H. Smith, and S. G. Jennings,New particle formation: Nucleation rates and spatial scales in the cleanmarine coastal environment, Geophys. Res. Lett., 25, 1661–1664, 1998.
O’Dowd, C. D., et al., On the photochemical production of new particles inthe coastal boundary layer, Geophys. Res. Lett., 26, 1707–1710, 1999.
O’Dowd, C. D., et al., A dedicated study of new particle formation and fatein the coastal environment (PARFORCE): Overview of objectives andachievements, J. Geophys. Res., 107(D19), 8108, doi:10.1029/2000JD000555, 2002.
Percival, C. J., J. C. Mossinger, and R. A. Cox, The Uptake of HI and HBron Ice, Phys. Chem. Chem. Phys., 1, 4565–4570, 1999.
Rader, D. J., and P. H. McMurry, Applications of the Tandem DifferentialMobility Analyzer to Studies of Droplet Growth or Evaporation, J. Aero-sol Sci., 17, 771–787, 1986.
Rogak, S. N., U. Balstensperger, and R. C. Flagan, Measurement of masstransfer to agglomerate aerosols, Aerosol Sci. Technol., 14, 447–458,1991.
Rowley, D., J. C. Mossinger, R. A. Cox, and R. L. Jones, The UV-visibleabsorption cross-section and atmospheric photolysis rate of HOI, J. At-mos. Chem., 34, 137–151, 1999.
Saathoff, H., K. H. Naumann, N. Riemer, S. Kamm, O. Mohler, U. Schur-ath, H. Vogel, and B. Vogel, The loss of NO2, HNO3, NO3/N2O5, andHO2/HOONO2 on soot aerosol: A chamber and modeling study, Geo-phys. Res. Lett., 28, 1957–1960, 2001.
Sander, R., R. Vogt, G. W. Harris, and P. J. Crutzen, Modeling the chem-istry of ozone, halogen compounds, and hydrocarbons in the arctic tropo-sphere during spring, Tellus, 49B, 522–532, 1997.
AAC 5 - 24 JIMENEZ ET AL.: NEW PARTICLE FORMATION FROM DIIODOMETHANE
Sander, S. P., Kinetics and mechanism of the IO+IO reaction, J. Phys.Chem., 90, 2194–2199, 1986.
Seinfeld, J. H., and S. N. Pandis, Atmospheric Chemistry and Physics:From Air Pollution to Climate Change, John Wiley, New York, 1998.
Selte, K., and A. Kjekshus, Iodine oxides: part III, The crystal structure ofI2O5, Acta Chem. Scandinavica, 24, 1912–1924, 1970.
Sorensen, C. M., Light scattering by fractal aggregates: A review, AerosolSci. Technol., 35, 648–687, 2001.
Sorensen, C. M., and G. C. Roberts, The prefactor of fractal aggregates,J. Colloid Interface Sci., 186, 447–452, 1997.
Sunder, S., and A. C. Vikis, Raman spectra of iodine oxyacids produced bythe gas-phase reaction of iodine with ozone in the presence of watervapour, Can. J. Spectrosc., 32, 45–48, 1987.
Sunder, S., J. C. Wren, and A. C. Vikis, Raman spectra of I4O9 formed bythe reaction of iodine with ozone, J. Raman Spectrosc., 16, 424–426,1985.
TSI, Model 3025A, Ultrafine Condensation Particle Counter Operationand Display Instruction Manual, TSI, Inc., St. Paul, Minn., 1996.
Vakeva, M., K. Hameri, and P. P. Aalto, Hygroscopic properties of nuclea-tion mode and Aitken mode particles during nucleation bursts and inbackground air on the west coast of Ireland, J. Geophys. Res.,107(D19), 8104, doi:10.1029/2000JD000176, 2002.
Vemury, S., and S. E. Pratsinis, Self-preserving size distributions of ag-glomerates, J. Aerosol Sci., 26, 175–185, 1995.
Viisanen, Y., M. Kulmala, and A. Laaksonen, Experiments on Gas-LiquidNucleation of Sulfuric Acid and Water, J. Chem. Phys., 107, 920–926,1997.
Vikis, A. C., and R. MacFarlane, Reaction of iodine with ozone in the gasphase, J. Phys Chem., 89, 812–815, 1985.
Vogt, R., R. Sander, R. Von Glasow, and P. J. Crutzen, Iodine chemistry andits role in halogen activation and ozone loss in the marine boundary layer:A model study, J. Atmos. Chem., 32, 375–395, 1999.
Wang, S. C., and R. C. Flagan, Scanning electrical mobility analyzer,J. Aerosol Sci., 8, 1485–1488, 1989.
Weber, R. J., P. H. McMurry, R. L. Mauldin III, D. J. Tanner, F. L. Eisele,A. D. Clarke, and V. N. Kapustin, New particle formation in the remotetrosposphere: A comparison of observations at various sites, Geophys.Res. Lett., 26, 307–310, 1999.
Weingartner, E., H. Burtscher, and U. Baltensperger, Hygroscopic proper-ties of carbon and diesel soot particles, Atmos. Environ., 31, 2311–2327,1997.
Wu, M. K., and S. K. Friedlander, Note on the power law equation forfractal-like aerosol agglomerates, J. Colloid Interface Sci., 159, 246–248, 1993.
�����������������������R. Bahreini, R. C. Flagan, J. H. Seinfeld, and H. Zhuang, Department of
Environmental Science and Engineering, California Institute of Technology,Mail Code 210-41, 1200 East California Boulevard, Pasadena, CA 91125,USA.D. R. Cocker III, Department of Chemical and Environmental
Engineering, University of California, Riverside, CA 92521, USA.T. Hoffmann, Institute of Spectrochemistry and Applied Spectroscopy,
P. O. Box 10 13 52, D-44013 Dortmund, Germany.J. L. Jimenez, Department of Chemistry and Biochemistry and CIRES,
UCB 216, University of Colorado, Boulder, CO 80309-0216, USA.( [email protected])C. D. O’Dowd, Department of Physics, University of Helsinki, P. O. Box
9 (Siltavuorenpenger 20D), FIN-00014, Helsinki, Finland.V. Varutbangkul, Department of Chemical Engineering, California
Institute of Technology, Mail Code 210-41, 1200 East CaliforniaBoulevard, Pasadena, CA 91125, USA.
JIMENEZ ET AL.: NEW PARTICLE FORMATION FROM DIIODOMETHANE AAC 5 - 25