Embed Size (px)
Citation preview

A method for measuring operational and financial performance of a production value
stream Tomasz Sobczyk1, Tomasz Koch1
1 Institute for Production Engineering and Automation,
Wroclaw University of Technology,
ul. Wybrzeze Wyspianskiego 27, 50-370 Wroclaw, Poland
WWW home page: http://www.pwr.wroc.pl/
Abstract. The paper explains the conceptual framework of so called costs,
effects and resources map that is intended to support performance analyses of
the production value stream. Its purpose is to enhance manufacturing decision
taking processes by providing relevant information related to production
flows. The tool consists of five modules: production system model (value
stream map), cost module, financial statement and inventory valuation module,
resources analyses module, and operational metrics module. The tool has been
equipped with appropriate metrics that enable analyses of production system
dynamics. In the last section of the paper example application of the tool in the
production environment has been explained.
1 Introduction
Lean production (also known as the Toyota Production System) triggered a global transformation in virtually every industry over the last decade and became the
foundation of dozens of books [1]. According to Womack, Jones and Ross, lean production is a means for rapidly developing world-class manufacturing skills
without massive capital investments [2]. Many companies try to imitate the Toyota Way developing their production systems based on lean assumptions. However,
numerous operational initiatives are often rejected as traditional cost accounting systems do not provide relevant and timely information to support them. Great
amount of publicity has been generated by the writings of many authors criticizing current management accounting practices and their lack of relevance to today’s
business imperatives. Some authors advocate that many accounting textbooks teach the managers to put aside understanding the concrete particulars of how the business
organizes work and focus exclusively on abstract quantitative generalizations about financial results [3]. According to Johnson managers too often manipulate processes

152 Tomasz Sobczyk, Tomasz Koch
to achieve accounting results, instead of monitoring well-run processes and occasionally checking accounting results [4]. Other authors suggest that cost cutting
exercises are too often ritual activity which gives the appearance of something happening rather than the probably much needed but less comfortable rethink of
some underlying causes of cost [5]. Some other argue that cost improvements not only come from reducing direct expenditures but also from properly managing
indirect costs. According to Miller and, most production managers understand what drives direct labor and material costs but are much less aware of what drives
overhead costs [6]. Value stream costing proposed by Maskell and Baggaley is one of the methods
that can be successfully applied for measuring performance of a lean production system [7]. Although perfectly tailored for lean production organizations, it can be of
little use by companies that are in an early stage of a lean journey . The authors articulate this by stressing the need for numerous “lean assumptions” that must be in
place before the method can be effectively used [7, p. 140]. In the paper alternative method for measuring performance of a production system will be presented. The
objective is to present a way of measuring system’s performance regardless of the company’s “lean maturity”. The method is also intended to serve as a tool for
monitoring current performance, estimation of gains envisioned by future state blueprints and individual improvement initiatives as well as assessment of value
stream performance over time.
2 Conceptual framework of the tool
Production value stream’s costs, effects and resources map (called hereafter value stream cost map) is a model used for measuring the performance of the
selected manufacturing area modeled by means of the value stream map. The idea behind the model assumes the integration of a value stream map with a set of
appropriate modules that aim at explicit description of the production system’s state over time. The concept has been graphically presented in Figure 1.
The core of the model is given by the production value stream map (see 1 in Fig. 1). A Value Stream Mapping tool derives from Toyota’s standard method for
portraying material and information flows and was adapted by Rother and Shook into value stream maps [8]. According to Womack and Jones, the mapping process
clearly reveals the potential for a major leap in performance if a relatively small number of flow and process improvements can be conducted and then sustained [9].
To measure the performance of any given value stream over time, four integrated modules have been proposed:
1. Cost module (or positioned cost pools module), in which each cost category is broken down into cost pools and any given cost pool is positioned along
appropriate processes; the cost module enables assignment of costs to production entities (see 2 in Fig. 1);
2. Financial statement and inventory valuation module (see 3 in Fig. 1); 3. Resources analyses module (see 4 in Fig. 1);
4. Additional metrics module (see 5 in Fig. 1).

A method for measuring operational and financial performance of a production value
stream
153
II IProcess 1 Process 2 Process 3
I
Cost module (positioned cost pools module)
Financial statement and inventory valuation module
Resources analyses module
Additional metrics module 5
4
3
2
1
Fig. 1. Building blocks of the value stream cost map
Developed model represents a performance measurement platform that can be used for assessing any given production system in financial and operational terms.
The model can support the analyses of: 1. State of the production system over time;
2. Financial consequences of changes presented on a value stream future state map along with establishing a set of necessary conditions required to implement
operational ideas envisioned by a future state blueprint; 3. Individual improvement initiatives and investments (creation of financial
scenarios based on different operational assumptions); 4. Value stream process costs and their root causes.
2.1 Cost pools and cost objects. Assigning costs to cost objects.
It has been assumed that in the model processes visualized by process boxes will form basic cost objects. Assignment of costs onto cost objects is a three-stage
process that consists of the following steps: 1. Grouping cost into cost categories;
2. Braking cost categories into cost pools; 3. Assigning cost pools to a single process or group of processes.
It has been proposed that depending on the needs any cost category can be
created. Cost categories must than be allocated to the processes (cost objects) using pre-defined cost pools. Three types of cost pools have been defined: single process
cost pool, group of processes cost pool, and value stream cost pool. The example configuration of cost categories and their value stream assignment has been shown in
Figure 2.
154 Tomasz Sobczyk, Tomasz Koch
$12.378
Direct labor $168.753 $32.089
$48.988
$65.433$22.234
$7.544
$7.689
Machine depreciation $32.727 $18.885 zá
$9.457 zá$7.832
II I I
$6.298
Energy $20.032
Space $26.431 $1.453
Management $23.245
Internal logistics $56.324 $56.324
$23.245
$7.654
Process 1 Process 2 Process 3
1
2
3
Total $327.512
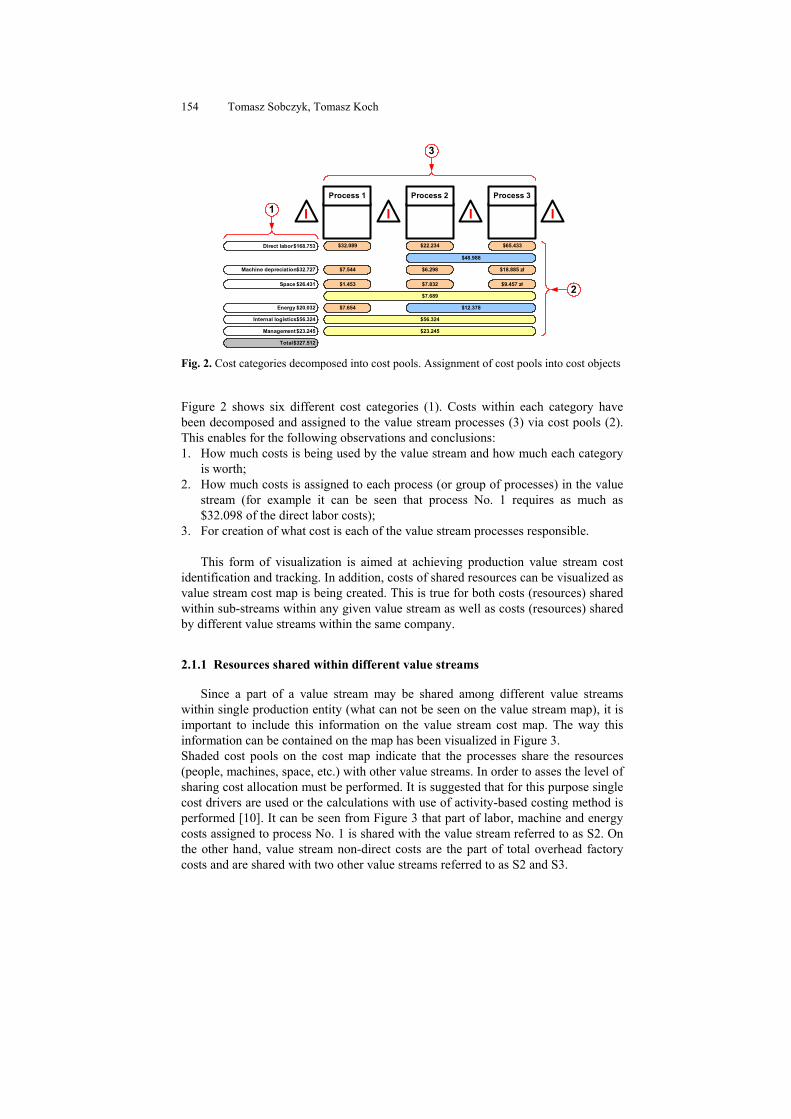
Fig. 2. Cost categories decomposed into cost pools. Assignment of cost pools into cost objects
Figure 2 shows six different cost categories (1). Costs within each category have
been decomposed and assigned to the value stream processes (3) via cost pools (2). This enables for the following observations and conclusions:
1. How much costs is being used by the value stream and how much each category is worth;
2. How much costs is assigned to each process (or group of processes) in the value stream (for example it can be seen that process No. 1 requires as much as
$32.098 of the direct labor costs); 3. For creation of what cost is each of the value stream processes responsible.
This form of visualization is aimed at achieving production value stream cost
identification and tracking. In addition, costs of shared resources can be visualized as value stream cost map is being created. This is true for both costs (resources) shared
within sub-streams within any given value stream as well as costs (resources) shared by different value streams within the same company.
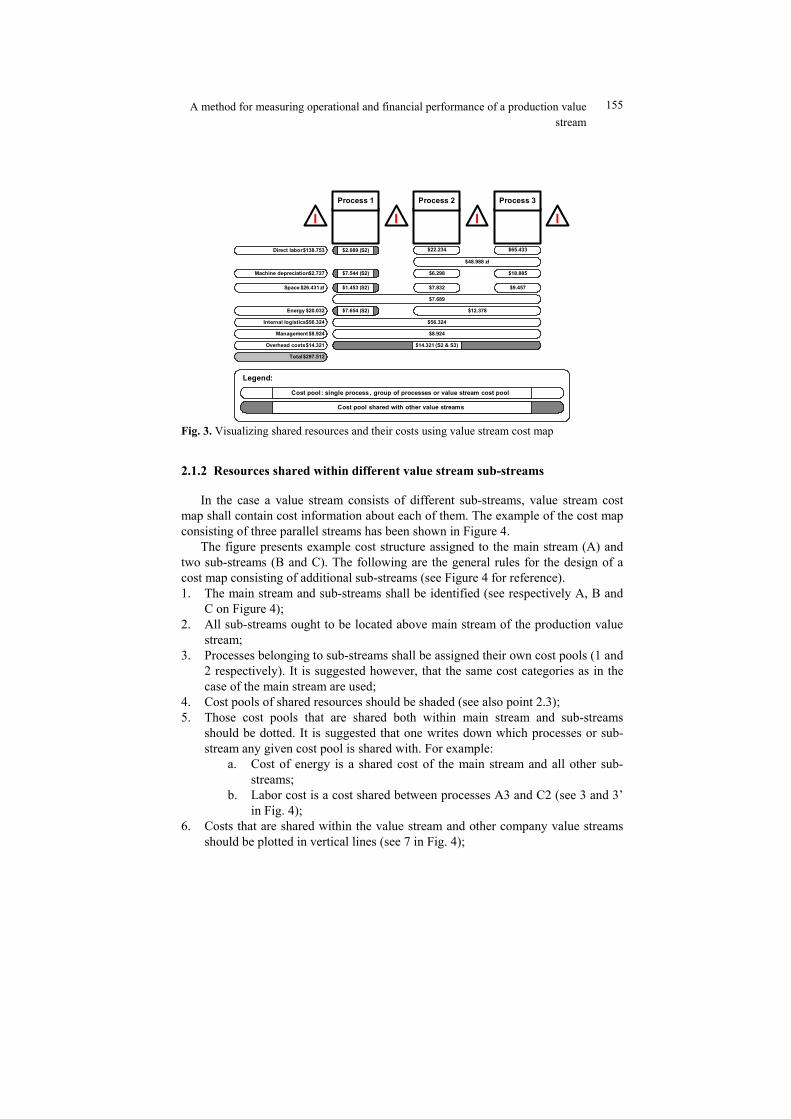
2.1.1 Resources shared within different value streams
Since a part of a value stream may be shared among different value streams
within single production entity (what can not be seen on the value stream map), it is important to include this information on the value stream cost map. The way this
information can be contained on the map has been visualized in Figure 3. Shaded cost pools on the cost map indicate that the processes share the resources
(people, machines, space, etc.) with other value streams. In order to asses the level of sharing cost allocation must be performed. It is suggested that for this purpose single
cost drivers are used or the calculations with use of activity-based costing method is performed [10]. It can be seen from Figure 3 that part of labor, machine and energy
costs assigned to process No. 1 is shared with the value stream referred to as S2. On the other hand, value stream non-direct costs are the part of total overhead factory
costs and are shared with two other value streams referred to as S2 and S3.
A method for measuring operational and financial performance of a production value
stream
155
$12.378
Direct labor $138.753 32.089 zá
$48.988 zá
$65.433$22.234
7.544 zá
$7.689
Machine depreciation $2.727 $18.885
$9.457$7.832
II I I
$6.298
Energy $20.032
Space $26.431 zá 1.453 zá
Management $8.924
Internal logistics $56.324 $56.324
7.654 zá
Process 1 Process 2 Process 3
Total $297.512
$8.924
14.321 záOverhead costs $14.321 $14.321 (S2 & S3)
$7.654 (S2)
$1.453 (S2)
$7.544 (S2)
$2.089 (S2)
Legend:
Cost pool: single process , group of processes or value stream cost pool
Cost pool shared with other value streams
Fig. 3. Visualizing shared resources and their costs using value stream cost map
2.1.2 Resources shared within different value stream sub-streams
In the case a value stream consists of different sub-streams, value stream cost map shall contain cost information about each of them. The example of the cost map
consisting of three parallel streams has been shown in Figure 4. The figure presents example cost structure assigned to the main stream (A) and
two sub-streams (B and C). The following are the general rules for the design of a cost map consisting of additional sub-streams (see Figure 4 for reference).
1. The main stream and sub-streams shall be identified (see respectively A, B and C on Figure 4);
2. All sub-streams ought to be located above main stream of the production value stream;
3. Processes belonging to sub-streams shall be assigned their own cost pools (1 and 2 respectively). It is suggested however, that the same cost categories as in the
case of the main stream are used; 4. Cost pools of shared resources should be shaded (see also point 2.3);
5. Those cost pools that are shared both within main stream and sub-streams should be dotted. It is suggested that one writes down which processes or sub-
stream any given cost pool is shared with. For example: a. Cost of energy is a shared cost of the main stream and all other sub-
streams; b. Labor cost is a cost shared between processes A3 and C2 (see 3 and 3’
in Fig. 4); 6. Costs that are shared within the value stream and other company value streams
should be plotted in vertical lines (see 7 in Fig. 4);

156 Tomasz Sobczyk, Tomasz Koch
7. One ought to calculate summary costs of each sub-stream (see 8, 9 and 10 in Figure 4) as well as total costs of the entire value stream (see 11 in Figure 4).
$546
Direct labor $36.036 2.439 zá (S1) 6.498 zá (C2)1.543 zá
2.121 zá (S1)
$5.435
Machine depreciation $9.446 567 zá
114 zá221 zá
II I I
234 zá
Energy $26.622
Space $803 167 zá (S1)
Overhead costs $18.924
Internal logistics $6.324 6.324 zá (S2 i S3)
7.654 zá (S1)
Process A1 Process A2 Process A3
Total A $93.552
18.924 zá
$14.321
I
Process A4 Process A5
IProcess C1 Process C2
I I
$1.436Robocizna bezpoĞrednia (3.781 zá)
Maszyny i urządzenia (564 zá)
Powierzchnia (453 zá)
Energia technologiczna (1.667 zá)
2.345 zá (A3)
$564
$127
IProcess B1 Process B2
I I
$256
Robocizna bezpoĞrednia (3.211 zá)
Maszyny i urządzenia (1.017 zá)
Powierzchnia (455 zá)
Energia technologiczna (1.437 zá)
$761
$3.211
$455
$7.345 $18.221
$5.112 $1.412
$178 $123
$1.987 $16.435
2.689 zá (B i C)
Razem C (6.465 zá)
Razem B (8.659 zá)
$326
Total costs $127.600
Legend:
Stream A
Substream B
Substream C
Management $14.321
$18.924 (S2 & S3)
$6.324 (S2 & S3)
$2.689 (B & C)
$2.439 (S1) 6.488 zá (C2)
$2.345 (A3)
$2.121 (S1)
$167 (S1)
$7.654 (S1)
3
3'
1
2
45
67
8
9
1011
Cost pool: single process, group of processes or value stream cost pool
Pool of costs shared within analyzed value stream
Pool of costs shared with other value streams
Pool of costs shared within analyzed value stream and other value streams
$1.437 (A & C)
$1.667 (A & B)
Fig. 4. Example value stream cost map consisting of the main value stream and two parallel
sub-streams
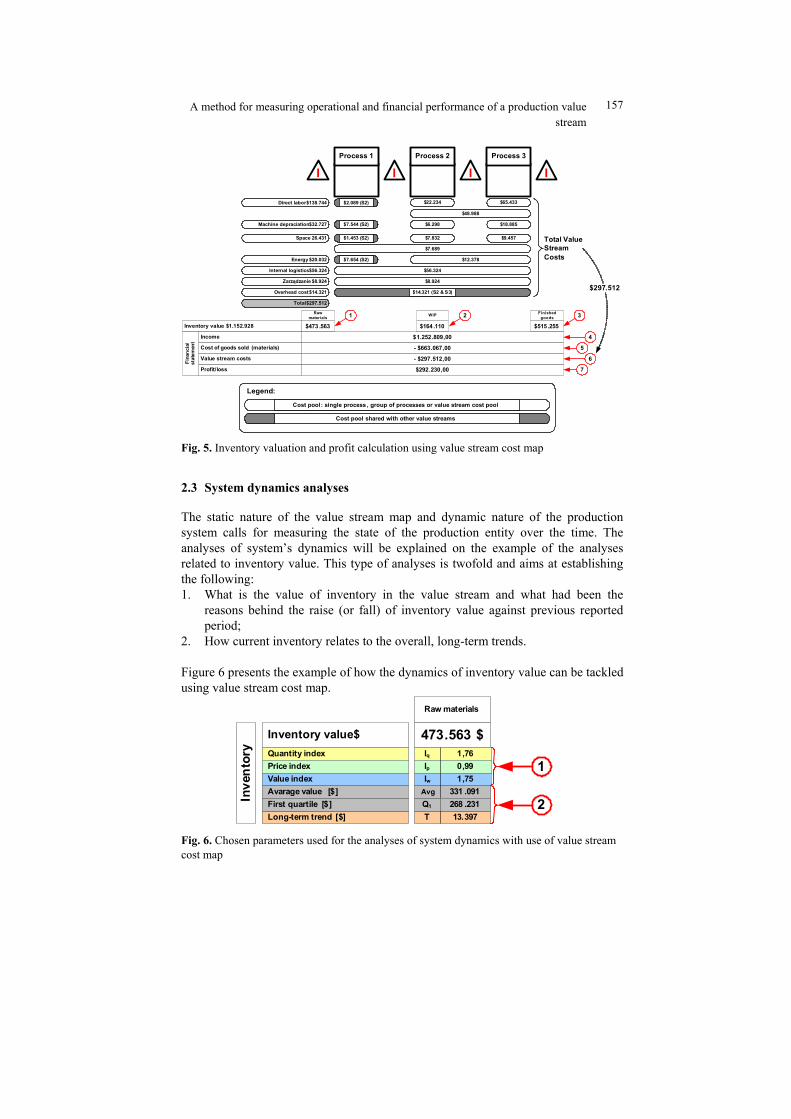
2.2 Financial statement and inventory valuation module
Financial results are calculated using throughput costing methodology to prevent
overproduction. This implies that all costs except from material costs are regarded period costs. What is more, in valuing the inventory only material costs are taken
into consideration. Figure 5 presents the value stream cost map linked with financial statement and inventory valuation module.
Selected positions are related to: 1. Value of inventory at the end of the analyzed period (see 1, 2 and 3 in Fig. 5);
2. Income reported at the end of the analyzed period (see 4 in Fig. 5); 3. Cost of goods sold throughout the analyzed period (see 5 in Fig. 5);
4. Value stream costs incurred in the analyzed period (the sum of all cost pools); 5. Amount of revenue gained in the period.
A method for measuring operational and financial performance of a production value
stream
157
$12.378
Direct labor $138.744 32.089 zá
$48.988
$65.433$22.234
7.544 zá
$7.689
Machine depraciation $32.727 $18.885
$9.457$7.832
II I I
$6.298
Energy $20.032
Space 26.431 1.453 zá
Zarządzanie $8.924
Internal logistics $56.324 $56.324
7.654 zá
Process 1 Process 2 Process 3
Total $297.512
$8.924
14.321 záOverhead cost $14.321 $14.321 (S2 & S3)
$7.654 (S2)
$1.453 (S2)
$7.544 (S2)
$2.089 (S2)
Legend:
Cost pool: single process, group of processes or value stream cost pool
Cost pool shared with other value streams
Inventory value $1.152.928 $473 .563 $515 .255$164 .110
Raw materials
WIP Finished goods
Profit/loss $292.230,00
Income $1.252.809,00
Cost of goods sold (materials) - $663.067,00
Value stream costs - $297.512,00 6
5
4
21 3
Total Value Stream Costs
$297.512
7
Fin
anci
al
stat
emen
t
Fig. 5. Inventory valuation and profit calculation using value stream cost map
2.3 System dynamics analyses
The static nature of the value stream map and dynamic nature of the production system calls for measuring the state of the production entity over the time. The
analyses of system’s dynamics will be explained on the example of the analyses related to inventory value. This type of analyses is twofold and aims at establishing
the following: 1. What is the value of inventory in the value stream and what had been the
reasons behind the raise (or fall) of inventory value against previous reported period;
2. How current inventory relates to the overall, long-term trends.
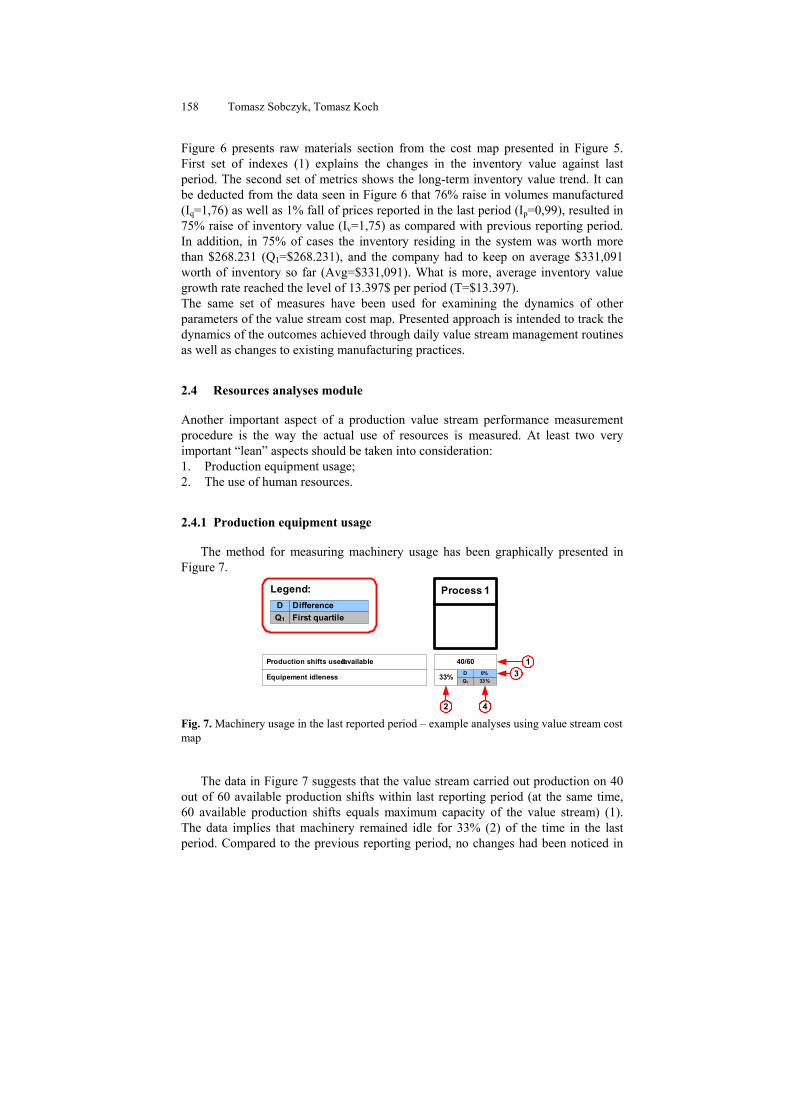
Figure 6 presents the example of how the dynamics of inventory value can be tackled using value stream cost map.
Inventory value $ 473.563 $
Raw materials
1,760,991,75
331 .091
13.397
IqIpIw
Inve
nto
ry
T
Quantity indexPrice indexValue indexAvarage value [$]
Long-term trend [$]
1
2First quartile [$] Q1
Avg
268 .231
Fig. 6. Chosen parameters used for the analyses of system dynamics with use of value stream
cost map
158 Tomasz Sobczyk, Tomasz Koch
Figure 6 presents raw materials section from the cost map presented in Figure 5. First set of indexes (1) explains the changes in the inventory value against last
period. The second set of metrics shows the long-term inventory value trend. It can be deducted from the data seen in Figure 6 that 76% raise in volumes manufactured
(Iq=1,76) as well as 1% fall of prices reported in the last period (Ip=0,99), resulted in 75% raise of inventory value (Iv=1,75) as compared with previous reporting period.
In addition, in 75% of cases the inventory residing in the system was worth more than $268.231 (Q1=$268.231), and the company had to keep on average $331,091
worth of inventory so far (Avg=$331,091). What is more, average inventory value growth rate reached the level of 13.397$ per period (T=$13.397).
The same set of measures have been used for examining the dynamics of other parameters of the value stream cost map. Presented approach is intended to track the
dynamics of the outcomes achieved through daily value stream management routines as well as changes to existing manufacturing practices.
2.4 Resources analyses module
Another important aspect of a production value stream performance measurement
procedure is the way the actual use of resources is measured. At least two very important “lean” aspects should be taken into consideration:
1. Production equipment usage; 2. The use of human resources.
2.4.1 Production equipment usage
The method for measuring machinery usage has been graphically presented in Figure 7.
Equipement idleness 33%Q1 33%
0%D
40/60Production shifts used/available
Process 1
13
2 4
DifferenceFirst quartile
DQ1
Legend:
Fig. 7. Machinery usage in the last reported period – example analyses using value stream cost
map
The data in Figure 7 suggests that the value stream carried out production on 40
out of 60 available production shifts within last reporting period (at the same time, 60 available production shifts equals maximum capacity of the value stream) (1).
The data implies that machinery remained idle for 33% (2) of the time in the last period. Compared to the previous reporting period, no changes had been noticed in
A method for measuring operational and financial performance of a production value
stream
159
that matter (3). However 75% of cases, production equipment stayed non-productive for not less than 33% (4).
In addition to the usage of the machinery, it is important to consider the use of human resources as well as associated labor costs and its productivity.
2.4.2 Human resources usage
Given that human resources are active does not necessarily imply that they are productive. Hence, there is a need to distinguish between different types of human
activities carried out and the amount of time they require. The basis for comparison is the time devoted to production which can be divided into categories shown in
Figure 8. Each category that impacts the use of resources in a given process (1) has been
assigned percentage of time out of total available time used by the process in the analyzed period (2). In addition, each category has been equipped with appropriate
indexes similar to those presented on Figure 6 to measure the dynamics of changes as improvement initiatives take place (3).
Given the example from Figure 1 one can arrive at the following conclusions: 1. 40% of time the resources were used for actual production 8.3% of which was
overproduction. 2. Even though production volume was higher than required, customer satisfaction
reached only 95% (the value stream produced more than expected however not the part numbers that were needed) (4).
It important to realize that the time used for production was close to 40% what
suggests that the rest of it was wasted (see relevant categories in Fig. 8). It also implies that one should search for causes of wasted human effort that is the effect of
existing production practices. If connected to the cost module, the tool enables the following:
1. Analyses of the cost of waste related to any activity within value stream; 2. Analyses of the potential gains due to waste elimination.
These two enablers will be explained in more detail in point 3.
2.5 Additional metrics module
Depending on the production type, metrics used by the company/corporation, or
individual needs of the user, the cost map may be supplemented by additional set of operational and financial indexes. In addition, the dynamics of the parameters can be
measured by means of proposed set of indexes explained in point 2.4.

160 Tomasz Sobczyk, Tomasz Koch
Hu
man
res
ourc
es u
sage
leve
l
Mo
dule
No.
3
IIProcess 1
1 2
3
Difference
Trend
First quartileD
T
Q1
Legend:
Overproduction
Changeovers
Brakedowns
Stoppages
Production
Customer satisfaction %
Idleness
8,3%
40,2%
14,4%
95
-8,0%DQ1 42,6%
-24,0%DQ1 4,7%
1,5D
5,0%7,2%D
5,3% -1,7%D
25,1% 21,0%DQ1 26,6%
Avg
T 596,7
T -8,5%
T -0,7%
T -2,3%
T 9,5%
T -2,5%
T 7,5%
Avarage valueAvg
4
Fig. 8. Categories of activities performed by human resources employed in the production
value stream – notation of the value stream cost map
3 Application of the tool
The application of the cost map will be explained on the example of the company manufacturing metal nets used in coal mines. The data was gathered on the basis of
six-month project. Four complementary ways of use have been graphically presented in Figure 9.
As it can be seen in Figure 9, the model is based on the production current state value stream map (1). The tool can be used for the following analyses:
1. value stream current state operational and financial performance measurement (1);
2. monitoring operational and financial performance of the value stream over time (2);
3. operational and financial assessment of the future state blueprint; 4. operational and financial assessment of the individual improvement initiatives
(both technical and organizational) (4).
The application of the latter issue will be explained in more detail in the following section of the paper. It has been assumed that the reference for the following
analyses will be the cost map designed in May 2006.
3.1 Operational and financial assessment of the individual improvement initiatives
Modernization of the existing fabrication cell became the study with use of value stream cost map methodology. Improvement ideas became the subject to further
assessment. Proposed changes were related to reduced cycle times and improved use of production resources. It had been assumed that additional investment ($ 1.320 for

A method for measuring operational and financial performance of a production value
stream
161
fixtures and $5.000 for employee training) would be required. Achieved results in form of the value stream cost map are presented in Figure 10.
Current state map
Period 1
Future state map
Period 2
Improvement project No. 1
Improvement project No. 2
Period 3
Beginning of project implementation phase
Period n
Monitoring operational and financial
performance of a value stream over time (subsequent time
periods )
Analyses of the current production system state
(costs, effects, resources , etc.)
Analyses of the potential benefits resulting from the implementation of
individual improvement projects
Improvement project No. 3
Analyses of the potential benefits resulting from
the implementation of the future state blueprint
Blueprint for implementation
START
Beginning of project implementation phase
1
2
4
3
Future state analyses (potential effects and results )
Current state analyses (current effects and results )
Legend:
Fig. 9. Four complementary ways of using value stream cost map methodology
Expected changes to map’s analytical positions have been colored. According to
data in Figure 10 proposed organizational and technical changes lead to the following considerations:
1. The same production volume might be manufactured using half of the resources available (1); this in turn leads to 50% reduction in direct labor costs (2);
2. Increase in productive use (3) and at the same reduction in non-productive use of resources (4);
3. 10% reduction in value stream costs and 64% profitability increase (5); Similarly to the future state financial considerations it is possible to propose many
different scenarios based on different assumptions. What is more, the model can be used for assessing the impact of operational changes that may not have any influence
on bottom-line results. In this case such a scenario may be rejected.
4 Summary and conclusions
The platform for measuring performance of a production value stream called
value stream cost map has been presented. In the research work, value stream mapping method has been linked to the cost analyses module and integrated with:
1. financial statement and inventory valuation module (based on throughput costing methodology);

162 Tomasz Sobczyk, Tomasz Koch
2. resources analyses module; 3. operational metrics module.
1 4 21
IC/T=10 s
Cutting (5)
C/O=10 min
C/T=5 s
Welding (4)
C/O=15 min
UP=95%
IC/T=5 s
Bending (2)
C/O=20 min IIC/T=22 s
Production preparation (4)
C/O=1 h
UP=95%
IUP=95%UP=90%
$4.919Direct labor $14.696 (̌ 40%)
Serwis i konserwacja urządzeĔ $1.600
Energy $4.960
Space $100
Other costs $45.958
Internal logistics $1.258
Total $82.863 (ˇ10,6%)
Overhead costs 52.176 zá
$4.192(ˇ 50%) $2.295 (ˇ 50%)
$3.290 (ˇ 50%)
$1.600
$1.308 $1.549 $1.123
$45
$100
Spare parts $10.266 $1.217
$794
$8.255
$4.960 (S2 & S3)
$1.258 (S2 & S3)
$45.958 (S2 & S3)
Direct costs $30.687 (ˇ 24,2%)
Machine depreciation $4.025
47.231 zá36.750 zá
WIP Finished goods
Profit/Loss
Income 688.865 záCosts of goods sold (materials) 580.986 záValue stream costs
Total inventory value
$83.981
Mo
dule
1
82.863 zá (ˇ 10,6%)25.016 zá (^64,1%)
Mod
ule
2M
odu
le 3
Mod
ule
4P
rodu
ctio
n va
lue
stre
am
Overproduction
Changeovers
Brakedowns
Stoppages
Production
Customer satisfaction %
Idleness
9%
71,7% (^14,3%)
0,2%
90
Equipement idleness
0,4%
12,1%
15,6% (ˇ 14,3%)
9,9%
71,7% ( 2̂1,5%)
0,2%
90
2,3%
0,8%
25,0% (ˇ21,5%)
10,9 daysLead time
Number of goods sold 144.800 units
Number of goods manufactured 123.900 units
50% 50%
30/60 (ˇ50%)Production shifts used/available 1
2
3
4
5
Fig. 10. Assessment and validation of the improvement project with use of value stream cost
map
Graphical structure of the model supports analyses of the state of a production
value stream with parallel focus on resources usage, costs, profits, value of inventory, and other important operational and financial parameters. The potential
users of the model are manufacturing engineers and production managers who look for appropriate tool to support their strategic and daily operational decisions.
The model is an alternative solution for the existing performance measurement systems (particularly traditional cost accounting and management systems). It has
been proved that it can be successfully applied by the production facility. The major distinction to value stream costing proposal is that the value stream cost map:
1. Does provide alternative method for measuring profitability and resources usage as well as the costs of individual processes and the entire value stream;
A method for measuring operational and financial performance of a production value
stream
163
2. Utilizes existing inventory valuation method based on throughput approach; 3. Does not require the resources (costs) to be dedicated process costs (it visualizes
costs of shared resources); 4. Can be used by any company regardless of the maturity in Lean Manufacturing
implementation; 5. Provides graphical representation of the value stream’s operational and financial
data – usually on one piece of paper; 6. Supports analyses of complex value streams with many fabrication sub-streams;
7. Enables the analyses of the dynamics of any given production value stream.
The method can be used by any company regardless of its size, country of origin or production profile as long as the production system can be modeled by means of
the value stream map.
References:
1. Liker, J., K., The Toyota Way: 14 Management Principles from the World’s Greatest Manufacturer, McGraw-Hill 2004.
2. Womack, J., P., Jones, D., T., Ross, D., The Machine That Changed the World. Who’s ahead in the Global Auto Wars and why: Japan’s Revolutionary Leap from
Mass Production to Lean Production And What Industry Everywhere can Learn from, Simon & Schuster Inc., p. 256.
3. Johnson, T.H.; Broms, A., Profit Beyond Measure : Extraordinary Results through
Attention to Work and People, Free Press, November 2000, p. 58.
4. Johnson, T.H., 1992, Relevance Regained: From Top-Down Control to Bottom-Up Empowerment, Free Press, January 2002, p. 26.
5. Slack, N., 1992, The Manufacturing Advantage: Achieving Competitive Manufacturing Operations, Management Books 2000 (April 1992), p. 99.
6. Miller, J.G.; Vollmann, T.E., The Hidden Factory, Harvard Business Review,
September-October 1985, p.143.
7. Maskell, B., H., Baggaley, B., Practical Lean Accounting. A Proven System for Measuring and Managing the Lean Enterprise, Productivity Press Inc. 2003.
8. Rother, M., Shook, J., Learning to See, Ver. 1.3, The Lean Enterprise Institute, 2003.
9. Womack, J.P.; Jones, D.T., Lean Thinking. Banish Waste and Create Wealth in
Your Corporation, The Free Press 2003, p. 316.
10. Sobczyk, T., Koch, T., Cost Management Framework for a Value Stream, International Conference on Changeable, Agile, Reconfigurable and Virtual
Production.