Embed Size (px)
DESCRIPTION
Journal
Citation preview
RESEARCH Open Access
A mathematical model of quorum sensingregulated EPS production in biofilm communitiesMallory R Frederick1*, Christina Kuttler2, Burkhard A Hense3 and Hermann J Eberl1*
* Correspondence:[email protected];[email protected] of Mathematics andStatistics, University of Guelph, 50Stone Rd E, Guelph ON CanadaN1G 2W1Full list of author information isavailable at the end of the article
Abstract
Background: Biofilms are microbial communities encased in a layer of extracellularpolymeric substances (EPS). The EPS matrix provides several functional purposes forthe biofilm, such as protecting bacteria from environmental stresses, and providingmechanical stability. Quorum sensing is a cell-cell communication mechanism usedby several bacterial taxa to coordinate gene expression and behaviour in groups,based on population densities.
Model: We mathematically model quorum sensing and EPS production in a growingbiofilm under various environmental conditions, to study how a developing biofilmimpacts quorum sensing, and conversely, how a biofilm is affected by quorumsensing-regulated EPS production. We investigate circumstances when usingquorum-sensing regulated EPS production is a beneficial strategy for biofilm cells.
Results: We find that biofilms that use quorum sensing to induce increased EPSproduction do not obtain the high cell populations of low-EPS producers, but canrapidly increase their volume to parallel high-EPS producers. Quorum sensing-induced EPS production allows a biofilm to switch behaviours, from a colonizationmode (with an optimized growth rate), to a protection mode.
Conclusions: A biofilm will benefit from using quorum sensing-induced EPSproduction if bacteria cells have the objective of acquiring a thick, protective layer ofEPS, or if they wish to clog their environment with biomass as a means of securingnutrient supply and outcompeting other colonies in the channel, of their own or adifferent species.
BackgroundBiofilms, quorum sensing, and EPS
Biofilms are microbial communities encased in a layer of extracellular polymeric sub-
stances (EPS), adhered to biotic or abiotic surfaces. Bacteria preferentially reside in bio-
films, rather than in isolation as planktonic cells. In a biofilm, bacteria are protected by
the EPS matrix from external stresses, and carry out a wide range of reactions which
are relevant in many disciplines, such as environmental engineering, food processing,
and medicine [1].
Quorum sensing is generally interpreted as a cell-cell communication mechanism
used by several bacterial taxa to coordinate gene expression and behaviour in groups,
based on population densities [2]. Initially, bacteria cells produce and release low
amounts of signalling molecules, called autoinducers (e.g., acyl-homoserine lactones
(AHL) in Gram-negative bacteria). Concurrently, the cells measure the environmental
Frederick et al. Theoretical Biology and Medical Modelling 2011, 8:8http://www.tbiomed.com/content/8/1/8
© 2011 Frederick et al; licensee BioMed Central Ltd. This is an Open Access article distributed under the terms of the CreativeCommons Attribution License (http://creativecommons.org/licenses/by/2.0), which permits unrestricted use, distribution, andreproduction in any medium, provided the original work is properly cited.

concentration of the autoinducer. When a critical concentration is reached, changes in
gene expressions are induced. In most bacterial autoinducer systems, the autoinducer
synthase gene itself is upregulated, initiating positive feedback, and the bacteria subse-
quently produce AHL molecules at an increased rate. As a number of traits in bacterial
biofilms relevant for human and plant health are regulated via autoinducers [3,4], a
comprehensive understanding of quorum sensing systems is highly desirable. EPS is
composed of organic molecules such as polysaccharides, proteins, and lipids. The EPS
matrix provides several functional purposes for the biofilm, such as protecting bacteria
from environmental threats, providing mechanical stability, and degrading macromole-
cules to be used by the cells [5]. EPS is thought to indirectly store nutrients, which
could later be converted to an available form and used as an energy source during per-
iods of low nutrient availability [6-9].
Modelling of biofilms and quorum sensing
Biofilms are complex systems that can be viewed simultaneously as microbial ecologi-
cal communities and as mechanical objects. Traditional one-dimensional biofilm mod-
els were formulated as free boundary value problems of semi-linear diffusion reaction
systems (see [10]). Newer models take the spatially heterogeneous structure of biofilms
into account and are formulated as spatially multi-dimensional models. A host of
mathematical modelling techniques has been proposed to model biofilms, including
stochastic individual based models, stochastic cellular automata models, and a variety
of deterministic partial differential equation models. Some examples for such
approaches are: [11-25]. These models of biofilm structure are usually coupled with
diffusion-reaction models for growth controlling substrates such as nutrients and oxy-
gen. This leads to hybrid models which are mathematically difficult to analyse and
often only amendable to computational simulations. In most biofilm models, EPS is
not explicitly included but implicitly subsumed in the variables that describe biomass
and biofilm structure. Some early exceptions are the one-dimensional model of [26],
the hybrid individual-continuum model of [11], the hydrogel model of [20], and the
diffusion-reaction model [27].
For our study we build on the prototype biofilm model of [16], in which the biofilm
structure is described by a determinstic, density-dependent diffusion-reaction equation
with two nonlinear diffusion effects: porous medium degeneracy and a super-diffusion
singularity. This model has been extended to explicitly account for EPS in [27] based
on [26], and to model quorum sensing in [28]. In the current study, we combine both
effects.
Although the various multi-dimensional biofilm models are based on fundamentally
different assumptions, such as ecological vs. mechanical properties of biofilms, and
although they utilise different mathematical concepts, such as discrete stochastic vs
deterministic continuous descriptions, they have been shown to predict similar biofilm
structures in [10]. More recently it was formally shown that the prototype density-
dependent diffusion-reaction biofilm model, on which our study is based, can be
derived from a spatially discrete lattice model that is related to cellular automata bio-
film models [29]. In [28], it was also shown that the same prototype density-dependent
diffusion-reaction model can likewise be derived from a the same hydrodynamic
description of biofilms that underlies the biofilm model introduced by [15]. Thus, the
Frederick et al. Theoretical Biology and Medical Modelling 2011, 8:8http://www.tbiomed.com/content/8/1/8
Page 2 of 29
density-dependent diffusion model of biofilms can be understood as bridge between
ecological and continuum mechanical views in biofilm modelling. The idea of using
nonlinear diffusion processes, in the form of modified Cahn-Hilliard equations, to
describe the propagation of the biofilm/water interface, is also used in current, physi-
cally more involved phase field models, as introduced in [24].
Initial mathematical models of quorum sensing describe the phenomena in sus-
pended bacteria cultures [30-32]. These models focus on predicting the rapid switch in
proportions of down- and upregulated sub-populations of bacteria in a batch culture,
which is the characteristic positive-feedback feature of quorum sensing systems. Papers
[33-35] extended the work of early models to study quorum sensing in a growing bio-
film, identifying key physical kinetics parameters required for induction. More recent
models describe growth in two dimensions [28], and include the effects of hydrody-
namics [28,36,37]. A variety of applications motivate development of specific quorum
sensing and biofilm models. For example, papers [34,35] determine the critical depth
the biofilm must grow to, as a function of pH, in order for induction to occur. The
models of [38-40] detail biochemical pathways in quorum sensing systems, also
describing anti-quorum sensing treatments for applications in the medical field. The
role of convective and diffusive transport of signal molecules in inter-colony communi-
cation within biofilm communities is investigated in [28].
These models share a common element: autoinducer molecules (e.g., AHL) are pro-
duced by downregulated bacteria, and AHL production is greatly enhanced when the
characteristic switch (change from low to high quorum sensing activity) rapidly occurs
throughout the biofilm.
Much mathematical modelling research has been conducted to understand when bio-
films partake in quorum sensing activity, for example, determining population thresh-
olds [30,31], critical biofilm depth [34,35], and the influence of the hydrodynamic and
nutritional environment [28,36,41]. There have, however, been few studies that look at
the reverse effect - the effect of quorum sensing induction on biofilms. Once biofilm
cells are upregulated, AHL is produced at an increased rate, but the question of
whether the biofilm behaves differently, grows differently, or undergoes some other
functional change, remains largely unanswered.
We expand on the works of [38-40,42]. Study [42] analyzes the effectiveness of the
modelled anti-quorum sensing therapies by comparing growth rates of the biofilms,
and states that quorum sensing activity may be detected by EPS production and asso-
ciated enhanced biofilm growth. Based on the findings of [43], it is assumed in [42]
that EPS production is regulated by quorum sensing, and models significantly
enhanced EPS production by upregulated cells. With our model, we will study in detail
how the process of quorum sensing-regulated EPS production impacts biofilm growth
and development in a two-dimensional patchy biofilm community with slow back-
ground flow, under various environmental conditions. Our objective is to understand
the relationship between quorum sensing, biofilm growth, and EPS production, and
investigate the benefits a biofilm receives by using quorum sensing-regulated EPS
production.
To validate the claim that quorum sensing controls EPS production, and to what
degree, we turn to the experimental literature. In many studies, quorum sensing has
been found to impact the quality of EPS. For example, study [44] showed differences
Frederick et al. Theoretical Biology and Medical Modelling 2011, 8:8http://www.tbiomed.com/content/8/1/8
Page 3 of 29

in biofilm appearance with and without expression of the pelA gene, which is essential
for the production of the EPS matrix. In a later study of the quorum sensing-regulated
expression of the PelA enzyme, it was shown that pel-genes are required for EPS pro-
duction [45]. On the other hand, [46] found many factors which affect the quality of
the EPS matrix to be regulated by quorum sensing in the early development stage,
such as channel production within the biofilm, swarming activity, and lipid production.
Also, many studies have shown the connection between quorum sensing and mucosity
[47-49]. Quorum sensing regulates components of EPS (e.g., EPS II, polysaccharides)
which contribute to the mucosity, thus impacting the biofilm matrix. These studies
support the idea that the amount of EPS production per cell might be influenced by
quorum sensing, but do not show to what degree.
There are some examples of bacteria species, mostly plant pathogens, in which a
quantitative increase of EPS production by quorum sensing regulation has been
demonstrated. In [50], quorum sensing was found to regulate alginate production in
Pseudomonas syringae. Alginate is an important component of EPS, and without
quorum sensing, alginate levels were 70% lower. However, the impact on biofilm thick-
ness is not described, so conclusions cannot be drawn regarding whether overall EPS is
significantly reduced by the drop in alginate levels.
In [51] it is concluded that the amount of EPS production per cell in a Pantoea
stewartii biofilm is increased by quorum sensing, though the degree of production
is not given. Similarly, in [52] is claimed that quorum sensing upregulated EPS pro-
duction in the plant pathogen Erwinia amylovora, but do not provide quantitative
data. However, images are shown, from which the upregulated EPS may be esti-
mated as a factor five to ten increase. This is supported by the experiments in [53],
in which an approximately ten-fold increase of EPS production in a Pantoea stewar-
tii biofilm upon QS induction was discovered. Though many studies have estab-
lished connections between quorum sensing activity and qualitative changes in EPS
or other structural components, there are very few quantitative studies which inves-
tigate the amount of EPS produced through quorum sensing regulation. We choose
to use the direct values for change in EPS production as reported in [53] as an esti-
mate for the difference in downregulated and upregulated cell production rates in
our system.
Aim of study
In previous research, we developed a two-dimensional model of quorum sensing in
patchy biofilm communities in an early development stage to study how the hydrody-
namic environment and nutrient conditions contribute to biofilm growth, spatiotem-
poral quorum sensing induction patterns, and flow-facilitated intercolony
communication [28].
In this paper, we will extend this model to include a response from the biofilm once
quorum sensing has been induced. The upregulated cells not only produce AHL at
increased rates, but produce EPS at an increased rate as well. We wish to investigate
whether QS regulated EPS production provides a benefit (in some sense) over a EPS
production strategy at fixed rate. In order to do so, we address two main research
questions with our model:
Frederick et al. Theoretical Biology and Medical Modelling 2011, 8:8http://www.tbiomed.com/content/8/1/8
Page 4 of 29

1. How does quorum sensing-regulated EPS production impact the growing biofilm?
2. Why is it beneficial for the biofilm to regulate EPS production using a quorum
sensing mechanism?
Answers to these questions will be sought through numerical experiments that simu-
late the growth of biofilms in microfluidic chambers.
Mathematical Model and Simulation DesignModel assumptions
We formulate a mathematical model that describes quorum sensing in a growing bio-
film community in a narrow conduit which consists of several colonies, mimicking
conditions that occur in soil pores or plant/blood vessels. The biofilm is assumed to
consist of bacterial cells and EPS, and it is described by the local densities of its consti-
tuents. The biofilm proper is the region in which these densities are not zero; it is sur-
rounded by the bulk liquid. The biofilm expands due to cell growth and EPS
production, both of which are coupled to the availability of a carbon nutrient. The
nutrient is assumed to be dissolved. In the aqueous phase surrounding the biofilm, the
nutrient is transported by bulk flow convection and by Fickian diffusion. In the biofilm
itself it diffuses, although at reduced rate due to the increased diffusive resistance of
the EPS and cells. Nutrients are degraded in the biofilm by the growing cells for
growth and EPS production.
We distinguish between down- and upregulated bacterial cells. Upregulation and
downregulation are controlled by the local concentration of AHL. Upregulation occurs
locally when and where the AHL concentration exceeds a threshold. If the AHL con-
centration in a (partially) upregulated biofilm colony drops below this critical thresh-
old, the upregulated cells become downregulated. AHL is also assumed to be dissolved.
AHL is transported by convection and diffusion in the surrounding aqueous phase, and
by diffusion in the biofilm, also at a reduced rate. After AHL is produced by the bac-
teria, it diffuses into the aqueous phase. Upregulated cells produce AHL at a higher
rate (by one order of magnitude) than downregulated cells, and decay abiotically, at a
rate much slower than they are produced.
We assume that up- and downregulated cells grow at the same rate, but upregulated
cells produce EPS at much higher rates (tenfold). Moreover, we assume that the aver-
age cell size for down- and upregulated bacteria is the same, i.e., the maximum cell
and EPS density is the same for both cell types. The increased production of EPS
implies an increased nutrient consumption of upregulated cells. Based on the para-
meters for EPS production kinetics and stoichiometry of [26], we estimate with a sim-
ple rule of proportions that upregulated cells consume approximately twice the
amount of nutrients that down-regulated cells consume. We do not distinguish
between the EPS that is produced by each type of bacteria, but combine them into one
EPS fraction.
In addition to bacteria that engage in quorum sensing, i.e., switch between down-
and upregulated states, we also consider non-quorum sensing bacteria species, which
behave as either downregulated or upregulated cells, in regards to parameters for
growth, consumption, and EPS production. These non-quorum sensing cells carry an
AHL-receptor mutation and cannot be upregulated or produce any AHL. Although
Frederick et al. Theoretical Biology and Medical Modelling 2011, 8:8http://www.tbiomed.com/content/8/1/8
Page 5 of 29
they are technically mutant cells, we will refer to these non-quorum sensing bacteria as
different species throughout the paper.
We formulate this model in the framework of the density-dependent nonlinear diffu-
sion model for biofilms which was originally introduced for a prototype single species
biofilm in [16], and has since been extended to multi-species systems. Quorum sensing
was first included in this model in our earlier study [28]. In the current study, we
expand on this model by explicitly accounting for EPS, which was previously implicitly
subsumed in the biomass fractions. Our model of EPS production is based on the one-
dimensional biofilm model of [26]. Some authors suggest that under conditions of
severe nutrient limitations, EPS could be broken down and converted into nutrients by
the cells [6-9,54]. Following [26], we include this process as an option in our model
and investigate whether it affects quorum sensing activity and biofilm composition.
Governing equations
The mathematical model for biofilm growth, quorum sensing, and EPS production,
based on the above assumptions, is formulated as a differential mass balance for the
bacterial biomass fraction, EPS, growth-promoting nutrient substrate and quorum sen-
sing molecules.
Following the usual convention of biofilm modelling, the density of the particulate
substances (bacterial cells and EPS), is expressed in terms of the volume fraction that
they occupy [10]. We denote the volume fraction locally occupied by downregulated
quorum sensing cells by M0 [-], the volume fraction of upregulated quorum sensing
cells by M1 [-]. Their densities are accordingly M0 *Mmax and M1*Mmax, where the
constant Mmax [gm-3] is the maximum biomass density, in terms of mass COD per
unit volume.
The non-quorum sensing bacteria are accordingly expressed in terms of the volume
fractions M2 (downregulated cells) and M3 (upregulated cells). A summary of the cell
types and behaviours is given in Table 1.
Similarly, EPS density is expressed in terms of its variable volume fraction EPS [-]
and the constant maximum EPS density EPSmax [gm-3], as EPS * EPSmax.
The dissolved growth controlling nutrient substrates and the dissolved quorum sen-
sing molecules are described in terms of their concentrations C [gm-3] and AHL [nM].
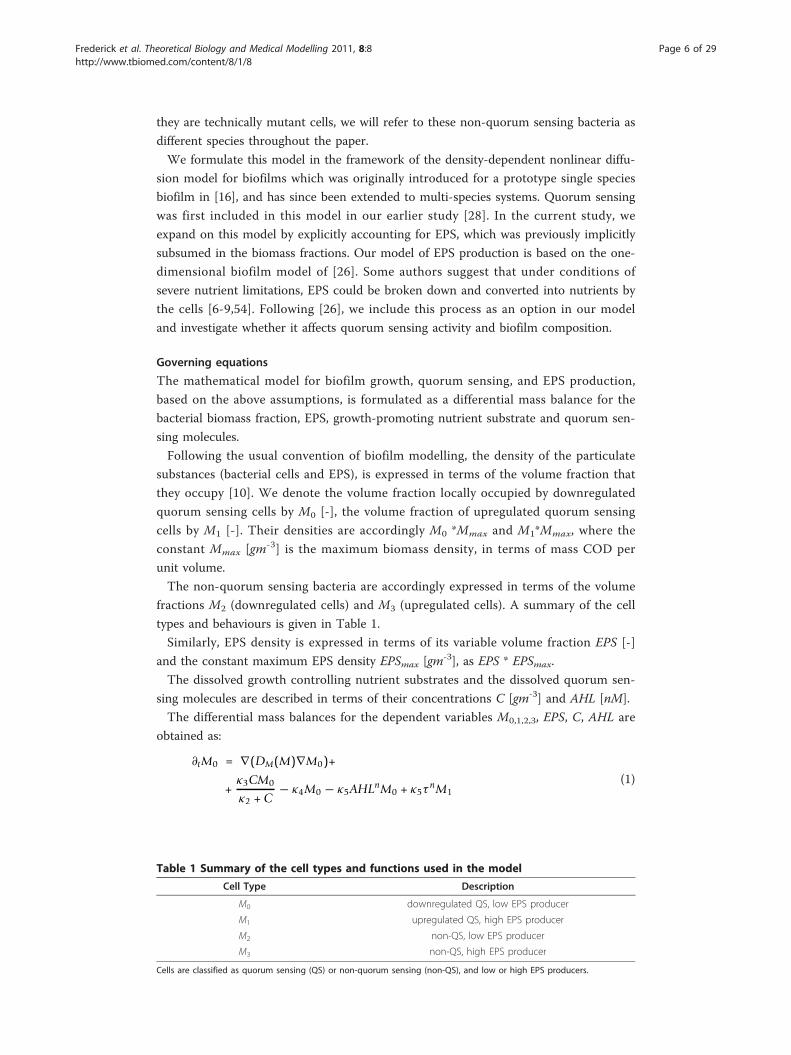
The differential mass balances for the dependent variables M0,1,2,3, EPS, C, AHL are
obtained as:
∂tM0 = ∇(DM(M)∇M0)+
+κ3CM0
κ2 + C− κ4M0 − κ5AHLnM0 + κ5τ
nM1(1)
Table 1 Summary of the cell types and functions used in the model
Cell Type Description
M0 downregulated QS, low EPS producer
M1 upregulated QS, high EPS producer
M2 non-QS, low EPS producer
M3 non-QS, high EPS producer
Cells are classified as quorum sensing (QS) or non-quorum sensing (non-QS), and low or high EPS producers.
Frederick et al. Theoretical Biology and Medical Modelling 2011, 8:8http://www.tbiomed.com/content/8/1/8
Page 6 of 29
∂tM1 = ∇(DM(M)∇M1)+
+κ3CM1
κ2 + C− κ4M1 + κ5AHLnM0 − κ5τ
nM1(2)
∂tM2 = ∇(DM(M)∇M2)+
+κ3CM2
κ2 + C− κ4M2
(3)
∂tM3 = ∇(DM(M)∇M3)+
+κ3CM3
κ2 + C− κ4M3
(4)
∂tC = ∇(DC(M)∇C) − ∇(wC)−
−3∑
i=0
κ1iCMi
κ2 + C+
δκ6EPS
κ6 + C
(5)
∂tAHL = ∇(DAHL(M)∇AHL)) − ∇(wAHL)−− σAHL + αMmaxM0 + (α + β)MmaxM1
(6)
∂tEPS = ∇(DM(M)∇EPS)+
+3∑
i=0
γiCMi
κ2 + C− δκ6EPS
κ6 + C
(7)
where in the mass balances for the particulate substances, the constant densities
Mmax and EPSmax cancelled. The total volume fraction occupied by the biofilm is
denoted by M, where
M = M0 + M1 + M2 + M3 + EPS.
The two-dimensional computational domain Ω consists of a liquid phase with no
biomass, Ω1(t) = {(x, y) Î Ω : M(t, x, y) = 0}, and the solid biofilm phase, Ω2(t) = {(x,
y) Î Ω : M(t, x, y) > 0}.
These regions change as the biofilm grows.
The diffusion coefficient for the biomass fractions (DM (M)) is density dependent,
and is formulated according to [16] as
DM(M) = dMMa
(1 − M)b.
The diffusion coefficient can be assumed to be the same for all bacterial fractions
and the EPS because we do not distinguish the cells with respect to size and growth
behaviour, and because EPS and cells diffuse together. The biomass motility coefficient
dm [m2d-1] is positive but much smaller than the diffusion coefficients of the dissolved
substrates. Exponents a > 1 [-] and b > 1 [-] ensure biofilm expansion when M
approaches 1 (implying all available space is filled by biomass), and little or no expan-
sion provided M is small. This choice of diffusion coefficient ensures a separation of
the biofilm and its surrounding aqueous phase, and that the maximum cell density will
Frederick et al. Theoretical Biology and Medical Modelling 2011, 8:8http://www.tbiomed.com/content/8/1/8
Page 7 of 29

not be exceeded. The latter effect is of the type of a superdiffusion singularity, the for-
mer of the type of the porous medium equation degeneracy.
The diffusion coefficients for C and AHL are lower in the biofilm than in the sur-
rounding aqueous phase [55]. We let
DC(M) = DC(0) + M(DC(1) − DC(0)),
DAHL(M) = DAHL(0) + M(DAHL(1) − DAHL(0)),
where DC(0) and DAHL(0) are the diffusion coefficients in water, and DC(1) and DAHL
(1) are the diffusion coefficients in a fully developed biofilm [m2d-1]. Although these
diffusion coefficients depend on the biomass density as well, they do so in a non criti-
cal way. Since DC, AHL(0) and DC, AHL(1) are positive constants within one order mag-
nitude, substrate diffusion is essentially Fickian.
The model includes diffusive transport of carbon substrate and AHL in the biofilm,
and both convective and diffusive transport in the surrounding aqueous phase of the
biofilm. The convective contribution to transport of C and AHL in the aqueous phase
is controlled by the flow velocity vector w = (u, v), where u and v [md-1] are the flow
velocities in the x- and y- directions. The flow in the aqueous phase is described by a
thin-film approximation to the incompressible Navier-Stokes equations [56]. In order
to drive the flow in the channel, we specify the volumetric flow rate in terms of the
non-dimensional Reynolds number Re. The growth and decay processes incorporated
into our model are:
• growth of bacterial cells, controlled by the local availability of carbon substrate, in
equations (1)-(4): the maximum specific growth rate is denoted by �3 [d-1], depen-
dency on C is described by standard Monod kinetics where �2 [gm-3] is the half
saturation concentration.
• natural cell death, at rate �4 [d-1], in equations (1)-(4),
• upregulation of downregulated biomass, i.e. the conversion of M0 cells into M1
cells in equations (1) and (2), as a consequence of AHL concentration inducing a
change in gene expression, and a constant rate of back-conversion. The parameter
�5 [d-1nM -n] is the quorum sensing regulation rate – the rate at which downregu-
lated bacteria become upregulated, and vice versa. τ [nM] is the threshold AHL con-
centration locally required for quorum sensing induction to occur. The coefficient n
(n > 1) describes the degree of polymerisation in the synthesis of AHL. We model
the dimerisation process for AHL, assuming that dimers of receptor-AHL complexes
are necessary for the transcription of the AHL-synthase gene. Assuming mass action
law kinetics, this process gives n = 2, however, the value of n used here is slightly
higher, as further synergistic effects are lumped into this parameter as well [28].
• production of EPS by the bacterial cells at rates proportional to the bacterial
growth rates, in equation (7): the EPS production rate is
γi = κ3 ∗ Yi ∗ Mmax/
EPSmax, i = 0, ..., 3
in [d-1] where the yield coefficients Yi(EPS) [-] describe the amount of EPS pro-
duced per unit bacterial biomass of type M0,1,2,3.
Frederick et al. Theoretical Biology and Medical Modelling 2011, 8:8http://www.tbiomed.com/content/8/1/8
Page 8 of 29
• nutrient consumption by bacterial biomass in (5): the maximum specific substrate
consumption rates are denoted by
κ1i = κ3Mmax/
Yi, i = 0, ..., 3,
in [gm-3d-1], where Mmax is the maximum cell density, and Yi [-] are the yield coef-
ficients that incorporate both, the amount of nutrient required for biomass growth
and for EPS production
• abiotic AHL decay, at rate s [d-1], in equation (6)
• AHL production by both quorum-sensing cell types M0 and M1 in (6) at different
rates: the AHL production rate of downregulated quorum sensing bacteria is a[nM/(gm-3d-1)], and the increased production rate of upregulated quorum sensing
bacteria is a + b [nM d-1]
• when carbon becomes limited, EPS may be used as a food source, in equations
(5) and (7). This process is represented by an inhibition term, in which EPS is
transformed into carbon at rate δ [d-1], with inhibition constant �6 [gm-3]; the rate
δ [gm−3d−1] in (5) is related to δ by a yield coefficient and a constant conversion
factor, see [26]; to neglect the EPS consumption process, we let δ = 0 and δ = 0.
For the numerical treatment, the above model is non-dimensionalized with the
choices:
x =xL
, t = tκ3,
where L is the flow channel length, and1κ3
is the characteristic time scale for bio-
mass growth. The new dimensionless concentration variables are:
C =C
Cbulk, A =
AHLτ
,
where Cbulk is the bulk substrate concentration (the amount of substrate C supplied
at the inflow boundary). Note that the volume fractions Mi, i = 0, ..., 3 and EPS were
originally defined as dimensionless variables. The new reaction parameters are:
κ1i =Mmax
YiCbulk, i = 0, . . . , 3;
κ2 =κ2
Cbulk; κ3 = 1; κ4 =
κ4
κ3;
κ5 =κ5τ
n
κ3; κ6 =
κ6
Cbulk;
σ =σ
κ3; α =
αMmax
κ3T; β =
βMmax
κ3T
δ =δ
κ3; ˜δ =
δ
κ3Cbulk;
γi =Y0EPSMmax
EPSmax, i = 0, . . . , 3.
Frederick et al. Theoretical Biology and Medical Modelling 2011, 8:8http://www.tbiomed.com/content/8/1/8
Page 9 of 29

The dimensionless diffusion coefficients become:
DC =DC
L2κ3; DAHL =
DAHL
L2κ3; DM =
DM
L2κ3.
The non-dimensionalized equations are then:
∂tM0 = ∇(DM(M)∇M0))
+κ3CM0
κ2 + C− κ4M0 − κ5AnM0 + κ5M1
∂tM1 = ∇(DM(M)∇M1))
+κ3CM1
κ2 + C− κ4M1 + κ5AnM0 − κ5M1
∂tM2 = ∇(DM(M)∇M2))
+κ3CM2
κ2 + C− κ4M2
∂tM3 = ∇(DM(M)∇M3))
+κ3CM2
κ2 + C− κ4M3
∂t C = ∇(DC(M)∇C)) − ∇(wC)
− C
κ2 + C
r∑i=0
κ1iMi +˜δκ6E
κ6 + C
∂t A = ∇(DA(M)∇A)) − ∇(wA)
− σ A + αM0 + βM1
∂t E = ∇(DM(M)∇E)
+C
κ2 + C
3∑i=0
γiMi − δκ6E
κ6 + C
The parameters used in our simulations and their non-dimensional values are listed
in Table 2. The biofilm growth parameters, the EPS production parameters, and the
substrate diffusion coefficients were chosen from the range of standard values in bio-
film modelling literature [10,26], and the biomass diffusion coefficient values (dM, a, b)
were selected from [56]. The quorum sensing parameters �5, a, b, g and n were
derived from experiments on the kinetics of suspended P. putida IsoF cultures and the
AHL molecule 3-oxo-C10-HSL [57]. In experimental quorum sensing literature, the
threshold AHL concentration required for induction, τ, ranges from less than 5 nM to
above 200 nM. Following [58], we have chosen the relatively low value of τ = 10 nmol/
L to allow for induction to occur at an early stage of biofilm growth. We have selected
these parameters in order to analyze the general behaviour of a system of biofilms and
quorum sensing, i.e., the analysis is not specific to P. putida and AHL. The flow velo-
city is Re = 10-4, which is well within the creeping flow regime. At this low flow rate,
the dimensionless Peclet number, which estimates the relative contributions of convec-
tive and diffusive mass transport, is Pe ≈ 1.0, indicating that the system is neither con-
vection- nor diffusion-dominated. In particular, in convection dominated cases (Pe >>
1), it has been shown that AHL can be washed out without contributing to up-
Frederick et al. Theoretical Biology and Medical Modelling 2011, 8:8http://www.tbiomed.com/content/8/1/8
Page 10 of 29

regulation [28,37]. Moreover, following [56], biofilm deformation and shear induced
detachment can be neglected at these low flow velocities.
Computational approach
The numerical solution of the density-dependent diffusion-reaction model is computed
using a semi-implicit finite difference-based finite volume scheme, formulated for the
concentrations in the centers of the grid cells. Time integration uses a non-local
(semi-implicit) discretization in the fashion of non-standard finite difference methods.
The time-step size is variable and chosen in order to ensure stability, positivity, bound-
edness (by 1), and a finite speed of interface propagation [59]. In our application, the
computational domain is discretized on a uniform rectangular grid of size 2000 × 200.
In each time step six sparse, banded diagonal linear algebraic systems (one for each
of M0, M1, M2/3, C, AHL, and EPS) are solved with the stabilized biconjugate gradient
method. The flow field is calculated using the analytical approximation of [56].
The numerical method was first introduced for single-species biofilms in [59] and
then extended to biofilm systems with several microbial species in [60] and [61], the
latter also containing a stability analysis. A computational convergence study can be
found in [62]. These results carry over qualitatively to the study at hand. The method
is implemented in OpenMP for execution on multi-core and shared memory multi-
Table 2 Model parameters in the high nutrient case
Parameter Description Source Value
�10 Rate of C consumption by M0 W 923
�11 Rate of C consumption by M1 W 1846
�12 Rate of C consumption by M2 W 923
�13 Rate of C consumption by M3 W 1846
�2 Monod half sat. const. W 0.02
�3 Max specific growth rate of bacteria H 1.0
�4 Bacterial lysis rate W 0.2083
�5 Quorum sensing upregulation rate F 2.5
�6 Monod half sat. const. H 0.04
δ EPS conversion to C rate (C equation), if included H 0.28
δ EPS conversion to C rate (EPS equation), if included H 11.2
s Abiotic degradation rate of AHL F 0.1109
a Constitutive production rate of AHL F 920
b Induced production rate of AHL F 9200
n Degree of polymerisation F 2.5
g0 M0 EPS production rate H 0.84
g1 M1 EPS production rate H 8.4
g2 M2 EPS production rate H 0.84
g3 M3 EPS production rate H 8.4
Mmax Maximum cell density H 24·103
EPSmax Maximum EPS density H 4·103
DC (0), (1) Substrate diffusion coefficients ES 0.67, 0.54
DAHL(0), (1) AHL diffusion coefficients HR 0.52, 0.26
a Diffusion coefficient parameter ES 4.0
b Diffusion coefficient parameter ES 4.0
dM Biomass motility coefficient ES 6.67e-09
H/L Channel aspect ratio ES 0.1
References: ES = [56], H = [26], HR = [64], F = [57], W = [10]
Frederick et al. Theoretical Biology and Medical Modelling 2011, 8:8http://www.tbiomed.com/content/8/1/8
Page 11 of 29

processor architectures; the parallelization behaviour is documented in [61]. The simu-
lations were conducted on an Intel Itanium based SGI Altix 450, typically using 12
cores concurrently.
Simulation setup
Three different types of biofilms will be studied: quorum sensing (M0, M1 cells only),
non-quorum sensing (M2 or M3 cells only), and mixed (M0, M1, and one of M2 or M3
cells). Two nutrient conditions are tested: high and low (differing by a factor of two),
and simulations are performed with and without the biological process of EPS con-
sumption; the parameters δ and δ are set equal to zero when EPS consumption is
excluded. A summary of the simulation experiments is given in Table 3. Our simula-
tions will give us qualitative information about quorum sensing and biofilm systems.
Numerical results, including time, are described using non-dimensional measures, and
should not be deemed as quantitative conclusions.
Our biofilm model is on a mesoscopic scale, and so the computational domain is
considered to be a small portion, or open subdomain, existing within a larger reactor.
The boundary conditions we choose describe both the reactor type and the operating
conditions in which the experiment is conducted, and connect the computational
domain to the outside physical environment. Our computational domain is representa-
tive of a microfluidics chamber which receives fluid at the left (inflow) boundary from
a large, well mixed reactor. Carbon is supplied into the channel from the upstream
boundary, but no AHL may enter into the flow channel from upstream. AHL and car-
bon in the dissolved liquid phase Ω1 may exit the system via convective transport.
Specifically, the following boundary conditions are imposed on our domain Ω = [0,
L]×[0, H]:
• For M0, M1, M2, M3 and EPS, no flux conditions everywhere (n is the direction of
the outward normal): ∂nM0 = 0, ∂nM1 = 0, ∂nM2 = 0 ∂n M3 = 0, ∂nEPS = 0 on ∂Ω
• For C and AHL, no diffusive flux conditions everywhere except for on inflow,
where we specify the bulk concentration: C = 1, A = 0 for x = 0, ∂nC = 0, ∂n A = 0
everywhere else.
The initial conditions used are:
• An inoculation of the bottom surface of the channel with 16 colonies, each with a
density of 0.3. Biofilm colonies are placed randomly along the channel, at an offset
from the channel entrance and exit, to avoid unphysical boundary effects. This ran-
dom placement mimics experimental difficulties in controlling where bacteria set-
tle. The type of cell inoculated depends on the biofilm being grown: either quorum
Table 3 Summary of the simulation experiments
Biofilm Name Biofilm Type Nutrient Case EPS consumption
QS M0, M1 high, low yes, no
M2 non-QS M2 high, low yes, no
M3 non-QS M3 high, low yes, no
M2 mixed M0, M1, M2 high yes, no
M3 mixed M0, M1, M3 high yes, no
Frederick et al. Theoretical Biology and Medical Modelling 2011, 8:8http://www.tbiomed.com/content/8/1/8
Page 12 of 29
sensing (16 M0 cells), non-quorum sensing (16 M2 or M3), or mixed (8 M0 and 8
M2, or 8 M0 and 8 M3)
• AHL = 0, EPS = 0; initially, biomass consists of cells only, but EPS and AHL pro-
duction begins immediately upon the start of the simulation
• C = 1.
The simulations finish when an imposed stopping criterion is met: the biofilm height
reaches 80% of the channel height. This ensures the simulation stops before clogging
effects take place; when the biofilm height approaches the top of the channel, local
flow velocities and shear forces increase to the level that detachment processes would
no longer be negligible, leading to a breakdown of the biofilm growth model.
Analysis
To interpret the results of computer simulations of our model, we will provide two-
dimensional visualizations of the simulations, and use the following quantitative mea-
sures. The volume fraction of the domain occupied by the biofilm (cells and EPS), or
the occupancy, is a simple measure of biofilm size. The occupancy is averaged over the
whole regarded volume:
Occupancy(t) : =1
LH
∫2(t)
dxdy.
The total downregulated quorum sensing cell biomass in the system, M0total, is the
volume fraction of M0 multiplied by maximum cell density:
M0total(t) := Mmax
∫
M0(t, x, y) dxdy.
The total M1, M2, and M3 cell biomasses, and the EPS biomass, are computed simi-
larly. The total biomass is therefore:
M(t) = M0total(t) + M1total(t)+
+ M2total(t) + M3total(t) + EPStotal(t).
The occupancy and total cell and EPS biomass measures will be used to compare the
growth and composition of the biofilm over time.
We will use the following abbreviations: quorum sensing (QS), non-quorum sensing
(non-QS).
ResultsThe results of the simulation experiments summarized in Table 3 will be described in
the following sequence:
• Example simulation of QS controlled EPS production in a biofilm: an example
simulation of a quorum sensing biofilm under high nutrient conditions.
• Simulations without the EPS consumption process: simulations of biofilms that do
not include the process of EPS consumption. First, QS and M2 and M3 non-QS
biofilms are compared under high and low nutrient conditions. Second, M2 and M3
mixed biofilms are regarded.
Frederick et al. Theoretical Biology and Medical Modelling 2011, 8:8http://www.tbiomed.com/content/8/1/8
Page 13 of 29

• Simulations with the EPS consumption process: the experiments of the previous
section are repeated, but the process of EPS consumption is included. QS and M2,
M3 non-QS biofilms under high and low nutrient conditions are described first, fol-
lowed by M2 and M3 mixed biofilms.
• Effect of random colony placement in mixed biofilms: a discussion on the effects
of random initial colony placement in M2 and M3 mixed biofilms on quorum sen-
sing induction.
Example simulation of QS controlled EPS production in a biofilm
To simulate growth of a QS biofilm, the bottom surface of the channel is inoculated
with sixteen M0 colonies. A high supply of substrate enters the channel from the
inflow boundary, and the process of EPS consumption is neglected.
The growth period begins with biomass in the inoculated colonies growing and spa-
tially spreading when the total biomass (M0 + M1 + EPS) locally approaches the maxi-
mum density, 1.0. In time, some neighbouring colonies begin to merge. Figure 1(a)
depicts the biofilm before induction occurs; the colonies consist almost entirely of M0
cells.
AHL accumulates over time in the channel as it is produced by the growing colonies.
Molecules produced by the colonies diffuse into the liquid region, and are transported
downstream by convection and diffusion, causing AHL concentrations to increase in
the main flow direction. The maximum AHL concentration found at the downstream
boundary is a typical effect of flow facilitated convective transport [37]. In Figure 1(b),
the switch to QS is occuring. Upregulation occurs locally when the non-dimensional
AHL concentration reaches 1.0. Positive feedback in the quorum sensing system is
then initiated – upregulated cells produce AHL at ten times the downregulated rate,
leading rapidly to large increases in AHL concentrations, and further upregulation of
cells throughout the domain.
The downstream colonies begin to upregulate first, followed by the upstream colo-
nies. This is an observation of flow-facilitated inter-colony communication – AHL
molecules produced by the large, upstream colonies are transported by convection and
diffusion, contributing to upregulation in the smaller downstream colonies [28].
The biofilm in Figure 1(c) is fully upregulated, and EPS production has increased by
a factor of ten. The biofilm grows and expands rapidly, until the flow channel becomes
clogged with biomass and the maximum predetermined biofilm height is obtained.
In Figure 2, the biofilm is shown again before and after induction, with the colour
scale representing the proportion of cellular biomass (the fraction (M0 + M1)/(M0 +
M1 + EPS)), along with the concentration of the carbon nutrient C. Carbon concentra-
tions decrease in the flow direction, due to consumption by biomass. In later time-
steps, mid-channel and downstream colonies experience severe substrate limitations
due to substrate consumption by the larger upstream colonies.
Prior to induction (Figure 2(a)), the biofilm composition by mass is approximately
15% EPS, 85% cells. Following induction (Figure 2(b)), EPS production rates are upre-
gulated, resulting in a change in biofilm composition to 60-65% EPS. The large,
merged, upstream colonies experienced the greatest increase in volume - in order for
colonies to have increased growth due to upregulated EPS production rates, both
Frederick et al. Theoretical Biology and Medical Modelling 2011, 8:8http://www.tbiomed.com/content/8/1/8
Page 14 of 29

Figure 1 Example simulation: QS biofilm in the case of high nutrient conditions, and no EPSconsumption. The colour scale (E) in the subfigures represents the fraction of downregulated cells in thebiofilm (M0/(M0 + M1)). AHL concentration lines are shown in black and white, equidistantly distributedbetween zero and the maximum AHL value at each time. A non-dimensional value of AHL = 1.0 isrequired for upregulation. (A) shows the QS biofilm, before induction occurs (t = 5.0, max AHL = 0.44). In(B), the downstream colonies have upregulated (t = 6.0, max AHL = 1.71). (C) shows the biofilm afterinduction has occurred (t = 8.0, max AHL = 14.1).
Figure 2 Example simulation: QS biofilm in the case of high nutrient conditions, and no EPSconsumption. The colour scale in the subfigures represents the fraction of EPS biomass in the biofilm((EPS)/(M0 + M1 + EPS)), showing mass composition of the biofilm. Carbon concentrations are normalizedwith respect to the value of the incoming carbon concentration (the non-dimensional parameter Cbulk). (A)shows the QS biofilm at an early stage of growth, before induction (t = 5.0). (B) shows the biofilm afterinduction (t = 9.5). The carbon concentration colour scale is given in (C).
Frederick et al. Theoretical Biology and Medical Modelling 2011, 8:8http://www.tbiomed.com/content/8/1/8
Page 15 of 29

upregulated cells and adequate nutrients are required. So although the downstream
colonies are first to upregulate, these colonies lack the nutrients needed to expand
quickly.
In Figure 3, the spatially averaged measures introduced in the “Analysis” Section are
plotted, describing biofilm growth and EPS production in time. The biofilm occupancy
(inclusive of cellular and EPS biomass) is plotted in Figure 3(a). The slope of the occu-
pancy curve increases at t = 6.0, corresponding to induction, after which biofilm
growth continues at an enhanced rate. The total M0, M1, and EPS biomass constituting
the biofilm is shown in Figure 3(b). It is primarily the downregulated cell populations
which grow in the initial time period, until induction occurs. Subsequently, M0 cells
are rapidly upregulated to M1 cells, and the total M0 biomass in the biofilm declines
while M1 cell representation increases. Upon completion of the simulation, the biofilm
is fully upregulated. M1 produces EPS at the induced rate, so EPS biomass increases
substantially after the switch as well.
Simulations without the EPS consumption process
Quorum sensing and non-quorum sensing biofilms
In the first simulation experiment, QS biofilms (M0, M1 cells), the low-EPS producing
M2 non-QS biofilms and high-EPS producing M3 non-QS biofilms were grown under
high and low nutrient conditions, using the same initial distribution of colonies. Under
the low nutrient condition, the concentration of incoming carbon (Cbulk) is lowered,
which affects the following non-dimensional parameters: �10 = 1846, �11 = 3692, �12 =
1846, �13 = 3692, �2 = 0.04, δ = 22.4.
Figure 4 shows the spatially averaged results for these biofilm simulations. The nutri-
ent supply directly influences growth rates, and so the simulations finish earliest for
the high nutrient case. The occupancies of the biofilms are shown in Figures 4(a, b);
note that occupancy is inclusive of both cells and EPS. The high-EPS producing M3
non-QS biofilm had the greatest occupancy, followed by the QS biofilm, and the low-
EPS producing M2 non-QS biofilm had the lowest occupancy. In contrast, the M3 non-
QS biofilm had the lowest bacteria cell population, and the M2 non-QS biofilm had the
highest cell population (Figures 4(c, d)). The high values of QS and M3 non-QS biofilm
occupancies are therefore not due to additional bacteria cells, but are due to the pre-
sence of EPS produced at the induced rates. This is verified in Figures 4(e, f), which
demonstrates the enhanced EPS production by the QS biofilm. The spatial patterns of
Figure 3 Spatially averaged results for the example simulation. The (A) occupancy and (B) M0, M1, andM2 biomass of the quorum sensing biofilm with high nutrient supply, excluding EPS consumption.
Frederick et al. Theoretical Biology and Medical Modelling 2011, 8:8http://www.tbiomed.com/content/8/1/8
Page 16 of 29
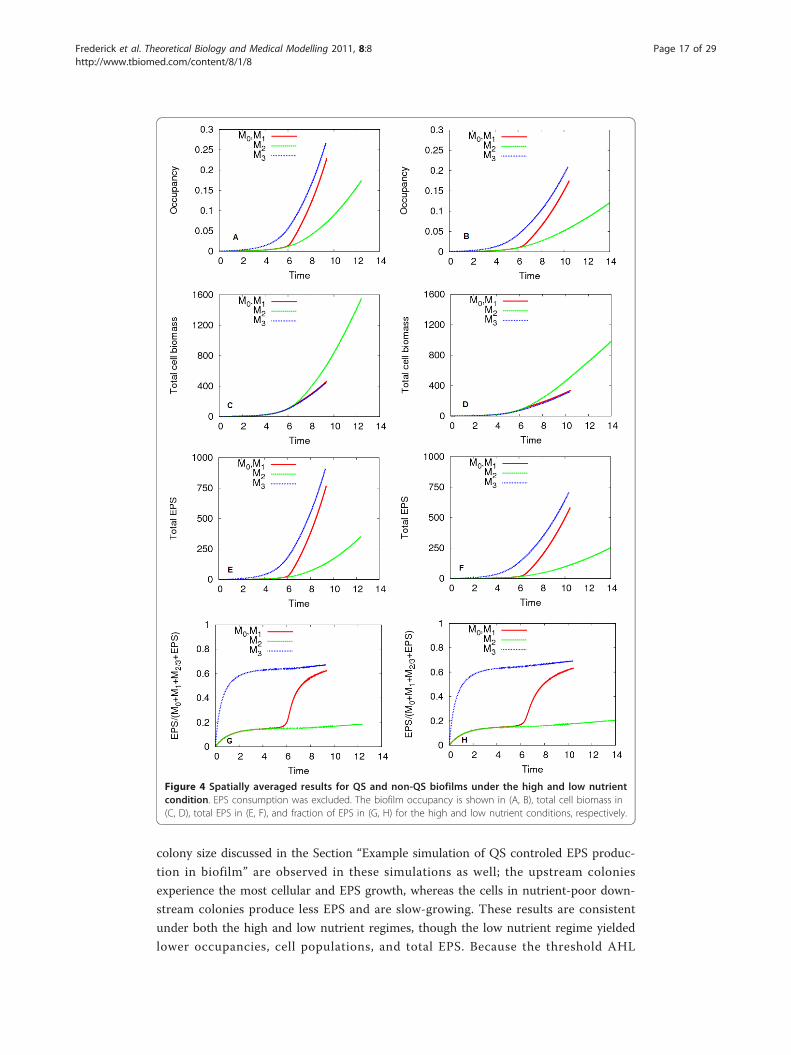
colony size discussed in the Section “Example simulation of QS controled EPS produc-
tion in biofilm” are observed in these simulations as well; the upstream colonies
experience the most cellular and EPS growth, whereas the cells in nutrient-poor down-
stream colonies produce less EPS and are slow-growing. These results are consistent
under both the high and low nutrient regimes, though the low nutrient regime yielded
lower occupancies, cell populations, and total EPS. Because the threshold AHL
Figure 4 Spatially averaged results for QS and non-QS biofilms under the high and low nutrientcondition. EPS consumption was excluded. The biofilm occupancy is shown in (A, B), total cell biomass in(C, D), total EPS in (E, F), and fraction of EPS in (G, H) for the high and low nutrient conditions, respectively.
Frederick et al. Theoretical Biology and Medical Modelling 2011, 8:8http://www.tbiomed.com/content/8/1/8
Page 17 of 29
concentration is surpassed before nutrient limitations occur, induction occurs at the
same time in both the high and low nutrient regimes.
The composition of the biofilm over time is shown in Figures 4(g, h). After the initial
time period in which EPS production begins, the low-EPS producing non-QS biofilm
(M2) remains composed of less than 20% EPS by mass, whereas the high- EPS produ-
cing non-QS biofilm (M3) is approximately 65% EPS. The QS biofilm switches its com-
position by mass after induction from predominantly bacteria cells to EPS. In
summary, the QS biofilms obtained greater cell populations than M3 non-QS biofilms,
and occupied more volume in the channel than M2 non-QS biofilms.
The quorum sensing mechanism is used to switch behaviours from the M2 like mode
of low EPS production and faster cell growth to the M3 like mode of high EPS produc-
tion at the expense of slower bacterial growth. This transition takes place rapidly after
induction occurs and is almost completed after a period of time that is about twice as
long as the characteristic time scale of biomass growth. Eventually the entire biofilm
behaves like a high-EPS producing M3 biofilm.
Mixed biofilms
A series of simulations were performed to simulate the growth of mixed biofilms with
a high nutrient supply. Mixed biofilms contain both QS cells and M2 or M3 non-QS
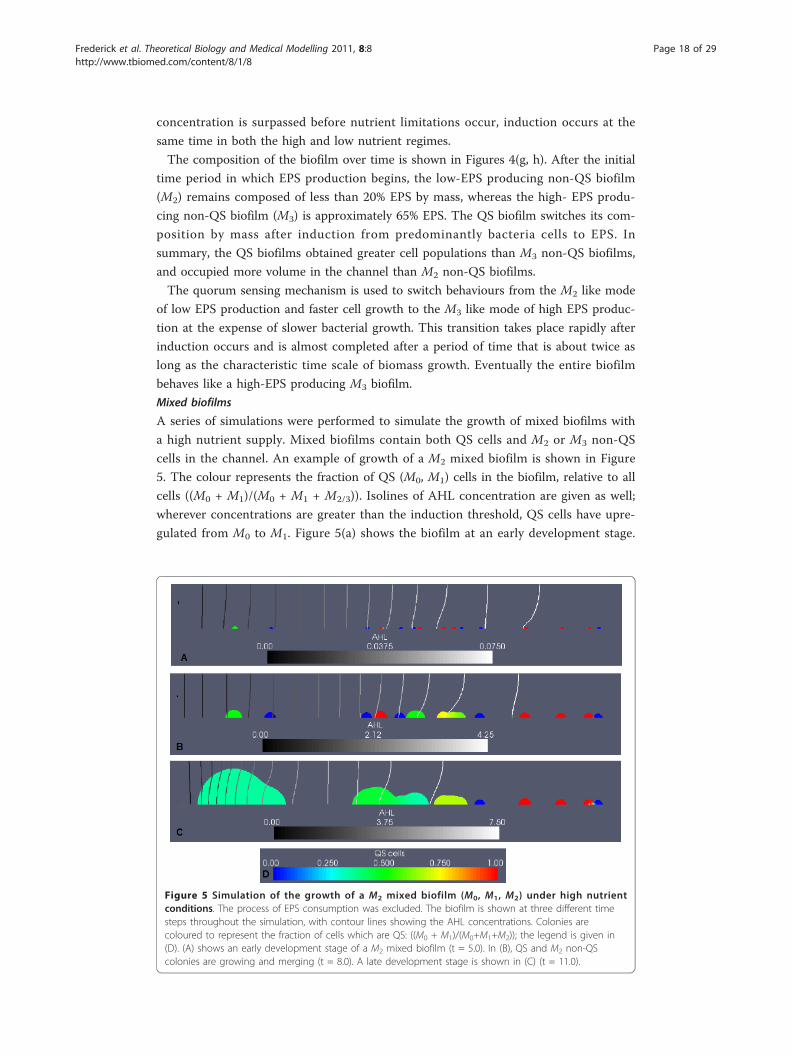
cells in the channel. An example of growth of a M2 mixed biofilm is shown in Figure
5. The colour represents the fraction of QS (M0, M1) cells in the biofilm, relative to all
cells ((M0 + M1)/(M0 + M1 + M2/3)). Isolines of AHL concentration are given as well;
wherever concentrations are greater than the induction threshold, QS cells have upre-
gulated from M0 to M1. Figure 5(a) shows the biofilm at an early development stage.
Figure 5 Simulation of the growth of a M2 mixed biofilm (M0, M1, M2) under high nutrientconditions. The process of EPS consumption was excluded. The biofilm is shown at three different timesteps throughout the simulation, with contour lines showing the AHL concentrations. Colonies arecoloured to represent the fraction of cells which are QS: ((M0 + M1)/(M0+M1+M2)); the legend is given in(D). (A) shows an early development stage of a M2 mixed biofilm (t = 5.0). In (B), QS and M2 non-QScolonies are growing and merging (t = 8.0). A late development stage is shown in (C) (t = 11.0).
Frederick et al. Theoretical Biology and Medical Modelling 2011, 8:8http://www.tbiomed.com/content/8/1/8
Page 18 of 29
The colonies are approximately equal in size, as carbon supply is sufficient for maximal
growth at this time. Because QS induction has not yet occurred, and C is not limited,
all QS and M2 non-QS colonies produced EPS equivalently, at the low rate. In Figure
5(b), merging of QS and non-QS colonies is prevalent upstream and in the mid-chan-
nel, though colonies at the downstream extent of the biofilm remain exclusively QS or
M2 non-QS. AHL concentrations have surpassed the induction threshold in the mid-
channel and downstream, indicating that QS cells in those regions of the domain have
upregulated to M1, and are consuming nutrients at an increased rate. Merging of colo-
nies continues into the late development stage (Figure 5(c)). At the end of the simula-
tion, QS cell populations are slightly higher than M2 non-QS cell populations. The
large, merged, upstream colony experiences the most growth, due to its proximity to
the nutrient source, enabling both cell population growth and induced EPS production
by upregulated QS cells. Note that in this example, the colony closest to the inflow
boundary is a QS colony, and several of the furthest downstream colonies, where nutri-
ent deficiencies are highest, are M2 non-QS colonies.
Because the resulting final QS and non-QS cell populations may be impacted by the
stochastic distribution of cells in the initial inoculation, particularly, whether a QS or
non-QS colony is located closest to the nutrient-rich upstream boundary, this M2
mixed biofilm experiment was repeated for a total of ten simulations, each using a dif-
ferent initial distribution. An additional ten simulations were conducted to test the
growth of M3 mixed biofilms, which include the high-EPS producing M3 non-QS cells
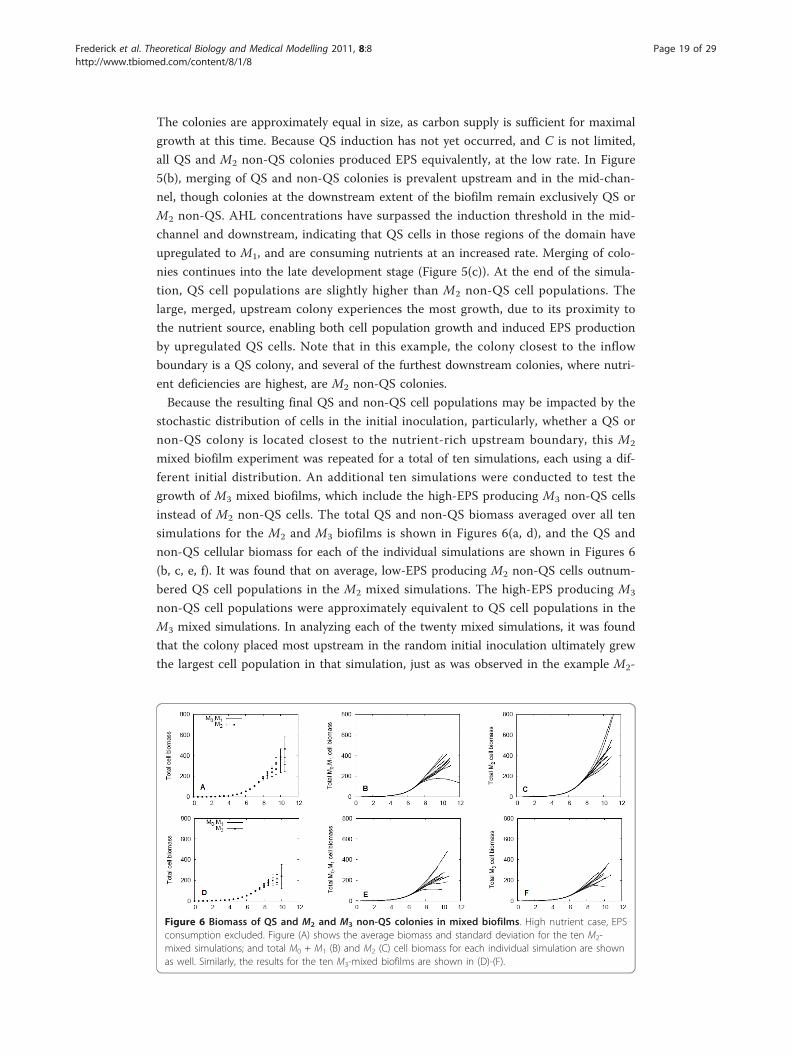
instead of M2 non-QS cells. The total QS and non-QS biomass averaged over all ten
simulations for the M2 and M3 biofilms is shown in Figures 6(a, d), and the QS and
non-QS cellular biomass for each of the individual simulations are shown in Figures 6
(b, c, e, f). It was found that on average, low-EPS producing M2 non-QS cells outnum-
bered QS cell populations in the M2 mixed simulations. The high-EPS producing M3
non-QS cell populations were approximately equivalent to QS cell populations in the
M3 mixed simulations. In analyzing each of the twenty mixed simulations, it was found
that the colony placed most upstream in the random initial inoculation ultimately grew
the largest cell population in that simulation, just as was observed in the example M2-
Figure 6 Biomass of QS and M2 and M3 non-QS colonies in mixed biofilms. High nutrient case, EPSconsumption excluded. Figure (A) shows the average biomass and standard deviation for the ten M2-mixed simulations; and total M0 + M1 (B) and M2 (C) cell biomass for each individual simulation are shownas well. Similarly, the results for the ten M3-mixed biofilms are shown in (D)-(F).
Frederick et al. Theoretical Biology and Medical Modelling 2011, 8:8http://www.tbiomed.com/content/8/1/8
Page 19 of 29

mixed simulation shown in Figure 5. This shows the strong effect of nutrient availabil-
ity and mass transfer on biofilm structure, which can dominate quorum sensing effects.
In some cases, the upstream colonies utilized so much of the incoming nutrient that
cells in the downstream colonies experienced cell death (this is evident by the decreas-
ing curves in the cell biomass plots Figures 6(b, c, e, f)). In accordance with the results
of the previous section, populations of high-EPS producing biofilms are lower than
populations of low-EPS producing biofilms.
Simulations with the EPS consumption process
An additional complexity was considered in our biofilm simulations, which accounts
for the utilization of EPS by bacteria cells as a secondary source of the carbon nutrient
when limitations occur. The experiments of the subsections “Quorum sensing and
non-quorum sensing biofilms” and “Mixed biofilms” were repeated, but with considera-
tion of this biological process.
Quorum sensing and non-QS biofilms
QS and non-QS biofilms were grown in the channel using the same initial distribution
of colonies as the first simulation experiment, under high and low nutrient conditions.
The trend discussed there is present here as well: QS biofilms have higher cell popula-
tions than M3 non-QS biofilms, and higher occupancies than M2 non-QS biofilms. Cell
populations were approximately equivalent to those in the biofilms that did not con-
sume EPS, however, occupancy was considerably lower, due to EPS lost through
consumption.
When QS biofilms induced, they increased their volume from that of a M2 non-QS
biofilm to match the size of a M3 non-QS biofilm. These trends are also present under
the low nutrient regime, though cell populations and occupancies are lower than when
the high nutrient regime was used.
Differences in the biofilm composition were found when biofilms consumed EPS as
an additional nutrient source, in comparison to biofilms which do not consume EPS.
Figure 7(a) shows the total EPS produced by the biofilms over time for the simulations
with a high nutrient supply. In contrast to the non-EPS consuming biofilms in Figure
4, the total net EPS production of these biofilms is much lower, and production is
impaired when nutrient deficiencies emerge at approximately t = 6.0, when EPS con-
sumption is triggered. Induction of the QS biofilm also occurs at t = 6.0, so its total
EPS is increased to the levels of the M3 non-QS biofilm. The fraction of EPS biomass
in the biofilm over time for the simulations with a high nutrient supply is shown in
Figure 7(b). After the initial time period in which EPS production begins, the low-EPS
producing M2 non-QS biofilm is composed of 10% EPS by mass, whereas the high-EPS
producing M3 non-QS biofilm is about 50% EPS. The QS biofilm switches its composi-
tion by mass after induction from predominantly bacteria cells to EPS. When EPS con-
sumption increases, EPS declines to 20% in the M3 non-QS and QS biofilms, and to
almost zero in the M2 non-QS biofilm. Biofilms that use EPS as a nutrient source are
predominantly composed of cellular biomass, or entirely by cellular biomass, in
extreme nutrient deficiencies.
However, the most notable difference in biofilms that consumed EPS was in the bio-
film composition. The EPS consumption process promotes more pronounced spatial
differences in biofilm composition. In Figure 8(a), a QS biofilm with the same initial
Frederick et al. Theoretical Biology and Medical Modelling 2011, 8:8http://www.tbiomed.com/content/8/1/8
Page 20 of 29

inoculation of Figure 2 is shown at an early development stage, when nutrient supply is
abundant, and composition is uniformly 10% EPS. In Figure 8(b), induction has
occurred, and the large, merged upstream colony has experienced growth and
enhanced EPS production by upregulated M1 cells. Only the most upstream portion of
this colony contains both cells and EPS. Here, as indicated by the carbon isolines,
upregulated cells have access to the nutrients required to produce EPS at the induced
rate, and therefore do not need to consume local EPS for additional nutrients. Else-
where, the cells are starved of nutrients and are forced to consume their entire EPS
supply.
After QS induction occurs, the biofilm undergoes a transition from a low EPS produ-
cing M2 like state to a state that is essentially entirely M3 like, i.e. it becomes a fast
EPS producer at the expense of slower bacterial growth. After this transition is com-
plete, within a time period that compares to the characteristic timescale of biomass
growth, no remainders of the down-regulated past are evident. This corresponds to the
observations of the previous sections.
Mixed biofilms
Twenty additional simulations of mixed biofilms under the high nutrient condition
were performed (ten M2-mixed and ten M3-mixed biofilms), each using a different
Figure 7 QS and non-QS biofilms under the high nutrient condition, for the EPS consumption case.(A) shows the total EPS, and (B) shows the fraction of EPS biomass in the biofilms.
Figure 8 An example of a QS biofilm under high nutrient conditions, EPS consumption case. Thecomposition of the biofilm by EPS biomass is shown (A) before and (B) after induction. The carbonconcentration scale is given in (C).
Frederick et al. Theoretical Biology and Medical Modelling 2011, 8:8http://www.tbiomed.com/content/8/1/8
Page 21 of 29

initial inoculation, with the inclusion of the EPS consumption process. Figure 9(a, d)
shows the average biomass of the QS and non-QS colonies, as well as the total cell
biomass in time for every simulation in Figures 9(b, c, e, f). In comparison to the
mixed biofilms that excluded EPS consumption, a higher variance in final cell popula-
tions was observed. This is in part due to an increased occurrence of cell populations
either remaining constant or declining in time. Again, the average QS and non-QS cell
populations are not higher than the mixed biofilms which excluded EPS consumption.
Similar to the previous mixed simulations, biofilms with low-EPS producing M2 non-
QS cells obtained higher cell populations than biofilms with high-EPS producing M3
non-QS cells. In every case, the colony located closest to the nutrient source experi-
enced the most growth in the particular simulation. Decline of cell populations,
observed in some of the simulations, is attributed to a high distribution of those colo-
nies in the nutrient-poor mid-channel and downstream regions. Spatial gradients in
biofilm composition by EPS, as discussed in subsection “Quorum sensing and non-QS
biofilms” (in “Simulations with the EPS consumption process”), were also prevalent,
resulting in biofilms with little to no EPS in the downstream colonies.
Effect of random colony placement in mixed biofilms
In subsections “Mixed Biofilms”, in both “Simulations without the EPS consumption
process” and “Simulations with the EPS consumption process”, variations in the total
QS and non-QS biomass were found for the M2- and M3-mixed biofilms. To investi-
gate whether these variations are attributed to nutrient limitations or to QS, the M1
biomass was studied for all forty mixed biofilm simulations, plotted in Figure 10.
The positive feedback feature of QS systems leads to a very rapid upregulation of QS
cells in the biofilm – after induction occurs, M1 cell populations quickly rise. The
switching time represents this upregulation period. In Figures 10(a, b), the M2- and
M3-mixed biofilms that exclude EPS consumption have a switching time between 7.5
and 8.5. The M2 and M3 mixed biofilms that consume EPS (Figures 10(c, d)) switch
between 7.5 and 8.0. Though the variation in switching time is small, we can conclude
that the random initial placement of colonies does have a small effect of the time at
Figure 9 Biomass of QS and non-QS colonies in mixed biofilms. High nutrient case, EPS consumptionincluded. Figure (A) shows the average biomass and standard deviation for the ten M2-mixed simulations;and total M0 + M1 (B) and M2 (C) cell biomass for each individual simulation are shown as well. Similarly,the results for the ten M3-mixed biofilms are shown in (D)-(F).
Frederick et al. Theoretical Biology and Medical Modelling 2011, 8:8http://www.tbiomed.com/content/8/1/8
Page 22 of 29
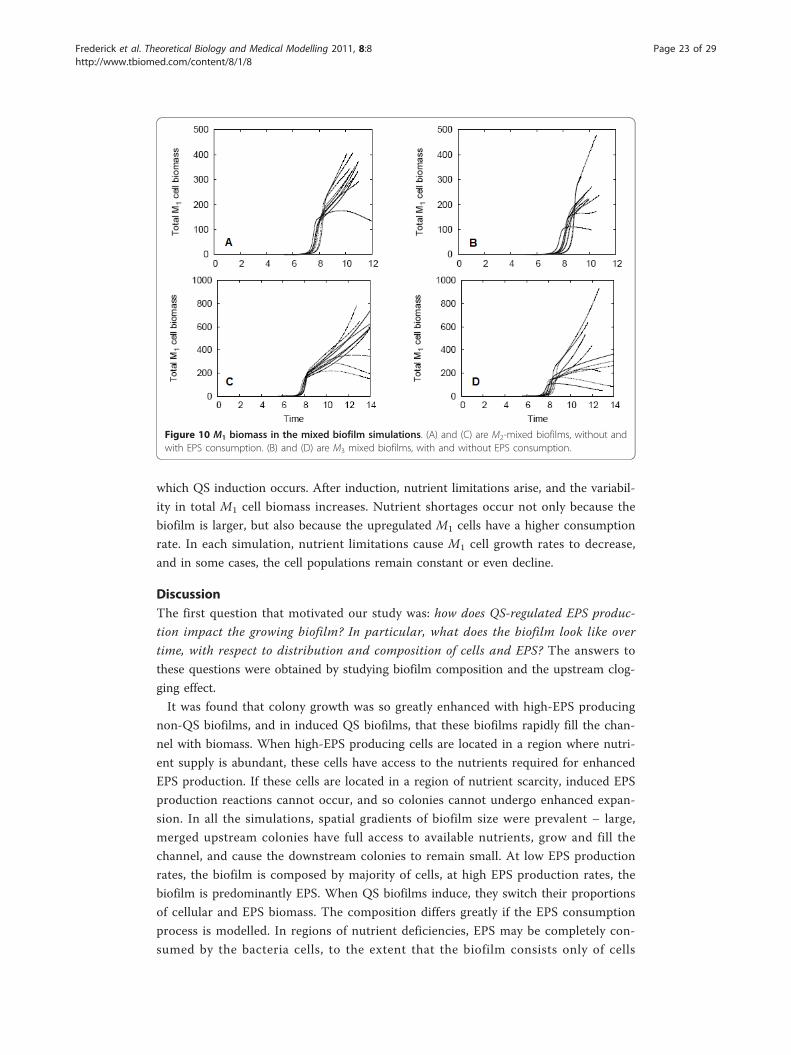
which QS induction occurs. After induction, nutrient limitations arise, and the variabil-
ity in total M1 cell biomass increases. Nutrient shortages occur not only because the
biofilm is larger, but also because the upregulated M1 cells have a higher consumption
rate. In each simulation, nutrient limitations cause M1 cell growth rates to decrease,
and in some cases, the cell populations remain constant or even decline.
DiscussionThe first question that motivated our study was: how does QS-regulated EPS produc-
tion impact the growing biofilm? In particular, what does the biofilm look like over
time, with respect to distribution and composition of cells and EPS? The answers to
these questions were obtained by studying biofilm composition and the upstream clog-
ging effect.
It was found that colony growth was so greatly enhanced with high-EPS producing
non-QS biofilms, and in induced QS biofilms, that these biofilms rapidly fill the chan-
nel with biomass. When high-EPS producing cells are located in a region where nutri-
ent supply is abundant, these cells have access to the nutrients required for enhanced
EPS production. If these cells are located in a region of nutrient scarcity, induced EPS
production reactions cannot occur, and so colonies cannot undergo enhanced expan-
sion. In all the simulations, spatial gradients of biofilm size were prevalent – large,
merged upstream colonies have full access to available nutrients, grow and fill the
channel, and cause the downstream colonies to remain small. At low EPS production
rates, the biofilm is composed by majority of cells, at high EPS production rates, the
biofilm is predominantly EPS. When QS biofilms induce, they switch their proportions
of cellular and EPS biomass. The composition differs greatly if the EPS consumption
process is modelled. In regions of nutrient deficiencies, EPS may be completely con-
sumed by the bacteria cells, to the extent that the biofilm consists only of cells
Figure 10 M1 biomass in the mixed biofilm simulations. (A) and (C) are M2-mixed biofilms, without andwith EPS consumption. (B) and (D) are M3 mixed biofilms, with and without EPS consumption.
Frederick et al. Theoretical Biology and Medical Modelling 2011, 8:8http://www.tbiomed.com/content/8/1/8
Page 23 of 29
(generally in the mid- to downstream region), and only the portion of the biofilm clo-
sest to the inflow boundary contains a protective layer of EPS.
We were also interested in investigating, is it beneficial for the biofilm to regulate
EPS production using a QS mechanism? Several factors are considered in determining
whether one biofilm was more successful than another, including occupancy and total
cell biomass. High-EPS producing biofilms have higher occupancies than low-EPS pro-
ducing biofilms, as a result of increased levels of EPS. They may furthermore benefit,
for example, by protection from environmental hazards, such as detachment, antibio-
tics or grazers. Low-EPS producing non-QS cells which have merged with upregulated
QS colonies (in mixed simulations) therefore experience benefits from the thick EPS
layer as well. If EPS consumption is occurring, non-QS cells in mixed colonies also
benefit by consuming the additional nutrients produced.
However, in all simulations, low-EPS producing cells on average outnumbered the
QS cells. This occurred in comparing QS with low EPS-producing non-QS biofilms,
and mixed biofilms, with and without the EPS consumption process. These findings
show that EPS production does not provide a benefit to the biofilm in regards to
achieving a high cell population, which is one potential objective of the bacteria cells
residing in a biofilm. To produce EPS at the induced rate, bacteria cells have a high
nutrient demand, and if this demand is not met, colony growth cannot occur. Another
cause of low populations of high-EPS producing cells is that these expanding colonies,
with high proportions of EPS, quickly clog the channel. In contrast, low-EPS producing
non-QS biofilm colonies take much longer to grow to the point that the channel is
clogged, but the biofilm is composed primarily of cells.
In the mixed biofilm simulations, success of QS or non-QS populations was deter-
mined by proximity to the nutrient source, largely an effect of the random initial distri-
bution. In a mixed environment, clogging of the channel by upstream colonies may
prevent downstream colonies from receiving nutrients, in some cases causing their
populations to suffer declines. Resource requirements are considerably higher for high-
EPS producing cells. If an adequate nutrient supply can be secured, either by locating
a colony near the nutrient source or utilizing EPS as a secondary food source, then it
is possible for QS cell populations to be greater than low-EPS producing cell
populations.
Under the investigated conditions, we found that overall, QS-regulated EPS produc-
tion rarely provides a benefit to a biofilm with the objective of achieving a high cell
population, in comparison to biofilms with low EPS-producing non-QS cells. However,
maximizing offspring generation is not necessarily the best strategy under all condi-
tions. EPS production would be beneficial if the objective of the bacteria cells in the
biofilm is to clog the channel. A QS biofilm colony located near the nutrient source
may use QS to increase its volume, clog the channel, and secure its supply of nutrients
while starving downstream colonies, and potentially force the downstream colony to
deplete their EPS supply. This is a competitive advantage for a colony, whether it is
located in a QS biofilm (indicating intra-species competition), or in a mixed biofilm
(inter-species competition). In any space-limited environment, such as fine sediment or
small vessels in higher organisms, channel clogging may be considered a beneficial
strategy for bacteria cells to use. In the study [51], it was shown that biofilms develop-
ing in plants stems used QS to clog the plant vessel used for water and nutrient
Frederick et al. Theoretical Biology and Medical Modelling 2011, 8:8http://www.tbiomed.com/content/8/1/8
Page 24 of 29

transportation, the so-called xylem, securing nutrients for themselves. Individual colo-
nies in patchy biofilm communities have an antagonistic interaction (some colonies
benefit at the expense of others) through utilization of an exploitative competition
strategy - the upstream colonies reduce nutrient resources in the environment, deplet-
ing the resource required by the downstream colonies. If cells wish to outcompete
another cell population in a biofilm, of their own species or a different species, (QS-
controlled) EPS production can provide an advantage. The drawback is that nutrient
supply must be abundant, as high-EPS producing cells have a high nutrient demand.
Downstream cells are upregulated (partly) by AHL produced by upstream colonies.
However, it is not obvious how upstream colonies could contribute to a potential ben-
efit (e.g. protection) for downstream cells through EPS production. In this sense,
downstream cells seem to be fooled into a premature EPS production, which they
might not even be able to realize due to nutrient depletion.
The results showed that on a population level, high-EPS producing biofilms suffered
lower cell populations. However, the spatial distributions in the 2D visualizations
demonstrated that for individual colonies, clogging the channel with biomass may be a
beneficial strategy. Individual cells within microcolonies are genetically related, and
have the ultimate objective of maintaining their own genes and reproducing in the
future. To optimize survival of their genes in the colonies, and ensure survival of their
offspring, bacteria cells would be interested in suppressing other colonies. In the event
of a structural reorganization or detachment/reattachment, the upstream colony has an
advantage, in that their genetically similar offspring will continue to succeed.
The nutrient supply, random placement of colonies, and QS had various impacts on
the resulting biofilms. QS and high-EPS producing non-QS biofilms had almost
equivalent total cell biomass under both the high and low nutrient regimes, indicating
that total cell population at the end of the simulation is predominantly controlled by
nutrients and mass transfer in the aqueous phase, and not quorum sensing, which is
also supported by the experimental findings of [63]. It was found that the random pla-
cement of colonies in the initial inoculation had a small impact on when induction
occurred. Nutrient limitations succeeded induction, and led to greater variability in
total cell biomass. The impact of QS was most prominent in regards to biofilm occu-
pancy and composition. QS induction occurs very rapidly, and likewise, the QS bio-
films were able to rapidly increase their occupancy and change their composition from
that of a low EPS-producing to high EPS-producing non-QS biofilm.
We argued that EPS production benefits cells under certain conditions. The question
arises of why EPS production would be associated with quorum sensing, that is, why
would cells wait until upregulation to produce EPS at higher rates, versus always pro-
ducing EPS at enhanced levels? A minimum thickness of an EPS layer is required for
effective protection of cells from a hazard, such as antibiotics and washout. If a cell
population is small, much energy would be expended to produce a layer of EPS which
may not provide adequate protection. Coupling EPS production with quorum sensing
ensures that a sufficient colony size is obtained such that the cost to produce EPS is
returned by the benefits of a protective layer. QS may then be considered a mechanism
for switching to a mode of high-EPS production once a certain number of cells is pre-
sent, ensuring the bacteria can protect themselves efficiently. Rather than existing in a
Frederick et al. Theoretical Biology and Medical Modelling 2011, 8:8http://www.tbiomed.com/content/8/1/8
Page 25 of 29

permanently upregulated state, which requires additional nutrients, QS biofilms can
quickly switch to the upregulated state and increase their size when necessary.
Conclusions and further workIn this study, we developed a mathematical model of QS in biofilms which incorpo-
rated an effect of QS on biofilm growth: upregulated cells produce EPS at an increased
rate. Through simulations, we investigated QS, non-QS, and mixed biofilms under var-
ious nutrient regimes and the biological process of EPS consumption. Our main results
are:
• QS-induced EPS production allows a biofilm to switch rapidly from an initial
colonization stage, in which the focus lies on rapid cell production, to a stage in
which the focus lies on producing large amounts of EPS as protection against
environmental threats such as grazers, mechanical washout, biocides, and transient
periods of nutrient limitation.
• low-EPS producing biofilms generally obtained higher cell populations, and high-
EPS producing biofilms obtained greater occupancies. The QS biofilms rapidly
changed from a state of cell growth to a state of EPS production; in other words,
quorum sensing is used as a signal for the biofilms to switch from a colonization
mode to a protection mode.
• high-EPS producing biofilm colonies rapidly filled their space-limited environ-
ment with biomass, and consisted of high proportions of EPS biomass. When EPS
is consumed, however, extreme nutrient deficiencies lead biofilms to deplete their
EPS supply, resulting in biofilms comprised purely of cells, with little to no EPS
present.
• a biofilm will benefit from using quorum sensing-induced EPS production if bac-
teria cells have the objective of acquiring a thick, protective layer of EPS, or if they
wish to clog their environment with biomass as a means of securing nutrient sup-
ply and outcompeting other colonies in the channel, of their own or a different
species.
Limitations of our model and simulation setup include the narrow simulation space.
We chose to model biofilm growth in narrow channels, and because high-EPS produ-
cing biofilm colonies expand rapidly, the observation period of QS induced biofilms is
brief. Other experimental setups that allow for long-term biofilm development could
be of interest; our model is intended to describe only the initial stages of biofilm
growth in a reactor system representative of space-restricted environments with fluid
flow, such as soil pores.
We used our model to observe connections between biofilm growth, quorum sen-
sing, and EPS production. Our study could be extended to test biofilms that use
quorum-sensing induced EPS production under the scenarios which we speculated bio-
films would benefit from high levels of EPS, for example, when grazers or antibiotics
are present. Future work in biofilm and quorum sensing modelling is required to con-
tinue to investigate how biofilms respond to quorum sensing induction.
Frederick et al. Theoretical Biology and Medical Modelling 2011, 8:8http://www.tbiomed.com/content/8/1/8
Page 26 of 29

AcknowledgementsThis study was supported in parts by the Advanced Foods and Materials Network, a Network of Centers of Excellence(NCE) and the National Science and Engineering Research Council (NSERC). The computing equipment used for thisstudy was provided by the Canada Foundation for Innovation (CFI) with a grant in the Leaders Opportunity Fundingprogram, awarded to HJE. We thank the technical staff of the Shared Hierarchical Academic Research Network(SHARCNET), for their technical support.
Author details1Department of Mathematics and Statistics, University of Guelph, 50 Stone Rd E, Guelph ON Canada N1G 2W1.2Center of Mathematical Sciences, Technical University of Munich, Boltzmannstr. 3, 85748 Garching, Germany. 3Instituteof Biomathematics and Biometry, HelmholtzCenter Munich, Ingolstädter Landstr. 1, 85764 Neuherberg, Germany.
Authors contributionsThis study was conducted as part of the M.Sc. thesis research of MRF at the University of Guelph, and on researchvisits to the HelmholtzCenter Munich. HJE was the thesis supervisor and guided the biofilm modelling aspects, CKand BAH guided the quorum sensing modelling aspects and the ecological interpretation of the results. All authorscontributed to the writing of the article, and read and approved the final manuscript.
Competing interestsThe authors declare that they have no competing interests.
Received: 2 August 2010 Accepted: 10 April 2011 Published: 10 April 2011
References1. Lewandowski Z, Beyenal H: Fundamentals of Biofilm Research Boca Raton: CRC Press; 2007.2. Fuqua C, Greenberg EP: Listening on bacteria: Acyl-homoserine lactone signalling. Nature Reviews Molecular Cell
Biology 2002, 3:685-695.3. Demuth DR, Lamont RJ: Bacterial cell-to-cell communication Cambridge: Cambridge University Press; 2006.4. Whitehead NA, Barnard AML, Slater H, Simpson NJL, Salmond GPC: Quorum-sensing in gram-negative bacteria. FEMS
Microbiology Reviews 2001, 25:365-404.5. Flemming HC, Neu TR, Wozniak DJ: The EPS Matrix: The “House of Biofilm Cells”. Journal of Bacteriology 2007,
189(22):7945-7947.6. Sutherland IW: Biofilm Exopolysaccharides. In Microbial Extracellular Polymeric Substances - Characterization, Structure,
and Function. Edited by: Wingender J, Neu TR, Flemming HC. Berlin-Heidelberg: Springer-Verlag; 1999:73-92.7. Wolfaardt GM, Lawrence JR, Korber DR: Function of EPS. In Microbial Extracellular Polymeric Substances -
Characterization, Structure, and Function. Edited by: Wingender J, Neu TR, Flemming HC. Springer; 1999:170-200.8. Laspidou CS, Rittmann BE: A unified theory for extracellular polymerica substances, soluble microbial products, and
active and inert biomass. Journal of Water Research 2002, 36(11):2711-2720.9. Wang ZW, Liu Y, Tay JH: Biodegradability of extracellular polymeric substances produced by aerobic granules.
Applied Microbiology and Biotechnology 2007, 74(2):462-466.10. Wanner O, Eberl H, Morgenroth E, Noguera D, Picioreanu C, Rittmann B, van Loosdrecht MCM: Mathematical Modeling
of Biofilms London: IWA Publishing; 2006.11. Alpkvist E, Picioreanu C, van Loosdrecht MCM, Heyden A: Three-dimensional biofilm model with individual cells and
continuum EPS matrix. Biotechnology and Bioengineering 2006, 94(5):961-979.12. Chambless JD, Hunt SM, Stewart PS: A three-dimensional computer model of four hypothetical mechanisms
protecting biofilms from antimicrobials. Applied Environmental Microbiology 2006, 72(3):2005-2013.13. Chopp DL: Simulating bacterial biofilms. In Deformable Models. Edited by: Suri JS, Farag AA. Berlin-Heidelberg:
Springer; 2007:1-31.14. Cogan NG: A two-fluid model of biofilm disinfection. Bull Math Biol 2008, 70(3):800-819.15. Dockery J, Klapper I: Finger formation in biofilm layers. SIAM Journal on Applied Mathematics 2001, 62(3):853-869.16. Eberl HJ, Parker DF, van Loosdrecht MCM: A new deterministic spatio-temporal continuum model for biofilm
development. Journal of Theoretical Medicine 2001, 3(3):161-175.17. Hermanowicz SW: A simple 2D biofilm model yields a variety of morphological features. Mathematical Biosciences
2001, 169(1):1-14.18. Kreft JU, Picioreanu C, Wimpenny JWT, van Loosdrecht MCM: Individual-based modelling of biofilms. Environmental
Microbiology 2001, 147:2897-2912.19. Picioreanu C, van Loosdrecht MCM, Heijnen JJ: A new combined differential-discrete cellular automaton approach
for biofilm modeling: Application for growth in gel beads. Biotechnology and Bioengineering 1998, 57(6):718-731.20. Cogan NG, Keener JP: The role of the biofilm matrix in structural development. IMA Mathematical Medicine and
Biology 2004, 21(2):147-166.21. Pizarro G, Griffeath D, Noguera D: Quantitative cellular automaton model for biofilms. Journal of Environmental
Engineering 2001, 127(9):782-789.22. Pizarro GE, Teixeira J, Sepulveda M, Noguera DR: Bitwise implementation of a 2D cellular automata biofilm model.
Journal of Computing in Civil Engineering 2005, 19(3):258-268.23. Tatek YB, Slater GW: A simulation model of biofilms with autonomous cells: Analysis of a two-dimensional version.
Physica A 2006, 362(2):382-402.24. Zhang T, Cogan NG, Wang Q: Phase field models for biofilms. I. Theory and one-dimensional simulations. SIAM
Journal on Applied Mathematics 2008, 69(3):641-669.25. Zhang T, Cogan NG, Wang Q: Phase-field models for biofilms. II. 2-D numerical simulations of biofilm-flow
interaction. Communications in Computational Physics 2008, 4(1):72-101.
Frederick et al. Theoretical Biology and Medical Modelling 2011, 8:8http://www.tbiomed.com/content/8/1/8
Page 27 of 29
26. Horn H, Neu TR, Wulkow M: Modelling the structure and function of extracellular polymeric substances in biofilmswith new numerical techniques. Water Science & Technology 2001, 43(6):121-127.
27. Eberl HJ: A deterministic continuum model for the formation of EPS in heterogeneous biofilm architectures.Proceedings of the International Conference Biofilms 2004: Structure and Activity of Biofilms , 24-26 October 2004; LasVegas.
28. Frederick MR, Kuttler C, Hense BA, Müller J, Eberl HJ: A mathematical model of quorum sensing in patchy biofilmcommunities with slow background flow. Canadian Applied Mathematics Quarterly 2011, 18(3):267-298.
29. Khassehkhan H, Hillen T, Eberl HJ: A nonlinear master equation for a degenerate diffusion model of biofilm growth.Lecture Notes in Computer Science 2009, 5544:735-744.
30. Ward JP, King JR, Koerber AJ, Williams P, Croft JM, Sockett RE: Mathematical modelling of quorum sensing inbacteria. IMA Journal of Mathematics Applied in Medicine and Biology 2001, 18(3):263-292.
31. Dockery JD, Keener JP: A mathematical model for quorum sensing in P. Aeruginosa. Bulletin of Mathematical Biology2001, 63(1):95-116.
32. Müller J, Kuttler C, Hense BA, Rothballer M, Hartmann A: Cell-cell communication by quorum sensing and dimension-reduction. Journal of Mathematical Biology 2006, 53:672-702.
33. Ward JP, King JR, Koerber AJ, Croft JM, Sockett RE, Williams P: Early development and quorum sensing in bacterialbiofilms. Journal of Mathematical Biology 2003, 47:23-55.
34. Chopp DL, Kirisits MJ, Parsek MR, Moran B: A mathematical model of quorum sensing in a growing P. aeruginosabiofilm. Journal of Industrial Microbiology and Biotechnology 2002, 29(6):339-346.
35. Chopp DL, Kirisits MJ, Parsek MR, Moran B: The dependence of quorum sensing on the depth of a growing biofilm.Bulletin of Mathematical Biology 2003, 65(6):1053-1079.
36. Janakiraman V, Englert D, Jayaraman A, Baskaran H: Modeling growth and quorum sensing in biofilms grown inmicrofluidic chamber. Annals of Biomedical Engineering 2009, 37(6):1206-1216.
37. Vaughan BL, Smith BG, Chopp DL: The influence of fluid flow on modeling quorum sensing in bacterial biofilms.Bulletin of Mathematical Biology 2010, 72(5):1143-65.
38. Anguige K, King JR, Ward JP, Williams P: Mathematical modelling of therapies targeted at bacterial quorum sensing.Mathematical Biosciences 2004, 192:39-83.
39. Anguige K, King JR, Ward JP: Modelling antibiotic and anti-quorum sensing treatment of a spatially structuredPseudomonas aeruginosa population. Journal of Mathematical Biology 2005, 51:557-594.
40. Anguige K, King JR, Ward JP: A multi-phase mathematical model of quorum sensing in a maturing Pseudomonasaeruginosa biofilm. Mathematical Biosciences 2006, 203(2):240-276.
41. Kirisits MJ, Margolis JJ, Purevdorj-Gage BL, Vaughan B, Chopp DL, Stoodley P, Parsek MR: Influence of thehydrodynamic environment on quorum sensing in Pseudomonas aeruginosa biofilms. Journal of Bacteriology 2007,189(22):8357-8360.
42. Ward J: Mathematical modelling of quorum sensing control in biofilms. In The Control of Biofilm Infections by SignalManipulation. Edited by: Balaban N. Berlin-Heidelberg: Springer-Verlag; 2008:78-107.
43. Davies DG: The Involvement of Cell-to-Cell Signals in the Development of a Bacterial Biofilm. Science 1998,280:295-298.
44. Sakuragi Y, Kolter R: Quorum-sensing regulation of the biofilm matrix genes (pel) of Pseudomonas aeruginosa.Journal of Bacteriology 2007, 189(14):5383-5386.
45. Friedman L, Kolter R: Genes involved in matrix formation in Pseudomonas aeruginosa PA14 biofilm. MolecularMicrobiology 2004, 51:675-690.
46. Shrout JD, Chopp DL, Just CL, Hentzer M, Givskov M, Parsek MR: The impact of quorum sensing and swarmingmotility on Pseudomonas aeruginosa biofilm formation is nutritionally conditional. Molecular Microbiology 2006,62(5):1264-1277.
47. Morohoshi T, Nakamura Y, Yamazaki G, Ishida A, Kato N, Ikeda T: The Plant Pathogen Pantoea ananatis Produces N-Acylhomoserine Lactone and Causes Center Rot Disease of Onion by Quorum Sensing. Journal of Bacteriology 2007,189(22):8333-8338.
48. Marketon MM, Glenn SA, Eberhard A, Gonzalez JE: Quorum Sensing Controls Exopolysaccharide Production inSinorhizobium meliloti. Journal of Bacteriology 2003, 185(1):325-331.
49. Minogue TD, Carlier AL, Koutsoudis MD, von Bodman SB: The cell density-dependent expression of stewartanexopolysaccharide in Pantoea stewartii ssp. stewartii is a function of EsaR-mediated repression of the rcsA gene.Molecular Microbiology 2005, 56:189-203.
50. Quinones B, Dulla G, Lindow SE: Quorum Sensing Regulates Exopolysaccharide Production, Motility, and Virulencein Pseudomonas syringae. Molecular Plant-Microbe Interactions 2005, 18(7):682-693.
51. Koutsoudis MD, Tsaltas D, Minogue TD, Beck von Bodman S: Quorum-sensing regulation governs bacterial adhesion,biofilm development, and host colonization in Pantoea stewartii subspecies stewartii. Proceedings of the NationalAcademy of Sciences 2006, 103(15):5983-5988.
52. Gao Y, Song J, Hu B, Zhang L, Liu Q, Liu F: The luxS Gene Is Involved in AI-2 Production, Pathogenicity, and SomePhenotypes in Erwinia amylovora. Current Microbiology 2009, 58(1):1-10.
53. Beck von Bodman S, Majerczak DR, Coplin DL: A negative regulator mediates quorum-sensing control ofexopolysaccharide production in Pantoea stewartii subsp. stewartii. Proceedings of the National Academy of Sciences1998, 95(13):7687-7692.
54. Zhang X, Bishop PL: Biodegradability of biofilm extracellular polymeric substances. Chemosphere 2006, 50:63-69.55. Stewart PS: Diffusion in biofilms. Journal of Bacteriology 2003, 185:1485-1491.56. Eberl HJ, Sudarsan R: Exposure of biofilms to slow flow fields: the convective contribution to growth and
disinfections. Journal of Theoretical Biology 2008, 253(4):788-807.57. Fekete A, Kuttler C, Rothballer M, Hense BA, Fischer D, Buddrus-Schiemann K, Lucio M, Müller J, Schmitt-Kopplin P,
Hartmann A: Dynamic Regulation of N-Acyl-homoserine Lactone Production and Degradation in Pseudomonasputida IsoF. FEMS Microbiology Ecology 2010, 72(1):22-34.
58. Kaplan HB, Greenberg EP: Diffusion of autoinducer is involved in regulation of the Vibrio fischeri luminescencesystem. Journal of Bacteriology 1985, 163(3):1210-1214.
Frederick et al. Theoretical Biology and Medical Modelling 2011, 8:8http://www.tbiomed.com/content/8/1/8
Page 28 of 29

59. Eberl HJ, Demaret L: A finite difference scheme for a doubly degenerate diffusion-reaction equation arising inmicrobial ecology. Electronic Journal of Differential Equations 2007, CS15:77-95.
60. Eberl HJ, Khassehkhan H, Demaret L: A mixed-culture model of a probiotic biofilm control system. Computationaland Mathematical Methods in Medicine 2010, 11(2):99-118.
61. Muhammad N, Eberl HJ: OpenMP Parallelization of a Mickens Time-Integration Scheme for a Mixed-Culture BiofilmModel and its Performance on Multi-core and Multi-processor Computers. LNCS 2010, 5976:180-195.
62. Muhammad N: Computational analysis of parameter uncertainties in a 2d mixed-culture biofilm model PhD Thesis,University of Guelph; 2010.
63. Purevdorj B, Costerton JW, Stoodley P: Influence of Hydrodynamics and Cell Signaling on the Structure andBehavior of Pseudomonas aeruginosa Biofilms. Applied and Environmental Microbiology 2002, 68(9):4457-4464.
64. Hobbie RK, Roth BJ: Intermediate physics for medicine and biology New York: Springer; 2007.
doi:10.1186/1742-4682-8-8Cite this article as: Frederick et al.: A mathematical model of quorum sensing regulated EPS production inbiofilm communities. Theoretical Biology and Medical Modelling 2011 8:8.
Submit your next manuscript to BioMed Centraland take full advantage of:
• Convenient online submission
• Thorough peer review
• No space constraints or color figure charges
• Immediate publication on acceptance
• Inclusion in PubMed, CAS, Scopus and Google Scholar
• Research which is freely available for redistribution
Submit your manuscript at www.biomedcentral.com/submit
Frederick et al. Theoretical Biology and Medical Modelling 2011, 8:8http://www.tbiomed.com/content/8/1/8
Page 29 of 29