Embed Size (px)
Citation preview
MARINE ECOLOGY PROGRESS SERIESMar Ecol Prog Ser
Vol. 434: 239–249, 2011doi: 10.3354/meps09136
Published July 28
INTRODUCTION
There is an increasing need to incorporate multiplevalues (i.e. economic, social and cultural) into conser-vation and environmental management plans (Cowl-ing et al. 2008, Naidoo et al. 2008). Strategy documentssuch as the Millennium Ecosystem Assessment (MEA)have highlighted the necessity to take into account theintrinsic values associated with ecosystems and also toadopt a comprehensive approach that encompasses awider range of values, including the local, cultural andeconomic values that stem from the relationship be -tween people and nature (MEA 2005). However, whilst
ecological, and latterly economic values (Naidoo et al.2008), are considered in the definition and design ofenvironmental management plans, community or stake -holder values are not always considered (Alessa et al.2008, Raymond et al. 2009, Bryan et al. 2010). If thesevalues are to be incorporated into spatial managementplans, it is essential that they possess a spatial compo-nent so that they can be integrated with spatiallydefined biophysical, ecological and economic data. Inaddition to facilitating the integration of information,Zube (1987) suggested several advantages associatedwith mapping community values; firstly it permits theidentification of places people value and the reasons
© Inter-Research 2011 · www.int-res.com*Email: [email protected]
Mapping stakeholder values for coastal zone management
A. Ruiz-Frau1,*, G. Edwards-Jones2, M. J. Kaiser1
1School of Ocean Sciences, College of Natural Sciences, Bangor University, LL59 5AB, UK 2School of the Environment, Natural Resources and Geography, College of Natural Science, Bangor University, LL57 2UW, UK
ABSTRACT: There is a growing recognition of the need to incorporate multiple values in environ-mental management plans. While biological and, increasingly, economic values are considered in thedesign of management strategies, community or stakeholder values are not often taken into account.We mapped stakeholders’ values for marine ecosystems and assessed their preferences for the loca-tion and type of marine protected areas (MPAs) around the coast of Wales (UK). Stakeholders werechosen to represent a comprehensive range of interests in the marine environment. Fourteen differ-ent types of value were identified by stakeholders. The spatial distribution of the different valuesattached to the marine environment was ascertained; this revealed the existence of areas where mul-tiple values overlapped. Results indicated that areas perceived as ecologically important also pos-sessed high heritage and leisure values. When locating MPAs, stakeholders balanced conservationneeds with societal demands by protecting areas identified as ecologically important while avoidingthose areas where restrictions could have a considerable impact on society. Data suggested a prefer-ence for MPAs that permitted a range of adequately regulated anthropogenic activities. The distrib-ution of stakeholders’ values and the identification of areas of multiple value help managers to under-stand the potential consequences of particular management strategies, and allow them to be awareof the location of areas where greater consideration is required when designing management plans,as multiple interests may overlap. Thus, mapping stakeholders’ values in the marine environmentprovides a useful tool for identifying areas better suited for specific management regulations and forthe development of comprehensive marine spatial plans, as these require the understanding of thespatial heterogeneity of the different ecosystem components including both ecological and humanelements.
KEY WORDS: Ecosystem service · Marine spatial planning · Marine protected area · Community values
Resale or republication not permitted without written consent of the publisher
Contribution to the Theme Section ‘Biodiversity, ecosystems and coastal zone management’ OPENPEN ACCESSCCESS
Mar Ecol Prog Ser 434: 239–249, 2011
why they value them, thus allowing managers tobecome aware of the need to give particular areasextra consideration when designing management plans.Secondly, it identifies areas of potential conflict be -tween user groups in cases where multiple user groupsvalue an area for potentially conflicting reasons; andthirdly, it helps managers understand the potentialconsequences that alternative management scenarioscan have on the wider environment and on society.
In terrestrial systems, several studies have mappedcommunity values of the natural environment usingdifferent approaches. For example, values associatedwith urban natural areas, such as parks and greenareas, have been mapped in Finland (Tyrvainen et al.2007), while other studies have elucidated the valuespeople ascribe to publicly owned lands (Brown & Reed2000, Alessa et al. 2008, McIntyre et al. 2008). A varietyof value typologies have been used in these studies;however, some of the typologies focused only on par-ticular sets of values, such as recreational values, andthus did not have the scope to capture the wider arrayof values that can be associated with the natural envi-ronment (McIntyre et al. 2008). Brown (2004) devel-oped a landscape value methodology to map and mea-sure a wider range of landscape values which includedrecreational, aesthetic, economic, cultural and bio -diversity values. Whilst this methodology sought tounderstand a range of values from the social perspec-tive, it failed to capture the biophysical aspects ofvalue. Raymond et al. (2009) provided a potentialframework for understanding this broader set of valuesby integrating Brown’s (2004) typology with the con-cept of natural capital and ecosystem services estab-lished by the MEA (2005), thereby offering the possi-bility to value other aspects of the environment such asthe provision of regulating or supporting services.
Such an approach to mapping community values islacking in the marine environment despite its potentialvalue to accomplish successful marine spatial planning(MSP). The development of comprehensive MSPrequires an understanding of the spatial heterogeneityof different ecosystem components, including bothecological and human elements. Marine protectedareas (MPAs) are among the most important manage-ment and conservation tools available within a frame-work of MSP and have been advocated as an essentialpart for achieving global marine conservation targets(UN 2002, OSPAR Commission 2003, CBD 2008). ForMPAs to be successful in achieving their conservationobjectives, they need to be designed with biologicalprinciples as a primary design criterion (Roberts et al.2003), but they also need to have community support inorder to ensure user compliance (Moore et al. 2004).Despite having recognised the latter as an importantfactor for success, community values are not always
considered during the MPA design process, which re -mains dominated by biological issues.
The aim of our study was to elicit and spatially definecommunity values for the marine environment. Thiswas achieved by adapting the value typology of Ray-mond et al. (2009) to the marine environment. WhilstRaymond et al. (2009) used MEA’s classification forecosystem goods and services (EGS), we utilised anadaptation of MEA’s EGS to the marine environment(Beaumont et al. 2007). Our study focused on Wales,UK, where the Welsh Assembly Government hasadopted a Marine and Coastal Access Act throughwhich it is committed to ‘establishing an ecologicallycoherent, representative and well-managed networkof marine protected areas’ taking into account ‘en -vironmental, social and economic criteria’ by 2012(DEFRA 2009). Although comprehensive information isavailable for the distribution of biophysical and ecolog-ical factors, no information exists on the social valuesassociated with the marine environment in Wales. Wesought to inform the decision-making process regard-ing the design of MPAs in Wales by providing keyinsights into the values held by different stakeholdergroups with an interest in the marine environment.This was achieved by gathering information on the val-ues and benefits derived from the marine environmentby different stakeholder groups and by defining thespatial distribution of those values such that they couldbe incorporated into marine spatial management plans.Stakeholder views on the preferred location and designof MPAs and their associated management were alsoinvestigated.
MATERIALS AND METHODS
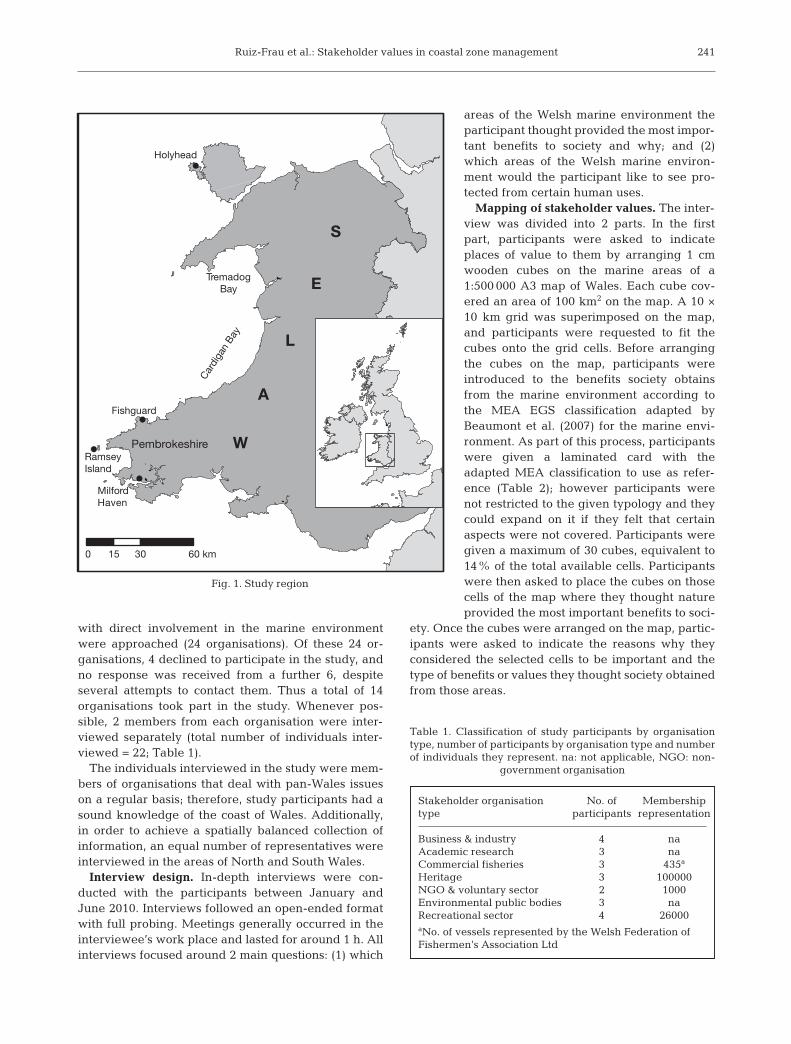
Study area. Wales has a coastline of ~1300 km, andan area of ~16 000 km2 lies within Welsh territorialwaters (Fig. 1). The majority of the Welsh populationis concentrated in coastal areas, where the marineenvironment offers the opportunity for a wide range ofuses such as commercial fisheries, tourism, energy pro-vision, recreation and shipping. Therefore, a variety ofstakeholder groups exists with a wide range of inter-ests and values attached to the marine environment.
Stakeholder sample. To achieve a comprehensiverepresentation of community views, representatives ofvarious stakeholder groups with different interests inthe marine environment were interviewed. In order todo this, members of the Wales Maritime and CoastalPartnership (WMCP) were approached. The WMCPis formed of representatives of maritime and coastalinterests in Wales encompassing 26 organisationsdrawn from the public, private and voluntary sector.For the purpose of our study, only those organisations
240
Ruiz-Frau et al.: Stakeholder values in coastal zone management
with direct involvement in the marine environmentwere approached (24 organisations). Of these 24 or -ganisations, 4 declined to participate in the study, andno response was received from a further 6, despite several attempts to contact them. Thus a total of 14organisations took part in the study. Whenever pos -sible, 2 members from each organisation were inter-viewed separately (total number of individuals inter-viewed = 22; Table 1).
The individuals interviewed in the study were mem-bers of organisations that deal with pan-Wales issueson a regular basis; therefore, study participants had asound knowledge of the coast of Wales. Additionally,in order to achieve a spatially balanced collection ofinformation, an equal number of representatives wereinterviewed in the areas of North and South Wales.
Interview design. In-depth interviews were con-ducted with the participants between January andJune 2010. Interviews followed an open-ended formatwith full probing. Meetings generally occurred in theinterviewee’s work place and lasted for around 1 h. Allinterviews focused around 2 main questions: (1) which
areas of the Welsh marine environment theparticipant thought provided the most impor-tant benefits to society and why; and (2)which areas of the Welsh marine environ-ment would the participant like to see pro-tected from certain human uses.
Mapping of stakeholder values. The inter-view was divided into 2 parts. In the firstpart, participants were asked to indicateplaces of value to them by arranging 1 cmwooden cubes on the marine areas of a1:500 000 A3 map of Wales. Each cube cov-ered an area of 100 km2 on the map. A 10 ×10 km grid was superimposed on the map,and participants were requested to fit thecubes onto the grid cells. Before arrangingthe cubes on the map, participants wereintroduced to the benefits society obtainsfrom the marine environment according tothe MEA EGS classification adapted byBeaumont et al. (2007) for the marine envi-ronment. As part of this process, participantswere given a laminated card with theadapted MEA classification to use as refer-ence (Table 2); however participants werenot restricted to the given typology and theycould expand on it if they felt that certainaspects were not covered. Participants weregiven a maximum of 30 cubes, equi valent to14% of the total available cells. Participantswere then asked to place the cubes on thosecells of the map where they thought natureprovided the most important benefits to soci-
ety. Once the cubes were arranged on the map, partic-ipants were asked to indicate the reasons why theyconsidered the selected cells to be important and thetype of benefits or values they thought society obtainedfrom those areas.
241
W
A
L
E
S
RamseyIsland
Milford Haven
Fishguard
Holyhead
TremadogBay
Car
diga
n B
ay
Pembrokeshire
0 15 30 60 km
Fig. 1. Study region
Stakeholder organisation No. of Membership type participants representation
Business & industry 4 naAcademic research 3 naCommercial fisheries 3 435a
Heritage 3 100000NGO & voluntary sector 2 1000Environmental public bodies 3 naRecreational sector 4 26000aNo. of vessels represented by the Welsh Federation ofFishermen’s Association Ltd
Table 1. Classification of study participants by organisationtype, number of participants by organisation type and numberof individuals they represent. na: not applicable, NGO: non-
government organisation
Mar Ecol Prog Ser 434: 239–249, 2011
The second part of the exercise was concerned withthe establishment and location of MPAs in Wales. Par-ticipants were briefed on the current conservation pol-icy situation in Wales. They were asked to indicatethose cells where they would like to see some type ofprotection or restriction in the marine environment. Tocreate priority in the selection of areas, the exercisewas divided into 3 subtasks; first, participants weregiven 10 cubes to place on the map, so that only 10cells could be selected for protection. Once the cubeswere arranged on the map, participants were thengiven another 10 cubes and once these were arranged,an extra 10 cubes were given. To be able to identify thecells selected through the different subtasks, each ofthe 3 sets of cubes had a different colour. After eachsubtask, participants were asked to indicate the rea-sons behind their selection and to state the type of pro-tection they would like to see in place for each of theselected cells. Participants could choose among 3 lev-els of protection: (1) closed access areas, where nohuman activities were allowed, (2) areas where non-extractive recreational activities were allowed, and (3)areas where restricted recreational and commercialfishing were permitted.
Data analysis. Digital pictures of the participant’smaps were taken after each exercise, and the resultswere digitised using geographic information system(GIS) software (ArcGIS 9.2, ESRI). Additionally, a data-base was created with the attribute information associ-ated with each of the cells on the map. This databasewas linked to the spatial information stored in the GIS.The percentage of participants and the number of
times each cell was identified as an important providerof a particular benefit, or was selected for protection,was recorded and used in subsequent spatial analyses.
The assessment of potential spatial relationships wasundertaken using 2 different types of analyses. First,Pearson’s correlations were used to identify geographicrelationships between pairs of benefits (Mitchell 2005).Second, the level of spatial aggregation for each of thebenefits was analysed using Local Moran’s I, which allows for the identification of clusterings of similar val-ues (high or low) by analysing how much each cell issimilar or dissimilar to its neighbours (Mitchell 2005).The statistical significance of Moran’s I at a certain con-fidence level is calculated using the Z-score. High val-ues of Moran’s I indicate high clustering, values around0 indicate no clustering, and negative values indicatedispersion. Three maps were produced for each of theperceived benefits. Local Moran’s I was mapped toshow the location of clusters of similar values, Z-scoremaps were produced to indicate which of the clusterswere significant at a 95% confidence level, and a thirdmap that showed the percentage of times each cell wasselected for a particular benefit was produced to indi-cate whether the clusters comprised high or low values.
RESULTS
Spatial distribution of values
The nature of stakeholders’ values and their spatialdistribution were examined for the coast of Wales.
242
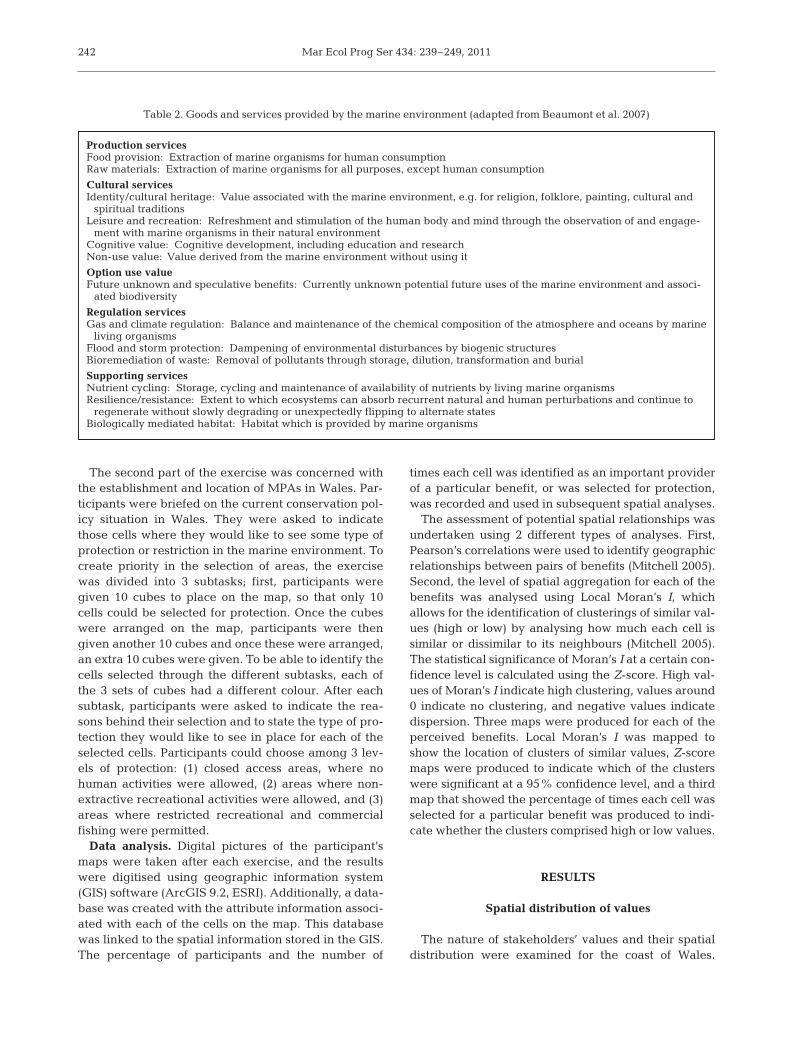
Production servicesFood provision: Extraction of marine organisms for human consumptionRaw materials: Extraction of marine organisms for all purposes, except human consumption
Cultural servicesIdentity/cultural heritage: Value associated with the marine environment, e.g. for religion, folklore, painting, cultural and
spiritual traditionsLeisure and recreation: Refreshment and stimulation of the human body and mind through the observation of and engage-
ment with marine organisms in their natural environmentCognitive value: Cognitive development, including education and researchNon-use value: Value derived from the marine environment without using it
Option use valueFuture unknown and speculative benefits: Currently unknown potential future uses of the marine environment and associ-
ated biodiversity
Regulation servicesGas and climate regulation: Balance and maintenance of the chemical composition of the atmosphere and oceans by marine
living organismsFlood and storm protection: Dampening of environmental disturbances by biogenic structuresBioremediation of waste: Removal of pollutants through storage, dilution, transformation and burial
Supporting servicesNutrient cycling: Storage, cycling and maintenance of availability of nutrients by living marine organismsResilience/resistance: Extent to which ecosystems can absorb recurrent natural and human perturbations and continue to
regenerate without slowly degrading or unexpectedly flipping to alternate statesBiologically mediated habitat: Habitat which is provided by marine organisms
Table 2. Goods and services provided by the marine environment (adapted from Beaumont et al. 2007)

Participants identified 14 different types of societalbenefits or values derived from the marine environ-ment. To classify the different benefits, intervieweesused the card given to them as a reference, and addi-tionally, they expanded on the typology of benefits andincluded other reasons for valuing certain areas of themarine environment such as the geological value of anarea or the value attached to a particular zone due toits conservation designation. The majority of partici-pants identified tourism and recreation, food provision,industrial opportunities and ecological importance asthe most cited values derived from the marine environ-ment (Table 3). The opportunities offered by themarine environment for recreation and tourism wereperceived as the most important benefit for society, as‘tourism and recreation’ values were assigned thegreatest number of cubes when compared to the otherpotential values. ‘Ecological value’ was the benefit thatreceived the second highest number of cubes and wasmentioned by 83% of participants. Only those partici-pants from the academic sector or the environmentalpublic bodies specifically mentioned the supportingand regulating benefits provided by the marine envi-ronment; this may relate to the level of expertise of theinterviewees. However, it became clear from the inter-views that other participants included these benefitsunder the broader term of ‘ecological value’.
Benefits derived from marinas and from the 3 maincommercial ports in Wales (Holyhead, Fishguard andMilford Haven, Fig. 1) were perceived as ‘industrialvalues’ and were mentioned by a high proportion ofparticipants; ~70% of participants re ferred to theseduring the interviews. Participants also viewed themarine environment as an important source of energysupply. Areas off the north coast of Wales were men-
tioned as important for wind energy and areas in thesouth and south west coast were pointed out as poten-tial suppliers of tidal energy.
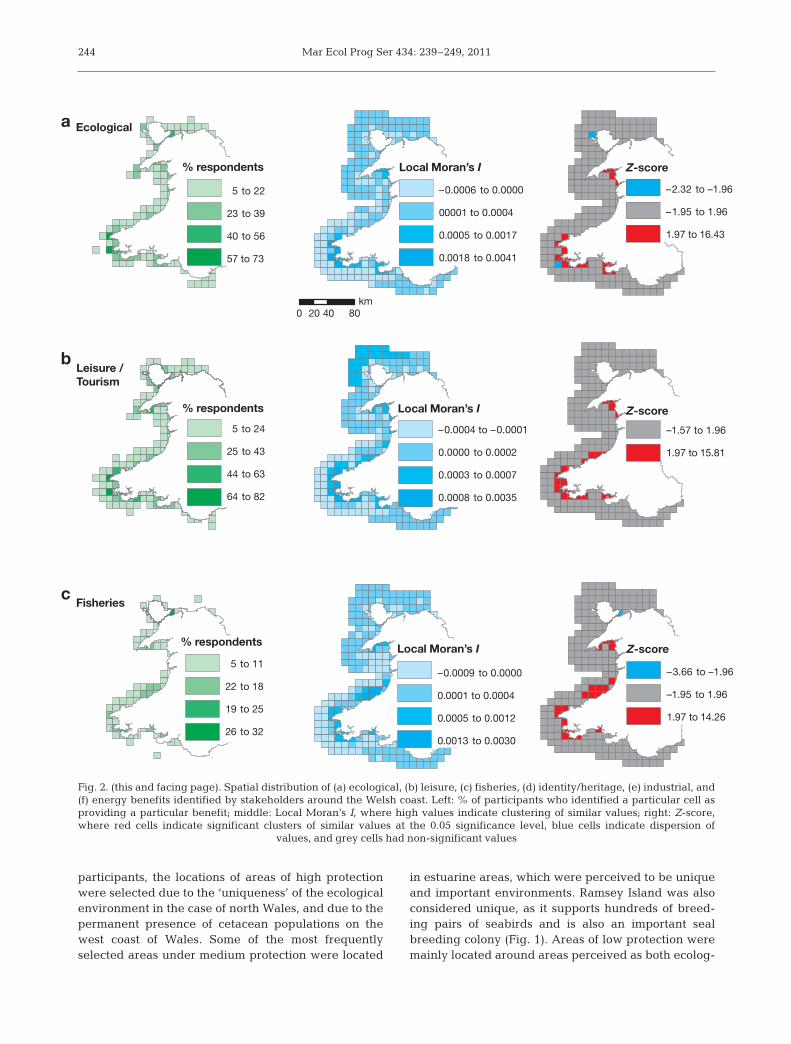
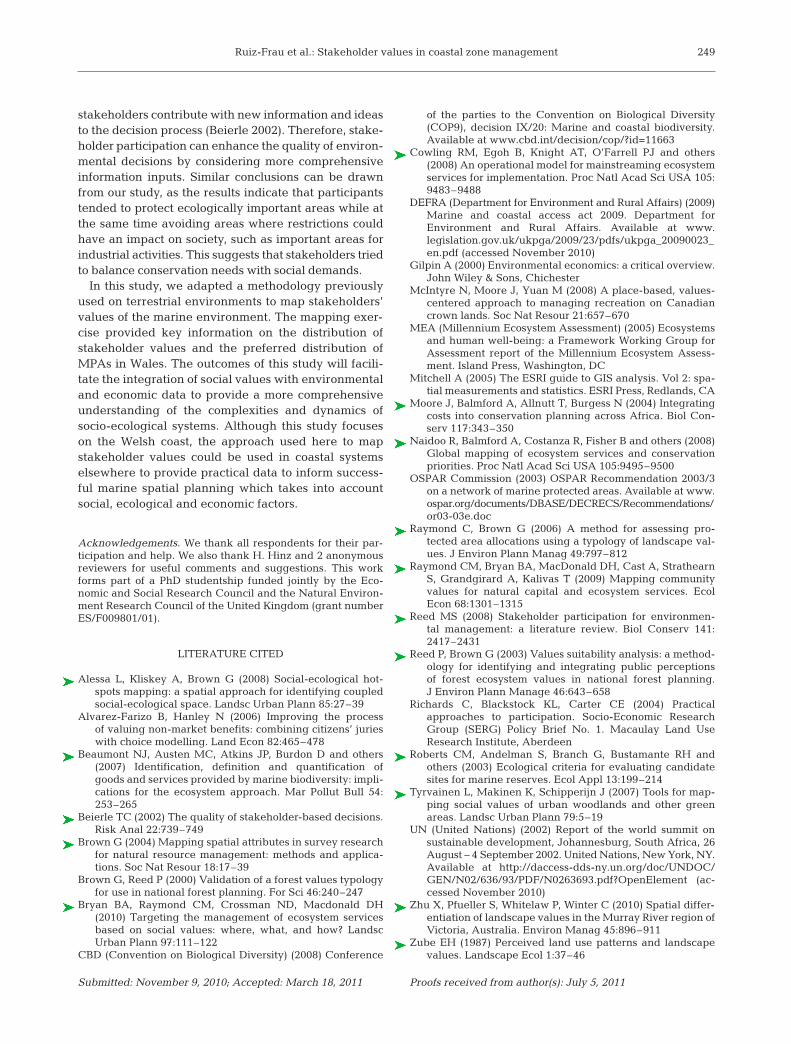
GIS maps were created for the spatial distribution ofthe benefits most frequently mentioned by participants(Fig. 2). The mapping of Z-scores indicated the exis-tence of significant clusters of high values for several ofthe benefits (i.e. areas selected by a high percentageof participants). For most of the benefits, significantclusters tended to be located around the same areas(Pembrokeshire coast, Cardigan Bay and TremadogBay, Fig. 1), suggesting that certain areas were per-ceived as providers of multiple benefits. The similarityof the spatial distribution for some of the benefits wasfurther confirmed by strong positive spatial correla-tions between some pairs of benefits (Table 4). Forinstance, the distribution of areas with an associatedecological value was strongly correlated with the dis-tribution of areas with associated recreational benefits(Pearson r = 0.904), identity/heritage values (r = 0.815)and fisheries benefits (r = 0.72). A map showing thetotal number of values assigned to each cell was cre-ated, and the presence of significant clusters was identi-fied (Fig. 3a). This map makes it possible to identify‘hotspot areas’ for the provision of values.
Location of MPAs
The majority of participants (74%) used the 30 avail-able cubes for the selection of protected areas. In general, participants supported less restrictive marineprotected areas where controlled commercial and re -creational fishing were allowed. Seventy-four percent ofparticipants chose to protect areas using this type ofmanagement (lowest level of protection), and on aver-age, participants allocated 66% (± 7.8% SE) of theircubes to this level of protection. Similarly, 74% of partic-ipants chose to protect some areas of the coast using thesecond level of protection where only non-extractiverecreational activities were allowed. However, the aver-age number of cubes allocated to this type of protectionwas lower than in the previous case as participants onaverage allocated 30 ± 7.5% of the cubes to this level ofmanagement. Generally, participants did not supportthe full protection of areas of the marine environment,i.e. where no anthropogenic activities would be permit-ted. Only 4 participants chose to implement the highestform of protection in certain areas of the coast. Interest-ingly, these areas were of very restricted size as partici-pants who chose the highest level of protection allocatedon average only 2 cubes to this type of management.
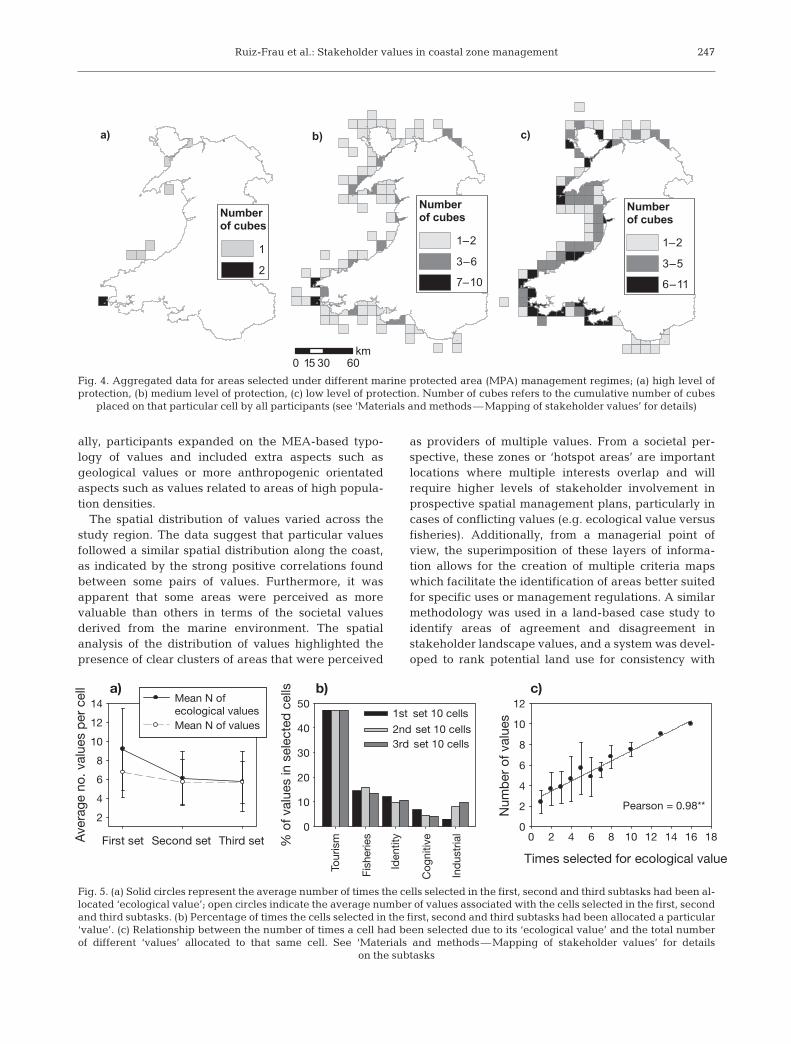
Digital maps that represented the distribution ofhigh, medium and low protection areas as chosen bythe participants were created (Fig. 4). According to
Ruiz-Frau et al.: Stakeholder values in coastal zone management 243
Value No. of No. of cubes participants
Tourism/leisure/recreation 416 20Ecological value 332 19Food provision (fisheries) 124 16Industrial value 104 16Identity/heritage 99 9Existing conservation designations 44 3Supporting services 44 3Cognitive value 30 4Energy provision 21 7Geological value 18 2Regulation services 16 3Option value 12 2High population 4 1
Total 637 22
Table 3. Stakeholder values, number of cubes allocated toeach value (see ‘Materials and methods—Mapping of stake-holder values’ for details) and number of participants who
mentioned each of them
Mar Ecol Prog Ser 434: 239–249, 2011
participants, the locations of areas of high protectionwere selected due to the ‘uniqueness’ of the ecologicalenvironment in the case of north Wales, and due to thepermanent presence of cetacean populations on thewest coast of Wales. Some of the most frequentlyselected areas under medium protection were located
in estuarine areas, which were perceived to be uniqueand important environments. Ramsey Island was alsoconsidered unique, as it supports hundreds of breed-ing pairs of seabirds and is also an important sealbreeding colony (Fig. 1). Areas of low protection weremainly located around areas perceived as both ecolog-
244
% respondents
5 to 22
23 to 39
40 to 56
57 to 73
0 8020 40km
Ecological
Leisure / Tourism
Fisheries
% respondents
5 to 24
25 to 43
44 to 63
64 to 82
% respondents
5 to 11
22 to 18
19 to 25
26 to 32
Local Moran’s I
–0.0006 to 0.0000
00001 to 0.0004
0.0005 to 0.0017
0.0018 to 0.0041
–0.0004 to –0.0001
0.0000 to 0.0002
0.0003 to 0.0007
0.0008 to 0.0035
–0.0009 to 0.0000
0.0001 to 0.0004
0.0005 to 0.0012
0.0013 to 0.0030
Local Moran’s I
Local Moran’s I
Z-score
–2.32 to –1.96
–1.95 to 1.96
1.97 to 16.43
Z-score
–1.57 to 1.96
1.97 to 15.81
Z-score
–3.66 to –1.96
–1.95 to 1.96
1.97 to 14.26
a
b
c
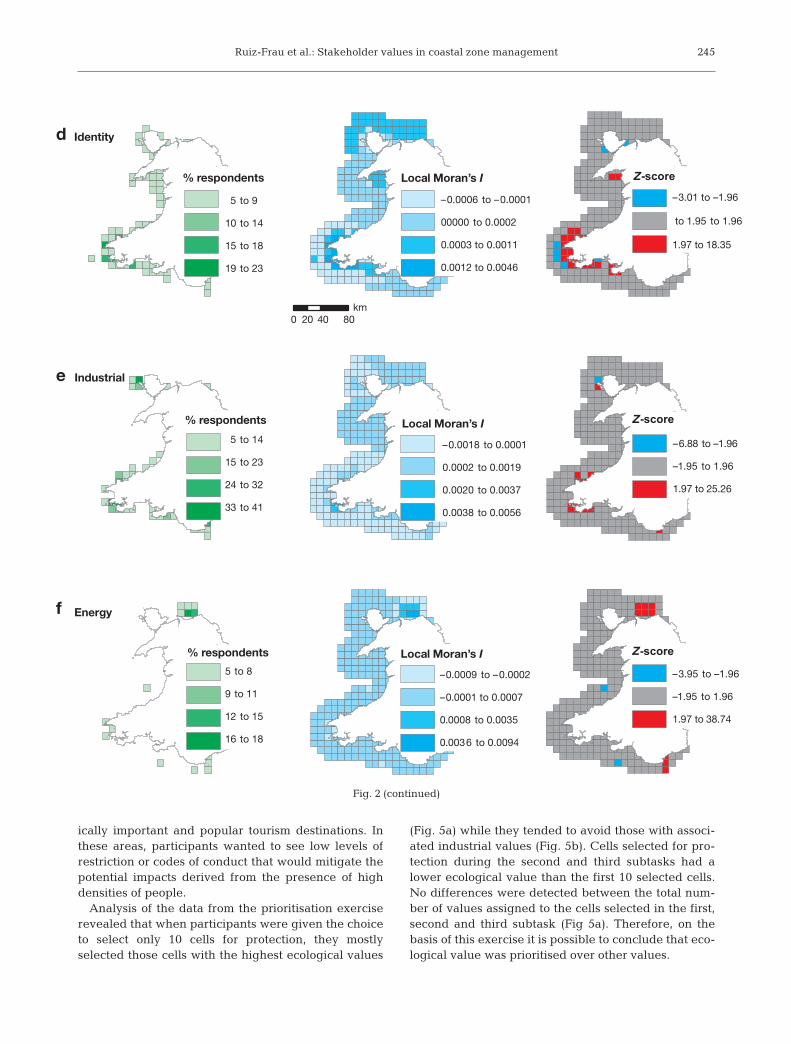
Fig. 2. (this and facing page). Spatial distribution of (a) ecological, (b) leisure, (c) fisheries, (d) identity/heritage, (e) industrial, and(f) energy benefits identified by stakeholders around the Welsh coast. Left: % of participants who identified a particular cell asproviding a particular benefit; middle: Local Moran’s I, where high values indicate clustering of similar values; right: Z-score,where red cells indicate significant clusters of similar values at the 0.05 significance level, blue cells indicate dispersion of
values, and grey cells had non-significant values
Ruiz-Frau et al.: Stakeholder values in coastal zone management
ically important and popular tourism destinations. Inthese areas, participants wanted to see low levels ofrestriction or codes of conduct that would mitigate thepotential impacts derived from the presence of highdensities of people.
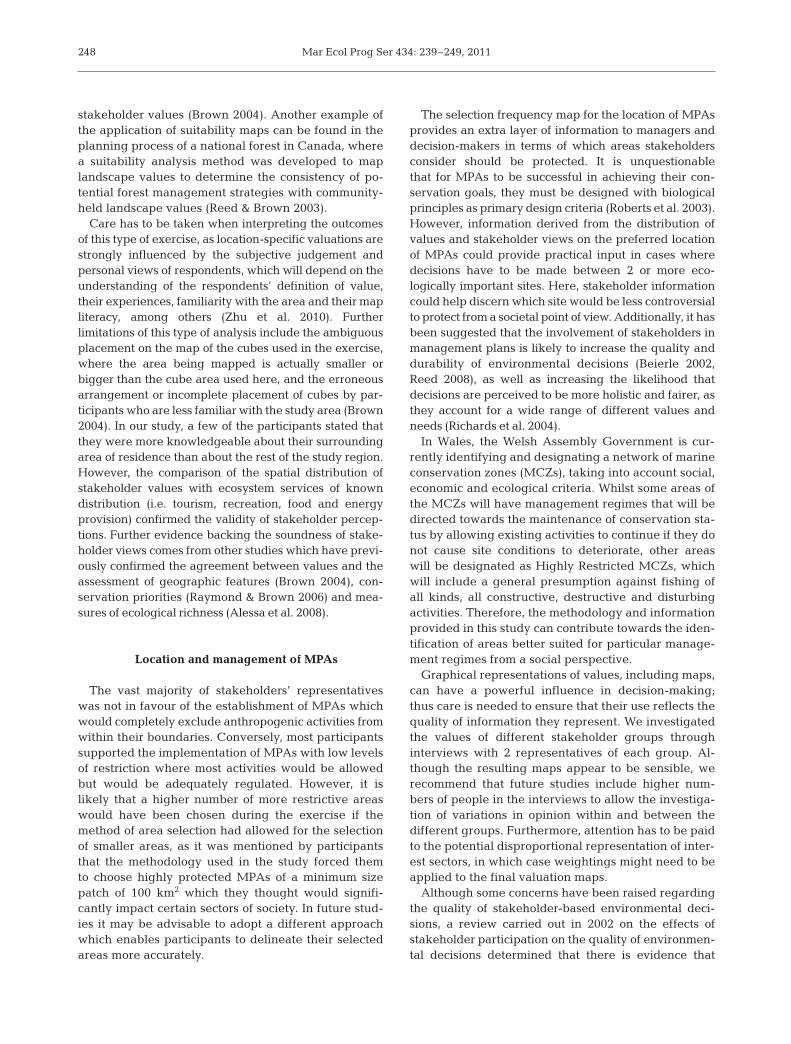
Analysis of the data from the prioritisation exerciserevealed that when participants were given the choiceto select only 10 cells for protection, they mostlyselected those cells with the highest ecological values
(Fig. 5a) while they tended to avoid those with associ-ated industrial values (Fig. 5b). Cells selected for pro-tection during the second and third subtasks had alower ecological value than the first 10 selected cells.No differences were detected between the total num-ber of values assigned to the cells selected in the first,second and third subtask (Fig 5a). Therefore, on thebasis of this exercise it is possible to conclude that eco-logical value was prioritised over other values.
245
Fig. 2 (continued)
% respondents
5 to 9
10 to 14
15 to 18
19 to 23
% respondents
% respondents
Identity
Industrial
Energy
5 to 14
15 to 23
24 to 32
33 to 41
5 to 8
9 to 11
12 to 15
16 to 18
Local Moran’s I
–0.0006 to –0.0001
00000 to 0.0002
0.0003 to 0.0011
0.0012 to 0.0046
–0.0018 to 0.0001
0.0002 to 0.0019
0.0020 to 0.0037
0.0038 to 0.0056
Local Moran’s I
–0.0009 to –0.0002
–0.0001 to 0.0007
0.0008 to 0.0035
0.0036 to 0.0094
Local Moran’s I
0 8020 40km
Z-score
Z-score
Z-score
–3.01 to –1.96
to 1.95 to 1.96
1.97 to 18.35
–6.88 to –1.96
–1.95 to 1.96
1.97 to 25.26
–3.95 to –1.96
–1.95 to 1.96
1.97 to 38.74
d
e
f
Mar Ecol Prog Ser 434: 239–249, 2011
Spatial overlap between protected areas andvalues
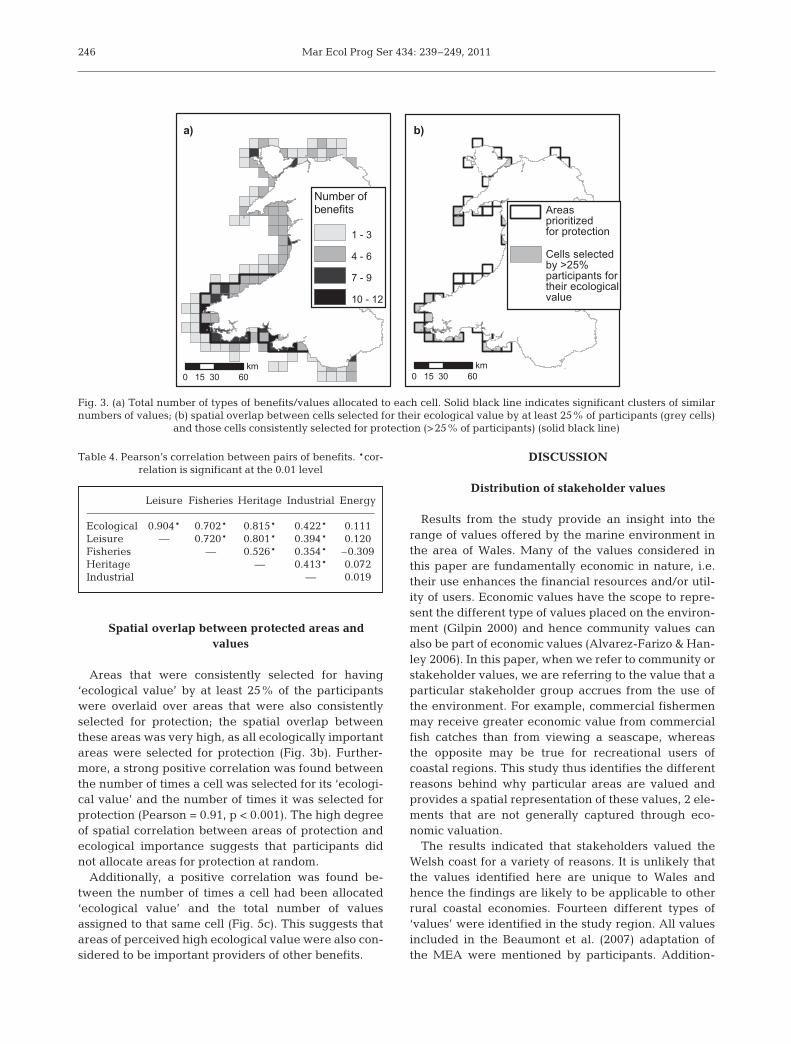
Areas that were consistently selected for having‘ecological value’ by at least 25% of the participantswere overlaid over areas that were also consistentlyselected for protection; the spatial overlap betweenthese areas was very high, as all ecologically importantareas were selected for protection (Fig. 3b). Further-more, a strong positive correlation was found betweenthe number of times a cell was selected for its ‘ecologi-cal value’ and the number of times it was selected forprotection (Pearson = 0.91, p < 0.001). The high degreeof spatial corre lation between areas of protection andecological importance suggests that participants didnot allocate areas for pro tection at random.
Additionally, a positive correlation was found be -tween the number of times a cell had been allocated‘ecological value’ and the total number of valuesassigned to that same cell (Fig. 5c). This suggests thatareas of perceived high ecological value were also con-sidered to be important providers of other benefits.
DISCUSSION
Distribution of stakeholder values
Results from the study provide an insight into therange of values offered by the marine environment inthe area of Wales. Many of the values considered inthis paper are fundamentally economic in nature, i.e.their use enhances the financial resources and/or util-ity of users. Economic values have the scope to repre-sent the different type of values placed on the environ-ment (Gilpin 2000) and hence community values canalso be part of economic values (Alvarez-Farizo & Han-ley 2006). In this paper, when we refer to community orstakeholder values, we are referring to the value that aparticular stakeholder group accrues from the use ofthe environment. For ex ample, commercial fishermenmay receive greater economic value from commercialfish catches than from viewing a seascape, whereasthe opposite may be true for recreational users ofcoastal regions. This study thus identifies the differentreasons behind why particular areas are valued andprovides a spatial representation of these values, 2 ele-ments that are not generally captured through eco-nomic valuation.
The results indicated that stakeholders valued theWelsh coast for a variety of reasons. It is unlikely thatthe values identified here are unique to Wales andhence the findings are likely to be applicable to otherrural coastal economies. Fourteen different types of‘values’ were identified in the study region. All valuesincluded in the Beaumont et al. (2007) adaptation ofthe MEA were mentioned by participants. Addition-
246
Leisure Fisheries Heritage Industrial Energy
Ecological 0.904* 0.702* 0.815* 0.422* 0.111Leisure — 0.720* 0.801* 0.394* 0.120Fisheries — 0.526* 0.354* –0.309Heritage — 0.413* 0.072Industrial — 0.019
Table 4. Pearson’s correlation between pairs of benefits. *cor-relation is significant at the 0.01 level
0 30 6015km
Number of benefits
1 - 3
4 - 6
7 - 9
10 - 12
a) b)
0 30 6015km
Areasprioritizedfor protection
Cells selectedby >25%participants for their ecological value
Fig. 3. (a) Total number of types of benefits/values allocated to each cell. Solid black line indicates significant clusters of similarnumbers of values; (b) spatial overlap between cells selected for their ecological value by at least 25% of participants (grey cells)
and those cells consistently selected for protection (>25% of participants) (solid black line)
Ruiz-Frau et al.: Stakeholder values in coastal zone management
ally, participants expanded on the MEA-based typo -logy of values and included extra aspects such as geological values or more anthropogenic orientatedaspects such as values related to areas of high popula-tion densities.
The spatial distribution of values varied across thestudy region. The data suggest that particular valuesfollowed a similar spatial distribution along the coast,as indicated by the strong positive correlations foundbetween some pairs of values. Furthermore, it wasapparent that some areas were perceived as morevaluable than others in terms of the societal valuesderived from the marine environment. The spatialanalysis of the distribution of values highlighted thepresence of clear clusters of areas that were perceived
as providers of multiple values. From a societal per-spective, these zones or ‘hotspot areas’ are importantlocations where multiple interests overlap and willrequire higher levels of stakeholder involvement inprospective spatial management plans, particularly incases of conflicting values (e.g. ecological value versusfisheries). Additionally, from a managerial point ofview, the superimposition of these layers of informa-tion allows for the creation of multiple criteria mapswhich facilitate the identification of areas better suitedfor specific uses or management regulations. A similarmethodology was used in a land-based case study toidentify areas of agreement and disagreement instakeholder landscape values, and a system was devel-oped to rank potential land use for consistency with
247
a)
Number of cubes
1
2
b)
Number of cubes
c)
Number of cubes
15 30 60km
0
1–2
3–6
7–10
1–2
3–5
6–11
Fig. 4. Aggregated data for areas selected under different marine protected area (MPA) management regimes; (a) high level ofprotection, (b) medium level of protection, (c) low level of protection. Number of cubes refers to the cumulative number of cubes
placed on that particular cell by all participants (see ‘Materials and methods—Mapping of stakeholder values’ for details)
c)b)a)
Tourism
Fis
heries
Identity
Co
gnitiv
e
Ind
ustr
ial
0
10
20
30
40
50
% o
f valu
es in
sele
cte
d c
ells
First set Second set Third setAvera
ge n
o.
valu
es p
er
cell
2
4
6
8
10
12
14
Times selected for ecological value
0 2 4 6 8 10 12 14 16 18
Nu
mb
er
of
valu
es
0
2
4
6
8
10
12
Pearson = 0.98**
1st set 10 cells
2nd set 10 cells
3rd set 10 cells
Mean N ofecological values
Mean N of values
Fig. 5. (a) Solid circles represent the average number of times the cells selected in the first, second and third subtasks had been al-located ‘ecological value’; open circles indicate the average number of values associated with the cells selected in the first, secondand third subtasks. (b) Percentage of times the cells selected in the first, second and third subtasks had been allocated a particular‘value’. (c) Relationship between the number of times a cell had been selected due to its ‘ecological value’ and the total numberof different ‘values’ allocated to that same cell. See ‘Materials and methods—Mapping of stakeholder values’ for details
on the subtasks
Mar Ecol Prog Ser 434: 239–249, 2011248
stakeholder values (Brown 2004). Another example ofthe application of suitability maps can be found in theplanning process of a national forest in Canada, wherea suitability analysis method was developed to mapland scape values to determine the consistency of po -tential forest management strategies with community-held landscape values (Reed & Brown 2003).
Care has to be taken when interpreting the outcomesof this type of exercise, as location-specific valuations arestrongly influenced by the subjective judgement andpersonal views of respondents, which will depend on theunderstanding of the respondents’ definition of value,their experiences, familiarity with the area and their mapliteracy, among others (Zhu et al. 2010). Furtherlimitations of this type of analysis include the ambiguousplacement on the map of the cubes used in the exercise,where the area being mapped is actually smaller orbigger than the cube area used here, and the erroneousarrangement or incomplete placement of cubes by par-ticipants who are less familiar with the study area (Brown2004). In our study, a few of the participants stated thatthey were more knowledgeable about their surroundingarea of residence than about the rest of the study region.However, the comparison of the spatial distribution ofstakeholder values with ecosystem ser vices of knowndistribution (i.e. tourism, recreation, food and energyprovision) confirmed the validity of stakeholder percep-tions. Further evidence backing the sound ness of stake-holder views comes from other studies which have previ-ously confirmed the agreement be tween values and theassessment of geographic features (Brown 2004), con-servation prio rities (Raymond & Brown 2006) and mea-sures of ecological richness (Alessa et al. 2008).
Location and management of MPAs
The vast majority of stakeholders’ representativeswas not in favour of the establishment of MPAs whichwould completely exclude anthropogenic activities fromwithin their boundaries. Conversely, most participantssupported the implementation of MPAs with low levelsof restriction where most activities would be allowedbut would be adequately regulated. However, it islikely that a higher number of more restrictive areaswould have been chosen during the exercise if themethod of area selection had allowed for the selectionof smaller areas, as it was mentioned by participantsthat the methodology used in the study forced themto choose highly protected MPAs of a minimum sizepatch of 100 km2 which they thought would signifi-cantly impact certain sectors of society. In future stud-ies it may be advisable to adopt a different approachwhich enables participants to delineate their selectedareas more accurately.
The selection frequency map for the location of MPAsprovides an extra layer of information to managers anddecision-makers in terms of which areas stakeholdersconsider should be protected. It is un questionablethat for MPAs to be successful in achieving their con -servation goals, they must be designed with biologicalprinciples as primary design criteria (Roberts et al. 2003).However, information derived from the distribution ofvalues and stakeholder views on the preferred locationof MPAs could provide practical input in cases wheredecisions have to be made between 2 or more eco -logically important sites. Here, stakeholder informa tioncould help discern which site would be less controversialto protect from a societal point of view. Addi tionally, it hasbeen suggested that the involvement of stake holders inmanagement plans is likely to increase the quality anddurability of en vironmental decisions (Beierle 2002,Reed 2008), as well as increasing the likelihood that decisions are perceived to be more holistic and fairer, asthey ac count for a wide range of different values andneeds (Richards et al. 2004).
In Wales, the Welsh Assembly Government is cur-rently identifying and designating a network of marineconservation zones (MCZs), taking into account social,economic and ecological criteria. Whilst some areas ofthe MCZs will have management regimes that will bedirected towards the maintenance of conservation sta-tus by allowing existing activities to continue if they donot cause site conditions to deteriorate, other areaswill be designated as Highly Restricted MCZs, whichwill include a general presumption against fishing ofall kinds, all constructive, destructive and disturbingactivities. Therefore, the methodology and informationprovided in this study can contribute towards the iden-tification of areas better suited for particular manage-ment regimes from a social perspective.
Graphical representations of values, including maps,can have a powerful influence in decision-making;thus care is needed to ensure that their use reflects thequality of information they represent. We investigatedthe values of different stakeholder groups throughinterviews with 2 representatives of each group. Al -though the resulting maps appear to be sensible, werecommend that future studies include higher num-bers of people in the interviews to allow the investiga-tion of variations in opinion within and between thedifferent groups. Furthermore, attention has to be paidto the potential disproportional representation of inter-est sectors, in which case weightings might need to beapplied to the final valuation maps.
Although some concerns have been raised regardingthe quality of stakeholder-based environmental deci-sions, a review carried out in 2002 on the effects ofstakeholder participation on the quality of environmen-tal decisions determined that there is evidence that
Ruiz-Frau et al.: Stakeholder values in coastal zone management
stakeholders contribute with new information and ideasto the decision process (Beierle 2002). Therefore, stake-holder participation can enhance the quality of environ-mental decisions by considering more comprehensiveinformation inputs. Similar conclusions can be drawnfrom our study, as the results indicate that participantstended to protect ecologically important areas while atthe same time avoiding areas where restrictions couldhave an impact on society, such as important areas forindustrial activities. This suggests that stakeholders triedto balance conservation needs with social demands.
In this study, we adapted a methodology previouslyused on terrestrial environments to map stakeholders’values of the marine environment. The mapping exer-cise provided key information on the distribution ofstakeholder values and the preferred distribution ofMPAs in Wales. The outcomes of this study will facili-tate the integration of social values with environmentaland economic data to provide a more comprehensiveunderstanding of the complexities and dynamics ofsocio-ecological systems. Although this study focuseson the Welsh coast, the approach used here to mapstakeholder values could be used in coastal systemselsewhere to provide practical data to inform success-ful marine spatial planning which takes into accountsocial, ecological and economic factors.
Acknowledgements. We thank all respondents for their par-ticipation and help. We also thank H. Hinz and 2 anonymousreviewers for useful comments and suggestions. This workforms part of a PhD studentship funded jointly by the Eco-nomic and Social Research Council and the Natural Environ-ment Research Council of the United Kingdom (grant numberES/F009801/01).
LITERATURE CITED
Alessa L, Kliskey A, Brown G (2008) Social-ecological hot -spots mapping: a spatial approach for identifying coupledsocial-ecological space. Landsc Urban Plann 85:27–39
Alvarez-Farizo B, Hanley N (2006) Improving the processof valuing non-market benefits: combining citizens’ jurieswith choice modelling. Land Econ 82:465–478
Beaumont NJ, Austen MC, Atkins JP, Burdon D and others(2007) Identification, definition and quantification ofgoods and services provided by marine biodiversity: impli-cations for the ecosystem approach. Mar Pollut Bull 54:253–265
Beierle TC (2002) The quality of stakeholder-based decisions.Risk Anal 22:739–749
Brown G (2004) Mapping spatial attributes in survey researchfor natural resource management: methods and applica-tions. Soc Nat Resour 18:17–39
Brown G, Reed P (2000) Validation of a forest values typologyfor use in national forest planning. For Sci 46:240–247
Bryan BA, Raymond CM, Crossman ND, Macdonald DH(2010) Targeting the management of ecosystem servicesbased on social values: where, what, and how? LandscUrban Plann 97:111–122
CBD (Convention on Biological Diversity) (2008) Conference
of the parties to the Convention on Biological Diversity(COP9), decision IX/20: Marine and coastal biodiversity.Available at www.cbd.int/decision/cop/?id=11663
Cowling RM, Egoh B, Knight AT, O’Farrell PJ and others(2008) An operational model for mainstreaming ecosystemservices for implementation. Proc Natl Acad Sci USA 105:9483–9488
DEFRA (Department for Environment and Rural Affairs) (2009)Marine and coastal access act 2009. Department for Environment and Rural Affairs. Available at www.legislation.gov.uk/ukpga/2009/23/pdfs/ukpga_20090023_en.pdf (accessed November 2010)
Gilpin A (2000) Environmental economics: a critical overview.John Wiley & Sons, Chichester
McIntyre N, Moore J, Yuan M (2008) A place-based, values-centered approach to managing recreation on Canadiancrown lands. Soc Nat Resour 21:657–670
MEA (Millennium Ecosystem Assessment) (2005) Ecosystemsand human well-being: a Framework Working Group forAssessment report of the Millennium Ecosystem Assess-ment. Island Press, Washington, DC
Mitchell A (2005) The ESRI guide to GIS analysis. Vol 2: spa-tial measurements and statistics. ESRI Press, Redlands, CA
Moore J, Balmford A, Allnutt T, Burgess N (2004) Integratingcosts into conservation planning across Africa. Biol Con-serv 117:343–350
Naidoo R, Balmford A, Costanza R, Fisher B and others (2008)Global mapping of ecosystem services and conservationpriorities. Proc Natl Acad Sci USA 105:9495–9500
OSPAR Commission (2003) OSPAR Recommendation 2003/3on a network of marine protected areas. Available at www.ospar.org/documents/DBASE/DECRECS/Recommendations/or03-03e.doc
Raymond C, Brown G (2006) A method for assessing pro-tected area allocations using a typology of landscape val-ues. J Environ Plann Manag 49:797–812
Raymond CM, Bryan BA, MacDonald DH, Cast A, StrathearnS, Grandgirard A, Kalivas T (2009) Mapping communityvalues for natural capital and ecosystem services. EcolEcon 68:1301–1315
Reed MS (2008) Stakeholder participation for environmen-tal management: a literature review. Biol Conserv 141:2417–2431
Reed P, Brown G (2003) Values suitability analysis: a method-ology for identifying and integrating public perceptionsof forest ecosystem values in national forest planning.J Environ Plann Manage 46:643–658
Richards C, Blackstock KL, Carter CE (2004) Practicalapproaches to participation. Socio-Economic ResearchGroup (SERG) Policy Brief No. 1. Macaulay Land UseResearch Institute, Aberdeen
Roberts CM, Andelman S, Branch G, Bustamante RH and others (2003) Ecological criteria for evaluating candidatesites for marine reserves. Ecol Appl 13:199–214
Tyrvainen L, Makinen K, Schipperijn J (2007) Tools for map-ping social values of urban woodlands and other greenareas. Landsc Urban Plann 79:5–19
UN (United Nations) (2002) Report of the world summit onsustainable development, Johannesburg, South Africa, 26August – 4 September 2002. United Nations, New York, NY.Available at http://daccess-dds-ny.un.org/doc/ UNDOC/GEN/N02/636/93/PDF/N0263693.pdf?OpenElement (ac -cessed November 2010)
Zhu X, Pfueller S, Whitelaw P, Winter C (2010) Spatial differ-entiation of landscape values in the Murray River region ofVictoria, Australia. Environ Manag 45:896–911
Zube EH (1987) Perceived land use patterns and landscapevalues. Landscape Ecol 1:37–46
249
Submitted: November 9, 2010; Accepted: March 18, 2011 Proofs received from author(s): July 5, 2011