Embed Size (px)
Citation preview
A Low Cost Producer with Strong Cash Flow and Exciting
Growth Potential
TSX:SMT | BVL:SMT | sierrametals.com September 2015
Disclaimer
Certain statements in this presentation constitute forward-looking information within the meaning of Canadian securities legislation. Forward-looking informationrelates to future events or the anticipated performance of Sierra and reflect management's expectations or beliefs regarding such future events and anticipatedperformance based on an assumed set of economic conditions and courses of action. In certain cases, statements that contain forward-looking information can beidentified by the use of words such as "plans", "expects", "is expected", "budget", "scheduled", "estimates", "forecasts", "intends", "anticipates", "believes" orvariations of such words and phrases or statements that certain actions, events or results "may", "could", "would", "might", or "will be taken", "occur" or "be achieved"or the negative of these words or comparable terminology. By its very nature forward-looking information involves known and unknown risks, uncertainties and otherfactors that may cause actual performance of Sierra to be materially different from any anticipated performance expressed or implied by such forward-lookinginformation. These include estimates of future production levels; expectations regarding mine production costs; expected trends in mineral prices; changes in generaleconomic conditions and financial markets; changes in prices for silver and other metals; technological and operational hazards in Sierra's mining and minedevelopment activities; risks inherent in mineral exploration; uncertainties inherent in the estimation of mineral reserves, mineral resources, and metal recoveries; thetiming and availability of financing; governmental and other approvals; political unrest or instability in countries where Sierra is active; labor relations and other riskfactors disclosed in Sierra's Annual Information Form, which is available on SEDAR at www.sedar.com.
Although Sierra has attempted to identify important factors that could cause actual performance to differ materially from that described in forward-lookinginformation, there may be other factors that cause its performance not to be as anticipated. Sierra neither intends nor assumes any obligation to update thesestatements containing forward-looking information to reflect changes in assumptions or circumstances other than as required by applicable law. There can be noassurance that forward-looking information will prove to be accurate as actual results and future events could differ materially from those currently anticipated.Accordingly, readers should not place undue reliance on forward-looking information.
This presentation uses the terms "measured resources", "indicated resources" and "inferred resources" as such terms are recognized under National Instrument 43-101 - Standards of Disclosure for Mineral Projects ("NI 43-101") adopted by the Canadian Securities Administrators. Readers are cautioned not to assume that any partor all of the mineral deposits in these categories will ever be converted into reserves. In addition, "inferred resources" have a great amount of uncertainty as to theirexistence and economic and legal feasibility. It cannot be assumed that all or any part of an inferred mineral resource will ever be upgraded to a higher category.Under Canadian securities rules, estimates of inferred mineral resources may not form the basis of feasibility or pre-feasibility studies, or economic studies, except for a"preliminary assessment" as defined under NI 43-101. Investors are cautioned not to assume that part or all of an inferred resource exists, or is economically or legallymineable.
Gordon Babcock BSc P. Eng., Chief Operating Officer, Sierra Metals is the qualified person as defined in NI 43-101 relating to operational scientific and technicalinformation of Sierra Metals which have been included in this presentation.
Matthew Wunder, B.Sc., P.Geo., is the "Qualified Person" as defined in NI 43-101 and Vice President, Exploration for Sierra Metals supervised the preparation of thegeoscientific and mineral exploration related information of Sierra Metals included in this presentation.
TSX:SMT | BVL:SMT 2
Investment HighlightsA Base and Precious Metal Growth Story
TSX:SMT | BVL:SMT 3
1 As at June 30, 2015 per financial statements filed on SEDAR.
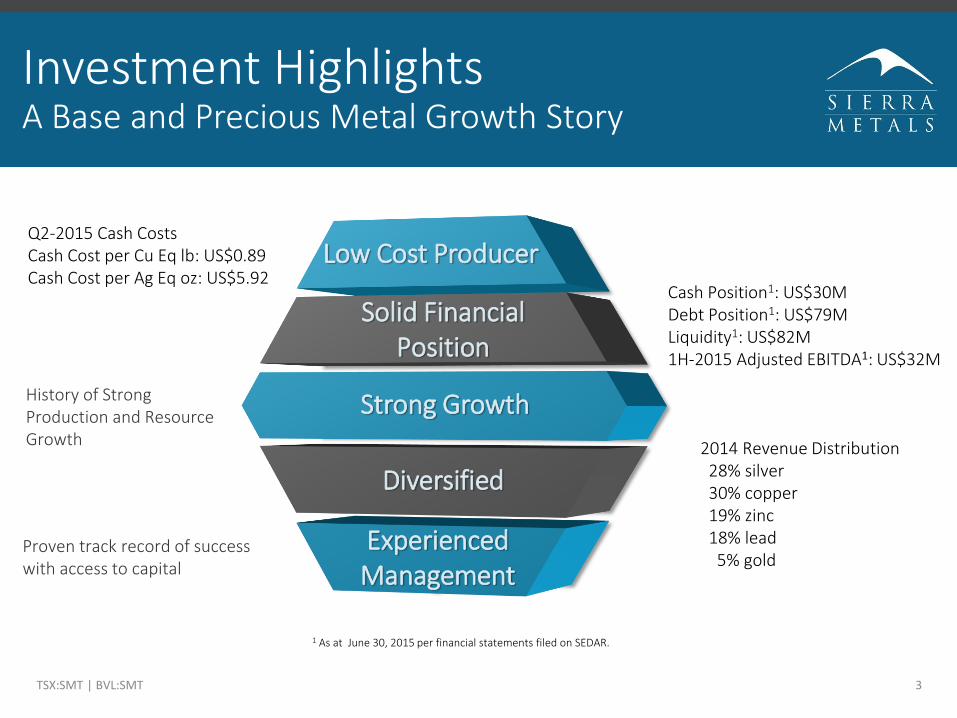
Cash Position1: US$30MDebt Position1: US$79MLiquidity1: US$82M1H-2015 Adjusted EBITDA1: US$32M
2014 Revenue Distribution28% silver30% copper19% zinc18% lead5% gold
Q2-2015 Cash Costs Cash Cost per Cu Eq lb: US$0.89Cash Cost per Ag Eq oz: US$5.92
History of Strong Production and Resource Growth
Experienced Management
Diversified
Low Cost Producer
Strong Growth
Solid Financial Position
Proven track record of success with access to capital
1 As of August 12, 20152 As of September 08, 2015
Capital Structure
TSX:SMT | BVL:SMT 4
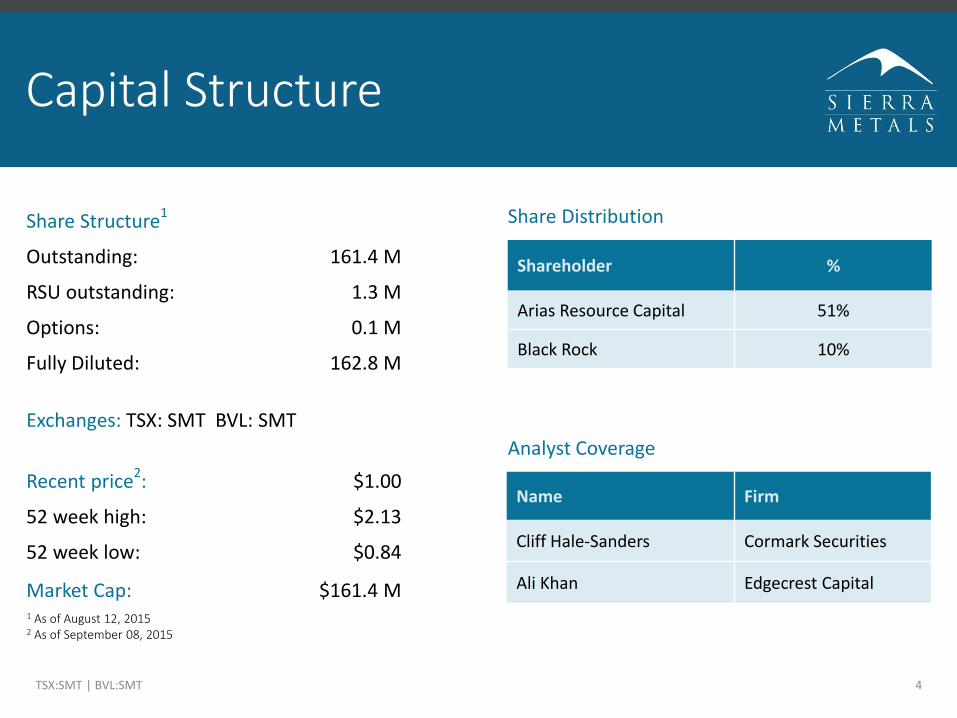
Share Structure1
Outstanding: 161.4 M
RSU outstanding: 1.3 M
Options: 0.1 M
Fully Diluted: 162.8 M
Exchanges: TSX: SMT BVL: SMT
Recent price2: $1.00
52 week high: $2.13
52 week low: $0.84
Market Cap: $161.4 M
Share Distribution
Shareholder %
Arias Resource Capital 51%
Black Rock 10%
Analyst Coverage
Name Firm
Cliff Hale-Sanders Cormark Securities
Ali Khan Edgecrest Capital
Experienced Management Team
5
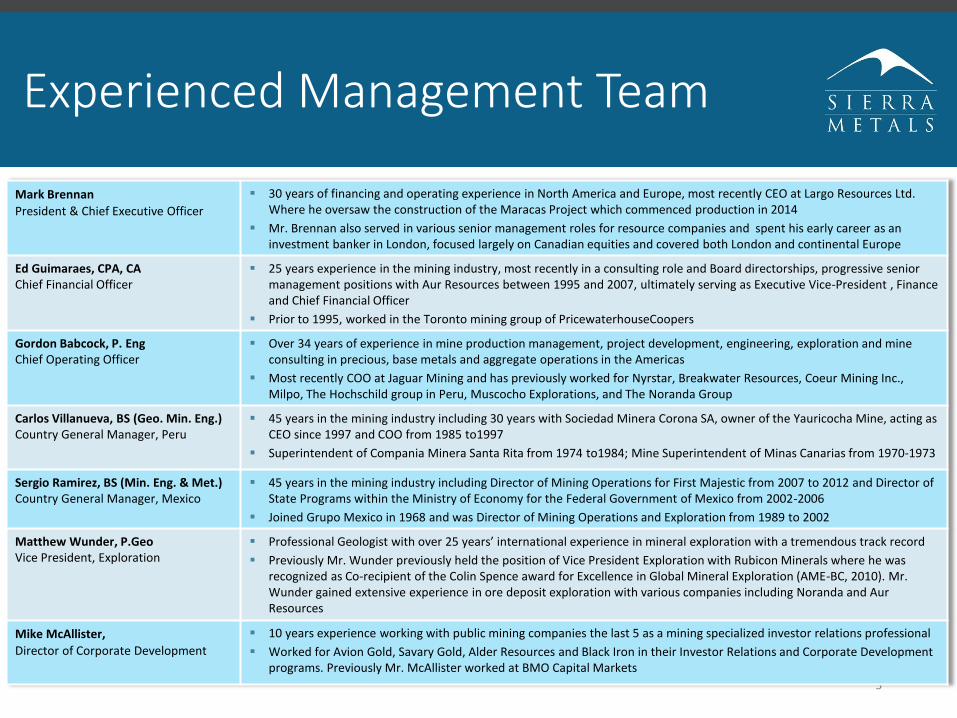
Mark Brennan
President & Chief Executive Officer
30 years of financing and operating experience in North America and Europe, most recently CEO at Largo Resources Ltd. Where he oversaw the construction of the Maracas Project which commenced production in 2014
Mr. Brennan also served in various senior management roles for resource companies and spent his early career as an investment banker in London, focused largely on Canadian equities and covered both London and continental Europe
Ed Guimaraes, CPA, CAChief Financial Officer
25 years experience in the mining industry, most recently in a consulting role and Board directorships, progressive senior management positions with Aur Resources between 1995 and 2007, ultimately serving as Executive Vice-President , Finance and Chief Financial Officer
Prior to 1995, worked in the Toronto mining group of PricewaterhouseCoopers
Gordon Babcock, P. EngChief Operating Officer
Over 34 years of experience in mine production management, project development, engineering, exploration and mine consulting in precious, base metals and aggregate operations in the Americas
Most recently COO at Jaguar Mining and has previously worked for Nyrstar, Breakwater Resources, Coeur Mining Inc., Milpo, The Hochschild group in Peru, Muscocho Explorations, and The Noranda Group
Carlos Villanueva, BS (Geo. Min. Eng.)Country General Manager, Peru
45 years in the mining industry including 30 years with Sociedad Minera Corona SA, owner of the Yauricocha Mine, acting as CEO since 1997 and COO from 1985 to1997
Superintendent of Compania Minera Santa Rita from 1974 to1984; Mine Superintendent of Minas Canarias from 1970-1973
Sergio Ramirez, BS (Min. Eng. & Met.) Country General Manager, Mexico
45 years in the mining industry including Director of Mining Operations for First Majestic from 2007 to 2012 and Director of State Programs within the Ministry of Economy for the Federal Government of Mexico from 2002-2006
Joined Grupo Mexico in 1968 and was Director of Mining Operations and Exploration from 1989 to 2002
Matthew Wunder, P.GeoVice President, Exploration
Professional Geologist with over 25 years’ international experience in mineral exploration with a tremendous track record
Previously Mr. Wunder previously held the position of Vice President Exploration with Rubicon Minerals where he was recognized as Co-recipient of the Colin Spence award for Excellence in Global Mineral Exploration (AME-BC, 2010). Mr. Wunder gained extensive experience in ore deposit exploration with various companies including Noranda and AurResources
Mike McAllister,
Director of Corporate Development
10 years experience working with public mining companies the last 5 as a mining specialized investor relations professional
Worked for Avion Gold, Savary Gold, Alder Resources and Black Iron in their Investor Relations and Corporate Development programs. Previously Mr. McAllister worked at BMO Capital Markets
Diversified: 3 Projects in 2 Countries
TSX:SMT | BVL:SMT 6
23
1
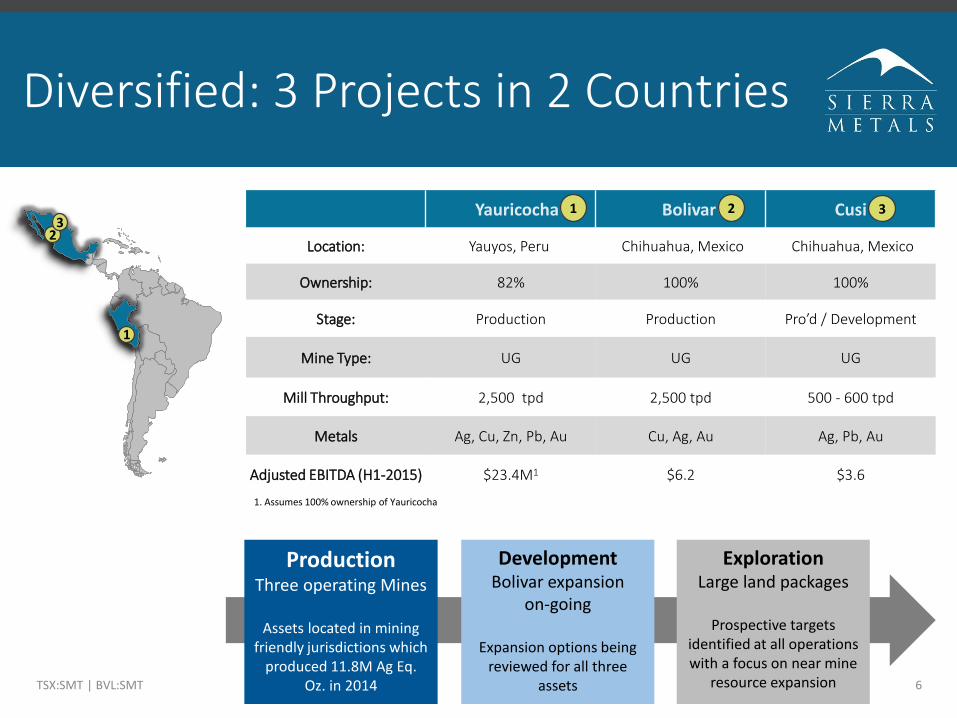
Yauricocha Bolivar Cusi
Location: Yauyos, Peru Chihuahua, Mexico Chihuahua, Mexico
Ownership: 82% 100% 100%
Stage: Production Production Pro’d / Development
Mine Type: UG UG UG
Mill Throughput: 2,500 tpd 2,500 tpd 500 - 600 tpd
Metals Ag, Cu, Zn, Pb, Au Cu, Ag, Au Ag, Pb, Au
Adjusted EBITDA (H1-2015) $23.4M1 $6.2 $3.6
1 2 3
ProductionThree operating Mines
Assets located in mining friendly jurisdictions which
produced 11.8M Ag Eq. Oz. in 2014
DevelopmentBolivar expansion
on-going
Expansion options being reviewed for all three
assets
ExplorationLarge land packages
Prospective targets identified at all operations with a focus on near mine
resource expansion
1. Assumes 100% ownership of Yauricocha
Low Cost Producer
TSX:SMT | BVL:SMT 7
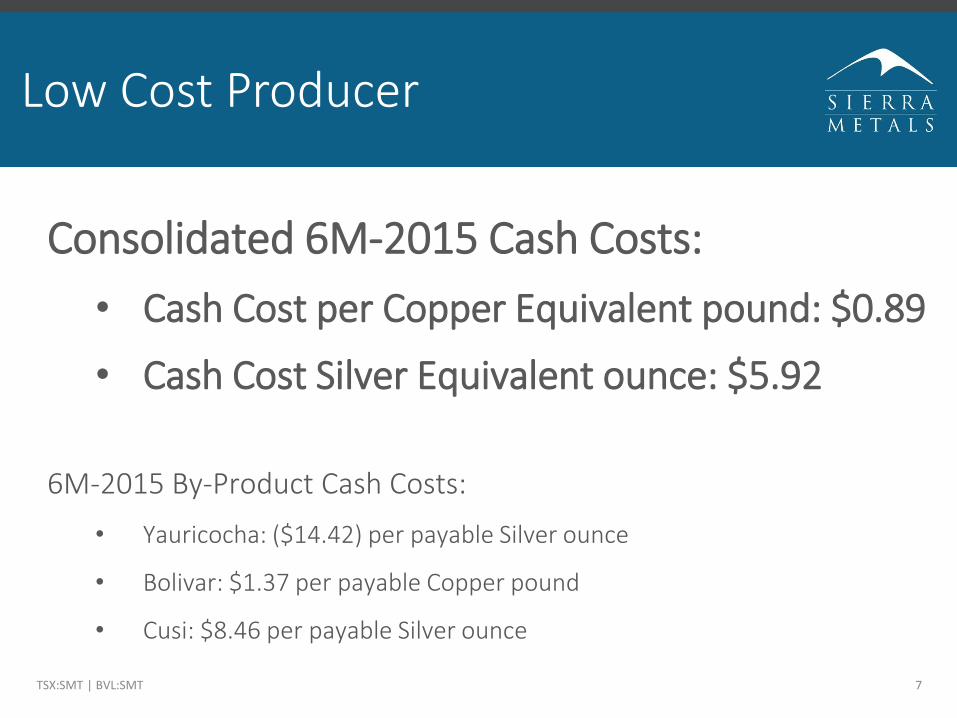
Consolidated 6M-2015 Cash Costs:
• Cash Cost per Copper Equivalent pound: $0.89
• Cash Cost Silver Equivalent ounce: $5.92
6M-2015 By-Product Cash Costs:
• Yauricocha: ($14.42) per payable Silver ounce
• Bolivar: $1.37 per payable Copper pound
• Cusi: $8.46 per payable Silver ounce
Strong Earnings
TSX:SMT | BVL:SMT 8
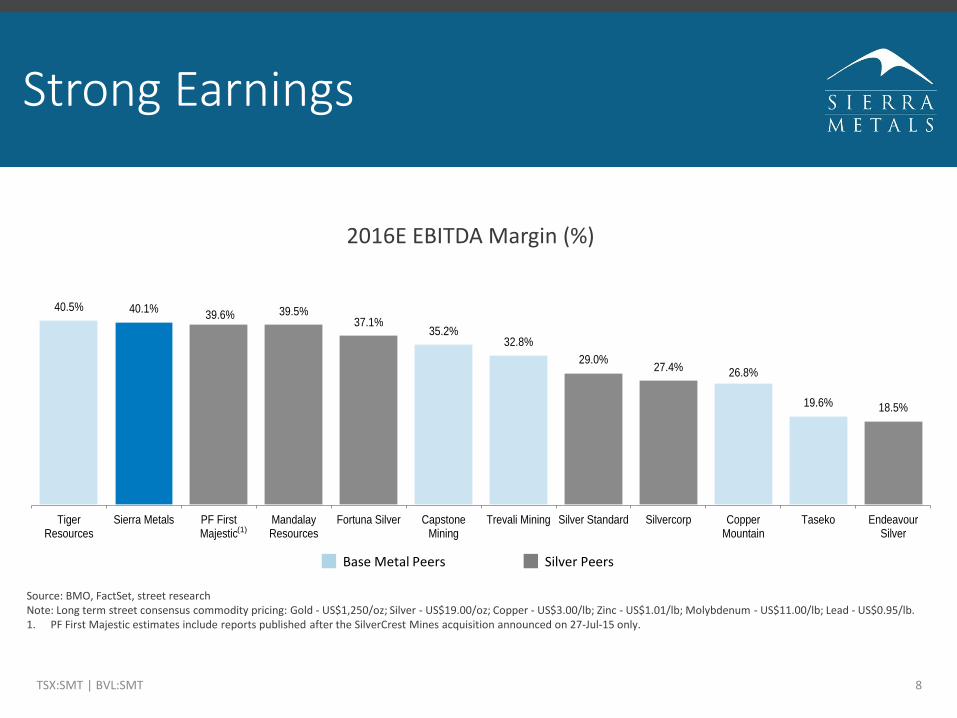
40.5% 40.1% 39.6% 39.5%
37.1% 35.2%
32.8%
29.0% 27.4% 26.8%
19.6% 18.5%
TigerResources
Sierra Metals PF FirstMajestic
MandalayResources
Fortuna Silver CapstoneMining
Trevali Mining Silver Standard Silvercorp CopperMountain
Taseko EndeavourSilver
Base Metals Silver
Source: BMO, FactSet, street researchNote: Long term street consensus commodity pricing: Gold - US$1,250/oz; Silver - US$19.00/oz; Copper - US$3.00/lb; Zinc - US$1.01/lb; Molybdenum - US$11.00/lb; Lead - US$0.95/lb. 1. PF First Majestic estimates include reports published after the SilverCrest Mines acquisition announced on 27-Jul-15 only.
(1)
2016E EBITDA Margin (%)
Base Metal Peers Silver Peers
Solid Financial Position
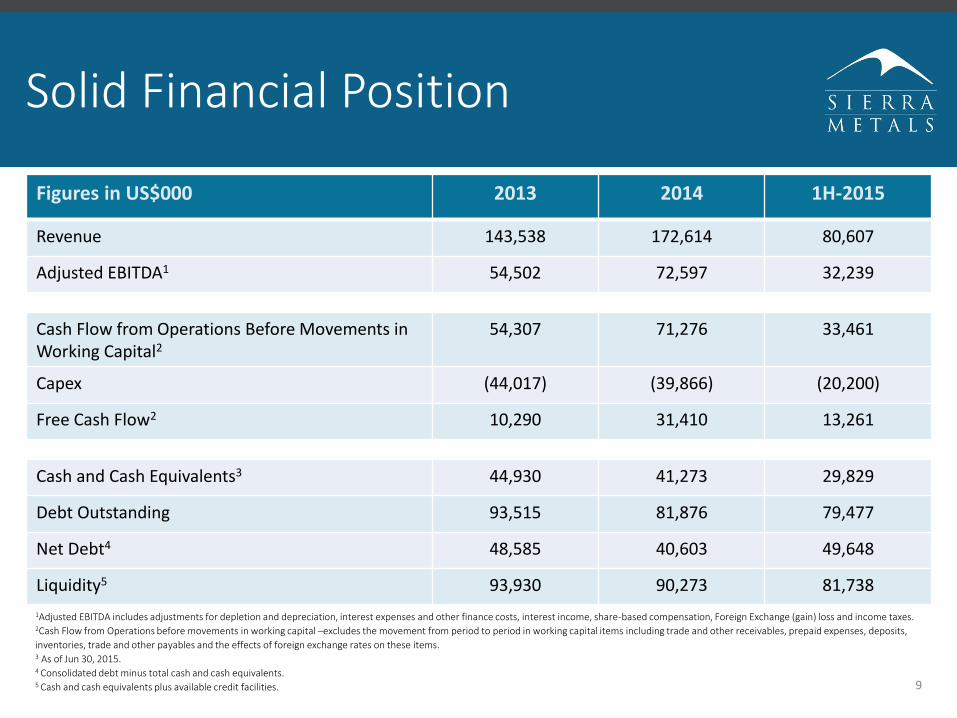
Figures in US$000 2013 2014 1H-2015
Revenue 143,538 172,614 80,607
Adjusted EBITDA1 54,502 72,597 32,239
Cash Flow from Operations Before Movements in Working Capital2
54,307 71,276 33,461
Capex (44,017) (39,866) (20,200)
Free Cash Flow2 10,290 31,410 13,261
Cash and Cash Equivalents3 44,930 41,273 29,829
Debt Outstanding 93,515 81,876 79,477
Net Debt4 48,585 40,603 49,648
Liquidity5 93,930 90,273 81,738
9
1Adjusted EBITDA includes adjustments for depletion and depreciation, interest expenses and other finance costs, interest income, share-based compensation, Foreign Exchange (gain) loss and income taxes.2Cash Flow from Operations before movements in working capital –excludes the movement from period to period in working capital items including trade and other receivables, prepaid expenses, deposits,
inventories, trade and other payables and the effects of foreign exchange rates on these items.3 As of Jun 30, 2015.4 Consolidated debt minus total cash and cash equivalents.5 Cash and cash equivalents plus available credit facilities.
H1 2015 Cash Flow
TSX:SMT | BVL:SMT 10
Consistent Yearly Production Growth
TSX:SMT | BVL:SMT 11
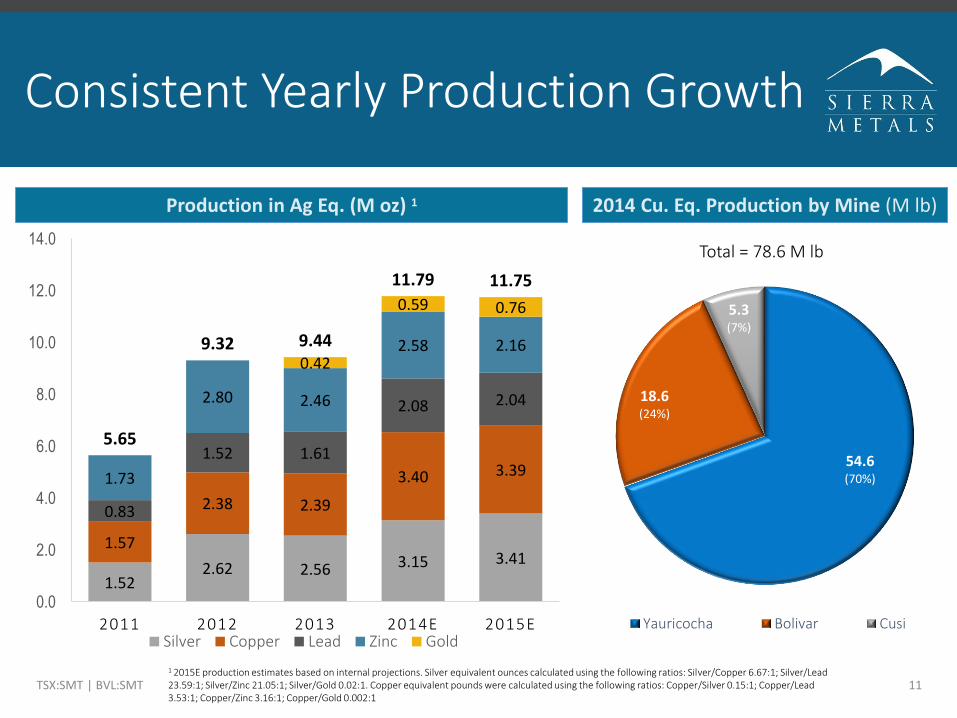
Production in Ag Eq. (M oz) 1
1 2015E production estimates based on internal projections. Silver equivalent ounces calculated using the following ratios: Silver/Copper 6.67:1; Silver/Lead 23.59:1; Silver/Zinc 21.05:1; Silver/Gold 0.02:1. Copper equivalent pounds were calculated using the following ratios: Copper/Silver 0.15:1; Copper/Lead 3.53:1; Copper/Zinc 3.16:1; Copper/Gold 0.002:1
54.6(70%)
18.6(24%)
5.3(7%)
Yauricocha Bolivar Cusi
Total = 78.6 M lb
1.522.62 2.56 3.15 3.41
1.57
2.38 2.39
3.40 3.39
0.83
1.52 1.61
2.08 2.04
1.73
2.80 2.46
2.58 2.160.42
0.59 0.76
5.65
9.32 9.44
11.79 11.75
0.0
2.0
4.0
6.0
8.0
10.0
12.0
14.0
2011 2012 2013 2014E 2015ESilver Copper Lead Zinc Gold
2014 Cu. Eq. Production by Mine (M lb)
2015 Production vs Guidance
TSX:SMT | BVL:SMT 12
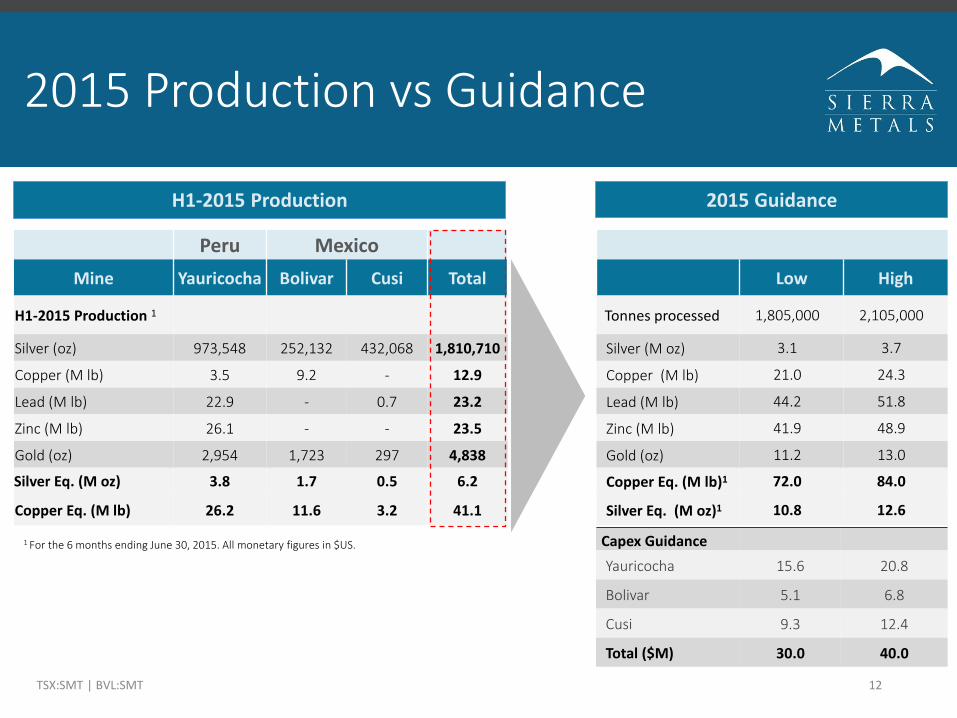
H1-2015 Production
1 For the 6 months ending June 30, 2015. All monetary figures in $US.
Peru Mexico
Mine Yauricocha Bolivar Cusi Total Low High
H1-2015 Production 1 Tonnes processed 1,805,000 2,105,000
Silver (oz) 973,548 252,132 432,068 1,810,710 Silver (M oz) 3.1 3.7
Copper (M lb) 3.5 9.2 - 12.9 Copper (M lb) 21.0 24.3
Lead (M lb) 22.9 - 0.7 23.2 Lead (M lb) 44.2 51.8
Zinc (M lb) 26.1 - - 23.5 Zinc (M lb) 41.9 48.9
Gold (oz) 2,954 1,723 297 4,838 Gold (oz) 11.2 13.0
Silver Eq. (M oz) 3.8 1.7 0.5 6.2 Copper Eq. (M lb)1 72.0 84.0
Copper Eq. (M lb) 26.2 11.6 3.2 41.1 Silver Eq. (M oz)1 10.8 12.6
Capex Guidance
Yauricocha 15.6 20.8
Bolivar 5.1 6.8
Cusi 9.3 12.4
Total ($M) 30.0 40.0
2015 Guidance
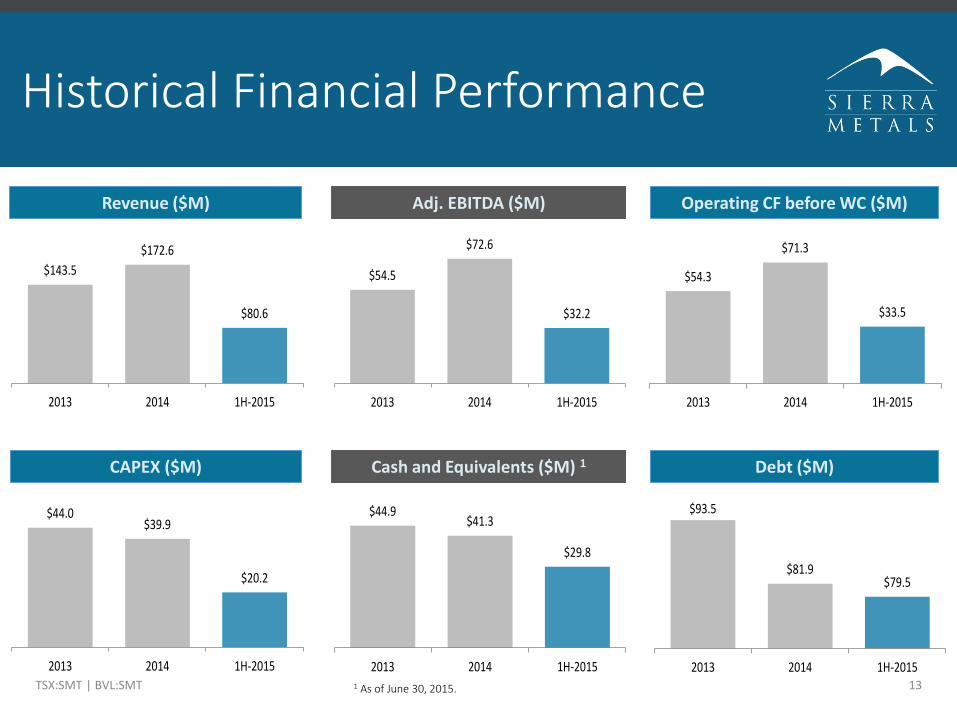
Historical Financial Performance
TSX:SMT | BVL:SMT 131 As of June 30, 2015.
Revenue ($M) Adj. EBITDA ($M) Operating CF before WC ($M)
$143.5
$172.6
$80.6
2013 2014 1H-2015
$54.5
$72.6
$32.2
2013 2014 1H-2015
$54.3
$71.3
$33.5
2013 2014 1H-2015
CAPEX ($M) Cash and Equivalents ($M) 1 Debt ($M)
$44.0$39.9
$20.2
2013 2014 1H-2015
$44.9$41.3
$29.8
2013 2014 1H-2015
$93.5
$81.9$79.5
2013 2014 1H-2015
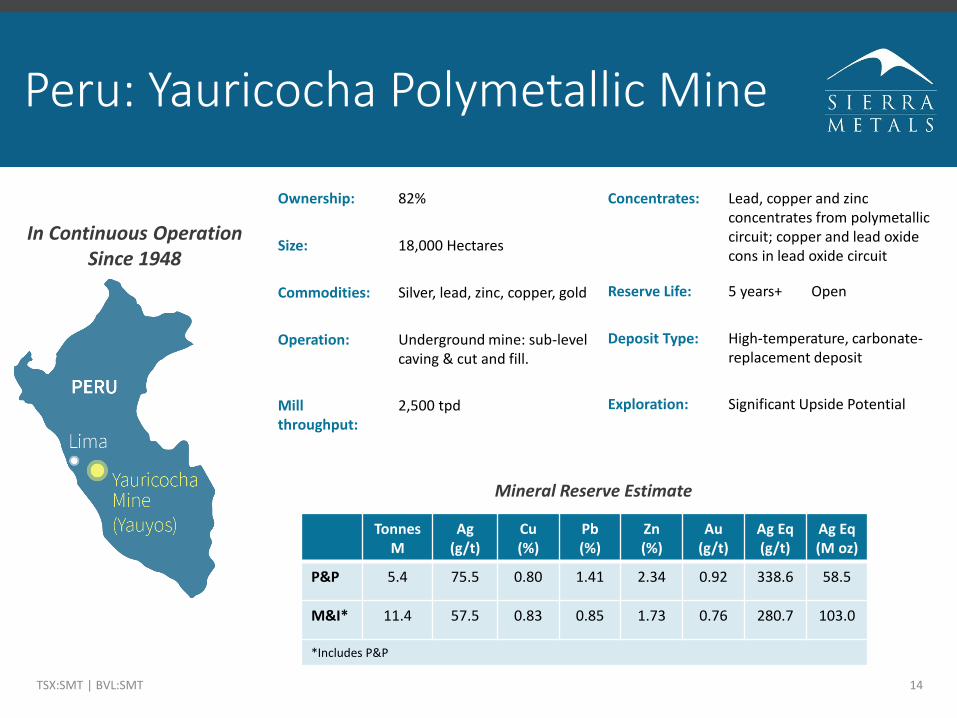
Peru: Yauricocha Polymetallic Mine
TSX:SMT | BVL:SMT 14
Ownership: 82%
Size: 18,000 Hectares
Commodities: Silver, lead, zinc, copper, gold
Operation: Underground mine: sub-level caving & cut and fill.
Mill throughput:
2,500 tpd
In Continuous Operation Since 1948
Tonnes M
Ag(g/t)
Cu (%)
Pb(%)
Zn(%)
Au(g/t)
Ag Eq(g/t)
Ag Eq(M oz)
P&P 5.4 75.5 0.80 1.41 2.34 0.92 338.6 58.5
M&I* 11.4 57.5 0.83 0.85 1.73 0.76 280.7 103.0
*Includes P&P
Mineral Reserve Estimate
Concentrates: Lead, copper and zinc concentrates from polymetallic circuit; copper and lead oxide cons in lead oxide circuit
Reserve Life: 5 years+ Open
Deposit Type: High-temperature, carbonate-replacement deposit
Exploration: Significant Upside Potential
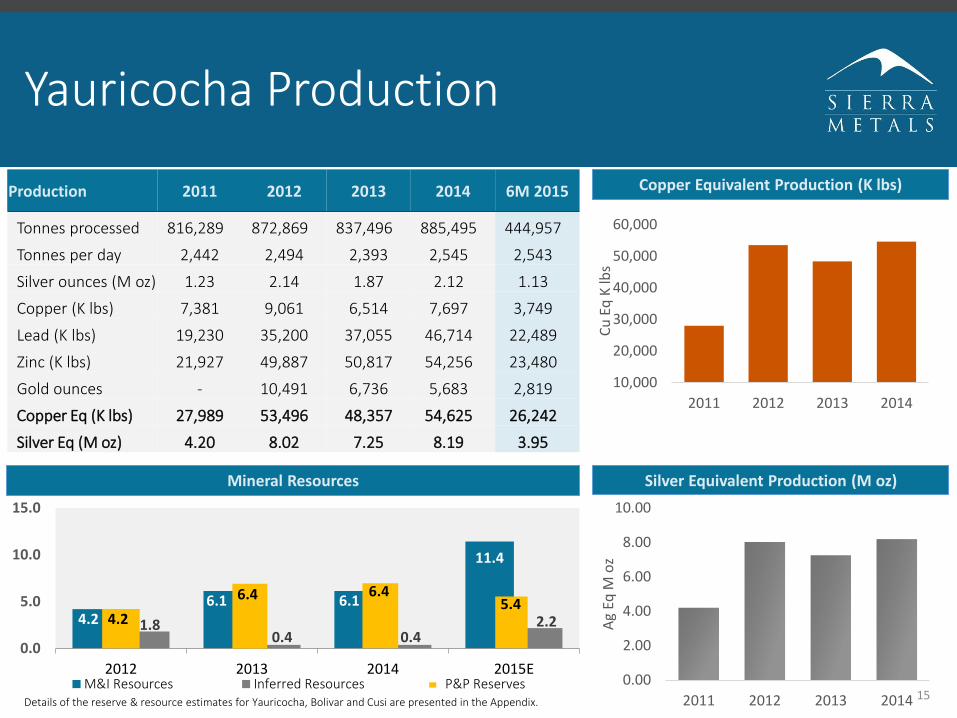
Yauricocha Production
150.00
2.00
4.00
6.00
8.00
10.00
2011 2012 2013 2014
Ag
EqM
oz
Silver Equivalent Production (M oz)Mineral Resources
Copper Equivalent Production (K lbs)
10,000
20,000
30,000
40,000
50,000
60,000
2011 2012 2013 2014
Cu
Eq
K lb
s
Production 2011 2012 2013 2014 6M 2015
Tonnes processed 816,289 872,869 837,496 885,495 444,957
Tonnes per day 2,442 2,494 2,393 2,545 2,543
Silver ounces (M oz) 1.23 2.14 1.87 2.12 1.13
Copper (K lbs) 7,381 9,061 6,514 7,697 3,749
Lead (K lbs) 19,230 35,200 37,055 46,714 22,489
Zinc (K lbs) 21,927 49,887 50,817 54,256 23,480
Gold ounces - 10,491 6,736 5,683 2,819
Copper Eq (K lbs) 27,989 53,496 48,357 54,625 26,242
Silver Eq (M oz) 4.20 8.02 7.25 8.19 3.95
Details of the reserve & resource estimates for Yauricocha, Bolivar and Cusi are presented in the Appendix.
4.26.1 6.1
11.4
1.80.4 0.4
2.2
0.0
5.0
10.0
15.0
2012 2013 2014 2015EM&I Resources Inferred Resources P&P Reserves
4.2
6.4 6.45.4
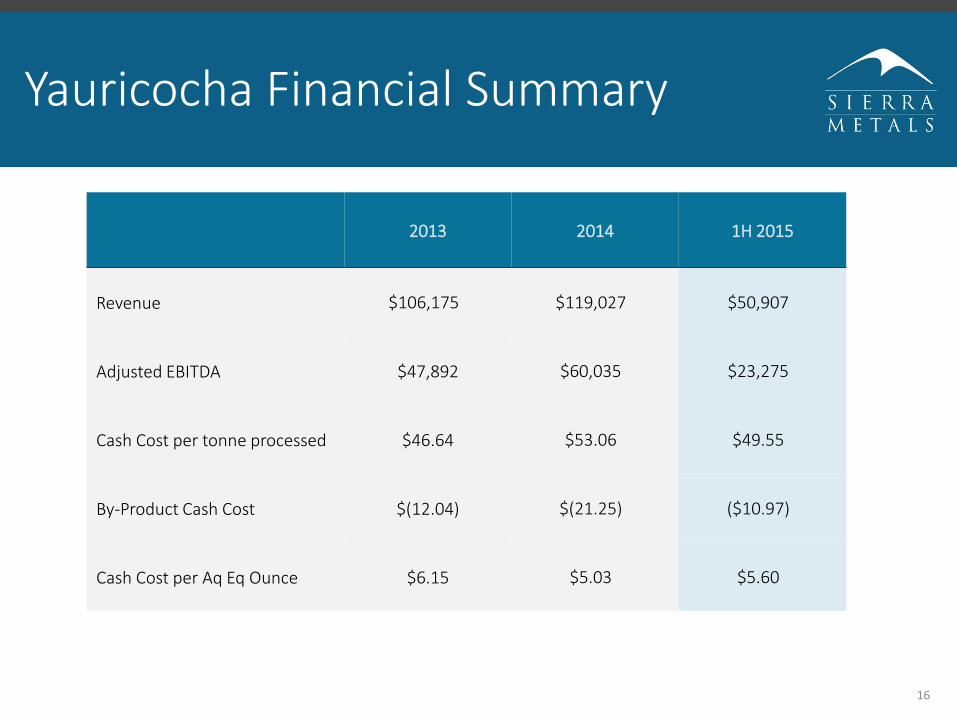
Yauricocha Financial Summary
16
2013 2014 1H 2015
Revenue $106,175 $119,027 $50,907
Adjusted EBITDA $47,892 $60,035 $23,275
Cash Cost per tonne processed $46.64 $53.06 $49.55
By-Product Cash Cost $(12.04) $(21.25) ($10.97)
Cash Cost per Aq Eq Ounce $6.15 $5.03 $5.60
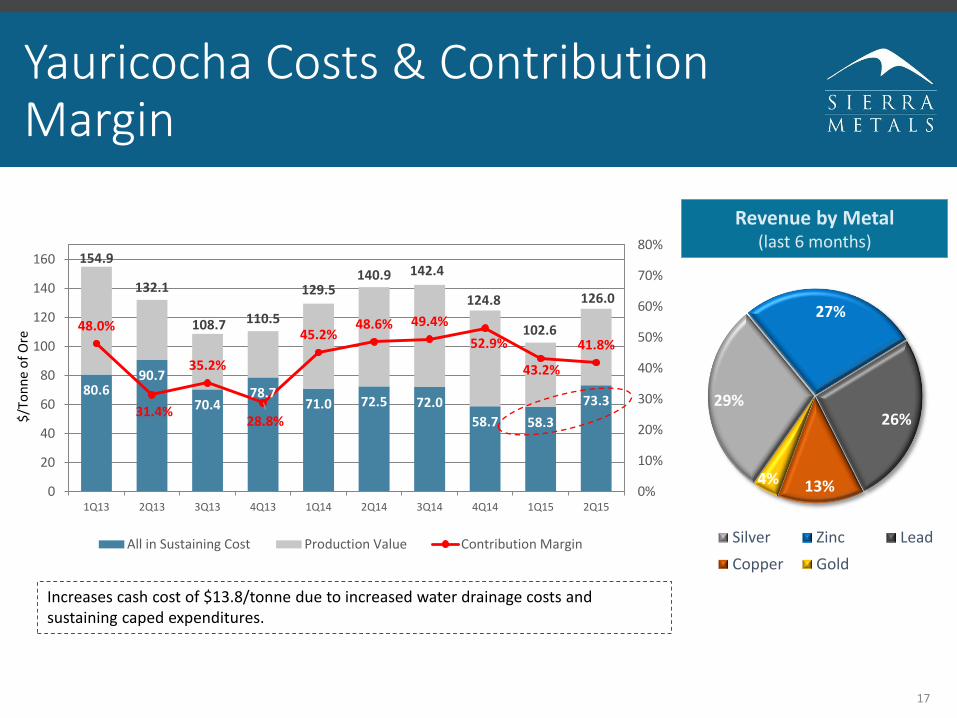
Yauricocha Costs & Contribution Margin
29%
27%
26%
13%4%
Silver Zinc Lead
Copper Gold
17
Revenue by Metal(last 6 months)
Increases cash cost of $13.8/tonne due to increased water drainage costs and sustaining caped expenditures.
80.690.7
70.478.7
71.0 72.5 72.0
58.7 58.3
73.3
154.9
132.1
108.7 110.5
129.5140.9 142.4
124.8
102.6
126.0
48.0%
31.4%
35.2%
28.8%
45.2%48.6% 49.4%
52.9%
43.2%
41.8%
0%
10%
20%
30%
40%
50%
60%
70%
80%
0
20
40
60
80
100
120
140
160
1Q13 2Q13 3Q13 4Q13 1Q14 2Q14 3Q14 4Q14 1Q15 2Q15
$/T
on
ne
of
Ore
All in Sustaining Cost Production Value Contribution Margin
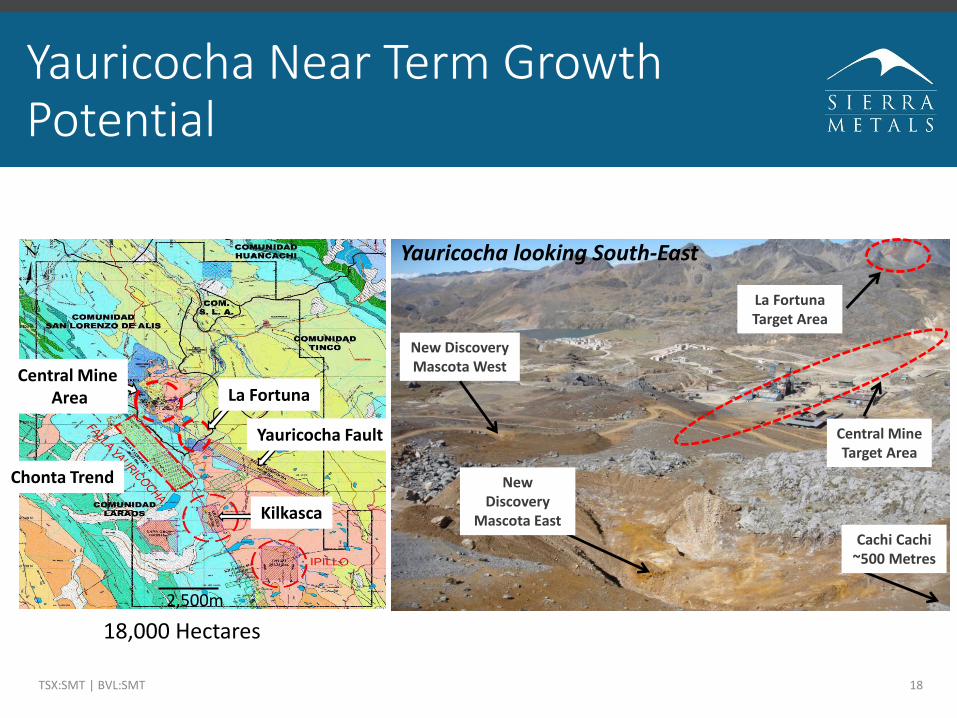
Yauricocha Near Term Growth Potential
TSX:SMT | BVL:SMT 18
Chonta Trend
Yauricocha Fault
Kilkasca
2,500m
La FortunaCentral Mine
Area
New Discovery Mascota West
New Discovery
Mascota East
La Fortuna Target Area
Central Mine Target Area
Cachi Cachi~500 Metres
Yauricocha looking South-East
18,000 Hectares
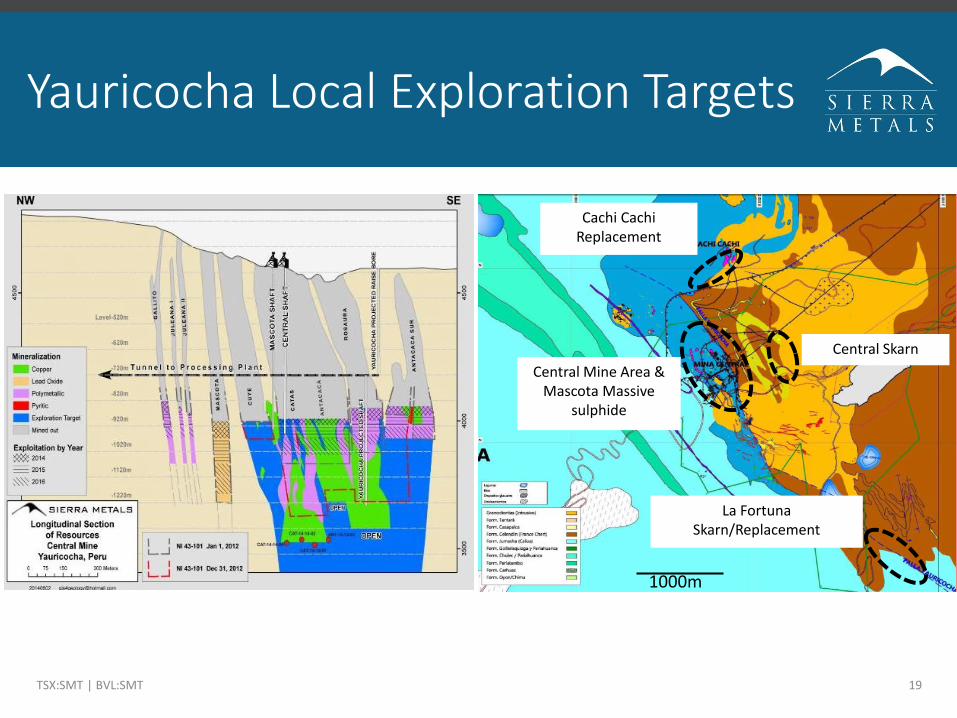
Yauricocha Local Exploration Targets
TSX:SMT | BVL:SMT 19
1000m
Central Mine Area &Mascota Massive
sulphide
Cachi CachiReplacement
La FortunaSkarn/Replacement
Central Skarn
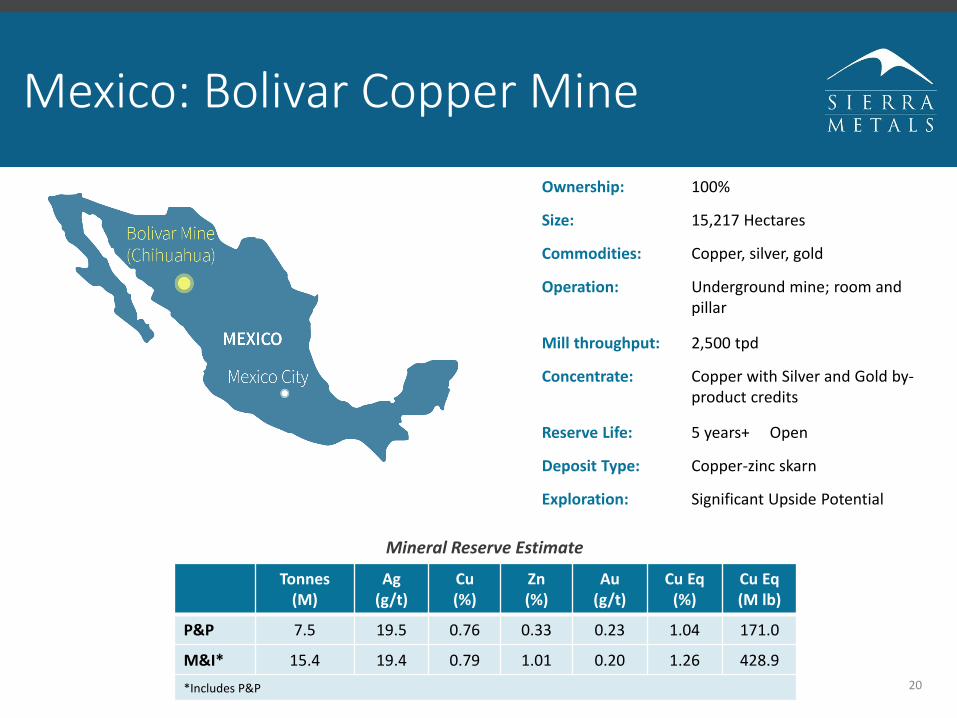
Mexico: Bolivar Copper Mine
20
Ownership: 100%
Size: 15,217 Hectares
Commodities: Copper, silver, gold
Operation: Underground mine; room and pillar
Mill throughput: 2,500 tpd
Concentrate: Copper with Silver and Gold by-product credits
Reserve Life: 5 years+ Open
Deposit Type: Copper-zinc skarn
Exploration: Significant Upside Potential
Tonnes(M)
Ag(g/t)
Cu (%)
Zn(%)
Au(g/t)
Cu Eq(%)
Cu Eq(M lb)
P&P 7.5 19.5 0.76 0.33 0.23 1.04 171.0
M&I* 15.4 19.4 0.79 1.01 0.20 1.26 428.9
*Includes P&P
Mineral Reserve Estimate
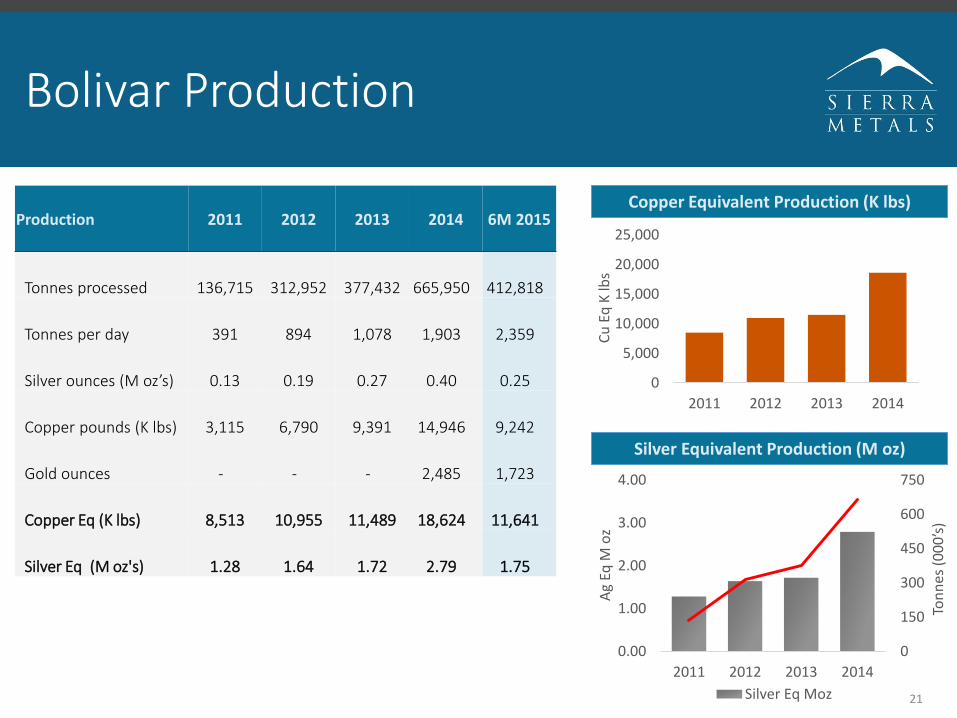
Bolivar Production
21
Production 2011 2012 2013 2014 6M 2015
Tonnes processed 136,715 312,952 377,432 665,950 412,818
Tonnes per day 391 894 1,078 1,903 2,359
Silver ounces (M oz’s) 0.13 0.19 0.27 0.40 0.25
Copper pounds (K lbs) 3,115 6,790 9,391 14,946 9,242
Gold ounces - - - 2,485 1,723
Copper Eq (K lbs) 8,513 10,955 11,489 18,624 11,641
Silver Eq (M oz's) 1.28 1.64 1.72 2.79 1.75
0
150
300
450
600
750
0.00
1.00
2.00
3.00
4.00
2011 2012 2013 2014
Ton
nes
(0
00
’s)
Ag
EqM
oz
Silver Eq Moz
Silver Equivalent Production (M oz)
Copper Equivalent Production (K lbs)
0
5,000
10,000
15,000
20,000
25,000
2011 2012 2013 2014
Cu
Eq
K lb
s
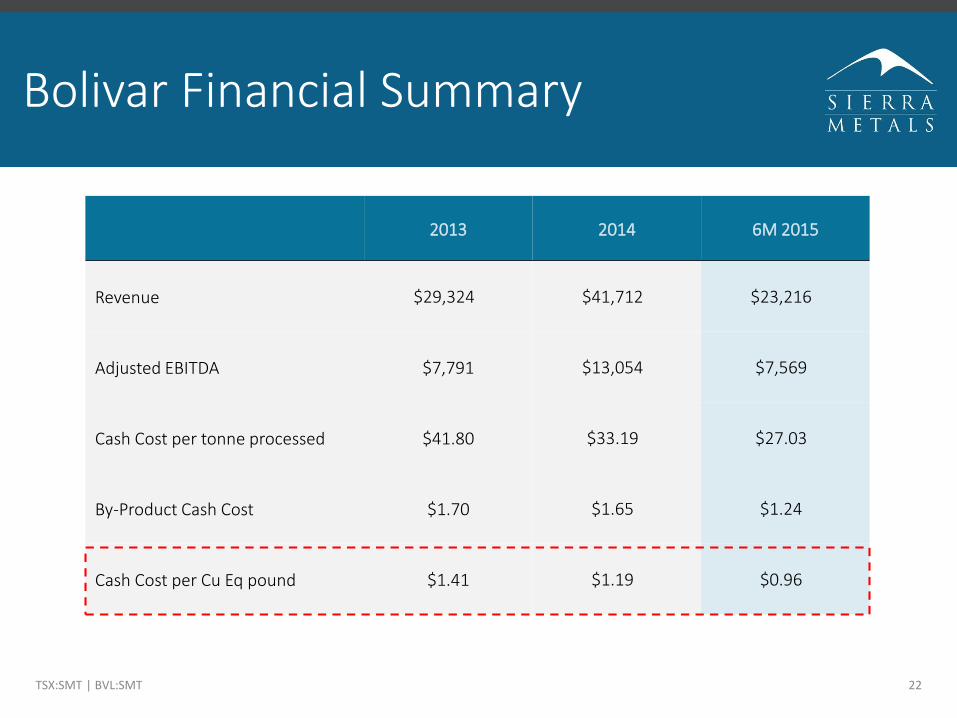
Bolivar Financial Summary
TSX:SMT | BVL:SMT 22
2013 2014 6M 2015
Revenue $29,324 $41,712 $23,216
Adjusted EBITDA $7,791 $13,054 $7,569
Cash Cost per tonne processed $41.80 $33.19 $27.03
By-Product Cash Cost $1.70 $1.65 $1.24
Cash Cost per Cu Eq pound $1.41 $1.19 $0.96
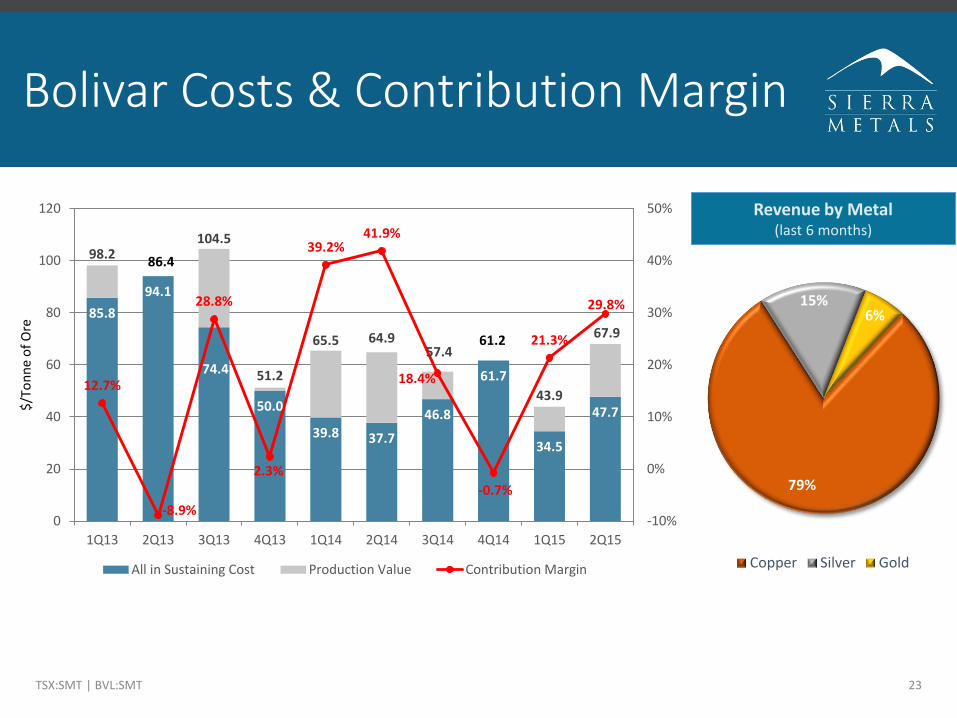
Bolivar Costs & Contribution Margin
79%
15%6%
Copper Silver Gold
TSX:SMT | BVL:SMT 23
Revenue by Metal(last 6 months)
85.8
94.1
74.4
50.0
39.8 37.7
46.8
61.7
34.5
47.7
98.2104.5
51.2
65.5 64.957.4
43.9
67.9
12.7%
-8.9%
28.8%
2.3%
39.2%41.9%
18.4%
-0.7%
21.3%
29.8%
-10%
0%
10%
20%
30%
40%
50%
0
20
40
60
80
100
120
1Q13 2Q13 3Q13 4Q13 1Q14 2Q14 3Q14 4Q14 1Q15 2Q15
$/T
on
ne
of
Ore
All in Sustaining Cost Production Value Contribution Margin
61.2
86.4
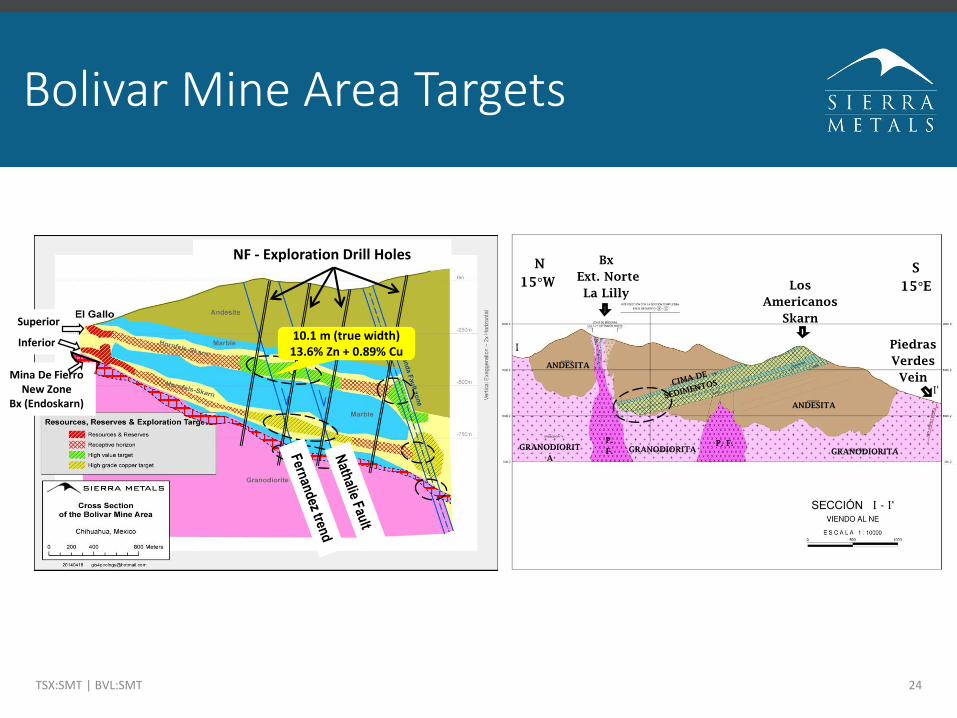
Piedras
Verdes
Vein
Los
Americanos
Skarn
Bx
Ext. Norte
La Lilly
ANDESITA
GRANODIORIT
A
GRANODIORITA GRANODIORITA
P. F.P.
F.
ANDESITA
N
15°WS
15°E
Bolivar Mine Area Targets
TSX:SMT | BVL:SMT 24
Superior
Inferior
Mina De FierroNew Zone
Bx (Endoskarn)
NF - Exploration Drill Holes
10.1 m (true width)13.6% Zn + 0.89% Cu
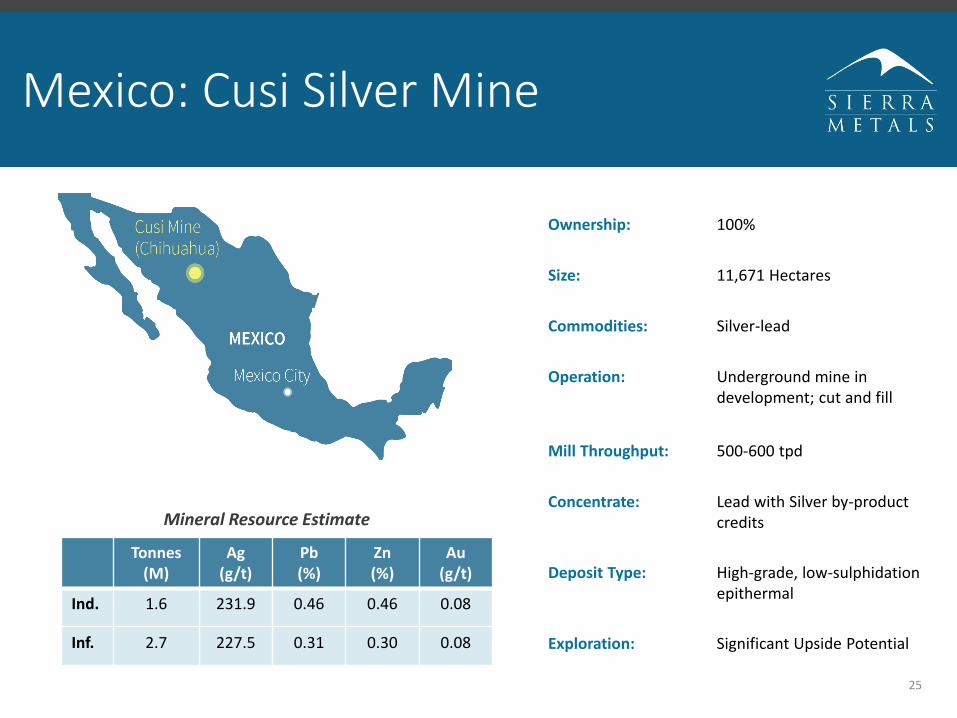
Mexico: Cusi Silver Mine
25
Ownership: 100%
Size: 11,671 Hectares
Commodities: Silver-lead
Operation: Underground mine in development; cut and fill
Mill Throughput: 500-600 tpd
Concentrate: Lead with Silver by-productcredits
Deposit Type: High-grade, low-sulphidationepithermal
Exploration: Significant Upside Potential
Mineral Resource Estimate
Tonnes(M)
Ag(g/t)
Pb(%)
Zn(%)
Au(g/t)
Ind. 1.6 231.9 0.46 0.46 0.08
Inf. 2.7 227.5 0.31 0.30 0.08
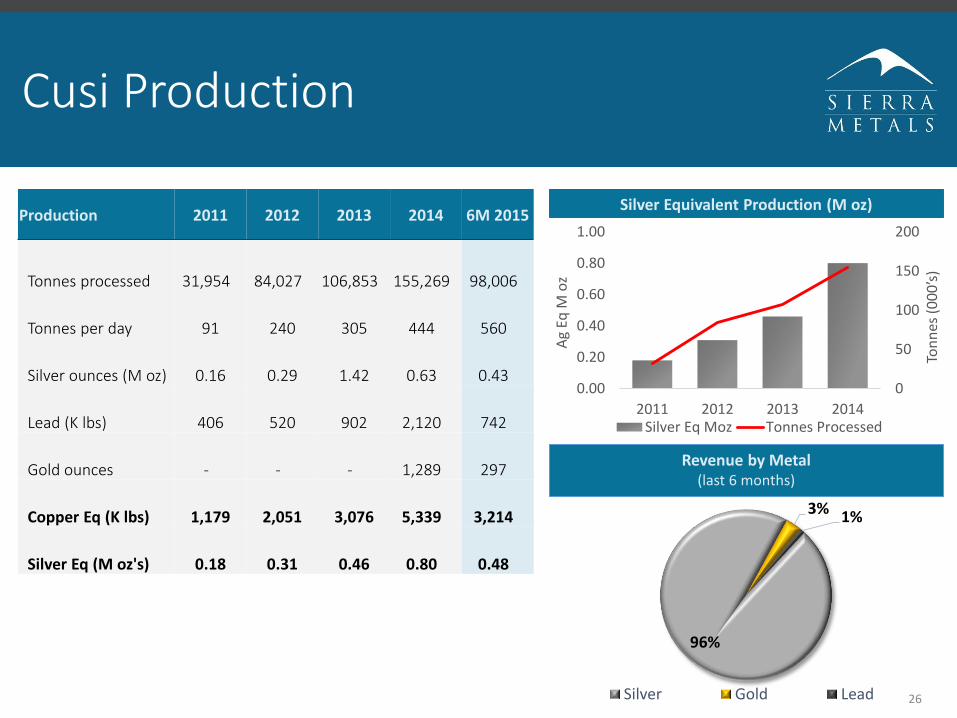
Cusi Production
26
0
50
100
150
200
0.00
0.20
0.40
0.60
0.80
1.00
2011 2012 2013 2014
Ton
nes
(0
00
’s)
Ag
EqM
oz
Silver Eq Moz Tonnes Processed
Silver Equivalent Production (M oz)Production 2011 2012 2013 2014 6M 2015
Tonnes processed 31,954 84,027 106,853 155,269 98,006
Tonnes per day 91 240 305 444 560
Silver ounces (M oz) 0.16 0.29 1.42 0.63 0.43
Lead (K lbs) 406 520 902 2,120 742
Gold ounces - - - 1,289 297
Copper Eq (K lbs) 1,179 2,051 3,076 5,339 3,214
Silver Eq (M oz's) 0.18 0.31 0.46 0.80 0.48
96%
3% 1%
Silver Gold Lead
Revenue by Metal(last 6 months)
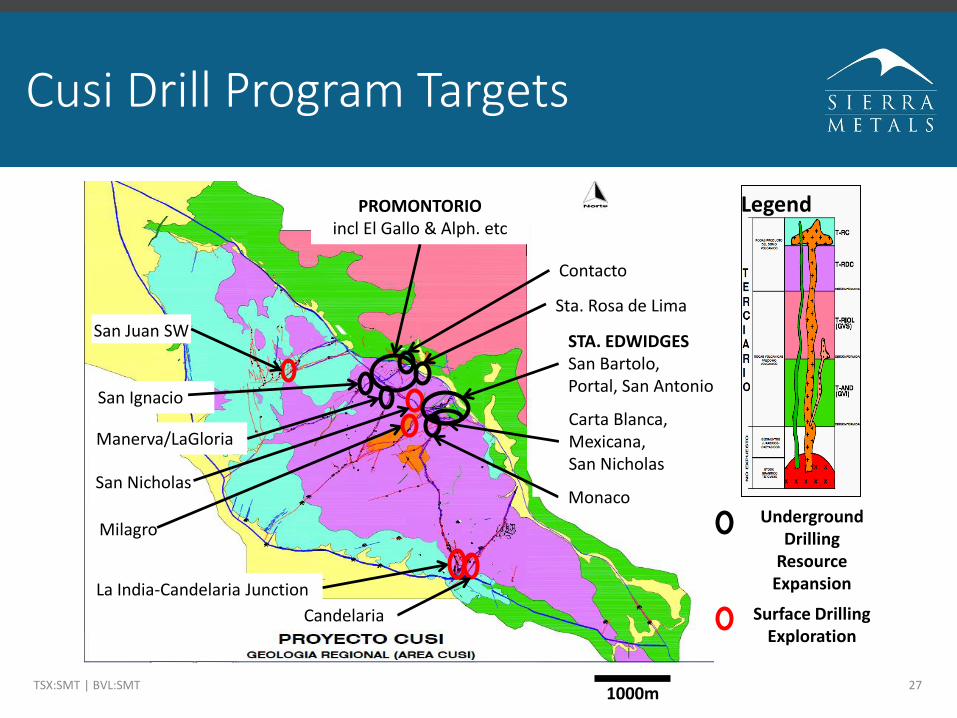
Cusi Drill Program Targets
TSX:SMT | BVL:SMT 27
San Nicholas
Milagro
La India-Candelaria Junction
San Juan SW
PROMONTORIOincl El Gallo & Alph. etc
Contacto
Sta. Rosa de Lima
San Ignacio
Manerva/LaGloria
STA. EDWIDGESSan Bartolo,Portal, San Antonio
Underground Drilling
Resource Expansion
Surface DrillingExploration
Legend
Carta Blanca,Mexicana,San Nicholas
1000m
Monaco
Candelaria
Contact Information
TSX:SMT | BVL:SMT 28
INVESTOR RELATIONS
Sierra Metals Inc. Mike McAllisterDirector, Corporate DevelopmentTel: 1.416.366.7777TF: 1.866.493.9646Email: [email protected]
CORPORATE OFFICE
TD South Tower79 Wellington Street West, Suite 2100Toronto, ON M5K 1H1
Tel: 1.416.366.7777TF: 1.866.493.9646
Follow us:
www.sierrametals.com
APPENDIX
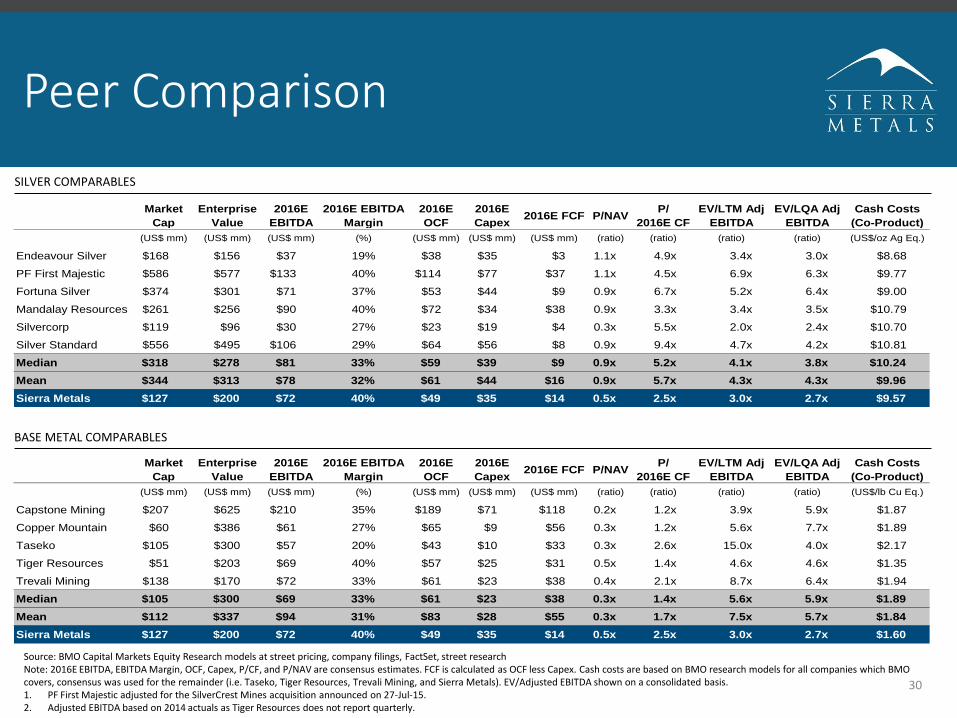
Peer Comparison
30
Source: BMO Capital Markets Equity Research models at street pricing, company filings, FactSet, street researchNote: 2016E EBITDA, EBITDA Margin, OCF, Capex, P/CF, and P/NAV are consensus estimates. FCF is calculated as OCF less Capex. Cash costs are based on BMO research models for all companies which BMO covers, consensus was used for the remainder (i.e. Taseko, Tiger Resources, Trevali Mining, and Sierra Metals). EV/Adjusted EBITDA shown on a consolidated basis.1. PF First Majestic adjusted for the SilverCrest Mines acquisition announced on 27-Jul-15.2. Adjusted EBITDA based on 2014 actuals as Tiger Resources does not report quarterly.
Market
Cap
Enterprise
Value
2016E
EBITDA
2016E EBITDA
Margin
2016E
OCF
2016E
Capex2016E FCF P/NAV
P/
2016E CF
EV/LTM Adj
EBITDA
EV/LQA Adj
EBITDA
Cash Costs
(Co-Product)
(US$ mm) (US$ mm) (US$ mm) (%) (US$ mm) (US$ mm) (US$ mm) (ratio) (ratio) (ratio) (ratio) (US$/lb Cu Eq.)
Capstone Mining $207 $625 $210 35% $189 $71 $118 0.2x 1.2x 3.9x 5.9x $1.87
Copper Mountain $60 $386 $61 27% $65 $9 $56 0.3x 1.2x 5.6x 7.7x $1.89
Taseko $105 $300 $57 20% $43 $10 $33 0.3x 2.6x 15.0x 4.0x $2.17
Tiger Resources $51 $203 $69 40% $57 $25 $31 0.5x 1.4x 4.6x 4.6x $1.35
Trevali Mining $138 $170 $72 33% $61 $23 $38 0.4x 2.1x 8.7x 6.4x $1.94
Median $105 $300 $69 33% $61 $23 $38 0.3x 1.4x 5.6x 5.9x $1.89
Mean $112 $337 $94 31% $83 $28 $55 0.3x 1.7x 7.5x 5.7x $1.84
Sierra Metals $127 $200 $72 40% $49 $35 $14 0.5x 2.5x 3.0x 2.7x $1.60
Market
Cap
Enterprise
Value
2016E
EBITDA
2016E EBITDA
Margin
2016E
OCF
2016E
Capex2016E FCF P/NAV
P/
2016E CF
EV/LTM Adj
EBITDA
EV/LQA Adj
EBITDA
Cash Costs
(Co-Product)
(US$ mm) (US$ mm) (US$ mm) (%) (US$ mm) (US$ mm) (US$ mm) (ratio) (ratio) (ratio) (ratio) (US$/oz Ag Eq.)
Endeavour Silver $168 $156 $37 19% $38 $35 $3 1.1x 4.9x 3.4x 3.0x $8.68
PF First Majestic $586 $577 $133 40% $114 $77 $37 1.1x 4.5x 6.9x 6.3x $9.77
Fortuna Silver $374 $301 $71 37% $53 $44 $9 0.9x 6.7x 5.2x 6.4x $9.00
Mandalay Resources $261 $256 $90 40% $72 $34 $38 0.9x 3.3x 3.4x 3.5x $10.79
Silvercorp $119 $96 $30 27% $23 $19 $4 0.3x 5.5x 2.0x 2.4x $10.70
Silver Standard $556 $495 $106 29% $64 $56 $8 0.9x 9.4x 4.7x 4.2x $10.81
Median $318 $278 $81 33% $59 $39 $9 0.9x 5.2x 4.1x 3.8x $10.24
Mean $344 $313 $78 32% $61 $44 $16 0.9x 5.7x 4.3x 4.3x $9.96
Sierra Metals $127 $200 $72 40% $49 $35 $14 0.5x 2.5x 3.0x 2.7x $9.57
SILVER COMPARABLES
BASE METAL COMPARABLES
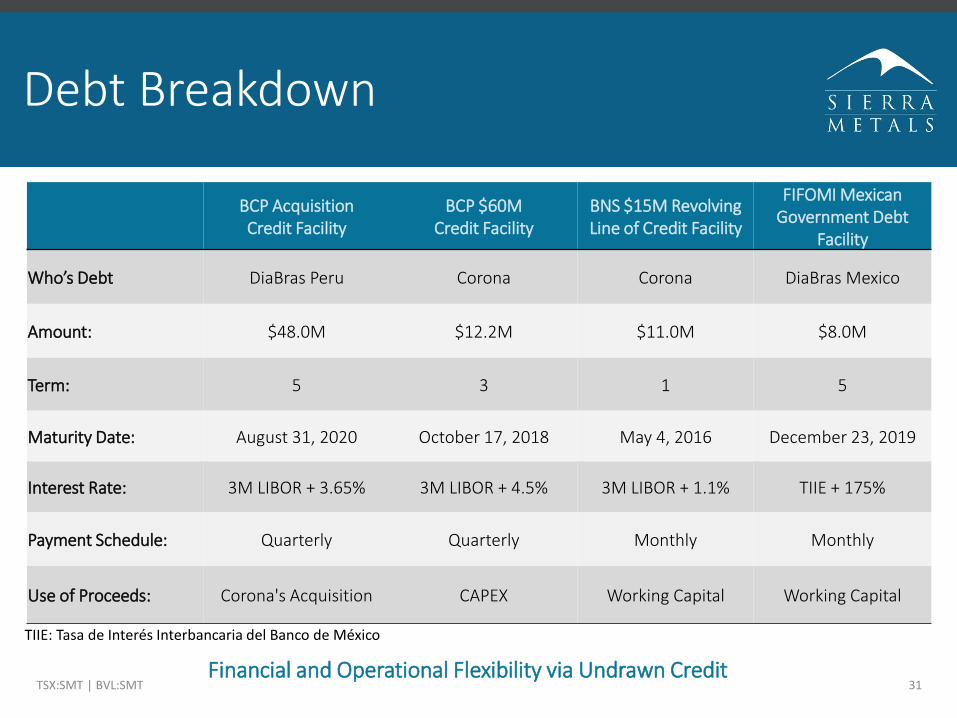
Debt Breakdown
TSX:SMT | BVL:SMT 31
BCP Acquisition Credit Facility
BCP $60M Credit Facility
BNS $15M Revolving Line of Credit Facility
FIFOMI Mexican Government Debt
Facility
Who’s Debt DiaBras Peru Corona Corona DiaBras Mexico
Amount: $48.0M $12.2M $11.0M $8.0M
Term: 5 3 1 5
Maturity Date: August 31, 2020 October 17, 2018 May 4, 2016 December 23, 2019
Interest Rate: 3M LIBOR + 3.65% 3M LIBOR + 4.5% 3M LIBOR + 1.1% TIIE + 175%
Payment Schedule: Quarterly Quarterly Monthly Monthly
Use of Proceeds: Corona's Acquisition CAPEX Working Capital Working Capital
Financial and Operational Flexibility via Undrawn Credit
TIIE: Tasa de Interés Interbancaria del Banco de México
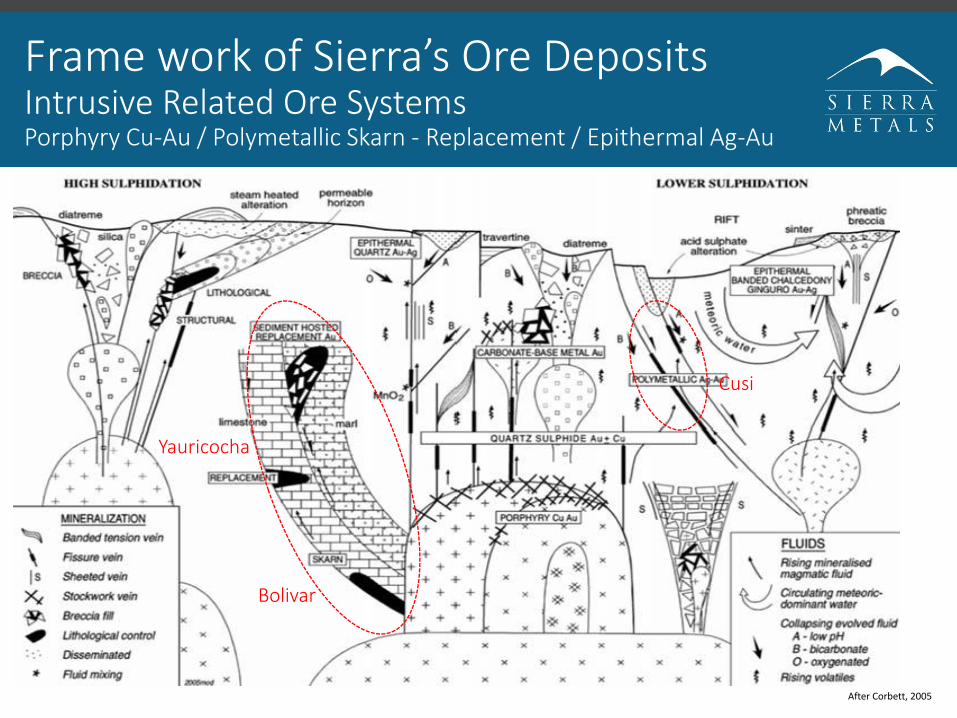
Frame work of Sierra’s Ore Deposits Intrusive Related Ore SystemsPorphyry Cu-Au / Polymetallic Skarn - Replacement / Epithermal Ag-Au
After Corbett, 2005
Cusi
Yauricocha
Bolivar
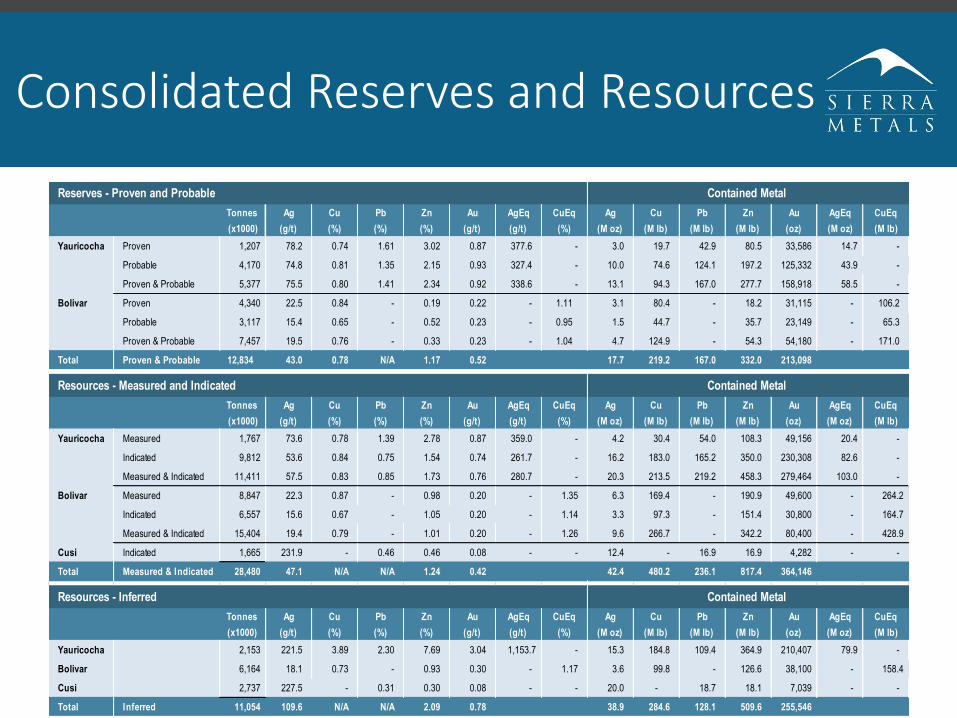
Consolidated Reserves and Resources
TSX:SMT | BVL:SMT 33
Tonnes Ag Cu Pb Zn Au AgEq CuEq Ag Cu Pb Zn Au AgEq CuEq
(x1000) (g/t) (%) (%) (%) (g/t) (g/t) (%) (M oz) (M lb) (M lb) (M lb) (oz) (M oz) (M lb)
Yauricocha Proven 1,207 78.2 0.74 1.61 3.02 0.87 377.6 - 3.0 19.7 42.9 80.5 33,586 14.7 -
Probable 4,170 74.8 0.81 1.35 2.15 0.93 327.4 - 10.0 74.6 124.1 197.2 125,332 43.9 -
Proven & Probable 5,377 75.5 0.80 1.41 2.34 0.92 338.6 - 13.1 94.3 167.0 277.7 158,918 58.5 -
Bolivar Proven 4,340 22.5 0.84 - 0.19 0.22 - 1.11 3.1 80.4 - 18.2 31,115 - 106.2
Probable 3,117 15.4 0.65 - 0.52 0.23 - 0.95 1.5 44.7 - 35.7 23,149 - 65.3
Proven & Probable 7,457 19.5 0.76 - 0.33 0.23 - 1.04 4.7 124.9 - 54.3 54,180 - 171.0
Total Proven & Probable 12,834 43.0 0.78 N/A 1.17 0.52 17.7 219.2 167.0 332.0 213,098
Tonnes Ag Cu Pb Zn Au AgEq CuEq Ag Cu Pb Zn Au AgEq CuEq
(x1000) (g/t) (%) (%) (%) (g/t) (g/t) (%) (M oz) (M lb) (M lb) (M lb) (oz) (M oz) (M lb)
Yauricocha Measured 1,767 73.6 0.78 1.39 2.78 0.87 359.0 - 4.2 30.4 54.0 108.3 49,156 20.4 -
Indicated 9,812 53.6 0.84 0.75 1.54 0.74 261.7 - 16.2 183.0 165.2 350.0 230,308 82.6 -
Measured & Indicated 11,411 57.5 0.83 0.85 1.73 0.76 280.7 - 20.3 213.5 219.2 458.3 279,464 103.0 -
Bolivar Measured 8,847 22.3 0.87 - 0.98 0.20 - 1.35 6.3 169.4 - 190.9 49,600 - 264.2
Indicated 6,557 15.6 0.67 - 1.05 0.20 - 1.14 3.3 97.3 - 151.4 30,800 - 164.7
Measured & Indicated 15,404 19.4 0.79 - 1.01 0.20 - 1.26 9.6 266.7 - 342.2 80,400 - 428.9
Cusi Indicated 1,665 231.9 - 0.46 0.46 0.08 - - 12.4 - 16.9 16.9 4,282 - -
Total Measured & Indicated 28,480 47.1 N/A N/A 1.24 0.42 42.4 480.2 236.1 817.4 364,146
Tonnes Ag Cu Pb Zn Au AgEq CuEq Ag Cu Pb Zn Au AgEq CuEq
(x1000) (g/t) (%) (%) (%) (g/t) (g/t) (%) (M oz) (M lb) (M lb) (M lb) (oz) (M oz) (M lb)
Yauricocha 2,153 221.5 3.89 2.30 7.69 3.04 1,153.7 - 15.3 184.8 109.4 364.9 210,407 79.9 -
Bolivar 6,164 18.1 0.73 - 0.93 0.30 - 1.17 3.6 99.8 - 126.6 38,100 - 158.4
Cusi 2,737 227.5 - 0.31 0.30 0.08 - - 20.0 - 18.7 18.1 7,039 - -
Total Inferred 11,054 109.6 N/A N/A 2.09 0.78 38.9 284.6 128.1 509.6 255,546
Reserves - Proven and Probable Contained Metal
Resources - Measured and Indicated Contained Metal
Resources - Inferred Contained Metal
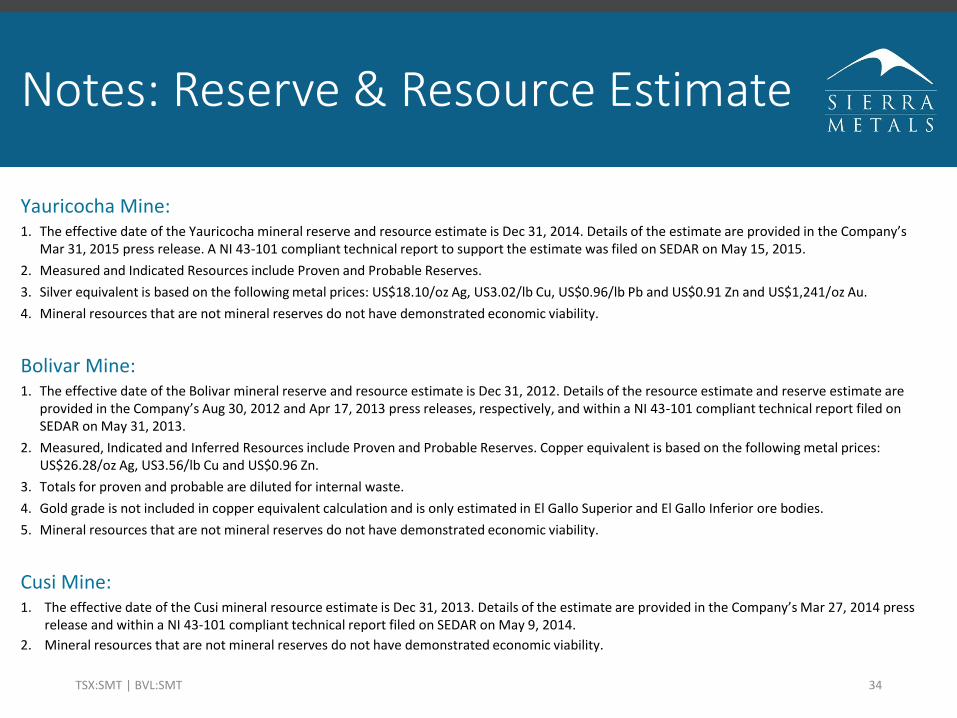
Notes: Reserve & Resource Estimate
TSX:SMT | BVL:SMT 34
Yauricocha Mine:1. The effective date of the Yauricocha mineral reserve and resource estimate is Dec 31, 2014. Details of the estimate are provided in the Company’s
Mar 31, 2015 press release. A NI 43-101 compliant technical report to support the estimate was filed on SEDAR on May 15, 2015.
2. Measured and Indicated Resources include Proven and Probable Reserves.
3. Silver equivalent is based on the following metal prices: US$18.10/oz Ag, US3.02/lb Cu, US$0.96/lb Pb and US$0.91 Zn and US$1,241/oz Au.
4. Mineral resources that are not mineral reserves do not have demonstrated economic viability.
Bolivar Mine:1. The effective date of the Bolivar mineral reserve and resource estimate is Dec 31, 2012. Details of the resource estimate and reserve estimate are
provided in the Company’s Aug 30, 2012 and Apr 17, 2013 press releases, respectively, and within a NI 43-101 compliant technical report filed on SEDAR on May 31, 2013.
2. Measured, Indicated and Inferred Resources include Proven and Probable Reserves. Copper equivalent is based on the following metal prices: US$26.28/oz Ag, US3.56/lb Cu and US$0.96 Zn.
3. Totals for proven and probable are diluted for internal waste.
4. Gold grade is not included in copper equivalent calculation and is only estimated in El Gallo Superior and El Gallo Inferior ore bodies.
5. Mineral resources that are not mineral reserves do not have demonstrated economic viability.
Cusi Mine:1. The effective date of the Cusi mineral resource estimate is Dec 31, 2013. Details of the estimate are provided in the Company’s Mar 27, 2014 press
release and within a NI 43-101 compliant technical report filed on SEDAR on May 9, 2014.
2. Mineral resources that are not mineral reserves do not have demonstrated economic viability.
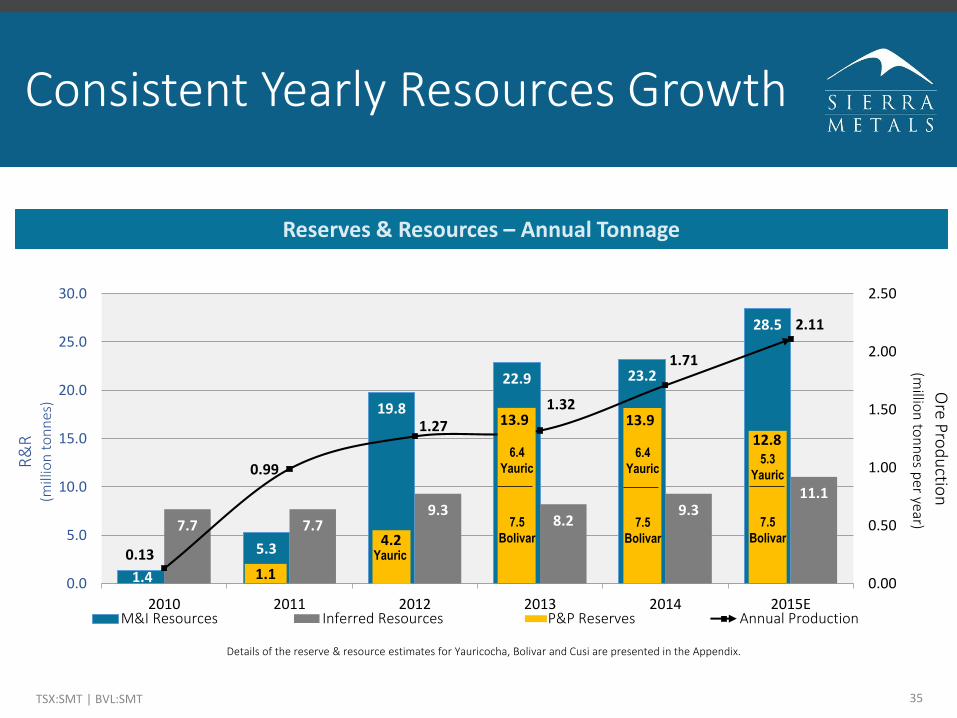
Consistent Yearly Resources Growth
TSX:SMT | BVL:SMT 35
1.4
5.3
19.8
22.9 23.2
28.5
7.7 7.79.3
8.29.3
11.1
0.13
0.99
1.27
1.32
1.71
2.11
0.00
0.50
1.00
1.50
2.00
2.50
0.0
5.0
10.0
15.0
20.0
25.0
30.0
2010 2011 2012 2013 2014 2015EM&I Resources Inferred Resources P&P Reserves Annual Production
Reserves & Resources – Annual Tonnage
Details of the reserve & resource estimates for Yauricocha, Bolivar and Cusi are presented in the Appendix.
1.1
4.2
13.9
12.8
Yauric
6.4
Yauric
7.5
Bolivar
5.3
Yauric
7.5
Bolivar
13.9
6.4
Yauric
7.5
Bolivar
Ore Pro
du
ction
(millio
n to
nn
es per year)
R&
R(m
illio
n t
on
nes
)
Board of Directors
TSX:SMT | BVL:SMT 36
J. Alberto Arias, Chairman & Director
Mr. Arias has over 21 years of experience in the field of international mining finance. He is the founder and President of Arias
Resource Capital Management LP (“ARCM”). Prior to ARCM, he was Managing Director & Head of Equity Research for Metals
and Mining at Goldman Sachs and a former mining analyst at UBS
Mark Brennan, President, Chief
Executive Officer & Director
Mr. Brennan has 30 years of financing and operating experience in North America and Europe. He most recently served as President and CEO at Largo Resources Ltd. During his tenure at Largo, the Maracas Project was constructed and commenced production in 2014 Prior to Largo, Mr. Brennan served in various senior management roles for resource companies. Mr. Brennan spent his early career as an investment banker in London, where he focused largely on Canadian equities and covered both London and continental Europe
Doug Cater, Director
Mr. Cater, a seasoned geologist with over 30 years of experience in the gold mining and exploration business and is currently
Vice President, Exploration at St Andrews Goldfields. He also serves as a Council member of the Association of Professional
Geoscientists of Ontario (APGO), representing the Southwest Ontario district
Steven Dean, Director
Mr. Dean has extensive international experience in the mining industry, most recently as President of Teck Cominco (now
Teck Resources). Prior to joining Teck, he was a founding director of Normandy Poseidon Group (which became Normandy
Mining) as well as founder of PacMin Mining
Igor Gonzales, Director
Mr. Gonzales has more than 30 years of experience in the mining industry, including with Barrick Gold from 1998 to 2013
where he most recently held the position of Executive VP and COO. Prior to joining Barrick, he served in various roles with
Southern Peru Copper
Diego Miranda, Director
Mr. Miranda is currently Vice President of Arias Resource Capital Latin America S.R.L. (a subsidiary of ARCM). Prior to joining
ARCM, Mr. Miranda spent six years at JP Morgan where he worked with the Global Special Opportunities Group in New York,
focused on principal investment and private equity opportunities; and with the Latin American Investment Banking Advisory
team based in Peru
Philip Renaud, Director Mr. Renaud is Managing Director of Church Advisors, a European investment advisory firm involved in private financings. Prior
to joining Church he was a founding partner of Change Capital Partners, a 300 million Euro private equity fund
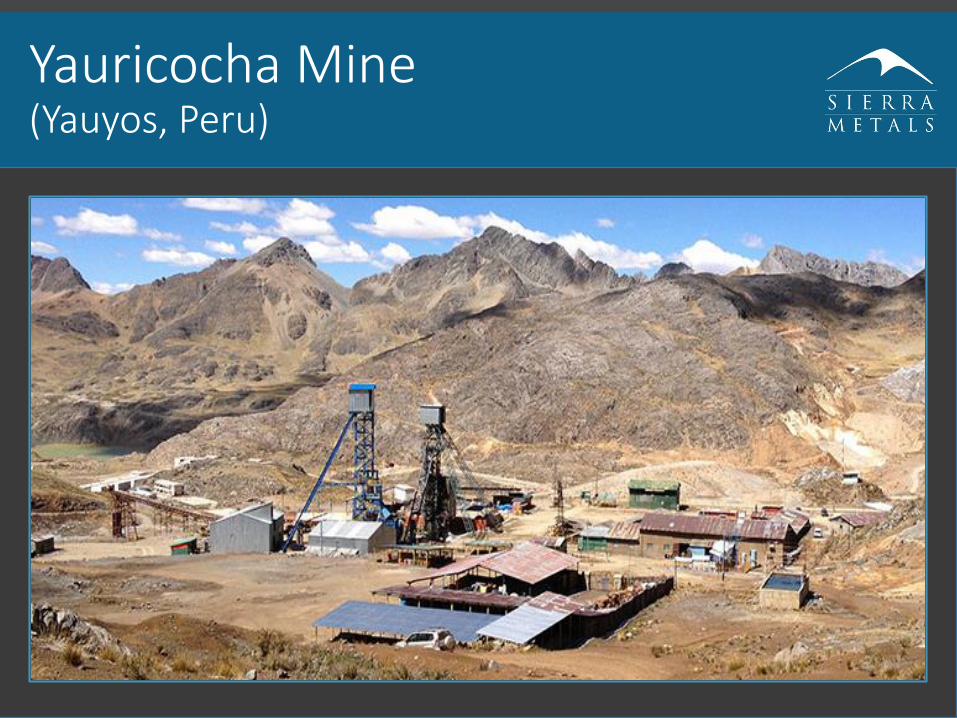
Yauricocha Mine(Yauyos, Peru)
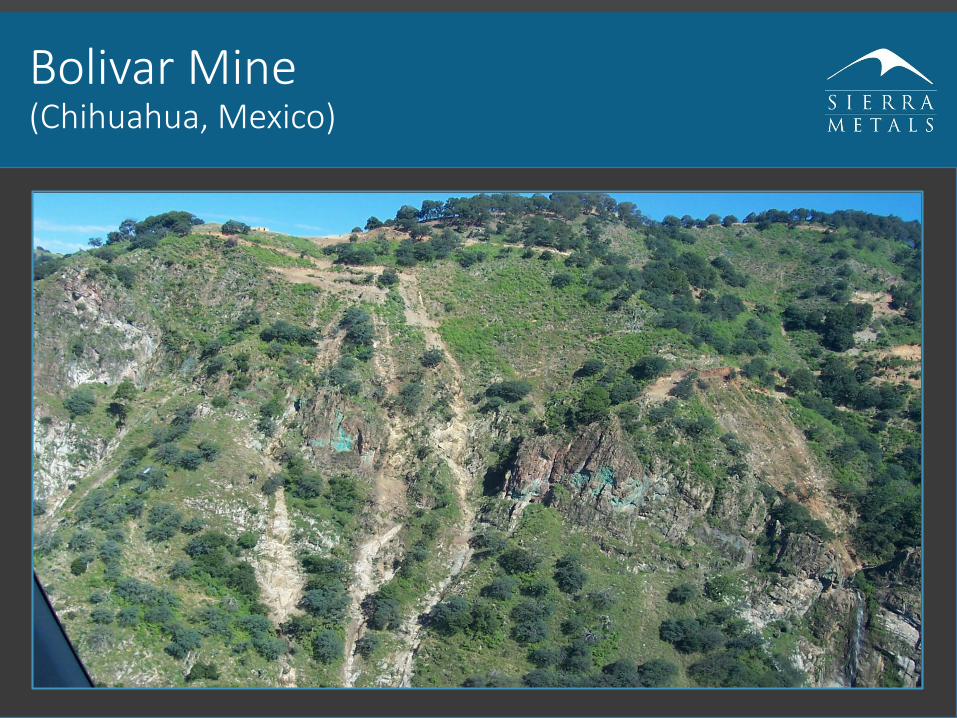
Bolivar Mine(Chihuahua, Mexico)
Cusi Mine(Chihuahua, Mexico)