Embed Size (px)
Citation preview
RUNGE L IMITED abn 17 010 672 321
MINERAL RESOURCE ESTIMATE
PATRICIA Zn-Pb-Ag DEPOSIT CHILE
Compania Minera Paguanta (Chile) SA
October, 2008
Mineral Resource Estimate Patricia Zn-Pb-Ag Deposit, Chile
Runge Limited (Perth), Level 3, 251 Adelaide Terrace, Perth WA 6000
Contact: Paul Payne [email protected]
www.runge.com.au
October 2008
Compiled by: Peer Review by:
Paul Payne Jeremy Clark
Manager Mining Consulting WA Senior Consultant Geologist
Authors:
Paul Payne
Runge Limited Compania Minera Paguanta (Chile) SA Patricia Deposit Resource Report
i
Executive Summary A Mineral Resource estimate for the Patricia Zn-Pb-Ag deposit located within the Paguanta Project area, was completed during October 2008 by Runge Limited (Runge) for Compania Minera Paguanta (Chile) SA (CMP), a 70% owned subsidiary of Paguanta Resources (Chile) SA. The deposit is located in mountainous terrain in northern Chile, some 120km east-northeast of the city of Iquique.
The deposit is located in the Andean Cordillera. Relief in this area is moderate to high, with a topographic range in the project area from 3,650m to 3,850m.
The Patricia deposit is hosted within andesite and rhyolite lithologies. The majority of mineralisation is associated with steep dipping, sub-vertical vein structures typically 3m to 15m in width and occurs as disseminated to semi-massive concentrations. The mineralised veins occur in four main clusters, with three of the clusters oriented east-west, and the fourth occurring as a strongly oblique north-northeast trending zone.
The deposit was first drilled in November 2006. Further drilling was undertaken in 2007 and 2008 and the resource is now based on the data from 33 diamond core holes and 107 RC holes, all drilled from surface. The estimate covers a 980m lateral extent from 494,065mE to 495,045mE and the vertical extent of the resource is 361m from surface at 3,838mRL to 3,477mRL.
Sampling of RC holes was carried out at 1m intervals, and core was sampled at either 1m or 0.5m intervals. Sample preparation and assay was carried out by ALS-Chemex in Chile. Comprehensive assaying of Zn, Pb, Ag was carried out routinely, with a number of samples also assayed for Au.
Previous mining by local miners has exploited an unknown but minor amount of ore from a small adit. An estimated few thousand tonnes has been exploited from the resource.
The Mineral Resource estimate complies with recommendations in the Australian Code for Reporting of Mineral Resources and Ore Reserves (2004) by the Joint Ore Reserves Committee (JORC). Therefore it is suitable for public reporting.
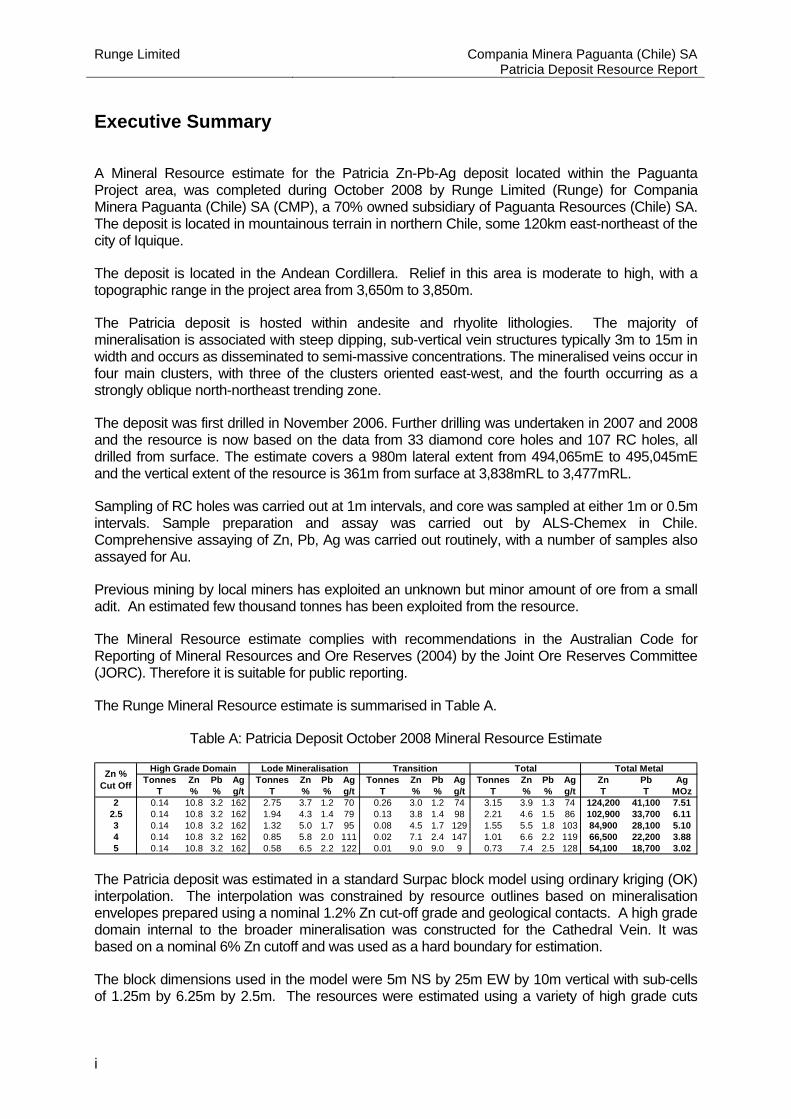
The Runge Mineral Resource estimate is summarised in Table A.
Table A: Patricia Deposit October 2008 Mineral Resource Estimate
Tonnes Zn Pb Ag Tonnes Zn Pb Ag Tonnes Zn Pb Ag Tonnes Zn Pb Ag Zn Pb AgT % % g/t T % % g/t T % % g/t T % % g/t T T MOz
2 0.14 10.8 3.2 162 2.75 3.7 1.2 70 0.26 3.0 1.2 74 3.15 3.9 1.3 74 124,200 41,100 7.512.5 0.14 10.8 3.2 162 1.94 4.3 1.4 79 0.13 3.8 1.4 98 2.21 4.6 1.5 86 102,900 33,700 6.113 0.14 10.8 3.2 162 1.32 5.0 1.7 95 0.08 4.5 1.7 129 1.55 5.5 1.8 103 84,900 28,100 5.104 0.14 10.8 3.2 162 0.85 5.8 2.0 111 0.02 7.1 2.4 147 1.01 6.6 2.2 119 66,500 22,200 3.885 0.14 10.8 3.2 162 0.58 6.5 2.2 122 0.01 9.0 9.0 9 0.73 7.4 2.5 128 54,100 18,700 3.02
Zn % Cut Off
High Grade Domain Lode Mineralisation Transition Total Total Metal
The Patricia deposit was estimated in a standard Surpac block model using ordinary kriging (OK) interpolation. The interpolation was constrained by resource outlines based on mineralisation envelopes prepared using a nominal 1.2% Zn cut-off grade and geological contacts. A high grade domain internal to the broader mineralisation was constructed for the Cathedral Vein. It was based on a nominal 6% Zn cutoff and was used as a hard boundary for estimation.
The block dimensions used in the model were 5m NS by 25m EW by 10m vertical with sub-cells of 1.25m by 6.25m by 2.5m. The resources were estimated using a variety of high grade cuts
Runge Limited Compania Minera Paguanta (Chile) SA Patricia Deposit Resource Report
ii
based on individual lode statistics within the Patricia deposit, and reported at a range of cutoff grades.
Bulk density analysis was carried out on drill core using the water immersion method. Approximately 1,600 samples determinations were completed on fresh material. A number of samples from the transition zone were also measured.
The Mineral Resource was largely classified as Inferred due to the broad drill density. However, several portions of the deposit have been drilled at spacings of 40m or less, and have mapped surface and underground exposures to confirm continuity of structure. These zones have been classified as Indicated Mineral Resource.
The resource model is undiluted, so appropriate dilution needs to be incorporated in any evaluation of the deposit.
Paul Payne
Principal Geologist
Runge Limited Compania Minera Paguanta (Chile) SA Patricia Deposit Resource Report
iii
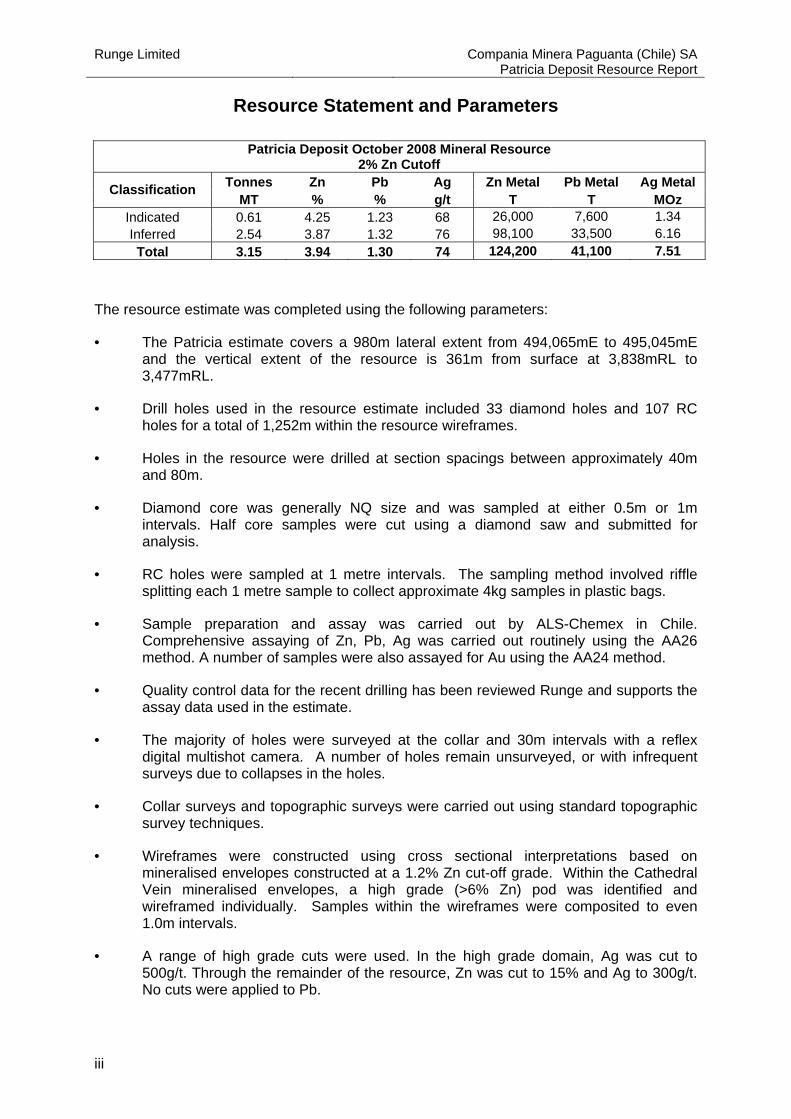
Resource Statement and Parameters
Patricia Deposit October 2008 Mineral Resource 2% Zn Cutoff
Tonnes Zn Pb Ag Zn Metal Pb Metal Ag Metal Classification MT % % g/t T T MOz
Indicated 0.61 4.25 1.23 68 26,000 7,600 1.34 Inferred 2.54 3.87 1.32 76 98,100 33,500 6.16 Total 3.15 3.94 1.30 74 124,200 41,100 7.51
The resource estimate was completed using the following parameters:
• The Patricia estimate covers a 980m lateral extent from 494,065mE to 495,045mE and the vertical extent of the resource is 361m from surface at 3,838mRL to 3,477mRL.
• Drill holes used in the resource estimate included 33 diamond holes and 107 RC holes for a total of 1,252m within the resource wireframes.
• Holes in the resource were drilled at section spacings between approximately 40m and 80m.
• Diamond core was generally NQ size and was sampled at either 0.5m or 1m intervals. Half core samples were cut using a diamond saw and submitted for analysis.
• RC holes were sampled at 1 metre intervals. The sampling method involved riffle splitting each 1 metre sample to collect approximate 4kg samples in plastic bags.
• Sample preparation and assay was carried out by ALS-Chemex in Chile. Comprehensive assaying of Zn, Pb, Ag was carried out routinely using the AA26 method. A number of samples were also assayed for Au using the AA24 method.
• Quality control data for the recent drilling has been reviewed Runge and supports the assay data used in the estimate.
• The majority of holes were surveyed at the collar and 30m intervals with a reflex digital multishot camera. A number of holes remain unsurveyed, or with infrequent surveys due to collapses in the holes.
• Collar surveys and topographic surveys were carried out using standard topographic survey techniques.
• Wireframes were constructed using cross sectional interpretations based on mineralised envelopes constructed at a 1.2% Zn cut-off grade. Within the Cathedral Vein mineralised envelopes, a high grade (>6% Zn) pod was identified and wireframed individually. Samples within the wireframes were composited to even 1.0m intervals.
• A range of high grade cuts were used. In the high grade domain, Ag was cut to 500g/t. Through the remainder of the resource, Zn was cut to 15% and Ag to 300g/t. No cuts were applied to Pb.
Runge Limited Compania Minera Paguanta (Chile) SA Patricia Deposit Resource Report
iv
• A Surpac block model was used for the estimate with a block size of 5m NS by 25m EW by 10m vertical with sub-cells of 1.25m by 6.25m by 2.5m.
• OK grade interpolation used an oriented ‘ellipsoid’ search with a first pass radius of 140m and a second pass of 210m. A third pass search radius of 300m was used to fill the model. Greater than 92% of the blocks were filled in the first two passes.
• A bulk density value of 2.89t/m3 was assigned to the fresh waste rock. Transition material was assigned a value of 2.52t/m3 for waste rock, 2.61t/m3 for mineralised rock. In the fresh resource the regression formula density=[2.99 + (0.0307*Zn_Pb%)] was used resulting in average densities of 3.41t/m3 for the high grade domain and 3.15t/m3 in the fresh resource. Values were based on results of recent test work carried out on drill core.
• The resource has been classified as Indicated and Inferred on the basis of continuity of structure, drill spacing and surface and underground mapping. The overall magnitude and tenor of the mineralisation suggests that the project has reasonable prospects for eventual economic extraction.
Runge Limited Compania Minera Paguanta (Chile) SA Patricia Deposit Resource Report
v
IMPORTANT INFORMATION ABOUT THIS DOCUMENT Confidentiality This document and all information contained herein is confidential and intended for use only by Compania Minera Paguanta (Chile) SA (CMP) and it’s subsidiary companies. It shall not be disclosed, in part or full, to any third party, without Runge Limited’s (Runge) prior written consent to the form and context of the disclosure and the identity of the person(s) to whom it is to be disclosed. Limited purpose and context of Information The opinions expressed in this document are addressed only to CMP for its benefit with respect to this project. Runge accepts no liability whatsoever for any loss or damage (including consequential or economic loss or damage) arising as a result of reliance on the information presented herein for any party other than CMP. Responsibility Runge has exercised reasonable care in accordance with standards normally exercised within our profession in the completion of this document. Runge has relied on information provided by CMP. Although Runge has exercised reasonable care in reviewing this data, Runge makes no representation or warranty with respect to the accuracy or veracity of the data that it has relied upon. Currency of Information This document has been prepared as at the date stated on the cover page. Given the nature of this document and the opinions expressed within, developments after the date of this document are likely. This document takes no account of such potential future developments. Therefore Runge recommends that CMP seek advice from Runge in the future to ascertain whether any such events have occurred or updated information has become available and should be considered.
Runge Limited Compania Minera Paguanta (Chile) SA Patricia Deposit Resource Report
vi
Table of Contents Executive Summary .................................................................................................................. i Resource Statement and Parameters ..................................................................................... iii 1 Introduction and Project Summary....................................................................................1
1.1 General .....................................................................................................................1 1.2 Competent Persons and Responsibilities .................................................................3
2 Geology and Mineralisation...............................................................................................4 2.1 Regional Geology .....................................................................................................4 2.2 Local Geology...........................................................................................................4 2.3 Mineralisation ...........................................................................................................4
3 Mining Status ....................................................................................................................6 4 Previous Estimates ...........................................................................................................7 5 Drilling Data.......................................................................................................................8
5.1 Summary ..................................................................................................................8 5.2 Drill Hole Collar Location ..........................................................................................8 5.3 Downhole Surveys....................................................................................................8 5.4 Sampling...................................................................................................................8
5.4.1 Methodology .........................................................................................................8 5.4.2 Sample Preparation ..............................................................................................9
5.5 Data Excluded ..........................................................................................................9 6 Assay Data........................................................................................................................9
6.1 Methodology .............................................................................................................9 6.2 Quality Control ..........................................................................................................9
6.2.1 General .................................................................................................................9 6.2.2 Blanks...................................................................................................................9 6.2.3 Standards ...........................................................................................................10 6.2.4 Pulp Checks........................................................................................................10 6.2.5 RC Re-Splits .......................................................................................................10
7 Bulk Density Data............................................................................................................11 7.1 Methodology ...........................................................................................................11 7.2 Results....................................................................................................................11
8 Metallurgy........................................................................................................................12 9 Database Verification ......................................................................................................12 10 Interpretation and Resource Statistics........................................................................13
10.1 Geology and Resource Interpretation.....................................................................13 10.2 Preparation of Wireframes......................................................................................13
10.2.1 Resource ........................................................................................................13 10.3 Sample Statistics ....................................................................................................15
10.3.1 General ...........................................................................................................15 10.3.2 Deposit Statistics ............................................................................................15
10.4 High Grade Cuts.....................................................................................................17 10.5 Geostatistical Analysis............................................................................................18
11 Resource Estimation ..................................................................................................19 11.1 Block Model ............................................................................................................19 11.2 Grade Interpolation.................................................................................................20
11.2.1 Estimation Parameters ...................................................................................20 11.3 Density and Material Type......................................................................................20 11.4 Resource Classification ..........................................................................................20 11.5 Results....................................................................................................................22 11.6 Model Validation .....................................................................................................23
12 Risk and Opportunities ...............................................................................................25 13 Conclusion and Recommendations............................................................................25 14 References .................................................................................................................26
Runge Limited Compania Minera Paguanta (Chile) SA Patricia Deposit Resource Report
vii
Index of Figures Figure 1-1: Paguanta Project Location.....................................................................................1 Figure 1-2 Paguanta Project Area............................................................................................2 Figure 1-3: All Drilling and Resource Wireframes ....................................................................2 Figure 2-1 Local Geology Showing Stratigraphy in Overlying Andesite Lithology ...................4 Figure 3-1 Patricia Adit and Resource Outline at 3715mRL ....................................................6 Figure 3-2 Main Strike Drive Cathedral Vein (left), Minor Surface Working (right)...................6 Figure 6-1 Results of Pulp Re-Assay .....................................................................................10 Figure 6-2 Comparison of RC Re-Splits.................................................................................11 Figure 7-1 Density and Grade for Fresh Resource ................................................................11 Figure 10-1: Typical Cross Section View of Patricia Mineralisation (Section 494,400mN) ....13 Figure 10-2: Example of High Grade Domaining (494,400E).................................................14 Figure 10-3 Patricia Resource Wireframes ............................................................................14 Figure 10-4 Histogram of Sample Lengths in Resource Wireframes .....................................15 Figure 10-5: Probability Plot of Zn for 1m Composite Data by Zone......................................17 Figure 10-6: Probability Plot of Pb for 1m Composite Data by Zone......................................17 Figure 10-7: Probability Plot of Ag for 1m Composite Data by Zone......................................18 Figure 11-1: Mineral Resource Classification (Red = Inferred, Green = Indicated) ...............21 Figure 11-2: Patricia Resource - Global Bench Tonnage.......................................................22 Figure 11-3: Patricia Resource - Global Grade Tonnage Curve ............................................23 Figure 11-4: Validation by Elevation – Cathedral High Grade Zone ......................................23 Figure 11-5: Validation by Northing – Low Grade Zones .......................................................24 Index of Tables Table 5-1 Patricia Project Drilling Summary.............................................................................8 Table 6-1 Patricia Standards..................................................................................................10 Table 7-1 Bulk Density Determinations – Patricia Core .........................................................12 Table 10-1: Summary Statistics for 1m Composites ..............................................................16 Table 10-2 Kriging Parameters for Patricia Estimate .............................................................19 Table 11-1: Block Model Parameters .....................................................................................19 Table 11-2: ID2 Estimation Parameters .................................................................................20 Table 11-3: Patricia Deposit October 2008 Resource Estimate.............................................22 Appendices Appendix 1 – October 2008 Resource Tables Appendix 2 – Block Model Validation Plots Appendix 3 – Statistical Analysis by Domain Appendix 4 – Variograms Appendix 5 – Model Interpolation Parameters Appendix 6 – Data Disk Appendix 7 – Exploration Drilling and Site Procedures
Runge Limited Compania Minera Paguanta (Chile) SA Patricia Deposit Resource Report
Page 1 October 2008
1 Introduction and Project Summary 1.1 General Runge Limited (Runge) was contracted by Compania Minera Paguanta (Chile) SA (CMP), a 70% owned subsidiary of Paguanta Resources (Chile) SA to carry out an updated interpretation and estimation of the Patricia Zn-Pb-Ag Deposit. The original resource estimate was undertaken in September 2007 by Resource Evaluations Pty Ltd (ResEval), now a wholly owned subsidiary of Runge.
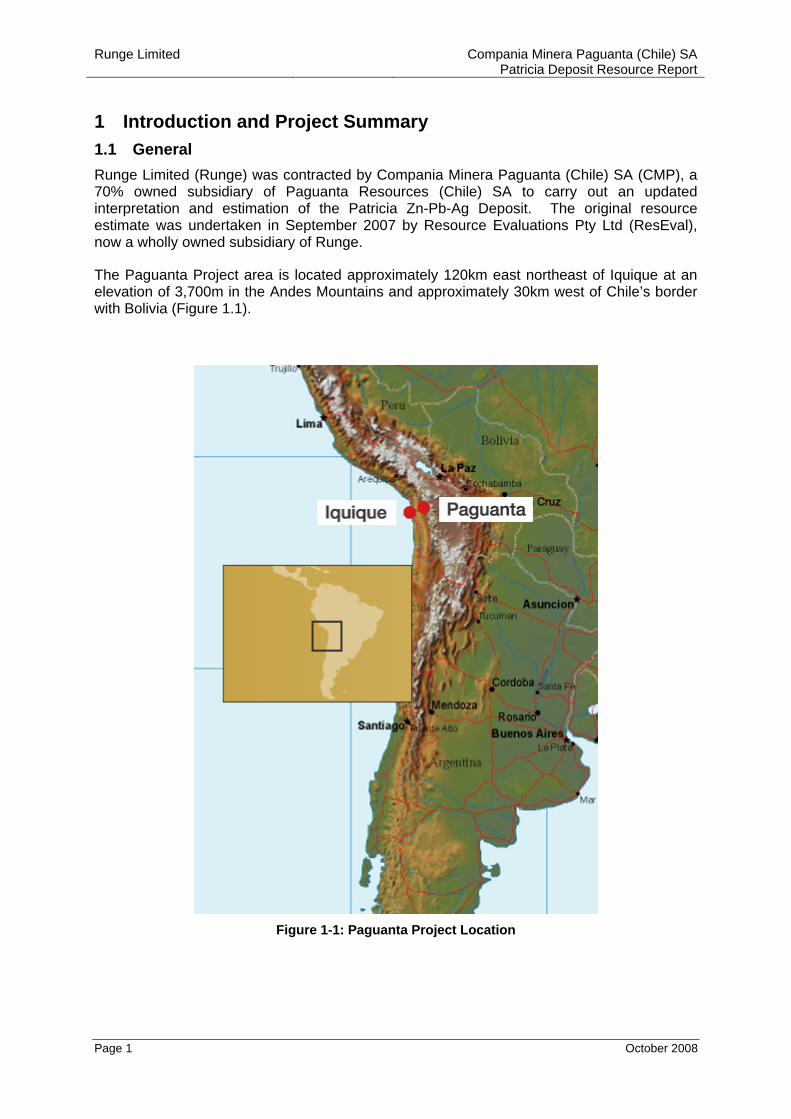
The Paguanta Project area is located approximately 120km east northeast of Iquique at an elevation of 3,700m in the Andes Mountains and approximately 30km west of Chile’s border with Bolivia (Figure 1.1).
Figure 1-1: Paguanta Project Location
Runge Limited Compania Minera Paguanta (Chile) SA Patricia Deposit Resource Report
Page 2 October 2008
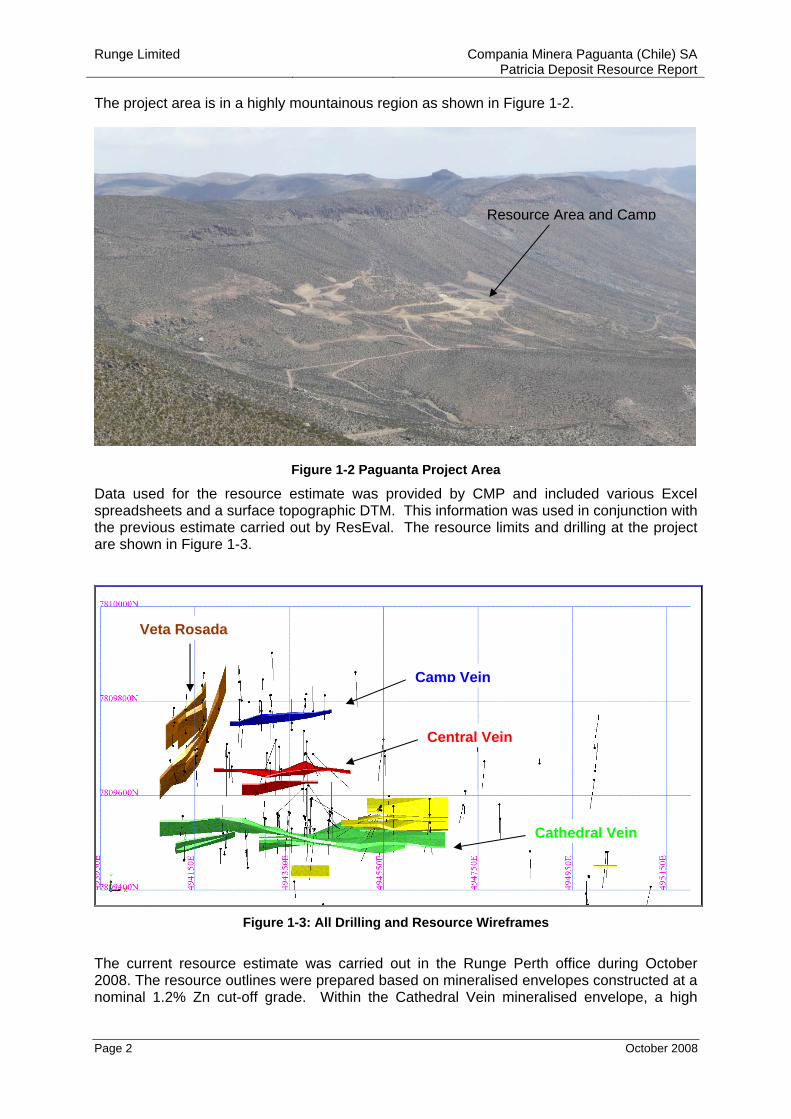
The project area is in a highly mountainous region as shown in Figure 1-2.
Figure 1-2 Paguanta Project Area
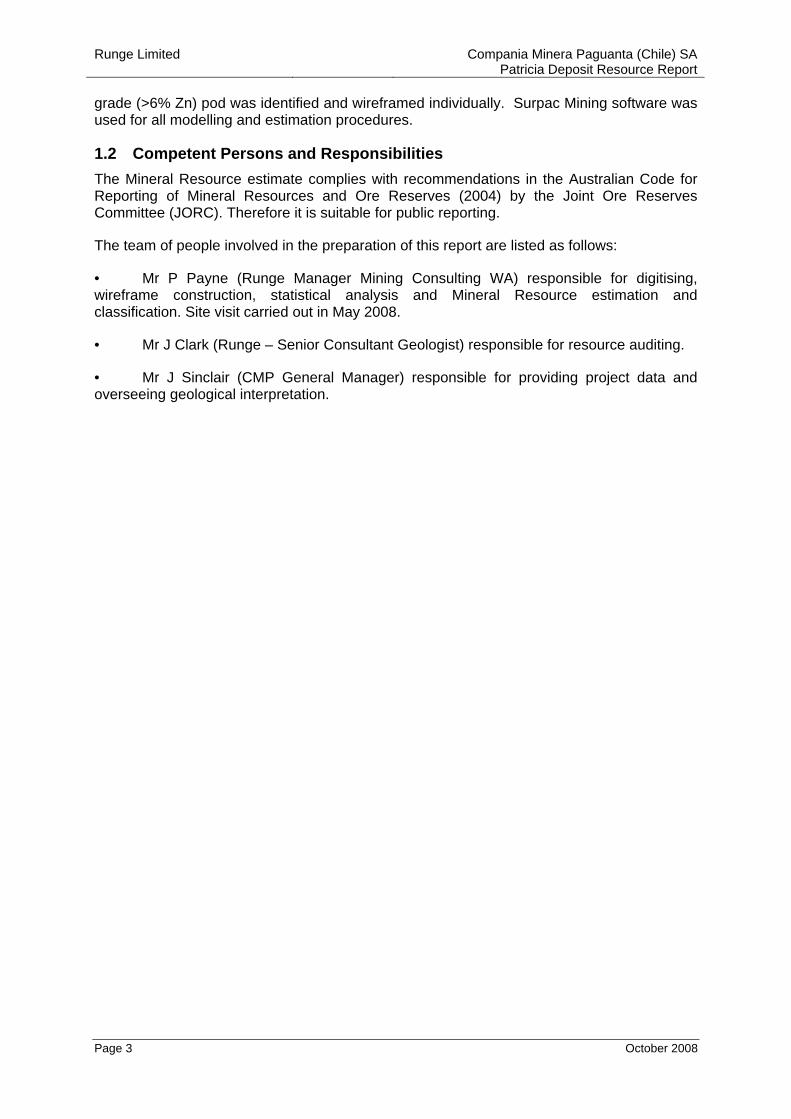
Data used for the resource estimate was provided by CMP and included various Excel spreadsheets and a surface topographic DTM. This information was used in conjunction with the previous estimate carried out by ResEval. The resource limits and drilling at the project are shown in Figure 1-3.
Figure 1-3: All Drilling and Resource Wireframes
The current resource estimate was carried out in the Runge Perth office during October 2008. The resource outlines were prepared based on mineralised envelopes constructed at a nominal 1.2% Zn cut-off grade. Within the Cathedral Vein mineralised envelope, a high
Cathedral Vein
Central Vein
Camp Vein
Veta Rosada
Resource Area and Camp
Runge Limited Compania Minera Paguanta (Chile) SA Patricia Deposit Resource Report
Page 3 October 2008
grade (>6% Zn) pod was identified and wireframed individually. Surpac Mining software was used for all modelling and estimation procedures.
1.2 Competent Persons and Responsibilities The Mineral Resource estimate complies with recommendations in the Australian Code for Reporting of Mineral Resources and Ore Reserves (2004) by the Joint Ore Reserves Committee (JORC). Therefore it is suitable for public reporting.
The team of people involved in the preparation of this report are listed as follows:
• Mr P Payne (Runge Manager Mining Consulting WA) responsible for digitising, wireframe construction, statistical analysis and Mineral Resource estimation and classification. Site visit carried out in May 2008.
• Mr J Clark (Runge – Senior Consultant Geologist) responsible for resource auditing.
• Mr J Sinclair (CMP General Manager) responsible for providing project data and overseeing geological interpretation.
Runge Limited Compania Minera Paguanta (Chile) SA Patricia Deposit Resource Report
Page 4 October 2008
2 Geology and Mineralisation 2.1 Regional Geology The Paguanta Project is 120km from the coast in Region 1, northern Chile. Paguanta lies within the northern extension of the Domeyko Fault system in the Andean Cordillera. Host rocks comprise folded and faulted Mesozoic sediments and arc-related volcanics; lying unconformably on Palaeozoic quartzite basement. Tertiary aged felsic intrusions have been mapped and are spatially related to zones of alteration and mineralisation. The area is covered by thick sequences of Miocene aged tuffs.
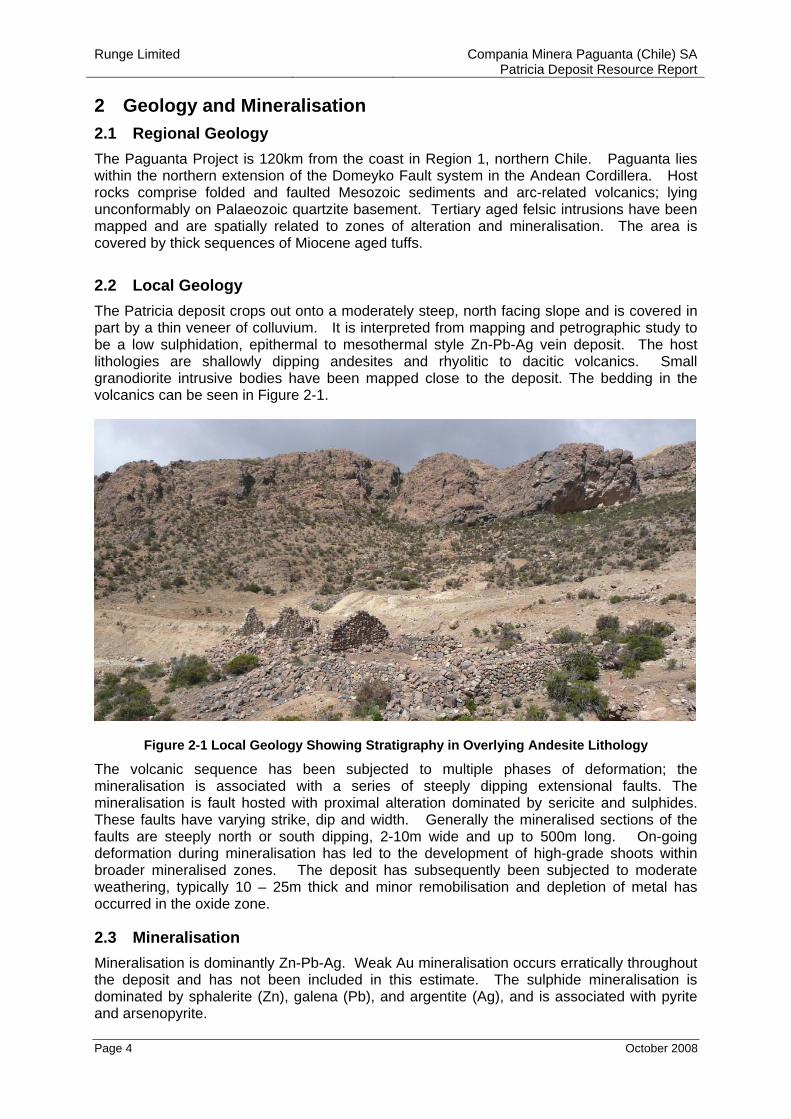
2.2 Local Geology The Patricia deposit crops out onto a moderately steep, north facing slope and is covered in part by a thin veneer of colluvium. It is interpreted from mapping and petrographic study to be a low sulphidation, epithermal to mesothermal style Zn-Pb-Ag vein deposit. The host lithologies are shallowly dipping andesites and rhyolitic to dacitic volcanics. Small granodiorite intrusive bodies have been mapped close to the deposit. The bedding in the volcanics can be seen in Figure 2-1.
Figure 2-1 Local Geology Showing Stratigraphy in Overlying Andesite Lithology
The volcanic sequence has been subjected to multiple phases of deformation; the mineralisation is associated with a series of steeply dipping extensional faults. The mineralisation is fault hosted with proximal alteration dominated by sericite and sulphides. These faults have varying strike, dip and width. Generally the mineralised sections of the faults are steeply north or south dipping, 2-10m wide and up to 500m long. On-going deformation during mineralisation has led to the development of high-grade shoots within broader mineralised zones. The deposit has subsequently been subjected to moderate weathering, typically 10 – 25m thick and minor remobilisation and depletion of metal has occurred in the oxide zone.
2.3 Mineralisation Mineralisation is dominantly Zn-Pb-Ag. Weak Au mineralisation occurs erratically throughout the deposit and has not been included in this estimate. The sulphide mineralisation is dominated by sphalerite (Zn), galena (Pb), and argentite (Ag), and is associated with pyrite and arsenopyrite.
Runge Limited Compania Minera Paguanta (Chile) SA Patricia Deposit Resource Report
Page 5 October 2008
Mineralisation style varies throughout the deposit with three domains being interpreted. Two styles of vein have been interpreted; disseminated sulphide and massive/semi massive sulphide veins. These have been domained separately within the mineralised envelopes where continuous zones have been interpreted. Limited structural information was available for the strike and dip of the veins, as only limited orientated drill core was available. However, underground exposures have been mapped and sampled and the information used to control the strike and dip of the veins in the upper part of the deposit. This increases confidence in the geological interpretation. The sampling from the workings has not been included in the estimate.
Runge Limited Compania Minera Paguanta (Chile) SA Patricia Deposit Resource Report
Page 6 October 2008
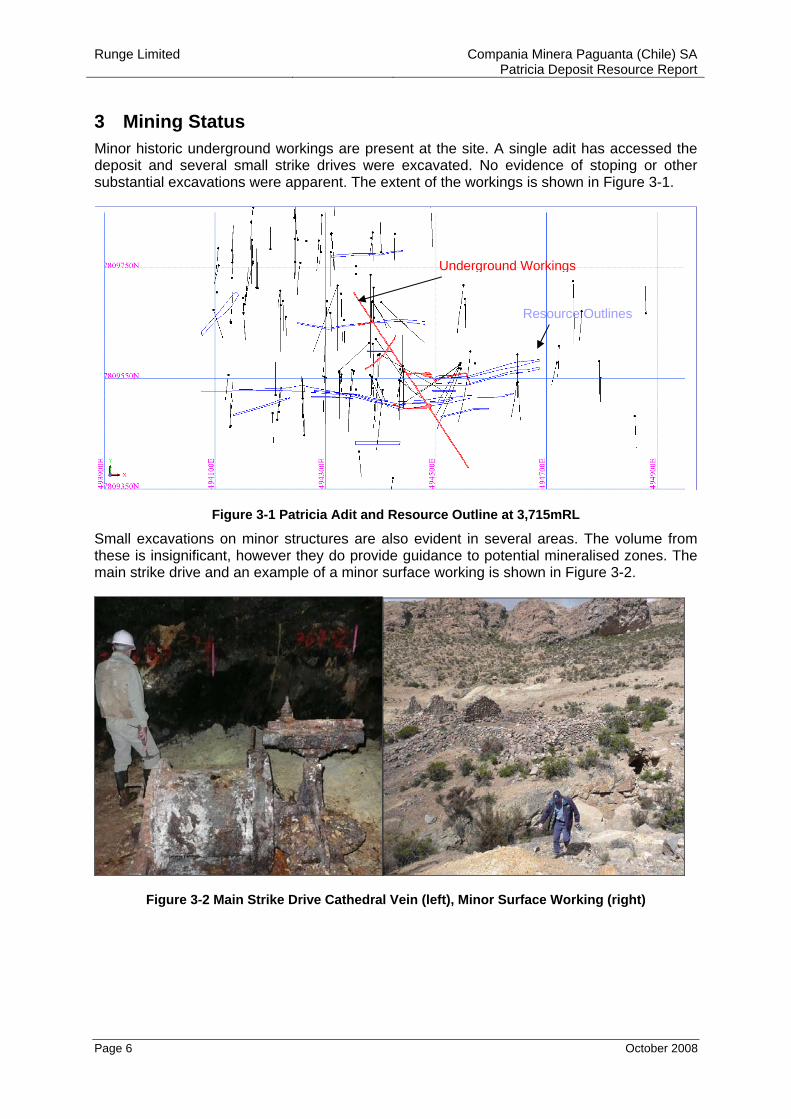
3 Mining Status Minor historic underground workings are present at the site. A single adit has accessed the deposit and several small strike drives were excavated. No evidence of stoping or other substantial excavations were apparent. The extent of the workings is shown in Figure 3-1.
Figure 3-1 Patricia Adit and Resource Outline at 3,715mRL
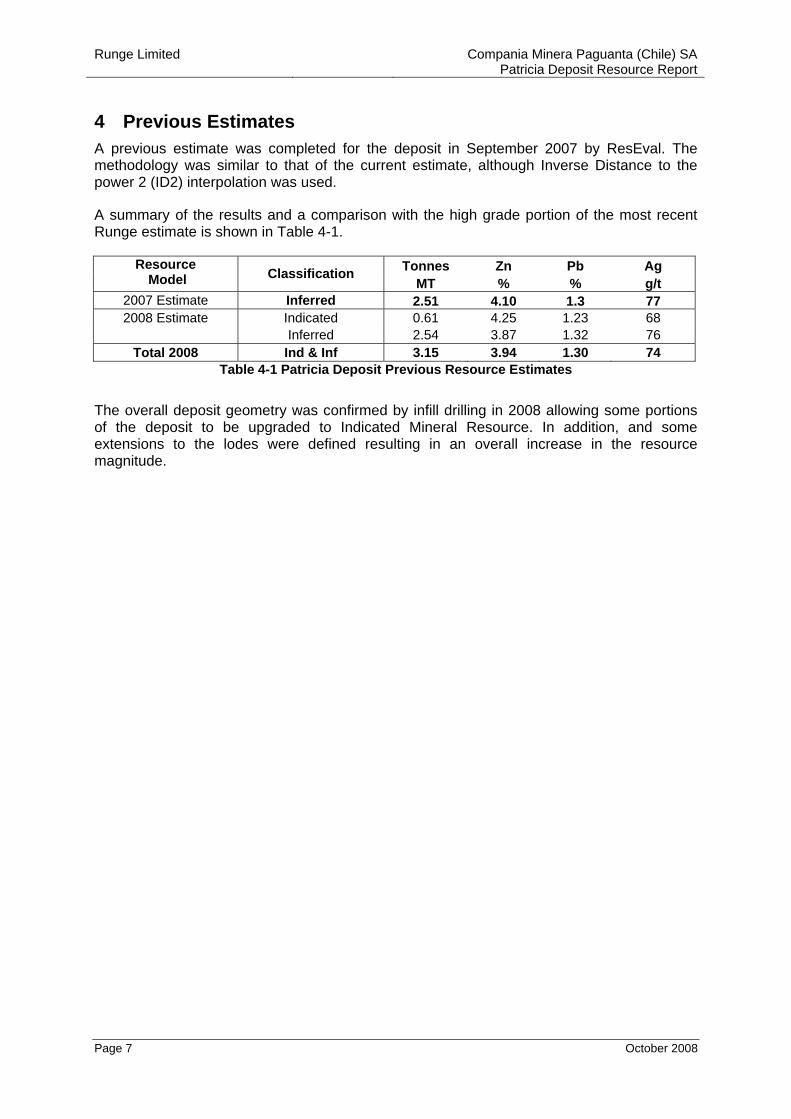
Small excavations on minor structures are also evident in several areas. The volume from these is insignificant, however they do provide guidance to potential mineralised zones. The main strike drive and an example of a minor surface working is shown in Figure 3-2.
Figure 3-2 Main Strike Drive Cathedral Vein (left), Minor Surface Working (right)
Resource Outlines
Underground Workings
Runge Limited Compania Minera Paguanta (Chile) SA Patricia Deposit Resource Report
Page 7 October 2008
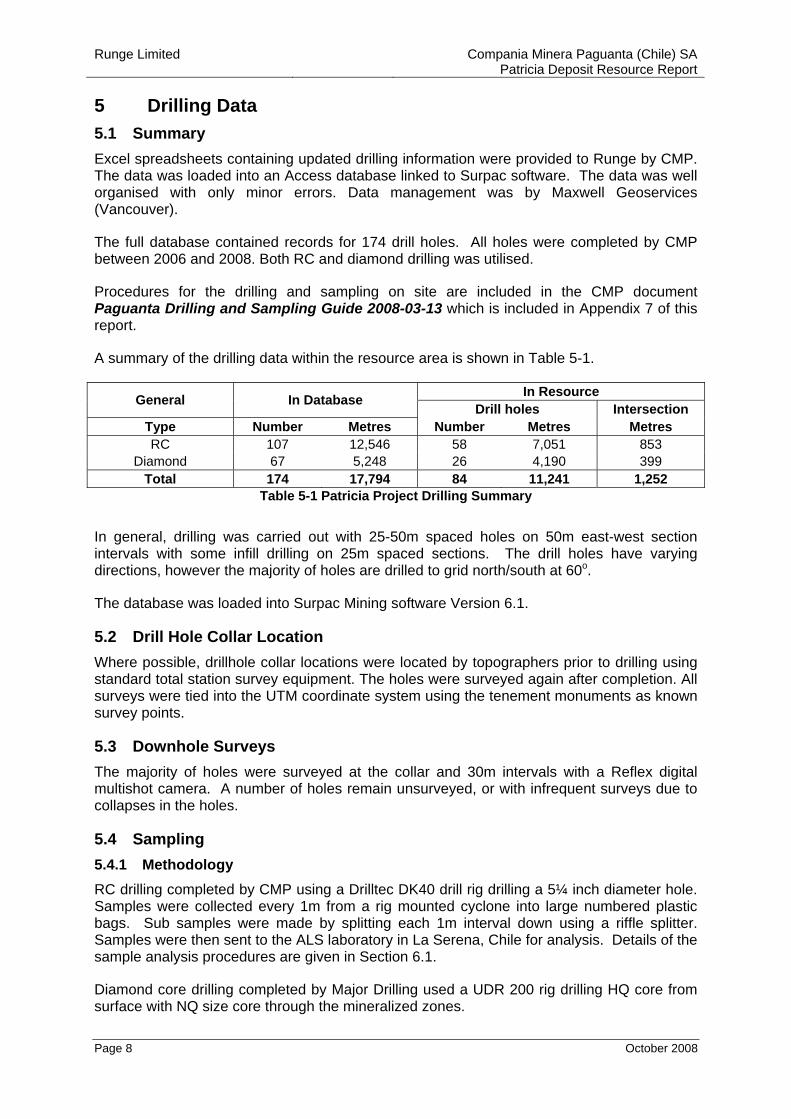
4 Previous Estimates A previous estimate was completed for the deposit in September 2007 by ResEval. The methodology was similar to that of the current estimate, although Inverse Distance to the power 2 (ID2) interpolation was used.
A summary of the results and a comparison with the high grade portion of the most recent Runge estimate is shown in Table 4-1.
Tonnes Zn Pb Ag Resource Model Classification
MT % % g/t 2007 Estimate Inferred 2.51 4.10 1.3 77 2008 Estimate Indicated 0.61 4.25 1.23 68
Inferred 2.54 3.87 1.32 76 Total 2008 Ind & Inf 3.15 3.94 1.30 74
Table 4-1 Patricia Deposit Previous Resource Estimates
The overall deposit geometry was confirmed by infill drilling in 2008 allowing some portions of the deposit to be upgraded to Indicated Mineral Resource. In addition, and some extensions to the lodes were defined resulting in an overall increase in the resource magnitude.
Runge Limited Compania Minera Paguanta (Chile) SA Patricia Deposit Resource Report
Page 8 October 2008
5 Drilling Data 5.1 Summary Excel spreadsheets containing updated drilling information were provided to Runge by CMP. The data was loaded into an Access database linked to Surpac software. The data was well organised with only minor errors. Data management was by Maxwell Geoservices (Vancouver).
The full database contained records for 174 drill holes. All holes were completed by CMP between 2006 and 2008. Both RC and diamond drilling was utilised.
Procedures for the drilling and sampling on site are included in the CMP document Paguanta Drilling and Sampling Guide 2008-03-13 which is included in Appendix 7 of this report.
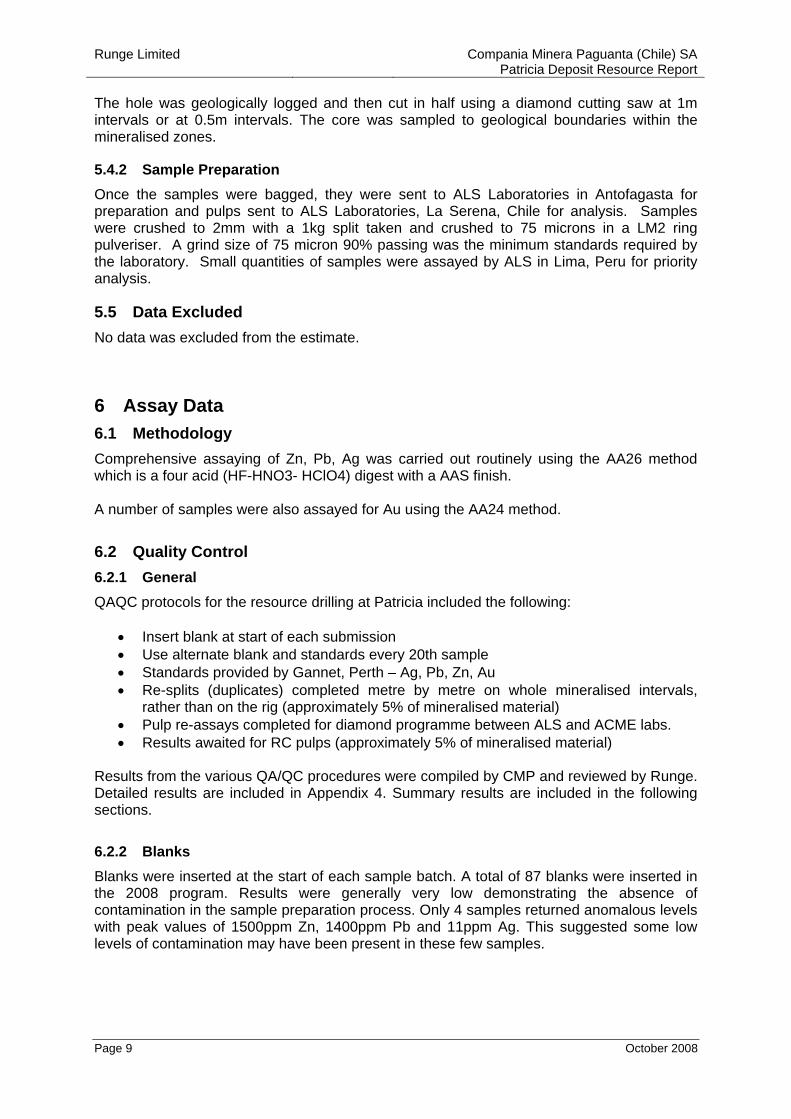
A summary of the drilling data within the resource area is shown in Table 5-1.
In Resource General In Database Drill holes Intersection Type Number Metres Number Metres Metres RC 107 12,546 58 7,051 853
Diamond 67 5,248 26 4,190 399 Total 174 17,794 84 11,241 1,252
Table 5-1 Patricia Project Drilling Summary
In general, drilling was carried out with 25-50m spaced holes on 50m east-west section intervals with some infill drilling on 25m spaced sections. The drill holes have varying directions, however the majority of holes are drilled to grid north/south at 60o.
The database was loaded into Surpac Mining software Version 6.1.
5.2 Drill Hole Collar Location Where possible, drillhole collar locations were located by topographers prior to drilling using standard total station survey equipment. The holes were surveyed again after completion. All surveys were tied into the UTM coordinate system using the tenement monuments as known survey points.
5.3 Downhole Surveys The majority of holes were surveyed at the collar and 30m intervals with a Reflex digital multishot camera. A number of holes remain unsurveyed, or with infrequent surveys due to collapses in the holes.
5.4 Sampling 5.4.1 Methodology RC drilling completed by CMP using a Drilltec DK40 drill rig drilling a 5¼ inch diameter hole. Samples were collected every 1m from a rig mounted cyclone into large numbered plastic bags. Sub samples were made by splitting each 1m interval down using a riffle splitter. Samples were then sent to the ALS laboratory in La Serena, Chile for analysis. Details of the sample analysis procedures are given in Section 6.1.
Diamond core drilling completed by Major Drilling used a UDR 200 rig drilling HQ core from surface with NQ size core through the mineralized zones.
Runge Limited Compania Minera Paguanta (Chile) SA Patricia Deposit Resource Report
Page 9 October 2008
The hole was geologically logged and then cut in half using a diamond cutting saw at 1m intervals or at 0.5m intervals. The core was sampled to geological boundaries within the mineralised zones.
5.4.2 Sample Preparation Once the samples were bagged, they were sent to ALS Laboratories in Antofagasta for preparation and pulps sent to ALS Laboratories, La Serena, Chile for analysis. Samples were crushed to 2mm with a 1kg split taken and crushed to 75 microns in a LM2 ring pulveriser. A grind size of 75 micron 90% passing was the minimum standards required by the laboratory. Small quantities of samples were assayed by ALS in Lima, Peru for priority analysis.
5.5 Data Excluded No data was excluded from the estimate.
6 Assay Data 6.1 Methodology Comprehensive assaying of Zn, Pb, Ag was carried out routinely using the AA26 method which is a four acid (HF-HNO3- HClO4) digest with a AAS finish. A number of samples were also assayed for Au using the AA24 method.
6.2 Quality Control 6.2.1 General QAQC protocols for the resource drilling at Patricia included the following:
• Insert blank at start of each submission • Use alternate blank and standards every 20th sample • Standards provided by Gannet, Perth – Ag, Pb, Zn, Au • Re-splits (duplicates) completed metre by metre on whole mineralised intervals,
rather than on the rig (approximately 5% of mineralised material) • Pulp re-assays completed for diamond programme between ALS and ACME labs. • Results awaited for RC pulps (approximately 5% of mineralised material)
Results from the various QA/QC procedures were compiled by CMP and reviewed by Runge. Detailed results are included in Appendix 4. Summary results are included in the following sections.
6.2.2 Blanks Blanks were inserted at the start of each sample batch. A total of 87 blanks were inserted in the 2008 program. Results were generally very low demonstrating the absence of contamination in the sample preparation process. Only 4 samples returned anomalous levels with peak values of 1500ppm Zn, 1400ppm Pb and 11ppm Ag. This suggested some low levels of contamination may have been present in these few samples.
Runge Limited Compania Minera Paguanta (Chile) SA Patricia Deposit Resource Report
Page 10 October 2008
6.2.3 Standards A number of commercially prepared standards were used by CMP at a ratio of one every 20 samples. They were a mix of sulphide and oxide matrices from a variety of poly-metallic projects and prepared by Geostats Pty Ltd of Perth. A tabulation of the standards and their assigned values is shown in Table 6-1.
Standard Values Standard ID Pb ppm Zn ppm Ag ppm Au ppb Number Assayed
BK 50 100 0.5 0.5 87 GBM308-12 21400 49100 82 GBM398-4 11714 5117 48.7 131 GBM995-8 25919 124300 52 93 GBM999-3 9942 482 291 184
Table 6-1 Patricia Standards
In general the standards returned values within two standard deviations of the expected value. Monitoring of results by CMP during the drilling campaign identified one batch where the standard values were outside the acceptable range and the batch was re-assayed.
The results did not suggest any problems with the quality of the assay data.
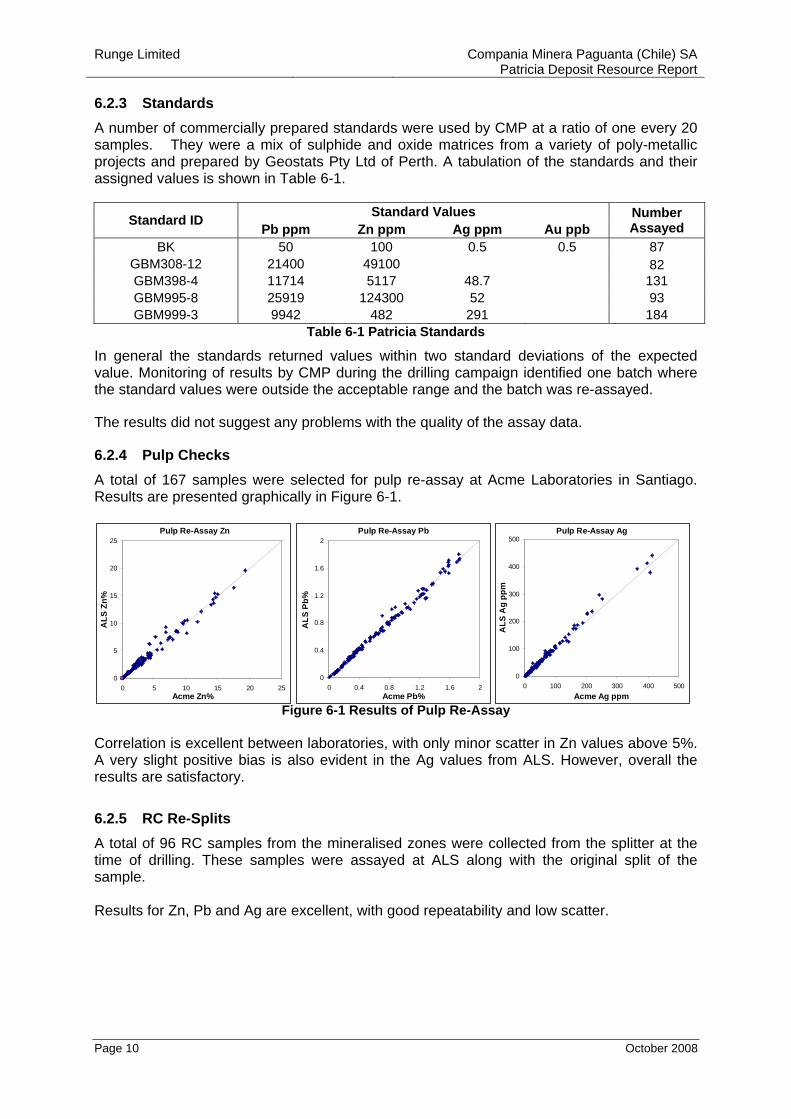
6.2.4 Pulp Checks A total of 167 samples were selected for pulp re-assay at Acme Laboratories in Santiago. Results are presented graphically in Figure 6-1.
Figure 6-1 Results of Pulp Re-Assay Correlation is excellent between laboratories, with only minor scatter in Zn values above 5%. A very slight positive bias is also evident in the Ag values from ALS. However, overall the results are satisfactory.
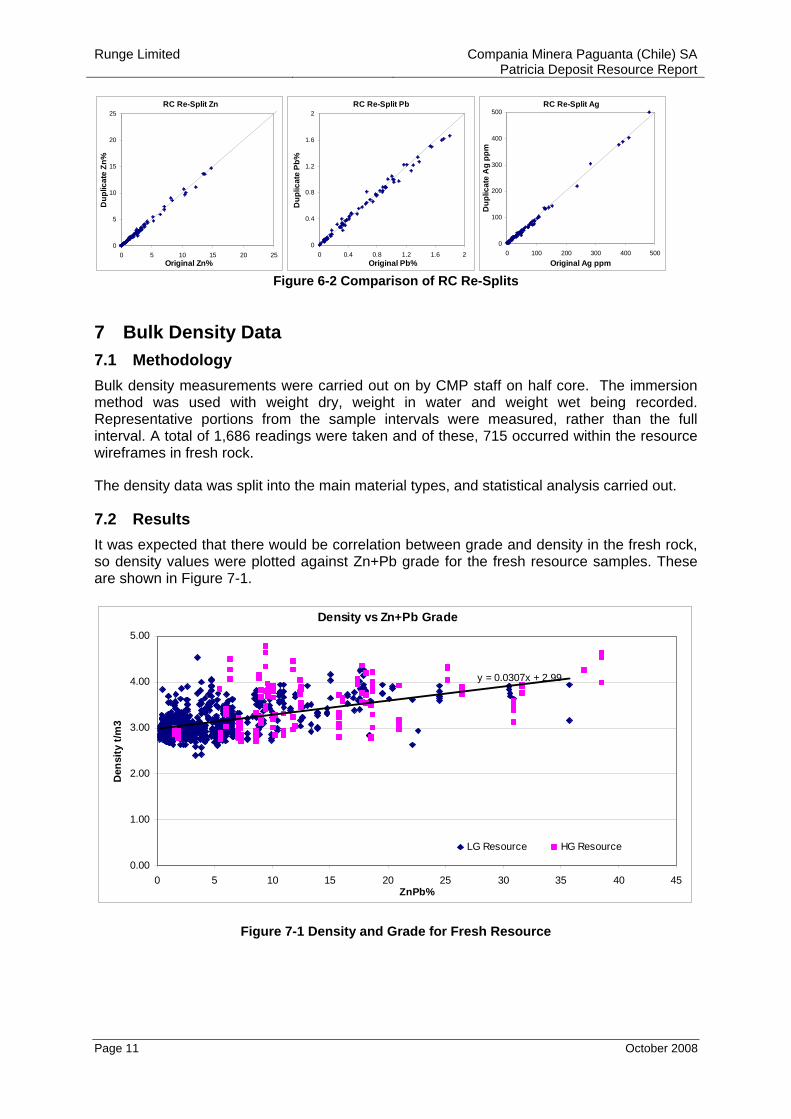
6.2.5 RC Re-Splits A total of 96 RC samples from the mineralised zones were collected from the splitter at the time of drilling. These samples were assayed at ALS along with the original split of the sample. Results for Zn, Pb and Ag are excellent, with good repeatability and low scatter.
Pulp Re-Assay Zn
0
5
10
15
20
25
0 5 10 15 20 25Acme Zn%
ALS
Zn%
Pulp Re-Assay Pb
0
0.4
0.8
1.2
1.6
2
0 0.4 0.8 1.2 1.6 2Acme Pb%
ALS
Pb%
Pulp Re-Assay Ag
0
100
200
300
400
500
0 100 200 300 400 500Acme Ag ppm
ALS
Ag
ppm
Runge Limited Compania Minera Paguanta (Chile) SA Patricia Deposit Resource Report
Page 11 October 2008
RC Re-Split Zn
0
5
10
15
20
25
0 5 10 15 20 25Original Zn%
Dup
licat
e Zn
%RC Re-Split Pb
0
0.4
0.8
1.2
1.6
2
0 0.4 0.8 1.2 1.6 2Original Pb%
Dup
licat
e Pb
%
RC Re-Split Ag
0
100
200
300
400
500
0 100 200 300 400 500Original Ag ppm
Dup
licat
e A
g pp
m
Figure 6-2 Comparison of RC Re-Splits
7 Bulk Density Data 7.1 Methodology Bulk density measurements were carried out on by CMP staff on half core. The immersion method was used with weight dry, weight in water and weight wet being recorded. Representative portions from the sample intervals were measured, rather than the full interval. A total of 1,686 readings were taken and of these, 715 occurred within the resource wireframes in fresh rock.
The density data was split into the main material types, and statistical analysis carried out.
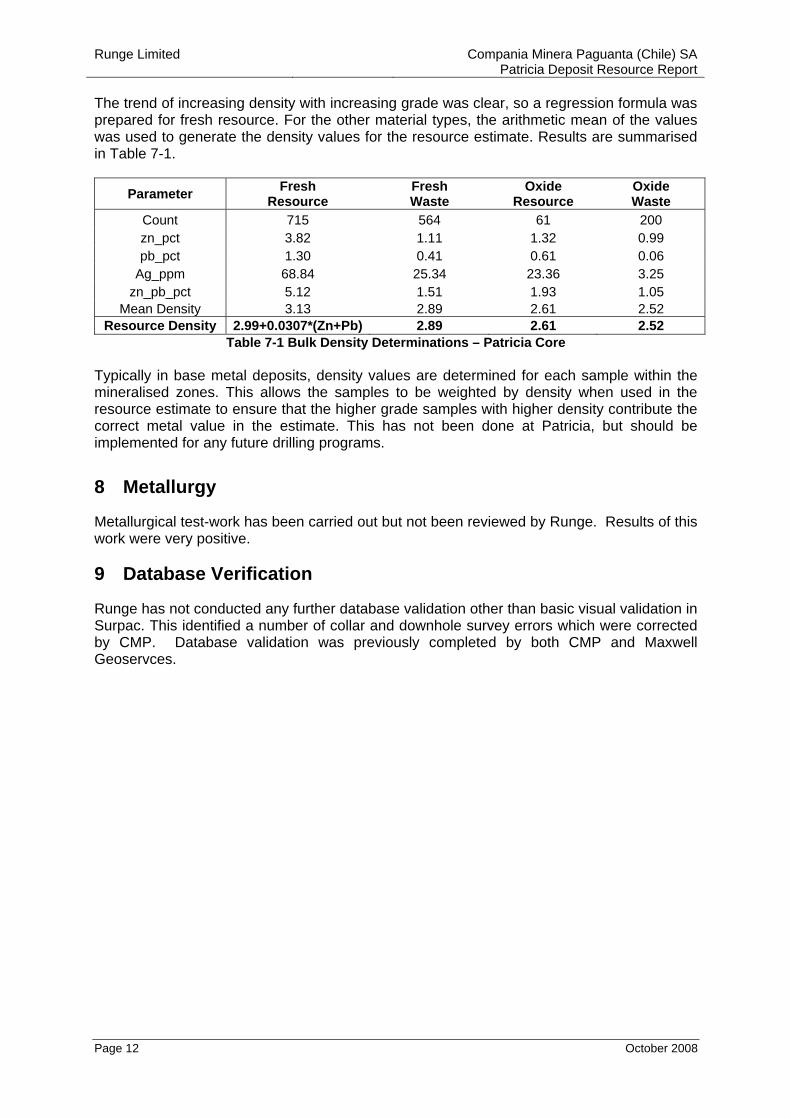
7.2 Results It was expected that there would be correlation between grade and density in the fresh rock, so density values were plotted against Zn+Pb grade for the fresh resource samples. These are shown in Figure 7-1.
Density vs Zn+Pb Grade
y = 0.0307x + 2.99
0.00
1.00
2.00
3.00
4.00
5.00
0 5 10 15 20 25 30 35 40 45ZnPb%
Den
sity
t/m
3
LG Resource HG Resource
Figure 7-1 Density and Grade for Fresh Resource
Runge Limited Compania Minera Paguanta (Chile) SA Patricia Deposit Resource Report
Page 12 October 2008
The trend of increasing density with increasing grade was clear, so a regression formula was prepared for fresh resource. For the other material types, the arithmetic mean of the values was used to generate the density values for the resource estimate. Results are summarised in Table 7-1.
Parameter Fresh Resource
Fresh Waste
Oxide Resource
Oxide Waste
Count 715 564 61 200 zn_pct 3.82 1.11 1.32 0.99 pb_pct 1.30 0.41 0.61 0.06
Ag_ppm 68.84 25.34 23.36 3.25 zn_pb_pct 5.12 1.51 1.93 1.05
Mean Density 3.13 2.89 2.61 2.52 Resource Density 2.99+0.0307*(Zn+Pb) 2.89 2.61 2.52
Table 7-1 Bulk Density Determinations – Patricia Core Typically in base metal deposits, density values are determined for each sample within the mineralised zones. This allows the samples to be weighted by density when used in the resource estimate to ensure that the higher grade samples with higher density contribute the correct metal value in the estimate. This has not been done at Patricia, but should be implemented for any future drilling programs.
8 Metallurgy
Metallurgical test-work has been carried out but not been reviewed by Runge. Results of this work were very positive.
9 Database Verification
Runge has not conducted any further database validation other than basic visual validation in Surpac. This identified a number of collar and downhole survey errors which were corrected by CMP. Database validation was previously completed by both CMP and Maxwell Geoservces.
Runge Limited Compania Minera Paguanta (Chile) SA Patricia Deposit Resource Report
Page 13 October 2008
10 Interpretation and Resource Statistics
10.1 Geology and Resource Interpretation Runge updated previous wireframes constructed for the September 2007 estimate. The resource outlines were based on mineralisation envelopes prepared using a nominal 1.2% Zn cut-off grade and a minimum downhole length of 2m. Some areas required the use of Pb and Ag anomalism to determine the mineralisation boundaries.
Within the broad 1.2% outlines of the Cathedral Vein, a zone of semi-massive sulphide occurs. This has been separately interpreted using a cutoff grade of approximately 6% Zn. It forms a zone with good continuity and is partly exposed in the old workings. The high grade and low grade zones were interpolated separately. Some zones of internal dilution were included to maintain continuity of the resource wireframes based on geological contacts.
Resource outlines were generally extrapolated to a distance of 20m from drillhole intersections, unless supported by adjacent drill holes.
A weathering profile representing the top of fresh rock was prepared by Runge based on the logged weathering codes provided in the database.
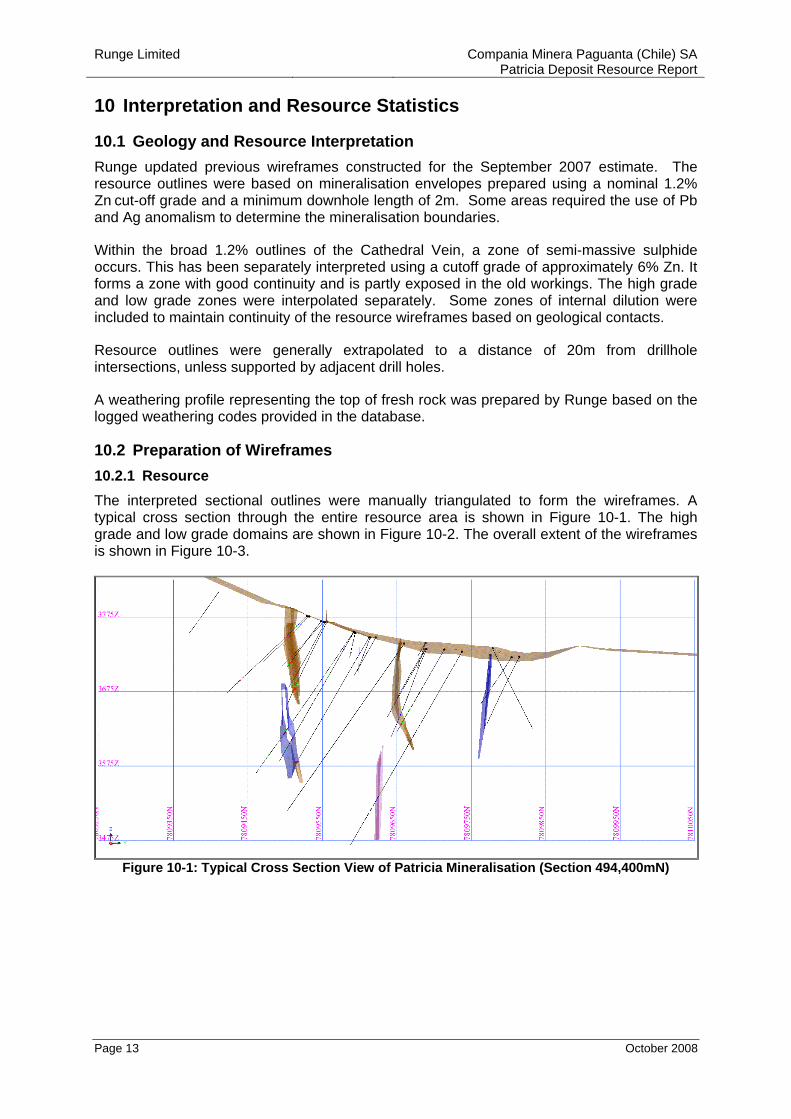
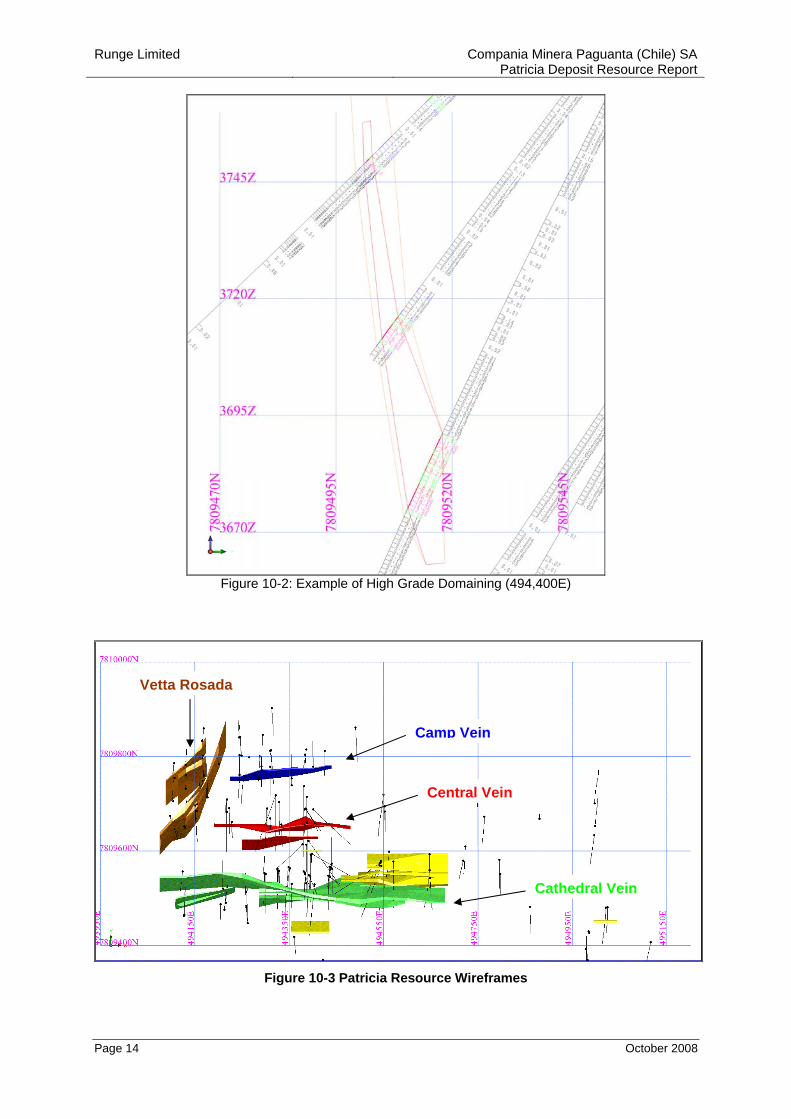
10.2 Preparation of Wireframes 10.2.1 Resource The interpreted sectional outlines were manually triangulated to form the wireframes. A typical cross section through the entire resource area is shown in Figure 10-1. The high grade and low grade domains are shown in Figure 10-2. The overall extent of the wireframes is shown in Figure 10-3.
Figure 10-1: Typical Cross Section View of Patricia Mineralisation (Section 494,400mN)
Runge Limited Compania Minera Paguanta (Chile) SA Patricia Deposit Resource Report
Page 14 October 2008
Figure 10-2: Example of High Grade Domaining (494,400E)
Figure 10-3 Patricia Resource Wireframes
Cathedral Vein
Central Vein
Camp Vein
Vetta Rosada
Runge Limited Compania Minera Paguanta (Chile) SA Patricia Deposit Resource Report
Page 15 October 2008
To form ends to the wireframes, the end section strings were copied to a position midway to the next section or to 20m and adjusted to match the dip, strike and plunge of the zone. The wireframed objects were validated using Surpac software and set as solids.
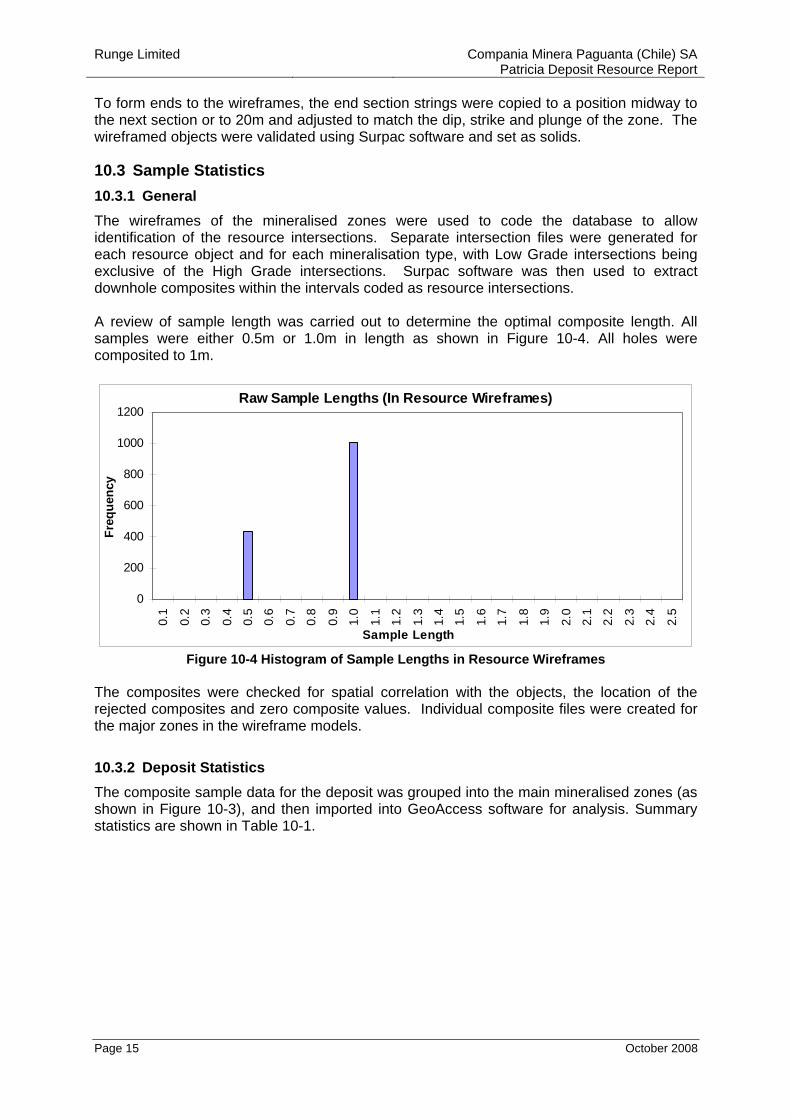
10.3 Sample Statistics 10.3.1 General The wireframes of the mineralised zones were used to code the database to allow identification of the resource intersections. Separate intersection files were generated for each resource object and for each mineralisation type, with Low Grade intersections being exclusive of the High Grade intersections. Surpac software was then used to extract downhole composites within the intervals coded as resource intersections. A review of sample length was carried out to determine the optimal composite length. All samples were either 0.5m or 1.0m in length as shown in Figure 10-4. All holes were composited to 1m.
Raw Sample Lengths (In Resource Wireframes)
0
200
400
600
800
1000
1200
0.1
0.2
0.3
0.4
0.5
0.6
0.7
0.8
0.9
1.0
1.1
1.2
1.3
1.4
1.5
1.6
1.7
1.8
1.9
2.0
2.1
2.2
2.3
2.4
2.5
Sample Length
Freq
uenc
y
Figure 10-4 Histogram of Sample Lengths in Resource Wireframes
The composites were checked for spatial correlation with the objects, the location of the rejected composites and zero composite values. Individual composite files were created for the major zones in the wireframe models.
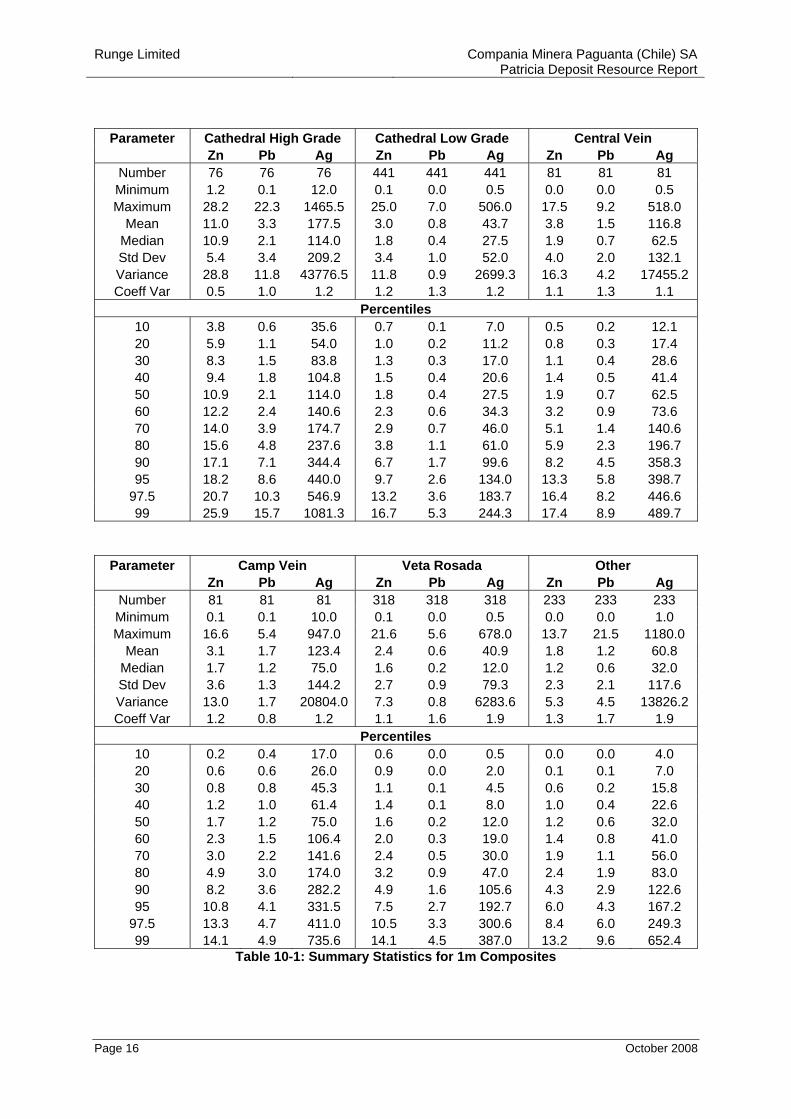
10.3.2 Deposit Statistics The composite sample data for the deposit was grouped into the main mineralised zones (as shown in Figure 10-3), and then imported into GeoAccess software for analysis. Summary statistics are shown in Table 10-1.
Runge Limited Compania Minera Paguanta (Chile) SA Patricia Deposit Resource Report
Page 16 October 2008
Parameter Cathedral High Grade Cathedral Low Grade Central Vein Zn Pb Ag Zn Pb Ag Zn Pb Ag
Number 76 76 76 441 441 441 81 81 81 Minimum 1.2 0.1 12.0 0.1 0.0 0.5 0.0 0.0 0.5 Maximum 28.2 22.3 1465.5 25.0 7.0 506.0 17.5 9.2 518.0
Mean 11.0 3.3 177.5 3.0 0.8 43.7 3.8 1.5 116.8 Median 10.9 2.1 114.0 1.8 0.4 27.5 1.9 0.7 62.5 Std Dev 5.4 3.4 209.2 3.4 1.0 52.0 4.0 2.0 132.1 Variance 28.8 11.8 43776.5 11.8 0.9 2699.3 16.3 4.2 17455.2 Coeff Var 0.5 1.0 1.2 1.2 1.3 1.2 1.1 1.3 1.1
Percentiles 10 3.8 0.6 35.6 0.7 0.1 7.0 0.5 0.2 12.1 20 5.9 1.1 54.0 1.0 0.2 11.2 0.8 0.3 17.4 30 8.3 1.5 83.8 1.3 0.3 17.0 1.1 0.4 28.6 40 9.4 1.8 104.8 1.5 0.4 20.6 1.4 0.5 41.4 50 10.9 2.1 114.0 1.8 0.4 27.5 1.9 0.7 62.5 60 12.2 2.4 140.6 2.3 0.6 34.3 3.2 0.9 73.6 70 14.0 3.9 174.7 2.9 0.7 46.0 5.1 1.4 140.6 80 15.6 4.8 237.6 3.8 1.1 61.0 5.9 2.3 196.7 90 17.1 7.1 344.4 6.7 1.7 99.6 8.2 4.5 358.3 95 18.2 8.6 440.0 9.7 2.6 134.0 13.3 5.8 398.7
97.5 20.7 10.3 546.9 13.2 3.6 183.7 16.4 8.2 446.6 99 25.9 15.7 1081.3 16.7 5.3 244.3 17.4 8.9 489.7
Parameter Camp Vein Veta Rosada Other Zn Pb Ag Zn Pb Ag Zn Pb Ag
Number 81 81 81 318 318 318 233 233 233 Minimum 0.1 0.1 10.0 0.1 0.0 0.5 0.0 0.0 1.0 Maximum 16.6 5.4 947.0 21.6 5.6 678.0 13.7 21.5 1180.0
Mean 3.1 1.7 123.4 2.4 0.6 40.9 1.8 1.2 60.8 Median 1.7 1.2 75.0 1.6 0.2 12.0 1.2 0.6 32.0 Std Dev 3.6 1.3 144.2 2.7 0.9 79.3 2.3 2.1 117.6 Variance 13.0 1.7 20804.0 7.3 0.8 6283.6 5.3 4.5 13826.2 Coeff Var 1.2 0.8 1.2 1.1 1.6 1.9 1.3 1.7 1.9
Percentiles 10 0.2 0.4 17.0 0.6 0.0 0.5 0.0 0.0 4.0 20 0.6 0.6 26.0 0.9 0.0 2.0 0.1 0.1 7.0 30 0.8 0.8 45.3 1.1 0.1 4.5 0.6 0.2 15.8 40 1.2 1.0 61.4 1.4 0.1 8.0 1.0 0.4 22.6 50 1.7 1.2 75.0 1.6 0.2 12.0 1.2 0.6 32.0 60 2.3 1.5 106.4 2.0 0.3 19.0 1.4 0.8 41.0 70 3.0 2.2 141.6 2.4 0.5 30.0 1.9 1.1 56.0 80 4.9 3.0 174.0 3.2 0.9 47.0 2.4 1.9 83.0 90 8.2 3.6 282.2 4.9 1.6 105.6 4.3 2.9 122.6 95 10.8 4.1 331.5 7.5 2.7 192.7 6.0 4.3 167.2
97.5 13.3 4.7 411.0 10.5 3.3 300.6 8.4 6.0 249.3 99 14.1 4.9 735.6 14.1 4.5 387.0 13.2 9.6 652.4
Table 10-1: Summary Statistics for 1m Composites
Runge Limited Compania Minera Paguanta (Chile) SA Patricia Deposit Resource Report
Page 17 October 2008
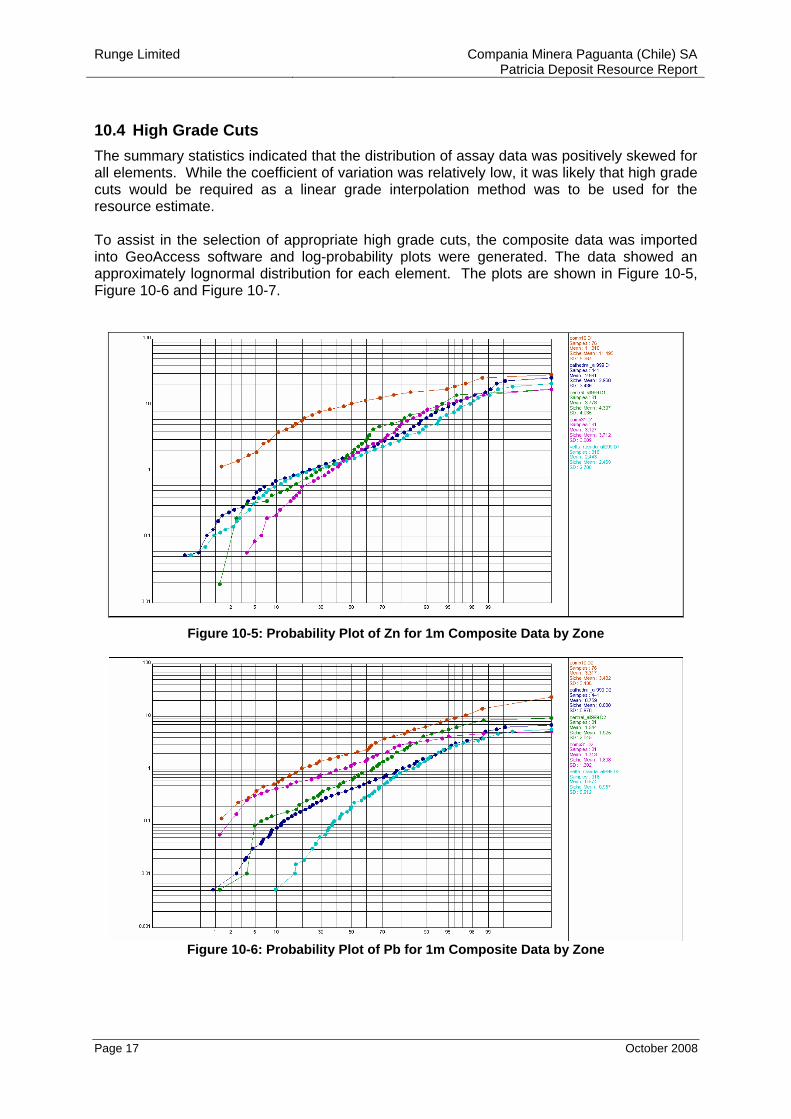
10.4 High Grade Cuts The summary statistics indicated that the distribution of assay data was positively skewed for all elements. While the coefficient of variation was relatively low, it was likely that high grade cuts would be required as a linear grade interpolation method was to be used for the resource estimate. To assist in the selection of appropriate high grade cuts, the composite data was imported into GeoAccess software and log-probability plots were generated. The data showed an approximately lognormal distribution for each element. The plots are shown in Figure 10-5, Figure 10-6 and Figure 10-7.
Figure 10-5: Probability Plot of Zn for 1m Composite Data by Zone
Figure 10-6: Probability Plot of Pb for 1m Composite Data by Zone
Runge Limited Compania Minera Paguanta (Chile) SA Patricia Deposit Resource Report
Page 18 October 2008
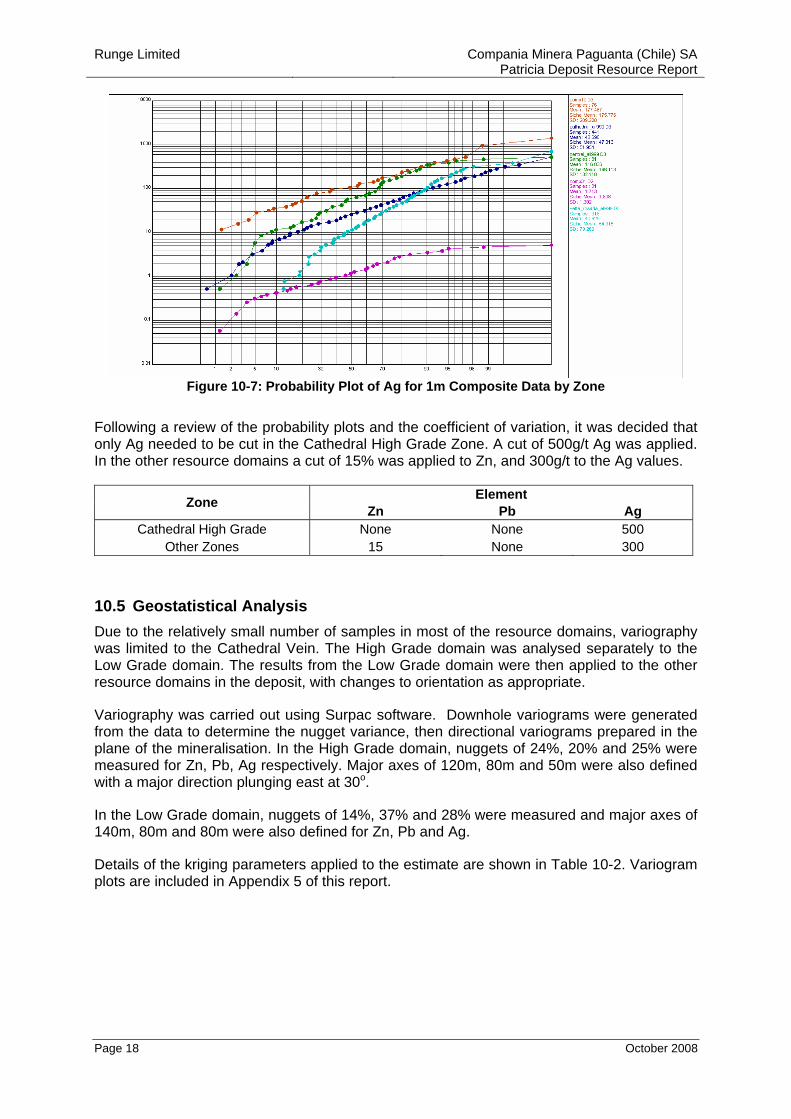
Figure 10-7: Probability Plot of Ag for 1m Composite Data by Zone
Following a review of the probability plots and the coefficient of variation, it was decided that only Ag needed to be cut in the Cathedral High Grade Zone. A cut of 500g/t Ag was applied. In the other resource domains a cut of 15% was applied to Zn, and 300g/t to the Ag values.
Element Zone Zn Pb Ag Cathedral High Grade None None 500
Other Zones 15 None 300
10.5 Geostatistical Analysis Due to the relatively small number of samples in most of the resource domains, variography was limited to the Cathedral Vein. The High Grade domain was analysed separately to the Low Grade domain. The results from the Low Grade domain were then applied to the other resource domains in the deposit, with changes to orientation as appropriate.
Variography was carried out using Surpac software. Downhole variograms were generated from the data to determine the nugget variance, then directional variograms prepared in the plane of the mineralisation. In the High Grade domain, nuggets of 24%, 20% and 25% were measured for Zn, Pb, Ag respectively. Major axes of 120m, 80m and 50m were also defined with a major direction plunging east at 30o.
In the Low Grade domain, nuggets of 14%, 37% and 28% were measured and major axes of 140m, 80m and 80m were also defined for Zn, Pb and Ag.
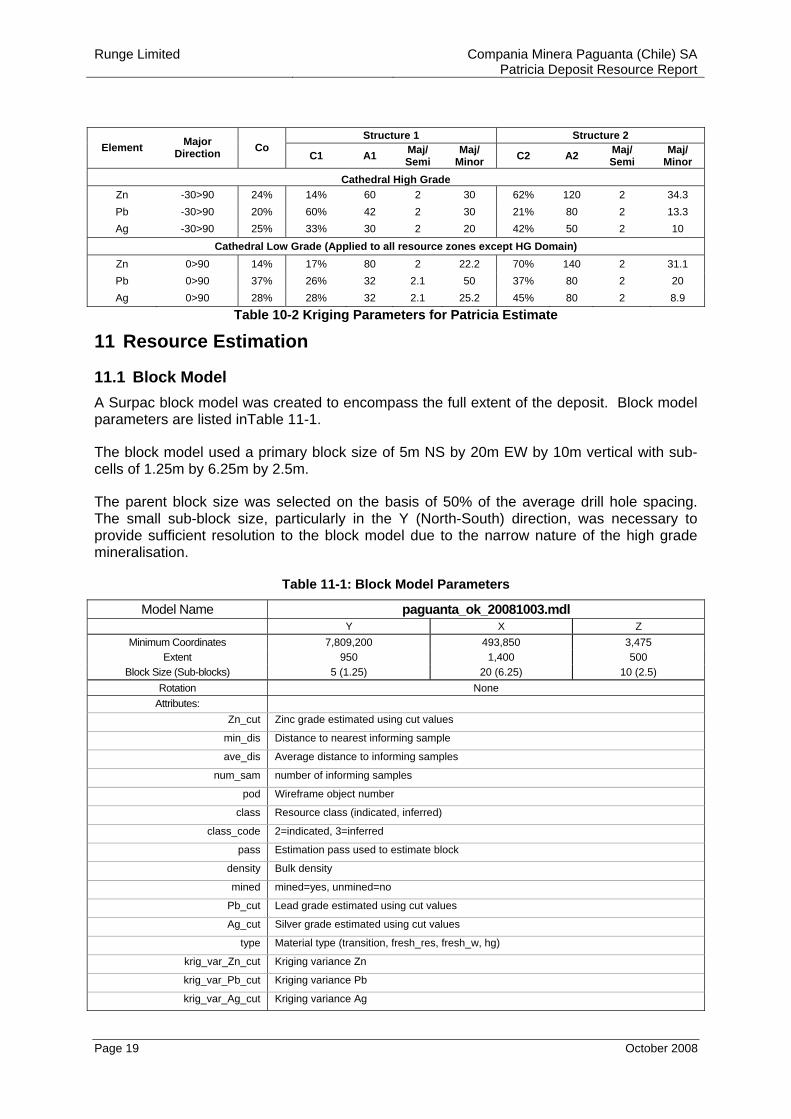
Details of the kriging parameters applied to the estimate are shown in Table 10-2. Variogram plots are included in Appendix 5 of this report.
Runge Limited Compania Minera Paguanta (Chile) SA Patricia Deposit Resource Report
Page 19 October 2008
Structure 1 Structure 2 Element Major
Direction Co C1 A1 Maj/
Semi Maj/
Minor C2 A2 Maj/ Semi
Maj/ Minor
Cathedral High Grade Zn -30>90 24% 14% 60 2 30 62% 120 2 34.3 Pb -30>90 20% 60% 42 2 30 21% 80 2 13.3 Ag -30>90 25% 33% 30 2 20 42% 50 2 10
Cathedral Low Grade (Applied to all resource zones except HG Domain) Zn 0>90 14% 17% 80 2 22.2 70% 140 2 31.1 Pb 0>90 37% 26% 32 2.1 50 37% 80 2 20 Ag 0>90 28% 28% 32 2.1 25.2 45% 80 2 8.9
Table 10-2 Kriging Parameters for Patricia Estimate
11 Resource Estimation
11.1 Block Model A Surpac block model was created to encompass the full extent of the deposit. Block model parameters are listed inTable 11-1.
The block model used a primary block size of 5m NS by 20m EW by 10m vertical with sub-cells of 1.25m by 6.25m by 2.5m.
The parent block size was selected on the basis of 50% of the average drill hole spacing. The small sub-block size, particularly in the Y (North-South) direction, was necessary to provide sufficient resolution to the block model due to the narrow nature of the high grade mineralisation.
Table 11-1: Block Model Parameters
Model Name paguanta_ok_20081003.mdl Y X Z
Minimum Coordinates 7,809,200 493,850 3,475 Extent 950 1,400 500
Block Size (Sub-blocks) 5 (1.25) 20 (6.25) 10 (2.5) Rotation None
Attributes: Zn_cut Zinc grade estimated using cut values
min_dis Distance to nearest informing sample
ave_dis Average distance to informing samples
num_sam number of informing samples
pod Wireframe object number
class Resource class (indicated, inferred)
class_code 2=indicated, 3=inferred
pass Estimation pass used to estimate block
density Bulk density
mined mined=yes, unmined=no
Pb_cut Lead grade estimated using cut values
Ag_cut Silver grade estimated using cut values
type Material type (transition, fresh_res, fresh_w, hg)
krig_var_Zn_cut Kriging variance Zn
krig_var_Pb_cut Kriging variance Pb
krig_var_Ag_cut Kriging variance Ag
Runge Limited Compania Minera Paguanta (Chile) SA Patricia Deposit Resource Report
Page 20 October 2008
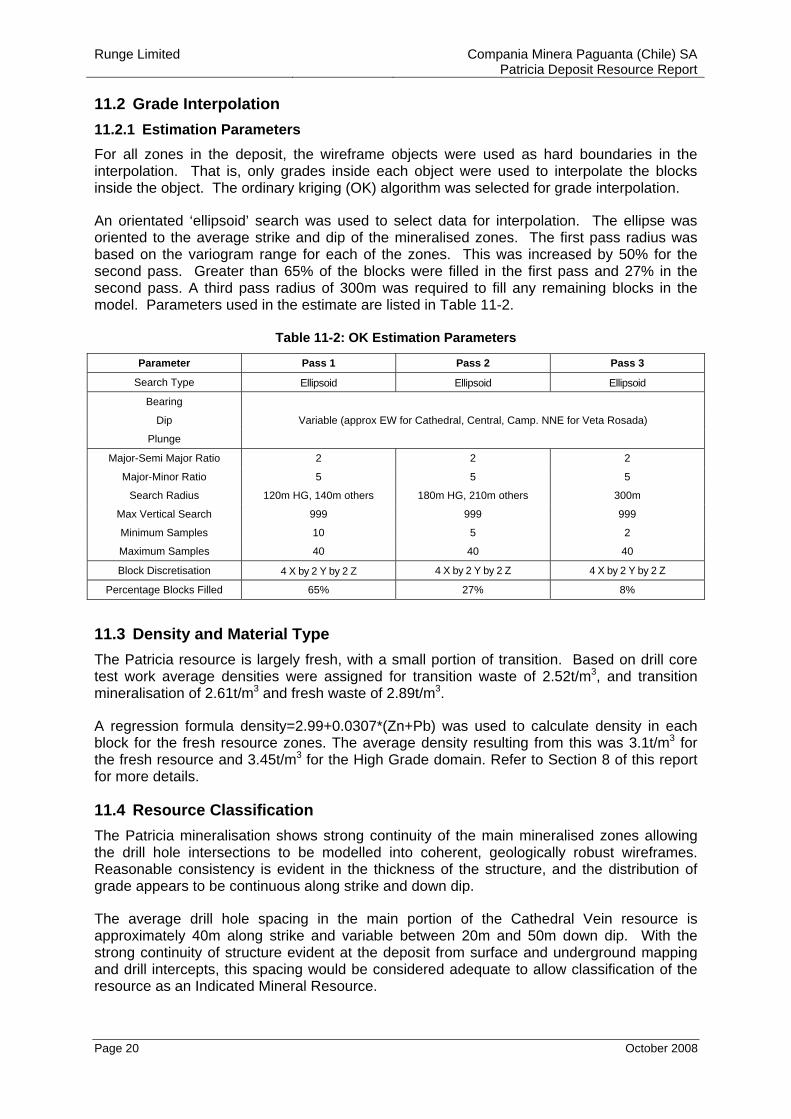
11.2 Grade Interpolation 11.2.1 Estimation Parameters For all zones in the deposit, the wireframe objects were used as hard boundaries in the interpolation. That is, only grades inside each object were used to interpolate the blocks inside the object. The ordinary kriging (OK) algorithm was selected for grade interpolation.
An orientated ‘ellipsoid’ search was used to select data for interpolation. The ellipse was oriented to the average strike and dip of the mineralised zones. The first pass radius was based on the variogram range for each of the zones. This was increased by 50% for the second pass. Greater than 65% of the blocks were filled in the first pass and 27% in the second pass. A third pass radius of 300m was required to fill any remaining blocks in the model. Parameters used in the estimate are listed in Table 11-2.
Table 11-2: OK Estimation Parameters
Parameter Pass 1 Pass 2 Pass 3
Search Type Ellipsoid Ellipsoid Ellipsoid
Bearing
Dip Variable (approx EW for Cathedral, Central, Camp. NNE for Veta Rosada)
Plunge
Major-Semi Major Ratio 2 2 2
Major-Minor Ratio 5 5 5
Search Radius 120m HG, 140m others 180m HG, 210m others 300m
Max Vertical Search 999 999 999
Minimum Samples 10 5 2
Maximum Samples 40 40 40
Block Discretisation 4 X by 2 Y by 2 Z 4 X by 2 Y by 2 Z 4 X by 2 Y by 2 Z
Percentage Blocks Filled 65% 27% 8%
11.3 Density and Material Type The Patricia resource is largely fresh, with a small portion of transition. Based on drill core test work average densities were assigned for transition waste of 2.52t/m3, and transition mineralisation of 2.61t/m3 and fresh waste of 2.89t/m3.
A regression formula density=2.99+0.0307*(Zn+Pb) was used to calculate density in each block for the fresh resource zones. The average density resulting from this was 3.1t/m3 for the fresh resource and 3.45t/m3 for the High Grade domain. Refer to Section 8 of this report for more details.
11.4 Resource Classification The Patricia mineralisation shows strong continuity of the main mineralised zones allowing the drill hole intersections to be modelled into coherent, geologically robust wireframes. Reasonable consistency is evident in the thickness of the structure, and the distribution of grade appears to be continuous along strike and down dip.
The average drill hole spacing in the main portion of the Cathedral Vein resource is approximately 40m along strike and variable between 20m and 50m down dip. With the strong continuity of structure evident at the deposit from surface and underground mapping and drill intercepts, this spacing would be considered adequate to allow classification of the resource as an Indicated Mineral Resource.
Runge Limited Compania Minera Paguanta (Chile) SA Patricia Deposit Resource Report
Page 21 October 2008
The Central Vein is partially mapped at surface and has hole spacings of 40-50m in the better drilled portion. The Veta Rosada vein has some surface mapping data and in the better drilled portion of the deposit has 20-40m spaced holes on 40m spaced sections. Each of these areas was also classified as Indicated Mineral Resource.
The portions of the deposit classified as Inferred include poorly tested areas of the main zones, small zones peripheral to the main structures which are defined by three intersections or less with no clear lateral continuity, and zones of increased complexity which require more detailed information.
The resource block model has an attribute “class” for all blocks within the resource wireframes coded as either “Ind” for Indicated or “Inf” for Inferred.
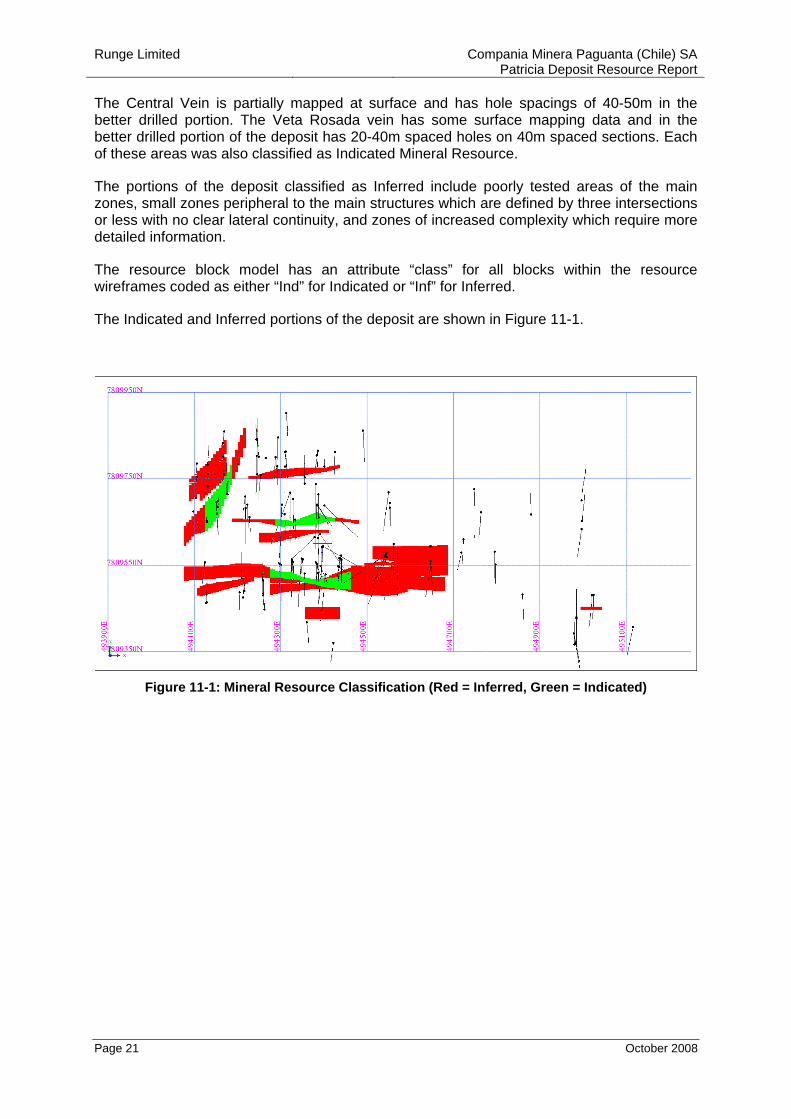
The Indicated and Inferred portions of the deposit are shown in Figure 11-1.
Figure 11-1: Mineral Resource Classification (Red = Inferred, Green = Indicated)
Runge Limited Compania Minera Paguanta (Chile) SA Patricia Deposit Resource Report
Page 22 October 2008
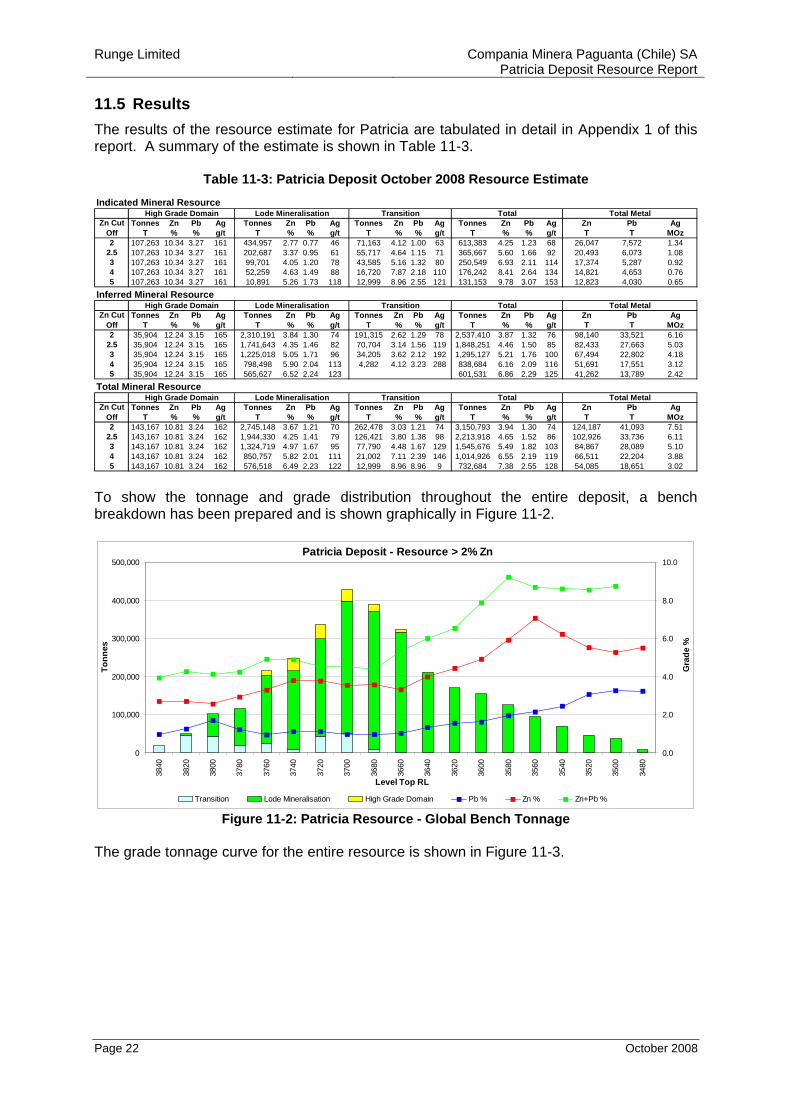
11.5 Results The results of the resource estimate for Patricia are tabulated in detail in Appendix 1 of this report. A summary of the estimate is shown in Table 11-3.
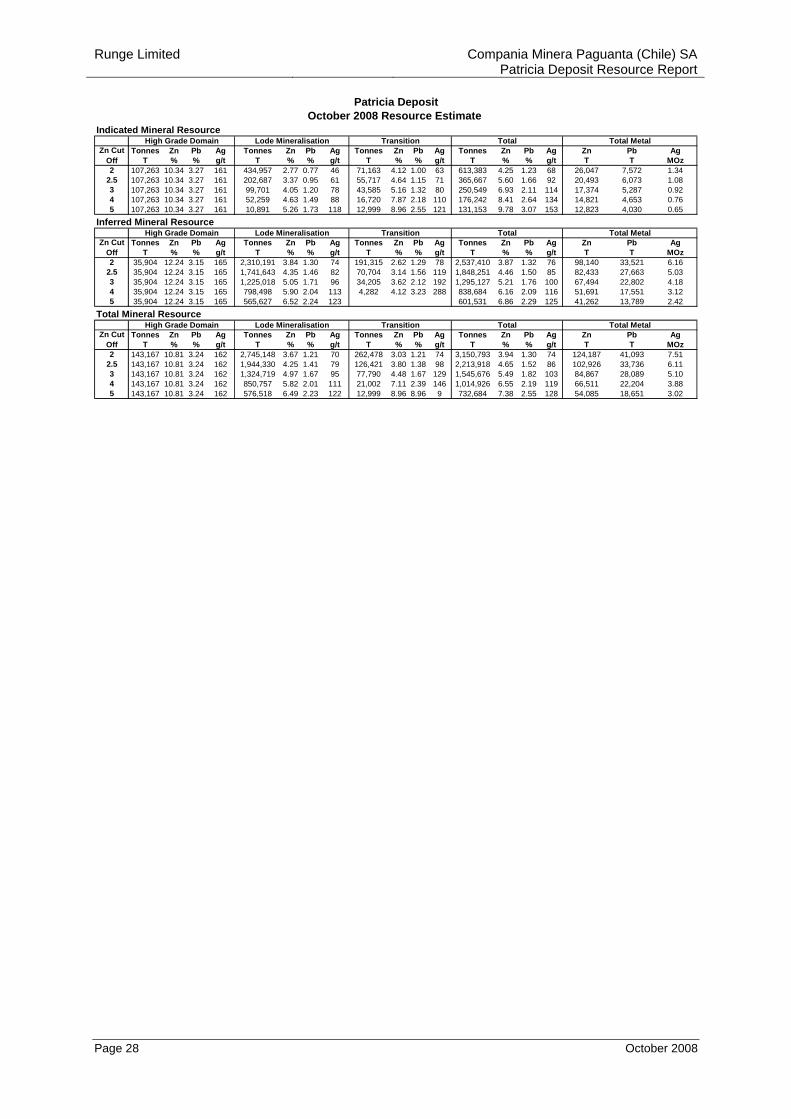
Table 11-3: Patricia Deposit October 2008 Resource Estimate Indicated Mineral Resource
Tonnes Zn Pb Ag Tonnes Zn Pb Ag Tonnes Zn Pb Ag Tonnes Zn Pb Ag Zn Pb AgT % % g/t T % % g/t T % % g/t T % % g/t T T MOz
2 107,263 10.34 3.27 161 434,957 2.77 0.77 46 71,163 4.12 1.00 63 613,383 4.25 1.23 68 26,047 7,572 1.342.5 107,263 10.34 3.27 161 202,687 3.37 0.95 61 55,717 4.64 1.15 71 365,667 5.60 1.66 92 20,493 6,073 1.083 107,263 10.34 3.27 161 99,701 4.05 1.20 78 43,585 5.16 1.32 80 250,549 6.93 2.11 114 17,374 5,287 0.924 107,263 10.34 3.27 161 52,259 4.63 1.49 88 16,720 7.87 2.18 110 176,242 8.41 2.64 134 14,821 4,653 0.765 107,263 10.34 3.27 161 10,891 5.26 1.73 118 12,999 8.96 2.55 121 131,153 9.78 3.07 153 12,823 4,030 0.65
Inferred Mineral Resource
Tonnes Zn Pb Ag Tonnes Zn Pb Ag Tonnes Zn Pb Ag Tonnes Zn Pb Ag Zn Pb AgT % % g/t T % % g/t T % % g/t T % % g/t T T MOz
2 35,904 12.24 3.15 165 2,310,191 3.84 1.30 74 191,315 2.62 1.29 78 2,537,410 3.87 1.32 76 98,140 33,521 6.162.5 35,904 12.24 3.15 165 1,741,643 4.35 1.46 82 70,704 3.14 1.56 119 1,848,251 4.46 1.50 85 82,433 27,663 5.033 35,904 12.24 3.15 165 1,225,018 5.05 1.71 96 34,205 3.62 2.12 192 1,295,127 5.21 1.76 100 67,494 22,802 4.184 35,904 12.24 3.15 165 798,498 5.90 2.04 113 4,282 4.12 3.23 288 838,684 6.16 2.09 116 51,691 17,551 3.125 35,904 12.24 3.15 165 565,627 6.52 2.24 123 601,531 6.86 2.29 125 41,262 13,789 2.42
Total Mineral Resource
Tonnes Zn Pb Ag Tonnes Zn Pb Ag Tonnes Zn Pb Ag Tonnes Zn Pb Ag Zn Pb AgT % % g/t T % % g/t T % % g/t T % % g/t T T MOz
2 143,167 10.81 3.24 162 2,745,148 3.67 1.21 70 262,478 3.03 1.21 74 3,150,793 3.94 1.30 74 124,187 41,093 7.512.5 143,167 10.81 3.24 162 1,944,330 4.25 1.41 79 126,421 3.80 1.38 98 2,213,918 4.65 1.52 86 102,926 33,736 6.113 143,167 10.81 3.24 162 1,324,719 4.97 1.67 95 77,790 4.48 1.67 129 1,545,676 5.49 1.82 103 84,867 28,089 5.104 143,167 10.81 3.24 162 850,757 5.82 2.01 111 21,002 7.11 2.39 146 1,014,926 6.55 2.19 119 66,511 22,204 3.885 143,167 10.81 3.24 162 576,518 6.49 2.23 122 12,999 8.96 8.96 9 732,684 7.38 2.55 128 54,085 18,651 3.02
Zn Cut Off
Total Total Metal
Zn Cut Off
High Grade Domain Lode Mineralisation Transition Total Total MetalZn Cut
Off
High Grade Domain Lode Mineralisation Transition
High Grade Domain Lode Mineralisation Transition Total Total Metal
To show the tonnage and grade distribution throughout the entire deposit, a bench breakdown has been prepared and is shown graphically in Figure 11-2.
Patricia Deposit - Resource > 2% Zn
0
100,000
200,000
300,000
400,000
500,000
3840
3820
3800
3780
3760
3740
3720
3700
3680
3660
3640
3620
3600
3580
3560
3540
3520
3500
3480
Level Top RL
Tonn
es
0.0
2.0
4.0
6.0
8.0
10.0
Gra
de %
Transition Lode Mineralisation High Grade Domain Pb % Zn % Zn+Pb % Figure 11-2: Patricia Resource - Global Bench Tonnage
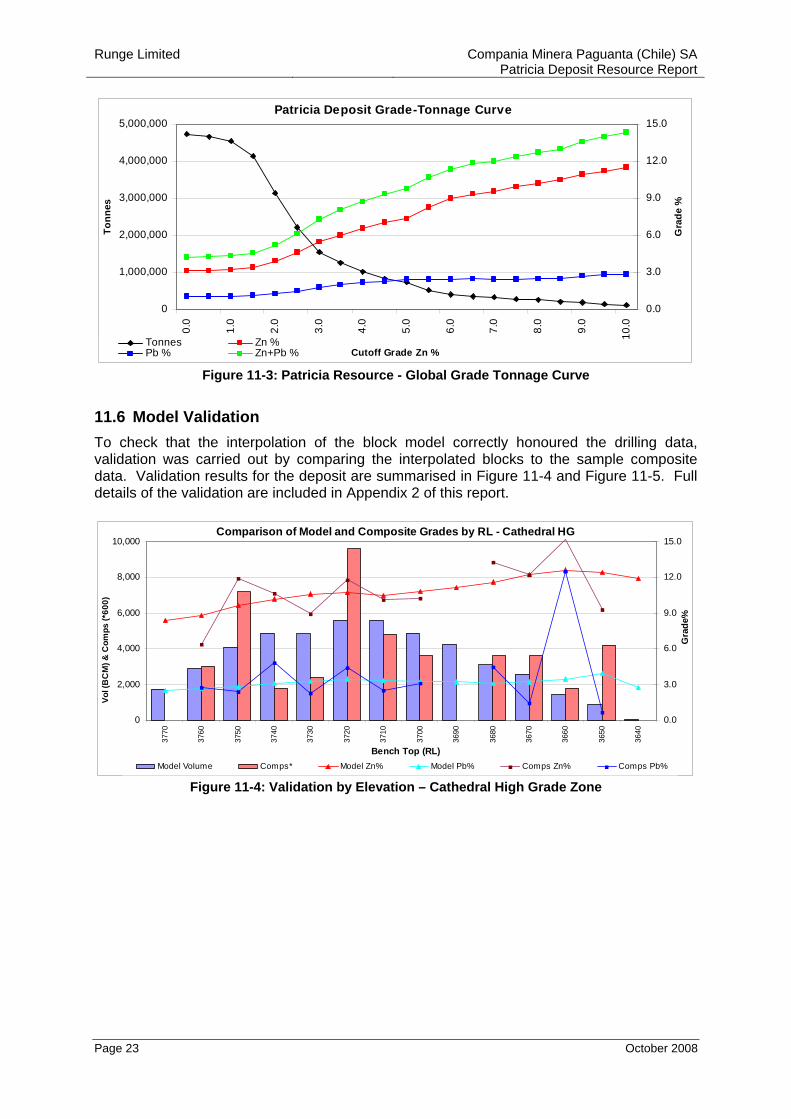
The grade tonnage curve for the entire resource is shown in Figure 11-3.
Runge Limited Compania Minera Paguanta (Chile) SA Patricia Deposit Resource Report
Page 23 October 2008
Patricia Deposit Grade-Tonnage Curve
0
1,000,000
2,000,000
3,000,000
4,000,000
5,000,000
0.0
1.0
2.0
3.0
4.0
5.0
6.0
7.0
8.0
9.0
10.0
Cutoff Grade Zn %
Tonn
es
0.0
3.0
6.0
9.0
12.0
15.0
Gra
de %
Tonnes Zn %Pb % Zn+Pb %
Figure 11-3: Patricia Resource - Global Grade Tonnage Curve
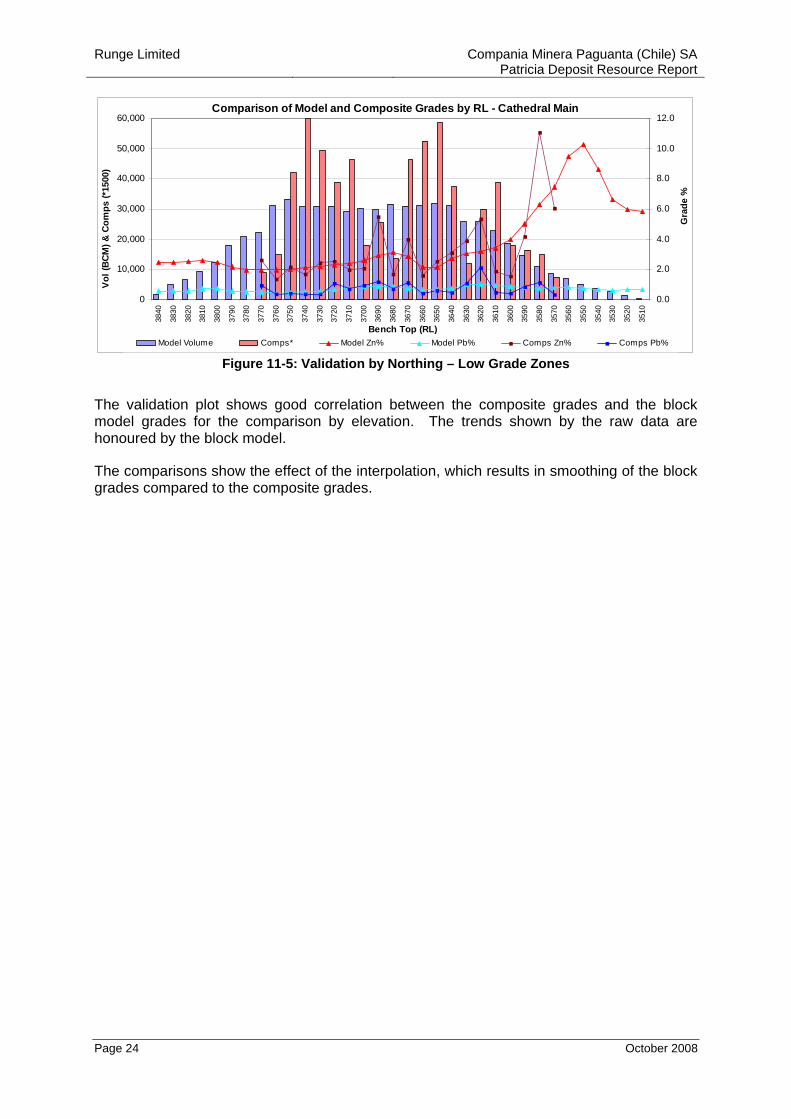
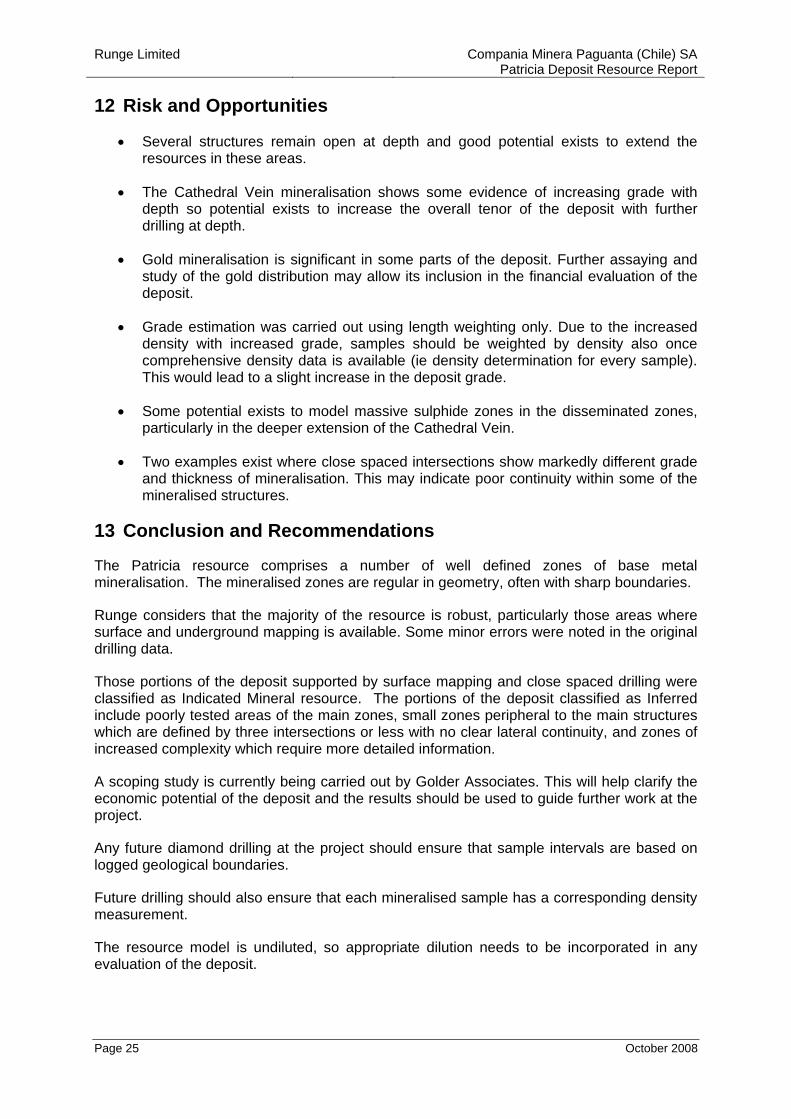
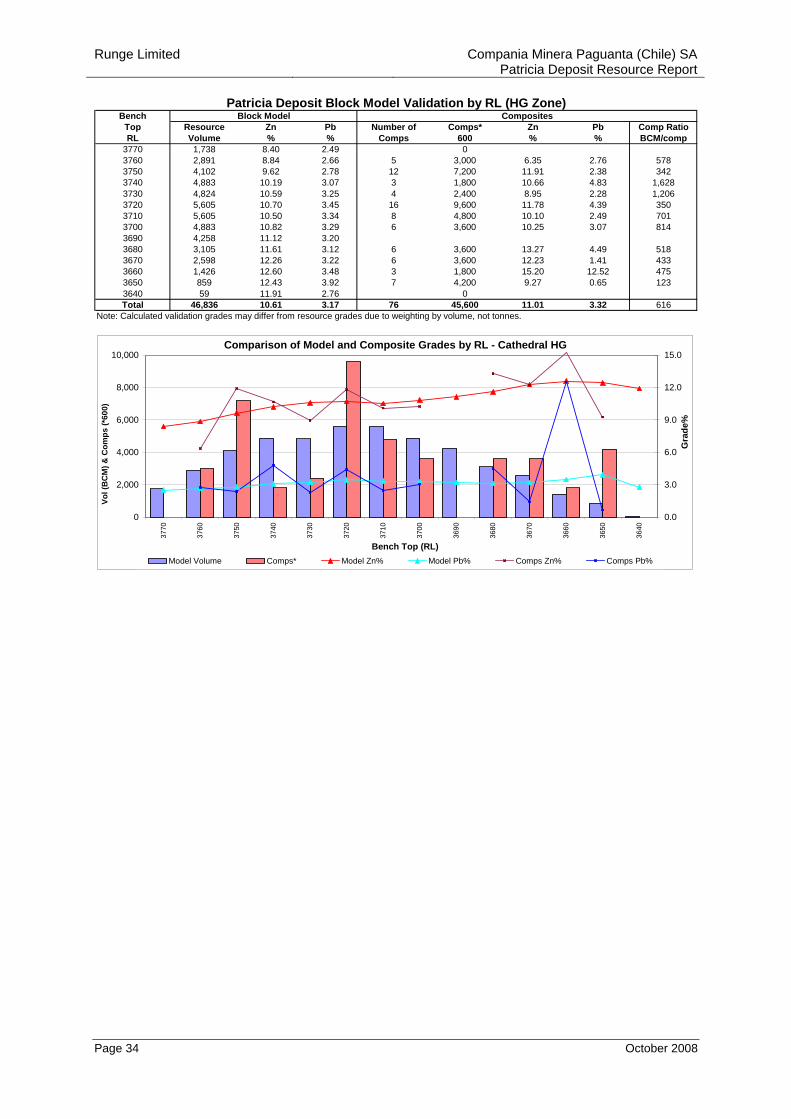
11.6 Model Validation To check that the interpolation of the block model correctly honoured the drilling data, validation was carried out by comparing the interpolated blocks to the sample composite data. Validation results for the deposit are summarised in Figure 11-4 and Figure 11-5. Full details of the validation are included in Appendix 2 of this report.
Comparison of Model and Composite Grades by RL - Cathedral HG
0
2,000
4,000
6,000
8,000
10,000
3770
3760
3750
3740
3730
3720
3710
3700
3690
3680
3670
3660
3650
3640
Bench Top (RL)
Vol (
BC
M) &
Com
ps (*
600)
0.0
3.0
6.0
9.0
12.0
15.0
Gra
de%
Model Volume Comps* Model Zn% Model Pb% Comps Zn% Comps Pb%
Figure 11-4: Validation by Elevation – Cathedral High Grade Zone
Runge Limited Compania Minera Paguanta (Chile) SA Patricia Deposit Resource Report
Page 24 October 2008
Comparison of Model and Composite Grades by RL - Cathedral Main
0
10,000
20,000
30,000
40,000
50,000
60,000
3840
3830
3820
3810
3800
3790
3780
3770
3760
3750
3740
3730
3720
3710
3700
3690
3680
3670
3660
3650
3640
3630
3620
3610
3600
3590
3580
3570
3560
3550
3540
3530
3520
3510
Bench Top (RL)
Vol
(BC
M) &
Com
ps (*
1500
)
0.0
2.0
4.0
6.0
8.0
10.0
12.0
Gra
de %
Model Volume Comps* Model Zn% Model Pb% Comps Zn% Comps Pb%
Figure 11-5: Validation by Northing – Low Grade Zones
The validation plot shows good correlation between the composite grades and the block model grades for the comparison by elevation. The trends shown by the raw data are honoured by the block model.
The comparisons show the effect of the interpolation, which results in smoothing of the block grades compared to the composite grades.
Runge Limited Compania Minera Paguanta (Chile) SA Patricia Deposit Resource Report
Page 25 October 2008
12 Risk and Opportunities
• Several structures remain open at depth and good potential exists to extend the resources in these areas.
• The Cathedral Vein mineralisation shows some evidence of increasing grade with depth so potential exists to increase the overall tenor of the deposit with further drilling at depth.
• Gold mineralisation is significant in some parts of the deposit. Further assaying and study of the gold distribution may allow its inclusion in the financial evaluation of the deposit.
• Grade estimation was carried out using length weighting only. Due to the increased density with increased grade, samples should be weighted by density also once comprehensive density data is available (ie density determination for every sample). This would lead to a slight increase in the deposit grade.
• Some potential exists to model massive sulphide zones in the disseminated zones, particularly in the deeper extension of the Cathedral Vein.
• Two examples exist where close spaced intersections show markedly different grade and thickness of mineralisation. This may indicate poor continuity within some of the mineralised structures.
13 Conclusion and Recommendations
The Patricia resource comprises a number of well defined zones of base metal mineralisation. The mineralised zones are regular in geometry, often with sharp boundaries.
Runge considers that the majority of the resource is robust, particularly those areas where surface and underground mapping is available. Some minor errors were noted in the original drilling data.
Those portions of the deposit supported by surface mapping and close spaced drilling were classified as Indicated Mineral resource. The portions of the deposit classified as Inferred include poorly tested areas of the main zones, small zones peripheral to the main structures which are defined by three intersections or less with no clear lateral continuity, and zones of increased complexity which require more detailed information.
A scoping study is currently being carried out by Golder Associates. This will help clarify the economic potential of the deposit and the results should be used to guide further work at the project.
Any future diamond drilling at the project should ensure that sample intervals are based on logged geological boundaries.
Future drilling should also ensure that each mineralised sample has a corresponding density measurement.
The resource model is undiluted, so appropriate dilution needs to be incorporated in any evaluation of the deposit.
Runge Limited Compania Minera Paguanta (Chile) SA Patricia Deposit Resource Report
Page 26 October 2008
14 References Clark, J., 2004: Mineral Resource Estimate for the Paguanta Zn-Pb-Ag Deposit, Chile. Resource Evaluations Pty Ltd report dated September 2007 for Paguanta Resources (Chile) SA.
Herencia, 2008: Paguanta Drilling and Sampling Guide 2008-03-13. Herencia Resource internal memorandum dated 13 March 2008.

Runge Limited Compania Minera Paguanta (Chile) SA Patricia Deposit Resource Report
Page 27 October 2008
Appendix 1
Patricia Deposit
October 2008 Resource Tables
Runge Limited Compania Minera Paguanta (Chile) SA Patricia Deposit Resource Report
Page 28 October 2008
Indicated Mineral Resource
Tonnes Zn Pb Ag Tonnes Zn Pb Ag Tonnes Zn Pb Ag Tonnes Zn Pb Ag Zn Pb AgT % % g/t T % % g/t T % % g/t T % % g/t T T MOz
2 107,263 10.34 3.27 161 434,957 2.77 0.77 46 71,163 4.12 1.00 63 613,383 4.25 1.23 68 26,047 7,572 1.342.5 107,263 10.34 3.27 161 202,687 3.37 0.95 61 55,717 4.64 1.15 71 365,667 5.60 1.66 92 20,493 6,073 1.083 107,263 10.34 3.27 161 99,701 4.05 1.20 78 43,585 5.16 1.32 80 250,549 6.93 2.11 114 17,374 5,287 0.924 107,263 10.34 3.27 161 52,259 4.63 1.49 88 16,720 7.87 2.18 110 176,242 8.41 2.64 134 14,821 4,653 0.765 107,263 10.34 3.27 161 10,891 5.26 1.73 118 12,999 8.96 2.55 121 131,153 9.78 3.07 153 12,823 4,030 0.65
Inferred Mineral Resource
Tonnes Zn Pb Ag Tonnes Zn Pb Ag Tonnes Zn Pb Ag Tonnes Zn Pb Ag Zn Pb AgT % % g/t T % % g/t T % % g/t T % % g/t T T MOz
2 35,904 12.24 3.15 165 2,310,191 3.84 1.30 74 191,315 2.62 1.29 78 2,537,410 3.87 1.32 76 98,140 33,521 6.162.5 35,904 12.24 3.15 165 1,741,643 4.35 1.46 82 70,704 3.14 1.56 119 1,848,251 4.46 1.50 85 82,433 27,663 5.033 35,904 12.24 3.15 165 1,225,018 5.05 1.71 96 34,205 3.62 2.12 192 1,295,127 5.21 1.76 100 67,494 22,802 4.184 35,904 12.24 3.15 165 798,498 5.90 2.04 113 4,282 4.12 3.23 288 838,684 6.16 2.09 116 51,691 17,551 3.125 35,904 12.24 3.15 165 565,627 6.52 2.24 123 601,531 6.86 2.29 125 41,262 13,789 2.42
Total Mineral Resource
Tonnes Zn Pb Ag Tonnes Zn Pb Ag Tonnes Zn Pb Ag Tonnes Zn Pb Ag Zn Pb AgT % % g/t T % % g/t T % % g/t T % % g/t T T MOz
2 143,167 10.81 3.24 162 2,745,148 3.67 1.21 70 262,478 3.03 1.21 74 3,150,793 3.94 1.30 74 124,187 41,093 7.512.5 143,167 10.81 3.24 162 1,944,330 4.25 1.41 79 126,421 3.80 1.38 98 2,213,918 4.65 1.52 86 102,926 33,736 6.113 143,167 10.81 3.24 162 1,324,719 4.97 1.67 95 77,790 4.48 1.67 129 1,545,676 5.49 1.82 103 84,867 28,089 5.104 143,167 10.81 3.24 162 850,757 5.82 2.01 111 21,002 7.11 2.39 146 1,014,926 6.55 2.19 119 66,511 22,204 3.885 143,167 10.81 3.24 162 576,518 6.49 2.23 122 12,999 8.96 8.96 9 732,684 7.38 2.55 128 54,085 18,651 3.02
Patricia DepositOctober 2008 Resource Estimate
High Grade Domain Lode Mineralisation Transition Total Total Metal
Total Total MetalZn Cut
Off
High Grade Domain Lode Mineralisation Transition
Zn Cut Off
High Grade Domain Lode Mineralisation Transition
Total Total MetalZn Cut
Off
Runge Limited Compania Minera Paguanta (Chile) SA Patricia Deposit Resource Report
Page 29 October 2008
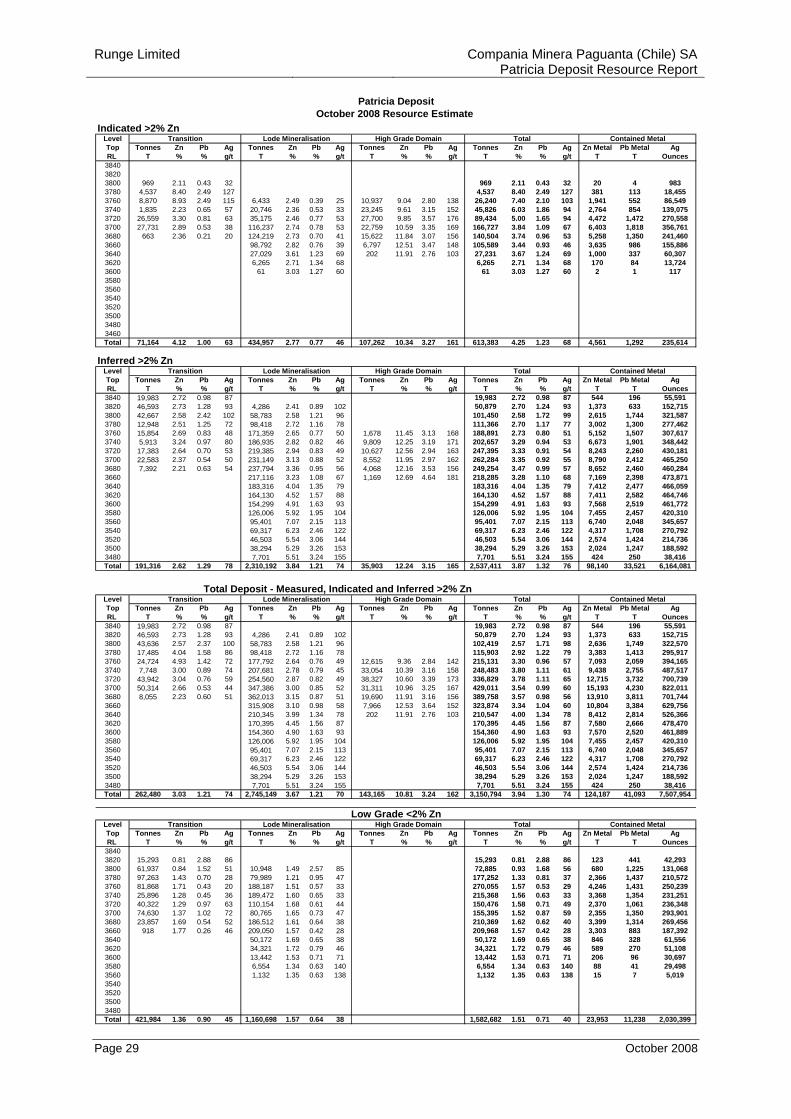
Indicated >2% ZnLevelTop Tonnes Zn Pb Ag Tonnes Zn Pb Ag Tonnes Zn Pb Ag Tonnes Zn Pb Ag Zn Metal Pb Metal AgRL T % % g/t T % % g/t T % % g/t T % % g/t T T Ounces
384038203800 969 2.11 0.43 32 969 2.11 0.43 32 20 4 9833780 4,537 8.40 2.49 127 4,537 8.40 2.49 127 381 113 18,4553760 8,870 8.93 2.49 115 6,433 2.49 0.39 25 10,937 9.04 2.80 138 26,240 7.40 2.10 103 1,941 552 86,5493740 1,835 2.23 0.65 57 20,746 2.36 0.53 33 23,245 9.61 3.15 152 45,826 6.03 1.86 94 2,764 854 139,0753720 26,559 3.30 0.81 63 35,175 2.46 0.77 53 27,700 9.85 3.57 176 89,434 5.00 1.65 94 4,472 1,472 270,5583700 27,731 2.89 0.53 38 116,237 2.74 0.78 53 22,759 10.59 3.35 169 166,727 3.84 1.09 67 6,403 1,818 356,7613680 663 2.36 0.21 20 124,219 2.73 0.70 41 15,622 11.84 3.07 156 140,504 3.74 0.96 53 5,258 1,350 241,4603660 98,792 2.82 0.76 39 6,797 12.51 3.47 148 105,589 3.44 0.93 46 3,635 986 155,8863640 27,029 3.61 1.23 69 202 11.91 2.76 103 27,231 3.67 1.24 69 1,000 337 60,3073620 6,265 2.71 1.34 68 6,265 2.71 1.34 68 170 84 13,7243600 61 3.03 1.27 60 61 3.03 1.27 60 2 1 1173580356035403520350034803460Total 71,164 4.12 1.00 63 434,957 2.77 0.77 46 107,262 10.34 3.27 161 613,383 4.25 1.23 68 4,561 1,292 235,614
Inferred >2% ZnLevelTop Tonnes Zn Pb Ag Tonnes Zn Pb Ag Tonnes Zn Pb Ag Tonnes Zn Pb Ag Zn Metal Pb Metal AgRL T % % g/t T % % g/t T % % g/t T % % g/t T T Ounces
3840 19,983 2.72 0.98 87 19,983 2.72 0.98 87 544 196 55,5913820 46,593 2.73 1.28 93 4,286 2.41 0.89 102 50,879 2.70 1.24 93 1,373 633 152,7153800 42,667 2.58 2.42 102 58,783 2.58 1.21 96 101,450 2.58 1.72 99 2,615 1,744 321,5873780 12,948 2.51 1.25 72 98,418 2.72 1.16 78 111,366 2.70 1.17 77 3,002 1,300 277,4623760 15,854 2.69 0.83 48 171,359 2.65 0.77 50 1,678 11.45 3.13 168 188,891 2.73 0.80 51 5,152 1,507 307,6173740 5,913 3.24 0.97 80 186,935 2.82 0.82 46 9,809 12.25 3.19 171 202,657 3.29 0.94 53 6,673 1,901 348,4423720 17,383 2.64 0.70 53 219,385 2.94 0.83 49 10,627 12.56 2.94 163 247,395 3.33 0.91 54 8,243 2,260 430,1813700 22,583 2.37 0.54 50 231,149 3.13 0.88 52 8,552 11.95 2.97 162 262,284 3.35 0.92 55 8,790 2,412 465,2503680 7,392 2.21 0.63 54 237,794 3.36 0.95 56 4,068 12.16 3.53 156 249,254 3.47 0.99 57 8,652 2,460 460,2843660 217,116 3.23 1.08 67 1,169 12.69 4.64 181 218,285 3.28 1.10 68 7,169 2,398 473,8713640 183,316 4.04 1.35 79 183,316 4.04 1.35 79 7,412 2,477 466,0593620 164,130 4.52 1.57 88 164,130 4.52 1.57 88 7,411 2,582 464,7463600 154,299 4.91 1.63 93 154,299 4.91 1.63 93 7,568 2,519 461,7723580 126,006 5.92 1.95 104 126,006 5.92 1.95 104 7,455 2,457 420,3103560 95,401 7.07 2.15 113 95,401 7.07 2.15 113 6,740 2,048 345,6573540 69,317 6.23 2.46 122 69,317 6.23 2.46 122 4,317 1,708 270,7923520 46,503 5.54 3.06 144 46,503 5.54 3.06 144 2,574 1,424 214,7363500 38,294 5.29 3.26 153 38,294 5.29 3.26 153 2,024 1,247 188,5923480 7,701 5.51 3.24 155 7,701 5.51 3.24 155 424 250 38,416Total 191,316 2.62 1.29 78 2,310,192 3.84 1.21 74 35,903 12.24 3.15 165 2,537,411 3.87 1.32 76 98,140 33,521 6,164,081
LevelTop Tonnes Zn Pb Ag Tonnes Zn Pb Ag Tonnes Zn Pb Ag Tonnes Zn Pb Ag Zn Metal Pb Metal AgRL T % % g/t T % % g/t T % % g/t T % % g/t T T Ounces
3840 19,983 2.72 0.98 87 19,983 2.72 0.98 87 544 196 55,5913820 46,593 2.73 1.28 93 4,286 2.41 0.89 102 50,879 2.70 1.24 93 1,373 633 152,7153800 43,636 2.57 2.37 100 58,783 2.58 1.21 96 102,419 2.57 1.71 98 2,636 1,749 322,5703780 17,485 4.04 1.58 86 98,418 2.72 1.16 78 115,903 2.92 1.22 79 3,383 1,413 295,9173760 24,724 4.93 1.42 72 177,792 2.64 0.76 49 12,615 9.36 2.84 142 215,131 3.30 0.96 57 7,093 2,059 394,1653740 7,748 3.00 0.89 74 207,681 2.78 0.79 45 33,054 10.39 3.16 158 248,483 3.80 1.11 61 9,438 2,755 487,5173720 43,942 3.04 0.76 59 254,560 2.87 0.82 49 38,327 10.60 3.39 173 336,829 3.78 1.11 65 12,715 3,732 700,7393700 50,314 2.66 0.53 44 347,386 3.00 0.85 52 31,311 10.96 3.25 167 429,011 3.54 0.99 60 15,193 4,230 822,0113680 8,055 2.23 0.60 51 362,013 3.15 0.87 51 19,690 11.91 3.16 156 389,758 3.57 0.98 56 13,910 3,811 701,7443660 315,908 3.10 0.98 58 7,966 12.53 3.64 152 323,874 3.34 1.04 60 10,804 3,384 629,7563640 210,345 3.99 1.34 78 202 11.91 2.76 103 210,547 4.00 1.34 78 8,412 2,814 526,3663620 170,395 4.45 1.56 87 170,395 4.45 1.56 87 7,580 2,666 478,4703600 154,360 4.90 1.63 93 154,360 4.90 1.63 93 7,570 2,520 461,8893580 126,006 5.92 1.95 104 126,006 5.92 1.95 104 7,455 2,457 420,3103560 95,401 7.07 2.15 113 95,401 7.07 2.15 113 6,740 2,048 345,6573540 69,317 6.23 2.46 122 69,317 6.23 2.46 122 4,317 1,708 270,7923520 46,503 5.54 3.06 144 46,503 5.54 3.06 144 2,574 1,424 214,7363500 38,294 5.29 3.26 153 38,294 5.29 3.26 153 2,024 1,247 188,5923480 7,701 5.51 3.24 155 7,701 5.51 3.24 155 424 250 38,416Total 262,480 3.03 1.21 74 2,745,149 3.67 1.21 70 143,165 10.81 3.24 162 3,150,794 3.94 1.30 74 124,187 41,093 7,507,954
LevelTop Tonnes Zn Pb Ag Tonnes Zn Pb Ag Tonnes Zn Pb Ag Tonnes Zn Pb Ag Zn Metal Pb Metal AgRL T % % g/t T % % g/t T % % g/t T % % g/t T T Ounces
38403820 15,293 0.81 2.88 86 15,293 0.81 2.88 86 123 441 42,2933800 61,937 0.84 1.52 51 10,948 1.49 2.57 85 72,885 0.93 1.68 56 680 1,225 131,0683780 97,263 1.43 0.70 28 79,989 1.21 0.95 47 177,252 1.33 0.81 37 2,366 1,437 210,5723760 81,868 1.71 0.43 20 188,187 1.51 0.57 33 270,055 1.57 0.53 29 4,246 1,431 250,2393740 25,896 1.28 0.45 36 189,472 1.60 0.65 33 215,368 1.56 0.63 33 3,368 1,354 231,2513720 40,322 1.29 0.97 63 110,154 1.68 0.61 44 150,476 1.58 0.71 49 2,370 1,061 236,3483700 74,630 1.37 1.02 72 80,765 1.65 0.73 47 155,395 1.52 0.87 59 2,355 1,350 293,9013680 23,857 1.69 0.54 52 186,512 1.61 0.64 38 210,369 1.62 0.62 40 3,399 1,314 269,4563660 918 1.77 0.26 46 209,050 1.57 0.42 28 209,968 1.57 0.42 28 3,303 883 187,3923640 50,172 1.69 0.65 38 50,172 1.69 0.65 38 846 328 61,5563620 34,321 1.72 0.79 46 34,321 1.72 0.79 46 589 270 51,1083600 13,442 1.53 0.71 71 13,442 1.53 0.71 71 206 96 30,6973580 6,554 1.34 0.63 140 6,554 1.34 0.63 140 88 41 29,4983560 1,132 1.35 0.63 138 1,132 1.35 0.63 138 15 7 5,0193540352035003480Total 421,984 1.36 0.90 45 1,160,698 1.57 0.64 38 1,582,682 1.51 0.71 40 23,953 11,238 2,030,399
Transition
Patricia DepositOctober 2008 Resource Estimate
Lode Mineralisation High Grade Domain Total
Total
Contained Metal
Contained Metal
Contained MetalHigh Grade Domain
Total Deposit - Measured, Indicated and Inferred >2% ZnHigh Grade Domain
TotalTransition
Lode MineralisationTransition
Lode Mineralisation
Contained MetalTransition High Grade DomainLow Grade <2% Zn
TotalLode Mineralisation
Runge Limited Compania Minera Paguanta (Chile) SA Patricia Deposit Resource Report
Page 30 October 2008
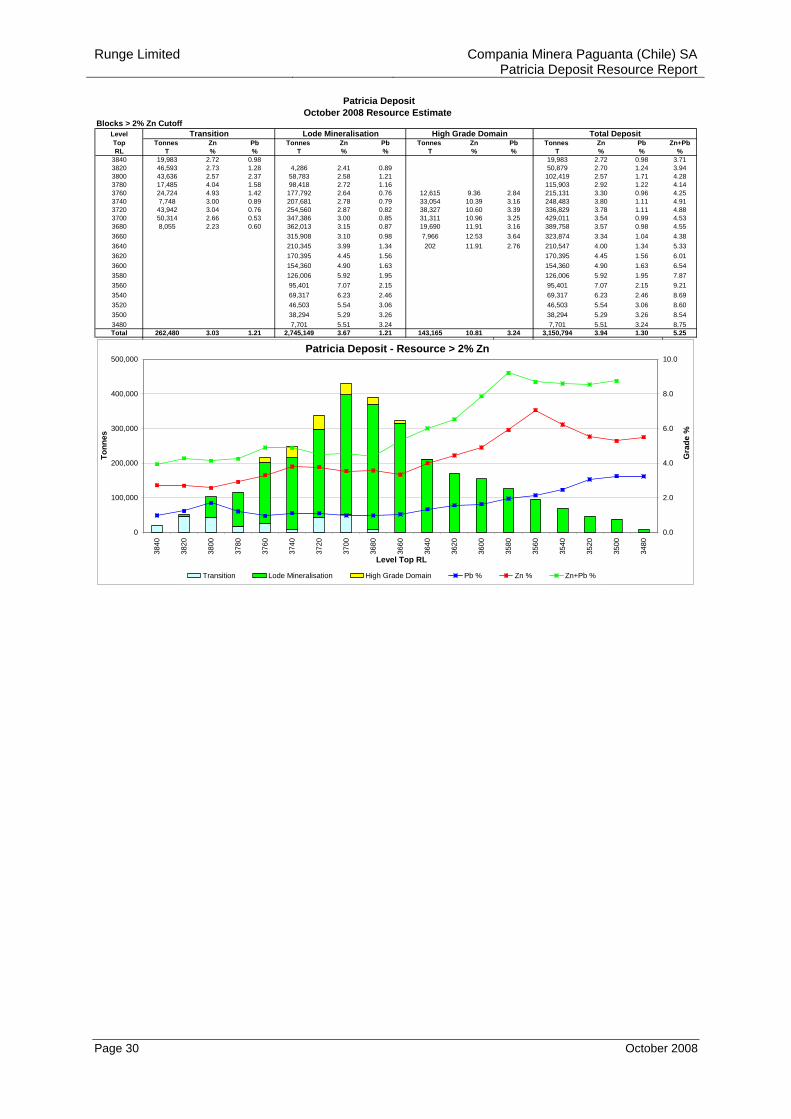
Blocks > 2% Zn CutoffLevelTop Tonnes Zn Pb Tonnes Zn Pb Tonnes Zn Pb Tonnes Zn Pb Zn+PbRL T % % T % % T % % T % % %
3840 19,983 2.72 0.98 19,983 2.72 0.98 3.713820 46,593 2.73 1.28 4,286 2.41 0.89 50,879 2.70 1.24 3.943800 43,636 2.57 2.37 58,783 2.58 1.21 102,419 2.57 1.71 4.283780 17,485 4.04 1.58 98,418 2.72 1.16 115,903 2.92 1.22 4.143760 24,724 4.93 1.42 177,792 2.64 0.76 12,615 9.36 2.84 215,131 3.30 0.96 4.253740 7,748 3.00 0.89 207,681 2.78 0.79 33,054 10.39 3.16 248,483 3.80 1.11 4.913720 43,942 3.04 0.76 254,560 2.87 0.82 38,327 10.60 3.39 336,829 3.78 1.11 4.883700 50,314 2.66 0.53 347,386 3.00 0.85 31,311 10.96 3.25 429,011 3.54 0.99 4.533680 8,055 2.23 0.60 362,013 3.15 0.87 19,690 11.91 3.16 389,758 3.57 0.98 4.553660 315,908 3.10 0.98 7,966 12.53 3.64 323,874 3.34 1.04 4.383640 210,345 3.99 1.34 202 11.91 2.76 210,547 4.00 1.34 5.333620 170,395 4.45 1.56 170,395 4.45 1.56 6.013600 154,360 4.90 1.63 154,360 4.90 1.63 6.543580 126,006 5.92 1.95 126,006 5.92 1.95 7.873560 95,401 7.07 2.15 95,401 7.07 2.15 9.213540 69,317 6.23 2.46 69,317 6.23 2.46 8.693520 46,503 5.54 3.06 46,503 5.54 3.06 8.603500 38,294 5.29 3.26 38,294 5.29 3.26 8.543480 7,701 5.51 3.24 7,701 5.51 3.24 8.75Total 262,480 3.03 1.21 2,745,149 3.67 1.21 143,165 10.81 3.24 3,150,794 3.94 1.30 5.25
Patricia DepositOctober 2008 Resource Estimate
Transition Lode Mineralisation High Grade Domain Total Deposit
Patricia Deposit - Resource > 2% Zn
0
100,000
200,000
300,000
400,000
500,000
3840
3820
3800
3780
3760
3740
3720
3700
3680
3660
3640
3620
3600
3580
3560
3540
3520
3500
3480
Level Top RL
Tonn
es
0.0
2.0
4.0
6.0
8.0
10.0
Gra
de %
Transition Lode Mineralisation High Grade Domain Pb % Zn % Zn+Pb %
Runge Limited Compania Minera Paguanta (Chile) SA Patricia Deposit Resource Report
Page 31 October 2008
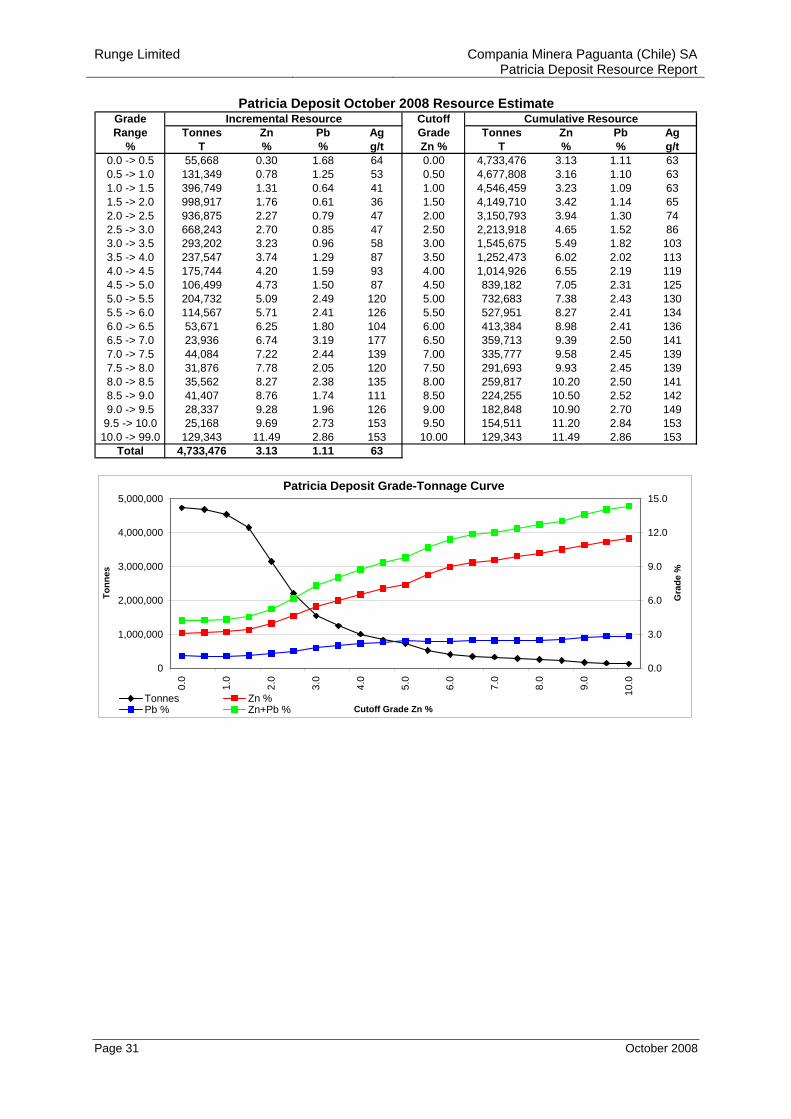
Grade CutoffRange Tonnes Zn Pb Ag Grade Tonnes Zn Pb Ag
% T % % g/t Zn % T % % g/t0.0 -> 0.5 55,668 0.30 1.68 64 0.00 4,733,476 3.13 1.11 630.5 -> 1.0 131,349 0.78 1.25 53 0.50 4,677,808 3.16 1.10 631.0 -> 1.5 396,749 1.31 0.64 41 1.00 4,546,459 3.23 1.09 631.5 -> 2.0 998,917 1.76 0.61 36 1.50 4,149,710 3.42 1.14 652.0 -> 2.5 936,875 2.27 0.79 47 2.00 3,150,793 3.94 1.30 742.5 -> 3.0 668,243 2.70 0.85 47 2.50 2,213,918 4.65 1.52 863.0 -> 3.5 293,202 3.23 0.96 58 3.00 1,545,675 5.49 1.82 1033.5 -> 4.0 237,547 3.74 1.29 87 3.50 1,252,473 6.02 2.02 1134.0 -> 4.5 175,744 4.20 1.59 93 4.00 1,014,926 6.55 2.19 1194.5 -> 5.0 106,499 4.73 1.50 87 4.50 839,182 7.05 2.31 1255.0 -> 5.5 204,732 5.09 2.49 120 5.00 732,683 7.38 2.43 1305.5 -> 6.0 114,567 5.71 2.41 126 5.50 527,951 8.27 2.41 1346.0 -> 6.5 53,671 6.25 1.80 104 6.00 413,384 8.98 2.41 1366.5 -> 7.0 23,936 6.74 3.19 177 6.50 359,713 9.39 2.50 1417.0 -> 7.5 44,084 7.22 2.44 139 7.00 335,777 9.58 2.45 1397.5 -> 8.0 31,876 7.78 2.05 120 7.50 291,693 9.93 2.45 1398.0 -> 8.5 35,562 8.27 2.38 135 8.00 259,817 10.20 2.50 1418.5 -> 9.0 41,407 8.76 1.74 111 8.50 224,255 10.50 2.52 1429.0 -> 9.5 28,337 9.28 1.96 126 9.00 182,848 10.90 2.70 149
9.5 -> 10.0 25,168 9.69 2.73 153 9.50 154,511 11.20 2.84 15310.0 -> 99.0 129,343 11.49 2.86 153 10.00 129,343 11.49 2.86 153
Total 4,733,476 3.13 1.11 63
Cumulative ResourceIncremental ResourcePatricia Deposit October 2008 Resource Estimate
Patricia Deposit Grade-Tonnage Curve
0
1,000,000
2,000,000
3,000,000
4,000,000
5,000,000
0.0
1.0
2.0
3.0
4.0
5.0
6.0
7.0
8.0
9.0
10.0
Cutoff Grade Zn %
Tonn
es
0.0
3.0
6.0
9.0
12.0
15.0
Gra
de %
Tonnes Zn %Pb % Zn+Pb %

Runge Limited Compania Minera Paguanta (Chile) SA Patricia Deposit Resource Report
Page 32 October 2008
Appendix 2
Patricia Deposit
Validation Plots
Runge Limited Compania Minera Paguanta (Chile) SA Patricia Deposit Resource Report
Page 33 October 2008
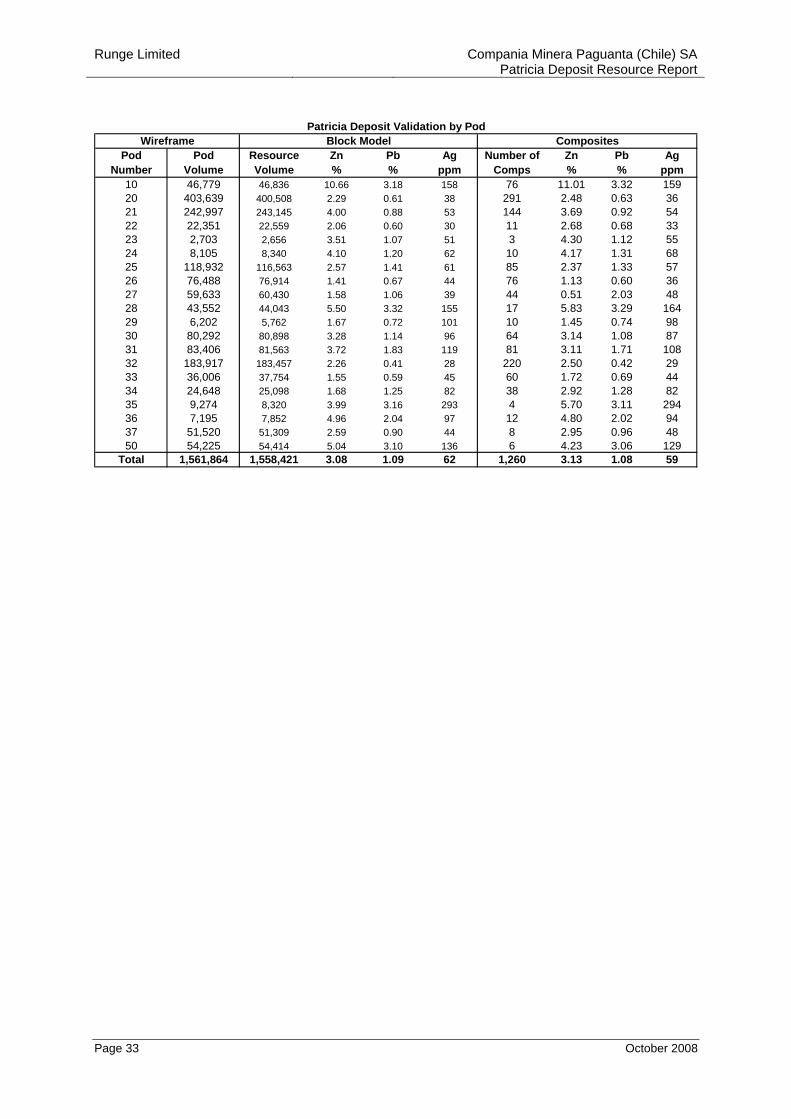
Pod Pod Resource Zn Pb Ag Number of Zn Pb AgNumber Volume Volume % % ppm Comps % % ppm
10 46,779 46,836 10.66 3.18 158 76 11.01 3.32 15920 403,639 400,508 2.29 0.61 38 291 2.48 0.63 3621 242,997 243,145 4.00 0.88 53 144 3.69 0.92 5422 22,351 22,559 2.06 0.60 30 11 2.68 0.68 3323 2,703 2,656 3.51 1.07 51 3 4.30 1.12 5524 8,105 8,340 4.10 1.20 62 10 4.17 1.31 6825 118,932 116,563 2.57 1.41 61 85 2.37 1.33 5726 76,488 76,914 1.41 0.67 44 76 1.13 0.60 3627 59,633 60,430 1.58 1.06 39 44 0.51 2.03 4828 43,552 44,043 5.50 3.32 155 17 5.83 3.29 16429 6,202 5,762 1.67 0.72 101 10 1.45 0.74 9830 80,292 80,898 3.28 1.14 96 64 3.14 1.08 8731 83,406 81,563 3.72 1.83 119 81 3.11 1.71 10832 183,917 183,457 2.26 0.41 28 220 2.50 0.42 2933 36,006 37,754 1.55 0.59 45 60 1.72 0.69 4434 24,648 25,098 1.68 1.25 82 38 2.92 1.28 8235 9,274 8,320 3.99 3.16 293 4 5.70 3.11 29436 7,195 7,852 4.96 2.04 97 12 4.80 2.02 9437 51,520 51,309 2.59 0.90 44 8 2.95 0.96 4850 54,225 54,414 5.04 3.10 136 6 4.23 3.06 129
Total 1,561,864 1,558,421 3.08 1.09 62 1,260 3.13 1.08 59
Patricia Deposit Validation by PodBlock Model CompositesWireframe
Runge Limited Compania Minera Paguanta (Chile) SA Patricia Deposit Resource Report
Page 34 October 2008
BenchTop Resource Zn Pb Number of Comps* Zn Pb Comp RatioRL Volume % % Comps 600 % % BCM/comp
3770 1,738 8.40 2.49 0 3760 2,891 8.84 2.66 5 3,000 6.35 2.76 5783750 4,102 9.62 2.78 12 7,200 11.91 2.38 3423740 4,883 10.19 3.07 3 1,800 10.66 4.83 1,6283730 4,824 10.59 3.25 4 2,400 8.95 2.28 1,2063720 5,605 10.70 3.45 16 9,600 11.78 4.39 3503710 5,605 10.50 3.34 8 4,800 10.10 2.49 7013700 4,883 10.82 3.29 6 3,600 10.25 3.07 8143690 4,258 11.12 3.20 3680 3,105 11.61 3.12 6 3,600 13.27 4.49 5183670 2,598 12.26 3.22 6 3,600 12.23 1.41 4333660 1,426 12.60 3.48 3 1,800 15.20 12.52 4753650 859 12.43 3.92 7 4,200 9.27 0.65 1233640 59 11.91 2.76 0 Total 46,836 10.61 3.17 76 45,600 11.01 3.32 616
Note: Calculated validation grades may differ from resource grades due to weighting by volume, not tonnes.
Block Model CompositesPatricia Deposit Block Model Validation by RL (HG Zone)
Comparison of Model and Composite Grades by RL - Cathedral HG
0
2,000
4,000
6,000
8,000
10,000
3770
3760
3750
3740
3730
3720
3710
3700
3690
3680
3670
3660
3650
3640
Bench Top (RL)
Vol (
BC
M) &
Com
ps (*
600)
0.0
3.0
6.0
9.0
12.0
15.0
Gra
de%
Model Volume Comps* Model Zn% Model Pb% Comps Zn% Comps Pb%
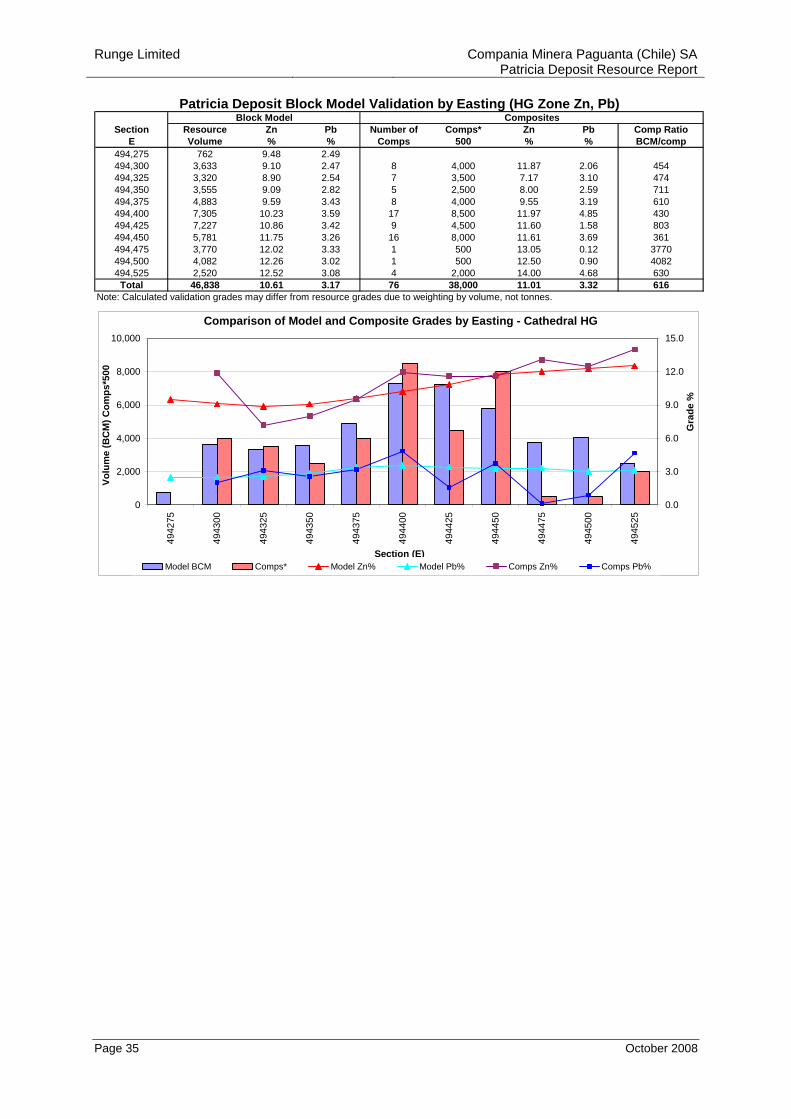
Runge Limited Compania Minera Paguanta (Chile) SA Patricia Deposit Resource Report
Page 35 October 2008
Section Resource Zn Pb Number of Comps* Zn Pb Comp RatioE Volume % % Comps 500 % % BCM/comp
494,275 762 9.48 2.49 494,300 3,633 9.10 2.47 8 4,000 11.87 2.06 454494,325 3,320 8.90 2.54 7 3,500 7.17 3.10 474494,350 3,555 9.09 2.82 5 2,500 8.00 2.59 711494,375 4,883 9.59 3.43 8 4,000 9.55 3.19 610494,400 7,305 10.23 3.59 17 8,500 11.97 4.85 430494,425 7,227 10.86 3.42 9 4,500 11.60 1.58 803494,450 5,781 11.75 3.26 16 8,000 11.61 3.69 361494,475 3,770 12.02 3.33 1 500 13.05 0.12 3770494,500 4,082 12.26 3.02 1 500 12.50 0.90 4082494,525 2,520 12.52 3.08 4 2,000 14.00 4.68 630
Total 46,838 10.61 3.17 76 38,000 11.01 3.32 616Note: Calculated validation grades may differ from resource grades due to weighting by volume, not tonnes.
Block ModelPatricia Deposit Block Model Validation by Easting (HG Zone Zn, Pb)
Composites
Comparison of Model and Composite Grades by Easting - Cathedral HG
0
2,000
4,000
6,000
8,000
10,000
4942
75
4943
00
4943
25
4943
50
4943
75
4944
00
4944
25
4944
50
4944
75
4945
00
4945
25
Section (E)
Volu
me
(BC
M) C
omps
*500
0.0
3.0
6.0
9.0
12.0
15.0
Gra
de %
Model BCM Comps* Model Zn% Model Pb% Comps Zn% Comps Pb%
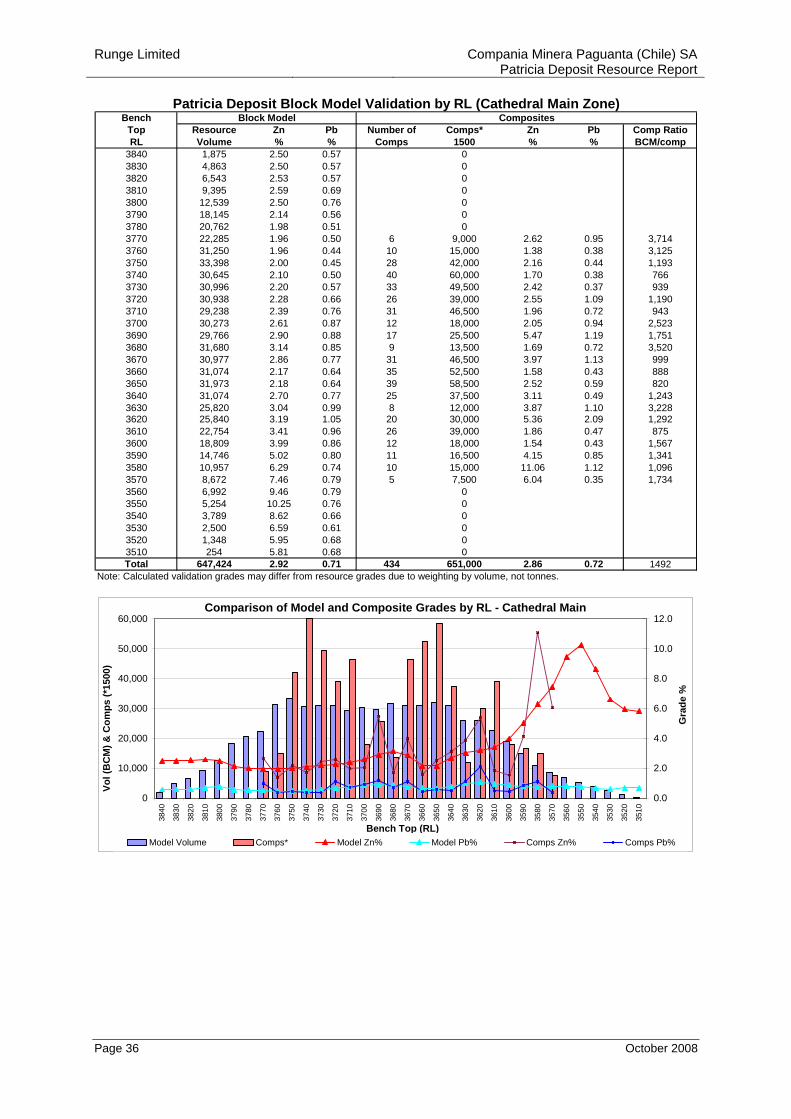
Runge Limited Compania Minera Paguanta (Chile) SA Patricia Deposit Resource Report
Page 36 October 2008
BenchTop Resource Zn Pb Number of Comps* Zn Pb Comp RatioRL Volume % % Comps 1500 % % BCM/comp
3840 1,875 2.50 0.57 0 3830 4,863 2.50 0.57 0 3820 6,543 2.53 0.57 0 3810 9,395 2.59 0.69 0 3800 12,539 2.50 0.76 0 3790 18,145 2.14 0.56 0 3780 20,762 1.98 0.51 0 3770 22,285 1.96 0.50 6 9,000 2.62 0.95 3,7143760 31,250 1.96 0.44 10 15,000 1.38 0.38 3,1253750 33,398 2.00 0.45 28 42,000 2.16 0.44 1,1933740 30,645 2.10 0.50 40 60,000 1.70 0.38 7663730 30,996 2.20 0.57 33 49,500 2.42 0.37 9393720 30,938 2.28 0.66 26 39,000 2.55 1.09 1,1903710 29,238 2.39 0.76 31 46,500 1.96 0.72 9433700 30,273 2.61 0.87 12 18,000 2.05 0.94 2,5233690 29,766 2.90 0.88 17 25,500 5.47 1.19 1,7513680 31,680 3.14 0.85 9 13,500 1.69 0.72 3,5203670 30,977 2.86 0.77 31 46,500 3.97 1.13 9993660 31,074 2.17 0.64 35 52,500 1.58 0.43 8883650 31,973 2.18 0.64 39 58,500 2.52 0.59 8203640 31,074 2.70 0.77 25 37,500 3.11 0.49 1,2433630 25,820 3.04 0.99 8 12,000 3.87 1.10 3,2283620 25,840 3.19 1.05 20 30,000 5.36 2.09 1,2923610 22,754 3.41 0.96 26 39,000 1.86 0.47 8753600 18,809 3.99 0.86 12 18,000 1.54 0.43 1,5673590 14,746 5.02 0.80 11 16,500 4.15 0.85 1,3413580 10,957 6.29 0.74 10 15,000 11.06 1.12 1,0963570 8,672 7.46 0.79 5 7,500 6.04 0.35 1,7343560 6,992 9.46 0.79 0 3550 5,254 10.25 0.76 0 3540 3,789 8.62 0.66 0 3530 2,500 6.59 0.61 0 3520 1,348 5.95 0.68 0 3510 254 5.81 0.68 0 Total 647,424 2.92 0.71 434 651,000 2.86 0.72 1492
Note: Calculated validation grades may differ from resource grades due to weighting by volume, not tonnes.
Block Model CompositesPatricia Deposit Block Model Validation by RL (Cathedral Main Zone)
Comparison of Model and Composite Grades by RL - Cathedral Main
0
10,000
20,000
30,000
40,000
50,000
60,000
3840
3830
3820
3810
3800
3790
3780
3770
3760
3750
3740
3730
3720
3710
3700
3690
3680
3670
3660
3650
3640
3630
3620
3610
3600
3590
3580
3570
3560
3550
3540
3530
3520
3510
Bench Top (RL)
Vol (
BC
M) &
Com
ps (*
1500
)
0.0
2.0
4.0
6.0
8.0
10.0
12.0
Gra
de %
Model Volume Comps* Model Zn% Model Pb% Comps Zn% Comps Pb%
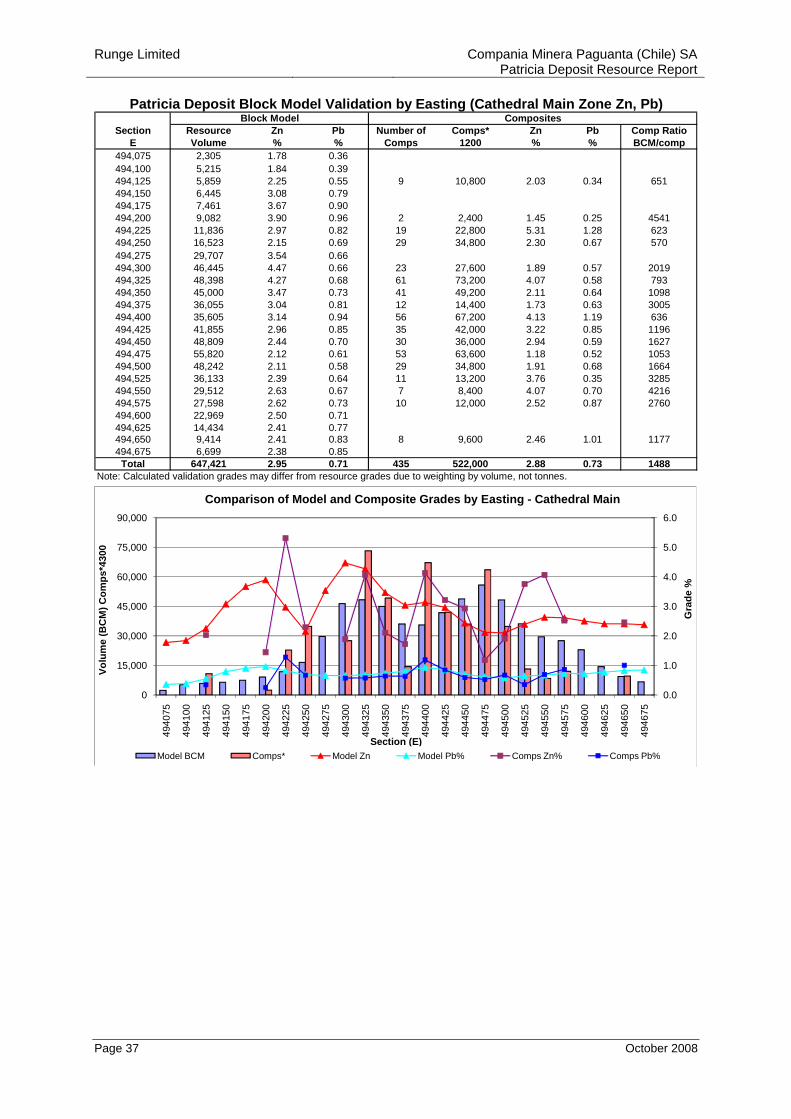
Runge Limited Compania Minera Paguanta (Chile) SA Patricia Deposit Resource Report
Page 37 October 2008
Section Resource Zn Pb Number of Comps* Zn Pb Comp RatioE Volume % % Comps 1200 % % BCM/comp
494,075 2,305 1.78 0.36494,100 5,215 1.84 0.39494,125 5,859 2.25 0.55 9 10,800 2.03 0.34 651494,150 6,445 3.08 0.79494,175 7,461 3.67 0.90494,200 9,082 3.90 0.96 2 2,400 1.45 0.25 4541494,225 11,836 2.97 0.82 19 22,800 5.31 1.28 623494,250 16,523 2.15 0.69 29 34,800 2.30 0.67 570494,275 29,707 3.54 0.66494,300 46,445 4.47 0.66 23 27,600 1.89 0.57 2019494,325 48,398 4.27 0.68 61 73,200 4.07 0.58 793494,350 45,000 3.47 0.73 41 49,200 2.11 0.64 1098494,375 36,055 3.04 0.81 12 14,400 1.73 0.63 3005494,400 35,605 3.14 0.94 56 67,200 4.13 1.19 636494,425 41,855 2.96 0.85 35 42,000 3.22 0.85 1196494,450 48,809 2.44 0.70 30 36,000 2.94 0.59 1627494,475 55,820 2.12 0.61 53 63,600 1.18 0.52 1053494,500 48,242 2.11 0.58 29 34,800 1.91 0.68 1664494,525 36,133 2.39 0.64 11 13,200 3.76 0.35 3285494,550 29,512 2.63 0.67 7 8,400 4.07 0.70 4216494,575 27,598 2.62 0.73 10 12,000 2.52 0.87 2760494,600 22,969 2.50 0.71494,625 14,434 2.41 0.77494,650 9,414 2.41 0.83 8 9,600 2.46 1.01 1177494,675 6,699 2.38 0.85
Total 647,421 2.95 0.71 435 522,000 2.88 0.73 1488Note: Calculated validation grades may differ from resource grades due to weighting by volume, not tonnes.
Block ModelPatricia Deposit Block Model Validation by Easting (Cathedral Main Zone Zn, Pb)
Composites
0.0
1.0
2.0
3.0
4.0
5.0
6.0
0
15,000
30,000
45,000
60,000
75,000
90,000
4940
75
4941
00
4941
25
4941
50
4941
75
4942
00
4942
25
4942
50
4942
75
4943
00
4943
25
4943
50
4943
75
4944
00
4944
25
4944
50
4944
75
4945
00
4945
25
4945
50
4945
75
4946
00
4946
25
4946
50
4946
75
Gra
de %
Volu
me
(BC
M) C
omps
*430
0
Section (E)
Comparison of Model and Composite Grades by Easting - Cathedral Main
Model BCM Comps* Model Zn Model Pb% Comps Zn% Comps Pb%
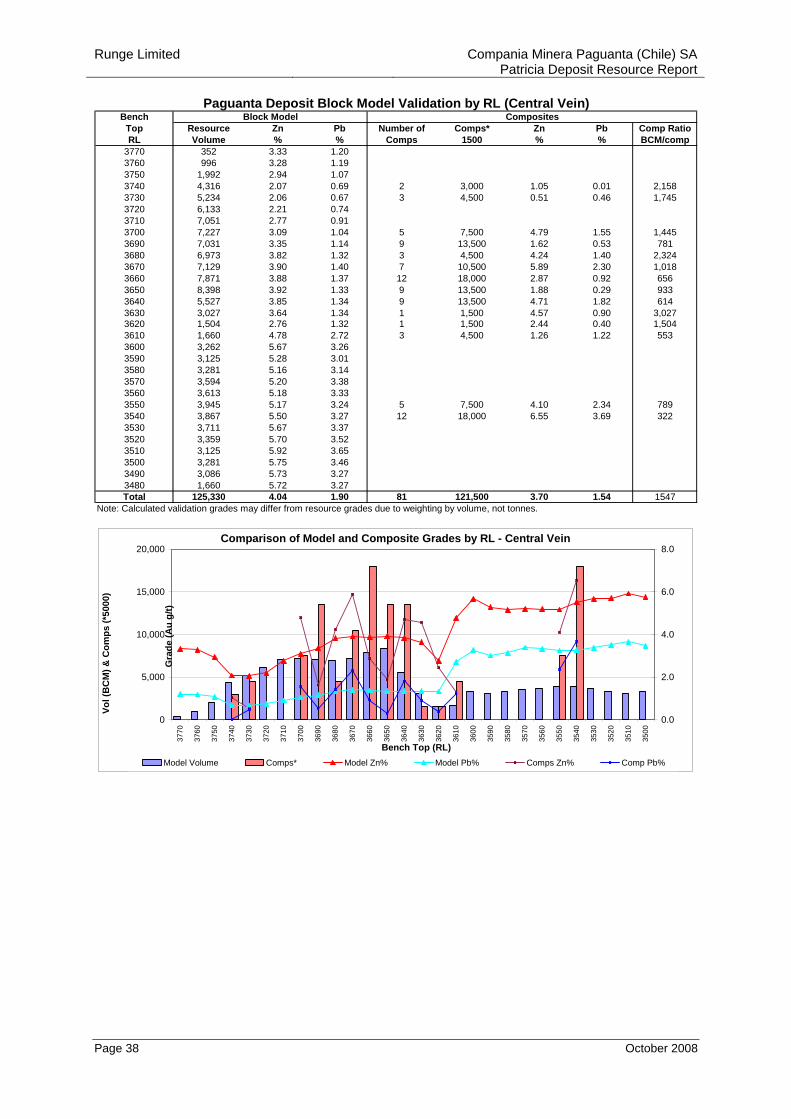
Runge Limited Compania Minera Paguanta (Chile) SA Patricia Deposit Resource Report
Page 38 October 2008
BenchTop Resource Zn Pb Number of Comps* Zn Pb Comp RatioRL Volume % % Comps 1500 % % BCM/comp
3770 352 3.33 1.20 3760 996 3.28 1.19 3750 1,992 2.94 1.07 3740 4,316 2.07 0.69 2 3,000 1.05 0.01 2,1583730 5,234 2.06 0.67 3 4,500 0.51 0.46 1,7453720 6,133 2.21 0.74 3710 7,051 2.77 0.91 3700 7,227 3.09 1.04 5 7,500 4.79 1.55 1,4453690 7,031 3.35 1.14 9 13,500 1.62 0.53 7813680 6,973 3.82 1.32 3 4,500 4.24 1.40 2,3243670 7,129 3.90 1.40 7 10,500 5.89 2.30 1,0183660 7,871 3.88 1.37 12 18,000 2.87 0.92 6563650 8,398 3.92 1.33 9 13,500 1.88 0.29 9333640 5,527 3.85 1.34 9 13,500 4.71 1.82 6143630 3,027 3.64 1.34 1 1,500 4.57 0.90 3,0273620 1,504 2.76 1.32 1 1,500 2.44 0.40 1,5043610 1,660 4.78 2.72 3 4,500 1.26 1.22 5533600 3,262 5.67 3.26 3590 3,125 5.28 3.01 3580 3,281 5.16 3.14 3570 3,594 5.20 3.38 3560 3,613 5.18 3.33 3550 3,945 5.17 3.24 5 7,500 4.10 2.34 7893540 3,867 5.50 3.27 12 18,000 6.55 3.69 3223530 3,711 5.67 3.37 3520 3,359 5.70 3.52 3510 3,125 5.92 3.65 3500 3,281 5.75 3.46 3490 3,086 5.73 3.27 3480 1,660 5.72 3.27 Total 125,330 4.04 1.90 81 121,500 3.70 1.54 1547
Note: Calculated validation grades may differ from resource grades due to weighting by volume, not tonnes.
Block Model CompositesPaguanta Deposit Block Model Validation by RL (Central Vein)
Comparison of Model and Composite Grades by RL - Central Vein
0
5,000
10,000
15,000
20,000
3770
3760
3750
3740
3730
3720
3710
3700
3690
3680
3670
3660
3650
3640
3630
3620
3610
3600
3590
3580
3570
3560
3550
3540
3530
3520
3510
3500
Bench Top (RL)
Vol (
BC
M) &
Com
ps (*
5000
)
0.0
2.0
4.0
6.0
8.0
Gra
de (A
u g/
t)
Model Volume Comps* Model Zn% Model Pb% Comps Zn% Comp Pb%
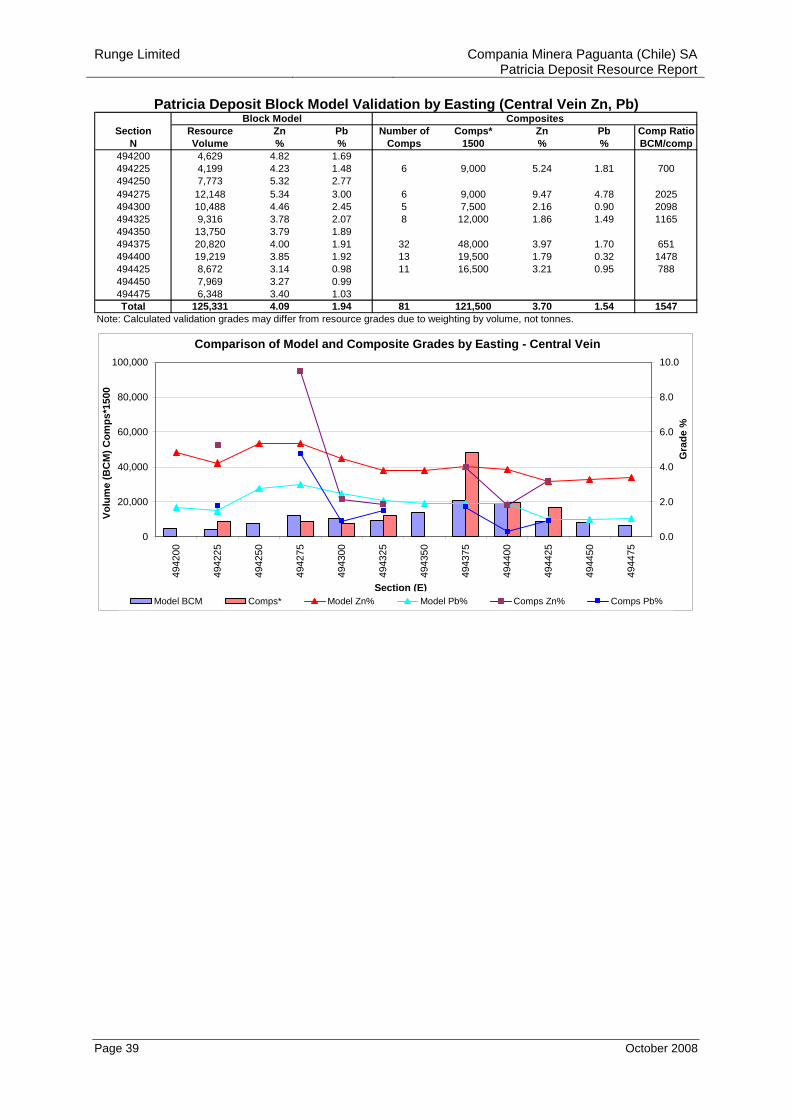
Runge Limited Compania Minera Paguanta (Chile) SA Patricia Deposit Resource Report
Page 39 October 2008
Section Resource Zn Pb Number of Comps* Zn Pb Comp RatioN Volume % % Comps 1500 % % BCM/comp
494200 4,629 4.82 1.69 494225 4,199 4.23 1.48 6 9,000 5.24 1.81 700494250 7,773 5.32 2.77 494275 12,148 5.34 3.00 6 9,000 9.47 4.78 2025494300 10,488 4.46 2.45 5 7,500 2.16 0.90 2098494325 9,316 3.78 2.07 8 12,000 1.86 1.49 1165494350 13,750 3.79 1.89 494375 20,820 4.00 1.91 32 48,000 3.97 1.70 651494400 19,219 3.85 1.92 13 19,500 1.79 0.32 1478494425 8,672 3.14 0.98 11 16,500 3.21 0.95 788494450 7,969 3.27 0.99 494475 6,348 3.40 1.03 Total 125,331 4.09 1.94 81 121,500 3.70 1.54 1547
Note: Calculated validation grades may differ from resource grades due to weighting by volume, not tonnes.
Block ModelPatricia Deposit Block Model Validation by Easting (Central Vein Zn, Pb)
Composites
Comparison of Model and Composite Grades by Easting - Central Vein
0
20,000
40,000
60,000
80,000
100,000
4942
00
4942
25
4942
50
4942
75
4943
00
4943
25
4943
50
4943
75
4944
00
4944
25
4944
50
4944
75
Section (E)
Volu
me
(BC
M) C
omps
*150
0
0.0
2.0
4.0
6.0
8.0
10.0
Gra
de %
Model BCM Comps* Model Zn% Model Pb% Comps Zn% Comps Pb%
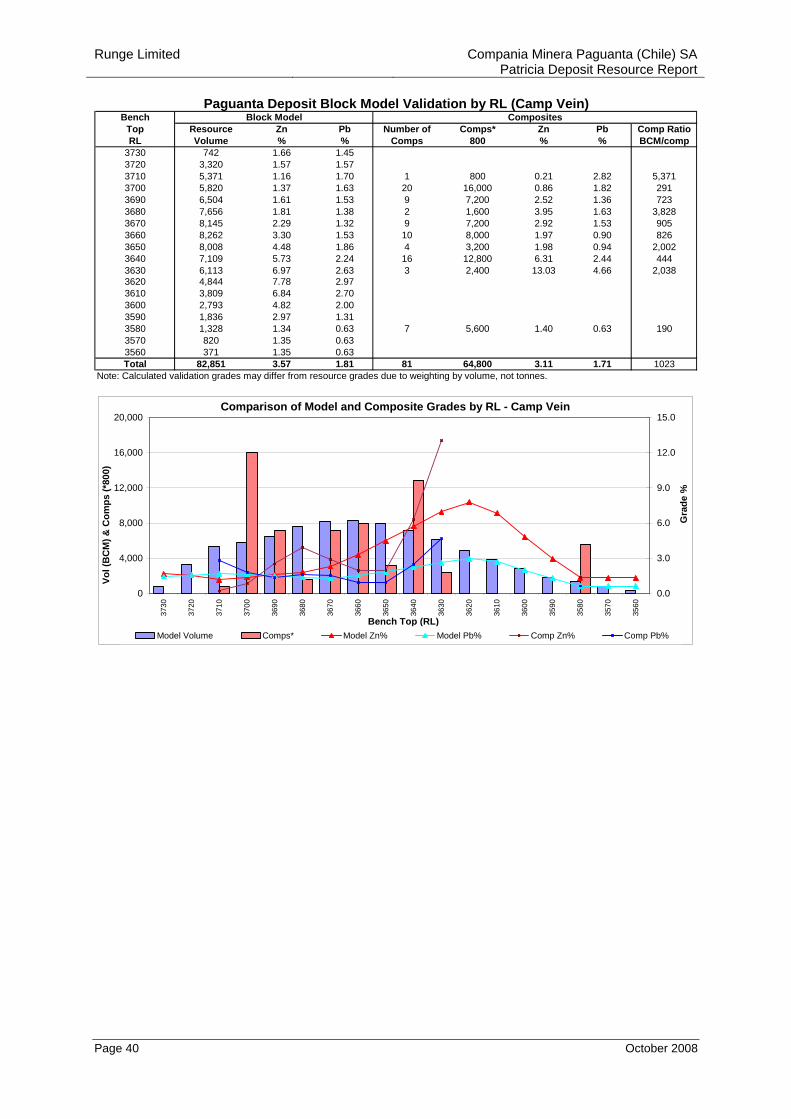
Runge Limited Compania Minera Paguanta (Chile) SA Patricia Deposit Resource Report
Page 40 October 2008
BenchTop Resource Zn Pb Number of Comps* Zn Pb Comp RatioRL Volume % % Comps 800 % % BCM/comp
3730 742 1.66 1.45 3720 3,320 1.57 1.57 3710 5,371 1.16 1.70 1 800 0.21 2.82 5,3713700 5,820 1.37 1.63 20 16,000 0.86 1.82 2913690 6,504 1.61 1.53 9 7,200 2.52 1.36 7233680 7,656 1.81 1.38 2 1,600 3.95 1.63 3,8283670 8,145 2.29 1.32 9 7,200 2.92 1.53 9053660 8,262 3.30 1.53 10 8,000 1.97 0.90 8263650 8,008 4.48 1.86 4 3,200 1.98 0.94 2,0023640 7,109 5.73 2.24 16 12,800 6.31 2.44 4443630 6,113 6.97 2.63 3 2,400 13.03 4.66 2,0383620 4,844 7.78 2.973610 3,809 6.84 2.70 3600 2,793 4.82 2.00 3590 1,836 2.97 1.31 3580 1,328 1.34 0.63 7 5,600 1.40 0.63 1903570 820 1.35 0.63 3560 371 1.35 0.63 Total 82,851 3.57 1.81 81 64,800 3.11 1.71 1023
Note: Calculated validation grades may differ from resource grades due to weighting by volume, not tonnes.
Block Model CompositesPaguanta Deposit Block Model Validation by RL (Camp Vein)
Comparison of Model and Composite Grades by RL - Camp Vein
0
4,000
8,000
12,000
16,000
20,000
3730
3720
3710
3700
3690
3680
3670
3660
3650
3640
3630
3620
3610
3600
3590
3580
3570
3560
Bench Top (RL)
Vol (
BC
M) &
Com
ps (*
800)
0.0
3.0
6.0
9.0
12.0
15.0
Gra
de %
Model Volume Comps* Model Zn% Model Pb% Comp Zn% Comp Pb%
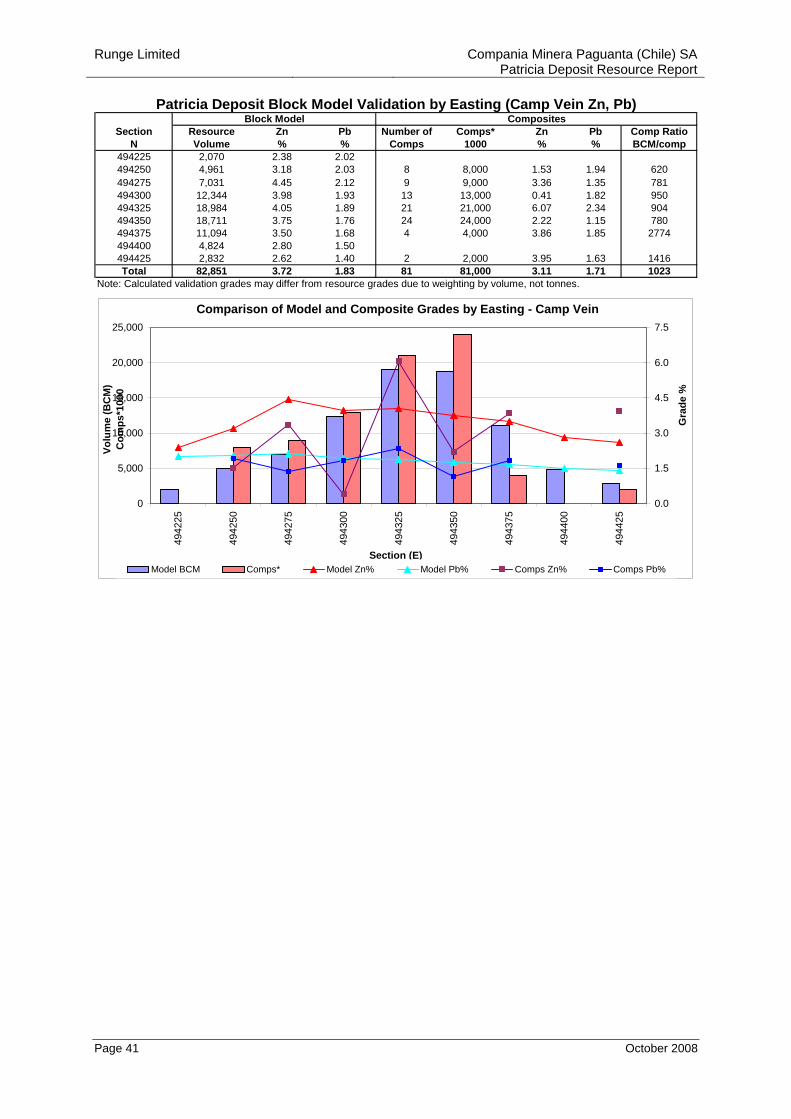
Runge Limited Compania Minera Paguanta (Chile) SA Patricia Deposit Resource Report
Page 41 October 2008
Section Resource Zn Pb Number of Comps* Zn Pb Comp RatioN Volume % % Comps 1000 % % BCM/comp
494225 2,070 2.38 2.02 494250 4,961 3.18 2.03 8 8,000 1.53 1.94 620494275 7,031 4.45 2.12 9 9,000 3.36 1.35 781494300 12,344 3.98 1.93 13 13,000 0.41 1.82 950494325 18,984 4.05 1.89 21 21,000 6.07 2.34 904494350 18,711 3.75 1.76 24 24,000 2.22 1.15 780494375 11,094 3.50 1.68 4 4,000 3.86 1.85 2774494400 4,824 2.80 1.50 494425 2,832 2.62 1.40 2 2,000 3.95 1.63 1416Total 82,851 3.72 1.83 81 81,000 3.11 1.71 1023
Note: Calculated validation grades may differ from resource grades due to weighting by volume, not tonnes.
Block ModelPatricia Deposit Block Model Validation by Easting (Camp Vein Zn, Pb)
Composites
Comparison of Model and Composite Grades by Easting - Camp Vein
0
5,000
10,000
15,000
20,000
25,000
4942
25
4942
50
4942
75
4943
00
4943
25
4943
50
4943
75
4944
00
4944
25
Section (E)
Volu
me
(BC
M)
Com
ps*1
000
0.0
1.5
3.0
4.5
6.0
7.5
Gra
de %
Model BCM Comps* Model Zn% Model Pb% Comps Zn% Comps Pb%
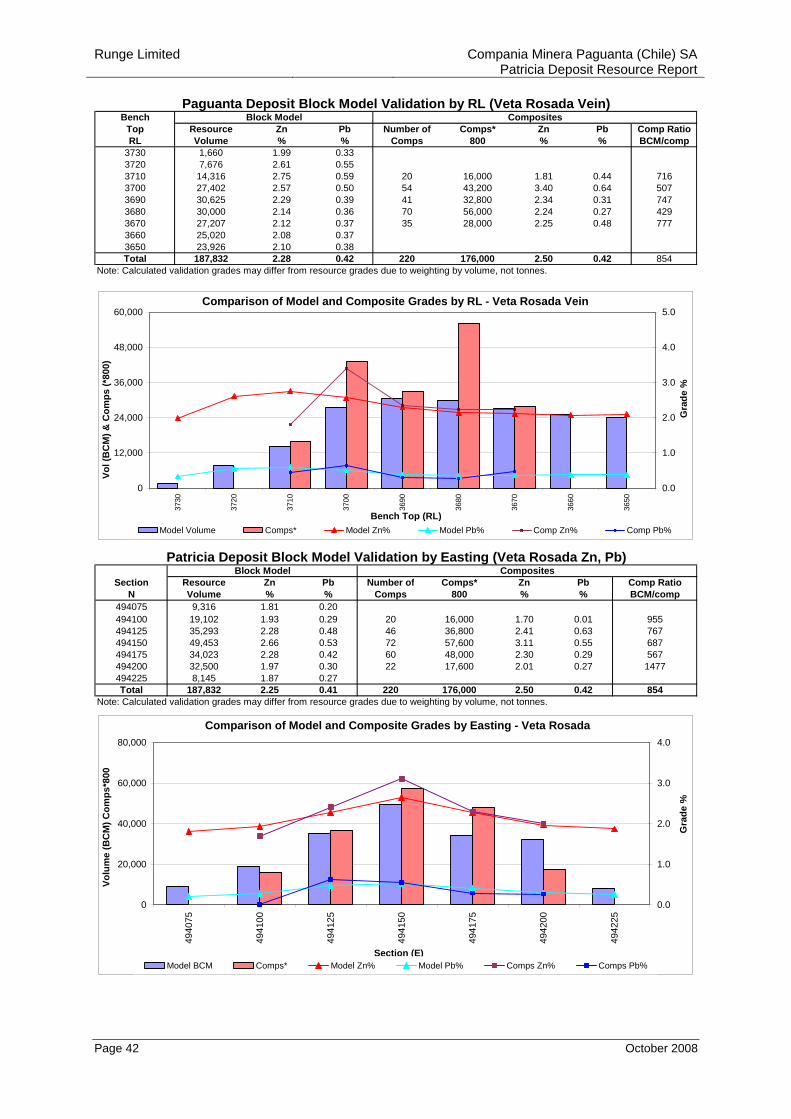
Runge Limited Compania Minera Paguanta (Chile) SA Patricia Deposit Resource Report
Page 42 October 2008
BenchTop Resource Zn Pb Number of Comps* Zn Pb Comp RatioRL Volume % % Comps 800 % % BCM/comp
3730 1,660 1.99 0.33 3720 7,676 2.61 0.55 3710 14,316 2.75 0.59 20 16,000 1.81 0.44 7163700 27,402 2.57 0.50 54 43,200 3.40 0.64 5073690 30,625 2.29 0.39 41 32,800 2.34 0.31 7473680 30,000 2.14 0.36 70 56,000 2.24 0.27 4293670 27,207 2.12 0.37 35 28,000 2.25 0.48 7773660 25,020 2.08 0.37 3650 23,926 2.10 0.38 Total 187,832 2.28 0.42 220 176,000 2.50 0.42 854
Note: Calculated validation grades may differ from resource grades due to weighting by volume, not tonnes.
Block Model CompositesPaguanta Deposit Block Model Validation by RL (Veta Rosada Vein)
Comparison of Model and Composite Grades by RL - Veta Rosada Vein
0
12,000
24,000
36,000
48,000
60,000
3730
3720
3710
3700
3690
3680
3670
3660
3650
Bench Top (RL)
Vol (
BC
M) &
Com
ps (*
800)
0.0
1.0
2.0
3.0
4.0
5.0
Gra
de %
Model Volume Comps* Model Zn% Model Pb% Comp Zn% Comp Pb%
Section Resource Zn Pb Number of Comps* Zn Pb Comp RatioN Volume % % Comps 800 % % BCM/comp
494075 9,316 1.81 0.20 494100 19,102 1.93 0.29 20 16,000 1.70 0.01 955494125 35,293 2.28 0.48 46 36,800 2.41 0.63 767494150 49,453 2.66 0.53 72 57,600 3.11 0.55 687494175 34,023 2.28 0.42 60 48,000 2.30 0.29 567494200 32,500 1.97 0.30 22 17,600 2.01 0.27 1477494225 8,145 1.87 0.27 Total 187,832 2.25 0.41 220 176,000 2.50 0.42 854
Note: Calculated validation grades may differ from resource grades due to weighting by volume, not tonnes.
Block ModelPatricia Deposit Block Model Validation by Easting (Veta Rosada Zn, Pb)
Composites
Comparison of Model and Composite Grades by Easting - Veta Rosada
0
20,000
40,000
60,000
80,000
4940
75
4941
00
4941
25
4941
50
4941
75
4942
00
4942
25
Section (E)
Volu
me
(BC
M) C
omps
*800
0.0
1.0
2.0
3.0
4.0
Gra
de %
Model BCM Comps* Model Zn% Model Pb% Comps Zn% Comps Pb%
Runge Limited Compania Minera Paguanta (Chile) SA Patricia Deposit Resource Report
Page 43 October 2008
Appendix 3
Patricia Deposit
Statistical Analysis by Domain
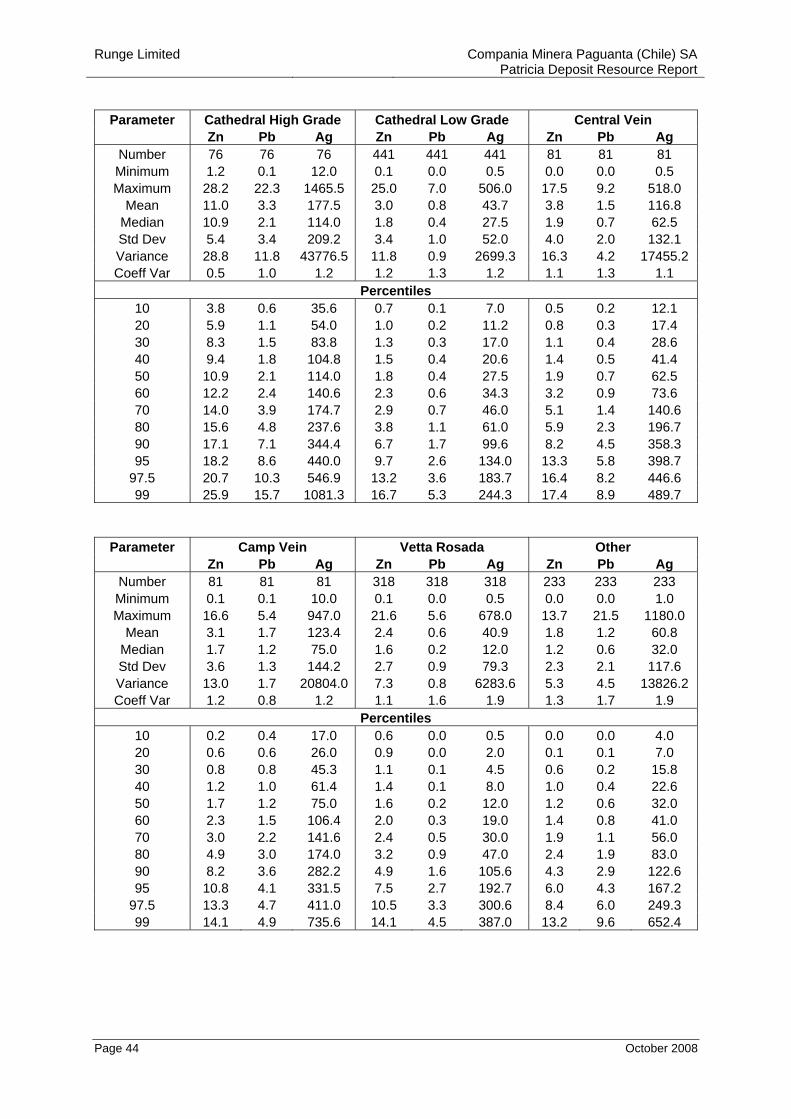
Runge Limited Compania Minera Paguanta (Chile) SA Patricia Deposit Resource Report
Page 44 October 2008
Parameter Cathedral High Grade Cathedral Low Grade Central Vein
Zn Pb Ag Zn Pb Ag Zn Pb Ag Number 76 76 76 441 441 441 81 81 81 Minimum 1.2 0.1 12.0 0.1 0.0 0.5 0.0 0.0 0.5 Maximum 28.2 22.3 1465.5 25.0 7.0 506.0 17.5 9.2 518.0
Mean 11.0 3.3 177.5 3.0 0.8 43.7 3.8 1.5 116.8 Median 10.9 2.1 114.0 1.8 0.4 27.5 1.9 0.7 62.5 Std Dev 5.4 3.4 209.2 3.4 1.0 52.0 4.0 2.0 132.1 Variance 28.8 11.8 43776.5 11.8 0.9 2699.3 16.3 4.2 17455.2 Coeff Var 0.5 1.0 1.2 1.2 1.3 1.2 1.1 1.3 1.1
Percentiles 10 3.8 0.6 35.6 0.7 0.1 7.0 0.5 0.2 12.1 20 5.9 1.1 54.0 1.0 0.2 11.2 0.8 0.3 17.4 30 8.3 1.5 83.8 1.3 0.3 17.0 1.1 0.4 28.6 40 9.4 1.8 104.8 1.5 0.4 20.6 1.4 0.5 41.4 50 10.9 2.1 114.0 1.8 0.4 27.5 1.9 0.7 62.5 60 12.2 2.4 140.6 2.3 0.6 34.3 3.2 0.9 73.6 70 14.0 3.9 174.7 2.9 0.7 46.0 5.1 1.4 140.6 80 15.6 4.8 237.6 3.8 1.1 61.0 5.9 2.3 196.7 90 17.1 7.1 344.4 6.7 1.7 99.6 8.2 4.5 358.3 95 18.2 8.6 440.0 9.7 2.6 134.0 13.3 5.8 398.7
97.5 20.7 10.3 546.9 13.2 3.6 183.7 16.4 8.2 446.6 99 25.9 15.7 1081.3 16.7 5.3 244.3 17.4 8.9 489.7
Parameter Camp Vein Vetta Rosada Other Zn Pb Ag Zn Pb Ag Zn Pb Ag
Number 81 81 81 318 318 318 233 233 233 Minimum 0.1 0.1 10.0 0.1 0.0 0.5 0.0 0.0 1.0 Maximum 16.6 5.4 947.0 21.6 5.6 678.0 13.7 21.5 1180.0
Mean 3.1 1.7 123.4 2.4 0.6 40.9 1.8 1.2 60.8 Median 1.7 1.2 75.0 1.6 0.2 12.0 1.2 0.6 32.0 Std Dev 3.6 1.3 144.2 2.7 0.9 79.3 2.3 2.1 117.6 Variance 13.0 1.7 20804.0 7.3 0.8 6283.6 5.3 4.5 13826.2 Coeff Var 1.2 0.8 1.2 1.1 1.6 1.9 1.3 1.7 1.9
Percentiles 10 0.2 0.4 17.0 0.6 0.0 0.5 0.0 0.0 4.0 20 0.6 0.6 26.0 0.9 0.0 2.0 0.1 0.1 7.0 30 0.8 0.8 45.3 1.1 0.1 4.5 0.6 0.2 15.8 40 1.2 1.0 61.4 1.4 0.1 8.0 1.0 0.4 22.6 50 1.7 1.2 75.0 1.6 0.2 12.0 1.2 0.6 32.0 60 2.3 1.5 106.4 2.0 0.3 19.0 1.4 0.8 41.0 70 3.0 2.2 141.6 2.4 0.5 30.0 1.9 1.1 56.0 80 4.9 3.0 174.0 3.2 0.9 47.0 2.4 1.9 83.0 90 8.2 3.6 282.2 4.9 1.6 105.6 4.3 2.9 122.6 95 10.8 4.1 331.5 7.5 2.7 192.7 6.0 4.3 167.2
97.5 13.3 4.7 411.0 10.5 3.3 300.6 8.4 6.0 249.3 99 14.1 4.9 735.6 14.1 4.5 387.0 13.2 9.6 652.4
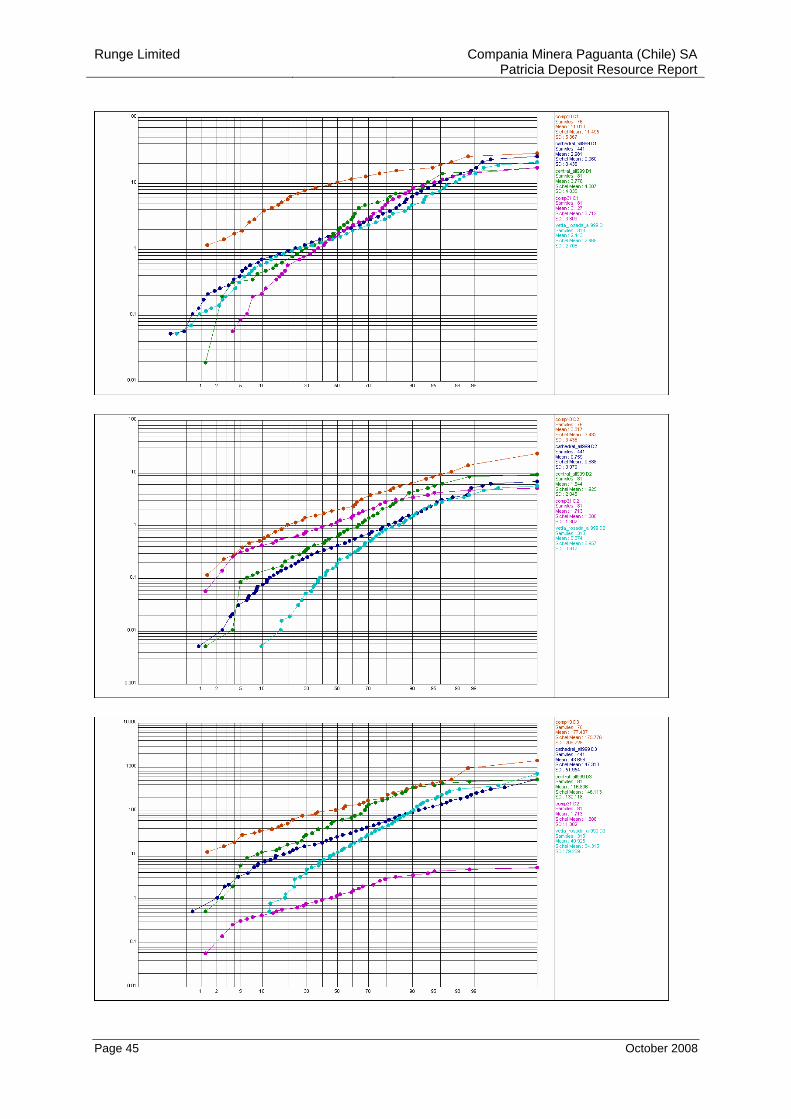
Runge Limited Compania Minera Paguanta (Chile) SA Patricia Deposit Resource Report
Page 45 October 2008
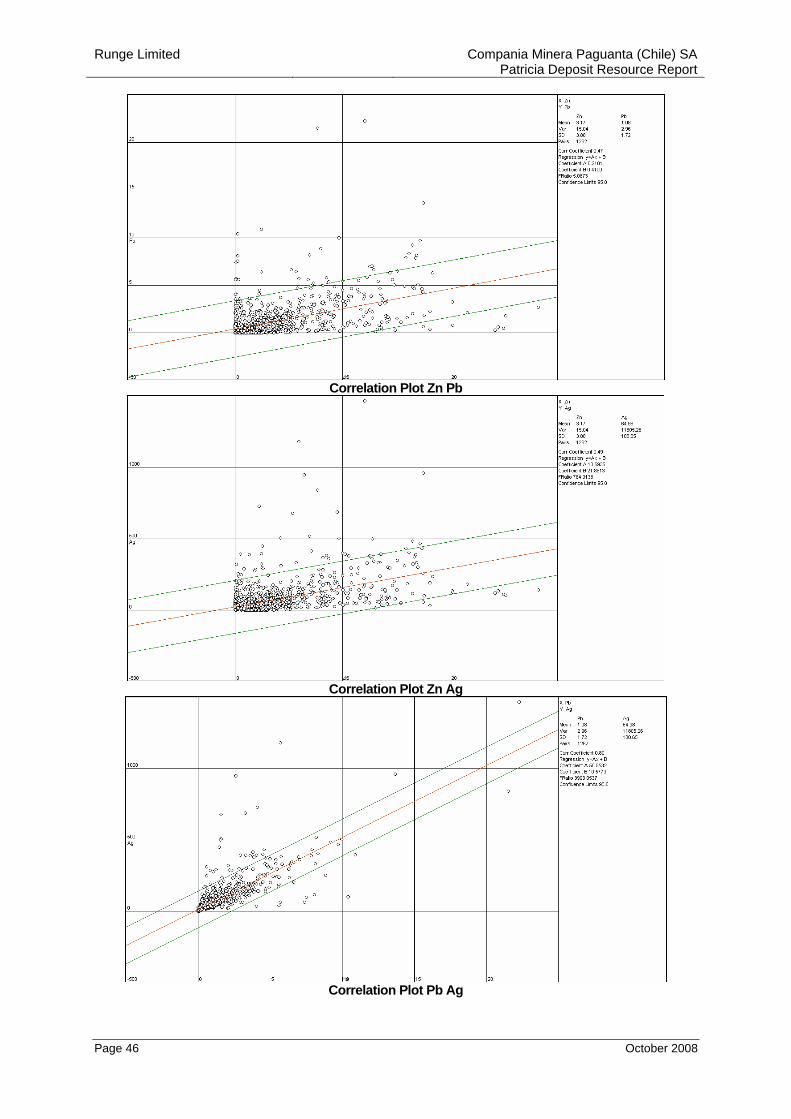
Runge Limited Compania Minera Paguanta (Chile) SA Patricia Deposit Resource Report
Page 46 October 2008
Correlation Plot Zn Pb
Correlation Plot Zn Ag
Correlation Plot Pb Ag
Runge Limited Compania Minera Paguanta (Chile) SA Patricia Deposit Resource Report
Page 47 October 2008
Appendix 4
Patricia Deposit
Variograms
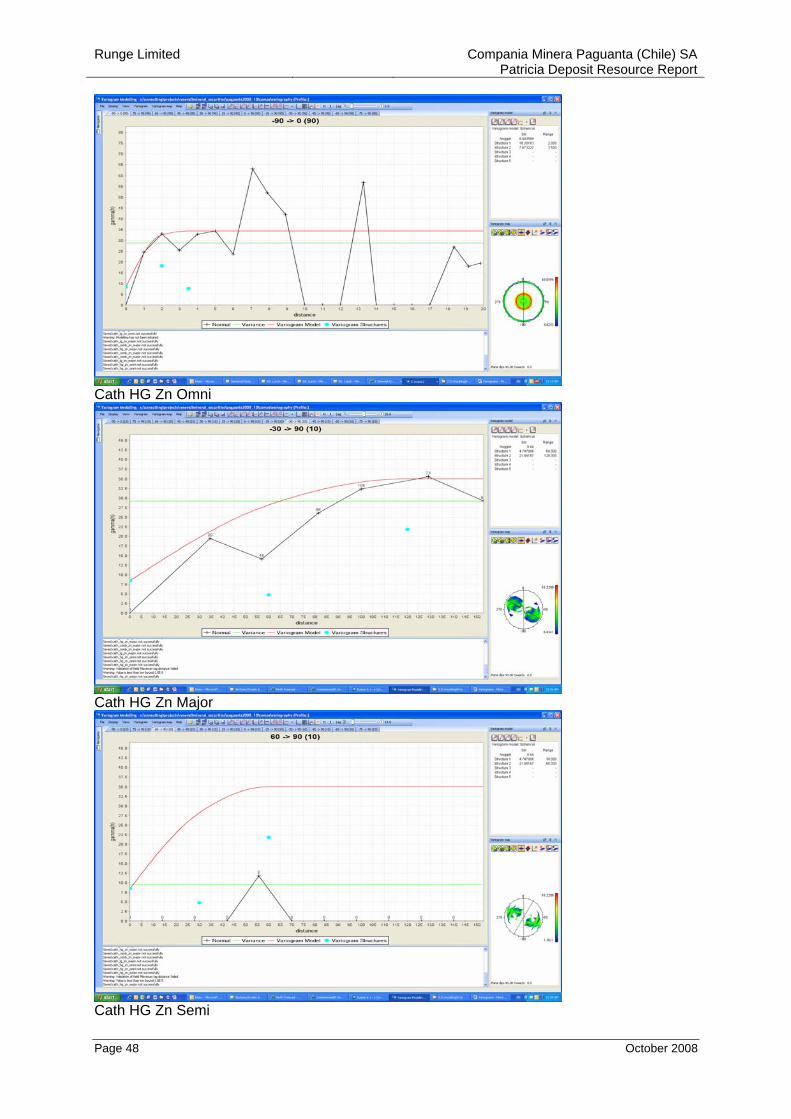
Runge Limited Compania Minera Paguanta (Chile) SA Patricia Deposit Resource Report
Page 48 October 2008
Cath HG Zn Omni
Cath HG Zn Major
Cath HG Zn Semi
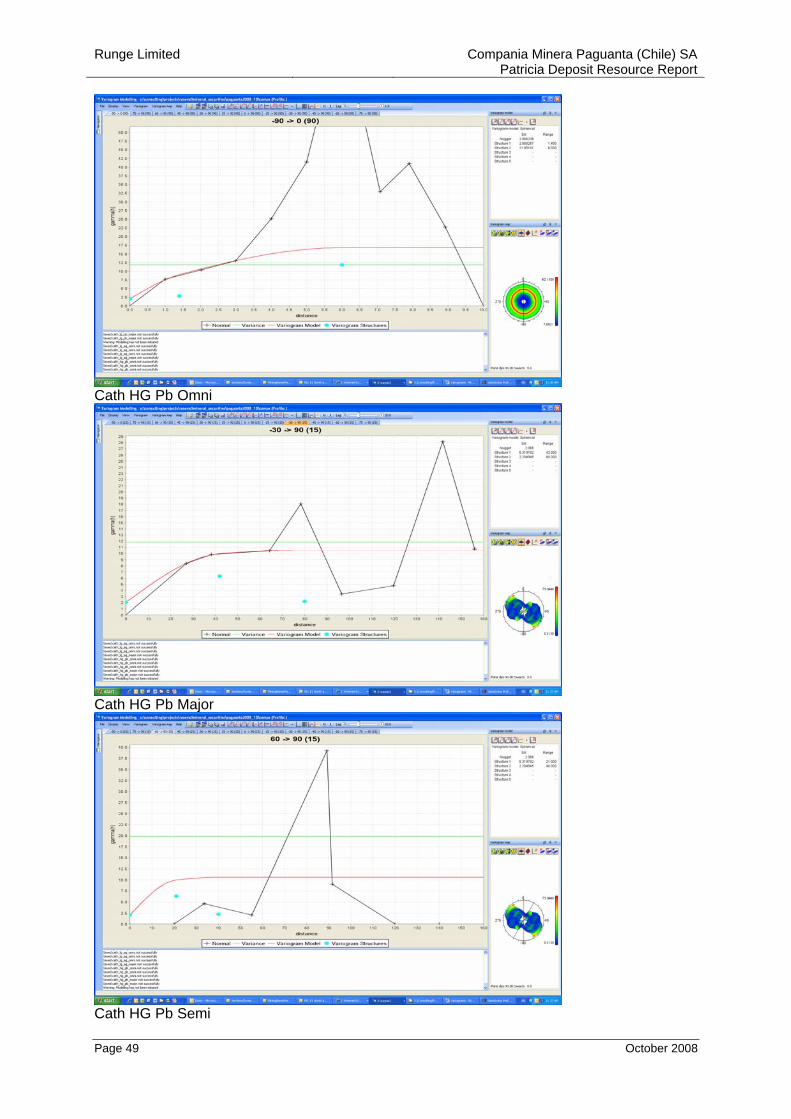
Runge Limited Compania Minera Paguanta (Chile) SA Patricia Deposit Resource Report
Page 49 October 2008
Cath HG Pb Omni
Cath HG Pb Major
Cath HG Pb Semi
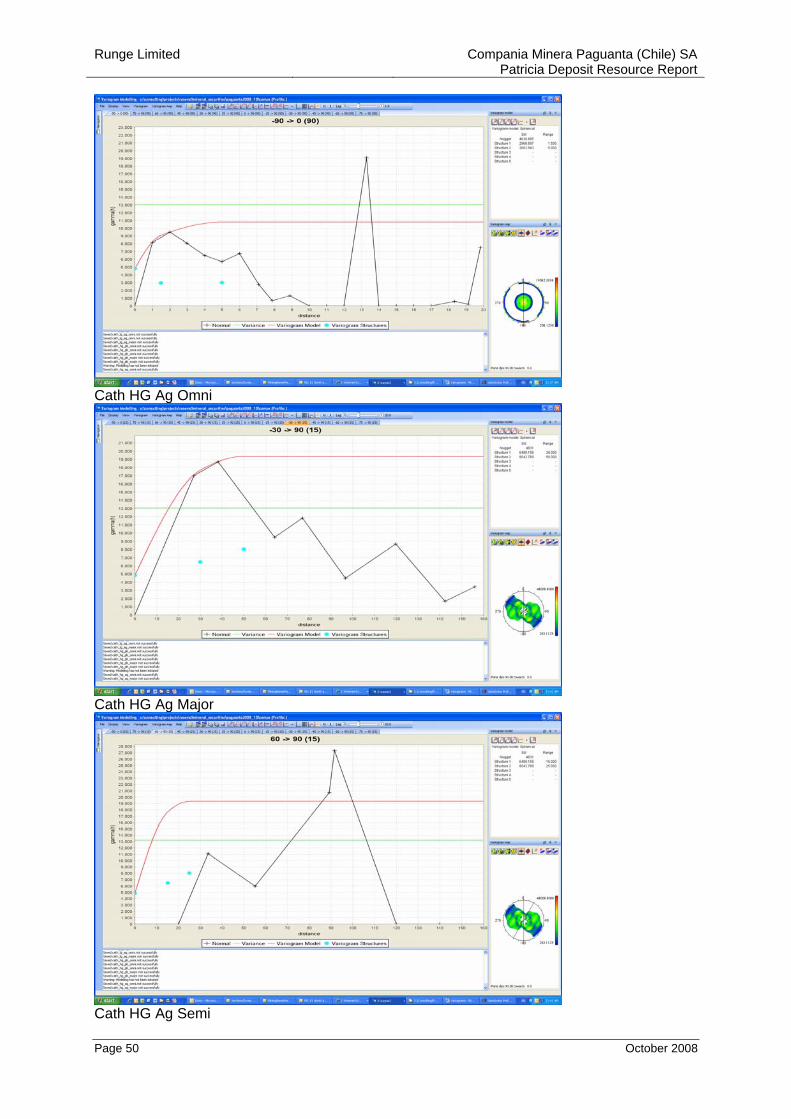
Runge Limited Compania Minera Paguanta (Chile) SA Patricia Deposit Resource Report
Page 50 October 2008
Cath HG Ag Omni
Cath HG Ag Major
Cath HG Ag Semi
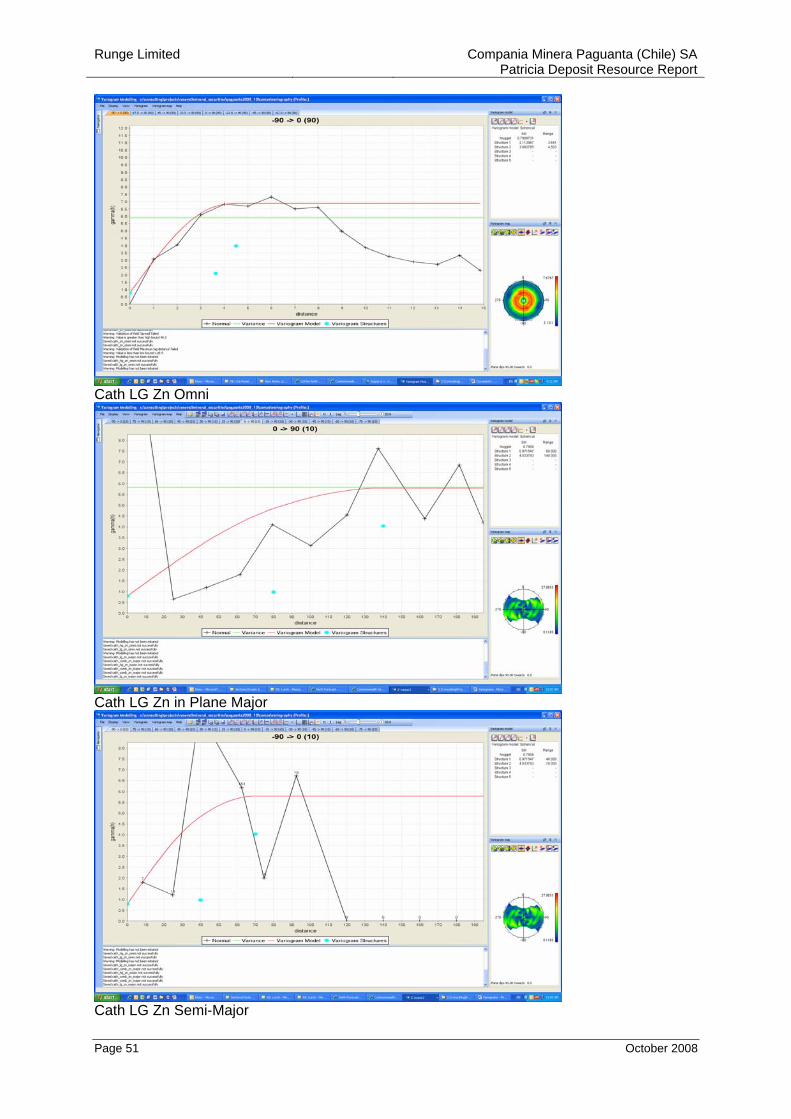
Runge Limited Compania Minera Paguanta (Chile) SA Patricia Deposit Resource Report
Page 51 October 2008
Cath LG Zn Omni
Cath LG Zn in Plane Major
Cath LG Zn Semi-Major
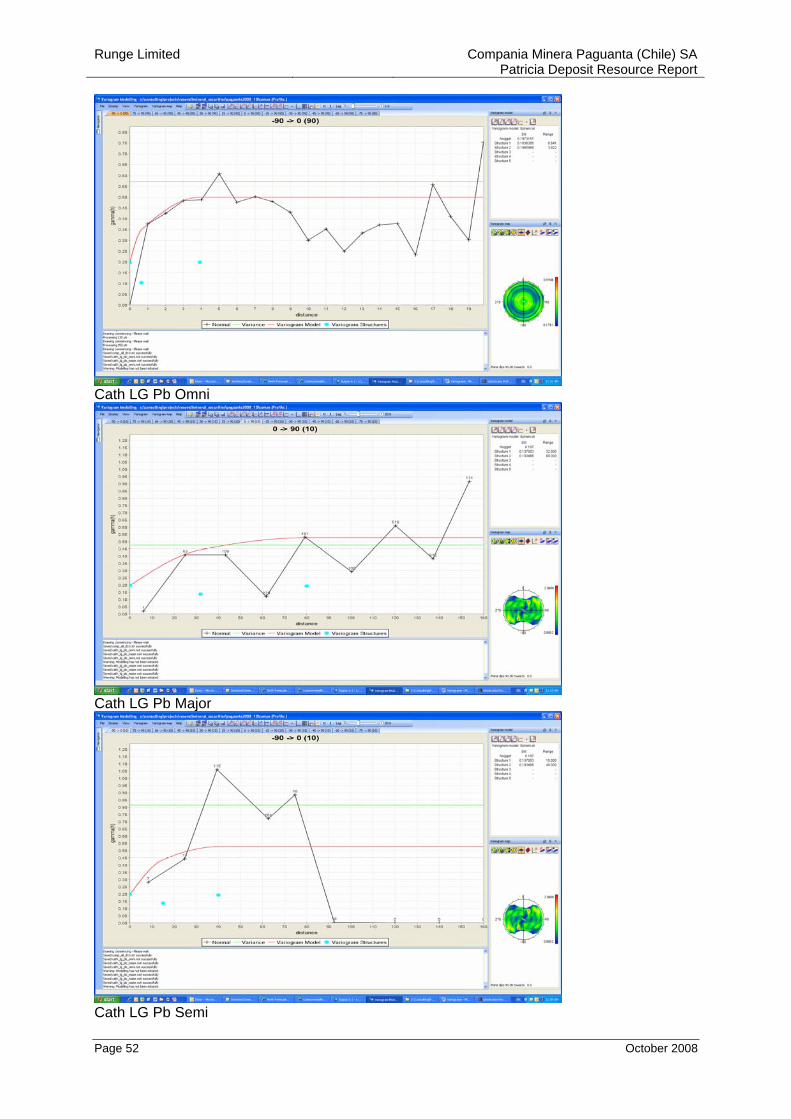
Runge Limited Compania Minera Paguanta (Chile) SA Patricia Deposit Resource Report
Page 52 October 2008
Cath LG Pb Omni
Cath LG Pb Major
Cath LG Pb Semi
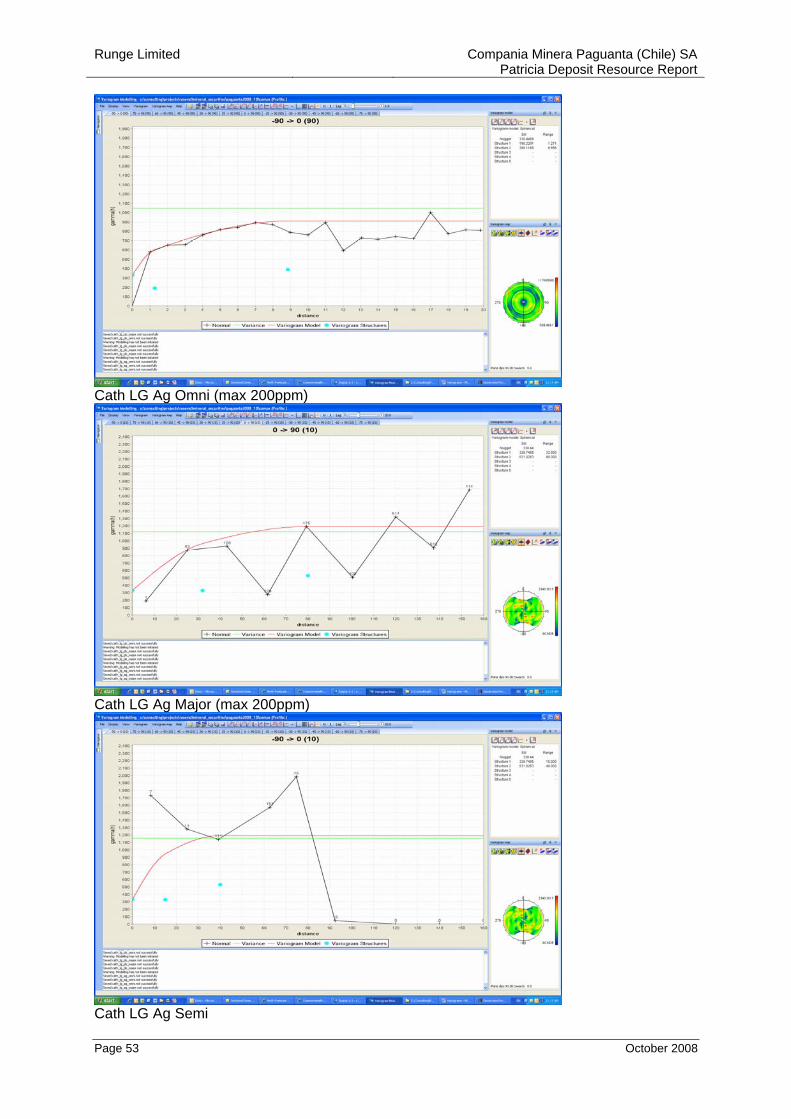
Runge Limited Compania Minera Paguanta (Chile) SA Patricia Deposit Resource Report
Page 53 October 2008
Cath LG Ag Omni (max 200ppm)
Cath LG Ag Major (max 200ppm)
Cath LG Ag Semi
Runge Limited Compania Minera Paguanta (Chile) SA Patricia Deposit Resource Report
Page 54 October 2008
Appendix 5
Patricia Deposit
Model Interpolation Parameters

Runge Limited Compania Minera Paguanta (Chile) SA Patricia Deposit Resource Report
Page 55 October 2008
Element Object Minimum Samples
Search Radius Strike Plunge Dip Major-Semi
Major RatioMajor-Minor
Ratio Pass x_min x_max
zn_cut 10 10 120 105 0 90 2 5 1 494250 494450pb_cut 10 10 120 105 0 90 2 5 1 494250 494450ag_cut 10 10 120 105 0 90 2 5 1 494250 494450zn_cut 10 10 120 85 0 75 2 5 1 494450 495000pb_cut 10 10 120 85 0 75 2 5 1 494450 495000ag_cut 10 10 120 85 0 75 2 5 1 494450 495000zn_cut 20 10 140 85 0 -70 2 5 1 493000 494250pb_cut 20 10 140 85 0 -70 2 5 1 493000 494250ag_cut 20 10 140 85 0 -70 2 5 1 493000 494250zn_cut 20 10 140 105 0 90 2 5 1 494250 494450pb_cut 20 10 140 105 0 90 2 5 1 494250 494450ag_cut 20 10 140 105 0 90 2 5 1 494250 494450zn_cut 20 10 140 85 0 75 2 5 1 494450 495000pb_cut 20 10 140 85 0 75 2 5 1 494450 495000ag_cut 20 10 140 85 0 75 2 5 1 494450 495000zn_cut 21 10 140 90 0 90 2 5 1 494000 495000pb_cut 21 10 140 90 0 90 2 5 1 494000 495000ag_cut 21 10 140 90 0 90 2 5 1 494000 495000zn_cut 22 10 140 80 0 -75 2 5 1 494000 495000pb_cut 22 10 140 80 0 -75 2 5 1 494000 495000ag_cut 22 10 140 80 0 -75 2 5 1 494000 495000zn_cut 23 10 140 90 0 90 2 5 1 494000 495000pb_cut 23 10 140 90 0 90 2 5 1 494000 495000ag_cut 23 10 140 90 0 90 2 5 1 494000 495000zn_cut 24 10 140 90 0 80 2 5 1 494000 495000pb_cut 24 10 140 90 0 80 2 5 1 494000 495000ag_cut 24 10 140 90 0 80 2 5 1 494000 495000zn_cut 25 10 140 90 0 80 2 5 1 493000 494400pb_cut 25 10 140 90 0 80 2 5 1 493000 494400ag_cut 25 10 140 90 0 80 2 5 1 493000 494400zn_cut 25 10 140 90 0 80 2 5 1 494400 495000pb_cut 25 10 140 90 0 80 2 5 1 494400 495000ag_cut 25 10 140 90 0 80 2 5 1 494400 495000zn_cut 26 10 140 90 0 90 2 5 1 494000 495000pb_cut 26 10 140 90 0 90 2 5 1 494000 495000ag_cut 26 10 140 90 0 90 2 5 1 494000 495000zn_cut 27 10 140 90 0 90 2 5 1 494000 495000pb_cut 27 10 140 90 0 90 2 5 1 494000 495000ag_cut 27 10 140 90 0 90 2 5 1 494000 495000zn_cut 28 10 140 90 0 70 2 5 1 494000 495000pb_cut 28 10 140 90 0 70 2 5 1 494000 495000ag_cut 28 10 140 90 0 70 2 5 1 494000 495000zn_cut 29 10 140 90 0 90 2 5 1 494000 495000pb_cut 29 10 140 90 0 90 2 5 1 494000 495000ag_cut 29 10 140 90 0 90 2 5 1 494000 495000zn_cut 30 10 140 90 0 90 2 5 1 494000 495000pb_cut 30 10 140 90 0 90 2 5 1 494000 495000ag_cut 30 10 140 90 0 90 2 5 1 494000 495000zn_cut 31 10 140 83 0 -80 2 5 1 494000 495000pb_cut 31 10 140 83 0 -80 2 5 1 494000 495000ag_cut 31 10 140 83 0 -80 2 5 1 494000 495000zn_cut 32 10 140 25 0 -70 2 5 1 494000 495000pb_cut 32 10 140 25 0 -70 2 5 1 494000 495000ag_cut 32 10 140 25 0 -70 2 5 1 494000 495000zn_cut 33 10 140 44 0 -70 2 5 1 494000 495000pb_cut 33 10 140 44 0 -70 2 5 1 494000 495000ag_cut 33 10 140 44 0 -70 2 5 1 494000 495000zn_cut 34 10 140 44 0 -70 2 5 1 494000 495000pb_cut 34 10 140 44 0 -70 2 5 1 494000 495000ag_cut 34 10 140 44 0 -70 2 5 1 494000 495000zn_cut 35 10 140 90 0 90 2 5 1 494000 495000pb_cut 35 10 140 90 0 90 2 5 1 494000 495000ag_cut 35 10 140 90 0 90 2 5 1 494000 495000zn_cut 50 10 140 90 0 90 2 5 1 494000 495000pb_cut 50 10 140 90 0 90 2 5 1 494000 495000ag_cut 50 10 140 90 0 90 2 5 1 494000 495000
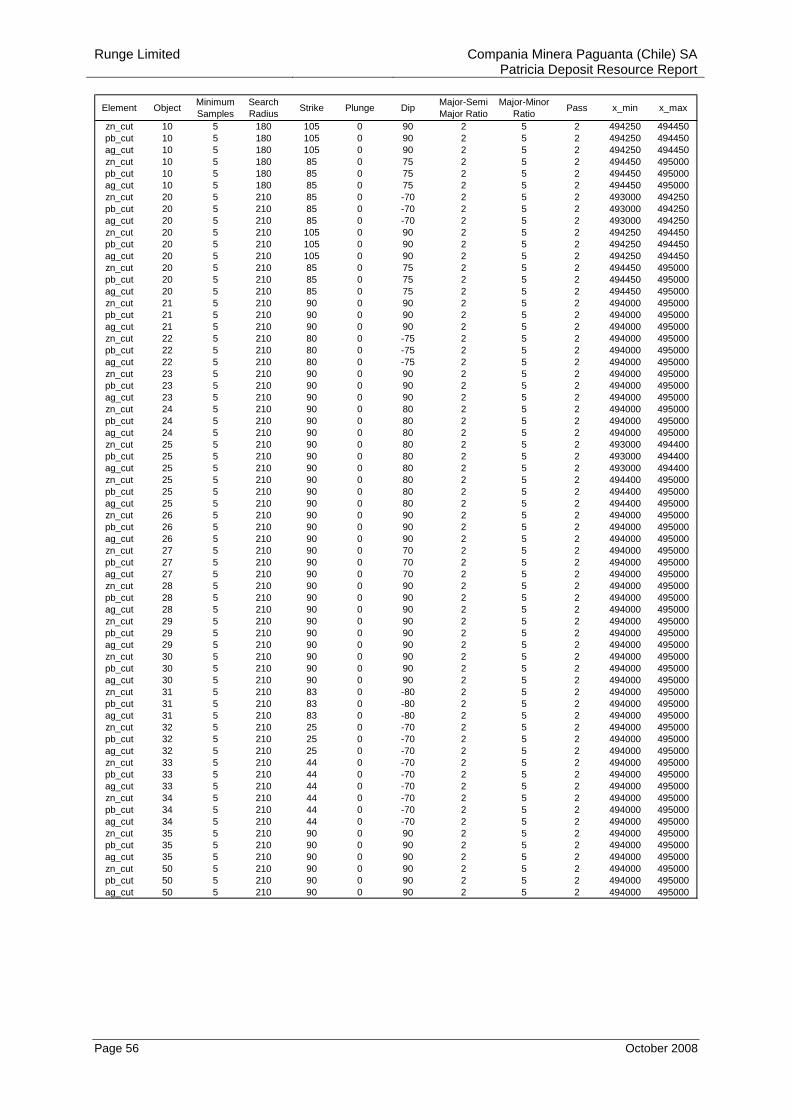
Runge Limited Compania Minera Paguanta (Chile) SA Patricia Deposit Resource Report
Page 56 October 2008
Element Object Minimum Samples
Search Radius Strike Plunge Dip Major-Semi
Major RatioMajor-Minor
Ratio Pass x_min x_max
zn_cut 10 5 180 105 0 90 2 5 2 494250 494450pb_cut 10 5 180 105 0 90 2 5 2 494250 494450ag_cut 10 5 180 105 0 90 2 5 2 494250 494450zn_cut 10 5 180 85 0 75 2 5 2 494450 495000pb_cut 10 5 180 85 0 75 2 5 2 494450 495000ag_cut 10 5 180 85 0 75 2 5 2 494450 495000zn_cut 20 5 210 85 0 -70 2 5 2 493000 494250pb_cut 20 5 210 85 0 -70 2 5 2 493000 494250ag_cut 20 5 210 85 0 -70 2 5 2 493000 494250zn_cut 20 5 210 105 0 90 2 5 2 494250 494450pb_cut 20 5 210 105 0 90 2 5 2 494250 494450ag_cut 20 5 210 105 0 90 2 5 2 494250 494450zn_cut 20 5 210 85 0 75 2 5 2 494450 495000pb_cut 20 5 210 85 0 75 2 5 2 494450 495000ag_cut 20 5 210 85 0 75 2 5 2 494450 495000zn_cut 21 5 210 90 0 90 2 5 2 494000 495000pb_cut 21 5 210 90 0 90 2 5 2 494000 495000ag_cut 21 5 210 90 0 90 2 5 2 494000 495000zn_cut 22 5 210 80 0 -75 2 5 2 494000 495000pb_cut 22 5 210 80 0 -75 2 5 2 494000 495000ag_cut 22 5 210 80 0 -75 2 5 2 494000 495000zn_cut 23 5 210 90 0 90 2 5 2 494000 495000pb_cut 23 5 210 90 0 90 2 5 2 494000 495000ag_cut 23 5 210 90 0 90 2 5 2 494000 495000zn_cut 24 5 210 90 0 80 2 5 2 494000 495000pb_cut 24 5 210 90 0 80 2 5 2 494000 495000ag_cut 24 5 210 90 0 80 2 5 2 494000 495000zn_cut 25 5 210 90 0 80 2 5 2 493000 494400pb_cut 25 5 210 90 0 80 2 5 2 493000 494400ag_cut 25 5 210 90 0 80 2 5 2 493000 494400zn_cut 25 5 210 90 0 80 2 5 2 494400 495000pb_cut 25 5 210 90 0 80 2 5 2 494400 495000ag_cut 25 5 210 90 0 80 2 5 2 494400 495000zn_cut 26 5 210 90 0 90 2 5 2 494000 495000pb_cut 26 5 210 90 0 90 2 5 2 494000 495000ag_cut 26 5 210 90 0 90 2 5 2 494000 495000zn_cut 27 5 210 90 0 70 2 5 2 494000 495000pb_cut 27 5 210 90 0 70 2 5 2 494000 495000ag_cut 27 5 210 90 0 70 2 5 2 494000 495000zn_cut 28 5 210 90 0 90 2 5 2 494000 495000pb_cut 28 5 210 90 0 90 2 5 2 494000 495000ag_cut 28 5 210 90 0 90 2 5 2 494000 495000zn_cut 29 5 210 90 0 90 2 5 2 494000 495000pb_cut 29 5 210 90 0 90 2 5 2 494000 495000ag_cut 29 5 210 90 0 90 2 5 2 494000 495000zn_cut 30 5 210 90 0 90 2 5 2 494000 495000pb_cut 30 5 210 90 0 90 2 5 2 494000 495000ag_cut 30 5 210 90 0 90 2 5 2 494000 495000zn_cut 31 5 210 83 0 -80 2 5 2 494000 495000pb_cut 31 5 210 83 0 -80 2 5 2 494000 495000ag_cut 31 5 210 83 0 -80 2 5 2 494000 495000zn_cut 32 5 210 25 0 -70 2 5 2 494000 495000pb_cut 32 5 210 25 0 -70 2 5 2 494000 495000ag_cut 32 5 210 25 0 -70 2 5 2 494000 495000zn_cut 33 5 210 44 0 -70 2 5 2 494000 495000pb_cut 33 5 210 44 0 -70 2 5 2 494000 495000ag_cut 33 5 210 44 0 -70 2 5 2 494000 495000zn_cut 34 5 210 44 0 -70 2 5 2 494000 495000pb_cut 34 5 210 44 0 -70 2 5 2 494000 495000ag_cut 34 5 210 44 0 -70 2 5 2 494000 495000zn_cut 35 5 210 90 0 90 2 5 2 494000 495000pb_cut 35 5 210 90 0 90 2 5 2 494000 495000ag_cut 35 5 210 90 0 90 2 5 2 494000 495000zn_cut 50 5 210 90 0 90 2 5 2 494000 495000pb_cut 50 5 210 90 0 90 2 5 2 494000 495000ag_cut 50 5 210 90 0 90 2 5 2 494000 495000
Runge Limited Compania Minera Paguanta (Chile) SA Patricia Deposit Resource Report
Page 57 October 2008
Appendix 6
Patricia Deposit
Data Disc Descriptions
(All relevant files are included on the Compact Disc
inside the back cover of this report)
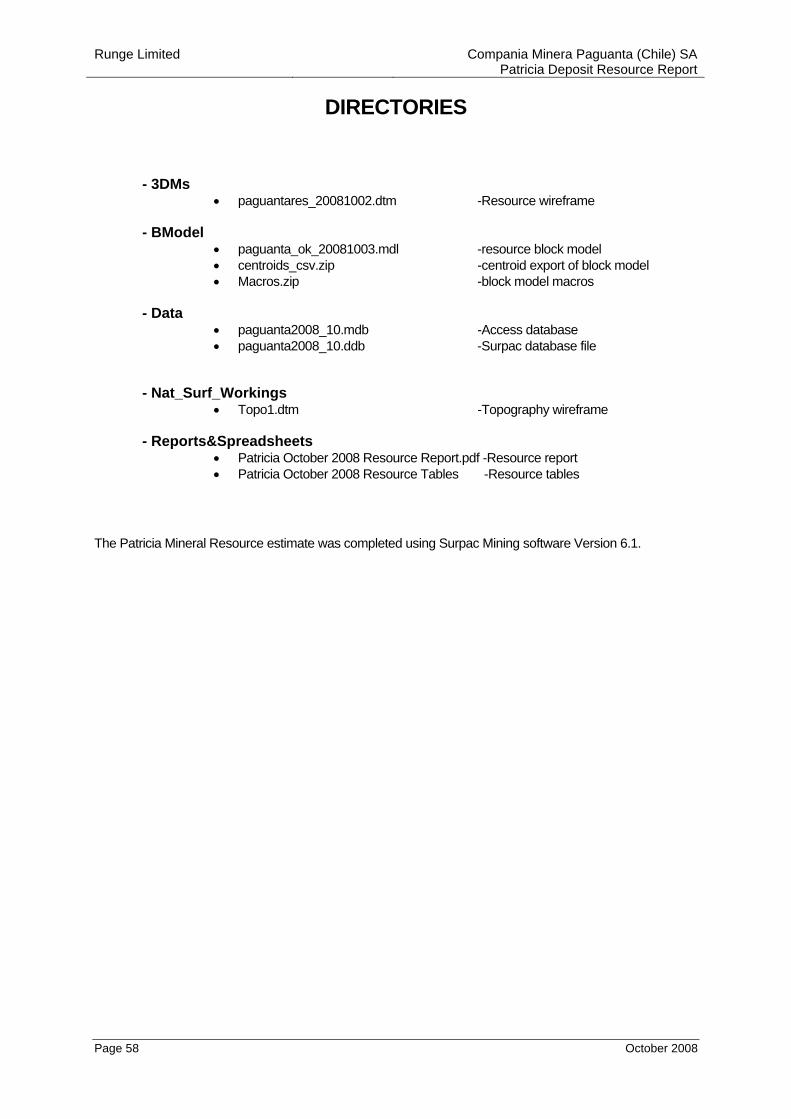
Runge Limited Compania Minera Paguanta (Chile) SA Patricia Deposit Resource Report
Page 58 October 2008
DIRECTORIES
- 3DMs
• paguantares_20081002.dtm -Resource wireframe
- BModel • paguanta_ok_20081003.mdl -resource block model • centroids_csv.zip -centroid export of block model • Macros.zip -block model macros
- Data
• paguanta2008_10.mdb -Access database • paguanta2008_10.ddb -Surpac database file
- Nat_Surf_Workings • Topo1.dtm -Topography wireframe
- Reports&Spreadsheets
• Patricia October 2008 Resource Report.pdf -Resource report • Patricia October 2008 Resource Tables -Resource tables
The Patricia Mineral Resource estimate was completed using Surpac Mining software Version 6.1.
Runge Limited Compania Minera Paguanta (Chile) SA Patricia Deposit Resource Report
Page 59 October 2008
Appendix 7
Patricia Deposit
Exploration Drilling and Site Procedures