Embed Size (px)
Citation preview
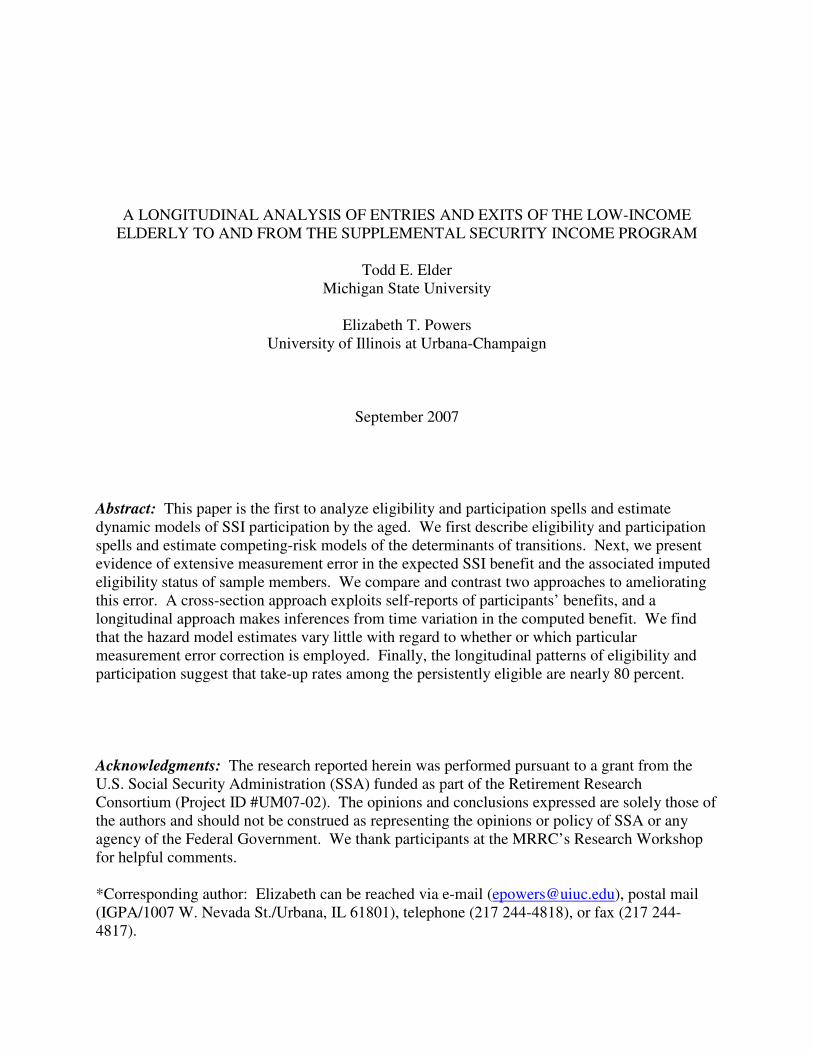
A LONGITUDINAL ANALYSIS OF ENTRIES AND EXITS OF THE LOW-INCOME ELDERLY TO AND FROM THE SUPPLEMENTAL SECURITY INCOME PROGRAM
Todd E. Elder
Michigan State University
Elizabeth T. Powers University of Illinois at Urbana-Champaign
September 2007 Abstract: This paper is the first to analyze eligibility and participation spells and estimate dynamic models of SSI participation by the aged. We first describe eligibility and participation spells and estimate competing-risk models of the determinants of transitions. Next, we present evidence of extensive measurement error in the expected SSI benefit and the associated imputed eligibility status of sample members. We compare and contrast two approaches to ameliorating this error. A cross-section approach exploits self-reports of participants’ benefits, and a longitudinal approach makes inferences from time variation in the computed benefit. We find that the hazard model estimates vary little with regard to whether or which particular measurement error correction is employed. Finally, the longitudinal patterns of eligibility and participation suggest that take-up rates among the persistently eligible are nearly 80 percent.
Acknowledgments: The research reported herein was performed pursuant to a grant from the U.S. Social Security Administration (SSA) funded as part of the Retirement Research Consortium (Project ID #UM07-02). The opinions and conclusions expressed are solely those of the authors and should not be construed as representing the opinions or policy of SSA or any agency of the Federal Government. We thank participants at the MRRC’s Research Workshop for helpful comments. *Corresponding author: Elizabeth can be reached via e-mail ([email protected]), postal mail (IGPA/1007 W. Nevada St./Urbana, IL 61801), telephone (217 244-4818), or fax (217 244-4817).
1
I. Introduction
A substantial fraction – as much as one-half – of the low-resource elderly who appear
qualified for Supplemental Security Income (SSI) fails to enroll in the program. This paper
seeks to understand this phenomenon by studying the dynamics of SSI eligibility and
participation spells. Ours is the first study of SSI take-up to focus on its longitudinal dimension.
Key issues that can only be addressed in a dynamic context are the role of individuals’ eligibility
duration expectations on program take-up and the degree to which eligibility without
participation is concentrated in groups that are persistently program-eligible. Understanding
differences in exit and entry behavior of welfare participants is also key for interpreting and
forecasting aggregate caseload movements (e.g., see Haider and Klerman, 2005, and Klerman
and Haider, 2004, with respect to the AFDC/TANF program).
If the phenomenon of ‘nonparticipating eligibles’ is chiefly an issue of individuals
choosing not to participate during fleeting periods of eligibility, the SSI program may still be
very effective in achieving its income support goals, even in the face of fairly low static take-up
rates. On the other hand, if people in deep and persistent poverty do not enroll in SSI, this
suggests that the program is failing in a fundamental respect. The study of SSI participation is
further complicated by the fact that individuals may come into the program through either its
disability or aged provisions, and the types of individuals entering and the determinants of
entries through these two distinct portals may be quite different.
Studying these issues requires longitudinal data. One must characterize who is persistently
needy and program-eligible to assess whether SSI is meeting its poverty-relief goals.
Longitudinal data are required to test whether participant behavior is forward-looking. We
examine whether eligible participants are less likely than nonparticipating eligibles to transition
2
to a state of ineligibility. If so, this is consistent with the notion that SSI participants are a self-
selected group among eligibles; they have chosen to participate in the program because they
expect to remain eligible for a sufficient length of time to justify the associated transaction costs.
As noted, at a given point in time, the aged in SSI consist of two groups; those who have
qualified by age and need alone, and those who have ‘aged in’ from the disability component.
Longitudinal information is required to tell these two types of aged participants apart.
Our descriptive analysis of eligibility and participation spells, similar to the analysis of
AFDC and Food Stamps by Blank and Ruggles (1996), provides evidence consistent with
rational SSI participation behavior. However, the interpretation of this evidence is complicated
by the serious difficulties in accurately assessing program eligibility in the two widely used
household data sets that we employ. We document the extent of this measurement error problem
and find that its nature poses a serious challenge to the validity of take-up and related estimates
that ignore it. To investigate its implications further, we implement two corrections for
measurement error – one originally proposed by McGarry (1996) and another that exploits the
availability of longitudinal data. We contrast duration model estimates of transitions into and out
of both SSI participation and nonparticipating SSI eligibility with and without these corrections.
The paper proceeds as follows. Section II discusses prior work on program participation,
focusing on studies of SSI and studies of other programs that take a dynamic approach to
program participation. Section III describes the two data sources for this project, the Health and
Retirement Study (HRS) and the Survey of Income and Program Participation (SIPP). Section
IV provides detailed descriptive information on SSI eligibility and participation spells. Section
V presents competing risk hazard model estimates of exits from spells of SSI ineligibility and
SSI nonparticipating eligibility. Section VI provides empirical evidence on the troubling extent
3
of measurement error in prospective benefits and hence eligibility status. In Section VII, we
describe two alternative approaches to accounting for eligibility errors, present alternative
dynamic estimates of eligibility and participation transitions, and discuss findings from
competing risk hazard models of SSI entries and exits using these schemes. Section VIII
concludes.
II. Prior Work
Prior Work on SSI Participation
The phenomenon of SSI nonparticipating eligibles has been a policy concern since the
program’s inception. McGarry (1996) and Warlick (1982) estimate take-up rates in the early era
of the program, while Hill (1990) and Coe (1983) use a special survey on SSI use in the PSID to
explore information barriers to take-up. Yelowitz (2000) also considers the role of the Medicaid
benefit in attracting the aged into SSI. All of the models employed in these studies are static and
the findings can generally be interpreted as supporting the notion that nonparticipation reflects
rational decisionmaking. McGarry (1996) finds that the expected SSI benefit strongly influences
take-up, while Yelowitz finds that both the SSI benefit and the availability of Medicaid outside
of SSI influence SSI participation in expected ways. Hill’s (1990) work also suggests that those
with little to gain from the SSI program rationally choose not to become informed about it.
Until recently, measurement error was given short shrift in the welfare participation
literature, even though its presence may generate patterns that cannot be identified from those
generated by rational behavior. For example, nonparticipation in the face of a very small
positive expected benefit appears rational, but what if the researcher’s calculation is slightly
wrong, and the actual expected benefit is very small but negative? In that case, the household is
4
ineligible for SSI and cannot choose participation. The household’s presence in the analysis
sample is a mistake, and in the case of classical measurement error, the direction of influence of
this classification error bias is in fact unpredictable (Pudney, 2001, details the complex
implications of the measurement error problem for probit estimates of take-up). Within the SSI
literature, only McGarry (1996) attempts to control for this problem by introducing a weighting
scheme based on the assumption that measurement error in the researcher’s guess of prospective
eligibility is normally distributed. The difference between the researcher’s best guess of the
expected benefit and self-reported benefits of program participants provides an estimate of the
variance of the measurement error.1
Prior Work on Program Participation with a Longitudinal Focus
Blank and Ruggles (1996) comprehensively examines the eligibility and participation
spells of female-headed households in the AFDC and Food Stamp programs. Four major
stylized facts emerge from this analysis. First, single mothers use the AFDC program in about
two-thirds of total eligible months. Second, there are many short eligibility spells, and these
seldom result in participation; only 28 percent of eligibility spells result in receipt. Participation
occurs disproportionately during longer eligibility spells, as one expects if participation decisions
are rational and program entry is costly. Third, eligible female heads don’t waste time getting
onto welfare – 71% of AFDC participation spells start in the first month of eligibility, and the
probability of take-up declines precipitously thereafter. The entry hazard has a strong profile – if
entry does not occur almost immediately, it is unlikely to occur at all. Finally, Blank and
Ruggles (1996) find that many families appear to leave AFDC prematurely, in the sense that they
1 Gunderson and Kreider (2006) and Hernandez and Pudney (2007) take approaches to measurement error problems in other programs that involve more detailed modeling of the error process.
5
appear to remain eligible after the participation spell ends. Fully half of those exiting AFDC are
still eligible in the first period after exit, and a substantial share (30 percent) are eligible 6
months after exiting.
III. Data Sources
We use two data sources for this project. While the HRS has the advantage of a long
time frame, the data collection is low-frequency and the reference period is annual. In contrast,
the SIPP is high-frequency, but the time frame is short. In part, the SIPP findings are used to
better understand whether or not the dynamic phenomena discovered in the HRS are largely
artifacts of its design; in fact, we find below that many findings from the SIPP and HRS are
surprisingly similar.
The Survey of Income and Program Participation
The SIPP is a large representative sample of the U.S. population. In a typical panel of the
SIPP, approximately 50,000 households are interviewed every four months for 2 to 3 years. At
each interview ‘wave,’ respondents are asked about their income, program use, and other
activities during each of the prior 4 months. In principle, SSI eligibility and participation in the
SIPP can be computed on a monthly basis.
While the SIPP, unlike the HRS, does not focus on the elderly, it has the advantage of
beginning with a quite large household sample. In addition, since the panel is repeated over
time, a large number of elderly households can be assembled by pooling panels. A fundamental
shortcoming of the SIPP for the purposes of this study is its short window of observation.
Because transitions into and out of SSI participation are likely to be fairly infrequent (in contrast
6
to transitions of nonelderly households in and out of Food Stamps and AFDC), relatively few
such transitions will be recorded for the same household.
To construct our SIPP analysis data set, we pool households from the 1987, 1989, 1990,
1991, 1992, and 1993 panels. The 1988 panel is omitted because it contains no asset
information. In this version of the paper, our unit of observation is ‘person-wave.’ We use
income and program information from the fourth month of each wave and assume that the
information is the same in the prior three months. Given the well-known feature of ‘seam bias’
in the SIPP—that changes in variables like welfare participation status tend to be reported from
wave to wave, rather than month-to-month within waves—our findings are unlikely to change
notably were we to move down to the true person-month unit of observation.
The SIPP contains high-frequency information on many variables, including the income
variables needed to assess income-eligibility for SSI, program participation, and the SSI benefit
receipt amounts of participants. The usual complement of demographic variables is also
available, as is detailed information on household structure. State-of-residence geocodes in the
SIPP enable us to apply the state-specific SSI benefit to each person. Asset data are typically
collected twice during a panel at one-year intervals. In each panel, we select the asset topical
module that has the most complete accounting of assets and liabilities useful for assessing a
person’s asset eligibility for the SSI program.2
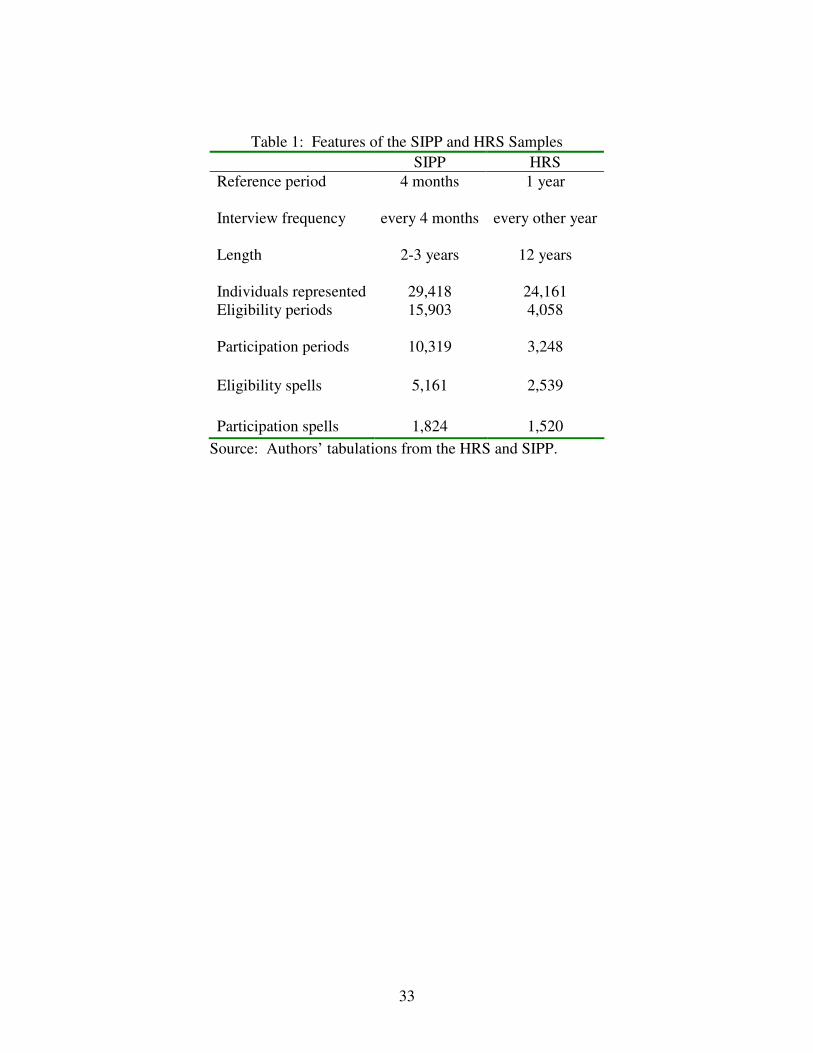
Table 1 presents the basic features of the SIPP sample, which represents 29,418 elderly
individuals. Collectively, they experience 15,903 periods (waves) of SSI eligibility and 10,319
periods of SSI participation. We often analyze ‘spells,’ or continuous runs of eligibility and
2 The procedures for assessing income and asset eligibility for both the HRS and the SIPP are available from the authors upon request.
7
participation. There are 2,539 SSI eligibility spells and 1,520 SSI participation spells in the
SIPP.
The Health and Retirement Study
The HRS is a representative sample of the U.S. population aged 51 and older. Interviews
began in 1992 with a base cohort aged 51-61 and an older cohort (AHEAD) aged 70 and above.
In 1998 and 2004 new cohorts were added to cover all ages over 50. Interviews are conducted
every other year, and information needed for computing eligibility and information about
program participation is collected with reference to ‘last year.’ Note that unlike in the SIPP, we
cannot compute the monthly eligibility that is the actual basis for determining SSI program
eligibility. This inevitably introduces additional measurement problems. For example, a
respondent in the HRS may be SSI-eligible for part of the previous year, yet correctly classified
as ‘ineligible’ on the basis of annual income. Similarly, a person may have been SSI-eligible on
an annual basis but actually ineligible for some portions of the year.
We use both asset and income information in the HRS to assess program eligibility. At the
time of this writing, HRS geocodes were not available to us. Therefore additional measurement
error is introduced because we can only apply the federal component of SSI rules to all HRS
sample members, regardless of their own state’s policies (this will be corrected in future
revisions). Overall, this problem results in an understatement of SSI eligibility.
Table 1 presents the basic features of the HRS sample, which consists of repeated
observations on 24,161 elderly individuals. There are 4,058 periods (years) of SSI eligibility and
3,248 periods of SSI participation. These are organized into 2,539 SSI eligibility spells and
1,520 SSI participation spells (i.e., reported eligibility or participation status in consecutive
survey waves is unchanged).
8
Comparative Descriptive Information
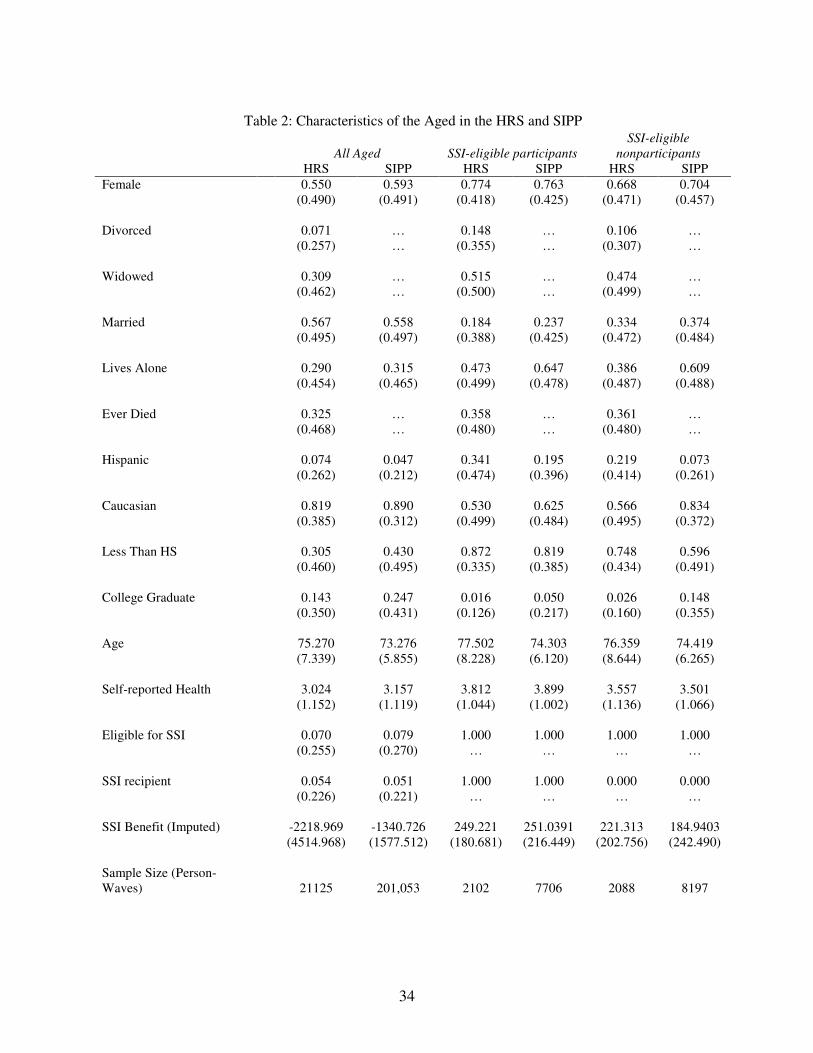
Table 2 presents means sample characteristics for both the SIPP and HRS. Overall, the
first two columns suggest that SIPP and HRS sample members have fairly similar characteristics.
Average age, health status, and marital history are similar. There are somewhat more minority
members and women in the SIPP. Education patterns differ between the two samples. While a
smaller share of SIPP sample members report high school incompletion than those in the HRS, a
greater share claim to have graduated college. The imputed SSI eligibility rates for the two
samples are similar; 7 percent of HRS sample members are assessed to be SSI-eligible, as
opposed to 7.9 percent of SIPP sample members. SSI recipiency rates for both samples are
around 5 percent.
The subsequent columns of Table 2 indicate the characteristics of the subsamples of
sample members who are assessed to be SSI-eligible after applying SSI rules to their incomes
and assets. Columns 3 and 4 indicate the sample characteristics of SSI participants whom we
classify as eligibles, while columns 5 and 6 indicate the characteristics of sample members
whom we classify as eligible but who do not appear to take up SSI. All eligibles, participating or
not, have characteristics associated with their vulnerable financial state; they are more likely to
be female, living alone, minority members, less educated, and substantially unhealthier than their
ineligible counterparts. In comparison with participating eligibles, nonparticipating eligibles are
better educated, in better health, and less likely to live alone than participants. As has been
found in prior studies, nonparticipating eligibles also face substantially lower (by $28 in the HRS
sample and $66 in the SIPP) SSI benefits than participants. This inequality has commonly been
interpreted as evidence of transaction costs and rational nonparticipation in past work.
9
IV. Descriptive Information on Eligibility and Participation Spells
It has long been noted that SSI take-up rates are low relative to other income-support
programs. We begin this section with a discussion of SSI take-up before proceeding to detailed
analyses of eligibility and participation spells. We then directly compare the characteristics of
SSI spells with those uncovered by Blank and Ruggles (1996) for the AFDC program.
SSI Take-Up Patterns by Age and Disability History
As noted above, the SSI program is unusual in that it combines an ‘ordinary’ income-
support program for the elderly (defined as ages 65 up) with a disability program potentially
open to any age group. The limited available evidence (Powers and Neumark, 2005; Elder and
Powers, 2004) suggests that the behavior of these two groups may be quite different. Therefore,
it is important to understand how many elderly may have ‘aged in’ from the disability program.
The lengthy records of the HRS make it possible to explore this issue.
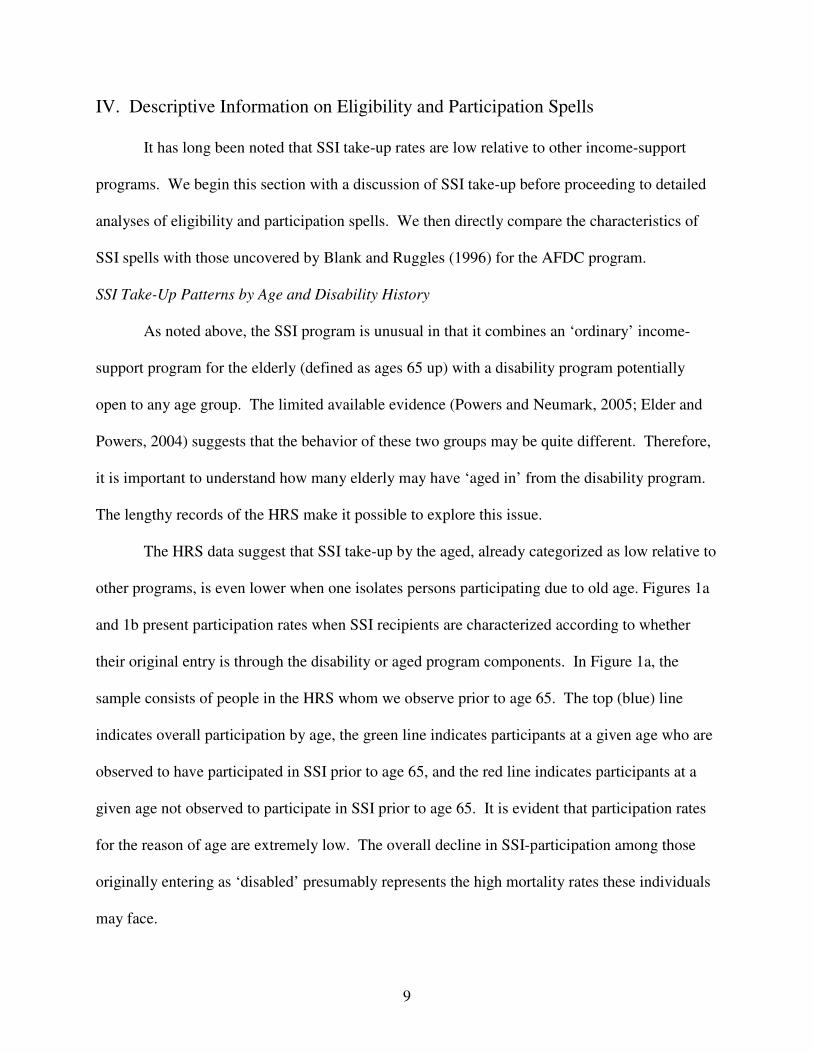
The HRS data suggest that SSI take-up by the aged, already categorized as low relative to
other programs, is even lower when one isolates persons participating due to old age. Figures 1a
and 1b present participation rates when SSI recipients are characterized according to whether
their original entry is through the disability or aged program components. In Figure 1a, the
sample consists of people in the HRS whom we observe prior to age 65. The top (blue) line
indicates overall participation by age, the green line indicates participants at a given age who are
observed to have participated in SSI prior to age 65, and the red line indicates participants at a
given age not observed to participate in SSI prior to age 65. It is evident that participation rates
for the reason of age are extremely low. The overall decline in SSI-participation among those
originally entering as ‘disabled’ presumably represents the high mortality rates these individuals
may face.
10
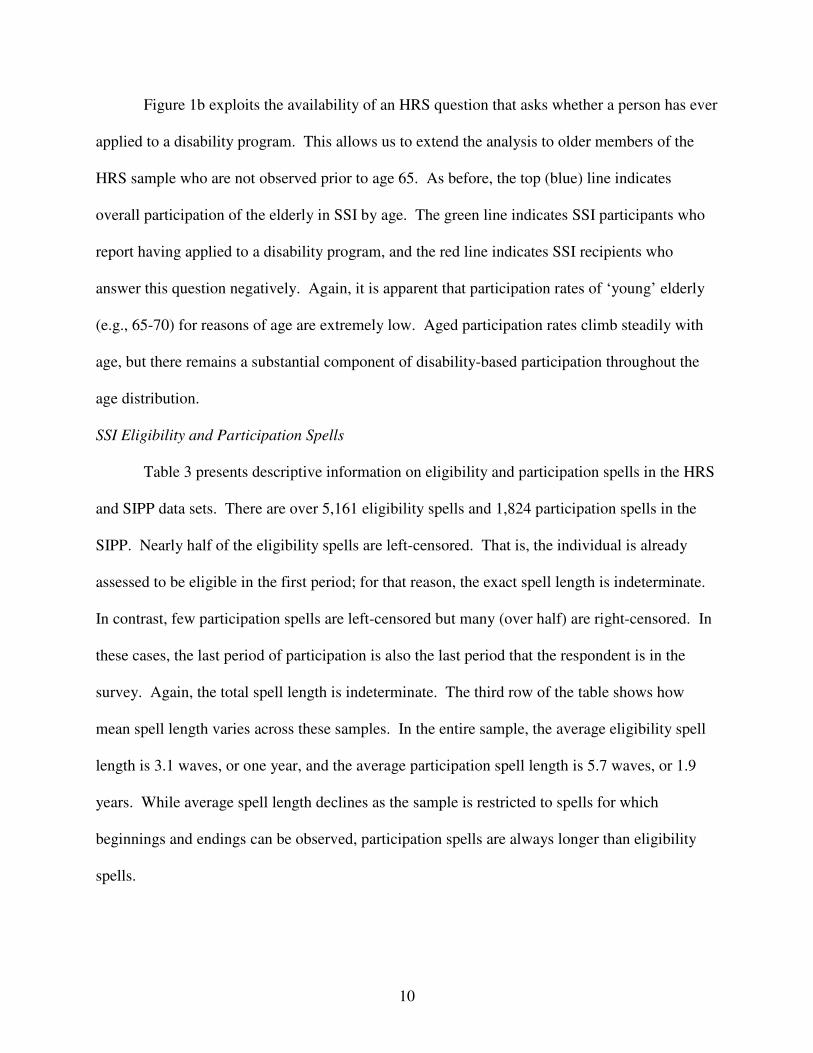
Figure 1b exploits the availability of an HRS question that asks whether a person has ever
applied to a disability program. This allows us to extend the analysis to older members of the
HRS sample who are not observed prior to age 65. As before, the top (blue) line indicates
overall participation of the elderly in SSI by age. The green line indicates SSI participants who
report having applied to a disability program, and the red line indicates SSI recipients who
answer this question negatively. Again, it is apparent that participation rates of ‘young’ elderly
(e.g., 65-70) for reasons of age are extremely low. Aged participation rates climb steadily with
age, but there remains a substantial component of disability-based participation throughout the
age distribution.
SSI Eligibility and Participation Spells
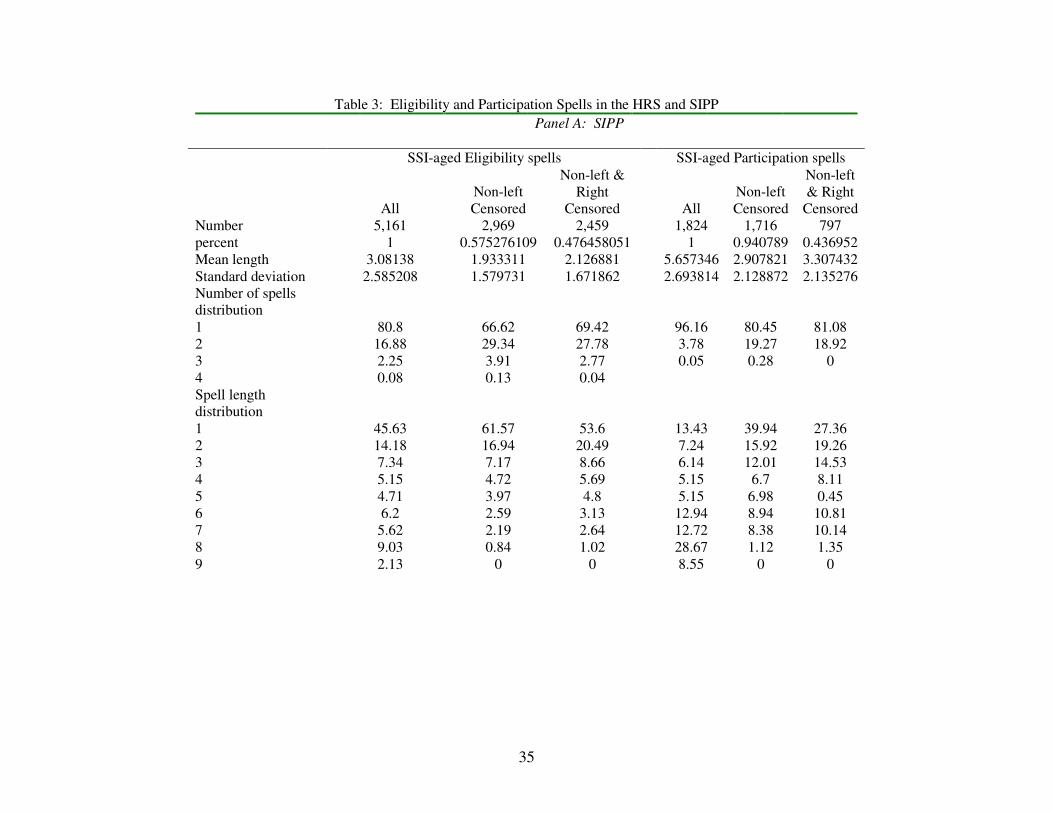
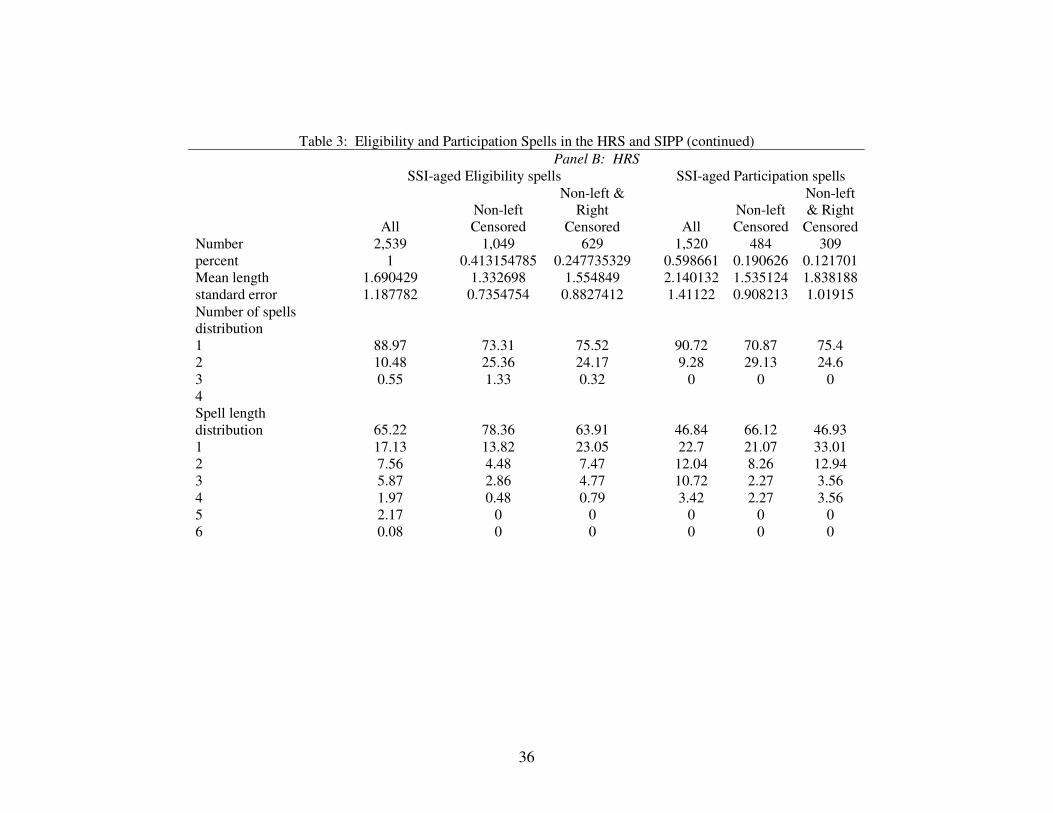
Table 3 presents descriptive information on eligibility and participation spells in the HRS
and SIPP data sets. There are over 5,161 eligibility spells and 1,824 participation spells in the
SIPP. Nearly half of the eligibility spells are left-censored. That is, the individual is already
assessed to be eligible in the first period; for that reason, the exact spell length is indeterminate.
In contrast, few participation spells are left-censored but many (over half) are right-censored. In
these cases, the last period of participation is also the last period that the respondent is in the
survey. Again, the total spell length is indeterminate. The third row of the table shows how
mean spell length varies across these samples. In the entire sample, the average eligibility spell
length is 3.1 waves, or one year, and the average participation spell length is 5.7 waves, or 1.9
years. While average spell length declines as the sample is restricted to spells for which
beginnings and endings can be observed, participation spells are always longer than eligibility
spells.
11
The next rows of Table 3 present eligibility and participation spell distributions. First,
spell openings are tabulated according to whether it is the first, second, or higher spell observed
for the same respondent. This indicates the prevalence of cycling in and out of eligibility and
participation statuses in the sample. Note again the differences between eligibility and
participation. In the case of participation, a large majority of respondents report but a single
spell of participation, while eligibility cycling is more common.
The distribution of spell lengths is presented last. Just under one-half of all eligibility
spells last a single period. Long eligibility spells are not uncommon, however; 27.7 percent last
from 5 to 9 consecutive waves, or 1.7 to 3.75 years. The fact that long spells are very long is
reinforced by the fact that most long spells are left-censored. The impact of right and left
censoring on sample size in the HRS is even greater. Presumably, this is because of the low
frequency collection of data. In the SIPP, there are many short spells occurring away from the
endpoints of the data window, but in the HRS there are fewer transitions between participation
and eligibility statuses and therefore more opportunities for spells to be coincident with
endpoints. Similar qualitative patterns obtain for participation spells, although participation
spells are generally much longer than eligibility spells.
As discussed above, Blank and Ruggles (1996) identify four major features of AFDC and
Food Stamp spells. We conclude our preliminary discussion of SSI eligibility and participation
spells by investigating whether these features also hold for the SSI program and its targeted
population.
1. Participation in Eligible Periods
The take-up rate is a basic indicator of welfare program effectiveness. The ratio of the
total number of periods in which eligible individuals participate to the total number of periods of
12
eligibility yields a “period take-up rate” of around 48 percent in the SIPP and 51% in the HRS.
Therefore our cross-section take-up figures conform quite closely to the rates reported for the
SSI program in McGarry (1996) and Warlick (1982).
Even at this early stage of analysis, however, the issue of the misclassification of
eligibility has potentially important implications. Large numbers of sample members report
participation, even though they are assessed as ineligible based on their income and assets and
our classification rules. In fact, one-quarter of self-reported SSI participants in the SIPP and
over one-third (36 percent) of self-reported SSI participants in the HRS are classified as
ineligible. If it is assumed (as has been done in some previous work) that self-reported SSI
participants must be program-eligible, then take-up rates rise to 56 and 62 percent in the SIPP
and HRS samples, respectively. Even these take-up rates, however, lie below the basic AFDC
take-up rates of around two-thirds for single mothers in Blank and Ruggles (1996). This finding
suggests that take-up of the SSI program by the aged is low relative to other targeted groups and
programs.
2. Participation and Duration of Eligibility Spells
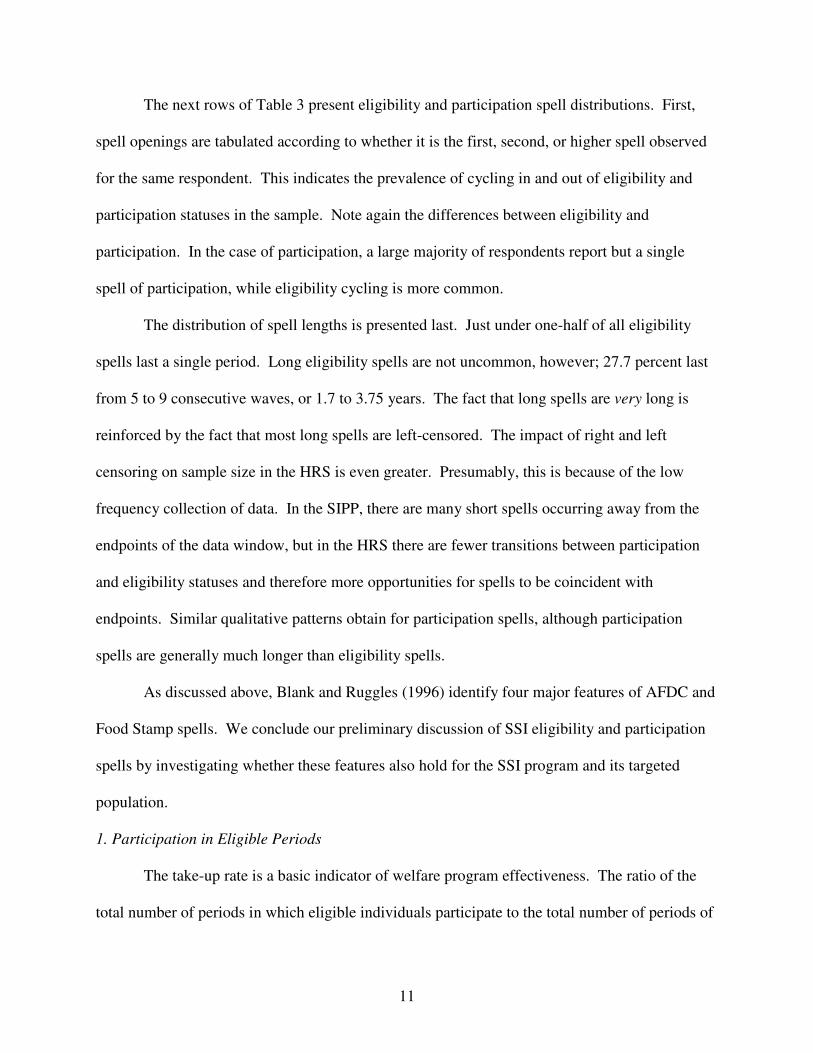
Blank and Ruggles (1996) note that short eligibility spells are common and often do not
result in participation. The fact that the incidence of participation grows with eligibility spell
length is offered as evidence of the rational behavior of individuals with regard to welfare
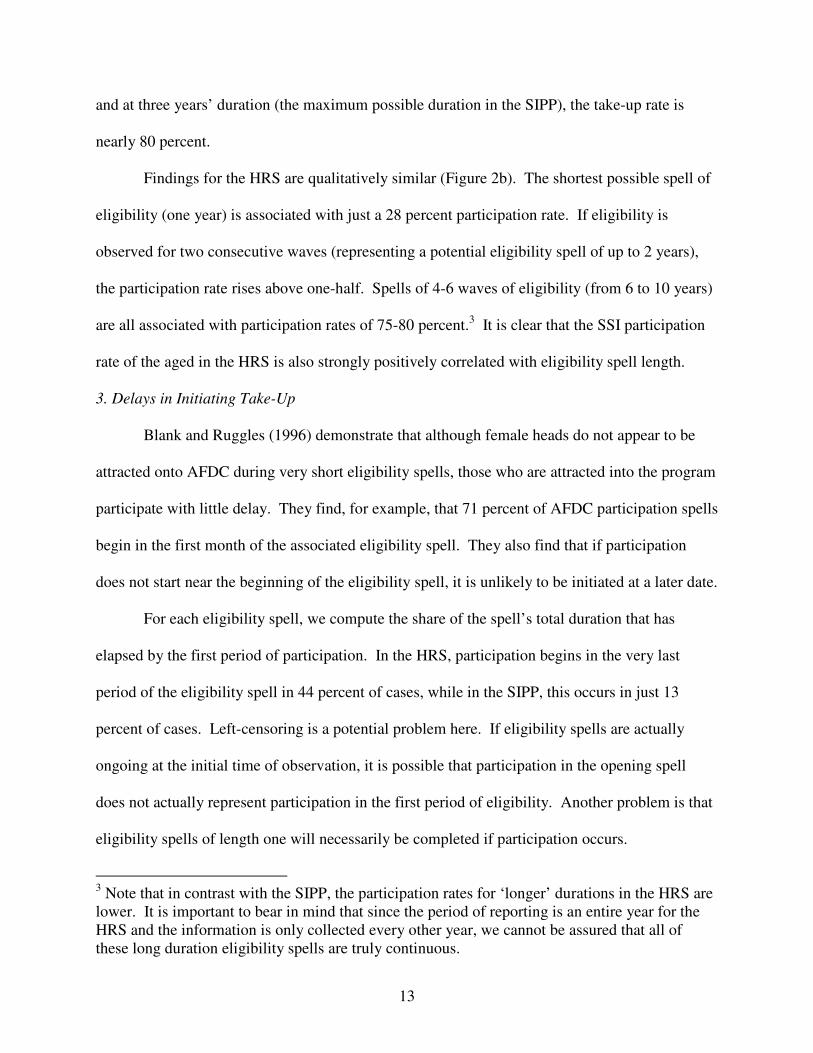
participation. This stylized fact holds for our data also, as illustrated in Figures 2a and 2b.
In the SIPP (Figure 2a) the share of eligible months with reported SSI participation is just
under 12 percent for spells that last only 1 wave, or 4 months. The participation rate climbs
quickly thereafter. In eligibility spells consisting of 3 consecutive waves – a one-year period –
the take-up rate is 31.3 percent. At two years’ duration of eligibility, the rate is over 50 percent,
13
and at three years’ duration (the maximum possible duration in the SIPP), the take-up rate is
nearly 80 percent.
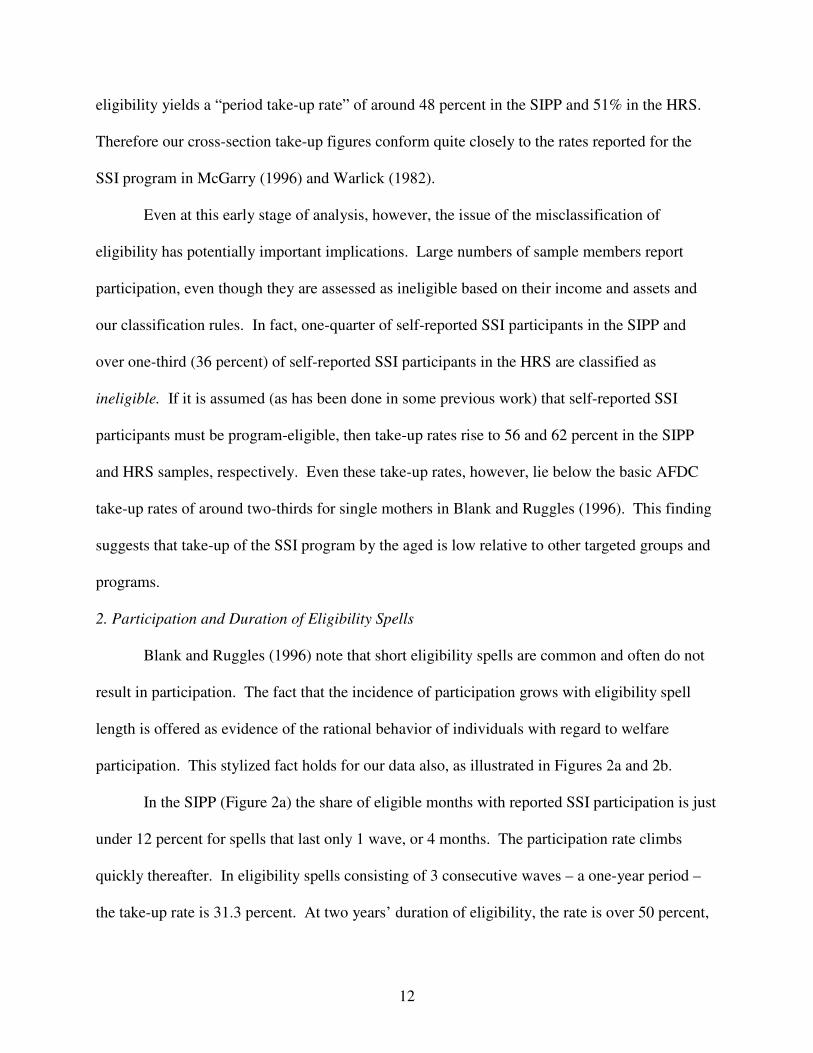
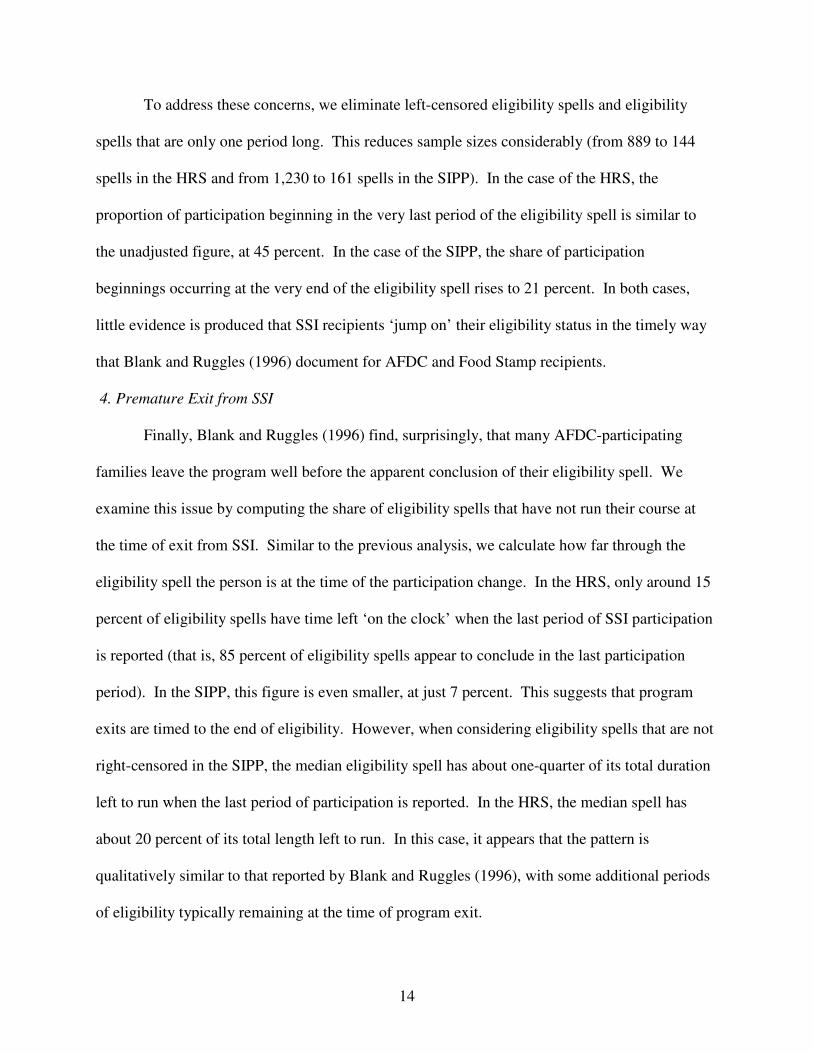
Findings for the HRS are qualitatively similar (Figure 2b). The shortest possible spell of
eligibility (one year) is associated with just a 28 percent participation rate. If eligibility is
observed for two consecutive waves (representing a potential eligibility spell of up to 2 years),
the participation rate rises above one-half. Spells of 4-6 waves of eligibility (from 6 to 10 years)
are all associated with participation rates of 75-80 percent.3 It is clear that the SSI participation
rate of the aged in the HRS is also strongly positively correlated with eligibility spell length.
3. Delays in Initiating Take-Up
Blank and Ruggles (1996) demonstrate that although female heads do not appear to be
attracted onto AFDC during very short eligibility spells, those who are attracted into the program
participate with little delay. They find, for example, that 71 percent of AFDC participation spells
begin in the first month of the associated eligibility spell. They also find that if participation
does not start near the beginning of the eligibility spell, it is unlikely to be initiated at a later date.
For each eligibility spell, we compute the share of the spell’s total duration that has
elapsed by the first period of participation. In the HRS, participation begins in the very last
period of the eligibility spell in 44 percent of cases, while in the SIPP, this occurs in just 13
percent of cases. Left-censoring is a potential problem here. If eligibility spells are actually
ongoing at the initial time of observation, it is possible that participation in the opening spell
does not actually represent participation in the first period of eligibility. Another problem is that
eligibility spells of length one will necessarily be completed if participation occurs.
3 Note that in contrast with the SIPP, the participation rates for ‘longer’ durations in the HRS are lower. It is important to bear in mind that since the period of reporting is an entire year for the HRS and the information is only collected every other year, we cannot be assured that all of these long duration eligibility spells are truly continuous.
14
To address these concerns, we eliminate left-censored eligibility spells and eligibility
spells that are only one period long. This reduces sample sizes considerably (from 889 to 144
spells in the HRS and from 1,230 to 161 spells in the SIPP). In the case of the HRS, the
proportion of participation beginning in the very last period of the eligibility spell is similar to
the unadjusted figure, at 45 percent. In the case of the SIPP, the share of participation
beginnings occurring at the very end of the eligibility spell rises to 21 percent. In both cases,
little evidence is produced that SSI recipients ‘jump on’ their eligibility status in the timely way
that Blank and Ruggles (1996) document for AFDC and Food Stamp recipients.
4. Premature Exit from SSI
Finally, Blank and Ruggles (1996) find, surprisingly, that many AFDC-participating
families leave the program well before the apparent conclusion of their eligibility spell. We
examine this issue by computing the share of eligibility spells that have not run their course at
the time of exit from SSI. Similar to the previous analysis, we calculate how far through the
eligibility spell the person is at the time of the participation change. In the HRS, only around 15
percent of eligibility spells have time left ‘on the clock’ when the last period of SSI participation
is reported (that is, 85 percent of eligibility spells appear to conclude in the last participation
period). In the SIPP, this figure is even smaller, at just 7 percent. This suggests that program
exits are timed to the end of eligibility. However, when considering eligibility spells that are not
right-censored in the SIPP, the median eligibility spell has about one-quarter of its total duration
left to run when the last period of participation is reported. In the HRS, the median spell has
about 20 percent of its total length left to run. In this case, it appears that the pattern is
qualitatively similar to that reported by Blank and Ruggles (1996), with some additional periods
of eligibility typically remaining at the time of program exit.
15
V. Hazard Model Estimates
We next estimate competing-risk hazard models of the determinants of transitions
between three distinct states: participation, nonparticipating ineligibility, and ineligibility. For
example, a spell of SSI participation may end because the respondent becomes ineligible or
transitions into nonparticipating eligibility. Alternatively, the spell’s end may not be observed,
in which case it is treated as censored. In all cases, we include as explanatory factors
demographic characteristics (sex, race, and age), marital status, marital history and important
marital changes (newly widowed), educational attainment (high school graduate), health (a
dummy variable indicating that self-reported health is ‘poor’ or ‘fair’), and the expected SSI
benefit (as computed from program rules and income and asset information). In this section, we
do not consider the problem of classification error. If a person has a calculated expected SSI
benefit that is positive and they meet the asset test, then they are classified as program-eligible.
Conventional duration specifications did not yield sensible findings (we suspect due to the
classification problem). The alternative approach to modeling duration dependence taken in
each model is explained below in the discussion of the findings.
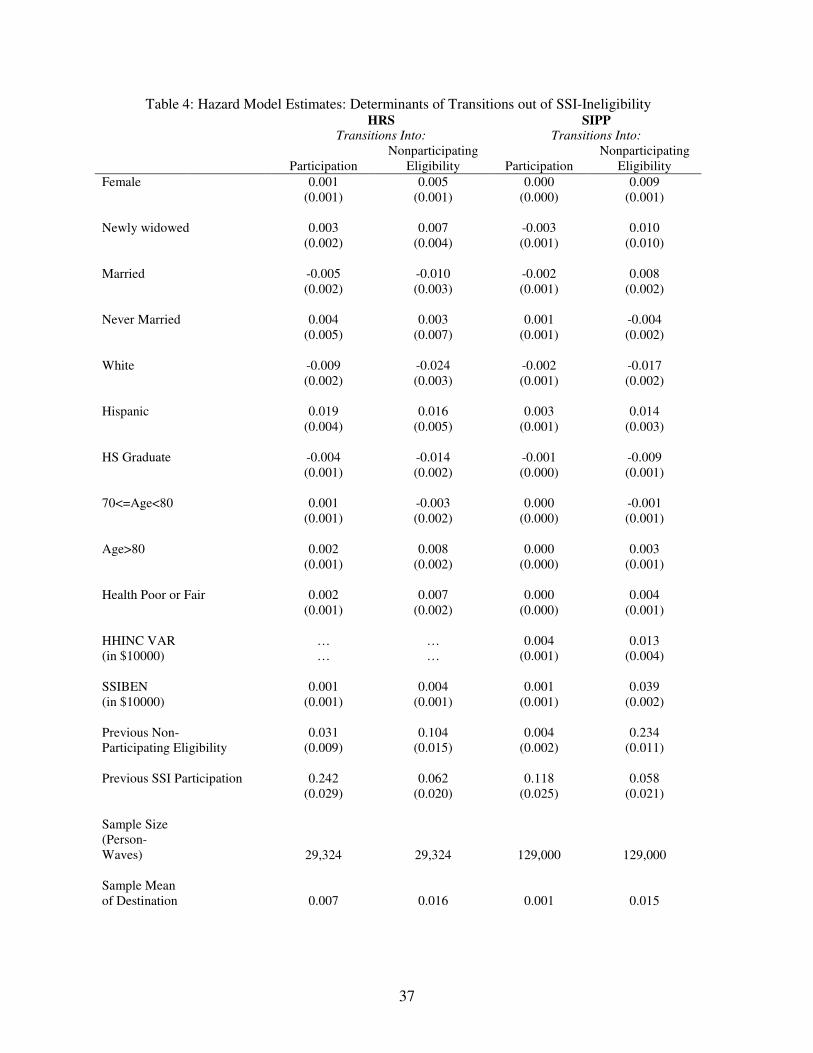
Transitions of SSI Ineligibles
Spells of SSI ineligibility can end in participation or in eligibility without participation.
The model estimates are presented in Table 4 (the estimates are of probability changes with
appropriate standard errors in parentheses beneath). Determinants of transitions into
participation (when significant) are overall similar for the HRS and SIPP samples. Ineligible
elderly who are currently married, white and have a high school diploma are significantly less
likely than others to transition into participation. Those who are Hispanic are significantly more
likely to become participants. Some factors’ effects differ across the two data sets. The HRS
16
findings indicate that the very old and those in poor health are more likely to transition into SSI,
while in the SIPP these factors are insignificant. The monthly variance of household income is
computed in the SIPP and those with greater income variability are more likely to become
participants. In both data sets, the value of the expected SSI benefit does not have a significant
effect on participation, in contrast to the static findings in McGarry (1996) and Elder and Powers
(2006).
Findings for the likelihood of transitions from ineligibility into nonparticipating
eligibility are presented in the second and fourth columns of Table 4. Again, overall the factors
influencing transitions in the HRS and SIPP are similar. Women, Hispanics, the very old, and
those in poor or fair health are more likely to become nonparticipating eligibles. Whites and
high school graduates in both data sets are less likely to become nonparticipating eligibles. The
most interesting finding is that the expected SSI benefit has a positive influence on
nonparticipating eligibility but no influence on participation. This suggests the expected
benefit’s role in this context is merely as an indicator of low resources (i.e., the
‘eligible/ineligible’ categorization). There is no evidence of a ‘behavioral’ effect of benefit
generosity in Table 4.
Some findings differ for the two samples. The newly widowed are more likely to
transition to nonparticipating eligibility in the HRS, while the effects of present marital status are
opposite in the HRS and SIPP. Individuals who have never been married are less likely to
become nonparticipating eligibles in the SIPP, and those with more income variation (as
computed in the SIPP) are more likely to become eligible without SSI participation.
Finally, duration dependence is modeled by including variables indicating any prior
period with nonparticipating eligible status and any prior period with SSI participation status. In
17
both the HRS and SIPP, persistently low resources, as indicated by past eligibility status, indicate
the person is likely to become eligible again and is also more likely to transition into
participation. Prior SSI participation also indicates that a person is likely to slip back into a low-
resource state (and become eligible for SSI again) and will participate in SSI again.
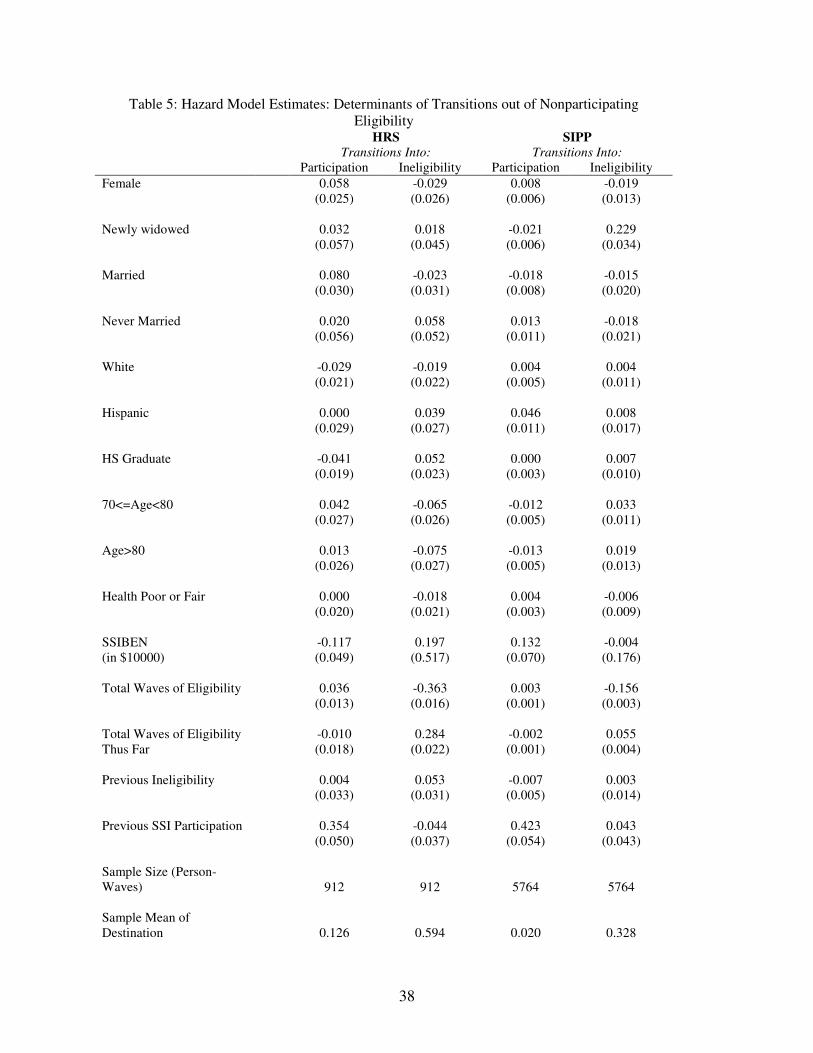
Transitions of SSI Nonparticipating Eligibles
Table 5 presents estimates that spells of nonparticipating eligibility will end in either
participation or ineligibility. In contrast with Table 4, the estimates from the HRS and SIPP
samples differ markedly. In the HRS, female sex and being married increase the probability of
participation, while holding a high school diploma and a higher expected SSI benefit reduce the
participation probability. This last finding is unexpected but not at odds with theory, for two
reasons. First, we have not been able to implement state-specific benefits in the HRS as of this
writing. Second, the coefficient on the expected SSI benefit in this model measures the marginal
effect of the benefit amount on participation, conditional on ever entering the state of
nonparticipating eligibility. Although the unconditional elasticity is predicted to be positive, no
such unambiguous prediction exists for a conditional elasticity. In the SIPP sample, the expected
benefit has a positive association with participation. Hispanic race also increases the likelihood
of a transition into participation. Being newly widowed or married reduces the probability of
participation in the SIPP, while the SIPP also displays some significant differences in behavior
by age (older ineligible sample members are less likely to transition into participation than those
in the 65-69 age range).
There are few significant factors predicting the transition from eligible to ineligible
states. In the HRS, a high school diploma increases the likelihood of ineligibility, while the
probability is lower at older ages. This is expected if, as seems reasonable, older individuals are
18
unlikely to find new sources of income. It is not reflected in the SIPP, however, and the finding
for 70-80-year-olds in the two samples conflicts. In the SIPP, newly widowed individuals are
much more likely to become ineligible, but this effect is not observed in the HRS.
Finally, duration dependence is modeled by including dummy variables indicating prior
SSI-ineligibility, prior SSI participation, and eligibility waves. The latter are decomposed into
the total number of waves of eligibility and the total number of waves of eligibility to the current
time. ‘Total waves to date’ is the variable intended to capture duration dependence. In both the
SIPP and HRS samples, a longer time in nonparticipating eligibility status makes a person much
more likely to exit through ineligibility, rather than participation. That is, those SSI-eligibles
who do not participate are very unlikely to change their behavior with regard to participation;
exits arise entirely through eligibility changes. The number of total waves of eligibility has a
small positive effect on participation, but only in the SIPP. In both the HRS and SIPP, however,
it has a large negative effect on ineligibility, as one would expect.4
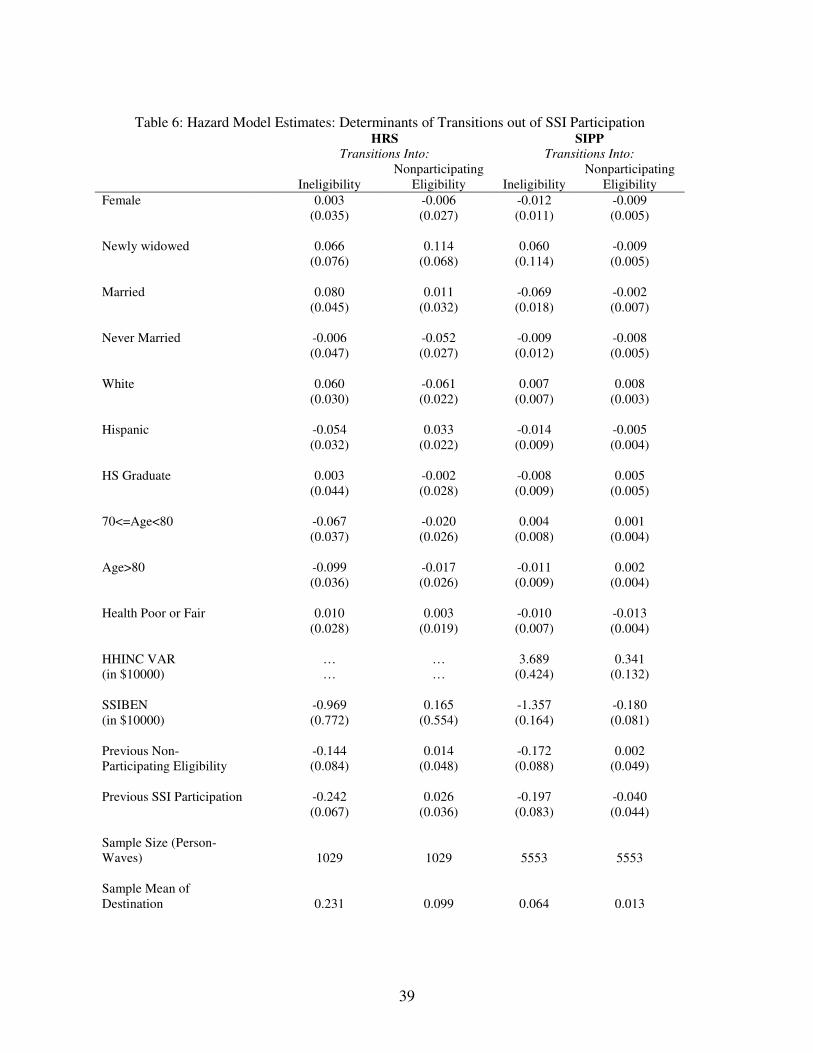
Transitions of SSI Participants
Finally, Table 6 presents estimates of the probabilities that SSI participation spells are
resolved by changes in eligibility status or by the type of ‘premature’ exit from the program that
Blank and Ruggles (1996) note in the case of AFDC. Few variables explain the probability of
transitions into ineligibility in either sample. In the HRS, being white increases the probability
of exiting through resource increases, while being very old decreases this probability. In the
SIPP, those who are married, those who are very old and those in poor or fair health are less
likely to exit participation due to ineligibility, while greater household income variance increases
4 This positive association should be interpreted cautiously since it is mechanical, e.g., a respondent who is eligible in every wave, and who therefore has a large value of “total waves of eligibility”, will never exit to ineligibility.
19
the likelihood of this occurrence. A higher expected benefit greatly reduces the probability of
exiting participation through ineligibility in the SIPP.
In the HRS, the newly widowed appear to have a higher chance of exiting SSI while they
are still program-eligible, while never married and white participants have a significantly lower
chance of exiting the program prematurely. The findings for whites in the SIPP are at odds with
those in the HRS, while those in poor or fair health are less likely to leave the program while still
eligible. In the SIPP, those with high benefits are less likely to leave SSI prior to the end of an
eligibility spell.
Again, duration dependence is captured by including variables indicating past
participation and eligibility experiences. There is some evidence in the SIPP that if a person has
been eligible for SSI in the past, they are likely to be ‘stuck’ in this state – the probability that
they exit SSI due to ineligibility is greatly reduced. A history of SSI participation greatly
reduces the probability of exiting SSI due to ineligibility in both data sets. This strong finding
suggests that people who are the ‘participating type’ do not exit because of concerns over
welfare stigma, e.g., but that exits occur chiefly because of eligibility changes.
In the introduction, we noted that if participants are less likely to transition to a state of
ineligibility than nonparticipating eligibles, this is evidence consistent with forward-looking
behavior. The bottom rows of Tables 5 and 6 provide the relevant statistics for this comparison.
The probability of transitions from nonparticipating eligibility to ineligibility far exceeds the
probability that participants become ineligible in both the HRS and the SIPP. The relevant rates
are 59.4 percent and 23.1 percent in the HRS and 32.8 percent and 6.4 percent in the SIPP.
20
VI. Empirical Evidence of Measurement Error in Eligibility and Prospective
Benefits
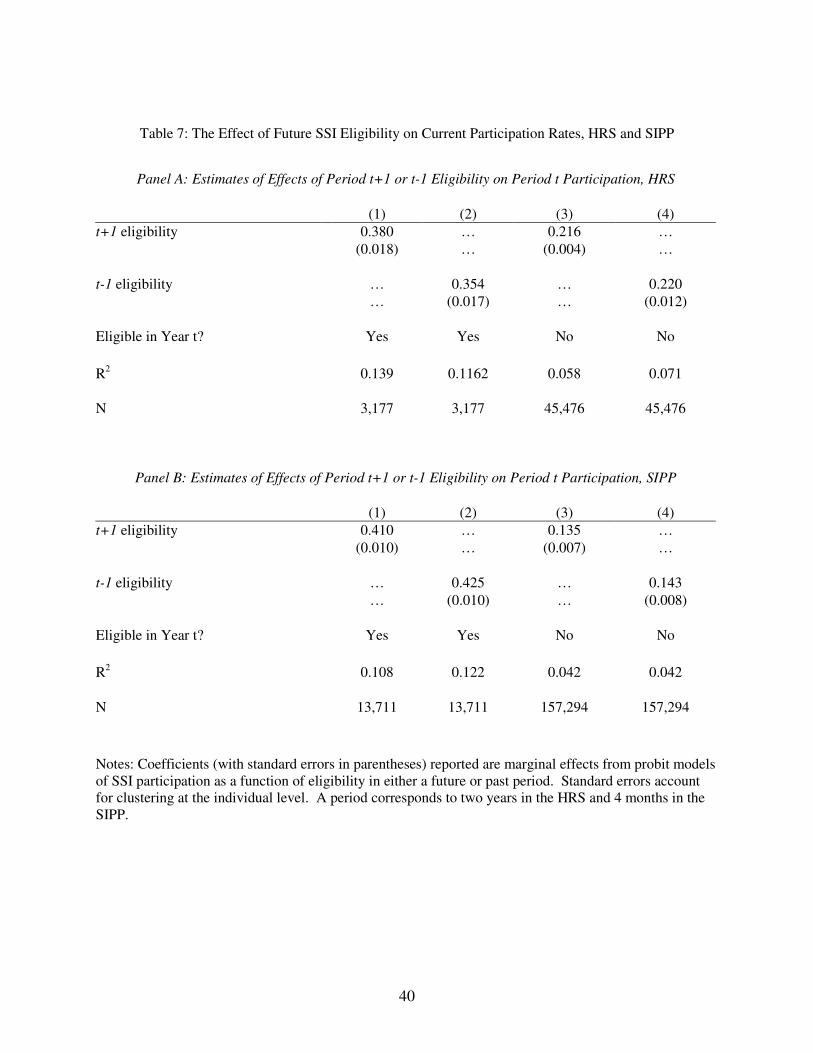
Our primary interest is determining the role of the expected duration of SSI eligibility in
decisions to enroll in the program. Table 7 presents estimates from probit models of SSI
participation decisions as a function of one-period-ahead eligibility status. Because future
eligibility status may be correlated with current expected benefit levels, which in turn may
influence participation today, we include the current expected benefit, as well as the
demographic variables listed in Tables 4-6, as additional controls (these coefficients are not
reported in Table 7). The first column of panel A seems to imply that future dynamics play a
dramatic role in SSI participation decisions – among those eligible in a given wave of data
collection, being eligible in the next wave increases the SSI participation rate by 38 percentage
points (the estimates in the table represent marginal effects). Similarly, the first column in panel
B shows that next-wave eligibility in the SIPP increases participation by 41 percentage points,
conditional on being eligible in the current wave. Both of these effects are sizeable, implying
that future eligibility more than doubles the current participation rate, from roughly 30 percent to
70 percent in both data sets. The similarity in magnitude across the two data sets is perhaps
surprising, since one wave corresponds to roughly two years of calendar time in the HRS and
four months in the SIPP.
Although it is tempting to interpret the estimates in column (1) in Table 7 as confirmation
that SSI participation decisions are inherently forward-looking, the estimates in column (2) cast
doubt on this interpretation. In particular, note that the association between previous (wave t-1)
eligibility and participation is of similar magnitude to the relationship between future eligibility
and participation in both the HRS and SIPP. Conditional on current participation, there is little
21
behavioral reason that previous eligibility should affect current participation at all, much less to
the same extent as future eligibility.5 This pattern suggests that multiple periods of eligibility
increase participation rates, but the timing of these periods is largely irrelevant. Columns (3) and
(4) confirm this view, indicating that both future and past eligibility substantially increase current
participation, even among those who appear to be currently ineligible. In the HRS, the
participation rates for those who appear ineligible in both the present and future periods is 1.4
percent, compared to roughly 25 percent among those presently ineligible but eligible in an
adjacent wave. The corresponding figures in the SIPP are 1.1 percent and 15 percent,
respectively.
The lack of correspondence between the timing of eligibility and participation suggests
that much of the time-series cycling between various states may be due to time-varying
classification error in the determination of which households are eligible and which are not. At a
minimum, the findings suggest that either individuals misreport their participation status, or that
at least one fourth of all households who appear transitorily ineligible are not.
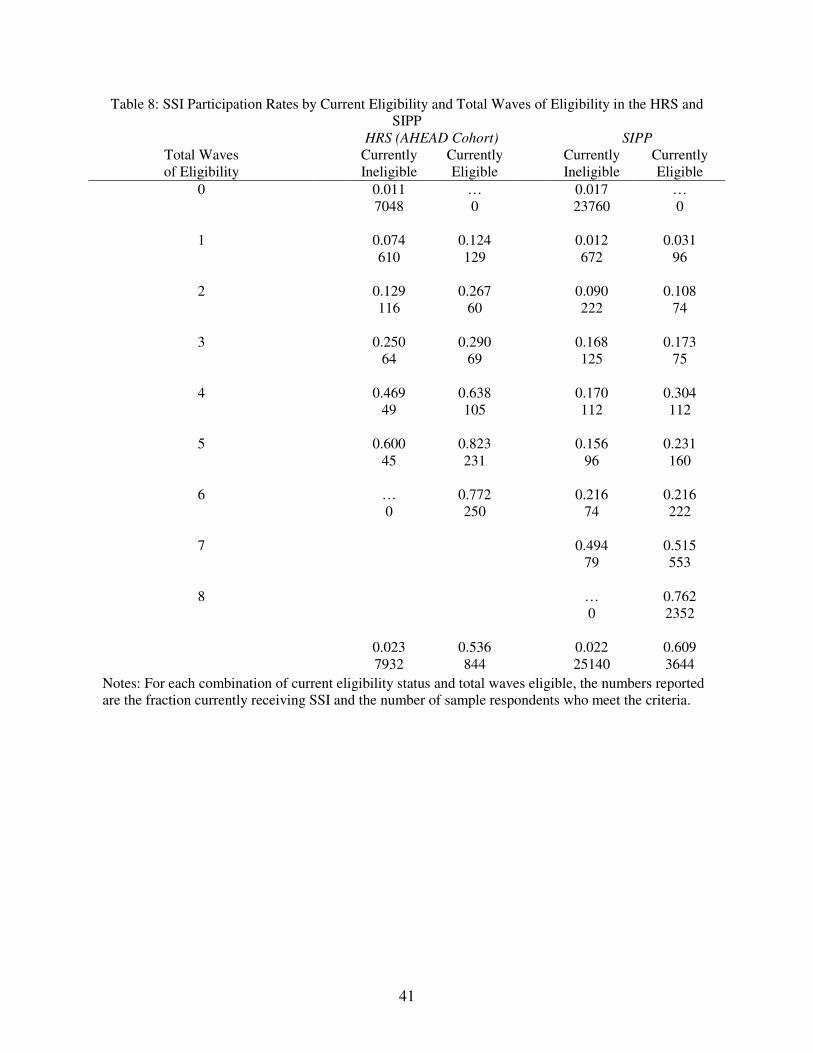
Table 8 presents further evidence that transitory changes in eligibility may be illusory.
The first two columns present SSI participation rates among the 8776 members of the HRS’s
AHEAD cohort who have responded to 6 surveys as of 2004.6 The top row shows that 1.1% of
all respondent-waves indicate SSI participation among those who never appear to be eligible.
Among the HRS’s 45 observations that correspond to current ineligibility but eligibility in the
five other periods, 60 percent involve participation in SSI. Similarly, in the SIPP, nearly half
5 To the extent that past eligibility is correlated with future eligibility, it will likely be related to future participation if one does not condition on future eligibility. In unreported models that include all three waves of eligibility, the three point estimates are roughly equivalent. 6 The first wave of the data collection for the AHEAD cohort was in 1993, with follow-ups in 1995, 1998, 2000, 2002, and 2004. A preliminary release of the 2006 data has recently become available.
22
(49.4%) of those who appear to be transitorily ineligible (i.e., eligible in 7 of the 8 waves in
which they appeared) participate in SSI. Note that this fraction is larger than the take-up rate
among all respondents who are currently eligible but have 6 or fewer total waves of eligibility.
Most strikingly, conditional on the total number of waves of eligibility, current eligibility status
has only a modest effect on participation rates in both data sets. This is particularly true in the
SIPP, where apparent eligibility cycling is presumably less likely to be genuine than in the HRS
due to the shorter span of time between each survey wave. Finally, as the results of Table 7
suggest, the total number of waves of eligibility are strongly associated with participation rates,
even among those who appear to be currently ineligible.
The patterns of Table 8 suggest that, absent a more accurate measure of eligibility, the
study of the determinants of transitions between various states may be severely hampered by
measurement error. This caveat is not directly relevant to the work of Blank and Ruggles (1996),
who studied transitions among AFDC eligibility and participation states, particularly if
researcher determinations of AFDC eligibility are less problematic than for SSI. However,
Blank and Ruggles (1996) conclude that many short spells of eligibility do not involve take-up
because agents rationally determine that the costs (stigma, informational, or otherwise) of take-
up are greater than the benefits associated with short spells of participation. If one ignores
measurement error – i.e., if one considered only the estimates in the first column of Table 7 – the
same conclusion would seem to apply in the case of SSI. This conclusion would not be
warranted, however, as the ability to test these sort of dynamic hypotheses appears to be severely
compromised by measurement error.
The notion that measurement error typically affects dynamic estimates more than static
ones is well known, but the patterns in Table 8 may also alter the interpretation of static
23
estimates of take-up rates as presented by McGarry (1996) and other researchers. Past work has
established a near-consensus that take-up of SSI is in the range of 0.45 to 0.60. We find overall
take-up rates of 0.536 and 0.609 in the balanced HRS and SIPP panels but much higher rates
among those persistently eligible – who are the most disadvantaged and presumably the focus of
policymakers. For those continuously eligible for eight waves in the SIPP, corresponding to
more than two years, 76.2 percent participate in SSI. The analogous figures are even higher in
the HRS, possibly because “continuous eligibility” is measured over a longer timeframe.
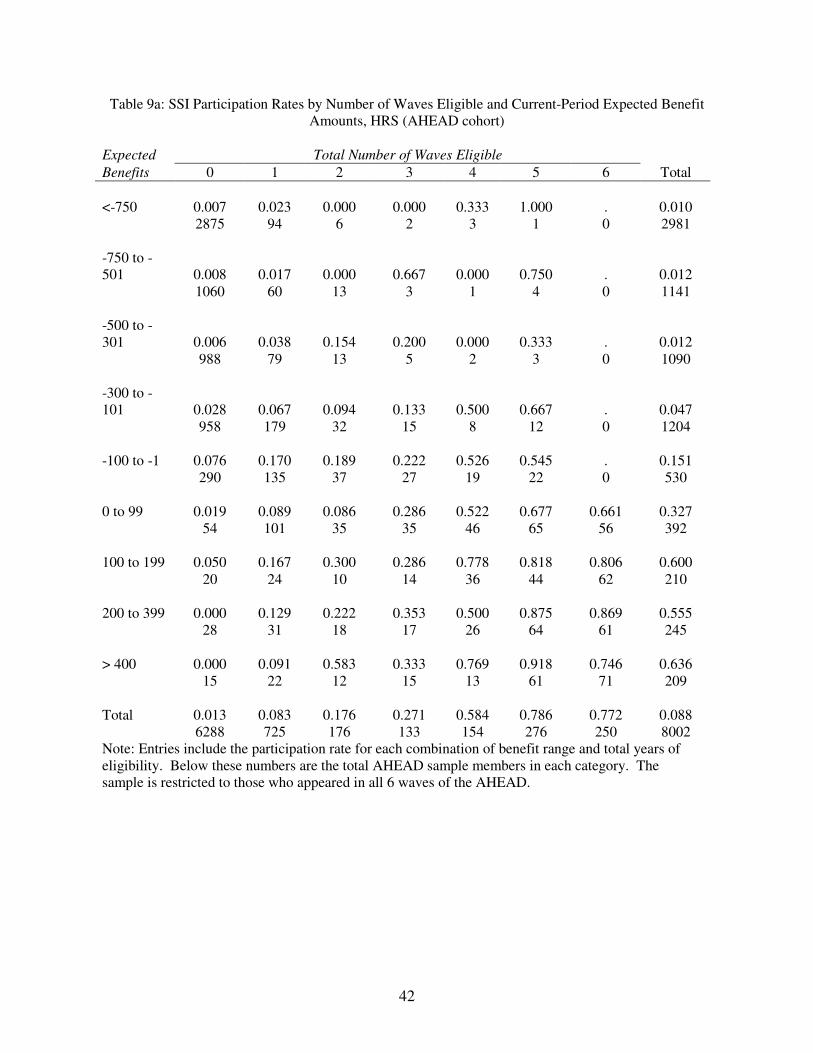
We present closely-related evidence of the extent of measurement error in Table 9a,
which shows participation rates separately for nine discrete categories of expected SSI benefits
and by the total number of waves eligible. We focus on a balanced sample of the AHEAD
cohort. As also reflected in Table 8, the total number of waves of eligibility strongly influences
participation rates. However, in Table 9a we also condition on a respondent’s current monthly
benefit level.7 Judging from the rightmost “Total” column, participation rises with the expected
benefit level for benefits greater than 0. The elasticity of participation with respect to benefit
levels has been the focus of previous research such as McGarry (1996), most of which has
concluded that benefit levels do positively affect participation. The figures in the table suggest
two caveats to this interpretation. First, the apparent positive association is already evident at
negative benefit levels. In particular, 15.1% of those with expected benefits between -$100 and -
$1 participate. This suggests that the proportion of eligible respondents misclassified as
ineligible is largest among those who are “marginally ineligible”, in accordance with additive,
classical measurement error. Second, the association between benefit levels and participation
7 Recall that a respondent is classified as SSI-eligible if expected benefits are positive and meets a resource test, specifying that an individual (couple) must have less than $2000 ($3000) in countable assets.
24
declines after conditioning on the total number of waves of eligibility. This can be seen by
contrasting the rise in unconditional participation rates reported in the last column with those in
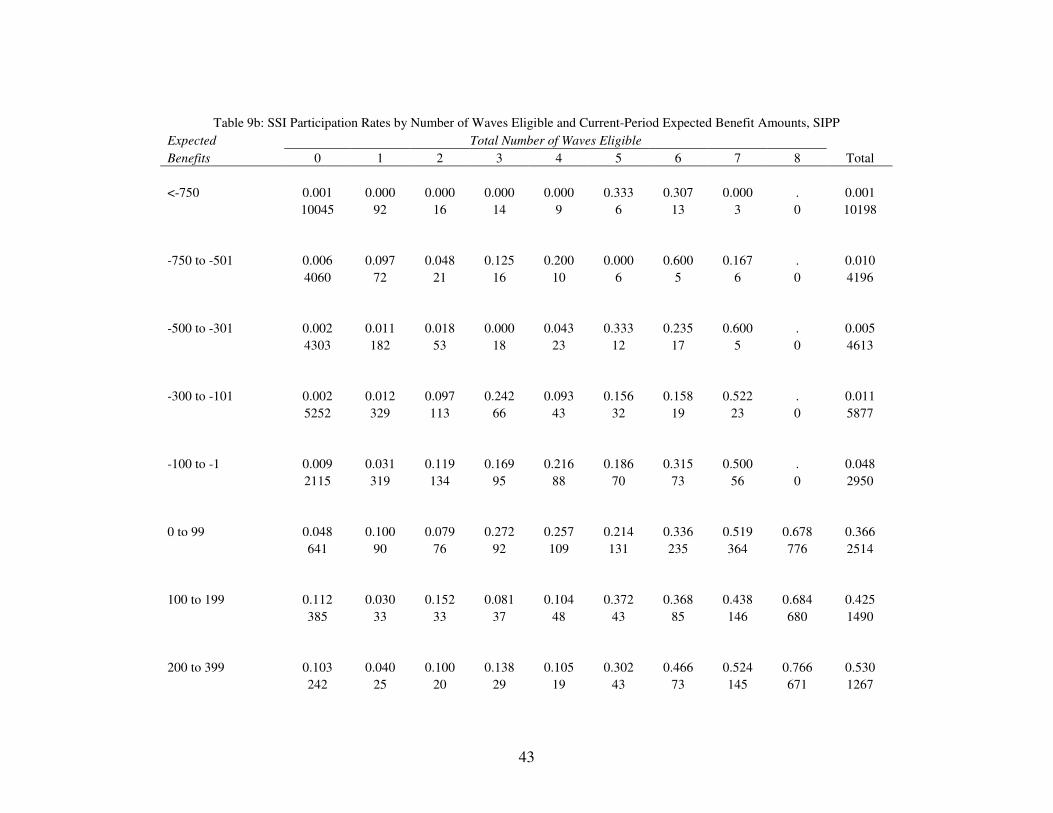
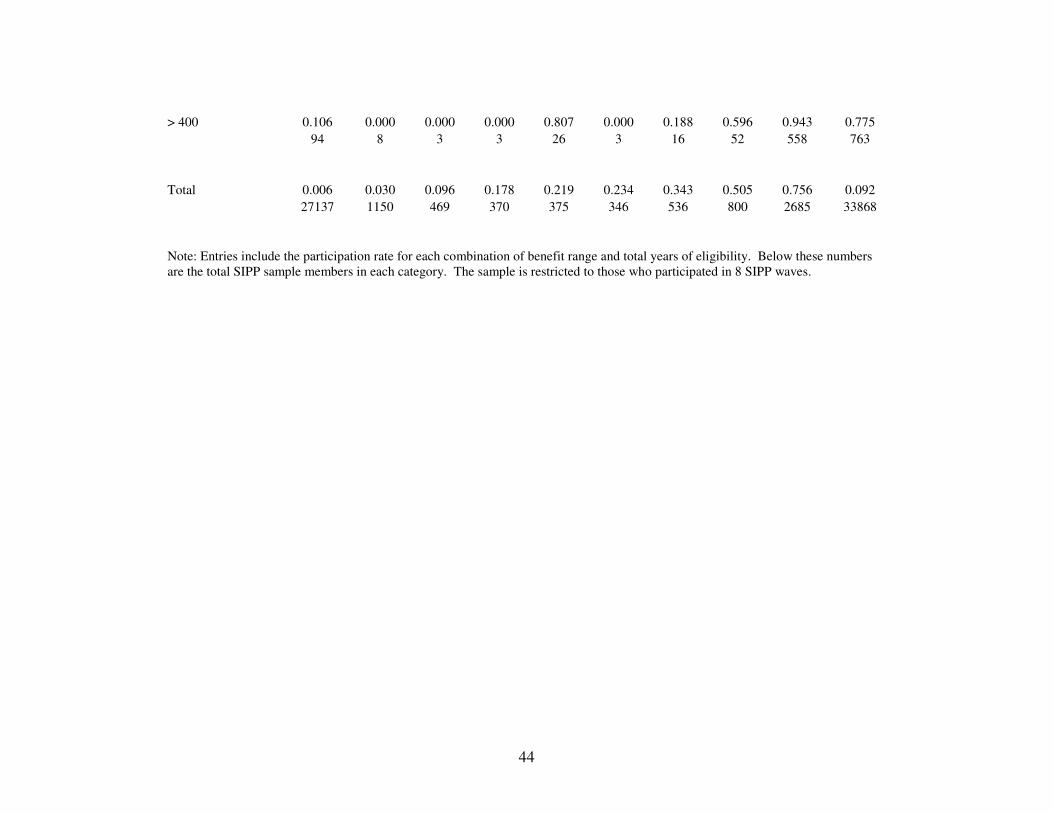
the columns that are stratified by eligibility periods to its left. These patterns exist in the SIPP as
well (see Table 9b), possibly implying a smaller role for current-period benefit amounts than
found by previous research using cross-sectional data.
Characterizing Measurement Error in the Monthly Expected SSI Benefit
The central role of measurement error in estimates of the determinants of program
participation has been the focus of previous research such as Hernandez and Pudney (2007) and
Elder and Powers (2006). In contrast to these studies, here we attempt to use the high-frequency
structure of the SIPP and the long panels of the HRS to characterize the most critical source of
measurement error, that involving the calculation of the expected monthly SSI benefit (Sit here
and SSIBEN in the tables) for each survey respondent. Assume that the true expected SSI
benefit follows an AR(1) process with two error components, the first (ai) being a permanent
individual-specific term and the second (εit) being a time-varying innovation with variance σ2:
itiitit aSS ερ ++= −1
The researcher does not observe Sit but instead calculates a noisy measure of it, using survey
respondents’ self-reports of income from various sources and applying known SSI program
rules, so that
ititit uSS +=* ,
where the error uit is assumed to have zero mean and variance σu2. If there were no permanent
unobserved heterogeneity (i.e., if the variance of ai is zero), then the model becomes
ititit SS ερ += −1 . This structure implies the following form for the variance of the observed
expected SSI benefit amount and its first two autocovariances:
25
)1(),(),(
)1(),(),(
)1()()()(
2
22
2
*
2
*
2
2
1
*
1
*
2
2
2*
ρ
σρ
ρ
ρσ
σρ
σ
−==
−==
+−
=+=
−−
−−
itititit
itititit
uititit
SSCovSSCov
SSCovSSCov
uVarSVarSVar
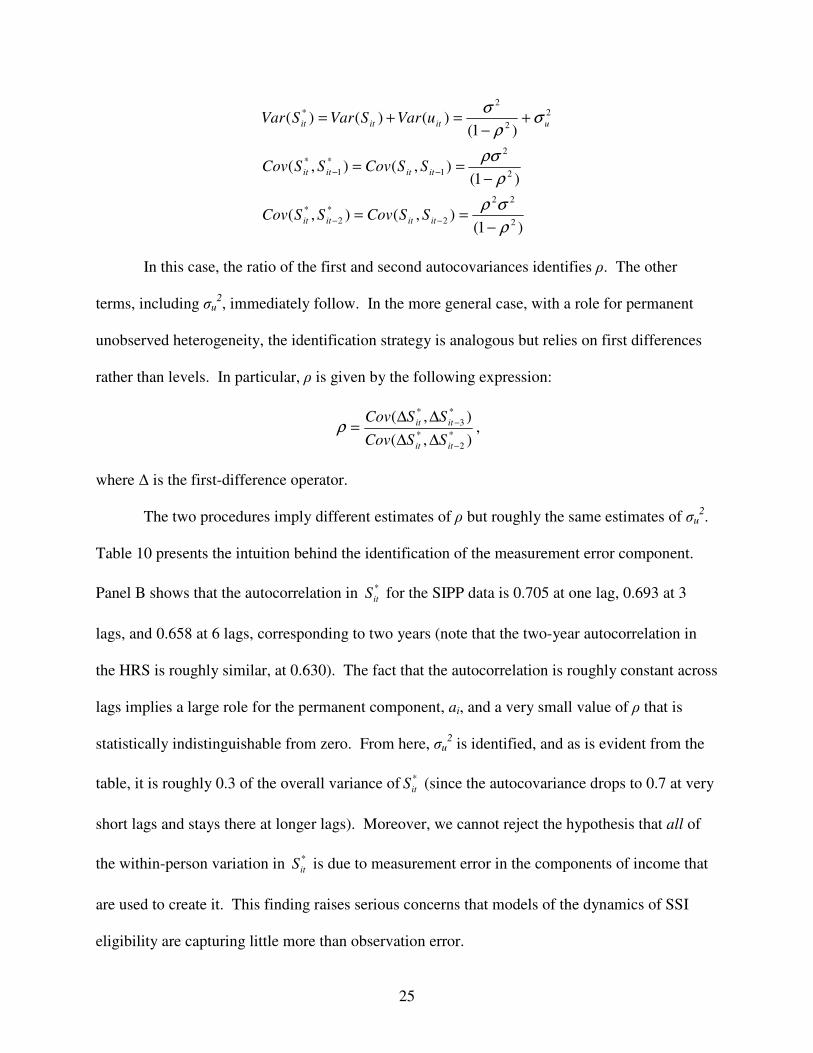
In this case, the ratio of the first and second autocovariances identifies ρ. The other
terms, including σu2, immediately follow. In the more general case, with a role for permanent
unobserved heterogeneity, the identification strategy is analogous but relies on first differences
rather than levels. In particular, ρ is given by the following expression:
),(
),(*
2
*
*
3
*
−
−
∆∆
∆∆=
itit
itit
SSCov
SSCovρ ,
where ∆ is the first-difference operator.
The two procedures imply different estimates of ρ but roughly the same estimates of σu2.
Table 10 presents the intuition behind the identification of the measurement error component.
Panel B shows that the autocorrelation in *
itS for the SIPP data is 0.705 at one lag, 0.693 at 3
lags, and 0.658 at 6 lags, corresponding to two years (note that the two-year autocorrelation in
the HRS is roughly similar, at 0.630). The fact that the autocorrelation is roughly constant across
lags implies a large role for the permanent component, ai, and a very small value of ρ that is
statistically indistinguishable from zero. From here, σu2 is identified, and as is evident from the
table, it is roughly 0.3 of the overall variance of *
itS (since the autocovariance drops to 0.7 at very
short lags and stays there at longer lags). Moreover, we cannot reject the hypothesis that all of
the within-person variation in *
itS is due to measurement error in the components of income that
are used to create it. This finding raises serious concerns that models of the dynamics of SSI
eligibility are capturing little more than observation error.
26
The remaining cells in the table present correlations between SSIBEN and self-reported
SSI benefit amounts (SSI_SR) at various lags. For example, the first-order autocorrelation in
self-reported SSI benefit amount is 0.915 in the SIPP, dropping to 0.879 after three waves and
0.866 after six waves (corresponding to two years). SSI_SR is evidently either a less noisy or
more persistent series that SSIBEN, but the fact that the two variables are meant to measure the
same thing – actual SSI benefits received – suggests that the former explanation is more likely.8
VII. Two Eligibility Weighting Schemes
The large role that measurement error plays in dynamic models suggests that it may also
be important in static models of take-up. McGarry (1996) and Hernandez and Pudney (2007)
focus on this question, using different methods to address the issue. McGarry (1996) assumes
that self-reports of actual SSI monthly benefits among recipients are measured without error, so
that difference between these benefits received and *
itS is the measurement error itself. The
subsample of SSI participants thus provide an estimate of σu2 which is used to create an
eligibility probability for all sample members. Specifically, for a respondent with a calculated
*
itS , instead of taking (income) eligibility as a binary variable equal to 1 if *
itS is positive and 0
otherwise, the probability that an individual is truly eligible is given by
Pr( itS > 0 | *
itS ) = Pr( *
itS > uit | *
itS ),
8 The table also shows that the correlation between one wave’s value of SSI_SR and SSIBEN from an adjacent wave is 0.169, and this correlation does not vary substantially with the time elapsed between waves. In fact, the value of the correlation is insensitive to whether SSI_SR and SSIBEN are measured in the same wave, as the contemporaneous correlation between the two measures (not reported in the table) is 0.170.
27
which is calculated assuming normality of uit and the implied variance of uit. One could
construct similar weights using longitudinal information by merely using a different estimate of
the variance of uit, i.e., that obtained from the previous section.
Figure 3 shows how the two schemes assign income eligibility based on the calculated
value of *
itS (SSIBEN in the figure). The unweighted model produces a one-unit discontinuity at
zero, with the cross-sectional weighting scheme producing the flattest profile and the
longitudinal weighting scheme producing an intermediate profile. In practice, the longitudinally
weighted profile is not as flat as that produced by cross-section weights because the estimate of
σu2 is smaller in the longitudinal method. This may be expected if there is reporting error in the
actual benefit received among participants.
The advantage of the weighting methods is that they allow for participating ineligibles,
those who participate in SSI but who do not appear to be eligible based on (noisy measures of)
their income, to be included in the analysis. The disadvantage is that they necessarily result in
lower implied eligibility rates among participants if participation is greater at positive values of
SSIBEN than negative values. Along this dimension, the longitudinal weights appear to be
preferable to the cross-sectional weights, as shown in Table 11. In the HRS, absent a correction
for measurement error, 70% of all single SSI participants are estimated to be eligible for SSI.
This number drops to 65.7% if longitudinal weights are used and 55.8% if the cross-sectional
weights are used. This pattern reappears in the SIPP, among both single respondents and
couples. Note that across both data sets, the eligibility assessment is much worse for couples
than for singles, possibly due to one member of a couple misreporting the earnings of his or her
28
partner. Eligibility assessment is also more successful in the SIPP than the HRS, which is not
surprising considering that income in the HRS is measured yearly rather than monthly.9
As a gauge of the practical usefulness of applying either weighting scheme to estimates
of transitions among SSI eligibility and participation states, Table 12 presents estimates of
weighted versions of the hazard models shown in Tables 4-6. For the sake of brevity, we only
report the coefficient associated with one covariate, SSIBEN, in each of these models, but the
conclusions are similar when looking at all variables. The two weighting procedures do not
substantially affect the estimates. For example, the top row presents the effect of SSIBEN
(measured in tens of thousands of dollars) on wave-to-wave transitions from SSI ineligibility to
participation. In the unweighted model of Table 6, repeated here in the first column, the point
estimate is 0.001 with a standard error of 0.001. Both the estimate and its precision are
unchanged when either cross-sectional or longitudinal weights are used.10
In a more interesting case, increasing the monthly expected benefit amount by $1000 is
estimated to increase transitions from nonparticipating eligibility to participation by 1.32
percentage points in the unweighted case, but this number rises to 1.53 and 5.45 percentage
points when using cross-sectional and longitudinal weights, respectively. Our central findings,
that transitions into participation from nonparticipating eligibility peak early in eligibility spells,
while transition rates into ineligibility rise with the duration of nonparticipating eligibility, are
not qualitatively affected by the treatment of measurement error.
9 A retrospective monthly income report is likely less error-prone than a retrospective yearly report, but more importantly, SSI eligibility is determined on the basis of last month’s income, rather than last year’s. 10 In this case, the weighting procedure involves using the full sample of nonparticipants and weighting each observation by the estimated probability that an individual is ineligible. The corresponding unweighted estimate involves limiting the sample to those who appear to be ineligible based on program rules.
29
VIII. Conclusions
This paper has presented evidence on the characteristics of eligibility and participation
spells of the aged with regard to the SSI program. We find that static take up rates in SSI are
low, but that longer-term eligibles have much higher take-up rates. The ability to track
respondents over time is particularly valuable in the case of SSI, as the program may be entered
through either its disability or aged component. In fact, when we examine participation rates
according to entry mode, we find that take-up rates of the aged do in fact appear fairly low,
especially among the “young elderly” aged 65 to 70. Thus, while long-term take-up rates are
fairly high, a large share of use, even at fairly advanced age ranges, cannot be attributed to the
aged program. Future work should attempt to integrate the two components of the program.
As noted at the outset of this paper, the SSI program is failing in a fundamental respect if
people in deep and persistent poverty do not enroll. Our longitudinal evidence is that take-up
rates for the long-term eligible are around 80 percent. This constitutes convincing evidence from
two large household data sets that the SSI take-up rate is reasonably high for the persistently
eligible. Unfortunately, such a conclusion is premature, as the evidence presented above on the
extent and nature of eligibility classification error implies that we cannot determine whether the
take-up rate for longer-term eligibles is higher because their eligibility categorization is more
accurately measured, because persistent eligibility poses more ‘chances’ to enter SSI, or because
prospective recipients are forward-looking and there are entry costs to beginning participation. If
the higher take-up of longer-term eligibles is explained in large part by measurement problems,
however, it is possible that cross-sectional take-up rates dramatically understate the effectiveness
of the program.
30
While we have documented the extent of measurement error, we have not proposed
corrections that substantially alter the estimates of competing risk hazards of entry and exits from
SSI. Credible methods to account for classification error, possibly including those developed
recently in the program participation literature, should be the top priority in ongoing research, as
classification error is the dominant empirical barrier to obtaining consensus on the determinants
and extent of SSI take-up. Future work will likely assess the impact of new methods on the
substantive findings of both static and dynamic studies of SSI participation.
31
References
Blank, Rebecca M. and Patricia Ruggles, 1996. "When Do Women Use Aid to Families with Dependent Children and Food Stamps? The Dynamics of Eligibility versus Participation". Journal of Human Resources 31(1,Winter): 57-89. Coe, Richard, 1983. "Nonparticipation in Welfare Programs by Eligible Households," Journal of
Economic Issues 4: 1035-56. Elder, Todd E., and Elizabeth T. Powers, 2006. "The Incredible Shrinking Program: Will Cash Welfare for the Elderly Disappear?" Research on Aging 28(3, May): 341-358. Elder, Todd E., and Elizabeth T. Powers, 2004. “SSI for the Aged and the Problem of ‘Take-Up’,” University of Michigan Retirement Research Center Working Paper #2004-076 (January). Gunderson, Craig, and Brent Kreider, 2006. “Food Stamps and Food Insecurity among Families with Children: What Can be Learned in the Presence of Non-classical Measurement Error?” Iowa State University, Department of Economics, Staff General Research Papers. Haider, Steven J. and Jacob Klerman. 2005. “Dynamic Properties of the Welfare Caseload.” Labour Economics 12(5): 629-48. Hernandez, Monica, and Stephen Putney, 2007. “Measurement Error in Models of Welfare Participation.” Journal of Public Economics 91(1-2), pp. 237-41. Hill, Daniel H., 1990, "An Endogenously-Switching Ordered-Response Model of Information, Eligibility, and Participation in SSI." The Review of Economics and Statistics 72(2, May). pp. 368-371. Klerman, Jacob, and Steven J. Haider. 2004. “A Stock-Flow Analysis of the Welfare Caseload.” Journal of Human Resources 39(4):865-886. McGarry, Kathleen, 1996. “Factors Determining Participation of the Elderly in Supplementary Security Income.” Journal of Human Resources 31(2, Spring): 331-58. Powers, Elizabeth T. and David Neumark, 2005. "The Supplemental Security Income Program and Incentives to Claim Social Security Retirement Early." National Tax Journal LVIII (1, March), 5-26.
Pudney, Stephen, 2001. “The Impact of Measurement Error in Probit Models of Benefit Take-Up.” Mimeo, University of Leicester, August.
Warlick, Jennifer L., 1982. “Participation of the Aged in SSI.” Journal of Human Resources
17(2, Spring), pp. 236-60.
32
Yelowitz, Aaron, 2000. “Using the Medicare Buy-In Program to Estimate the Effect of Medicaid on SSI Participation.” Economic Inquiry 38(3), 419-41.
33
Table 1: Features of the SIPP and HRS Samples
SIPP HRS
Reference period 4 months 1 year Interview frequency every 4 months every other year Length 2-3 years 12 years Individuals represented 29,418 24,161 Eligibility periods 15,903 4,058 Participation periods 10,319 3,248
Eligibility spells 5,161 2,539
Participation spells 1,824 1,520
Source: Authors’ tabulations from the HRS and SIPP.
34
Table 2: Characteristics of the Aged in the HRS and SIPP
All Aged SSI-eligible participants
SSI-eligible
nonparticipants
HRS SIPP HRS SIPP HRS SIPP
Female 0.550 0.593 0.774 0.763 0.668 0.704 (0.490) (0.491) (0.418) (0.425) (0.471) (0.457) Divorced 0.071 … 0.148 … 0.106 … (0.257) … (0.355) … (0.307) … Widowed 0.309 … 0.515 … 0.474 … (0.462) … (0.500) … (0.499) … Married 0.567 0.558 0.184 0.237 0.334 0.374 (0.495) (0.497) (0.388) (0.425) (0.472) (0.484) Lives Alone 0.290 0.315 0.473 0.647 0.386 0.609 (0.454) (0.465) (0.499) (0.478) (0.487) (0.488) Ever Died 0.325 … 0.358 … 0.361 … (0.468) … (0.480) … (0.480) … Hispanic 0.074 0.047 0.341 0.195 0.219 0.073 (0.262) (0.212) (0.474) (0.396) (0.414) (0.261) Caucasian 0.819 0.890 0.530 0.625 0.566 0.834 (0.385) (0.312) (0.499) (0.484) (0.495) (0.372) Less Than HS 0.305 0.430 0.872 0.819 0.748 0.596 (0.460) (0.495) (0.335) (0.385) (0.434) (0.491) College Graduate 0.143 0.247 0.016 0.050 0.026 0.148 (0.350) (0.431) (0.126) (0.217) (0.160) (0.355) Age 75.270 73.276 77.502 74.303 76.359 74.419 (7.339) (5.855) (8.228) (6.120) (8.644) (6.265) Self-reported Health 3.024 3.157 3.812 3.899 3.557 3.501 (1.152) (1.119) (1.044) (1.002) (1.136) (1.066) Eligible for SSI 0.070 0.079 1.000 1.000 1.000 1.000 (0.255) (0.270) … … … … SSI recipient 0.054 0.051 1.000 1.000 0.000 0.000 (0.226) (0.221) … … … … SSI Benefit (Imputed) -2218.969 -1340.726 249.221 251.0391 221.313 184.9403 (4514.968) (1577.512) (180.681) (216.449) (202.756) (242.490) Sample Size (Person-Waves) 21125 201,053 2102 7706 2088 8197
35
Table 3: Eligibility and Participation Spells in the HRS and SIPP
Panel A: SIPP
SSI-aged Eligibility spells SSI-aged Participation spells
All Non-left Censored
Non-left & Right
Censored All Non-left Censored
Non-left & Right
Censored Number 5,161 2,969 2,459 1,824 1,716 797 percent 1 0.575276109 0.476458051 1 0.940789 0.436952 Mean length 3.08138 1.933311 2.126881 5.657346 2.907821 3.307432 Standard deviation 2.585208 1.579731 1.671862 2.693814 2.128872 2.135276 Number of spells distribution 1 80.8 66.62 69.42 96.16 80.45 81.08 2 16.88 29.34 27.78 3.78 19.27 18.92 3 2.25 3.91 2.77 0.05 0.28 0 4 0.08 0.13 0.04 Spell length distribution 1 45.63 61.57 53.6 13.43 39.94 27.36 2 14.18 16.94 20.49 7.24 15.92 19.26 3 7.34 7.17 8.66 6.14 12.01 14.53 4 5.15 4.72 5.69 5.15 6.7 8.11 5 4.71 3.97 4.8 5.15 6.98 0.45 6 6.2 2.59 3.13 12.94 8.94 10.81 7 5.62 2.19 2.64 12.72 8.38 10.14 8 9.03 0.84 1.02 28.67 1.12 1.35 9 2.13 0 0 8.55 0 0
36
Table 3: Eligibility and Participation Spells in the HRS and SIPP (continued)
Panel B: HRS
SSI-aged Eligibility spells SSI-aged Participation spells
All Non-left Censored
Non-left & Right
Censored All Non-left Censored
Non-left & Right
Censored Number 2,539 1,049 629 1,520 484 309 percent 1 0.413154785 0.247735329 0.598661 0.190626 0.121701 Mean length 1.690429 1.332698 1.554849 2.140132 1.535124 1.838188 standard error 1.187782 0.7354754 0.8827412 1.41122 0.908213 1.01915 Number of spells distribution 1 88.97 73.31 75.52 90.72 70.87 75.4 2 10.48 25.36 24.17 9.28 29.13 24.6 3 0.55 1.33 0.32 0 0 0 4 Spell length distribution 65.22 78.36 63.91 46.84 66.12 46.93 1 17.13 13.82 23.05 22.7 21.07 33.01 2 7.56 4.48 7.47 12.04 8.26 12.94 3 5.87 2.86 4.77 10.72 2.27 3.56 4 1.97 0.48 0.79 3.42 2.27 3.56 5 2.17 0 0 0 0 0 6 0.08 0 0 0 0 0
37
Table 4: Hazard Model Estimates: Determinants of Transitions out of SSI-Ineligibility HRS SIPP
Transitions Into: Transitions Into:
Participation Nonparticipating
Eligibility Participation Nonparticipating
Eligibility
Female 0.001 0.005 0.000 0.009 (0.001) (0.001) (0.000) (0.001) Newly widowed 0.003 0.007 -0.003 0.010 (0.002) (0.004) (0.001) (0.010) Married -0.005 -0.010 -0.002 0.008 (0.002) (0.003) (0.001) (0.002) Never Married 0.004 0.003 0.001 -0.004 (0.005) (0.007) (0.001) (0.002) White -0.009 -0.024 -0.002 -0.017 (0.002) (0.003) (0.001) (0.002) Hispanic 0.019 0.016 0.003 0.014 (0.004) (0.005) (0.001) (0.003) HS Graduate -0.004 -0.014 -0.001 -0.009 (0.001) (0.002) (0.000) (0.001) 70<=Age<80 0.001 -0.003 0.000 -0.001 (0.001) (0.002) (0.000) (0.001) Age>80 0.002 0.008 0.000 0.003 (0.001) (0.002) (0.000) (0.001) Health Poor or Fair 0.002 0.007 0.000 0.004 (0.001) (0.002) (0.000) (0.001) HHINC VAR … … 0.004 0.013 (in $10000) … … (0.001) (0.004) SSIBEN 0.001 0.004 0.001 0.039 (in $10000) (0.001) (0.001) (0.001) (0.002) Previous Non- 0.031 0.104 0.004 0.234 Participating Eligibility (0.009) (0.015) (0.002) (0.011) Previous SSI Participation 0.242 0.062 0.118 0.058 (0.029) (0.020) (0.025) (0.021) Sample Size (Person-Waves) 29,324 29,324 129,000 129,000 Sample Mean of Destination 0.007 0.016 0.001 0.015
38
Table 5: Hazard Model Estimates: Determinants of Transitions out of Nonparticipating Eligibility
HRS SIPP
Transitions Into: Transitions Into:
Participation Ineligibility Participation Ineligibility
Female 0.058 -0.029 0.008 -0.019 (0.025) (0.026) (0.006) (0.013) Newly widowed 0.032 0.018 -0.021 0.229 (0.057) (0.045) (0.006) (0.034) Married 0.080 -0.023 -0.018 -0.015 (0.030) (0.031) (0.008) (0.020) Never Married 0.020 0.058 0.013 -0.018 (0.056) (0.052) (0.011) (0.021) White -0.029 -0.019 0.004 0.004 (0.021) (0.022) (0.005) (0.011) Hispanic 0.000 0.039 0.046 0.008 (0.029) (0.027) (0.011) (0.017) HS Graduate -0.041 0.052 0.000 0.007 (0.019) (0.023) (0.003) (0.010) 70<=Age<80 0.042 -0.065 -0.012 0.033 (0.027) (0.026) (0.005) (0.011) Age>80 0.013 -0.075 -0.013 0.019 (0.026) (0.027) (0.005) (0.013) Health Poor or Fair 0.000 -0.018 0.004 -0.006 (0.020) (0.021) (0.003) (0.009) SSIBEN -0.117 0.197 0.132 -0.004 (in $10000) (0.049) (0.517) (0.070) (0.176) Total Waves of Eligibility 0.036 -0.363 0.003 -0.156 (0.013) (0.016) (0.001) (0.003) Total Waves of Eligibility -0.010 0.284 -0.002 0.055 Thus Far (0.018) (0.022) (0.001) (0.004) Previous Ineligibility 0.004 0.053 -0.007 0.003 (0.033) (0.031) (0.005) (0.014) Previous SSI Participation 0.354 -0.044 0.423 0.043 (0.050) (0.037) (0.054) (0.043) Sample Size (Person-Waves) 912 912 5764 5764 Sample Mean of Destination 0.126 0.594 0.020 0.328
39
Table 6: Hazard Model Estimates: Determinants of Transitions out of SSI Participation
HRS SIPP
Transitions Into: Transitions Into:
Ineligibility Nonparticipating
Eligibility Ineligibility Nonparticipating
Eligibility
Female 0.003 -0.006 -0.012 -0.009 (0.035) (0.027) (0.011) (0.005) Newly widowed 0.066 0.114 0.060 -0.009 (0.076) (0.068) (0.114) (0.005) Married 0.080 0.011 -0.069 -0.002 (0.045) (0.032) (0.018) (0.007) Never Married -0.006 -0.052 -0.009 -0.008 (0.047) (0.027) (0.012) (0.005) White 0.060 -0.061 0.007 0.008 (0.030) (0.022) (0.007) (0.003) Hispanic -0.054 0.033 -0.014 -0.005 (0.032) (0.022) (0.009) (0.004) HS Graduate 0.003 -0.002 -0.008 0.005 (0.044) (0.028) (0.009) (0.005) 70<=Age<80 -0.067 -0.020 0.004 0.001 (0.037) (0.026) (0.008) (0.004) Age>80 -0.099 -0.017 -0.011 0.002 (0.036) (0.026) (0.009) (0.004) Health Poor or Fair 0.010 0.003 -0.010 -0.013 (0.028) (0.019) (0.007) (0.004) HHINC VAR … … 3.689 0.341 (in $10000) … … (0.424) (0.132) SSIBEN -0.969 0.165 -1.357 -0.180 (in $10000) (0.772) (0.554) (0.164) (0.081) Previous Non- -0.144 0.014 -0.172 0.002 Participating Eligibility (0.084) (0.048) (0.088) (0.049) Previous SSI Participation -0.242 0.026 -0.197 -0.040 (0.067) (0.036) (0.083) (0.044) Sample Size (Person-Waves) 1029 1029 5553 5553 Sample Mean of Destination 0.231 0.099 0.064 0.013
40
Table 7: The Effect of Future SSI Eligibility on Current Participation Rates, HRS and SIPP
Panel A: Estimates of Effects of Period t+1 or t-1 Eligibility on Period t Participation, HRS
(1) (2) (3) (4)
t+1 eligibility 0.380 … 0.216 …
(0.018) … (0.004) …
t-1 eligibility … 0.354 … 0.220
… (0.017) … (0.012)
Eligible in Year t? Yes Yes No No
R2 0.139 0.1162 0.058 0.071
N 3,177 3,177 45,476 45,476
Panel B: Estimates of Effects of Period t+1 or t-1 Eligibility on Period t Participation, SIPP
(1) (2) (3) (4)
t+1 eligibility 0.410 … 0.135 …
(0.010) … (0.007) …
t-1 eligibility … 0.425 … 0.143
… (0.010) … (0.008)
Eligible in Year t? Yes Yes No No
R2 0.108 0.122 0.042 0.042
N 13,711 13,711 157,294 157,294
Notes: Coefficients (with standard errors in parentheses) reported are marginal effects from probit models of SSI participation as a function of eligibility in either a future or past period. Standard errors account for clustering at the individual level. A period corresponds to two years in the HRS and 4 months in the SIPP.
41
Table 8: SSI Participation Rates by Current Eligibility and Total Waves of Eligibility in the HRS and SIPP
HRS (AHEAD Cohort) SIPP
Total Waves Currently Currently Currently Currently of Eligibility Ineligible Eligible Ineligible Eligible
0 0.011 … 0.017 … 7048 0 23760 0
1 0.074 0.124 0.012 0.031 610 129 672 96
2 0.129 0.267 0.090 0.108 116 60 222 74
3 0.250 0.290 0.168 0.173 64 69 125 75
4 0.469 0.638 0.170 0.304 49 105 112 112
5 0.600 0.823 0.156 0.231 45 231 96 160
6 … 0.772 0.216 0.216 0 250 74 222
7 0.494 0.515 79 553
8 … 0.762 0 2352 0.023 0.536 0.022 0.609 7932 844 25140 3644
Notes: For each combination of current eligibility status and total waves eligible, the numbers reported are the fraction currently receiving SSI and the number of sample respondents who meet the criteria.
42
Table 9a: SSI Participation Rates by Number of Waves Eligible and Current-Period Expected Benefit Amounts, HRS (AHEAD cohort)
Expected Total Number of Waves Eligible
Benefits 0 1 2 3 4 5 6 Total
<-750 0.007 0.023 0.000 0.000 0.333 1.000 . 0.010 2875 94 6 2 3 1 0 2981 -750 to -501 0.008 0.017 0.000 0.667 0.000 0.750 . 0.012 1060 60 13 3 1 4 0 1141 -500 to -301 0.006 0.038 0.154 0.200 0.000 0.333 . 0.012 988 79 13 5 2 3 0 1090 -300 to -101 0.028 0.067 0.094 0.133 0.500 0.667 . 0.047 958 179 32 15 8 12 0 1204 -100 to -1 0.076 0.170 0.189 0.222 0.526 0.545 . 0.151 290 135 37 27 19 22 0 530 0 to 99 0.019 0.089 0.086 0.286 0.522 0.677 0.661 0.327 54 101 35 35 46 65 56 392 100 to 199 0.050 0.167 0.300 0.286 0.778 0.818 0.806 0.600 20 24 10 14 36 44 62 210 200 to 399 0.000 0.129 0.222 0.353 0.500 0.875 0.869 0.555 28 31 18 17 26 64 61 245 > 400 0.000 0.091 0.583 0.333 0.769 0.918 0.746 0.636 15 22 12 15 13 61 71 209 Total 0.013 0.083 0.176 0.271 0.584 0.786 0.772 0.088 6288 725 176 133 154 276 250 8002 Note: Entries include the participation rate for each combination of benefit range and total years of eligibility. Below these numbers are the total AHEAD sample members in each category. The sample is restricted to those who appeared in all 6 waves of the AHEAD.
43
Table 9b: SSI Participation Rates by Number of Waves Eligible and Current-Period Expected Benefit Amounts, SIPP
Expected Total Number of Waves Eligible
Benefits 0 1 2 3 4 5 6 7 8 Total
<-750 0.001 0.000 0.000 0.000 0.000 0.333 0.307 0.000 . 0.001
10045 92 16 14 9 6 13 3 0 10198
-750 to -501 0.006 0.097 0.048 0.125 0.200 0.000 0.600 0.167 . 0.010
4060 72 21 16 10 6 5 6 0 4196
-500 to -301 0.002 0.011 0.018 0.000 0.043 0.333 0.235 0.600 . 0.005
4303 182 53 18 23 12 17 5 0 4613
-300 to -101 0.002 0.012 0.097 0.242 0.093 0.156 0.158 0.522 . 0.011
5252 329 113 66 43 32 19 23 0 5877
-100 to -1 0.009 0.031 0.119 0.169 0.216 0.186 0.315 0.500 . 0.048
2115 319 134 95 88 70 73 56 0 2950
0 to 99 0.048 0.100 0.079 0.272 0.257 0.214 0.336 0.519 0.678 0.366
641 90 76 92 109 131 235 364 776 2514
100 to 199 0.112 0.030 0.152 0.081 0.104 0.372 0.368 0.438 0.684 0.425
385 33 33 37 48 43 85 146 680 1490
200 to 399 0.103 0.040 0.100 0.138 0.105 0.302 0.466 0.524 0.766 0.530
242 25 20 29 19 43 73 145 671 1267
44
> 400 0.106 0.000 0.000 0.000 0.807 0.000 0.188 0.596 0.943 0.775
94 8 3 3 26 3 16 52 558 763
Total 0.006 0.030 0.096 0.178 0.219 0.234 0.343 0.505 0.756 0.092
27137 1150 469 370 375 346 536 800 2685 33868
Note: Entries include the participation rate for each combination of benefit range and total years of eligibility. Below these numbers are the total SIPP sample members in each category. The sample is restricted to those who participated in 8 SIPP waves.
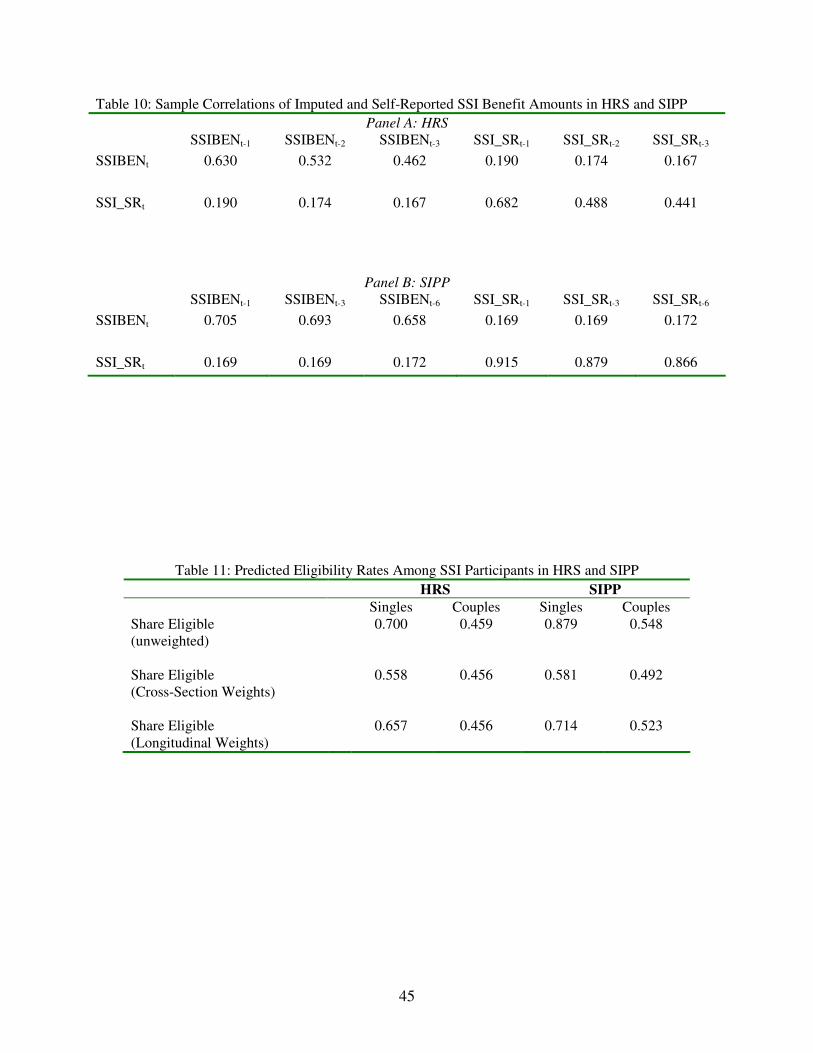
45
Table 10: Sample Correlations of Imputed and Self-Reported SSI Benefit Amounts in HRS and SIPP Panel A: HRS
SSIBENt-1 SSIBENt-2 SSIBENt-3 SSI_SRt-1 SSI_SRt-2 SSI_SRt-3
SSIBENt 0.630 0.532 0.462 0.190 0.174 0.167
SSI_SRt 0.190 0.174 0.167 0.682 0.488 0.441
Panel B: SIPP
SSIBENt-1 SSIBENt-3 SSIBENt-6 SSI_SRt-1 SSI_SRt-3 SSI_SRt-6
SSIBENt 0.705 0.693 0.658 0.169 0.169 0.172
SSI_SRt 0.169 0.169 0.172 0.915 0.879 0.866
Table 11: Predicted Eligibility Rates Among SSI Participants in HRS and SIPP
HRS SIPP
Singles Couples Singles Couples Share Eligible 0.700 0.459 0.879 0.548 (unweighted) Share Eligible 0.558 0.456 0.581 0.492 (Cross-Section Weights) Share Eligible 0.657 0.456 0.714 0.523 (Longitudinal Weights)
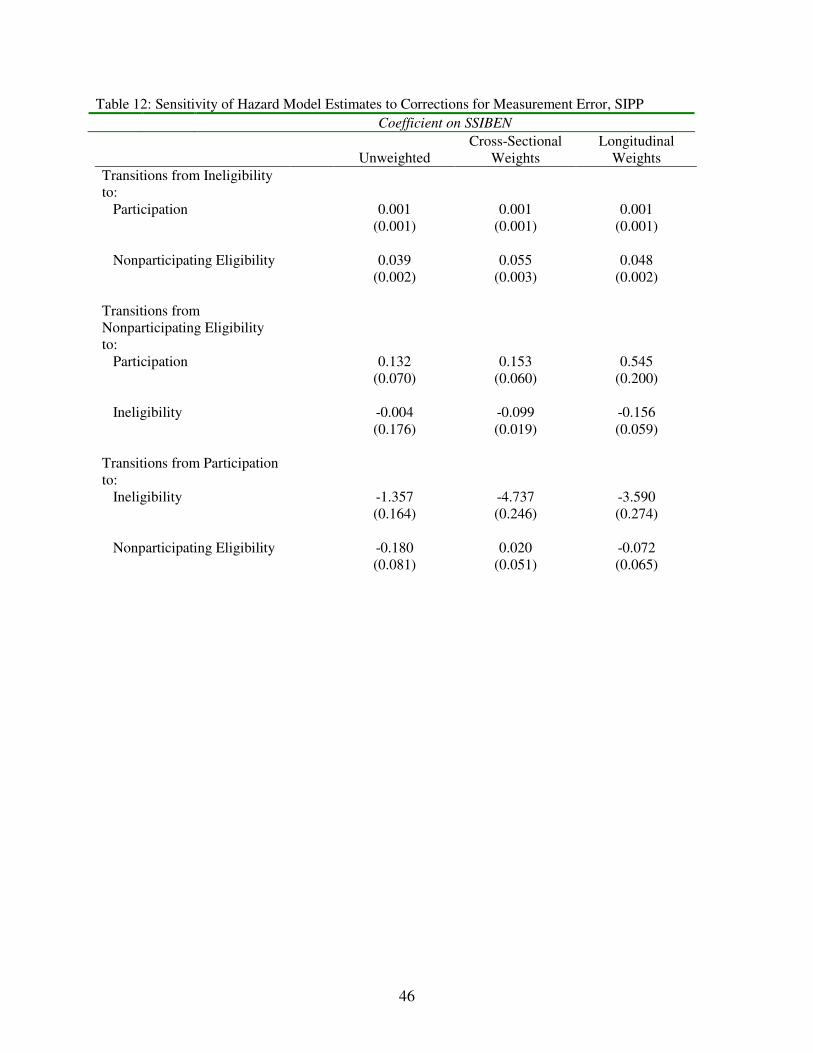
46
Table 12: Sensitivity of Hazard Model Estimates to Corrections for Measurement Error, SIPP Coefficient on SSIBEN
Unweighted Cross-Sectional
Weights Longitudinal
Weights
Transitions from Ineligibility to: Participation 0.001 0.001 0.001 (0.001) (0.001) (0.001) Nonparticipating Eligibility 0.039 0.055 0.048 (0.002) (0.003) (0.002) Transitions from Nonparticipating Eligibility to: Participation 0.132 0.153 0.545 (0.070) (0.060) (0.200) Ineligibility -0.004 -0.099 -0.156 (0.176) (0.019) (0.059) Transitions from Participation to: Ineligibility -1.357 -4.737 -3.590 (0.164) (0.246) (0.274) Nonparticipating Eligibility -0.180 0.020 -0.072 (0.081) (0.051) (0.065)
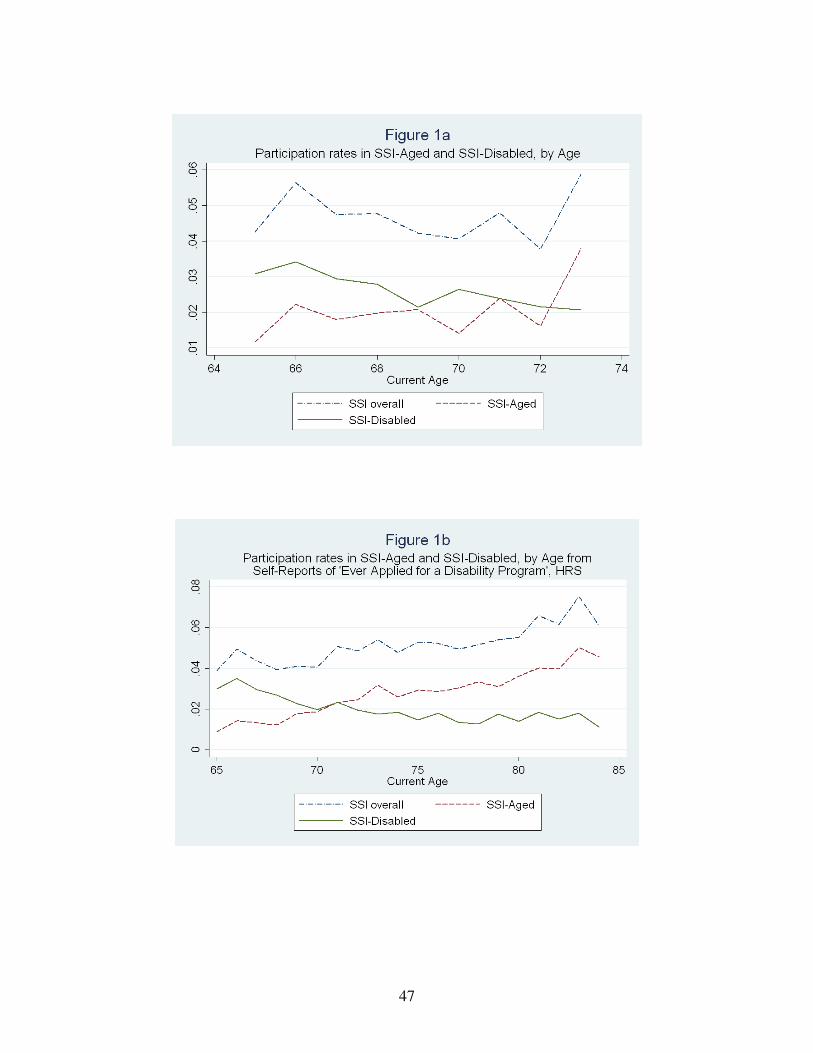
47
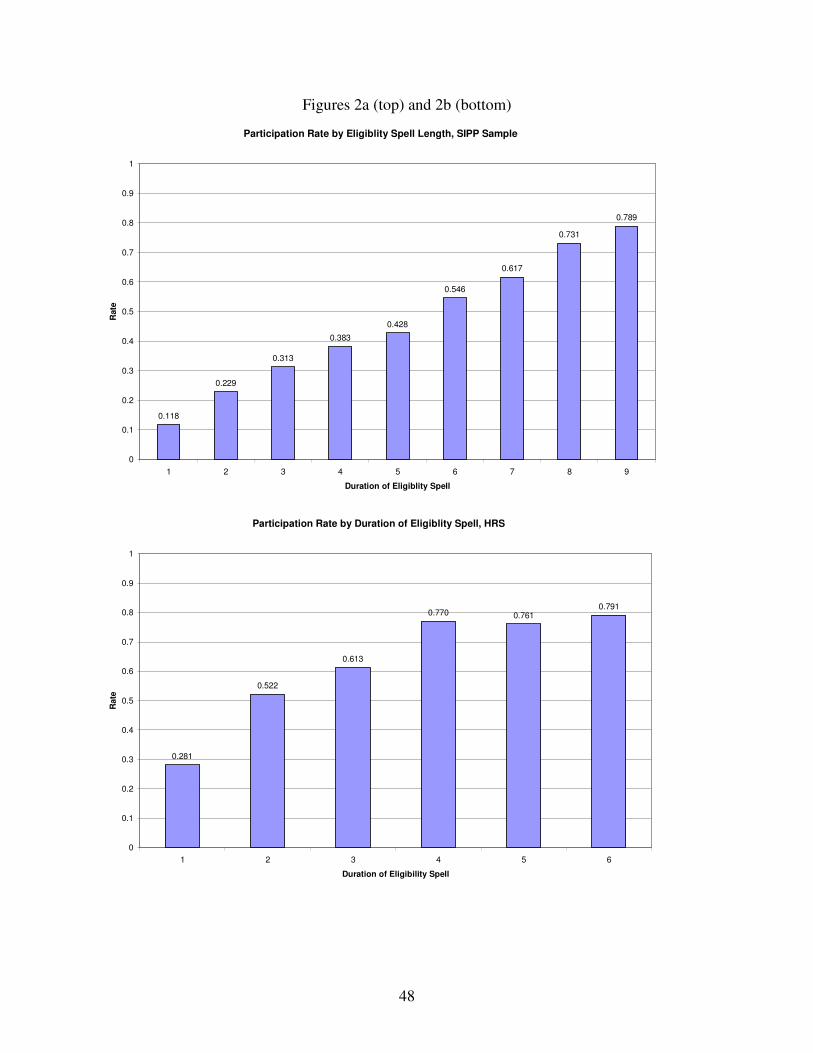
48
Figures 2a (top) and 2b (bottom)
Participation Rate by Eligiblity Spell Length, SIPP Sample
0.118
0.229
0.313
0.383
0.428
0.546
0.617
0.731
0.789
0
0.1
0.2
0.3
0.4
0.5
0.6
0.7
0.8
0.9
1
1 2 3 4 5 6 7 8 9
Duration of Eligiblity Spell
Rate
Participation Rate by Duration of Eligiblity Spell, HRS
0.281
0.522
0.613
0.761
0.7910.770
0
0.1
0.2
0.3
0.4
0.5
0.6
0.7
0.8
0.9
1
1 2 3 4 5 6
Duration of Eligibility Spell
Rate
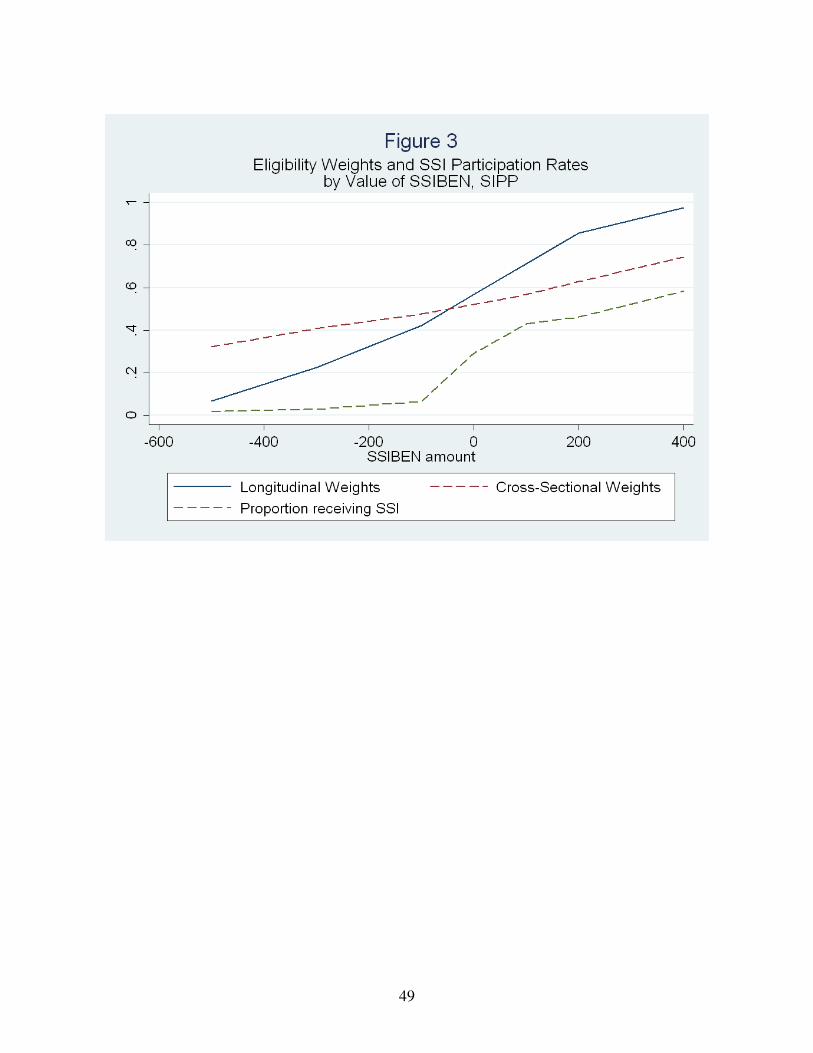
49