Embed Size (px)
Citation preview

1093
MEASURING BUSINESS ENTRIES & EXITS
Gerrit Faber ([email protected]) & Philippe Gagné ([email protected]), Statistics Canada Jean Talon Building 8th floor, Ottawa, Ontario, K1A 0T6, Canada
ABSTRACT
As a prototype project, the Business Register Division of Statistics Canada conducted a Business Entry & Exit Pilot Survey.The survey measured the number of business start-ups and closures in order to determine the net formation of businessesfor small and medium Canadian urban centers.
The methodology was based on the use of administrative files to identify potential entries and exits. Other methodologicalaspects will be discussed: stratification, sample allocation and edit & imputation. The degree to which the survey wassuccessful in identifying entry and exit units is examined, considering its impact on the quality of the final estimates.
One major concern with the administrative source was that, while the correct entry or exit signal was often indicated, itgenerally failed to reflect the true reference quarter within which the event occurred. Possible solutions to this problem arediscussed.
Key Words: Business Entry, Business Exit, Administrative Data, Small Urban Areas
1. BACKGROUND AND OBJECTIVE OF THE PROTOTYPE SURVEYDuring the early 90’s, the Business Register Division conducted a Business Entry & Exit Survey. The surveymeasured the number of employer business start-ups and closures in order to determine the net formation ofbusinesses. The quarterly results were presented by region (Atlantic, Québec, Ontario, Prairies, British Columbiaand Territories) and by industrial sector. The survey was discontinued due to budgetary pressures. Since thediscontinuance of the original survey Statistics Canada has received a considerable volume of queries concerning theavailability of data on Canadian business formation. In addition, a new source of administrative data has recentlybeen made available to Statistics Canada - the Business Number Registrations which is administered by the CanadaCustoms and Revenue Agency (CCRA).Accordingly, it was decided to launch a prototype survey which would employ many of the same concepts aspreviously but would now utilize the new Business Number Registration source and would limit the survey coverageto business registrations occurring in only small and medium urban areas. Such a focus would provide analystsconcerned with the economy at the community level a measure of business formation. These data might be ofassistance in evaluating the effectiveness of their local business promotion programs and policies.
2. URBAN AREAS COVERED BY THE PROTOTYPE SURVEYTo determine the urban areas in-scope for the survey, thresholds were fixed: the survey covered urban areas with apopulation of business establishments between 5,000 and 10,000 (according to counts derived from StatisticCanada's Business Register). The following twenty-four (24) urban areas were considered in-scope:
St-John’s (NF) Halifax (NS) Moncton (NB) Saint John (NB) Sherbrooke (QC) Trois-Rivière (QC)Chicoutimi-Jonquière (QC) Kingston (ON) Barrie (ON) Sudbury (ON) Oshawa (ON) Thunder Bay (ON)St-Catharines – Niagara (ON)Kitchener (ON) Windsor (ON) Guelph (ON) Peterborough (ON) Regina (SA)Saskatoon (SA) Kelowna (BC) Kamloops (BC) Abbotsford (BC) Victoria (BC) Nanaimo (BC)
Since the objective of the prototype was to develop a tool applicable to the local level, two urban areas (Sherbrookeand St Catharines – Niagara) were selected. A third area was created which represents a composite all the other 22areas listed above. The concept was to develop a national measure (termed National Residual in subsequent sectionsof this paper) for all smaller urban areas thereby facilitating a comparison to any community that might eventuallybe included in future survey cycles.
3. BUSINESSES COVERED BY THE SURVEYThe Business Register Database was established to provide a frame for Statistics Canada business surveys. Itcontains all the employer businesses, all the incorporated businesses in Canada and also all unincorporatedbusinesses with estimated annual revenues over $30,000. However, for purposes of this Entry & Exit Survey, it wasdecided to extend the coverage to also include all self-employed businesses below the $30,000 revenue threshold
1094
who have registered a Goods and services tax number. These smaller businesses reflect a significant portion of theentrepreneurs launching new businesses within a community. Thus the frame for this survey extends beyond thecurrent coverage of the Business Register. It includes any business that has registered for a Business Number (BN)with the Canada Customs and Revenue Agency (CCRA) for the purpose of making one of the followingremittances: payroll deductions (PD), goods and services tax (GST).
4. METHODOLOGY OF THE SURVEYPrior to calculating estimates for business entries and exits three major steps must be completed. The first step is todetermine the potential entries and exits from the BN registrations. Secondly, based on certain assumptions, asampling strategy has to be defined which will achieve an expected level of confidence for the final estimates.Finally, a telephone contact is made to verify if the sampled business event actually represents a new business entry,the closure of a previously active business or some other activity which does reflect entry or exit such as a change ofownership or a reorganization.4.1. Entry Estimates� The method to define a potential entry for a given quarter is relatively simple. The administrative source used
was a set of monthly files from Canada Customs and Revenue Agency (CCRA) known as the BN-MASTERfiles. These files contained various fields including the BN number - a unique identifier for each legal entitydoing business in Canada.Two consecutive monthly files are compared to identify new records, i.e. to find those businesses that appear onthe second file but not on the first. In total, 60,373 businesses within the 24 in-scope areas were identified asbeing potential entries. All BN registrant present within a given month but not present in the previous month aredefined as a potential entry. New units for January, February, and March 1998 were grouped together to formunits identified as potential entries for 1998 - quarter one. Similar quarterly groupings were made for 1998quarter two to 1999 quarter one.A sample was drawn for each of the three smaller urban areas outlined above for each of 5 quarters from January1998 to March 1999. The targeted coefficient of variation was 5% for Sherbrooke and St Catharines – Niagara.For the Other Urban Centers we sampled to get a 10% CV in each quarter. The probability (P) that the unit in thepopulation of potential entries is in fact a true entry) is not known but was set to .50. To estimate the value of P,we looked at if the business had made a remittance to PD or GST.
Table 1 : Sample Size for Entry SurveyREGION Target CV p-value Quarter Nb.of Potential Entries Sample Size
1998Q1 1,330 3081998Q2 516 2261998Q3 380 1961998Q4 324 180
Sherbrooke (QC) 5% 0.50
1999Q1 263 1591998Q1 1,009 2871998Q2 817 2691998Q3 749 2611998Q4 748 261
St Catharines – Niagara (ON) 5% 0.50
1999Q1 623 2441998Q1 15,026 1001998Q2 11,076 1001998Q3 9,688 991998Q4 9,021 99
Other Urban Areas 10% 0.50
1999Q1 8,803 99
� While a new registration may be the result of a business start-up, it may also reflect various other businessevents such as a change in the form of ownership (unincorporated to incorporated by the same owner) or achange of owner for an existing businesses. In order to discern True Entries from false signals, the sampledbusinesses were contacted by phone to determine the reason for their Business Number registration - newbusiness venture or other reasons. After verifying basic tombstone information and validating the BusinessNumber, the following questions were posed (To assess the time lag between the administrative registrationdate and the actual business operating start date, the respondent was asked the date when the business started tooperate):
1095
.
4.2 Exit Estimates� Definitive and timely signals for a business closure are not available on the BN administrative files. For the
initial version of the Entry/Exit Survey, a previously remitting PD account was identified as a potential exit if ithad not remitted to CCRA for six consecutive months.GST and PD remittances might be used in a similar manner to identify potential exits for this survey rendition.However, defining the specific rules for identifying exits is more problematic than in the old survey. PDremitters representing very small businesses now have the option of remitting quarterly. So it became necessaryto determine the optimal period of non-remitting to identify potential deaths (not late remitters). Similarly, GSTremitters can remit monthly, quarterly or annually depending on the size and nature of the business.Rules had to be defined which provided a definition of what would be considered a current potential exit. Thisproved more difficult than for the previous survey since there are signals from two administrative sources toreconcile. To define the population of potential exits, rules were defined making use of both PD and GSTsignals. Table 2 below gives counts of potential exits from the first quarter of 1999.
Table 2: Determination of potential exitsStatus Based on PD Remittances
Status Based on GSTRemittances
PotentialMonthly
Exit
PotentialQuarterly
Exit
Date of Last PD<=
Date of Last GST
Not onPD File TOTAL
Monthly Exit 55 1 195 181 432Quarterly Exit 341 42 2,153 3,683 6,219Quarterly Exit
(Default) 7 1 43 119 170
Annual Exit 184 64 N/A 14,482 14,730Date of Last GST
<=Date of Last PD
460 56 N/A N/A 516
Not on GST File 1,228 649 N/A N/A 1,877TOTAL 2,275 813 2,391 19,465 23,944
� The same sampling approach was taken for Exits: The target coefficients of variation were 5% for Sherbrookeand St Catharine – Niagara and of 10% for the National Residual.
Table 3 : Sample Size for Exit Survey
REGION Target CV p-value QuarterNumber ofPotential
Exits
SampleSize
Sherbrooke (QC) 5% 0.50 1999Q1 432 208St Catharines – Niagara (ON) 5% 0.50 1999Q1 1,750 326Other Urban Areas 10% 0.50 1999Q1 21,762 100
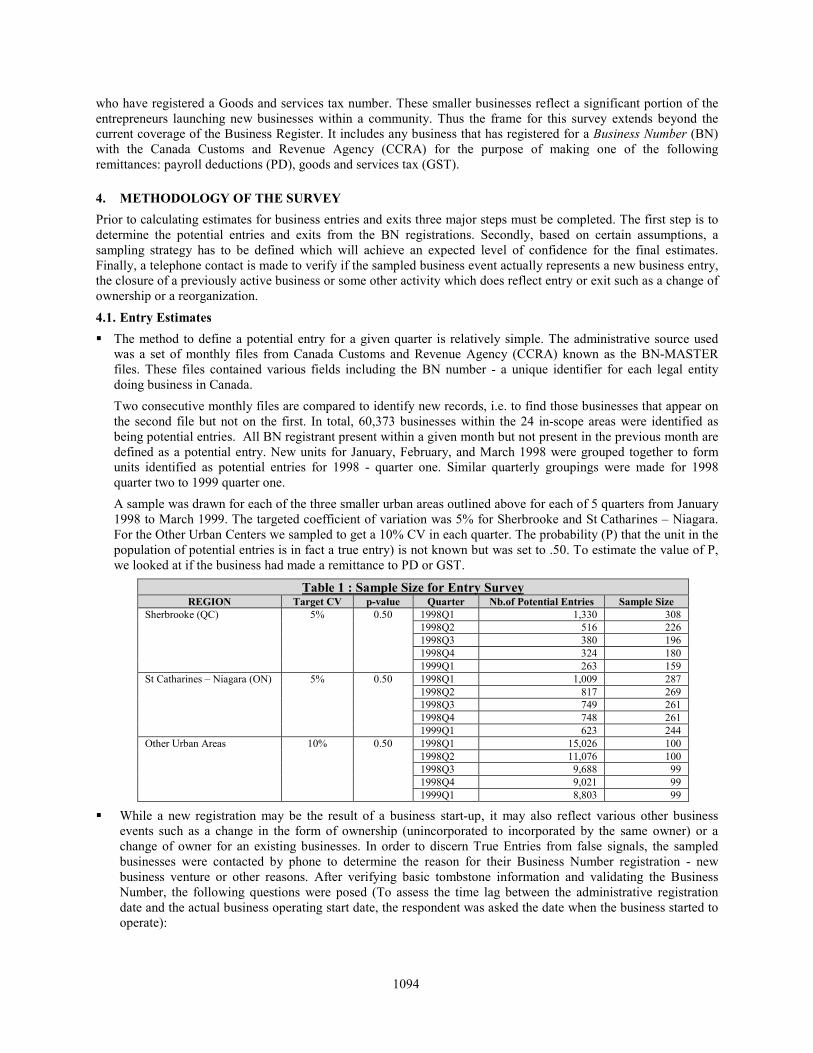
Section C – Entry Sample BusinessWhich of the following best describes the reason for opening or activation of this Business Number?1 New Business2 New ownership of a previously existing business3 A change in form of ownership, including change from unincorporated to incorporated by the same owner(s)4 Existing business but BN issued for administrative reason5 BN account was not activated6 Business has ceased operations
a) ask « When did it cease to operate ? ») _ _ _ _ _ _ (YYYYMM) _ b) ask « When did it initially start to operate » ? _ _ _ _ _ _ (YYYYMM) _ (unknown)0 Non-contact9 Other non-response
Section D2. When did your business start to operate ? _ _ _ _ _ _ (YYYYMM) _ (unknown)
1096
5. RESULTS: ESTIMATES FOR ENTRIES & EXITS
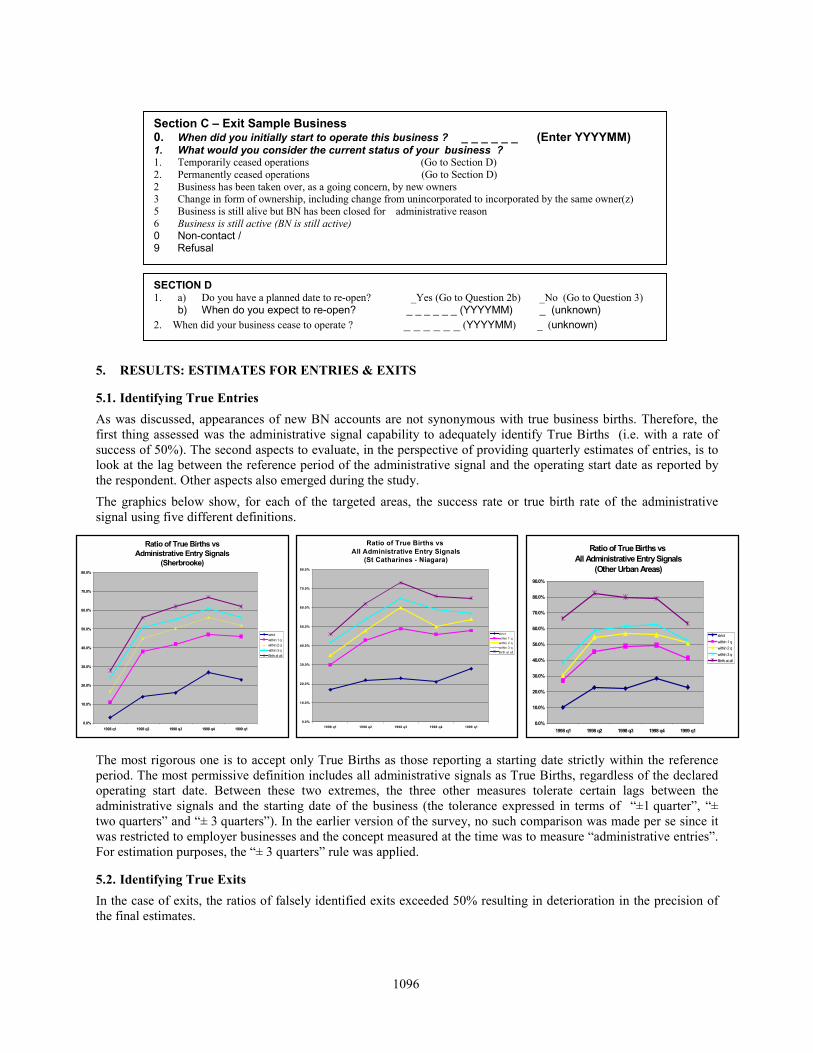
5.1. Identifying True EntriesAs was discussed, appearances of new BN accounts are not synonymous with true business births. Therefore, thefirst thing assessed was the administrative signal capability to adequately identify True Births (i.e. with a rate ofsuccess of 50%). The second aspects to evaluate, in the perspective of providing quarterly estimates of entries, is tolook at the lag between the reference period of the administrative signal and the operating start date as reported bythe respondent. Other aspects also emerged during the study.The graphics below show, for each of the targeted areas, the success rate or true birth rate of the administrativesignal using five different definitions.
The most rigorous one is to accept only True Births as those reporting a starting date strictly within the referenceperiod. The most permissive definition includes all administrative signals as True Births, regardless of the declaredoperating start date. Between these two extremes, the three other measures tolerate certain lags between theadministrative signals and the starting date of the business (the tolerance expressed in terms of “±1 quarter”, “±two quarters” and “± 3 quarters”). In the earlier version of the survey, no such comparison was made per se since itwas restricted to employer businesses and the concept measured at the time was to measure “administrative entries”.For estimation purposes, the “± 3 quarters” rule was applied.
5.2. Identifying True ExitsIn the case of exits, the ratios of falsely identified exits exceeded 50% resulting in deterioration in the precision ofthe final estimates.
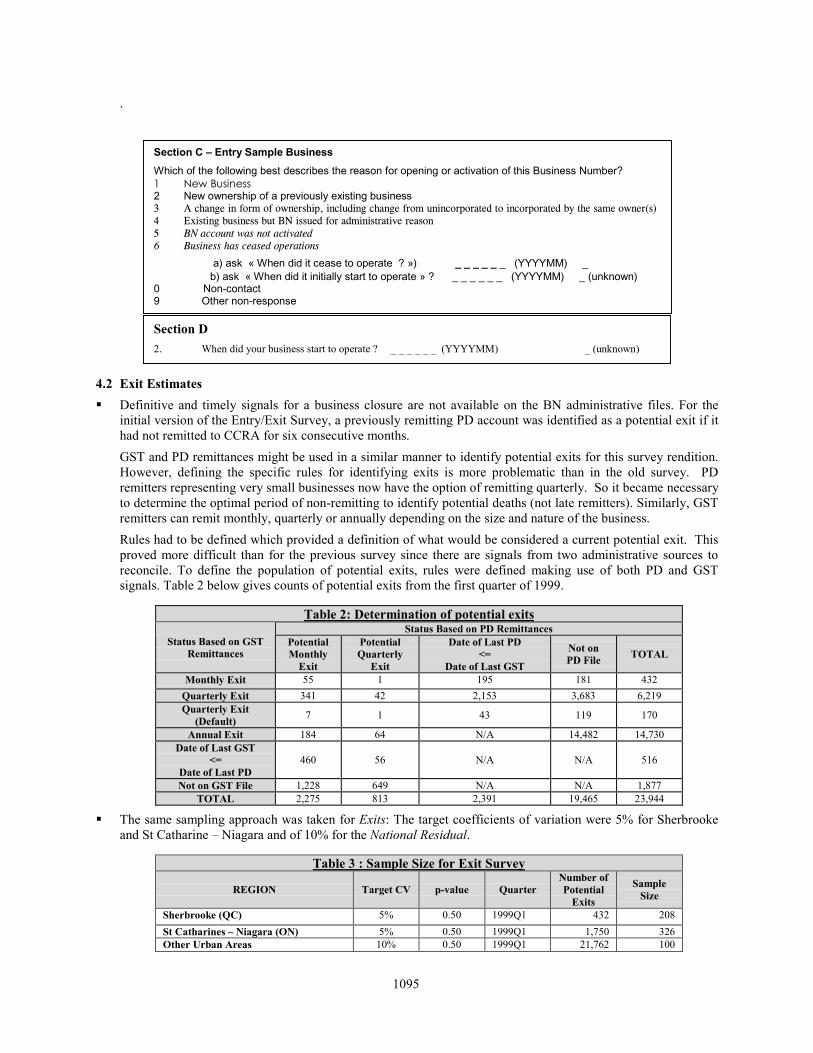
SECTION D1. a) Do you have a planned date to re-open? _Yes (Go to Question 2b) _No (Go to Question 3)
b) When do you expect to re-open? _ _ _ _ _ _ (YYYYMM) _ (unknown)2. When did your business cease to operate ? _ _ _ _ _ _ (YYYYMM) _ (unknown)
Ratio of True Births vs Administrative Entry Signals
(Sherbrooke)
0.0%
10.0%
20.0%
30.0%
40.0%
50.0%
60.0%
70.0%
80.0%
1998 q1 1998 q2 1998 q3 1998 q4 1999 q1
strictwithin 1 qwithin 2 qwithin 3 qBirth at all
Ratio of True Births vs All Administrative Entry Signals
(St Catharines - Niagara)
0.0%
10.0%
20.0%
30.0%
40.0%
50.0%
60.0%
70.0%
80.0%
1998 q1 1998 q2 1998 q3 1998 q4 1999 q1
strictwithin 1 qwithin 2 qwithin 3 qBirth at all
Ratio of True Births vs All Administrative Entry Signals
(Other Urban Areas)
0.0%
10.0%
20.0%
30.0%
40.0%
50.0%
60.0%
70.0%
80.0%
90.0%
1998 q1 1998 q2 1998 q3 1998 q4 1999 q1
strictwithin 1 qwithin 2 qwithin 3 qBirth at all
Section C – Exit Sample Business0. When did you initially start to operate this business ? _ _ _ _ _ _ (Enter YYYYMM)1. What would you consider the current status of your business ?1. Temporarily ceased operations (Go to Section D)2. Permanently ceased operations (Go to Section D)2 Business has been taken over, as a going concern, by new owners3 Change in form of ownership, including change from unincorporated to incorporated by the same owner(z)5 Business is still alive but BN has been closed for administrative reason6 Business is still active (BN is still active)0 Non-contact /9 Refusal
1097
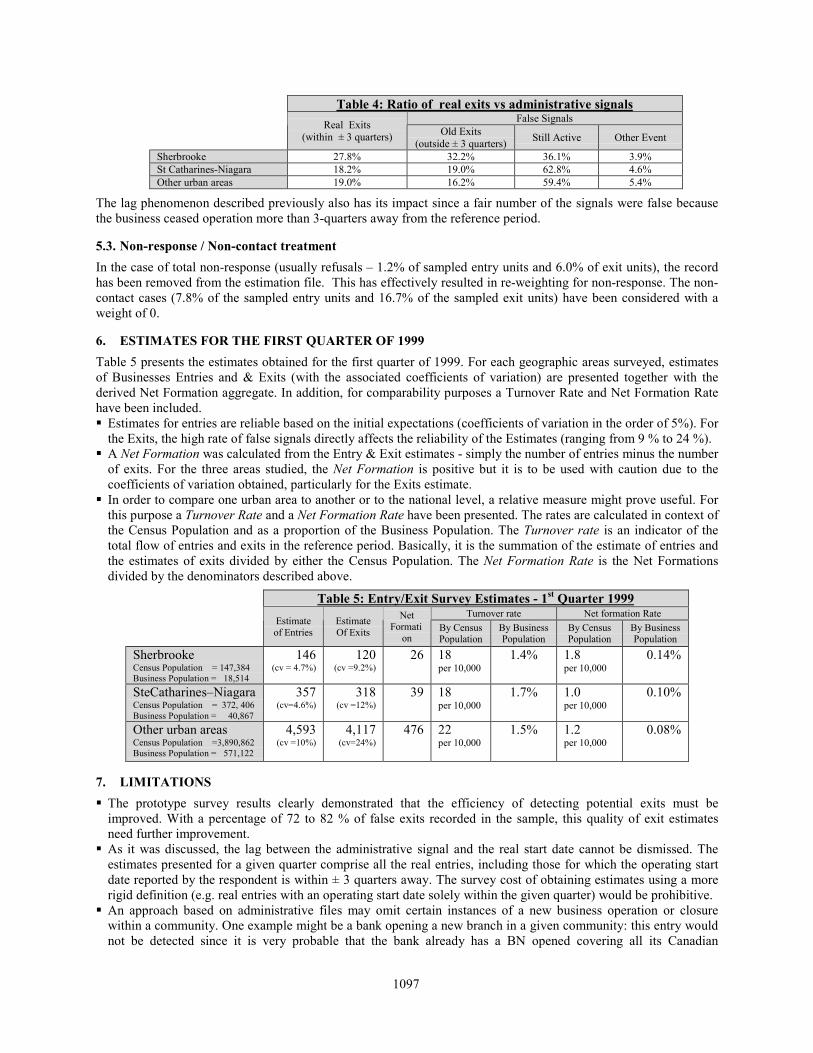
Table 4: Ratio of real exits vs administrative signalsFalse SignalsReal Exits
(within ± 3 quarters) Old Exits(outside ± 3 quarters) Still Active Other Event
Sherbrooke 27.8% 32.2% 36.1% 3.9%St Catharines-Niagara 18.2% 19.0% 62.8% 4.6%Other urban areas 19.0% 16.2% 59.4% 5.4%
The lag phenomenon described previously also has its impact since a fair number of the signals were false becausethe business ceased operation more than 3-quarters away from the reference period.
5.3. Non-response / Non-contact treatmentIn the case of total non-response (usually refusals – 1.2% of sampled entry units and 6.0% of exit units), the recordhas been removed from the estimation file. This has effectively resulted in re-weighting for non-response. The non-contact cases (7.8% of the sampled entry units and 16.7% of the sampled exit units) have been considered with aweight of 0.
6. ESTIMATES FOR THE FIRST QUARTER OF 1999Table 5 presents the estimates obtained for the first quarter of 1999. For each geographic areas surveyed, estimatesof Businesses Entries and & Exits (with the associated coefficients of variation) are presented together with thederived Net Formation aggregate. In addition, for comparability purposes a Turnover Rate and Net Formation Ratehave been included.� Estimates for entries are reliable based on the initial expectations (coefficients of variation in the order of 5%). For
the Exits, the high rate of false signals directly affects the reliability of the Estimates (ranging from 9 % to 24 %).� A Net Formation was calculated from the Entry & Exit estimates - simply the number of entries minus the number
of exits. For the three areas studied, the Net Formation is positive but it is to be used with caution due to thecoefficients of variation obtained, particularly for the Exits estimate.
� In order to compare one urban area to another or to the national level, a relative measure might prove useful. Forthis purpose a Turnover Rate and a Net Formation Rate have been presented. The rates are calculated in context ofthe Census Population and as a proportion of the Business Population. The Turnover rate is an indicator of thetotal flow of entries and exits in the reference period. Basically, it is the summation of the estimate of entries andthe estimates of exits divided by either the Census Population. The Net Formation Rate is the Net Formationsdivided by the denominators described above.
Table 5: Entry/Exit Survey Estimates - 1st Quarter 1999Turnover rate Net formation Rate
Estimateof Entries
EstimateOf Exits
NetFormati
onBy CensusPopulation
By BusinessPopulation
By CensusPopulation
By BusinessPopulation
SherbrookeCensus Population = 147,384Business Population = 18,514
146(cv = 4.7%)
120(cv =9.2%)
26 18per 10,000
1.4% 1.8per 10,000
0.14%
SteCatharines–NiagaraCensus Population = 372, 406Business Population = 40,867
357(cv=4.6%)
318(cv =12%)
39 18per 10,000
1.7% 1.0per 10,000
0.10%
Other urban areasCensus Population =3,890,862Business Population = 571,122
4,593(cv =10%)
4,117(cv=24%)
476 22per 10,000
1.5% 1.2per 10,000
0.08%
7. LIMITATIONS� The prototype survey results clearly demonstrated that the efficiency of detecting potential exits must be
improved. With a percentage of 72 to 82 % of false exits recorded in the sample, this quality of exit estimatesneed further improvement.
� As it was discussed, the lag between the administrative signal and the real start date cannot be dismissed. Theestimates presented for a given quarter comprise all the real entries, including those for which the operating startdate reported by the respondent is within ± 3 quarters away. The survey cost of obtaining estimates using a morerigid definition (e.g. real entries with an operating start date solely within the given quarter) would be prohibitive.
� An approach based on administrative files may omit certain instances of a new business operation or closurewithin a community. One example might be a bank opening a new branch in a given community: this entry wouldnot be detected since it is very probable that the bank already has a BN opened covering all its Canadian
1098
operations. Another example might be where a new entrepreneur does not open a BN account until his/herbusiness grows to a revenue threshold requiring GST remittances or upon hiring employees.
8. DISCUSSION� The quality of exit estimate issue has to be addressed. By nature, an exit determination criteria which keys on the
cessation of tax remittances will always have “lag problem” especially with the different remittance scheduleoptions offered by CCRA (since many of the exit signals come from annual GST remitters, it becomes particularlydifficult to produce sub-annual estimates). The high “non-response/non-contact” rate can be attributed to thisfactor. Alternatives to evaluate exits have to be investigated. One approach that is being seriously considered isnot to estimate the exits directly but estimate the entries and the continuing active business population. The surveycycle might take the following pattern:- At the beginning of the Reference Period, the first step will be to estimate the total active business population.
To do so, the survey frame would be comprised of all active BNs located in the in-scope area. A samplewould be drawn to estimate the truly active population using the same techniques used earlier. In this casethough the probability of a business being active could conservatively be set with a p-value of .70 or higher(based of Statistics Canada surveys’ results, the rate of out of business cases is around 15%).
- At the end of the reference period, the estimate of the total population would be repeated plus the entryestimate would performed the same way as in this prototype. The following calculations would be performed:
Net Formation = P - P’ = E - X -> X = E + P’ - P
P : Total of active businesses at the beginning of the reference period P’: Total of active businesses at the end of the reference periodE : Entries for the reference period X: Exits for the reference period
The cost and the response burden aspects of the survey would actually be improved. Taking as an exampleSt Catharines - Niagara area in the first quarter of 1999 (N = 40,867) with a targeted CV of 5% and a p-valueof .75, the sample size would be 133 (versus 326 in the method used in the currently Exit component).
� Over a longer perspective, one objective is to look at a strategy that attempts to derive an adjustment factor thatwould be applied directly on the raw administrative data in order to calculate the entry & exit estimates. Twoaspects are to be taken into considerationFirst, the possibility of using from administrative data directly the “True Entry/Exit Ratios” obtained in thesurvey was investigated. Hypothesis testing was done in order to determine if ratios from one area could beapplicable on other areas of similar size. Even though the ratios look similar from one area to the other, thehypothesis was rejected.Therefore, it can be concluded that the p-ratio observed for Sherbrooke is not consideredas identical to the p-ratio observed for St Catharines -Niagara. Also, within the same area, another concern is tovalidate whether the obtained ratios could be applied from one year to the next. The necessity to considerseasonal adjustment would be a consideration for these data. However, a compilation of 5 to 6 years of datawould be required in order to achieve a stable adjustment factor.Secondly, research could be done to see if there are efficient ways to move from a “± 3 quarters” definition to the“strict reference quarter” definition of an entry. One approach would be to be more restrictive in the definition ofa true entry which would effectively decrease the p-value but with the impact of having to increase substantiallythe sample size. Another alternative might be to retroactively refine the estimate after each cycle. For exampleafter the 1999Q2 treatment, the estimates of the 1999Q1 could be improved by taking into considerations theentries with a “minus one quarter” lag and so on with 1999Q3 results as well with 1998Q4 results. With thisapproach ,the process becomes inherently cumbersome and would not provide indicators in a timely fashion.
9. CONCLUSIONStatistics Canada, in collaboration with other federal department partners, is planning to set up a second phase of theproject, taking in consideration the improvements described in the last section.Even though external clients and users are mostly interested in entry figures, Statistics Canada considers imperativethat both entry & exit estimates are produced. One without the other does not give a picture of businessformation/dissolution. Secondly, estimates have to be produced in a relatively timely fashion in order to be relevantfor analysts even if it implies less stringent definition of an “entry/exit”. Also this strengthens the argument for thenew proposed method of measuring exits. Finally, in order to build a long term data series in at a minimum costusing adjustment factors directly on the crude administrative data is a certain prerequisite. This objective is to befully considered over the longer term.

1099
ESTIMATING THE EFFECTS OF BIRTH AND DEATH LAGS ON A BUSINESS REGISTER
Dan Hedlin, University of Southampton, UK and Mark Pont and Trevor Fenton, Office for NationalStatistics, UK
Dan Hedlin, University of Southampton, Highfield, Southampton, UK, SO17 1BJ. [email protected]
ABSTRACT
In this paper we tackle the issue of the registration and deregistration of businesses on the UK's business register. There is atime delay between the start-up of a business and the event being recorded on the business register. Likewise for businessclosures. We show that the undercoverage due to missing live units (new births) and overcoverage due to units where thedeath has not yet been notified are unequal. A key part of our work was to develop a method to predict the undercoveragedue to birth lags in terms of the number of businesses. Such a measure can be used as a frame quality indicator.
Key Words: business register, lags, reporting delay, undercoverage.
1. INTRODUCTION
One of the imperfections relating to business registers in general, and the UK’s Inter-Departmental BusinessRegister (IDBR) specifically, is miscoverage caused by delays in recording real-life events on the register. Newunits generally appear on the register some time after the date they begin to trade and units that have ceased to tradeare not removed from the register immediately.
For most units there is a one-to-one link between members of the target and frame populations. Where units are inthe target population but not on the frame, we call this undercoverage: businesses that have begun to trade but arenot yet on the IDBR form one part of this frame undercoverage. Conversely, businesses that have ceased trading buthave not yet been removed from the frame form part of overcoverage.
To accurately reflect the true population of businesses the IDBR would need to instantly adjust to add a newbusiness the moment it starts trading and delete a business the moment it stops. In reality this is not possible. Werely on administrative sources for our information and we are subject to the delays inherent within these systems.The result of this is that there will be a “birth lag” between the time a business actually begins trading and itsappearance on the register and a “death lag” between actual cessation of activity and the business being removedfrom the IDBR.
Measuring these lags allows us to estimate the extent of undercoverage caused by birth lag and overcoverage causedby death lag. This in turn should allow us to determine the best way to modify our estimation procedures to takeaccount of the missing/superfluous data.
2. MEASURING LAGS AND COVERAGE
In order to make a full analysis of lags we used as much historical register data as possible. The IDBR is a relativelyyoung register, being first established during 1993 as a result of the merging of two former registers. We have onlyused data from January 1995 to April 1998 (the time our data were extracted from the register) since prior to that theIDBR was in a period of settling down, during which structures were corrected and duplication identified andremoved.
The length of birth and death lags is extremely variable. Some businesses register as soon as they are set up,resulting in very short lags. Others may have been operating for years below the "VAT threshold" – the level ofannual turnover above which registration is compulsory – before their growth necessitates their registration. In thesecases the lag may be very long indeed. Some businesses actually register for VAT or Pay As You Earn (PAYE) in
1100
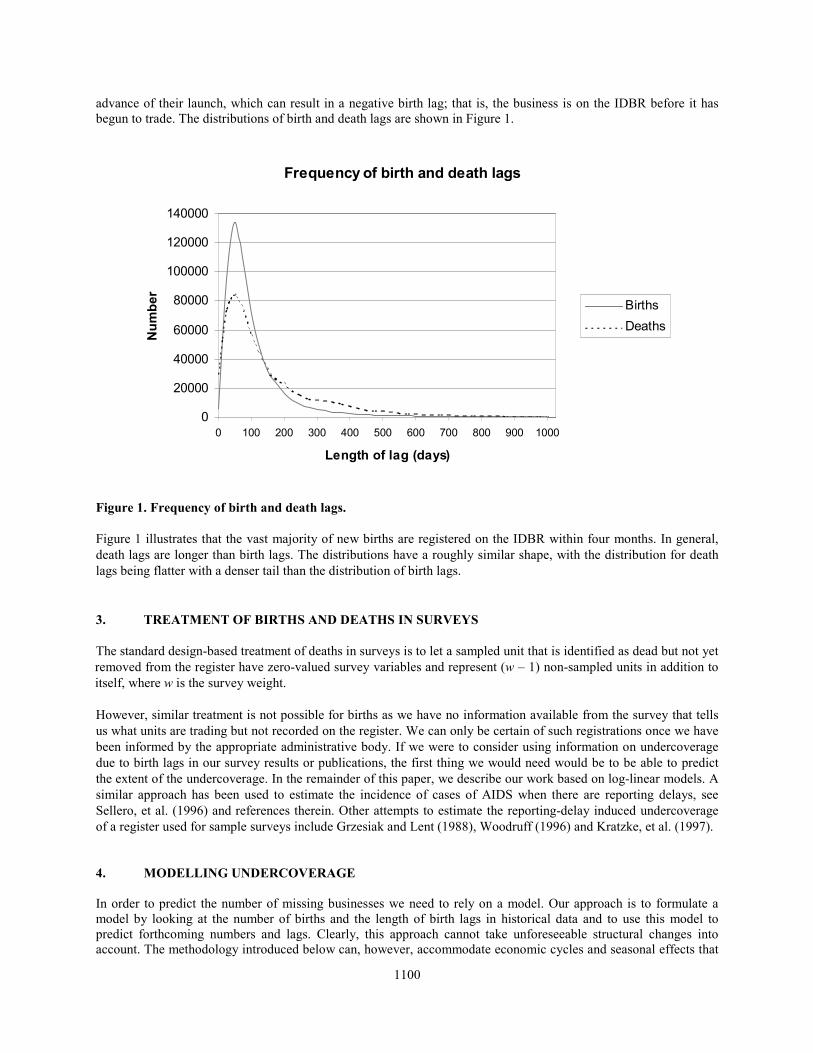
advance of their launch, which can result in a negative birth lag; that is, the business is on the IDBR before it hasbegun to trade. The distributions of birth and death lags are shown in Figure 1.
Figure 1. Frequency of birth and death lags.
Figure 1 illustrates that the vast majority of new births are registered on the IDBR within four months. In general,death lags are longer than birth lags. The distributions have a roughly similar shape, with the distribution for deathlags being flatter with a denser tail than the distribution of birth lags.
3. TREATMENT OF BIRTHS AND DEATHS IN SURVEYS
The standard design-based treatment of deaths in surveys is to let a sampled unit that is identified as dead but not yetremoved from the register have zero-valued survey variables and represent (w – 1) non-sampled units in addition toitself, where w is the survey weight.
However, similar treatment is not possible for births as we have no information available from the survey that tellsus what units are trading but not recorded on the register. We can only be certain of such registrations once we havebeen informed by the appropriate administrative body. If we were to consider using information on undercoveragedue to birth lags in our survey results or publications, the first thing we would need would be to be able to predictthe extent of the undercoverage. In the remainder of this paper, we describe our work based on log-linear models. Asimilar approach has been used to estimate the incidence of cases of AIDS when there are reporting delays, seeSellero, et al. (1996) and references therein. Other attempts to estimate the reporting-delay induced undercoverageof a register used for sample surveys include Grzesiak and Lent (1988), Woodruff (1996) and Kratzke, et al. (1997).
4. MODELLING UNDERCOVERAGE
In order to predict the number of missing businesses we need to rely on a model. Our approach is to formulate amodel by looking at the number of births and the length of birth lags in historical data and to use this model topredict forthcoming numbers and lags. Clearly, this approach cannot take unforeseeable structural changes intoaccount. The methodology introduced below can, however, accommodate economic cycles and seasonal effects that
Frequency of birth and death lags
0
20000
40000
60000
80000
100000
120000
140000
0 100 200 300 400 500 600 700 800 900 1000
Length of lag (days)
Num
ber
BirthsDeaths
1101
have been observed in historical data. As the usable data we have go back only to 1995 we have not attempted tomodel business cycles.
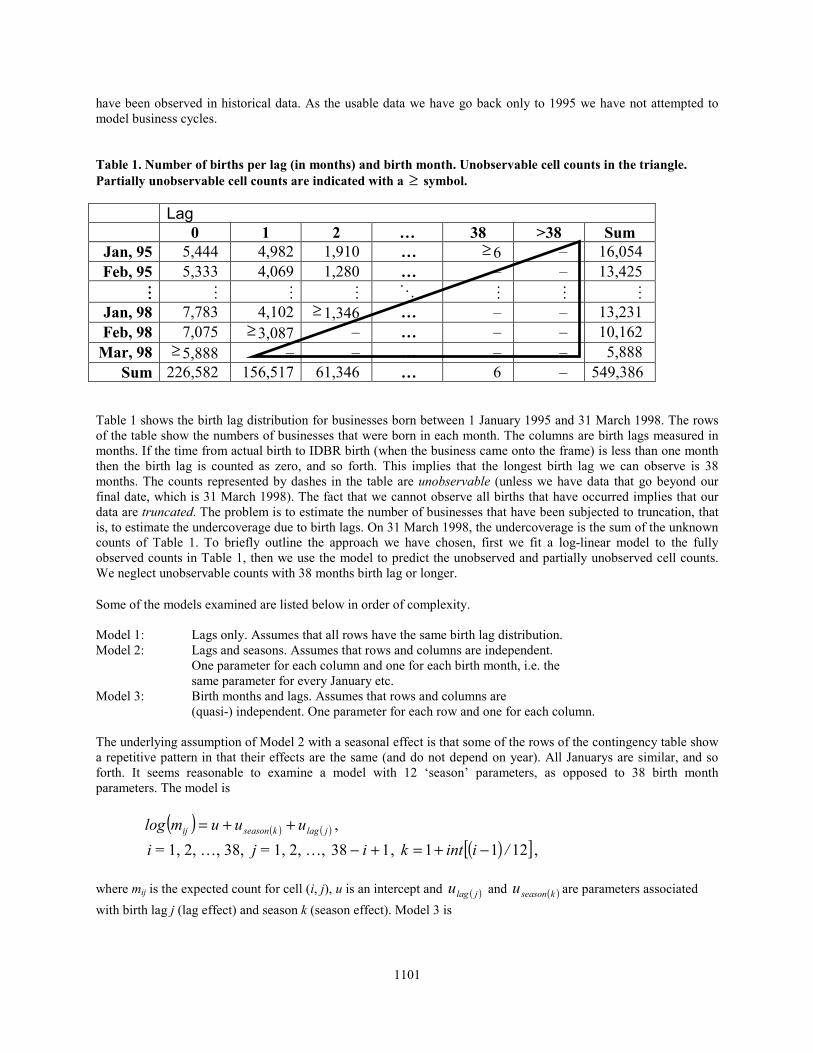
Table 1. Number of births per lag (in months) and birth month. Unobservable cell counts in the triangle.Partially unobservable cell counts are indicated with a ≥ symbol.
Lag0 1 2 … 38 >38 Sum
Jan, 95 5,444 4,982 1,910 … ≥ 6 – 16,054Feb, 95 5,333 4,069 1,280 … – – 13,425
���� � � � � � � �
Jan, 98 7,783 4,102 ≥ 1,346 … – – 13,231Feb, 98 7,075 ≥ 3,087 – … – – 10,162
Mar, 98 ≥ 5,888 – – … – – 5,888Sum 226,582 156,517 61,346 … 6 – 549,386
Table 1 shows the birth lag distribution for businesses born between 1 January 1995 and 31 March 1998. The rowsof the table show the numbers of businesses that were born in each month. The columns are birth lags measured inmonths. If the time from actual birth to IDBR birth (when the business came onto the frame) is less than one monththen the birth lag is counted as zero, and so forth. This implies that the longest birth lag we can observe is 38months. The counts represented by dashes in the table are unobservable (unless we have data that go beyond ourfinal date, which is 31 March 1998). The fact that we cannot observe all births that have occurred implies that ourdata are truncated. The problem is to estimate the number of businesses that have been subjected to truncation, thatis, to estimate the undercoverage due to birth lags. On 31 March 1998, the undercoverage is the sum of the unknowncounts of Table 1. To briefly outline the approach we have chosen, first we fit a log-linear model to the fullyobserved counts in Table 1, then we use the model to predict the unobserved and partially unobserved cell counts.We neglect unobservable counts with 38 months birth lag or longer.
Some of the models examined are listed below in order of complexity.
Model 1: Lags only. Assumes that all rows have the same birth lag distribution.Model 2: Lags and seasons. Assumes that rows and columns are independent.
One parameter for each column and one for each birth month, i.e. thesame parameter for every January etc.
Model 3: Birth months and lags. Assumes that rows and columns are(quasi-) independent. One parameter for each row and one for each column.
The underlying assumption of Model 2 with a seasonal effect is that some of the rows of the contingency table showa repetitive pattern in that their effects are the same (and do not depend on year). All Januarys are similar, and soforth. It seems reasonable to examine a model with 12 ‘season’ parameters, as opposed to 38 birth monthparameters. The model is
( ) ( ) ( )jlagkseasonij uuumlog ++= , i = 1, 2, …, 38, j = 1, 2, …, 138 +− i , ( )[ ]1211 /iintk −+= ,
where mij is the expected count for cell (i, j), u is an intercept and ( )jlagu and ( )kseasonu are parameters associatedwith birth lag j (lag effect) and season k (season effect). Model 3 is
1102
( ) ( ) ( )jlagibirthmonthij uuumlog ++= , i = 1, 2, … 38, j = 1, 2, … , 138 +− i .
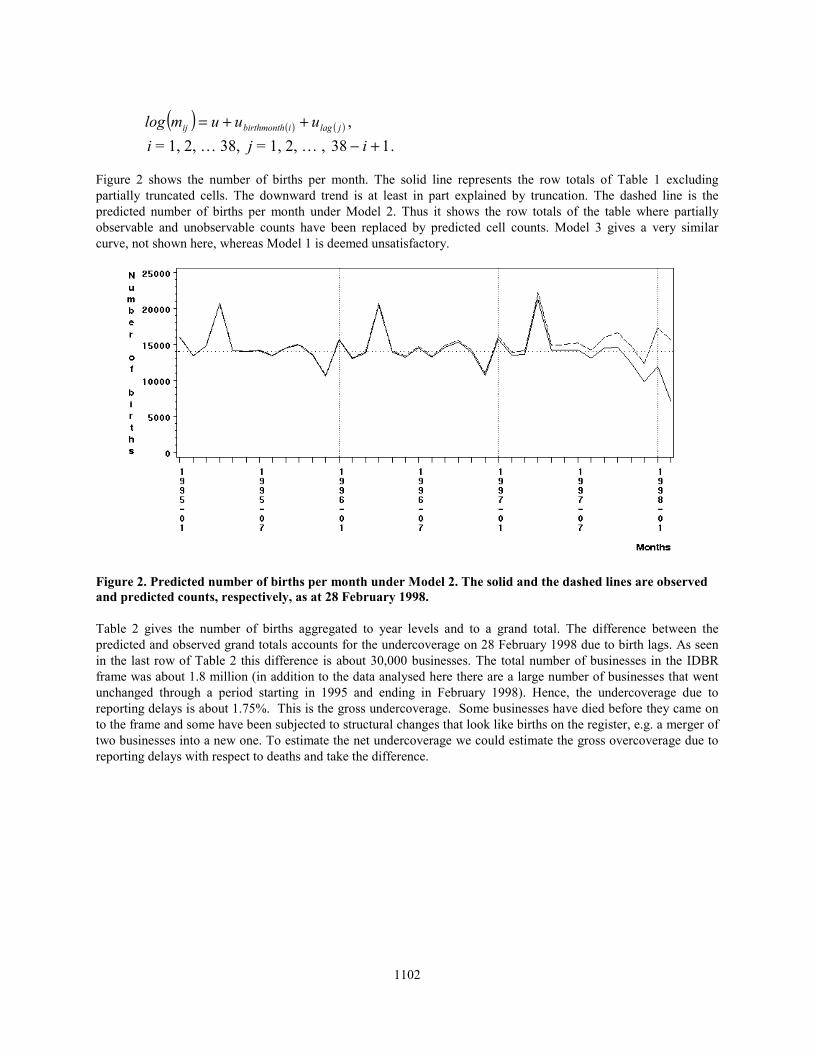
Figure 2 shows the number of births per month. The solid line represents the row totals of Table 1 excludingpartially truncated cells. The downward trend is at least in part explained by truncation. The dashed line is thepredicted number of births per month under Model 2. Thus it shows the row totals of the table where partiallyobservable and unobservable counts have been replaced by predicted cell counts. Model 3 gives a very similarcurve, not shown here, whereas Model 1 is deemed unsatisfactory.
Figure 2. Predicted number of births per month under Model 2. The solid and the dashed lines are observedand predicted counts, respectively, as at 28 February 1998.
Table 2 gives the number of births aggregated to year levels and to a grand total. The difference between thepredicted and observed grand totals accounts for the undercoverage on 28 February 1998 due to birth lags. As seenin the last row of Table 2 this difference is about 30,000 businesses. The total number of businesses in the IDBRframe was about 1.8 million (in addition to the data analysed here there are a large number of businesses that wentunchanged through a period starting in 1995 and ending in February 1998). Hence, the undercoverage due toreporting delays is about 1.75%. This is the gross undercoverage. Some businesses have died before they came onto the frame and some have been subjected to structural changes that look like births on the register, e.g. a merger oftwo businesses into a new one. To estimate the net undercoverage we could estimate the gross overcoverage due toreporting delays with respect to deaths and take the difference.
1103
Table 2. Predicted and observed births per year and their ratio.
YearObserved number
ofbirths
Ratio predictedto observed,
Model 2
Ratiopredicted toobserved,Model 3
1995 174,304 1.00 1.001996 172,621 1.01 1.011997 171,268 1.08 1.091998 18,960 1.74 1.92All 537,153 1.06 1.06
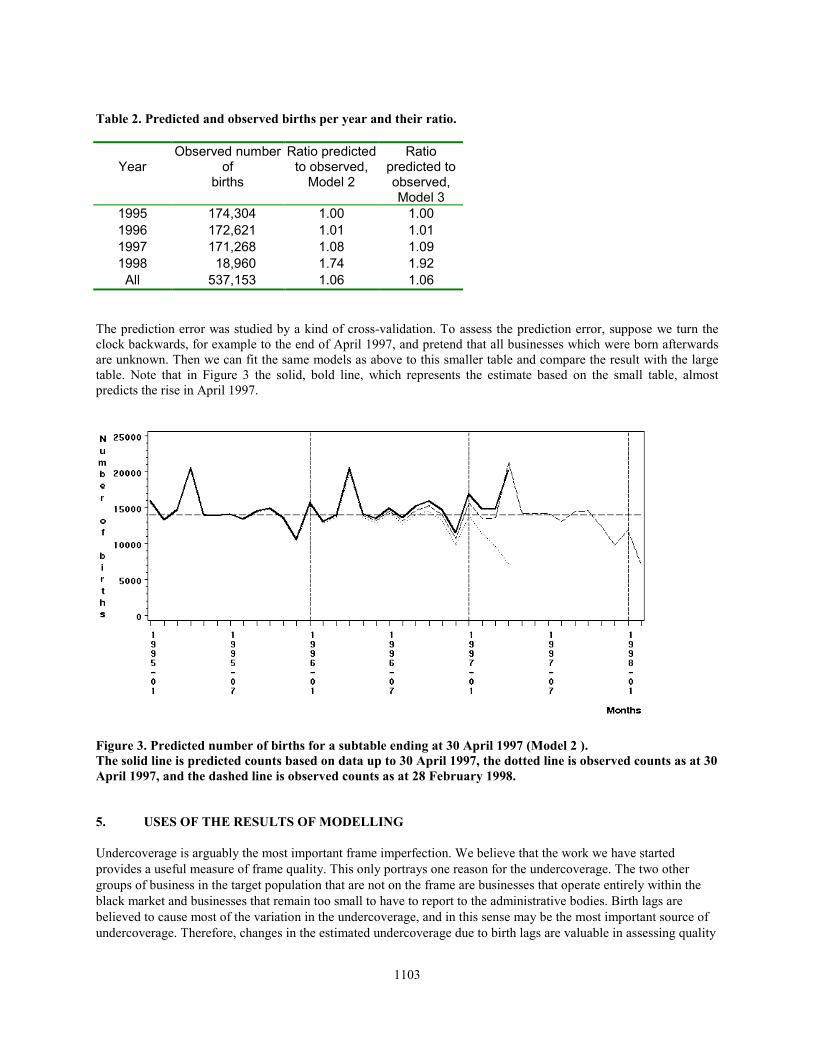
The prediction error was studied by a kind of cross-validation. To assess the prediction error, suppose we turn theclock backwards, for example to the end of April 1997, and pretend that all businesses which were born afterwardsare unknown. Then we can fit the same models as above to this smaller table and compare the result with the largetable. Note that in Figure 3 the solid, bold line, which represents the estimate based on the small table, almostpredicts the rise in April 1997.
Figure 3. Predicted number of births for a subtable ending at 30 April 1997 (Model 2 ).The solid line is predicted counts based on data up to 30 April 1997, the dotted line is observed counts as at 30April 1997, and the dashed line is observed counts as at 28 February 1998.
5. USES OF THE RESULTS OF MODELLING
Undercoverage is arguably the most important frame imperfection. We believe that the work we have startedprovides a useful measure of frame quality. This only portrays one reason for the undercoverage. The two othergroups of business in the target population that are not on the frame are businesses that operate entirely within theblack market and businesses that remain too small to have to report to the administrative bodies. Birth lags arebelieved to cause most of the variation in the undercoverage, and in this sense may be the most important source ofundercoverage. Therefore, changes in the estimated undercoverage due to birth lags are valuable in assessing quality

1104
of estimates produced from the frame. This work could be developed as part of ONS' ongoing research programmeto generate frame quality indicators, but nothing is yet proposed.
The level of undercoverage in terms of number of businesses tells us little about the bias of survey estimates. Forsure the frame population is smaller than the target population, but we know little about the characteristics of theunits that are newly birthed and not on the register, and how they differ from established units. Further work couldbe to extrapolate survey variables for businesses that have come on the frame recently, but none is currentlyproposed.
6. ACKNOWLEDGEMENTS
This work was partly supported by funding from Eurostat, the Statistical Office of the European Community.Thanks are due to Suojin Wang, Texas A&M University, and John W McDonald, University of Southampton, fortheir input without which this work would not have been accomplished.
7. REFERENCES
Grzesiak, T.J., and Lent, J. (1988), "Estimating Business Birth Employment in the Current Employment StatisticsProgram," Proceedings of the Survey Research Methods Section, American Statistical Association, pp. 597-602.
Kratzke, D.-T., Shierholz, H., and Woodruff, S. (1997), "Measuring Employment from Births and Deaths in theCurrent Employment Statistics Survey," Proceedings of the Survey Research Methods Section, American StatisticalAssociation, pp. 210-215.
Sellero, C.S., Fernández, E.V., Manteiga, W.G., Otero, X.L., Hervada, X., Fernández, E., and Taboada, X.A. (1996),"Reporting Delay: a Review with a Simulation Study and Application to Spanish AIDS Data," Statistics inMedicine, 15, pp. 305-321.
Woodruff, S. (1996), "Predicting Births in the Current Employment Statistics Survey," Proceedings of the SurveyResearch Methods Section, Vol 1, American Statistical Association, pp. 359-362
1105
SURVEYS OF BUSINESS REGISTER QUALITY IN CENTRAL EUROPEAN COUNTRIES
Paul Smith and John Perry, Office for National StatisticsPaul Smith, ONS, Cardiff Road, Newport, NP10 8XG, UK
ABSTRACT
Since 1995 eleven central European countries (twelve from 1998) have been running a consistent survey of businessesfrom their registers, to investigate the quality of the information on the register, and to provide information on ghost ratesand business demography. This paper describes the methods in use and the challenges in obtaining consistency over adiverse range of practices and systems, including the sampling methods, fieldwork, imputation and production of results.Some results from the surveys are also presented, indicating the pattern of creations of new businesses, and the evolution ofbusinesses estimated from longitudinal follow-up surveys. The results have been affected by changes in the registrationlaws in some of the participating countries, and comments on the consistency of the estimates over these changes areincluded.
Key Words: ghost rates, business demography, register quality survey, registration lags
1. INTRODUCTIONThe change in central European countries from central measurement of nationalised industry to a market-ledeconomy where small businesses play a much larger role has created many challenges for the collection of enterprisestatistics. In particular large-scale censuses are no longer appropriate and sample-based surveys are much moreimportant. A key underpinning of such surveys is the business register, and in 1992 Eurostat began preparations fora Pilot Project (called PECO), funded under the PHARE program, to investigate the quality of the information onthe business registers in the Central European countries (CEC’s) covered by that program. This led to survey workbeginning in 1995 in Albania, Bulgaria, Czech Republic, Estonia, Hungary, Latvia, Lithuania, Poland, Romania,Slovakia and Slovenia to look at the quality of information about existing businesses, and specifically to estimate theghost rates (proportions of businesses which are active according to the register but which in fact no longer exist orhave never operated). This survey was supplemented by a survey of businesses newly created in 1995, andsubsequently by surveys of newly created businesses in succeeding years. The ghost rate problem is particularlyacute since the administrative systems in most of these countries were good at obtaining information onregistrations, but had either incomplete information on, or no mechanism for identifying, businesses which died(ceased to be active).
A second phase of the project (called DoSME – demography of small and medium-sized enterprises) began in 1997with the aim of continuing the surveys of newly created businesses, but also of following up previously surveyedbusinesses to see how they had evolved. This set of information would be built into a longitudinal database whichcould be used to produce estimates of population size and business evolution. DoSME itself is split into two stages,with one large-scale follow-up survey in each phase. From 1998 the Former Yugoslav Republic of Macedonia wasalso included in the survey. The project completes its first phase in 2000. A second phase is planned covering ten ofthe twelve countries from the first phase. Albania and the Macedonia FYR will not be included but are expected toform part of a separate Balkans area project.
The projects have also had the aim of developing expertise in surveys and survey techniques, and of linking thesetraining opportunities to the use of surveys in the statistical offices of the CEC’s. A key challenge for a project ofthis nature is to have some software and systems which will work in all the participating countries, and to ensure thatthere is central management of the data and storage. In this project Infostat (the statistical computing service inSlovakia) has undertaken this role, and produced software which operates successfully in a number of environments.
2. SURVEY A: QUALITY OF INFORMATION ON THE EXISTING BUSINESSES‘A’ was the label given to the first survey, which had as its primary objective the estimation of ghost rates on thebusiness registers in the eleven participating CEC’s. Several other areas amenable to surveying were, however, ofinterest, and the survey also aimed to find information on the industrial classification, business origin and legalstatus, and of the characteristics of the proprietor, among others.
1111
IMPROVING THE QUALITY AND USE OF THE UK'S BUSINESS REGISTER
Mark Pont, John Perry, Mike Prestwood and Andrew Stephens, Office for National Statistics, UKMark Pont, Office for National Statistics, Cardiff Road, Newport, Wales, UK, NP10 8XG
ABSTRACT
Since the inception of the UK's business register, the Inter-Departmental Business Register (IDBR), in the early-1990s, arange of developments has been taking place to improve the quality and use of the IDBR. The drivers for thesedevelopments have been to improve the quality of economic statistics; to make better use of administrative data to maintainor improve quality whilst reducing the burden on businesses; and, to improve efficiency of statistical processes throughbetter techniques. This paper describes these important developments.
Key Words: administrative data, auxiliary variable, business register, quality, response burden
1. INTRODUCTION AND OVERVIEW OF THE UK BUSINESS REGISTER
In the early-1990s, the UK developed a new central register of businesses – the Inter-Departmental BusinessRegister (IDBR) (Perry 1995). This brought together two separate registers used by the then Central StatisticalOffice (one of the two organisations that merged to become the Office for National Statistics (ONS) in 1996) and theEmployment Department, whose statistical operations were themselves subsumed by CSO in 1995. The main drivefor the new register was to improve coverage and to improve the coherence of estimates produced from surveysusing the two registers as frames. In particular, the derivation of productivity and unit wage costs would be possibleusing statistics generated on a more consistent basis.
The IDBR begun to be used "live" in 1995 and since then many initiatives have been put in place to make the bestuse of the new register, and indeed to improve the quality and the use of the register. This paper describes some ofthe main areas of development.
The IDBR has two main administrative data sources. Data are received relating to traders who register for ValueAdded Tax (VAT) purposes with HM Customs and Excise, and to employers who operate Pay As You Earn (PAYE)income tax schemes. VAT registration is compulsory for traders with an annual turnover above the "VATthreshold", currently £52,000 except in a small number of exempt industries such as health and education, andPAYE registration is compulsory for employers operating PAYE schemes. Table 1, below, presents a summary ofthe numbers of reporting units (equivalent to enterprises in most cases and to homogeneous subsets of enterprises ina few cases) by broad employment sizeband and administrative source.
Table 1: Number ('000s) of live IDBR reporting units for the mainstream business surveys, March 2000
Reporting unit size (employment)Admin source 0-19 20-99 100+ TotalVAT and PAYE 633 61 19 712VAT only 785 3 1 788PAYE only 245 13 2 260Total 1,663 77 22 1,761
In addition to registered businesses, there are an estimated two million very small businesses trading below the VATthreshold and without PAYE schemes. These are largely sole proprietors but include some partnerships, and areestimated to contribute only about 1 per cent of the total output of the UK economy. They therefore represent asmall degree of frame undercoverage.
1112
2. USING THE IDBR TO MEASURE, MINIMISE AND SPREAD RESPONDENT BURDEN
The use of a single register for sample selection in all ONS business surveys means that we are now able to measureaccurately the burden imposed on the business community. Records are kept for each sample selection, and atabulation is produced once a year. The following table is extracted from ONS' compliance plan (ONS 1999) andshows the compliance cost by employment sizeband, along with the approximate probability of a unit of a particularsize being included in an ONS sample survey during the year.
Table 2: Compliance Costs by Employment Sizeband for 1998 (1998 prices)
EmploymentSizeband
Compliance cost(£M)
No. ofbusinessescontacted
(‘000)
Averagecompliance cost
(£)
Total no. ofbusinesses
(‘000)
Probabilityof
selection
0 – 9 3.7 111 33 1824 1 in 1610 – 19 2.0 41 49 134 1 in 320 – 99 5.5 66 82 84 1 in 1100+ 9.9 22 458 23 1 in 1
TOTAL 21.0 241 88 2065 1 in 9
Since the inception of the IDBR, there has been a gradual standardisation of sampling schemes operated by thedifferent business surveys. Within those, we have also tried to rationalise the design of surveys to a range ofstandards, as suggested by the review discussed in section 3. One of the key benefits is to be able to control betterthe burden we are placing on the businesses by asking them to respond to our surveys. One of the benefits of thetype of analysis shown above is that we can identify and address any problems.
All main ONS surveys are now conducted on a stratified random sampling basis, with samples selected by themethod of Permanent Random Numbers (PRN) (see for example Ohlsson 1995 for more details on PRN schemesand co-ordinated samples). Standard definition of strata permits a degree of control of overlap. Samples forindividual surveys are permitted to be selected from the whole range of PRNs, but overlap is controlled by settingsampling start points at different positions in the (0,1] PRN range. This ensures minimal overlap between samplesselected for different surveys at the time the PRN system was first used. Overlap will continue to be minimisedwhere the sampling intervals for different surveys in the same strata move at the same speed. However, this isgenerally not quite the case, due to some inconsistencies in stratum definition and differing sample sizes amongsurveys. This means in practice that there is some limited overlap.
Of particular interest in recent years is the response burden imposed on the smallest businesses. In 1996 the UKGovernment commissioned a review of the statistical burden on business (Osmotherly, et al. 1996). ONS nowguarantees that (other than in exceptional circumstances) while units have an employment value of less than 10recorded on the register, they will be included in only one ONS survey at once. When such businesses are rotatedout of sample, they are guaranteed a "survey holiday" of three years, during which time they will not be included ina further ONS survey. Samples are designed to ensure as far as possible that the number of questionnaires to be sentto small businesses is minimised, which works with the PRN system to prevent overlap of samples. The register isalso able to provide a failsafe guarantee that a business cannot be reselected while on survey holiday. Of course, theregister also provides an opportunity for additional initiatives to be developed and implemented to help furtherspread the burden.
3. REVIEW OF REGISTER OPERATIONS
A general review (Kokic and Brewer 1996) of the IDBR procedures and their implications for statistics helped toraise awareness within ONS of a range of fundamental issues relating to business registers. Their report addressedfour main areas: sample selection, particularly sample stability; identification and treatment of duplicate units;problems associated with births and deaths of units; and updating the register.

1113
In terms of sample selection procedures, the report recommended a range of measures to improve the stability ofsample membership. This in turn would help in the rotation of samples, and the control of overlap of samples drawnfor concurrent surveys. In particular, strata for the key business surveys are now defined in a standard way usingindustrial classification and employment size, and the auxiliary information used to define strata in the monthly andquarterly surveys is updated only once per year thus reducing the number of movements of units from stratum tostratum.
Another key area the report addressed was that of duplication of units. The IDBR has two sources – VAT data onregistered traders and PAYE information from employers. Because the administrative systems operateindependently and businesses do not have to register in a similar way with the two sources, it is not always possibleto identify and match duplicate units. Thus there is a potential for overestimation of results or for wasted resourceswhen sending questionnaires to duplicate units. As a precaution, units where we expected (based on the size andindustrial classification information available) but failed to find a match, are excluded from the register. Some workhas been done to estimate the extent of the duplication, but this is difficult on such a large scale. Clerical work iscontinuously undertaken to match the units that are being held off the register, and this has been enhanced recentlywith the injection of funding from the Statistical Office of the European Community (Eurostat).
The report also discussed the problems associated with births and deaths of businesses on the business register – thishas provoked a wide-ranging study into the impact of births and deaths on ONS business statistics, which isdiscussed below in section 7.
The final area addressed by the report was that of feedback to the register. It is well known that feeding backinformation from samples can introduce bias into a register and estimates produced subsequently. In addition tofeedback from the administrative sources, the Annual Register Inquiry provides employment and site informationrelating to all the largest businesses annually, and to small and medium-sized businesses on a less frequent, althoughregular basis. Coupled with other business surveys that also collect information that may be used to improve thequality of the register, updating from the information collected by the union of business surveys offers a pragmaticapproach for maintaining the quality of the register. Feedback to the register from non-administrative sources isparticularly important in areas where administrative data are particularly weak or unhelpful in the context ofstatistical surveys.
4. MEASURING AND IMPROVING THE QUALITY OF THE REGISTER
As registers become ever-increasingly more important tools for sampling and analysis there is a greater attention tothe quality of the IDBR. Information about the quality can then be used to focus resources on areas where qualityimprovement is most necessary and most achievable.
A major drive has been the setting up of a register strategy group within ONS. The aim of this group is to develop astrategy for measuring and monitoring the quality of the register. This information will be used to help focusavailable resources on those areas where quality can be improved most, and where improved quality will have themaximum impact. The information can also be used to describe the quality of the register alongside publishedstatistics.
Part of the assessment of quality has been to elicit the views of customers of the register in the ONS and in otherGovernment Departments. Customers were asked to rate the quality of five aspects of the IDBR – businessstructures, sources of overcoverage, sources of undercoverage, industrial classification, and employmentinformation. They were also asked to assess the impact on their outputs of quality deficiencies in each of these areas.Areas with highest importance and lowest perceived quality could be targeted for development work.
In parallel with this, work has just started to try to measure the impact of register quality deficiencies on surveyestimates. This is an extension to a register quality study undertaken in 1998, which aimed to determine the extent towhich the information shown on the IDBR was correct. The further analysis is being undertaken based on theAnnual Register Inquiry (ARI). The purpose of the ARI is to update the unit structures and auxiliary variables storedon the register. Data from the survey can also be used to measure the quality of a frame. From these two strands, aquality strategy can be developed.

1114
A recent Government white paper (1999) established the concept of National Statistics. Within the NationalStatistics framework a programme of reviews of key areas has been instigated. The second of those reviews startedin spring 2000 to review the IDBR. The review will audit a range of important register processes, including the ARI,to identify where improvements in quality may be made. The review will also audit the implementation ofrecommendations from Kokic and Brewer (1996). In addition, we aim to develop a range of quality measures, andwill explore the use that can be made of the ARI as a vehicle for measuring the quality of the register. The review isdue to report in October 2000.
In addition to the work described so far in this paper, a variety of other initiatives to improve the quality of thebusiness register is also underway. Many of these projects are funded by Eurostat which is keen to supportdevelopments in this difficult area. Two of these are summarised below.
The first area of work relates to matching currently unmatched units from the VAT and PAYE sources. This willreduce the overcoverage of the IDBR, and improve the quality of employment information, as actual employmentinformation is not available for VAT-only units and has to be imputed from register turnover where needed.
The second area of work relates to the documentation of the IDBR. At present, the only documentation covers theclerical processes involved in updating the register. We have begun to represent the internal information flowsbetween IDBR units pictorially, and to give an indication of the sources of information and their relative importance.The objective is to present more meaningful measures of the quality of the information stored on the register tosurvey managers and other analysts.
5. IMPROVING CONSISTENCY AMONG ECONOMIC SECTORS
One stated benefit of the introduction of the IDBR was that the same population definition and the same auxiliaryvariable(s) could be used in all economic sectors. On a wider scale the IDBR could be used as a tool for rationalisingsurvey procedures as suggested in a review by Ken Brewer (Brewer 1996). Consequently a major project wasestablished to bring together the main annual structural surveys of production and construction, six separate surveysof the distribution and services sectors and the Annual Employment Survey (AES) into a single survey – the AnnualBusiness Inquiry (ABI). The ABI was first run as a single survey at the end of 1998, and enjoys consistentmethodologies across all economic sectors, as well as a more optimal allocation of the sample between economicsectors – previously the split of the total sample size between the distinct surveys was not based on scientificprinciples.
The development of the ABI also helps to realise one of the perceived benefits of the IDBR, namely employmentand other business statistics being compiled on a consistent basis from one business register, a process which beganwith the amalgamation of the short-period turnover and employment surveys in 1996. Following the work describedabove, plans are now afoot to bring the methodologies of the short-period surveys (which are currently organised ona sectoral basis) together.
6. INCREASING THE USE OF UP-TO-DATE ADMINISTRATIVE DATA
One of the key benefits of the IDBR is that auxiliary information is available from both the PAYE and VATadministrative sources. This gives scope for improving design and estimation of surveys. A major project since 1996has been to evaluate the potential benefits that might arise through better utilising up-to-date PAYE data onemployees. Reconstructions for short-period surveys collecting turnover and employment information frombusinesses were made using the PAYE information as alternative auxiliary data. The results showed that using thisPAYE data in the estimation process could reduce the variance of estimates of employment totals by as much as 50per cent in some domains. This demonstrates a huge improvement in efficiency, and the potential to produce betterquality outputs, either directly or by redistributing resources to other areas.
A more recent development is that turnover information – which is often used as the auxiliary variable in ratioestimation for output variables – is now available quarterly (instead of annually) from HM Customs and Excise. We

1115
have begun to investigate in the same way whether the precision of estimates of output variables can be improved byusing this more timely auxiliary information.
We are also beginning to investigate the extent to which this turnover information can be used directly to estimateshort period changes in output, as part of a new Index of Service sector output. If this approach proved to befeasible, ONS may be able to dispense with or scale down the large scale statistical surveys we have at present. Thisapproach could also be extended to the production sector if it were successful. Such a development would rely ontimely information being made available on a monthly basis, or for us to be able to interpolate monthly values fromquarterly or annual data series. Work so far suggests that a hybrid system may be the best solution. Under such asystem, administrative data will be used to provide most of the input into the index, and a small-scale survey couldbe conducted of the largest businesses. More details can be found in Moore and Jones (2000).
7. BIRTHS AND DEATHS OF BUSINESS UNITS
One of the processes that has a large impact on the maintenance and use of the business register is the recording ofthe opening (birth) and closure (death) of business units on the sampling frame. Typically, ONS is notified of birthsand deaths from the two administrative sources some time after the actual events have taken place in "the realworld". Until recently, very little work had been undertaken in ONS to examine the consequences of the lags inreporting births and deaths, or to consider what effect the lags were having on estimation of results – until now thedefault assumption has been that the effects of undercoverage due to delays in reporting births and overcoverage dueto delays in reporting deaths cancel each other out.
ONS has just spent a year, part-funded by Eurostat, examining the way that births and deaths are treated on theIDBR, and analysing the effects of our processes. We discovered that the average lag in reporting births was shorterthan the average lag in reporting deaths (four months compared with six months). One main reason for this is thatthe tax authorities will not close down a business record until all outstanding tax is received. Deaths can be dealtwith simply through the survey estimation process, but we have no way of identifying how many units have begunto trade but do not yet appear on the register. We proposed a method for estimating the undercoverage based on log-linear models. Results are reported in more detail in Hedlin, et al. (2000).
The consequence of the differential lags is that the IDBR appears to be over-representing the size of the businesspopulation at any point in time. Having said that, we acknowledge that it was difficult to draw any firm conclusionsfrom our analysis because the IDBR is still relatively new, and we did not have much data to analyse. In particular,it wasn't possible for us to distinguish between genuine births and deaths, and units that were created as part of abusiness restructuring. We are therefore treating all our results as indicative, and will be revisiting this topic oncebetter data are available for analysis.
One of the main recommendations made by this review is for an expansion of the information held about the historyof units on the register. We propose that this would take the form of a variable which would record any change tothe status of the business during its life. The information to be held could be based on a typology of changes such asthat included in the Eurostat Business Registers Manual (Eurostat 1996) which identifies changes such as births,deaths, mergers, split-offs, restructuring etc. Such information would make it possible to improve demographicanalyses and future research of the type undertaken here that depend on an accurate history of changes to businessunits.
8. USING THE IDBR TO IMPROVE SMALL AREA ESTIMATION
One of the by-products of the development of the ABI was the development of an Annual Register Inquiry (ARI),the aim of which is to update auxiliary and structural information on the register. Previously, the AES had carriedout this function. The ARI now collects employment and industrial classification information for each local unit (asingle site where a business is active) of selected enterprises. All the largest businesses are included in the surveyeach year, and all multi-site enterprises are included at least once every four years. Other businesses are included ona less frequent basis.
1116
In addition to the ARI being an important instrument to maintain the quality of the register, particularly on aconsistent basis across industries, it ensures that good quality information is available about the size and structure ofthe largest businesses. This detailed information about individual sites is important in producing regional estimatesfrom the ABI and short-period employment surveys. In these surveys, data relating to individual local units are"imputed" by decomposing reporting unit level responses according to the local unit information stored on the IDBR(Pont, et al. 1999). This gives a sounder basis for the production of estimates for small geographical areas as thelargest businesses have activity in many areas. There is large demand for information on small areas, particularly forlocal authority planning etc. The decomposition technique was first used in ONS in the production of small areaemployment estimates from monthly and quarterly surveys. The technique has more recently been used in the ABIto generate small area estimates of employment and other output variables.
9. CONCLUDING REMARKS
There is increasing pressure within the UK to make more effective use of the business register for surveys andeconomic analysis, in particular by making more use of administrative data. In addition, the use of the register as aco-ordinating tool is also acknowledged. In turn the evolving emphasis within the UK is mirrored by the priorities ofthe European Community which are to improve the quality of economic statistics by harmonising register,expanding the use of administrative data, making better use of registers and measuring quality.
10. REFERENCES
Brewer, K. R. W. (1996), "Report on a methodological study of the Annual Employment Survey", unpublishedreport, Newport, UK: ONS.
Eurostat (1996), Business Registers for Statistical Purposes: Methodological Recommendations Volume 1,Luxembourg: Eurostat.
Hedlin, D., Pont, M. E., and Fenton, T. S. (2000) "Estimating the Effects of Birth and Death Lags on a BusinessRegister", Proceedings of the Second International Conference on Establishment Surveys, Buffalo.
Kokic, P. N. and Brewer, K. R. W. (1996), "Operational Aspects of the IDBR", unpublished report, Newport, UK:ONS.
Moore, P. and Jones, D. G. (2000), "The use of administrative data as a proxy for survey data: the challenges andrewards", Proceedings of the Second International Conference on Establishment Surveys, Buffalo.
Ohlsson, E. (1995), "Coordination of Samples Using Permanent Random Numbers", in B. G. Cox, et al (eds.)Business Survey Methods, New York: Wiley, pp. 153-170.
ONS (1999), Compliance Plan 1999-2001, London: ONS.
Osmotherly, E., Graham, T. and Pepper, M. (1996), "Statistical Surveys: Easing The Burden On Business",Independent Report Commissioned By HM Government, London: UK.
Perry, J. A. (1995), "The Inter-Departmental Business Register", Economic Trends, 505, pp. 27-30.
Pont, M. E., Smith, P. A., Fenton, T. S. and Studley, R. S. (1999), "The Effect of Using Auxiliary Information toDecompose First-Stage Responses into Second-Stage Units in a Business Survey", in Banks, R., et al. (eds.) ASC'99...Leading Survey and Statistical Computing into the New Millennium, Proceedings of the 3rd ASC InternationalConference, pp. 365-374.

1106
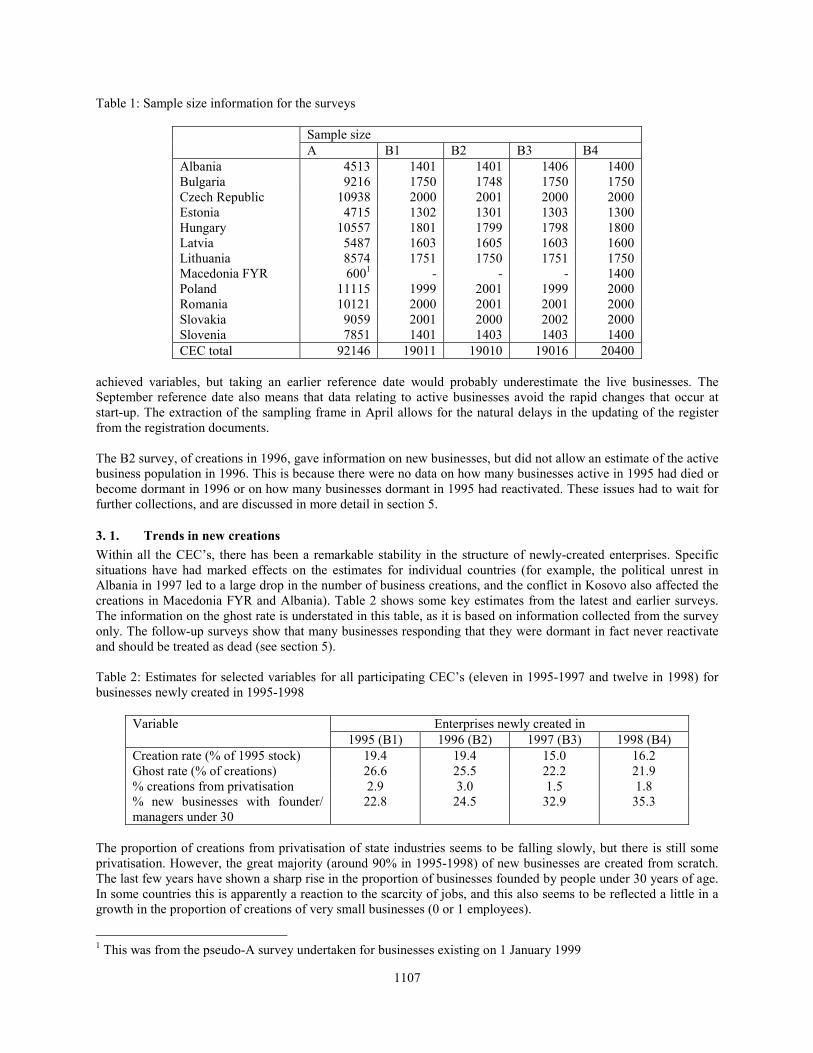
2. 1. Sample design and allocationAs in many surveys, the overall sample size was constrained by the money available to undertake fieldwork for thesurveys. A series of small-scale pilot studies in 1994 gave broad estimates of the ghost rate (g) on the registers. Thiswas used in the allocation of the sample to countries using the assumption that ( ) ( )gNgg −≈ 1var . As is well-known, small populations need proportionately larger samples sizes than large ones to achieve similar accuracy, andtaking account of the pilot survey estimates of g, the eventual allocation in table 1 was obtained.
The survey was stratified by year of registration of the business, with years before 1990 in a single stratum, and alsostratified by legal/natural persons and in some countries by location of business. The lack of a size stratification hassubsequently caused some challenges in producing results and analysis, although poststratification was used in oneof the surveys to alleviate this. In Hungary the earlier surveys used area sampling, to improve the efficiency of datacollection, which was by personal interview.
2. 2. Questionnaire designThe questionnaire for the surveys was designed in English. The initial questions involve the status of the business –whether it is active, dormant or dead. Dead businesses are not required (or able!) to complete the remainder of thequestions, which cover legal status, business origin, employment, premises, industrial classification, prevalence andtypes of trading difficulties, and characteristics of the owner. The questionnaire was translated into the nationallanguage(s) of the countries. All questions were consistent, but countries could add questions to the survey after thebasic questions, and in some cases this was done, mostly to measure or supplement measures of economic activity.
2. 3. FieldworkThe CEC’s have infrastructures in various stages of development, and this was reflected in the way in which thesurveys were undertaken. In some countries the approach was to use interviewers exclusively, to locate and contactbusinesses. In others the postal system is sufficiently reliable for the whole survey to be conducted on a postal basis.Other countries used a mixture of approaches, with an initial mail questionnaire with interviewer follow-up. Thetarget response rate for the surveys was set at 97%, but valid responses included dead businesses, partial responsesand businesses where information was obtained from indirect controls (proxies), such as neighbours or tax sources.This apparently high response rate has proved to be readily achievable in most cases with this definition. Thefieldwork methods developed as each survey was conducted. Table 1 shows the approach in the first (A) survey.
2. 4. ImputationImputation for total and partial non-response has been by a hot-deck method in all the surveys. This is an unusualapproach for business surveys, but the main interest here is in the characteristics of the enterprise, much as socialsurveys look at the characteristics of people and households. In this case the distributions of variables are moreimportant, and there is no requirement to estimate total economic activity, so a stochastic method is preferred.
2. 5. PublicationsTwo publications were produced from the data collected in the A survey – one summary volume, with an associatedpress notice and wide media coverage, and a more detailed publication, which analysed the wealth of informationcontained in the rest of the questionnaire and was published two years later. Results for publications usedappropriate stratum weighting to give estimates of population parameters.
3. SURVEYS B1-B4: INFORMATION ON NEWLY-CREATED BUSINESSESTo supplement the information on businesses existing on 1 January 1995, a survey of businesses created during1995 was undertaken during 1996 – the B1 survey. This completed the picture of businesses active in 1995, since Aand B1 cover the population. The approach has been repeated for businesses created in 1996-1998 in surveys B2-B4.In order to get a reasonable picture of the status of creations, some time was needed for newly registered businessesto begin their activity. Consequently sampling is based on an extract from the business register taken in Aprilfollowing the survey year (eg April 1996 for B1), but the fieldwork did not begin until September 1996, and theinformation collected relates to the business status on 1 September. This causes a mismatch between the target and
1107
Table 1: Sample size information for the surveys
Sample sizeA B1 B2 B3 B4
Albania 4513 1401 1401 1406 1400Bulgaria 9216 1750 1748 1750 1750Czech Republic 10938 2000 2001 2000 2000Estonia 4715 1302 1301 1303 1300Hungary 10557 1801 1799 1798 1800Latvia 5487 1603 1605 1603 1600Lithuania 8574 1751 1750 1751 1750Macedonia FYR 6001 - - - 1400Poland 11115 1999 2001 1999 2000Romania 10121 2000 2001 2001 2000Slovakia 9059 2001 2000 2002 2000Slovenia 7851 1401 1403 1403 1400CEC total 92146 19011 19010 19016 20400
achieved variables, but taking an earlier reference date would probably underestimate the live businesses. TheSeptember reference date also means that data relating to active businesses avoid the rapid changes that occur atstart-up. The extraction of the sampling frame in April allows for the natural delays in the updating of the registerfrom the registration documents.
The B2 survey, of creations in 1996, gave information on new businesses, but did not allow an estimate of the activebusiness population in 1996. This is because there were no data on how many businesses active in 1995 had died orbecome dormant in 1996 or on how many businesses dormant in 1995 had reactivated. These issues had to wait forfurther collections, and are discussed in more detail in section 5.
3. 1. Trends in new creationsWithin all the CEC’s, there has been a remarkable stability in the structure of newly-created enterprises. Specificsituations have had marked effects on the estimates for individual countries (for example, the political unrest inAlbania in 1997 led to a large drop in the number of business creations, and the conflict in Kosovo also affected thecreations in Macedonia FYR and Albania). Table 2 shows some key estimates from the latest and earlier surveys.The information on the ghost rate is understated in this table, as it is based on information collected from the surveyonly. The follow-up surveys show that many businesses responding that they were dormant in fact never reactivateand should be treated as dead (see section 5).
Table 2: Estimates for selected variables for all participating CEC’s (eleven in 1995-1997 and twelve in 1998) forbusinesses newly created in 1995-1998
Enterprises newly created inVariable1995 (B1) 1996 (B2) 1997 (B3) 1998 (B4)
Creation rate (% of 1995 stock) 19.4 19.4 15.0 16.2Ghost rate (% of creations) 26.6 25.5 22.2 21.9% creations from privatisation 2.9 3.0 1.5 1.8% new businesses with founder/managers under 30
22.8 24.5 32.9 35.3
The proportion of creations from privatisation of state industries seems to be falling slowly, but there is still someprivatisation. However, the great majority (around 90% in 1995-1998) of new businesses are created from scratch.The last few years have shown a sharp rise in the proportion of businesses founded by people under 30 years of age.In some countries this is apparently a reaction to the scarcity of jobs, and this also seems to be reflected a little in agrowth in the proportion of creations of very small businesses (0 or 1 employees).
1 This was from the pseudo-A survey undertaken for businesses existing on 1 January 1999

1108
3. 2. Introducing a new participantIn 1997 Macedonia FYR joined the project. They first undertook a small-scale pilot alongside survey B3, and wereincluded fully in survey B4. However, because they had not participated in the earlier stages, there was noinformation on ghost rates in the stock of pre-existing (rather than newly created) businesses. Hence, a “pseudo-A”survey was run with B4 to obtain data on the quality of the information about these businesses on the register.
There were some significant challenges for the people involved in running the project too – participating countrieshad built up their knowledge over some years (see section 6), but in this case a similar level of knowledge wasneeded within a much shorter time. The pilot survey was especially useful in this respect, since it introduced theconcepts required to run a full-scale survey, but with relatively small risk, and allowed the testing and refinement ofprocedures as the approaches were learnt. Special training sessions in the use of the software used in the projectwere set up to ensure that Macedonia FYR could be included fully from B4.
4. NEW REGISTRATION SYSTEMSIn two of the countries involved in the project there have been large changes in their business registration process. InBulgaria a new registration system, BULSTAT, was introduced, which obliged all existing businesses to reregister.This exercise, which aimed to clear up the administrative systems, produced several side effects• the creation date for all businesses from the administrative system was set to the date of reregistration, so that it
was not possible to find out how long businesses had existed from the administrative source;• the dead and dormant businesses did not reregister, since the process was somewhat complicated and involved
registration costs. In the case of dead businesses this was the desired effect. However, businesses which weretemporarily dormant only reregistered when their activity recommenced These appear as newly createdbusinesses on the administrative source, and have been included in the samples of the B2-B4 surveys.
In Poland, the law on registration was changed with the introduction of a new Statistical Law in 1995. This had theeffect of requiring many businesses, particularly smaller ones, to register for the first time. Thus many whichappeared as creations from the administrative sources were actually established enterprises. As in Bulgaria, this hashad the effect of increasing the proportion of creations, and this process has continued for several years, givingrecognisable lags in the registration process due to dormant businesses reactivating and registering.
Other changes to the registration systems in participating countries also caused more minor disruptions in thefigures, and it is clear that administrative system changes can have a substantial effect on survey results frombusiness registers and should be carefully considered.
5. SURVEY C: LONGITUDINAL FOLLOW-UP AND ANALYSISIn 1997 there was an additional survey (C) which followed up all previously live units. This produced informationfor the first time on the evolution of businesses, mostly over a two-year span (from A to C), although with someevidence of one-year changes from following up units surveyed in 1996 (B1 to C). This presented the opportunity tomake some preliminary estimates of the stock of businesses over three years, 1995-1997, and also to correct some ofthe earlier data for measurement error.
Some non-responding units in survey A were contacted during survey C, and this gave a considerable amount ofnew information. In order to use this, imputation in surveys A and C was undertaken simultaneously to providelongitudinal information. This meant that the longitudinal data did not necessarily exactly coincide with estimatesproduced from the original A survey, as some records were reimputed.
In the A and B1 surveys, units were classified as either active, dead, or dormant. It is however unusual forbusinesses to remain dormant for long periods – any reactivation is usually fairly quick. Thus in the C survey, unitswhich were previously dormant were permitted only to answer that they were active or dead. In a majority of thesecases, the business had not reactivated, and should be regarded as dead for the whole period of the surveys. Thisshould amendment the estimates of dead and dormant businesses, which are respectively increased and decreased.
5. 1. The weighting approachThere is a further challenge in using data from these surveys to estimate the number of active businesses, because ofthe lags in the registration process. These are illustrated in table 2 using data from Slovenia. In order to estimate the
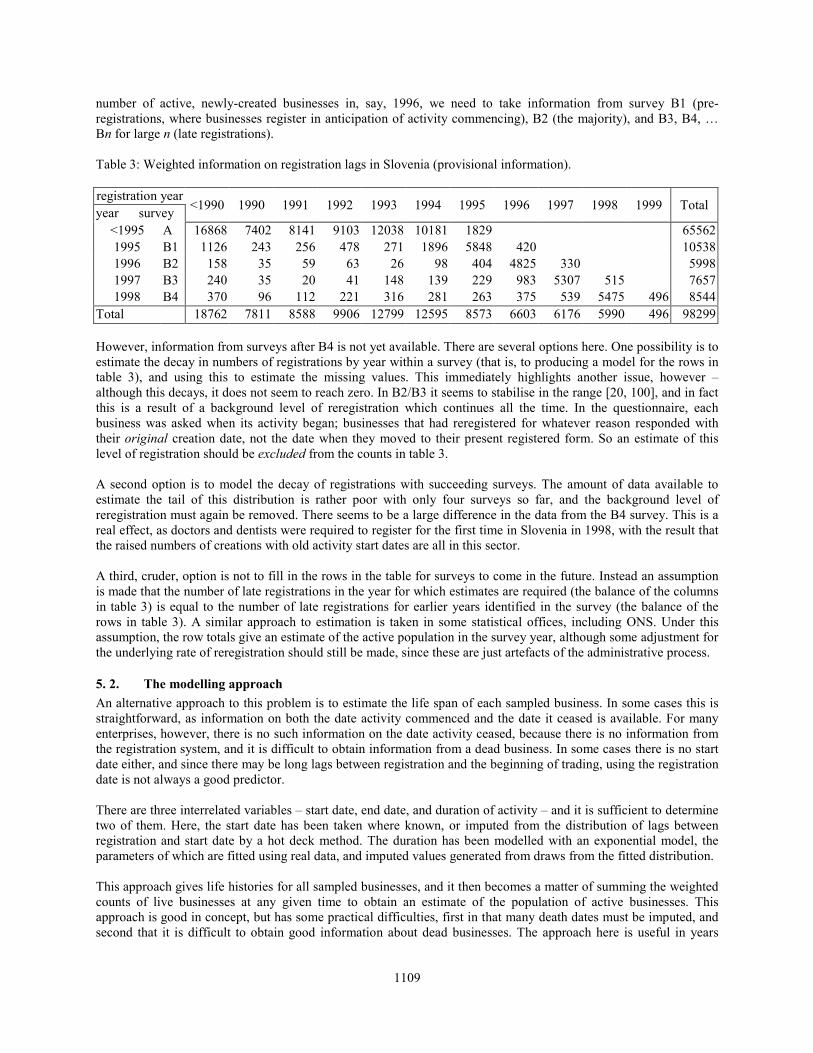
1109
number of active, newly-created businesses in, say, 1996, we need to take information from survey B1 (pre-registrations, where businesses register in anticipation of activity commencing), B2 (the majority), and B3, B4, …Bn for large n (late registrations).
Table 3: Weighted information on registration lags in Slovenia (provisional information).
registration yearyear survey <1990 1990 1991 1992 1993 1994 1995 1996 1997 1998 1999 Total
<1995 A 16868 7402 8141 9103 12038 10181 1829 655621995 B1 1126 243 256 478 271 1896 5848 420 105381996 B2 158 35 59 63 26 98 404 4825 330 59981997 B3 240 35 20 41 148 139 229 983 5307 515 76571998 B4 370 96 112 221 316 281 263 375 539 5475 496 8544
Total 18762 7811 8588 9906 12799 12595 8573 6603 6176 5990 496 98299
However, information from surveys after B4 is not yet available. There are several options here. One possibility is toestimate the decay in numbers of registrations by year within a survey (that is, to producing a model for the rows intable 3), and using this to estimate the missing values. This immediately highlights another issue, however –although this decays, it does not seem to reach zero. In B2/B3 it seems to stabilise in the range [20, 100], and in factthis is a result of a background level of reregistration which continues all the time. In the questionnaire, eachbusiness was asked when its activity began; businesses that had reregistered for whatever reason responded withtheir original creation date, not the date when they moved to their present registered form. So an estimate of thislevel of registration should be excluded from the counts in table 3.
A second option is to model the decay of registrations with succeeding surveys. The amount of data available toestimate the tail of this distribution is rather poor with only four surveys so far, and the background level ofreregistration must again be removed. There seems to be a large difference in the data from the B4 survey. This is areal effect, as doctors and dentists were required to register for the first time in Slovenia in 1998, with the result thatthe raised numbers of creations with old activity start dates are all in this sector.
A third, cruder, option is not to fill in the rows in the table for surveys to come in the future. Instead an assumptionis made that the number of late registrations in the year for which estimates are required (the balance of the columnsin table 3) is equal to the number of late registrations for earlier years identified in the survey (the balance of therows in table 3). A similar approach to estimation is taken in some statistical offices, including ONS. Under thisassumption, the row totals give an estimate of the active population in the survey year, although some adjustment forthe underlying rate of reregistration should still be made, since these are just artefacts of the administrative process.
5. 2. The modelling approachAn alternative approach to this problem is to estimate the life span of each sampled business. In some cases this isstraightforward, as information on both the date activity commenced and the date it ceased is available. For manyenterprises, however, there is no such information on the date activity ceased, because there is no information fromthe registration system, and it is difficult to obtain information from a dead business. In some cases there is no startdate either, and since there may be long lags between registration and the beginning of trading, using the registrationdate is not always a good predictor.
There are three interrelated variables – start date, end date, and duration of activity – and it is sufficient to determinetwo of them. Here, the start date has been taken where known, or imputed from the distribution of lags betweenregistration and start date by a hot deck method. The duration has been modelled with an exponential model, theparameters of which are fitted using real data, and imputed values generated from draws from the fitted distribution.
This approach gives life histories for all sampled businesses, and it then becomes a matter of summing the weightedcounts of live businesses at any given time to obtain an estimate of the population of active businesses. Thisapproach is good in concept, but has some practical difficulties, first in that many death dates must be imputed, andsecond that it is difficult to obtain good information about dead businesses. The approach here is useful in years

1110
where the population is well-covered, but in intervening years requires some correction for businesses which saythey are dormant, but later turn out to have ceased trading (as discussed at the beginning of this section).
6. ACHIEVEMENTSThe aims of the pilot projects under the PHARE program are to transfer knowledge and expertise to the statisticalinstitutes of the CEC’s to help them continue the process of economic measurement during the transition from acentrally-managed to a market-led economy. The early surveys were very centrally based, with programs forsampling and imputation created and operated from Infostat, and with central database management andadministration also undertaken by Infostat. The early surveys, however, presented an opportunity for the statisticalinstitutes to set up an appropriate field survey system, and to begin to use their business registers as a base fromwhich to undertake surveys.
Training in both the principles and software for imputation were provided, and this was moved from a centralprocess to one undertaken by the participating countries under guidance, and for surveys B3 and B4 has been donein countries own offices, with just some quality checking from the centre. This was the first of the survey processesto be “devolved” to the participants.
More recently some publication work has begun to involve the participating countries. Since the inception of theproject, participants have been allowed to produce their own publications from the survey (once a certain time hasbeen allowed for production of the central publications), and several countries have done so. Poland is producing apublication for the five first stage EU accession countries (Czech Republic, Estonia, Hungary, Poland and Slovenia).
Perhaps the biggest achievement for the project has been to run a survey in twelve countries with standard andagreed definitions, a common questionnaire and common processing, to give a set of results that can be interpretedconsistently, although local conditions have given rise to lots of interesting differences and anomalies in the dataseries. Nevertheless such a consistent survey is rare, particularly in enterprise surveys. One of the main reasons whythis was possible is that the systems for sample surveys in the participating countries were not well-developed, butthis has nevertheless shown what can be achieved by the co-operation of participants in a common project.
Further training was included in this project in the uses of business registers in statistical offices, and this three-dayseminar was unusual in that it included register specialists, survey managers and national accountants from theparticipating countries. Communication between these areas is vitally important to ensure that the estimates fromsample surveys are both valid and suited to their purpose – a point that is too often missed in some NSIs!
A major challenge was the multinational nature of the project. Project meetings were held every six months, initiallyorganised by Infostat to co-ordinate also with training, but later by the participating countries. All discussion anddocuments were initially in French and English but later only in English. The willingness of participants to use acommon language has ensured the success of the project. Communication between meetings is now by email andthrough a web site : www.infostat.sk/DOSME. All documentation is also being organised on a CDROM.
7. PUBLICATIONS OF THE PECO/DoSME PROJECTSEnterprises in Central and Eastern Europe (Eurostat 1996)New enterprises in Central and Eastern Europe in 1995 (Eurostat 1997)New enterprises in Central and Eastern Europe in 1996 (Eurostat 1999)Development of enterprises in Central European countries 1995-1997 (Eurostat 1999)New enterprises in CEC in 1997 (Eurostat 1999)New enterprises in CEC in 1998 (Eurostat – due Autumn 2000)Enterprises created in 1995 – 1997 in five countries of the first pre-accession group (Eurostat/Poland – due Autumn2000)
8. ACKNOWLEDGEMENTSThe work described in this paper is a joint effort of a team of people composed of members of the statistical officesof the participating countries, Infostat, Eurostat, and specialists from various EU countries who have contributed tothe smooth running of a complex survey; thanks to all of them – without their dedication none of this would havebeen possible. The work has been funded under the European Union’s PHARE program.