Embed Size (px)
Citation preview

Register entries/exits and demographic flows: some comparisons
for statistical aggregates
Caterina Viviano
18th Roundtable
Beijing, China October 2004
ISTAT
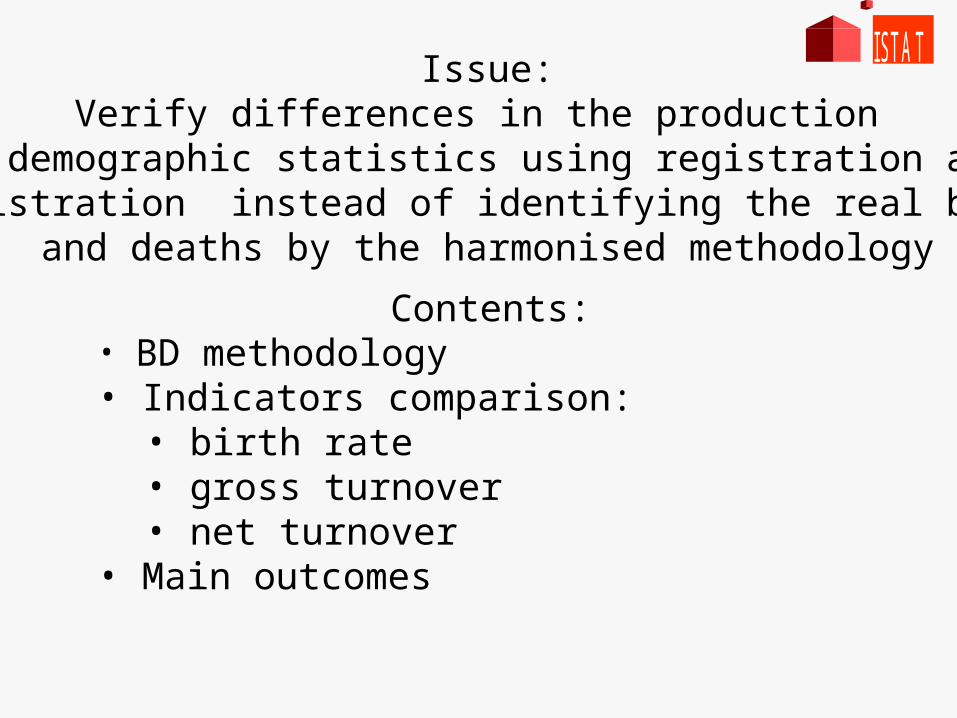
Issue:Verify differences in the production
of demographic statistics using registration and deregistration instead of identifying the real births
and deaths by the harmonised methodology
Contents:• BD methodology• Indicators comparison:
• birth rate• gross turnover• net turnover
• Main outcomes
ISTAT
Eurostat BD project aims to harmonise methodology to obtain comparable statistics
BD methodology is already operative in participating EU countries Developed internal procedures are costly and complex
ISTAT
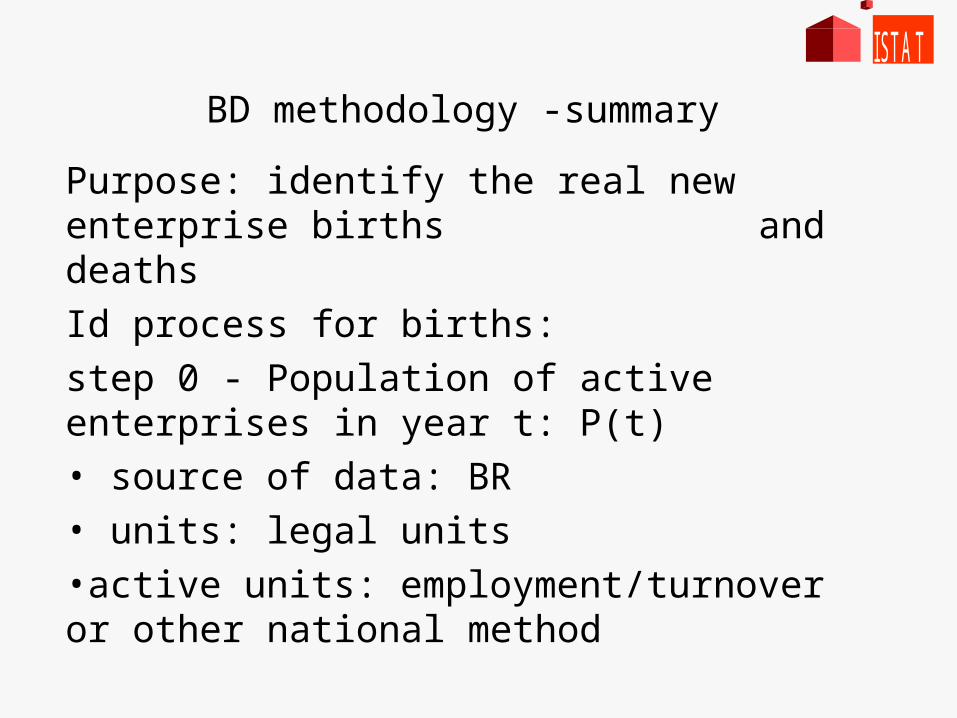
BD methodology -summary
Purpose: identify the real new enterprise births and deaths
Id process for births:
step 0 - Population of active enterprises in year t: P(t)• source of data: BR• units: legal units•active units: employment/turnover or other national method
ISTAT
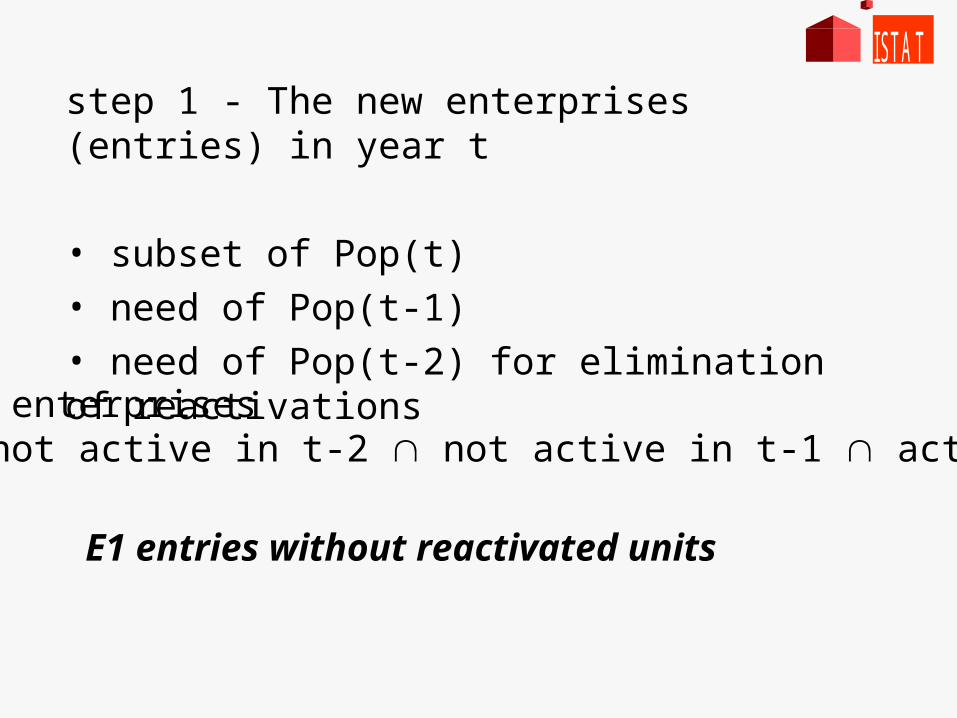
step 1 - The new enterprises (entries) in year t
• subset of Pop(t)• need of Pop(t-1) • need of Pop(t-2) for elimination of reactivations
E1 = new enterprises= units not active in t-2 not active in t-1 active in t
E1 entries without reactivated units
ISTAT

step 2 - Other creations: events of structural changes (merger, demerger, take-off, split-off)• need of updating information through administrative data and manual profiling activities
E2 = E1 - Eev
E2 entries without reactivated units and without events
ISTAT
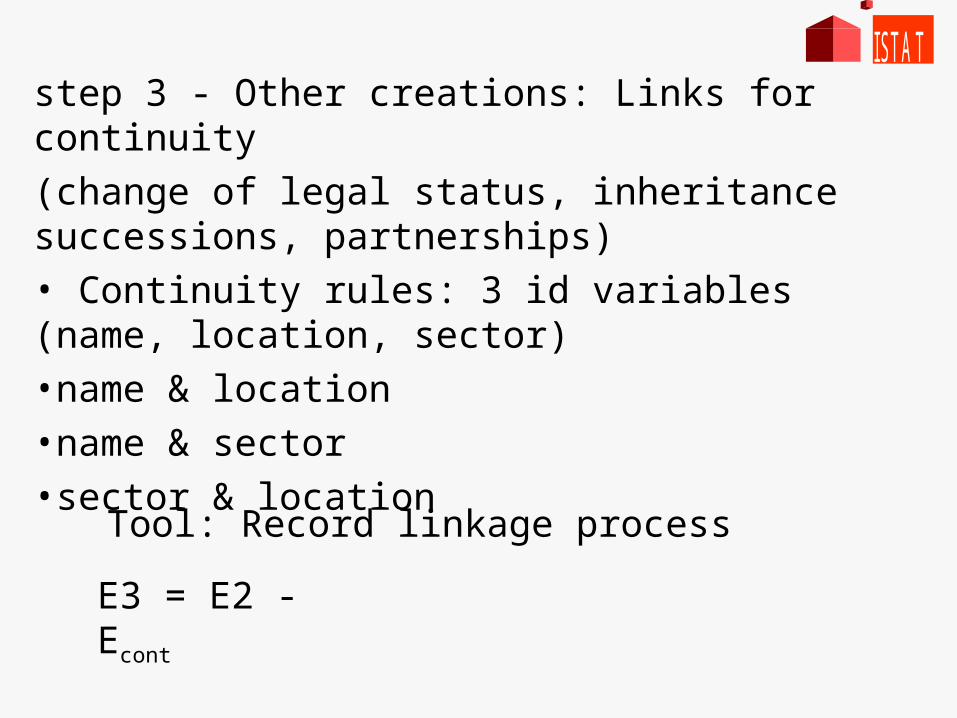
step 3 - Other creations: Links for continuity
(change of legal status, inheritance successions, partnerships)• Continuity rules: 3 id variables (name, location, sector)•name & location•name & sector•sector & location
Tool: Record linkage process
E3 = E2 - Econt
ISTAT
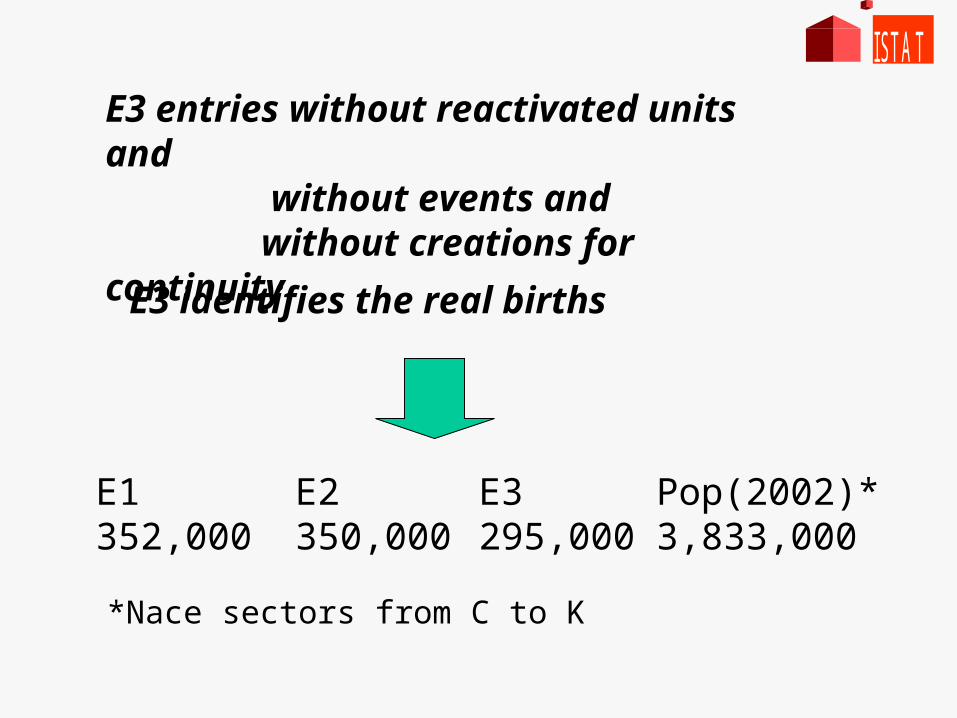
E3 entries without reactivated units and without events and without creations for continuity
E3 identifies the real births
E1352,000
E2350,000
E3295,000
Pop(2002)*3,833,000
*Nace sectors from C to K
ISTAT
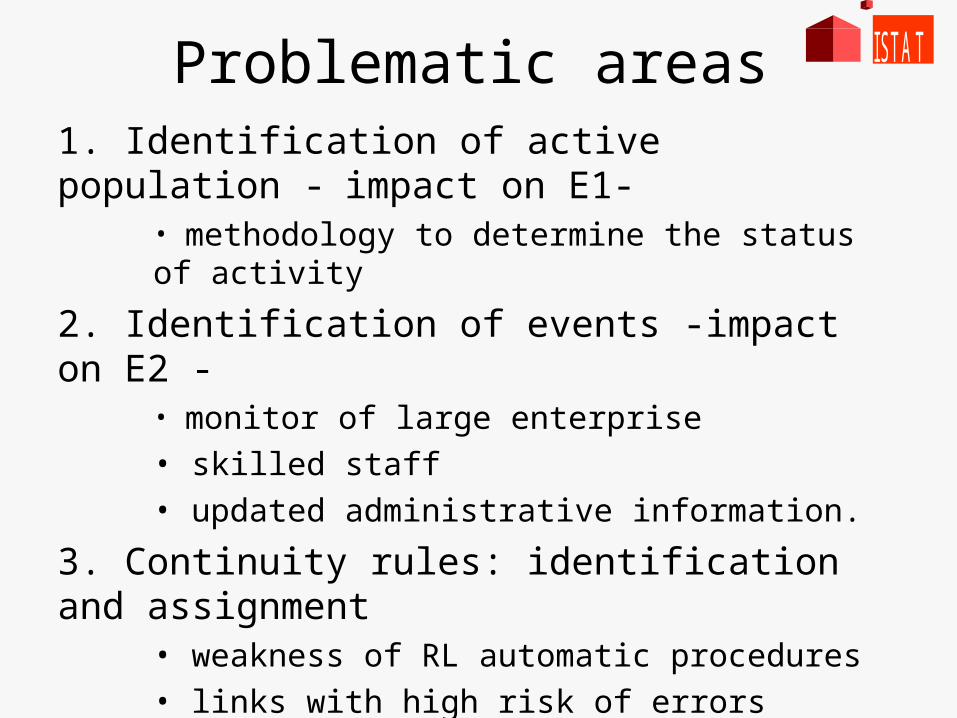
Problematic areas1. Identification of active population - impact on E1-
• methodology to determine the status of activity
2. Identification of events -impact on E2 -• monitor of large enterprise
• skilled staff
• updated administrative information.
3. Continuity rules: identification and assignment • weakness of RL automatic procedures
• links with high risk of errors
• continuity concepts limitations
ISTAT

Analysis of some demographic indicators
ISTAT
Indicators calculated on the basis of the three subset of data E1, E2 and E3

BOX-plot 1: Enterprise birth rates (%) for economic activity, year 2002
4.96.57.7
10.8
14.4
4.96.47.7
10.8
14.3
3.85.06.1
9.3
12.0
3.8
5.8
7.8
9.8
11.8
13.8
15.8
17.8
E1 E2 E3
Enterprise birth rate = %PopjE where j=1,2,3
ISTAT
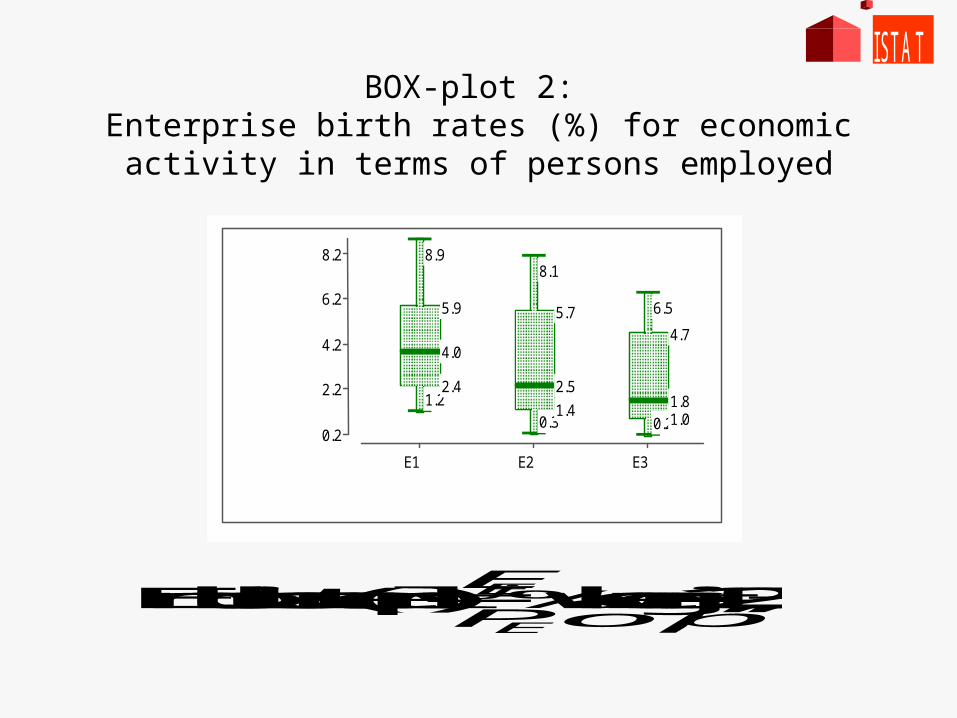
BOX-plot 2: Enterprise birth rates (%) for economic activity in terms of
persons employed
1.22.4
4.0
5.9
8.9
0.31.4
2.5
5.7
8.1
0.21.01.8
4.7
6.5
0.2
2.2
4.2
6.2
8.2
E1 E2 E3
Ent. birth rate (empl.) = %E
jE
Pop
E where j=1,2,3
ISTAT
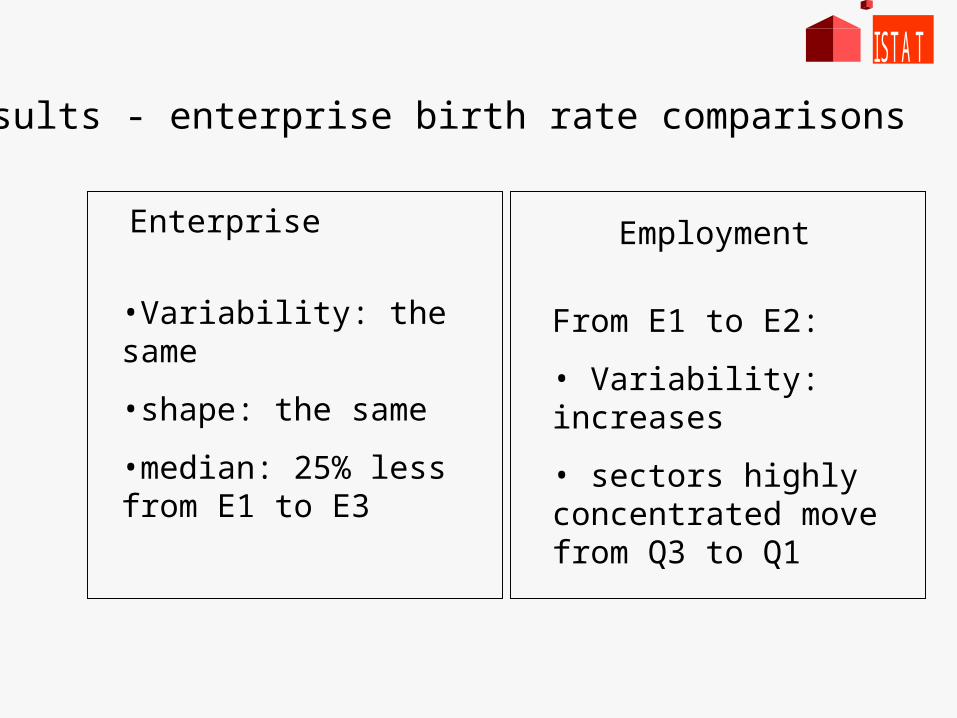
Results - enterprise birth rate comparisons
Enterprise
•Variability: the same
•shape: the same
•median: 25% less from E1 to E3
Employment
From E1 to E2:
• Variability: increases
• sectors highly concentrated move from Q3 to Q1
ISTAT
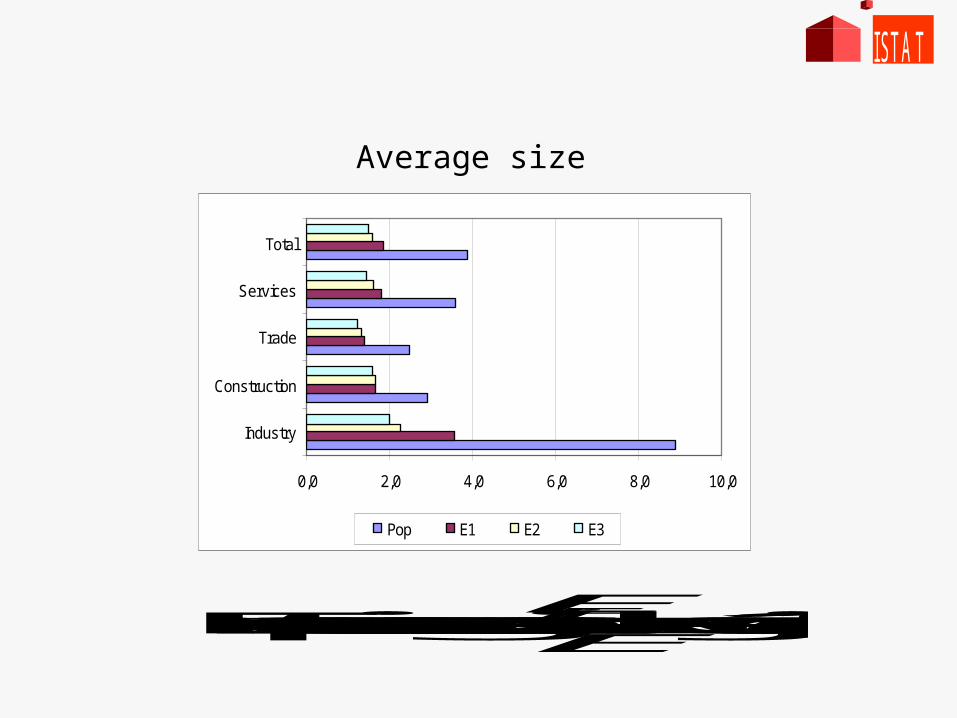
0,0 2,0 4,0 6,0 8,0 10,0
Industry
Construction
Trade
Services
Total
Pop E1 E2 E3
Average size
Enterprise average size = E
EjE where j=1,2,3
ISTAT
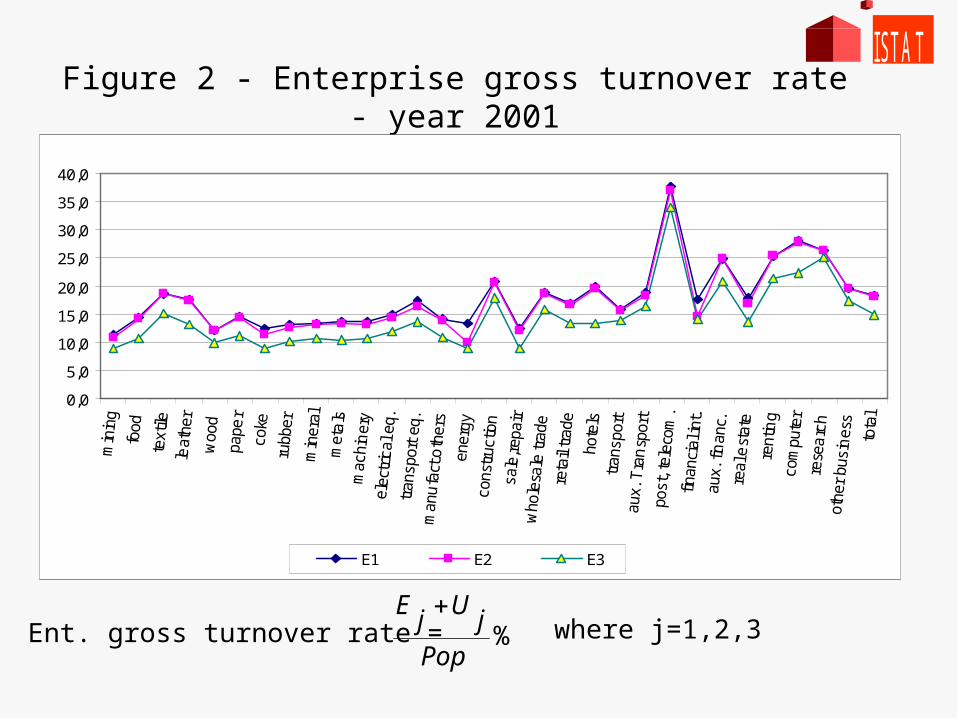
Figure 2 - Enterprise gross turnover rate - year 2001
0,0
5,0
10,0
15,0
20,0
25,0
30,0
35,0
40,0
E1 E2 E3
Ent. gross turnover rate = %Pop
jU
jE
where j=1,2,3
ISTAT
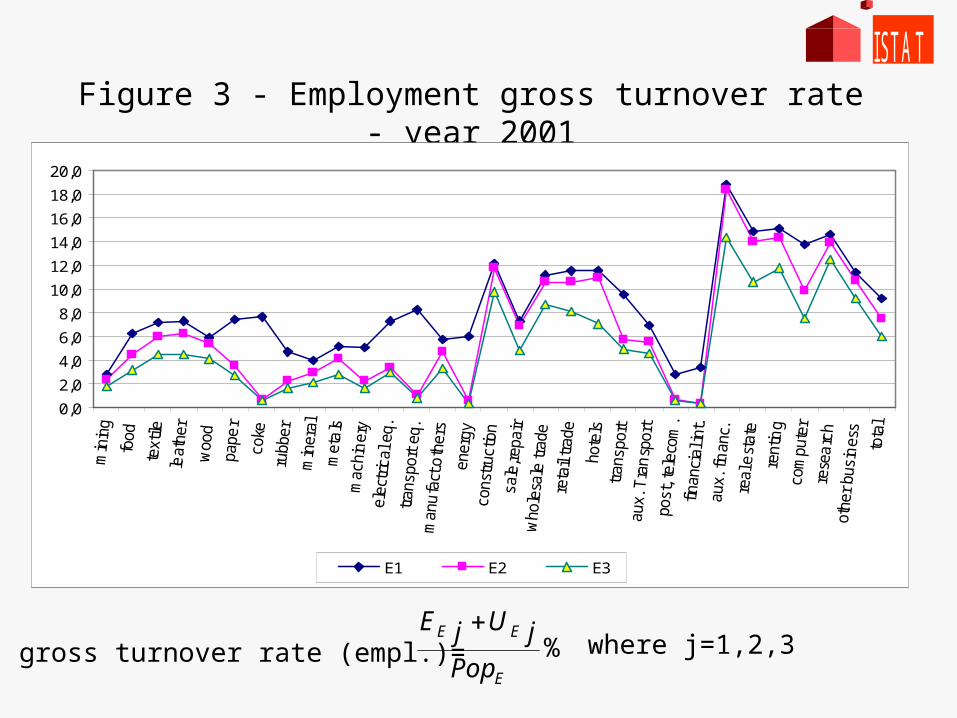
Figure 3 - Employment gross turnover rate - year 2001
0,0
2,0
4,0
6,0
8,0
10,0
12,0
14,0
16,0
18,0
20,0
E1 E2 E3
gross turnover rate (empl.)= %E
EE
PopjUjE
where j=1,2,3
ISTAT
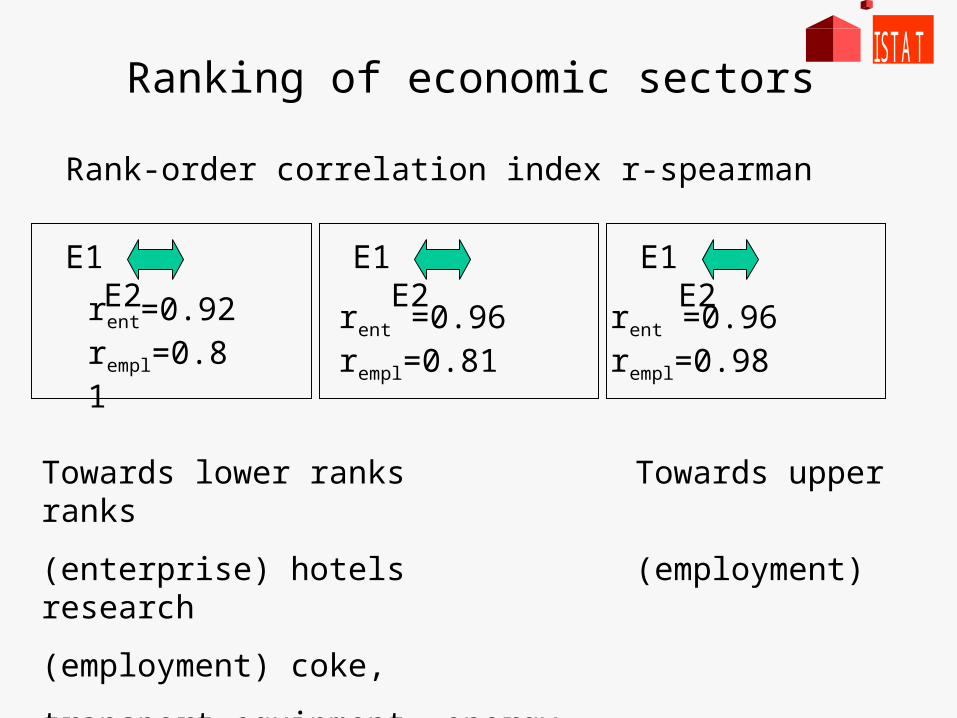
Ranking of economic sectors
E1 E2
rent=0.92rempl=0.81
E1 E2 E1 E2
rent =0.96rempl=0.81
rent =0.96rempl=0.98
Rank-order correlation index r-spearman
Towards lower ranks Towards upper ranks
(enterprise) hotels (employment) research
(employment) coke,
transport equipment, energy
ISTAT
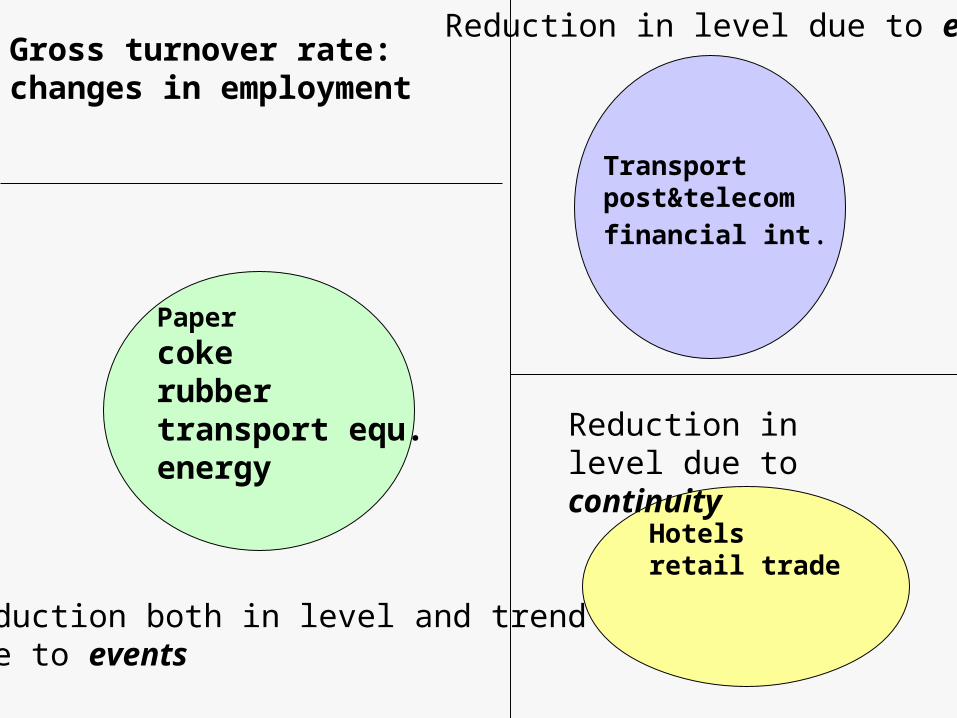
Papercokerubbertransport equ.energy
Transportpost&telecomfinancial int.
Hotelsretail trade
Gross turnover rate:changes in employment
Reduction both in level and trenddue to events
Reduction in level due to events
Reduction in level due to continuity
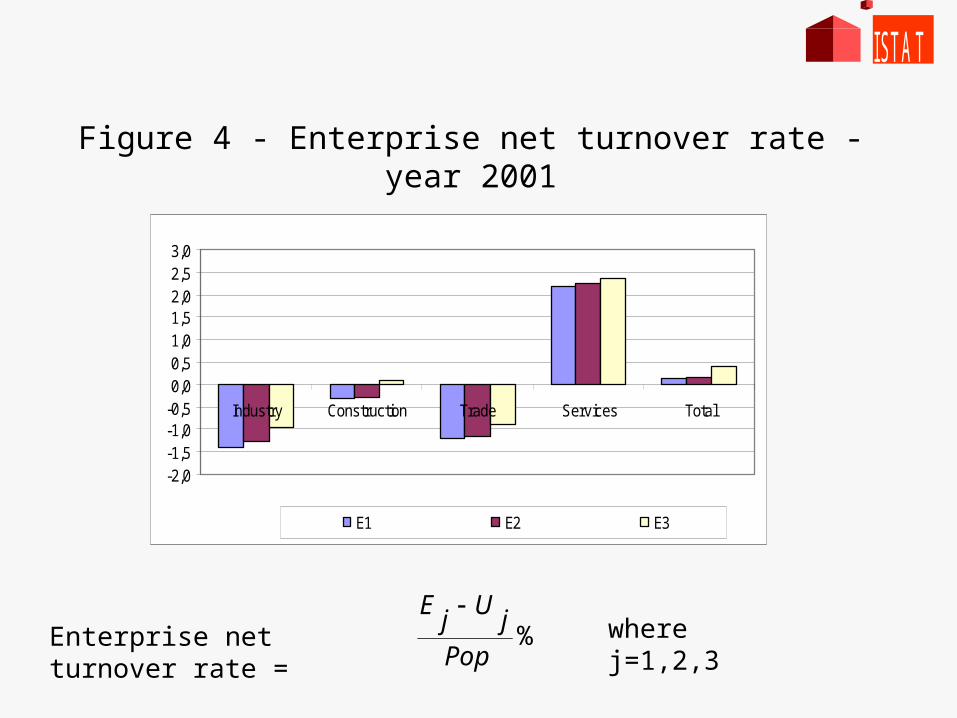
Figure 4 - Enterprise net turnover rate - year 2001
-2,0-1,5-1,0-0,50,00,51,01,52,02,53,0
Industry Construction Trade Services Total
E1 E2 E3
%Pop
jU
jE
where j=1,2,3
Enterprise net turnover rate =
ISTAT
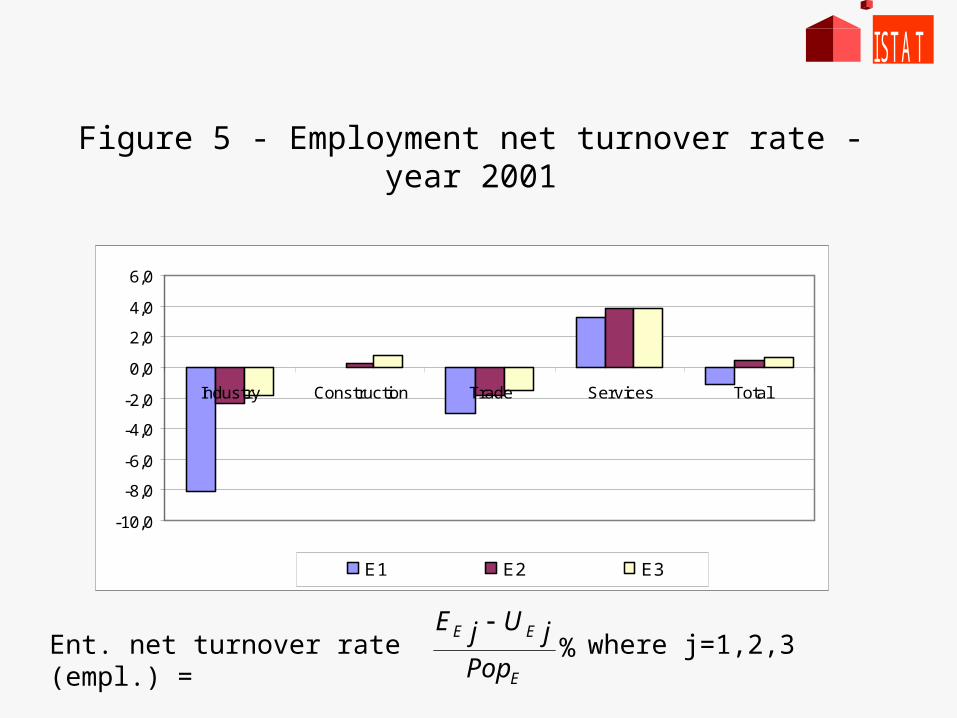
Figure 5 - Employment net turnover rate - year 2001
-10,0
-8,0
-6,0
-4,0
-2,0
0,0
2,0
4,0
6,0
Industry Construction Trade Services Total
E1 E2 E3
Ent. net turnover rate (empl.) =
%E
EE
PopjUjE
where j=1,2,3
ISTAT
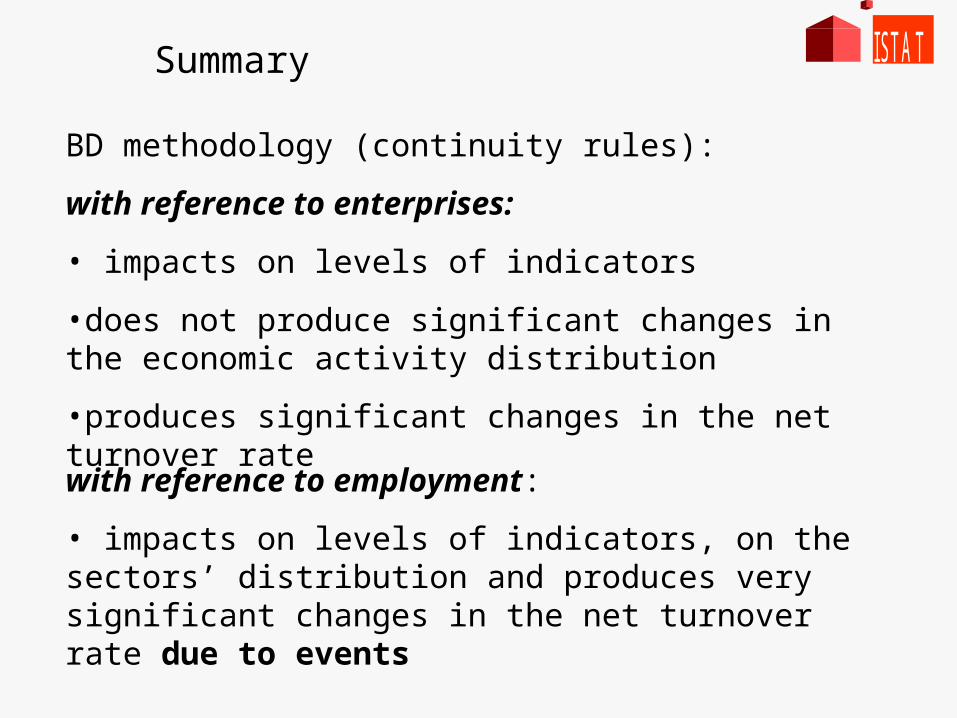
Summary
BD methodology (continuity rules):
with reference to enterprises:
• impacts on levels of indicators
•does not produce significant changes in the economic activity distribution
•produces significant changes in the net turnover rate
with reference to employment:
• impacts on levels of indicators, on the sectors’ distribution and produces very significant changes in the net turnover rate due to events
ISTAT
Results demonstrate the importance to concentrate efforts in the identification of mergers and
demergers
the necessity of
•more updated information on events •to increase the manual controls activities above all in presence of a large birth or death.
ISTAT
Conclusion