Embed Size (px)
Citation preview
57
Revista de Economía Aplicada Número 54 (vol. XVIII), 2010, págs. 57 a 78EA
A DEMAND-SUPPLY ANALYSISOF THE SPANISH EDUCATION
WAGE PREMIUM*
MANUEL A. HIDALGOUniversidad Pablo de Olavide
This paper estimates education demand for Spain in order to analyzewhether variations of the education wage premium between the 1980sand 1990s can be explained within the framework of a supply and de-mand model. The evidence reveals a stable pattern of growth in the de-mand for education throughout the eighties and nineties, empiricallyshowing that differences in the evolution of the education wage premiumduring the two decades can be explained by varying growth in educationsupply coupled with stable growth in education demand.
Key words: education wage premium, demand for education, labor supply.
JEL Classification: J24, J31, O33.
Recent decades have seen substantial heterogeneity in the evolution of theeducation wage premium, both across countries and over time [Katz, Love-man and Blanchflower (1995); Gottschalk and Smeeding (1997); Gottschalkand Joyce (1998); Acemoglu (2003)]. A natural starting point for the analy-sis of these differences is the demand-supply framework (D&S). The purpo-
se of the D&S framework is to examine whether the evolution of the educationwage premium can be approximated by supply-driven movements along a labor de-mand curve with a stable slope, plus shifts in labor demand. The results have beenquite encouraging in a variety of contexts. Katz and Murphy (1992), for example,conclude that the education wage premium in the U.S. between 1963 and 1987 canbe explained by steady, secular shifts in the demand for educated workers combinedwith observed changes in relative supply. Katz, Loveman, and Blanchflower (1995)show that the D&S framework is also useful for understanding the evolution of thewage premium in four OECD countries (the U.S., the U.K., Japan and France).
(*) I am grateful to seminar participants of the VI Workshop on International Economics organizedat the University of Malaga (Department of Theory and Economic History) and also to seminar par-ticipants at the University of Pablo de Olavide (Department of Economics) for very useful com-ments. I especially thank Antonio Ciccone, José Ignacio García, Jesus Rodriguez, Carmen Mª Rubioand an anonymous referee for very useful suggestions. I gratefully acknowledge support of projectECOD 1.07/085 (Ensayos sobre Andalucía y Nueva Economía) and the SEJ2006-04803/ECON(Efectos de las políticas fiscales y sociolaborales sobre el crecimiento).

Card, Kramarz, and Lemieux (1999) incorporate wage-setting institutions in a D&Sframework and show that this helps to explain relative wage trends among less-skilledworkers in the U.S., Canada and France in the 1980s. Acemoglu (2003) finds thatthe D&S with steady, secular shifts in the demand for educated workers can accountfor the differences in the evolution of wage inequality between Finland and Norway.
While the Spanish education wage premium has been studied quite intensi-vely1, the literature has not yet explored whether its evolution over time may fitwithin the D&S framework. The goal of this study is to ascertain whether theD&S framework can help explain the evolution of the education wage premium inSpain during the two decades between 1980 and 2000. The main finding is thatthe evolution of the premium during these two decades can be well approximatedby combining the observed changes in labor supply with steady growth in the de-mand for education during the period 1980-2000. Interestingly, our estimates ofthe slope of the Spanish demand curve for education and education demandgrowth are quite similar to U.S. estimates.
One of the key elements of the D&S framework is the slope of the demandcurve for education (which, in the standard D&S framework, is the inverse of theelasticity of substitution between more and less educated workers). The main diffi-culty faced when estimating this slope is that education supply and the educationwage premium are determined simultaneously by demand and supply. Estimationtherefore requires solving the standard identification problem (see Hamermesh,1993, for a summary of this problem in the context of labor demand estimation).The empirical literature on the demand curve for education stretches back to the1970s. Johnson (1970) estimates the elasticity of substitution between more andless educated workers to be 1.34 for a cross section of U.S. states in 1960. Cicconeand Peri (2005), using a panel of US states for the 1950-1990 period, and emplo-ying Acemoglu and Angrist’s (2001) state-time-dependent child labor and compul-sory school attendance laws as instruments for changes in the supply of education,find an elasticity of substitution of about 1.5. Angrist (1995) finds an elasticity ofsubstitution of about 2 for data on Palestinian workers in the West Bank and theGaza Strip during the 1980s; he uses the number of local higher-education institu-tions as an instrument for education supply. Fallon and Layard (1975), using cross-country data and employing income per capita as their instrument for educationsupply, obtain an estimate of 1.49 for the elasticity of substitution between moreand less educated workers. Caselli and Coleman (2000) apply a D&S frameworkwith endogenous technology to cross-country data and obtain an elasticity of subs-titution of 1.31. Katz and Murphy (1992) derive an elasticity of substitution ofabout 1.4 from U.S. time-series data for 1963-1987.
This paper uses the approach developed by Katz and Murphy to estimate theelasticity of substitution in a panel of Spanish regions, employing the beginning-of-period population structure as our instrument for education supply. The resul-ting estimate of the elasticity of substitution between more and less educated wor-kers in Spain is close to the estimates reported by Katz and Murphy and Cicconeand Peri for the United States.
Revista de Economía Aplicada
58
(1) See Abadíe (1997), Arellano, Bentolila and Bover (2001), Torres (2002) and Martinez-Ros (2001).

Our estimate of the slope of the Spanish demand curve for education for the1980-2000 period allows us to examine the degree to which the D&S frameworkcan be used to explain the evolution of the Spanish education wage premium duringthe period. Our chief empirical finding is that the evolution of the education wagepremium as predicted by the framework fits quite closely with its actual evolution.For example, our estimates imply a fall in the relative wage of more educated wor-kers during the 1980s of 1.45% and 0.93% in the 1990s, which comes close to theactual 1.52% drop in relative wages in the 1980s and the 0.92% decrease in the1990s. Interestingly, we find similar annual growth rates for relative education de-mand in Spain (labor demand shifts) during the 1980s and the 1990s (2.7%). Theseestimates come close to estimates for the United States: for example, Katz andMurphy (1992) estimate the relative U.S. demand shifts to be about 3.3% per year,while Acemoglu (2002) reports an increase of about 2.5% annually.
One explanation for cross-country differences in the evolution of wage ine-quality, especially in Europe, is that wage-setting institutions differ by country[Acemoglu (2003); Card, Kramarz and Lemieux (1999); Abraham and Houseman(1993)]. Arguably, the most important institution for the Spanish case is collectivewage bargaining; however, taking this into account does not affect our conclusionthat the D&S framework is able to capture the evolution of the Spanish educationwage premium.
The rest of the paper is structured as follows. Section 1 explains the Demandand Supply framework; Section 2 explains the data used and the measurement ofrelative wages and education supply; Section 3 presents the estimation and re-sults; Section 4 evaluates the possible effects of collective bargaining on relativedemand estimates; and Section 5 concludes.
1. THE DEMAND AND SUPPLY FRAMEWORK
According to the demand and supply framework, the wage of more relativeto less educated workers (the education wage premium) is determined by educa-tion demand and supply. The simplest model of relative demand is based on theconstant elasticity of substitution (CES) firm-level production function (see, forexample, Katz and Murphy, 1992). The model assumes that firms f have access tothe following production function:
A demand-supply analysis of the Spanish education wage premium
59
Y A L B Hf f= + ρ ρ ρ
1
[1]
where Y is output, H is the input of more educated (skilled) workers, and L the inputof less educated (unskilled) workers. Af and Bf denote the levels of factor-augmen-ting technology to which firms have access. It is straightforward to show that theproduction function parameter ρ determines the elasticity of substitution betweenfactors σ. In particular, σ = 1/(1 – ρ), which implies that ρ ≤ 1 is necessary for theisoquants to be convex and the education demand curve to be well-defined. Thecase ρ = 1 corresponds to the case where the two types of labor are perfect substi-tutes, while ρ → -∞ implies that there is no substitutability at all between moreand less educated workers).

Firms are assumed to take wages in the labor market as given when makingtheir hiring decisions. Firms’ demand for education, the demand for more relativeto less educated workers H/L, can be obtained from their first-order conditions forprofit-maximization as
Revista de Economía Aplicada
60
H
L
B
A
w
wD
f
f
H
L
=
−σ σ
,
where we have used that σ = 1/(1 – ρ).The D&S framework can be applied to the regional level by assuming that
firms in region i have levels of factor-augmenting technology Af = Ai and Bf = Bi.A region’s equilibrium education wage premium can now be determined by equa-ting education demand with education supply H/LSi in region i and solving for therelative wage for educated workers,
w
w
B
A
H
L
H
L
i i Si
=
− 1σ
.
Taking logs on both sides yields
ωσi i Sib h= −1
; [2]
where ωi = Ln(wH / wL), b = Ln (B/A) and h = Ln (H/L). Taking differences overtime (denoted by ∆) yields.
∆ ∆ ∆ωσit it iStb h= −1
. [3]
Hence, log changes in the education wage premium, ∆wit, are equal to shiftsin education demand, ∆bit, plus supply-driven movements along the education de-mand curve, . The strength of the effect of supply changes on the wagepremium depends on the slope of the inverse education demand curve, 1/σ, whichis equal to the inverse of the elasticity of substitution between more and less edu-cated workers. When the elasticity of substitution is high, supply changes willhave small effects on the education wage premium (the inverse demand curve isflat). As the elasticity of substitution between more and less educated workersfalls, the sensitivity of the education wage premium to changes in educationsupply increases. Figure 1 provides a graphic illustration of the relative wage ef-fects of demand shifts and supply-driven movements along the demand curve. Anincrease in the relative supply, from h to h’, moves the equilibrium point along thedownward-sloping inverse demand curve (A to B) and reduces the educationwage premium. An increase in the relative demand for educated workers movesthe equilibrium point to C and increases the education wage premium. Whenthere are demand and supply shifts, the equilibrium rests at point D; in this case,the behavior of the education wage premium depends on which shift prevails.
− 1σ ∆hiSt
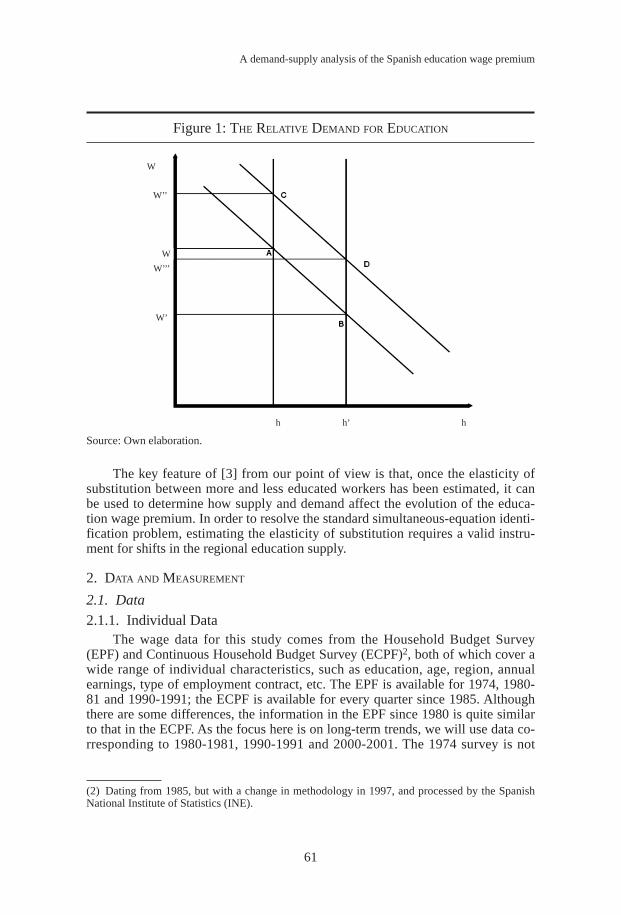
The key feature of [3] from our point of view is that, once the elasticity ofsubstitution between more and less educated workers has been estimated, it canbe used to determine how supply and demand affect the evolution of the educa-tion wage premium. In order to resolve the standard simultaneous-equation identi-fication problem, estimating the elasticity of substitution requires a valid instru-ment for shifts in the regional education supply.
2. DATA AND MEASUREMENT
2.1. Data
2.1.1. Individual DataThe wage data for this study comes from the Household Budget Survey
(EPF) and Continuous Household Budget Survey (ECPF)2, both of which cover awide range of individual characteristics, such as education, age, region, annualearnings, type of employment contract, etc. The EPF is available for 1974, 1980-81 and 1990-1991; the ECPF is available for every quarter since 1985. Althoughthere are some differences, the information in the EPF since 1980 is quite similarto that in the ECPF. As the focus here is on long-term trends, we will use data co-rresponding to 1980-1981, 1990-1991 and 2000-2001. The 1974 survey is not
A demand-supply analysis of the Spanish education wage premium
61
Figure 1: THE RELATIVE DEMAND FOR EDUCATION
(2) Dating from 1985, but with a change in methodology in 1997, and processed by the SpanishNational Institute of Statistics (INE).
Source: Own elaboration.
W
W’’
W’’’
W’
W
h h’ h

considered because it provides no usable education data. Other sources of wagedata either lack needed individual data or cover only short periods. An additionaladvantage of the EPF is that the methodology used to compile this data has remai-ned relatively stable since 1980.
Revista de Economía Aplicada
62
Table 1: SCHOOLING GROUPS EQUIVALENCE. INDIVIDUAL AND AGGREGATE DATA
EPF 81 EPF 91 ECPF 01 SS07 Yearssurvey survey survey survey ofgroups groups groups groups schooling
Illiterate-Primary 1,2,3 1,2,3,4 1,2 1,2 0-6Basic secondary andbasic vocational 4 5,7 3 3,5 10,12Advanced secondary andadvanced vocational 5,6 6,7,8 4,5 4,6 12,14College (short cycle) 7 9 6 7 15College (long cycle) 8 10 7 8 17
Note: EPF survey: Encuesta de Presupuestos Familiares.ECPF survey: Encuesta Continua de Presupuestos Familiares.SS07 data and years of schooling from Serrano and Soler (2007).Definition of the schooling groups:Groups EPF 81: 1 - Illiterate, 2 - No certificate (of Primary studies), 3 - Primary, 4 - Basic secondary,5 - Advanced secondary, 6 - Vocational training, 7 - College (short cycle), 8 - College (long cycle).Groups EPF 91: 1 - Illiterate, 2 - No certificate, 3 - Basic Primary, 4 - Advanced primary, 5 - Basicsecondary, 6 - Advanced secondary, 7 - Basic vocational training, 8 - Advanced vocational training,9 - College (short cycle), 10 - College (long cycle).Groups ACP F01: 1 - Illiterate, no certificate, 2 - Primary, 3 - Basic secondary and basic vocationaltraining, 4 - Advanced secondary and advanced vocational training, 5 - Other advanced secondarystudies, 6 - College (short cycle), 7 - College (long cycle).
Source: EPF Survey, ECPF Survey and Structural Wage Survey, Spanish National Statistics Institute.
We will focus on heads of households aged 20 to 65 who work full time andare not self-employed3. This provides us with a sample size of 11,402 workers for1980/81; 8,838 for 1990/91 and 3,751 for 2000/01.
Our schooling data refers to the highest of the possible degrees attainedupon the subject’s completion of primary school, basic and advanced secondaryand vocational school and college (short and long cycle). Table 1 gives the dif-ferent education levels considered in the 1980-1981 and 1990-1991 EPF andthe 2000-2001 ECPF and the same data aggregated into 5 homogeneous groups.
(3) Further details of the rationale for this selection, together with a description of the processingof the main data including wages, are given in Appendix A.

We use this information to assign years of schooling to each of the individualsin our sample4.
A demand-supply analysis of the Spanish education wage premium
63
(4) Serrano and Soler (2007) is used to assign these years.
Table 2: AVERAGE WAGES BY SCHOOLING GROUPS (IN PESETAS, 1980-2001)
1980/81 1990/91 2000/01
Primary or less size 8,104 5,872 2,135wage 617,374 1,252,468 1,934,716% women 5.2 7.5 8.6
Secondary size 2,182 1,653 736wage 841,026 1,679,672 2,409,868% women 8.4 10.0 14.9
College size 1,116 1,313 880wage 1,109,756 2,178,330 2,947,811% women 11.4 16.8 21.5
All size 11,402 8,838 3,751wage 708,367 1,469,914 2,265,624% women 6.4 9.3 12.9
Source: Household Budget Survey (EPF) and Continuous Household Budget Survey (ECPF).
Table 2 shows some descriptive statistics for the sample taken for each yearand level of education. For the sake of simplicity, the level of education was ag-gregated into three groups, primary or less, secondary and college, using the sameaggregation criterion as that described in Table 1. The data shown are the samplesize for each year and education group, average wages and the percentage ofwomen in the sample.
Here, we must mention one very important final point that affects the ade-quacy of the data. The fact that the surveys covered only heads of householdsmeans that women are under-represented in the sample. As the table shows, thepercentage of women among the total number of workers selected is 6.4% in1980/81, 9.3% in 1990/91 and 12.9% in 2000/01. These figures are far below tho-se yielded by labor-market surveys. For instance, according to the EconomicallyActive Population Survey, published by INE (the Spanish National Institute ofStatistics), women accounted for 27.9% of the total Spanish labor force between1980 and 1981, 31.6% between 1990 and 1991 and 36.9% between 2000 and2001, which, as will be explained later, will force us to seek a solution to the pos-sible bias that may result from this under-representation.

2.1.2. Aggregate Supply DataOur data on the aggregate supply of schooling comes from Instituto Valen-
ciano de Investigaciones Económicas (IVIE) and Bancaja surveys (Serrano andSoler, 2007). The schooling data refers to employed workers in 17 Spanish re-gions from 1964 to 2007. The categories are:
1) Illiterate2) No schooling or primary schooling only3) Basic secondary4) Advanced secondary5) Basic vocational6) Advanced vocational7) Previous to college and short cycle college degree8) Long cycle college degreeLess educated workers are defined as belonging to either the first, the second
or the third group in Table 1. That is, workers with fewer than 14 years of schoo-ling are considered to be less educated, while those with a college education aredefined as more educated. These definitions are made for the purpose of compari-son with other analyses for the U.S., U.K. and other countries5.
2.2. InstrumentsOur approach uses the beginning-of-period population structure as an instru-
ment for analyzing regional changes in schooling supply. The required populationdata were drawn from the 1981 and 1991 Spanish Population Censuses providedby the National Statistics Institute.
3. MEASUREMENT AND DESCRIPTIVE STATISTICS
3.1. Education Wage PremiumWages depend not only on schooling but on many other individual characte-
ristics. To isolate the role of schooling, two approaches might be used. One coulduse all of the available individual characteristics to build a narrow definition ofworker cohorts, then calculate the education wage premium as the wage of one na-rrowly-defined cohort relative to another, less-educated cohort that is very similarto the first in all other dimensions. However, this strategy requires many observa-tions. We therefore focus on a second strategy based on Mincer wage regressions[Mincer (1974)]. Using j for individuals, t for years, and i for regions, we estimate
Revista de Economía Aplicada
64
(5) Acemoglu (2002) defines this classification for the US. However, he considers this a simplifi-cation in a context in which there is a continuum of imperfectly substitutable skills.
ln( ) ( )w S E E Xitj
it it tj
it tj
it tj
it tj= + + + + +α β γ γ µ ε1 2 2
ttj . [4]

The left-hand side is the log of individual wages and the right-hand side con-tains a list of explanatory variables: years of schooling (Sj
t), years of experience(Ej
t), and other k variables (represented by the k � 1 vector (Xjt) such as marital
status, employment sector (agriculture worker) and gender. As usual, experienceis calculated as age minus years of schooling minus six. The key parameter is βit,that is, the percentage increase in wages (the return) from one year of schooling inany given region/year. Once we have estimated this return, we obtain the log edu-cation premium of workers with SH years of schooling relative to workers with SL
years of schooling in region i for year t by multiplying the difference in years ofschooling by the estimated return to schooling (β̂it).
The correct estimation of βit raises two problems. Firstly, as advanced in theprevious section, there is a sample selection problem due to the lack of data forsome individuals. Since the survey focuses exclusively on heads of households,women are clearly under-represented in the estimation of [4]. The βit estimatemay therefore be biased. One solution would be estimate equation [4] for menand women separately and estimate the betas as the weighted average of the two.This would result in very low numbers of women for some regions, which wouldseriously affect our estimates. Another possibility would be to estimate [4] withweighted least squares (WLS), weighting by the percentage share of differentgroups defined by gender, region or level of education in the total number of em-ployed in Spain. The 1991 and 2001 censuses provide sufficient data to performthe necessary calculations. Although the 1981 census data are not sufficiently de-tailed in this respect, the 1981 EPF data are adequate for calculation purposes.The latter strategy is the one chosen in the present study. The need to includewomen and find a means to avoid the above-mentioned bias arises from the factthat our supply variable captures both sexes jointly, thus justifying the need to re-sort to the process described in the preceding paragraph.
The second problem is that, with Mincerian wage regressions estimated usingordinary least squares, schooling can be correlated with unobservable characteris-tics (e.g., ability) that may also affect wages. While some Spanish studies havesought to address these concerns using instrumental variables, none of them useEPF or ECPF data, since these surveys do not provide suitable instruments. Ne-vertheless, there are two reasons to believe this concern should not affect ouranalysis. First, many studies have shown that the bias is quite small [Card(1999)]. Moreover, since our study focuses on the evolution of the educationwage premium, our analysis will not be affected by the bias as long at the latterremains approximately constant in time. Another issue is that our estimatingequation implies that the return to an additional year of schooling is independentof the level of schooling. In principle, we could relax this assumption by estima-ting the return to schooling only for those who have attained certain levels of edu-cation (degrees). But we do not have sufficient data to follow this approach forsome of the smaller Spanish regions.
Table 3 contains our return-to-schooling estimates (or β) for Spain as awhole, obtained using the data on individuals available in our surveys. Here, itcan be seen that return to education fell during the 1980s and 1990s. There are si-milar, previous findings for Spain; for example, Abadíe (1997) finds that Spanishwage inequality fell during 1980s, partly due to a decrease in the return to educa-
A demand-supply analysis of the Spanish education wage premium
65

tion6. We have only partial data for the 1990s. Barceinas, Oliver, Raymond and Roig(2000a) find an increase in return to education during the first half of the decade, whileIzquierdo and Lacuesta (2007) find a notable decrease during the second half.
Revista de Economía Aplicada
66
Table 3: SPANISH RETURNS TO EDUCATION. 1980/81, 1990/91 AND 2000/01
1980-81 1990-91 2000-01
βt 0.074 0.064 0.058(0.002) (0.001) (0.001)
Note: estimations for 1980/81 and 1990/91 are based on EPF and 2000/01 on ECPF. βt representsthe average return to education for Spain. Data in parenthesis represent standard deviations. Thereturns are estimated using Mincer equations and OLS. The sample is limited to heads of familyand non self-employed workers.
Source: EPF and ECPF, Spanish National Statistics Institute.
3.2. Relative SupplyWe first aggregate workers with only primary schooling and workers with
lower-level secondary schooling using
(6) Other works point in a different direction however, maybe because of the use of different sur-veys to compare trends in the return to education. Barceinas, Oliver, Raymond, and Roig (2000b)estimate the return to education using EPF for 1980 and ECPF for 1985-1996. They found that re-turn to education increased during this period, except between 1985 and 1991 when it fell. Theirestimate of the return to education is 5.9% for 1980 and 7.0% for 1990. The estimates obtained inthis paper are 6.4% for 1980, 6.0% for 1990, and 7.0% in 2000. The major differences in the 1990figures are due to the use of ECPF data for that year.
L L a L a L a L a Lit it itL
it itL
it itL
it itL
it= + + + +2 1 1 3 3 4 4 5 55 6 6+ a LitL
it ,
where aLnit is the efficiency of workers with n-level of schooling relative to workers
with no schooling or primary schooling and n are the groups defined for the ag-gregate, Section 2.1.2. This efficiency parameter is obtained as the education pre-mium in region i and year t of workers with n-level education relative workerswith no more than a primary-school education. Here, the supply of more educatedworkers is obtained by aggregating workers with college (short and long cycle)educated workers using
H H a Hit it itH
it= +7 8 ,
hH
Li tit
it, ln .=
where aHit is obtained as the education premium in region i and year t of workers
with long-cycle college degrees with respect to short-cycle college workers. Thelog supply of education can now be obtained as
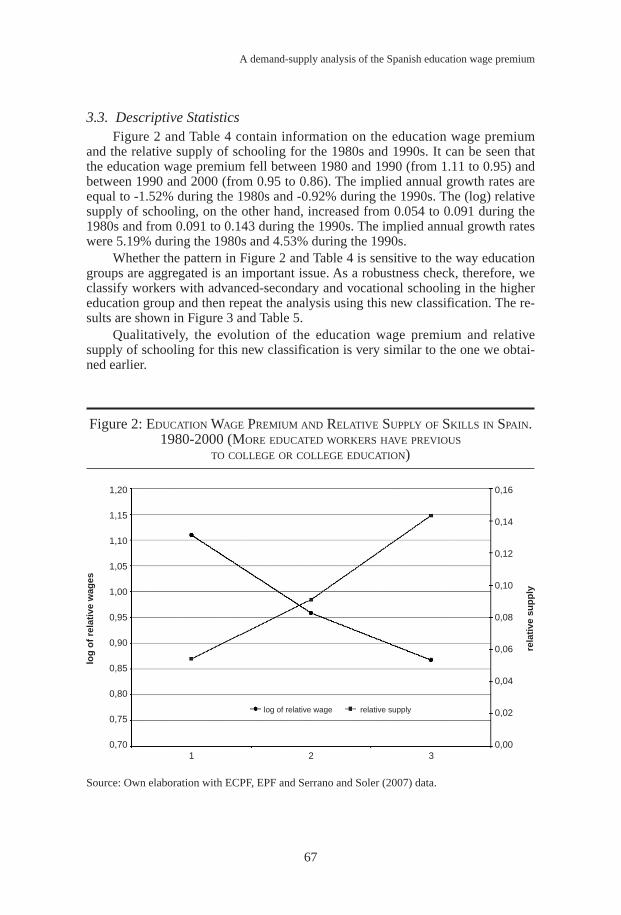
3.3. Descriptive StatisticsFigure 2 and Table 4 contain information on the education wage premium
and the relative supply of schooling for the 1980s and 1990s. It can be seen thatthe education wage premium fell between 1980 and 1990 (from 1.11 to 0.95) andbetween 1990 and 2000 (from 0.95 to 0.86). The implied annual growth rates areequal to -1.52% during the 1980s and -0.92% during the 1990s. The (log) relativesupply of schooling, on the other hand, increased from 0.054 to 0.091 during the1980s and from 0.091 to 0.143 during the 1990s. The implied annual growth rateswere 5.19% during the 1980s and 4.53% during the 1990s.
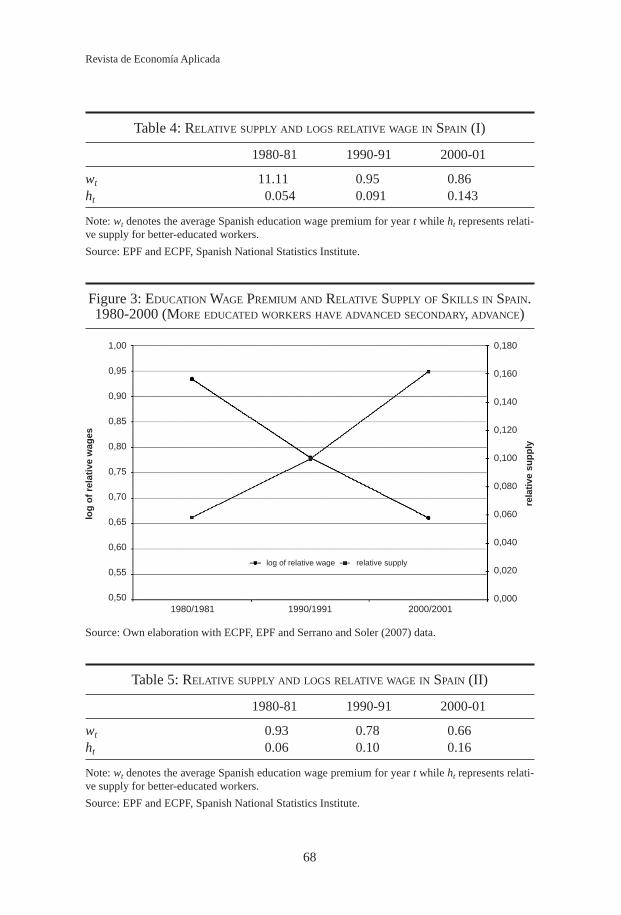
Whether the pattern in Figure 2 and Table 4 is sensitive to the way educationgroups are aggregated is an important issue. As a robustness check, therefore, weclassify workers with advanced-secondary and vocational schooling in the highereducation group and then repeat the analysis using this new classification. The re-sults are shown in Figure 3 and Table 5.
Qualitatively, the evolution of the education wage premium and relativesupply of schooling for this new classification is very similar to the one we obtai-ned earlier.
A demand-supply analysis of the Spanish education wage premium
67
Figure 2: EDUCATION WAGE PREMIUM AND RELATIVE SUPPLY OF SKILLS IN SPAIN.1980-2000 (MORE EDUCATED WORKERS HAVE PREVIOUS
TO COLLEGE OR COLLEGE EDUCATION)
Source: Own elaboration with ECPF, EPF and Serrano and Soler (2007) data.
1,20
1,15
1,10
1,05
1,00
0,95
0,90
0,85
0,80
0,75
0,70
0,16
0,14
0,12
0,10
0,08
0,06
0,04
0,02
0,00
log
of
rela
tive
wag
es
rela
tive
su
pp
ly
1 2 3
log of relative wage relative supply
Revista de Economía Aplicada
68
Table 4: RELATIVE SUPPLY AND LOGS RELATIVE WAGE IN SPAIN (I)
1980-81 1990-91 2000-01
wt 11.11 0.95 0.86ht 0.054 0.091 0.143
Note: wt denotes the average Spanish education wage premium for year t while ht represents relati-ve supply for better-educated workers.
Source: EPF and ECPF, Spanish National Statistics Institute.
Figure 3: EDUCATION WAGE PREMIUM AND RELATIVE SUPPLY OF SKILLS IN SPAIN.1980-2000 (MORE EDUCATED WORKERS HAVE ADVANCED SECONDARY, ADVANCE)
Source: Own elaboration with ECPF, EPF and Serrano and Soler (2007) data.
Table 5: RELATIVE SUPPLY AND LOGS RELATIVE WAGE IN SPAIN (II)
1980-81 1990-91 2000-01
wt 0.93 0.78 0.66ht 0.06 0.10 0.16
Note: wt denotes the average Spanish education wage premium for year t while ht represents relati-ve supply for better-educated workers.
Source: EPF and ECPF, Spanish National Statistics Institute.
1,00
0,95
0,90
0,85
0,80
0,75
0,70
0,65
0,60
0,55
0,50
0,180
0,160
0,140
0,120
0,100
0,080
0,060
0,040
0,020
0,000
log
of
rela
tive
wag
es
rela
tive
su
pp
ly
1980/1981 1990/1991 2000/2001
log of relative wage relative supply

A demand-supply analysis of the Spanish education wage premium
69
4. ESTIMATION AND RESULTS
To gauge the extent to which the evolution of the education wage premiumcan be explained by the demand-supply framework, we estimate
∆ ∆ ∆ ∆ ∆ωσ
ηit t iSt it t itb h b b= − + − +1
( ) , [5]
where ∆wit is the change in the log of education wage premium, ∆bt, the nationalshift in education demand, captures supply-driven movements along regional edu-cation demand curves, – (1/σ) ∆hist are regional shocks to labor demand and ∆itrepresents a time-region specific error.
Given that the data are for two decades of change, expression [5] can be re-written as
∆ ∆ ∆ ∆ ∆ ∆ ∆ωσ
ηit iSt i itb b b h b b= + − − + − +80 90 80 80 80
1( ) ( ), ,, [6]
where ∆b80 is average demand growth at national level for both decades, ∆b90 –∆b80 is a dummy that takes a value of 0 for the eighties and 1 for the nineties inorder to capture potential changes in relative demand growth for the second deca-de, and bi,80 – ∆b80 is the average value of change in demand for every region i re-lative to change in the nation as a whole. This last variable will be incorporatedinto estimation [6] as a regional effect.
Changes in the regional supply of educated workers are likely to be positi-vely correlated to shifts in regional labor demand, which implies that the inverseelasticity of substitution between more- and less-educated workers cannot be esti-mated by applying ordinary least squares estimation to [6]. This positive correla-tion may be the result of worker migration to regions with rapidly rising wages, orit may reflect the fact that individuals living in regions where education is highlypaid may decide to remain in school longer. Thus, it is necessary to find instru-ments for changes in the supply of education. Since the beginning-of-period po-pulation structure should be unaffected by shocks to regional labor demand, wewill use the regional population structure in 1980 as an instrument for changes inthe education supply during the 1980s and the population structure in 1990 as aninstrument for changes in the education supply during the 1990s. Since changes inlegal schooling requirements and better educational opportunities have increasedthe educational levels of younger people throughout Spain between 1980 and2000, relative to that of the generation that retired during those two decades,changes in the regional supply of educated workers should also correlate to chan-ges in the supply of education. Hence, the average level of schooling should haveincreased more rapidly in regions where there were more young people (under20s) and more older people (between 60 and 64) in 1980 and 1990, relative toother regions. It suggests a positive link between these three variables. The begin-ning-of-period population share of 5-to-19-year-olds and 60-to-64-year-olds arethe instruments used to estimate [6]. Hence, our identifying assumption is thatthis population share affects the change in the education premium over the courseof the following decade only through its effects on the relative supply of educa-

Revista de Economía Aplicada
70
Table 6: FIRST STAGE REGRESSION
Dependent Variable: changes in log of relative supply
5-19 years old 4.60**(1.91)
60-64 years old 2.03*(1.11)
Constant 13.22**(6.05)
Fixed effects yesR2 0.40-statistic 5.18
Note: dependent variable is log changes in regional relative supply due to extra education
The regressors (the 5-19 and 60-64 age group variables) represent the regional share in total popu-lation of people aged between 5 and 19 and 60 and 64.
Data in parenthesis are standard errors.
** and * means significance at 5 and 10%.
Source: Own elaboration.
tion. Table 6, which presents the first stage regression, shows that both the 5-to-20-year-old and 60-to-64-year-old population share have a highly significant posi-tive effect on the growth of education supply.
Table 6 contains the second stage results. The first column of results is thebaseline specification. The remaining columns give the results of various robust-ness checks using other variables such as physical capital stock per worker for allsectors, information and communication technology (ICT) physical capital perworker, and employment level. Both the data on physical capital per worker andinformation and communication technology (ICT) physical capital per workercome from IVIE series. The ideas of these robustness checks using capital is that(some types of) capital may be complementary to educated workers and thereforeaffect the education wage premium. Total employment is included to test for ag-gregate scale effects.
The results indicate that -1/ σ is between -0.775 and -0.865, meaning that theeducation demand curve is downward sloping. Moreover, our estimates are statis-tically different from zero at the 5% level. The implied elasticity of substitutionbetween more- and less- educated workers is between 1.1 and 1.3. This value isvery near to that found elsewhere. Johnson (1970), for example, estimates theelasticity of substitution between more- and less-educated workers to be 1.34 fora cross-section of U.S. states in 1960. Fallon and Layard (1975) find an elasticityof substitution between less- and more-educated workers of 1.49, using cross-country data. Angrist (1995) reports an elasticity of substitution of about 2 and

Caselli and Coleman (2000) estimate the elasticity of substitution between more-and less-educated workers to be approximately 1.3. Katz and Murphy (1992),using U.S. time-series data for the 1963-1987 period, report an inelasticity ofabout 1.4 for substitution between more- and less-educated workers. Using diffe-rent estimation methods, Ciccone and Peri (2005) argue that the long-term elasti-city of substitution in the U.S. between 1950 and the 1990s was between 1 and 2.
By how much did the demand for education increase in the 1980s and 1990saccording to our estimates? The first column shows a demand shift of 0.267 du-ring the 1980s, which represents an annual increase of about 2.7%. Since the dif-ference between the pace of the education demand shifts during the 1990s relativeto the 1980s is not statistically different from zero at any conventional level, wecannot reject the hypothesis that labor demand increased by the same amount du-ring the 1990s as during the 1980s. Interestingly, our estimated increase in educa-tion demand for Spain is very similar to that estimated by Katz and Murphy(1992), who report a value of 3.3%.
A demand-supply analysis of the Spanish education wage premium
71
Table 7: RELATIVE DEMAND ESTIMATION
I II III IV
∆b80 0.267* 0.274* 0.268* -1.841(0.160) (0.117) (0.160) (4.002)
∆b90 – ∆80 0.033 0.049 0.058 0.063(0.094) (0.103) (0.091) (0.137)
– -0.847** -0.865** -0.796** -0.775**(0.414) (0.426) (0.401) (0.369)
∆k – 0.917 – –– (0.280) – –
∆kict – – -0.231 –– – (0.172) –
Employment – – – 0.326– – – (0.636)
Adj. R2 0.453 0.467 0.532 0.486no. 34 34 34 34
Note: the dependent variable is changes in logs of regional relative wages due to extra education.∆b80 estimates changes in the (inverse) relative demand intercept from 1980 to 2000. ∆b90 – ∆80 es-timates differences in changes in the (inverse) relative demand intercept in the nineties relative to thewhole period. estimates the coefficient associated with changes in the log of the regional relati-ve supply due to extra education or the (inverse) relative demand slope. ∆k are changes in the logsof regional physical capital per workers and ∆kict are changes in the logs of regional ICT physicalcapital per workers. Employment is the log of regional employment at the start of the period. Allestimations are performed controlling for regional effects.
** implies significance at 5% and * at 10%.Values in parenthesis are standard deviations.Source: Own elaboration.
1σ
1σ

(7) Ley del Estatuto de los Trabajadores (1980).(8) Almost 50% of negotiations take place at sector-province level; 26.6% are sectoral negotiationsat national level.
Revista de Economía Aplicada
72
Summarizing, we find that education demand grew during the 1980s at a rateroughly similar to that for 1990s, and that this increase in education demand ap-proximates that found for the United States during the same period. Moreover, theelasticity of substitution between more- and less-educated workers found by thispaper is also quite similar to that estimated for the United States.
We are now ready to decompose the change in the education wage premiuminto the part attributable to changes in demand and the part attributable to changesin supply. Table 8 shows this exercise. Our results show that with no shift in edu-cation demand, the education wage premium would have fallen by -3.89% perannum between 1980 and 2000. By decade, this decrease would have been stron-ger during the 1980s (-4.15%) than during the 1990s (-3.63%). In the presence ofeducation demand shifts only, the education wage premium would have increasedby 2.7% during both the 1980s and the 1990s. The last column shows that thechange in the education wage premium predicted by the demand-supply modelcomes close to the change actually observed in the premium.
Table 8: DECOMPOSITION OF RELATIVE WAGE CHANGES
Wages1 Supply Demand Error
1980/81 – 1990/91 -1.52 -4.15 2.70 -0.061990/91 – 2000/01 -0.92 -3.63 2.70 0.01Average -1.22 -3.89 2.70 0.02
Note: Supply represents relative wage growth rates if the only changes are in relative supply, or chan-ges in relative wages along the relative demand curve. Wages are the values for relative wages deri-ved from Section 3.2. Demand represents the growth rates given by the common constant in [5]).
1. Observed.
Source: Own elaboration.
5. LABOR INSTITUTIONS
Let us now examine whether our conclusions above are robust to the influen-ce of wage-setting institutions. These institutions have changed in almost allcountries during recent decades. In Spain, a new system of labor regulation wasintroduced during the 1980s7, the most important feature of which was centralizedcollective bargaining (CB)8. The latter involved wages being negotiated betweenunions and employer associations, as it did in other European Countries such as

Another way to check whether our conclusions are driven by CB is to re-esti-mate our demand-supply model after excluding workers for whom the floors ofCB agreements are likely to be binding. DFJ argue that bargained wages earnedby the most CB-influenced workers fell below 125% of the minimum wage in theearly 1980s and below 140% of the minimum wage in 1990. Because their study
A demand-supply analysis of the Spanish education wage premium
73
Table 9: GROWTH IN UNEMPLOYMENT RATE BY EDUCATION GROUPS IN SPAIN
1980-85 1985-90 1990-95 1995-00
None or primary only 77.3 -20.1 51.6 -34.2Lower-secondary 63.3 -35.4 28.8 -45.5Upper-secondary 56.4 -27.5 47.2 -34.0Tertiary 75.4 -27.4 31.1 -43.7
Source: Human Capital Series compiled by IVIE, Spain.
Germany9. CB agreements set a wage floor, and while only 18% of workers arepaid at the negotiated rate, they tend to be the least-paid of all workers [see Dola-do, Felgueroso and Jimeno (1997), hereafter DFJ]10. Hence, education premiacould, in principle, be affected by CB wage floors; more importantly from ourperspective, the evolution of the education wage premium in Spain may have beenaffected by rising CB wage floors leading to wage compression (while there is aminimum wage in Spain, this wage is lower than the wage floor set by CB and istherefore not regarded as binding). One way to check whether trends in CB wagefloors did indeed raise the wages of the less-educated workers, relative to the mar-ket-clearing wage level, is to examine whether the unemployment rate amongless-educated workers increased more rapidly than it did among other education-classified worker groups. Table 9, which lists the percentage change in unemploy-ment rates by worker education category, shows no marked differences betweenless- versus more-educated workers as far as unemployment trends are concerned.For example, between 1980 and 1985 (a time of rising overall unemployment),the rates for workers with higher versus lower levels of education exhibited simi-lar trends. Between 1995 and 2000, a period characterized by falling unemploy-ment, both the primary and upper-secondary education groups registered the samedecline. In summary, over the course of the past twenty years, a similar trend hascharacterized unemployment among workers in all education categories.
(9) Despite very low union affiliation, almost 80% of workers are covered by some collectivebargaining agreement as negotiations are binding for most non-union workers.(10) Dolado, Felgueroso and Jimeno (1997) also explain that the real value of the minimum wagedoes not play any role in wage determination. They show that the lowest wages are determined bythe CB wage floors, and that there is no link between the minimum wage and CB wage floors.
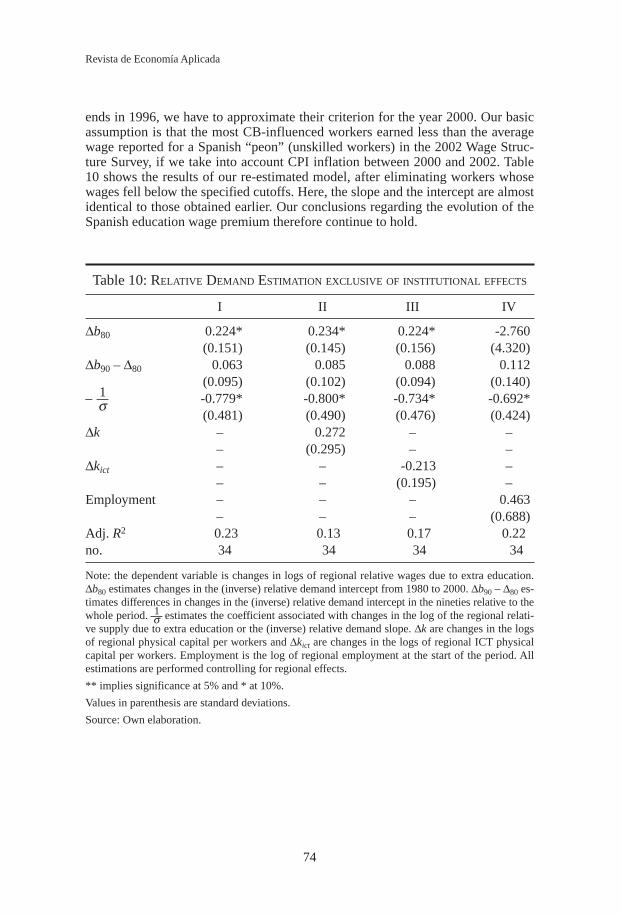
ends in 1996, we have to approximate their criterion for the year 2000. Our basicassumption is that the most CB-influenced workers earned less than the averagewage reported for a Spanish “peon” (unskilled workers) in the 2002 Wage Struc-ture Survey, if we take into account CPI inflation between 2000 and 2002. Table10 shows the results of our re-estimated model, after eliminating workers whosewages fell below the specified cutoffs. Here, the slope and the intercept are almostidentical to those obtained earlier. Our conclusions regarding the evolution of theSpanish education wage premium therefore continue to hold.
Revista de Economía Aplicada
74
Table 10: RELATIVE DEMAND ESTIMATION EXCLUSIVE OF INSTITUTIONAL EFFECTS
I II III IV
∆b80 0.224* 0.234* 0.224* -2.760(0.151) (0.145) (0.156) (4.320)
∆b90 – ∆80 0.063 0.085 0.088 0.112(0.095) (0.102) (0.094) (0.140)
– -0.779* -0.800* -0.734* -0.692*(0.481) (0.490) (0.476) (0.424)
∆k – 0.272 – –– (0.295) – –
∆kict – – -0.213 –– – (0.195) –
Employment – – – 0.463– – – (0.688)
Adj. R2 0.23 0.13 0.17 0.22no. 34 34 34 34
Note: the dependent variable is changes in logs of regional relative wages due to extra education.∆b80 estimates changes in the (inverse) relative demand intercept from 1980 to 2000. ∆b90 – ∆80 es-timates differences in changes in the (inverse) relative demand intercept in the nineties relative to thewhole period. estimates the coefficient associated with changes in the log of the regional relati-ve supply due to extra education or the (inverse) relative demand slope. ∆k are changes in the logsof regional physical capital per workers and ∆kict are changes in the logs of regional ICT physicalcapital per workers. Employment is the log of regional employment at the start of the period. Allestimations are performed controlling for regional effects.
** implies significance at 5% and * at 10%.
Values in parenthesis are standard deviations.
Source: Own elaboration.
1σ
1σ

(11) For instance, the ECPFs records contain information about education only for this group(12) These surveys’ information include six quarters.
A demand-supply analysis of the Spanish education wage premium
75
6. CONCLUSIONS
The main aim of this paper was to examine the extent to which a demand-supply model may be used to explain the evolution of the education wage premiumduring the 1980s and the 1990s. Our key finding was that the evolution of relativesupply was the main driving force behind the changes in this premium, since thedemand for education rose at a similar pace during the two decades under study.We also found that the increase in the demand for education during our study pe-riod –about 2.7% per year– roughly approximated that estimated for other coun-tries, including the United States. Another important finding was that the elasticityof substitution between more- and less-educated workers in Spain was around 1.1and 1.3 respectively, and thus almost identical to that obtained in previous cross-country and cross-regional studies. Our study therefore suggests that the trend inthe Spanish wage premium can be explained quite well by market forces.
APPENDIX A. THE EPF 80-81/90-91 AND ECPFS 1985-2005
A.1. DataHousehold Budget Surveys and Continuous Household Budget Surveys
supply data on consumption patterns, household and/or personal income (depen-ding on the focus of the analysis) and other relevant data on household members.Although these sources do not provide homogeneous wage statistic series, theygive important information that is relevant to this kind of analysis, for which theyhave become the main current source of statistics. However, a number of pro-blems need to be considered.
First, despite the vast amount of information available, complete informationis only available for the head of family11. Therefore, this paper, like other Spanishstudies (Abadíe 1997), works explicitly with this selection. Nevertheless, as notedin Section 3.1, there are methods of extending the main findings to the workingpopulation as a whole.
Second, annual wages are not immediately determined by recorded earningsdata. The main problem is that there is no information on hours worked or similarcriteria unless the head of family has worked for more than thirteen hours during thereference week. The only solution to this problem is to use only those workers whoreported working more than 13 hours and to assume that they worked full time.
Third, as in Abadíe (1997), groups of workers with unrepresentative characte-ristics were eliminated. For instance, education and experience cohorts were definedby five-year segments, and cohorts with fewer than fifteen records were deleted.
Fourth, the EPFs from 1980-81 and 1990-9112 provide a broad spectrum ofdata for about 20,000 families for each year. However, the quarterly surveys use asmaller sample size, since their main objective is to offer a short-term analysis ofconsumption, rather than consumption structure. In any case, since 1997, the samplehas doubled. This problem may be resolved by using two-year samples to improve

sample size, since the ECPFs poll the same family for six quarters, changing onesixth of this sample each quarter. It is therefore necessary to adjust household inco-mes, not only for the reasons described above but also for calendar effects whenworking with quarterly data. Further details of this will be given in subsection A.2.
The next problem stems from the heterogeneity of the definitions and theclassifications of variables used. For example, different educational level classifi-cations appear each year, partly because current surveys have modified their defi-nitions over the years and partly because the Spanish legal definition of educationchanged during the period under study13. It is, nevertheless, possible to find acommon denominator between the groups defined by each survey of individualdata and for the aggregate supply data, as shown in subsection 3.1 and in Table 1.The years imputed are the same as those given in Serrano and Soler (2007).
To conclude, despite the limitations of working with these surveys, they pos-sess many redeeming features which make them our best choice for data on the dis-tribution of Spanish wage inequality between 1980 and 2000. Two main criteriamay be cited in support of their use: first, the lack of any better alternatives for thisperiod and, second, their usefulness as a basis for comparative analysis.
A.2. Refining wages from EPF and ECPFsOnce the surveys were selected for each year, they were then refined. As has
been described, only data for heads-of-family working over thirteen hours per weekwere considered, after eliminating all self-employed wage-earners. Because ECPFsurveys are restricted to household income data, this study focused exclusively onhouseholds where the head of family is the only worker. This is why women areunder-represented and why this paper uses estimation [5].
Second, it was assumed that wages reported as below the legal minimumwere either earned by part-time workers or individuals who had been unemployedfor at least one year, or were erroneous replies. The records were modified whenannual reported wages fell below the legal minimum for that year.
Third and last, calendar effects are taken into account in the ECPF informa-tion. The quarterly nature of these surveys implies that the wages reported mightbe influenced by the quarter in which they are given. To eliminate this effect, fa-milies with wages for all six quarters were taken first, and the calendar effect wasanalyzed in these cases. Then, a wage-level factor was obtained for each quarter.Once these factors were obtained, all the workers’ wages were deflated. Finally,the quarterly average wage was taken and multiplied by four to give the yearlywage for all of the workers, regardless of which quarter they had worked. In thiscase, the six quarter samples were combined to increase (double) the ECPF samplesize, although the same result could probably be obtained by using all four quar-ters in the calendar context.
Revista de Economía Aplicada
76
EA
(13) In the early nineties, the education law changed from an earlier one passed in 1970, which in-troduced compulsory schooling in Spain up to the age of fourteen. In 1990, the LOGSE extendedcompulsory schooling to the age of sixteen and changed the organization of the educational cycle,as the 1970 law had.

REFERENCESAbadíe, A. (1997): “Changes in Spanish Labor Income Structure During the 1980’s: A Quan-
tile Regression Approach”, Investigaciones Económicas, vol. XXI, n. 2, pp. 253-272.Abraham, K.G. and S.N. Houseman (1993): “Earnings Inequality in Germany”, Working
Paper, n. 4541, NBER.Acemoglu, D. (2002): “Technical Change, Inequality, and the Labor Market”, Journal of
Economic Literature, vol. 40, n. 1, pp. 7-72.Acemoglu, D. (2003): “Cross-Country Inequality Trends”, Economic Journal, vol. 113, n.
485, pp. 121-149.Acemoglu, D. and J. Angrist (2001): “How Large are the Social Returns to Education: Evi-
dence from Compulsory Schooling Laws”, in B. Bernanke and K. Rogoff (eds.): Ma-croeconomic Annual 2000, NBER, Cambridge, MA: The MIT Press, pp. 9-59.
Angrist, J. (1995): “The Economic Returns to Schooling in the West Bank and Gaza Strip”,American Economic Review, vol 85, pp. 1065-1087.
Arellano, M., S. Bentolila and O. Bover (2001): “The Distribution of Earnings in SpainDuring the 1980s: The Effects of Skill, Unemployment and Union Power”, DiscussionPaper, n. 2770, CEPR.
Barceinas, F., J. Oliver, J. Raymond and J. Roig (2000a): “Spain” in C. Harmon, I. Walkerand N. Westergrad-Neilsen (eds.): Education and Earnings in Europe: a Cross CountryAnalysis of the Return to Education, Cheltenham: Edward Elgar, pp. 234-264.
Barceinas, F., J. Oliver, J. Raymond and J. Roig (2000b): “Los Rendimientos de la Educa-ción en España”, Papeles de Economía Española, n. 86.
Card, D. (1999): “The causal effect of education on earnings”, in O. Ashenfelter and D.Card (eds.): Handbook of Labor Economics, vol. 5, pp. 1801-1864.
Card, D., F. Kramarz and T. Lemieux (1999): “Changes in The Relative Structures ofWages and Employment: A Comparison of the United States, Canada and France”, TheCanadian Journal of Economics, vol. 32, n. 4, pp. 843-877.
Caselli, F. and W. Coleman (2006): “The World Technology Frontier”, The American Eco-nomic Review, vol. 96, n. 3, pp. 499-522.
Ciccone, A. and G. Peri (2005): “Long-Run Substitutability Between More and Less Edu-cated Workers: Evidence from U.S. States, 1950-1990”, The Review of Economics andStatistics, vol. 87, n. 4, pp. 652-663.
Dolado, J., F. Felgueroso and J. Jimeno (1997): “The Effects of Minimum BargainedWages on Earnings: Evidence from Spain”, European Economic Review, vol. 41, pp.713-721.
Fallon, P. and P. Layard (1975): “Capital-Skill Complementarity, Income Distribution andOutput Accounting”, Journal of Political Economy, vol. 83, pp. 279-302.
Gottschalk, P. and M. Joyce (1998): “Cross-National Differences In The Rise In EarningsInequality: Market And Institutional Factors”, The Review of Economics and Statistics,vol 80, n. 4, pp. 489-502.
Gottschalk, P. and T.M. Smeeding (1997): “Cross-National Comparasions of Earnings andIncome Inequality”, Journal of Economic Literature, vol 35, pp. 633-687.
Hamermesh, D. (1993): Labor Demand. Princetown University Press.Izquierdo, M. and A. Lacuesta (2007): “Wage Inequality in Spain: Recent Developments”,
Working Paper, n. 781, ECB, Banco de España.Johnson, G.E. (1970): “The Demand for Labor by Educational Category”, Southern Eco-
nomic Journal, vol. 37, pp. 190-203.
A demand-supply analysis of the Spanish education wage premium
77

Katz, L.F., G. Loveman and D. Blanchflower (1995): “A Comparison of Changes in theStructure of Wages in Four OECD Countries”, in R. Freeman and L.F. Katz (eds.): Di-fferences and changes in Wage Structure, Chicago: University of Chicago Press.
Katz, L.F. and K.M. Murphy (1992): “Changes in Relative Wages, 1963-1987: Supply andDemand Factors”, The Quarterly Journal of Economics, vol 107, n. 1, pp. 35-78.
Martinez-Ros, E. (2001): “Wages and Innovations in Spanish Manufacturing Firms”, Ap-plied Economics, vol 33, n. 1, pp. 81-89.
Mas, M., F. Pérez and E. Uriel (2006): El stock y los servicios del capital en España y sudistribución territorial (1964-2003). Fundación BBVA.
Mincer, J. (1974): “Schooling, Experience and Earnings”, Discussion paper, National Bu-reau of Research, New York.
Serrano, L. and A. Soler (2007): Metodología para la Estimación de las Series de CapitalHumano. 1964-2007. Bancaja.
Torres, V.X.T. (2002): “Dispersión salarial y cambio tecnológico en la industria española”,Investigaciones Económicas, vol 26, n. 3, pp. 551-571.
Fecha de recepción del original: enero, 2008Versión final: enero, 2009
RESUMENEn este trabajo se estima la demanda de educación para España, con elobjeto de analizar si la evolución de la prima a la educación durante losochenta y noventa puede ser explicada en el marco de un análisis deoferta y demanda. Como principal resultado se encuentra que el creci-miento en la demanda fue muy similar entre los ochenta y noventa. Porello, los resultados empíricos encontrados nos dicen que la diferente evo-lución de la prima a la educación entre ambas décadas puede ser explica-da combinando los cambios en el crecimiento de la oferta con una de-manda que creció de forma estable.
Palabras clave: premio a la educación, demanda de educación, oferta detrabajo.
Clasificación JEL: J24, J31, O33.
Revista de Economía Aplicada
78