Embed Size (px)
Citation preview
A data-driven review of thermoelectricmaterials: Performance and
resource considerationsThe Harvard community has made this
article openly available. Please share howthis access benefits you. Your story matters
Citation Gaultois, Michael W., Taylor D. Sparks, Christopher K. H. Borg, RamSeshadri, William D. Bonificio, and David R. Clarke. Forthcoming.Data-driven review of thermoelectric materials: Performance andresource considerations. Chemistry of Materials.
Published Version doi:10.1021/cm400893e
Citable link http://nrs.harvard.edu/urn-3:HUL.InstRepos:10665230
Terms of Use This article was downloaded from Harvard University’s DASHrepository, and is made available under the terms and conditionsapplicable to Other Posted Material, as set forth at http://nrs.harvard.edu/urn-3:HUL.InstRepos:dash.current.terms-of-use#LAA
A data-driven review of thermoelectric materials:
Performance and resource considerations
Michael W. Gaultois,⇤,†,‡ Taylor D. Sparks,⇤,‡ Christopher K. H. Borg,‡
Ram Seshadri,⇤,¶,†,‡ William D. Bonificio,§ and David R. Clarke§
Department of Chemistry and Biochemistry, University of California, Santa Barbara, CA
93106, Materials Research Laboratory, University of California, Santa Barbara, CA 93106,
Materials Department, University of California, Santa Barbara, CA 93106, and School of
Engineering and Applied Sciences, Harvard University, 29 Oxford Street, Cambridge, MA
02138
E-mail: [email protected]; [email protected]; [email protected]
⇤To whom correspondence should be addressed†Department of Chemistry and Biochemistry, UCSB‡Materials Research Laboratory, UCSB¶Materials Department, UCSB§School of Engineering and Applied Sciences, Harvard University
1
Page 1 of 37
ACS Paragon Plus Environment
Chemistry of Materials
123456789101112131415161718192021222324252627282930313233343536373839404142434445464748495051525354555657585960
Abstract
In this review, we describe the creation of a large database of thermoelectric materi-
als prepared by abstracting information from over 100 publications. The database has
over 18 000 data points from multiple classes of compounds, whose relevant proper-
ties have been measured at several temperatures. Appropriate visualization of the data
immediately allows certain insights to be gained with regard to the property space of
plausible thermoelectric materials. Of particular note is that any candidate material
needs to display an electrical resistivity value that is close to 1 mW cm at 300 K, i.e.,
samples should be significantly more conductive than the Mott minimum metallic con-
ductivity. The Herfindahl-Hirschman index, a commonly accepted measure of market
concentration, has been calculated from geological data (known elemental reserves)
and geopolitical data (elemental production) for much of the periodic table. The visu-
alization strategy employed here allows rapid sorting of thermoelectric compositions
with respect to important issues of elemental scarcity and supply risk.
Keywords: Thermoelectrics, datamining, Herfindahl-Hirschman Index, elemental abun-
dance
2
Page 2 of 37
ACS Paragon Plus Environment
Chemistry of Materials
123456789101112131415161718192021222324252627282930313233343536373839404142434445464748495051525354555657585960
Introduction
The nature of thermoelectric phenomena and materials — competing and contraindicated
properties, the complexity and variety of the material systems involved — make it some-
what difficult to develop rational strategies that can lead to significant improvements in
performance. Notwithstanding these difficulties, creative approaches have yielded highly
promising materials.1–8 The guiding principle behind the design of thermoelectric mate-
rials, and indeed, any functional material, is to completely understand the causal physics
and use such knowledge to rationally optimize material properties. However, even without
knowledge of causality, progress across numerous fields is enabled by correlation, without
a priori understanding of the drivers. Particularly when large datasets are available, robust
correlation can be found between seemingly disparate observables. This ability to extract
meaningful information from large pools of data has been somewhat under-utilized in the
search for new materials.
Thermoelectrics and their historical development have been surveyed by Snyder and
Toberer,9 Nolas et al.,10 Goldsmid,11 and the two CRC handbooks on thermoelectrics by
Rowe.12,13 The volume and complexity of research on thermoelectric materials makes the
field fertile for a data-driven review — sometimes referred to as data mining, or mate-
rials informatics. Informatics-based approaches have been successfully used for estimat-
ing some physical properties14 and the relative stability of selected material systems,15
and high-throughput methods are becoming increasingly helpful in materials design.16
Given the volume of information that has been published, knowing the right information
to abstract is the first step to such an approach. Furthermore, developing an appropriate
visualization strategy to explore the space of thermoelectric materials is crucial. Accord-
ingly, we have reduced the problem of reviewing thermoelectric performance to several
key properties at four temperatures of interest, and have created an interactive frame-
work to visualize the large amounts of information. Trends in materials properties emerge
from such visualization, and guiding principles for the development of high-performance
3
Page 3 of 37
ACS Paragon Plus Environment
Chemistry of Materials
123456789101112131415161718192021222324252627282930313233343536373839404142434445464748495051525354555657585960
thermoelectric materials emerge. Perhaps more importantly, guidelines are suggested for
where not to look in the parameter space of candidate materials.
Since the efficiency of a thermoelectric device is related to the thermoelectric figure
of merit, zT = S
2T/(rk), with S the Seebeck coefficient, r the electrical resistivity, and k
the thermal conductivity, these different measured parameters were the obvious choice for
extraction from publications into a database. A particularly useful format for displaying
the large amount of property-based data is based on a modification of the well-known
Jonker plot,17 in which the Seebeck coefficient is usually graphed as a function of the elec-
trical conductivity. The use of the Jonker plot has traditionally been limited to optimizing
the carrier concentration in a single thermoelectric material. In contrast, we display all
materials in a single plot, with the different material classes grouped by marker color. In
the modified version employed by us, we prefer to use the electrical resistivity (on a log-
arithmic scale) r as abscissa, and the Seebeck coefficient S as ordinate. The radius of the
circular marker represents the performance, which is commonly either zT or the power
factor, S
2/r.
There is more to a material than just performance. Given the proposed widespread
application of thermoelectrics and the potential for high-volume use of materials if certain
performance targets are reached, they must be composed of elements that are accessible
and not in danger of a supply risk. Crustal abundance of elements, their global production,
reserves, and use, are some of the factors that determine supply risk. The criticality of
elements in the context of metals that are crucial to energy conversion has been described
by Graedel.18 Homm and Klar19 have specifically raised these issues for thermoelectric
materials. Following the approach of Graedel,18 we have used our database to calculate
several criticality indices for the thermoelectric materials featured here. Resources that
are produced almost entirely in a particular region can provide a single entity leverage
in determining supplies and prices. This geopolitical influence over materials supply and
price can be measured by market concentration, often quantified through the Herfindahl-
4
Page 4 of 37
ACS Paragon Plus Environment
Chemistry of Materials
123456789101112131415161718192021222324252627282930313233343536373839404142434445464748495051525354555657585960
Hirschman Index (HHI).20,21 The HHI is a financial tool commonly used to measure the
monopoly of entities over a commodity or product, and has been previously used as a
measure of geopolitical influence on elemental production of a select few elements.18,22,23
Here we calculate the HHI, based on available 2011 data, of almost all of the first 83
elements in the periodic table. Only H, the noble gases, Tc, and Pm are excluded. The HHI
is calculated both for elemental production (HHIP), reflecting the specific geopolitics of
the element, as well as for elemental reserves (HHIR), based on known deposits that could
be processed. In conjunction with composition data entered into the database, we employ
HHI indices and elemental scarcity values to determine practical issues that influence the
likelihood a particular thermoelectric material will find widespread use.
Methods
Nature and source of data
We have abstracted data from representative publications on a wide variety of thermoelec-
tric compounds so that they can be accessed and compared easily with other compounds.
The data correspond to four different temperatures in the different regimes of interest for
high-temperature thermoelectric devices: 300 K, 400 K, 700 K, 1000 K. There are currently
over 1100 database entries (rows), each with 17 associated components: temperature,
electrical resistivity, Seebeck coefficient, thermal conductivity, power factor, kzT , zT , chem-
ical composition, material family, preparatory route, material form (whether single crystal
or polycrystalline), author, year of publication, DOI link, and comments. Additionally, we
generate new metadata from the chemical composition of materials, such as HHIP, HHIR,
scarcity, and average atomic weight, M̄. To facilitate comparison of materials, we limit our
choice of systems in the database to be bulk, polycrystalline samples. In many instances,
we employ the power factor or kzT rather than than the actual figure of merit zT for the
visualization, because zT requires k, the thermal conductivity to be measured. Thermal
5
Page 5 of 37
ACS Paragon Plus Environment
Chemistry of Materials
123456789101112131415161718192021222324252627282930313233343536373839404142434445464748495051525354555657585960
conductivity is not reported for many materials. Furthermore, of all the thermoelectric pa-
rameters it is the least reliable and/or reproducible because it is so sensitive to processing
conditions.
Data from published work was extracted manually from digital publications using free
software such as PlotDigitizer24 and DataThief.25 In general, data was extracted from plots
of a physical property vs. temperature. If data was not explicitly reported at a temperature
of interest, values were interpolated, or extrapolated when appropriate. If property traces
(curves) were found to rapidly or unpredictably changing in the region of extrapolation,
the point was omitted, or data was taken from the nearest reported temperature. In these
cases, the temperature of an extrapolated data point is mentioned in the metadata com-
ment. Because data was entered by hand, the power factor and figure of merit (zT ) were
calculated from the extracted data and checked against the reported values to ensure the
data was self-consistent.
HHI values based on production and reserves for each element were calculated from
2011 USGS commodity statistics following the approach used by others.18,22,23 When 2011
data was unavailable, data from 2010 or 2009 was used. This has generated a set of HHI
values presented in table 1 for much of the periodic table, a significant expansion from
previous studies, which focused on eight parent metals.18,23 For elements where reserves
are seen as adequate or extremely large (e.g., C, O, F, Na, Al, Ca, S, etc.) quantitative
reserves are not available but their use is unlikely to reduce their availability to critical
levels. For elements such as sodium, where multiple commodities are reported separately
(carbonates, sulphates, chloride . . . ), the reports were combined and the HHI values were
generated from the aggregate. Another important consideration is that the production
and/or reserve values for a country may be unknown or are withheld. In these instances,
where the number of producers and/or the amount of reserves are low, these omissions
introduce considerable uncertainty. In these cases, the HHI values were estimated based
on the general information provided in the USGS report. Estimates of these elements are
6
Page 6 of 37
ACS Paragon Plus Environment
Chemistry of Materials
123456789101112131415161718192021222324252627282930313233343536373839404142434445464748495051525354555657585960
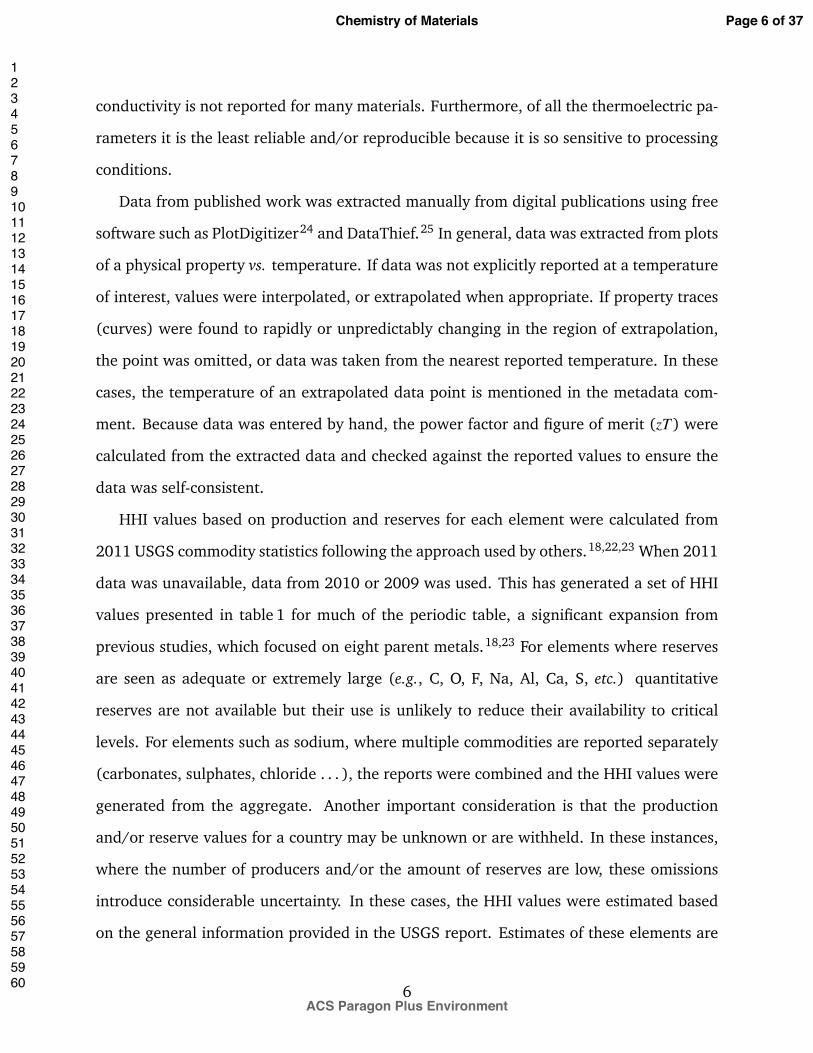
denoted by an asterisk in table 1.
Figure 1: Periodic table indicating elemental scarcity and the HHI (production, reserves)indices for most elements. Values were calculated using USGS statistics from 2011, or ifunavailable, from statistics no earlier than 2009.
HHI values were calculated using the following expression, HHI =N
Âi
s
2i
, where s
i
is
the percent market share of country i in the world production or reserves of a given ele-
ment. The US Department of Justice and the Federal Trade Commission have designated
markets as unconcentrated when HHI < 1500, moderately concentrated when the HHI lies
between 1500 and 2500, and highly concentrated when HHI > 2500.26 If a single country
controlled the entire market, HHI = 1002. Elemental HHI values were then used to cal-
culate weighted HHI production and reserve values based on the weight fraction of each
element in the chemical formula. Atomic weights were taken from the CRC Handbook.27
The crustal abundance of elements were obtained from the CRC Handbook27 and used to
generate elemental scarcity values, z (crustal abundance in inverse ppm). These scarcity
values were used to calculate the effective scarcity of materials based on the weight frac-
7
Page 7 of 37
ACS Paragon Plus Environment
Chemistry of Materials
123456789101112131415161718192021222324252627282930313233343536373839404142434445464748495051525354555657585960
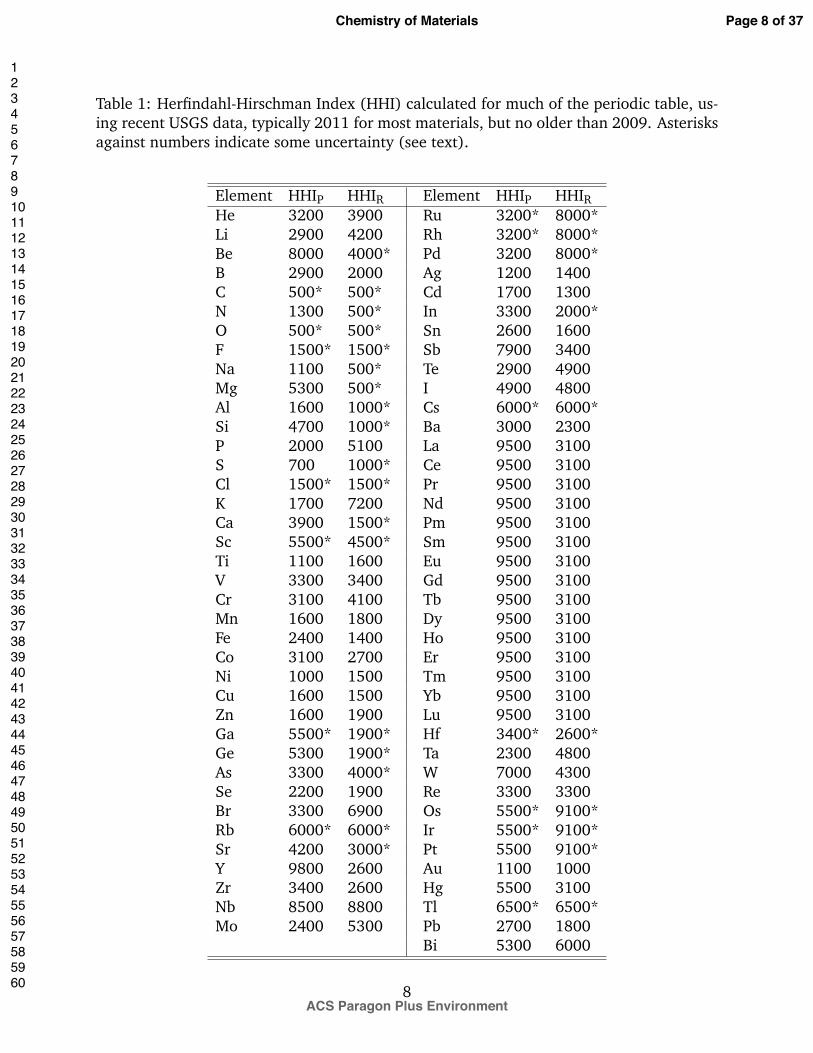
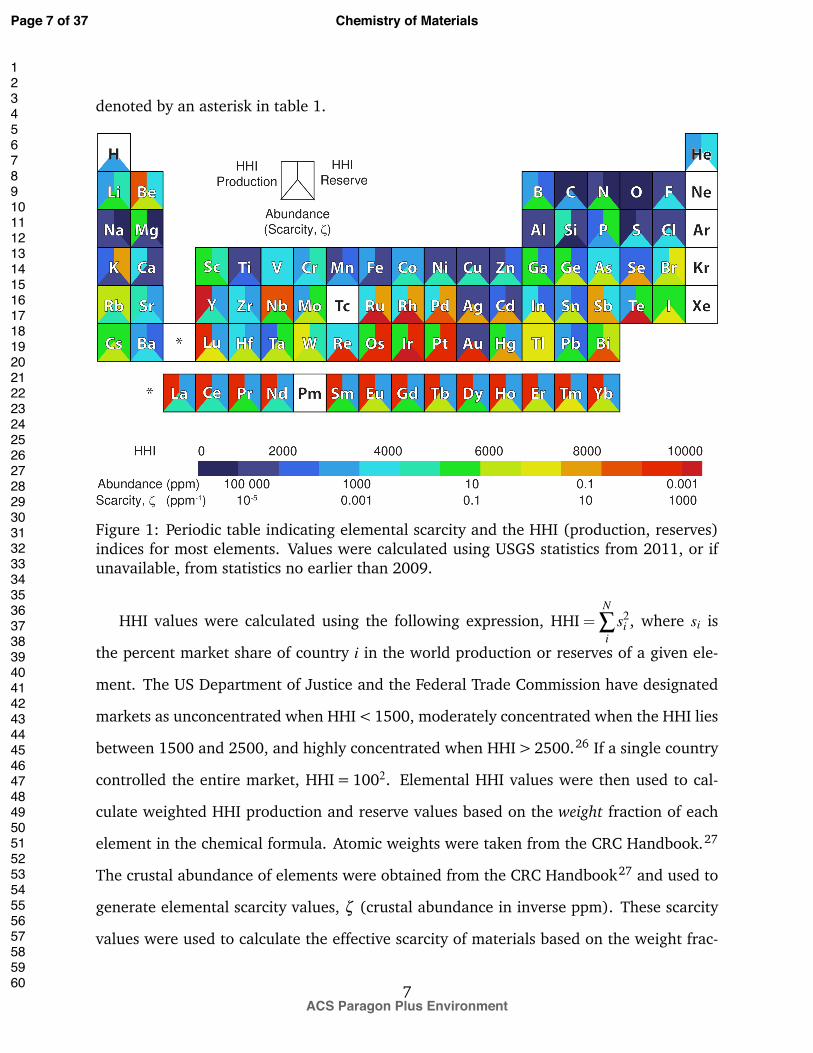
Table 1: Herfindahl-Hirschman Index (HHI) calculated for much of the periodic table, us-ing recent USGS data, typically 2011 for most materials, but no older than 2009. Asterisksagainst numbers indicate some uncertainty (see text).
Element HHIP HHIR Element HHIP HHIRHe 3200 3900 Ru 3200* 8000*Li 2900 4200 Rh 3200* 8000*Be 8000 4000* Pd 3200 8000*B 2900 2000 Ag 1200 1400C 500* 500* Cd 1700 1300N 1300 500* In 3300 2000*O 500* 500* Sn 2600 1600F 1500* 1500* Sb 7900 3400Na 1100 500* Te 2900 4900Mg 5300 500* I 4900 4800Al 1600 1000* Cs 6000* 6000*Si 4700 1000* Ba 3000 2300P 2000 5100 La 9500 3100S 700 1000* Ce 9500 3100Cl 1500* 1500* Pr 9500 3100K 1700 7200 Nd 9500 3100Ca 3900 1500* Pm 9500 3100Sc 5500* 4500* Sm 9500 3100Ti 1100 1600 Eu 9500 3100V 3300 3400 Gd 9500 3100Cr 3100 4100 Tb 9500 3100Mn 1600 1800 Dy 9500 3100Fe 2400 1400 Ho 9500 3100Co 3100 2700 Er 9500 3100Ni 1000 1500 Tm 9500 3100Cu 1600 1500 Yb 9500 3100Zn 1600 1900 Lu 9500 3100Ga 5500* 1900* Hf 3400* 2600*Ge 5300 1900* Ta 2300 4800As 3300 4000* W 7000 4300Se 2200 1900 Re 3300 3300Br 3300 6900 Os 5500* 9100*Rb 6000* 6000* Ir 5500* 9100*Sr 4200 3000* Pt 5500 9100*Y 9800 2600 Au 1100 1000Zr 3400 2600 Hg 5500 3100Nb 8500 8800 Tl 6500* 6500*Mo 2400 5300 Pb 2700 1800
Bi 5300 6000
8
Page 8 of 37
ACS Paragon Plus Environment
Chemistry of Materials
123456789101112131415161718192021222324252627282930313233343536373839404142434445464748495051525354555657585960
tion of elements in the chemical formula, z = ÂN
i
(zi
⇥ m
i
m
tot
) where zi
and m
i
are the scarcity
and weight of an element i in a material. The scarcity and Herfindahl-Hirschman In-
dex values (based on production and reserves) for much of the periodic table is shown
schematically in figure 1.
Mechanics of visualization
Figure 2: Flowchart for extraction, organization, and visualization of data. Note that thefirst step of data extraction is manual.
At the initial stages of this work, it became evident that gathering the
large amount of data would be futile in the absence of an appropriate frame-
work that permitted the gathered data to be visualized in a flexible man-
ner. In this section we describe a website we have developed and hosted at
www.mrl.ucsb.edu:8080/datamine/thermoelectric.jsp as an example of a
plausible framework for organizing and visualizing the results of such data mining. The
flowchart describing the data mining, database formation, and visualization process is
9
Page 9 of 37
ACS Paragon Plus Environment
Chemistry of Materials
123456789101112131415161718192021222324252627282930313233343536373839404142434445464748495051525354555657585960
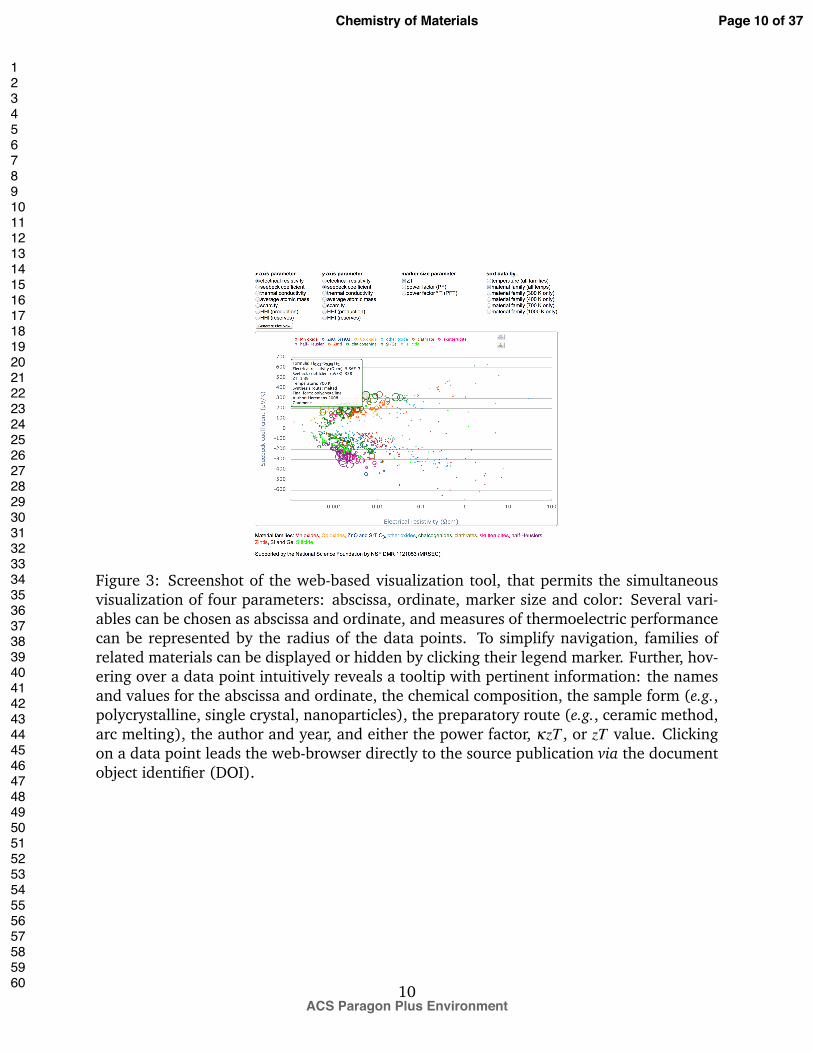
Figure 3: Screenshot of the web-based visualization tool, that permits the simultaneousvisualization of four parameters: abscissa, ordinate, marker size and color: Several vari-ables can be chosen as abscissa and ordinate, and measures of thermoelectric performancecan be represented by the radius of the data points. To simplify navigation, families ofrelated materials can be displayed or hidden by clicking their legend marker. Further, hov-ering over a data point intuitively reveals a tooltip with pertinent information: the namesand values for the abscissa and ordinate, the chemical composition, the sample form (e.g.,polycrystalline, single crystal, nanoparticles), the preparatory route (e.g., ceramic method,arc melting), the author and year, and either the power factor, kzT , or zT value. Clickingon a data point leads the web-browser directly to the source publication via the documentobject identifier (DOI).
10
Page 10 of 37
ACS Paragon Plus Environment
Chemistry of Materials
123456789101112131415161718192021222324252627282930313233343536373839404142434445464748495051525354555657585960
summarized in figure 2. A screenshot of the website is shown in figure 3. Because several
physical parameters were collected and tabulated, visualizing any number of combinations
along the abscissa and ordinate is possible using the website. While not all combinations
will yield insightful relationships, the website allows using as axes choices, the electri-
cal resistivity, Seebeck coefficient, thermal conductivity, average atomic weight, elemental
scarcity, and HHI based on production or reserves of a material. To increase the informa-
tion density that can be visualized, a third dimension is also plotted: the size of the data
point (the radius of a circle) is proportional to material performance. The marker size
can be either power factor (S
2/r), kzT , or zT . kzT allows a rough comparison with zT ,
but does not require the thermal conductivity to have been measured or reported. Many
materials have a thermal conductivity between 1 W m�1K�1 to 10 W m�1K�1, and in the
case that k = 1 W m�1K�1, the numerical value of kzT is the same as the numerical value
of zT .
The website allows interactive exploration of all the data. Hovering over a data point
reveals a tooltip with pertinent information: the values for the abscissa and ordinate, the
chemical composition, the sample form (e.g., polycrystalline, single crystal, nanoparticles),
the preparatory route (e.g., ceramic method, arc melting), the author and year, and either
the power factor, kzT , or zT value. Additionally, clicking on a data point leads the web-
browser directly to the publication via the document object identifier (DOI). To enable
sorting of the large number of datasets, the user may choose to sort by material family
or temperature regime. Although the material families are shown with different marker
color the ability to hide or show a given family can make direct comparison more clear.
This is accomplished by clicking the name of the dataset in the legend. Finally, option is
available to visualize the results of the thermoelectric database employed here, or for users
to upload their own data, following an ExcelTM template file available on the website.
In this way a user can look for trends in their data or use the website’s JavaTM code to
generate additional non-performance-related data such as scarcity, average atomic weight
11
Page 11 of 37
ACS Paragon Plus Environment
Chemistry of Materials
123456789101112131415161718192021222324252627282930313233343536373839404142434445464748495051525354555657585960
or HHI.
Results and discussion
Examples of useful visualization schemes
Table 2: The flexibility of the visualization framework allows users to examine the relationbetween any number of different parameters. Several examples are tabulated here, alongwith what can potentially be learned.
Abscissa Ordinate Size (radius) Use Findingr S S
2/r, kzT , zT General trends,insight
Compound must be metallicfor high performance
M̄ k kzT , zT Effect of w̄ k decreases with increasing M̄
r300 K S300 K kzT , zT at differ-ent temperatures
estimate high-Tperformance
Rapid screening of high-T ma-terials
r k kzT , zT Effect of ke
Slope of k vs. r changes lin-early with T of dataset
HHIP HHIR kzT , zT Material choiceand criticalilty
Intensive use of rare-earthsand/or Sb may strain markets
z HHIP kzT , zT Material choiceand criticalilty
Some elements are abun-dant, yet will have volatileprices. Many state-of-the-art high-performance materi-als rank poorly in criticality in-dices
In table 2, we list those combinations of parameters that we have found particularly
useful to plot. The various combinations and the findings are described more thoroughly
in the following sections.
Rapid screening of materials
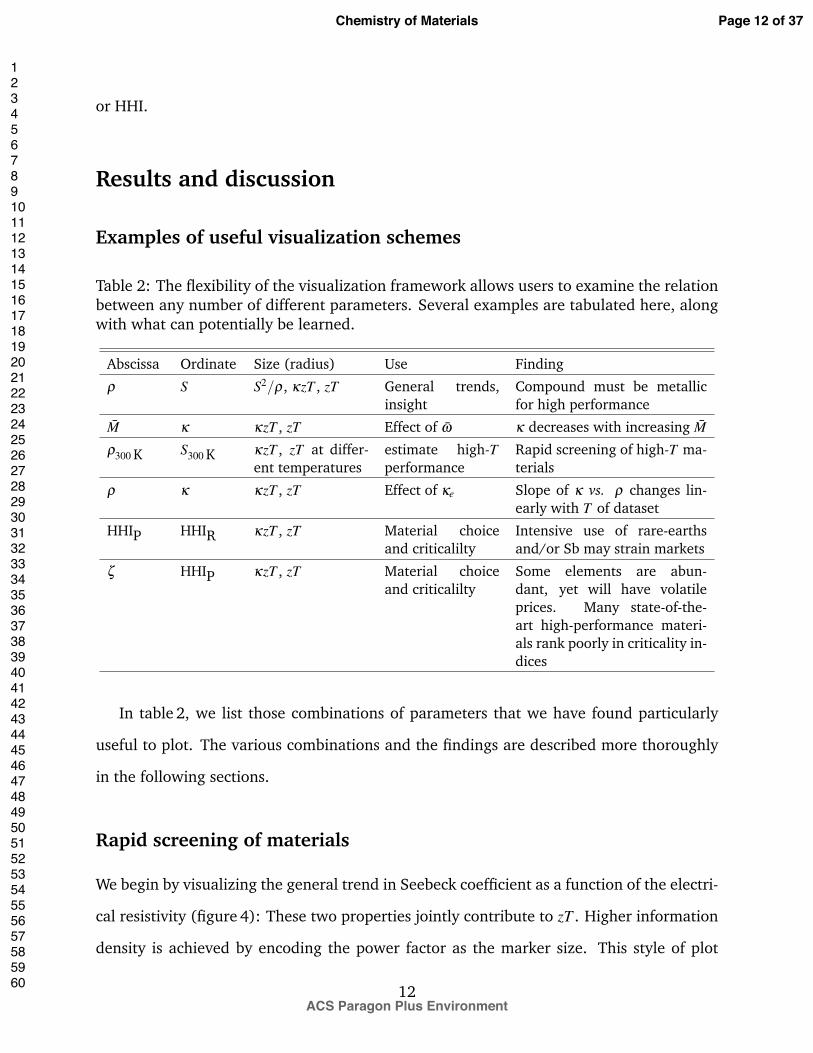
We begin by visualizing the general trend in Seebeck coefficient as a function of the electri-
cal resistivity (figure 4): These two properties jointly contribute to zT . Higher information
density is achieved by encoding the power factor as the marker size. This style of plot
12
Page 12 of 37
ACS Paragon Plus Environment
Chemistry of Materials
123456789101112131415161718192021222324252627282930313233343536373839404142434445464748495051525354555657585960
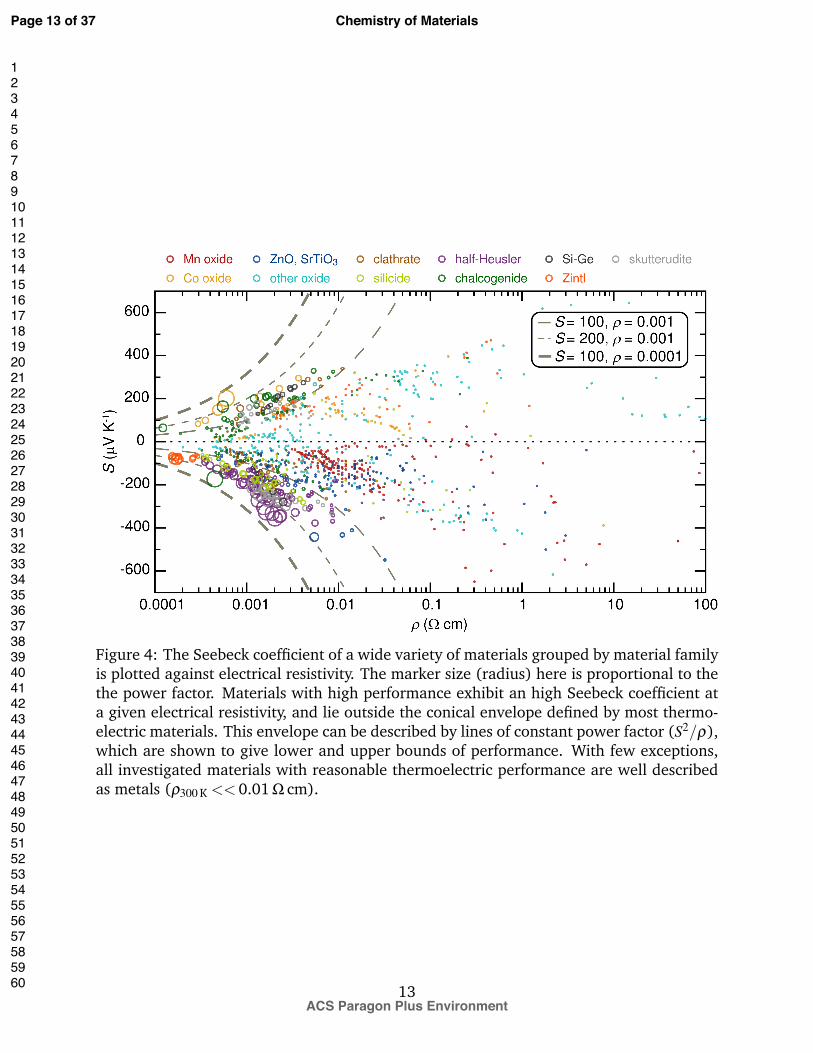
Figure 4: The Seebeck coefficient of a wide variety of materials grouped by material familyis plotted against electrical resistivity. The marker size (radius) here is proportional to thethe power factor. Materials with high performance exhibit an high Seebeck coefficient ata given electrical resistivity, and lie outside the conical envelope defined by most thermo-electric materials. This envelope can be described by lines of constant power factor (S
2/r),which are shown to give lower and upper bounds of performance. With few exceptions,all investigated materials with reasonable thermoelectric performance are well describedas metals (r300 K << 0.01 W cm).
13
Page 13 of 37
ACS Paragon Plus Environment
Chemistry of Materials
123456789101112131415161718192021222324252627282930313233343536373839404142434445464748495051525354555657585960
was first introduced in a previous report.28 Here we enhance it by assigning a color to
a family of related materials. Although the axes are similar to those for a Jonker plot
(where Seebeck coefficient is plotted vs. electrical conductivity) the application is quite
distinct. Jonker plots are usually employed to examine the effect of changing the carrier
concentration in a single material.17,29
Looking at the data as a whole, general envelope of materials is cone-like, widening
at higher electrical resistivities (figure 4). The best materials clearly define the left-most
edges of the envelope. All the high-performance materials have interesting physics that
make them special, even when looking only at the these two properties. Specifically, mate-
rials with metallic behavior generally have low Seebeck coefficients, but high-performance
thermoelectric materials violate this principle. For example, band asymmetry or high
band degeneracy near the Fermi level in BiTe- and PbTe-based systems leads to an un-
usually high Seebeck coefficient, despite their metallic behavior.5,30 Likewise, even though
Nax
CoO2 is metallic, with polycrystalline samples having r300 K ⇡0.002 W cm, the corre-
lated behavior of electrons and spin contribution to thermopower–or, arguably, the unique
band structure–lead to a remarkably high Seebeck coefficient.31,32
Looking at the ensemble of data (figure 4) also provides insight about particular fami-
lies of materials. For example, we find that optimizing non-metallic moderate-performance
materials is unlikely to lead to dramatic gains in performance, as the electrical resistivity is
too high. For example, CaMnO3-based systems remain a topic of intense study, but when
viewed in the context of all materials, their placement in the map suggests it is unlikely
that high performance will ever be reached.
It was previously shown that room-temperature thermoelectric properties (Seebeck
coefficient and electrical resistivity) of several high-performance thermoelectric materi-
als clustered in one area of the thermoelectric map (figure 4) when compared with low-
performance materials.28 Here we suggest that the relationship between the properties at
room-temperature and the properties at the temperature of highest zT for a small set of
14
Page 14 of 37
ACS Paragon Plus Environment
Chemistry of Materials
123456789101112131415161718192021222324252627282930313233343536373839404142434445464748495051525354555657585960
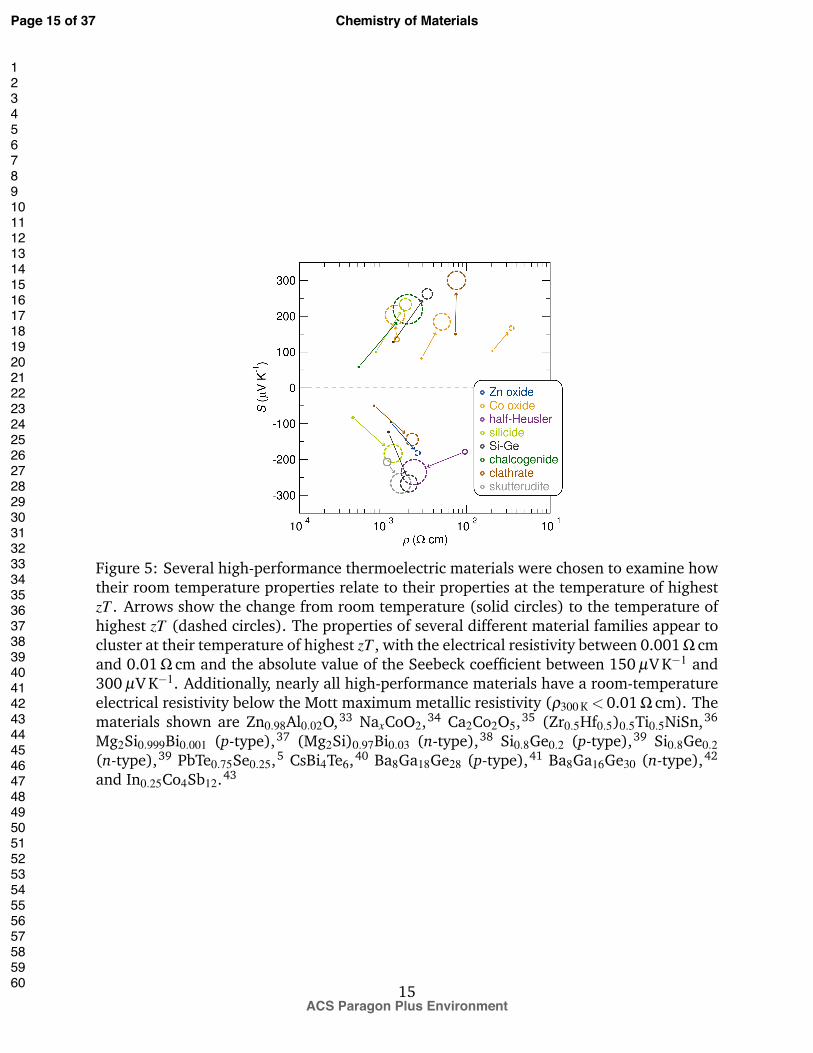
Figure 5: Several high-performance thermoelectric materials were chosen to examine howtheir room temperature properties relate to their properties at the temperature of highestzT . Arrows show the change from room temperature (solid circles) to the temperature ofhighest zT (dashed circles). The properties of several different material families appear tocluster at their temperature of highest zT , with the electrical resistivity between 0.001 W cmand 0.01 W cm and the absolute value of the Seebeck coefficient between 150 µV K�1 and300 µV K�1. Additionally, nearly all high-performance materials have a room-temperatureelectrical resistivity below the Mott maximum metallic resistivity (r300 K <0.01 W cm). Thematerials shown are Zn0.98Al0.02O,33 Na
x
CoO2,34 Ca2Co2O5,35 (Zr0.5Hf0.5)0.5Ti0.5NiSn,36
Mg2Si0.999Bi0.001 (p-type),37 (Mg2Si)0.97Bi0.03 (n-type),38 Si0.8Ge0.2 (p-type),39 Si0.8Ge0.2(n-type),39 PbTe0.75Se0.25,5 CsBi4Te6,40 Ba8Ga18Ge28 (p-type),41 Ba8Ga16Ge30 (n-type),42
and In0.25Co4Sb12.43
15
Page 15 of 37
ACS Paragon Plus Environment
Chemistry of Materials
123456789101112131415161718192021222324252627282930313233343536373839404142434445464748495051525354555657585960
mid- and high-temperature thermoelectric materials (figure 5). Interestingly, the proper-
ties of several different material families appear to cluster at their temperature of high-
est zT , with the electrical resistivity between 0.001 W cm and 0.01 W cm and the absolute
value of the Seebeck coefficient between 150 µV K�1 and 300 µV K�1.. Although the small
dataset prevents any strong conclusions, examining more materials may provide some
predictive ability of high-temperature properties, using those measured at room temper-
ature. Even some hints with regard to high-temperature properties would be powerful:
measurement of high temperature properties is time-consuming and requires specialized
instruments. Furthermore, there is much more room-temperature data available in the lit-
erature and a single room-temperature measurement could facilitate combinatorial testing
of a large phase space.44
The thermoelectric survey shown in figure 4 and the high-temperature trends observed
in figure 5 suggest that all thermoelectric materials with any appreciable performance are
all metallic, with an electrical resistivity well below the Mott maximum metallic resistiv-
ity at room temperature, i.e. r300 K < 0.01 W cm. This provides a valuable thermoelectric
screening criterion and guiding direction for future studies. Unlike intermetallic com-
pounds, which are generally metallic or semi-metallic, transition metal oxides span the
gamut of electrical resistivities, ranging from insulating (e.g. TiO2) to metallic (e.g. ReO3).
A common strategy to seeking effective thermoelectric oxides is to examine the metal/non-
metal border, i.e. proximal to the Mott minimum metallic conductivity, where Seebeck
coefficients are often substantial. However, the utility of this approach appears somewhat
questionable, given that the good thermoelectrics appear well on the metallic side.
Thermal conductivity
Over the past several decades, the majority of improvements in thermoelectric materials
have resulted from decreasing the lattice contribution to thermal conductivity. A num-
ber of materials selection guidelines have been identified in order to reduce the thermal
16
Page 16 of 37
ACS Paragon Plus Environment
Chemistry of Materials
123456789101112131415161718192021222324252627282930313233343536373839404142434445464748495051525354555657585960
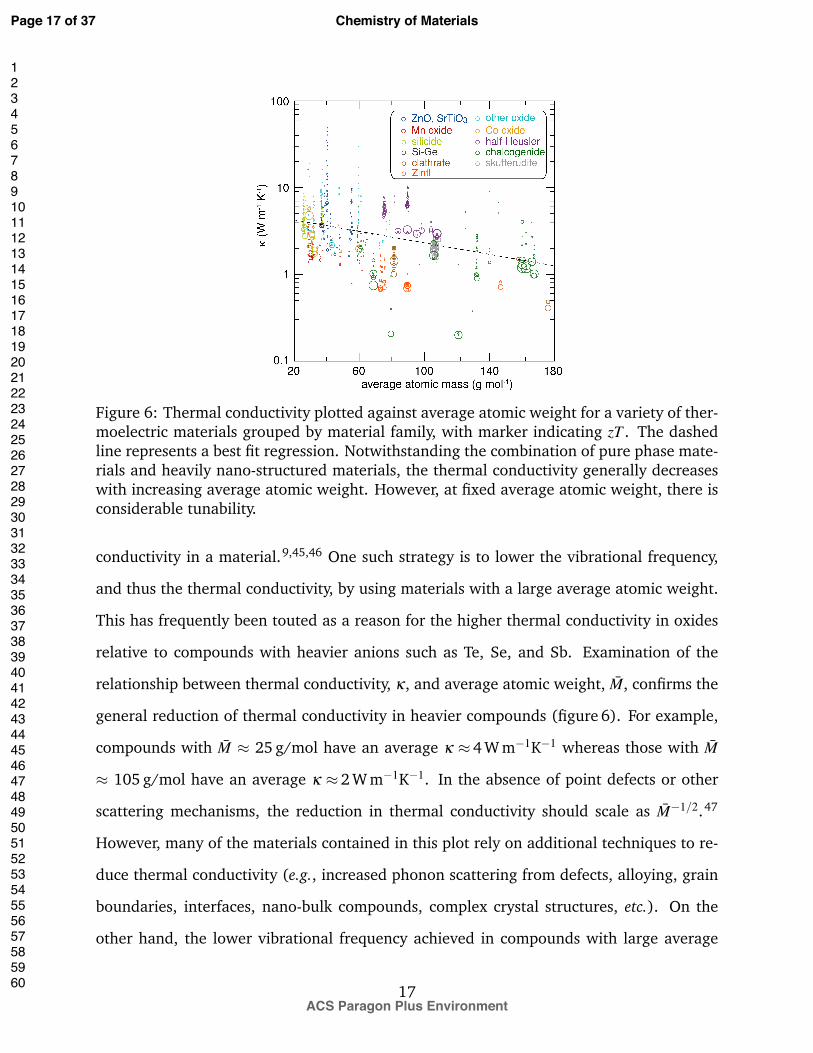
Figure 6: Thermal conductivity plotted against average atomic weight for a variety of ther-moelectric materials grouped by material family, with marker indicating zT . The dashedline represents a best fit regression. Notwithstanding the combination of pure phase mate-rials and heavily nano-structured materials, the thermal conductivity generally decreaseswith increasing average atomic weight. However, at fixed average atomic weight, there isconsiderable tunability.
conductivity in a material.9,45,46 One such strategy is to lower the vibrational frequency,
and thus the thermal conductivity, by using materials with a large average atomic weight.
This has frequently been touted as a reason for the higher thermal conductivity in oxides
relative to compounds with heavier anions such as Te, Se, and Sb. Examination of the
relationship between thermal conductivity, k, and average atomic weight, M̄, confirms the
general reduction of thermal conductivity in heavier compounds (figure 6). For example,
compounds with M̄ ⇡ 25 g/mol have an average k ⇡4 W m�1K�1 whereas those with M̄
⇡ 105 g/mol have an average k ⇡2 W m�1K�1. In the absence of point defects or other
scattering mechanisms, the reduction in thermal conductivity should scale as M̄
�1/2.47
However, many of the materials contained in this plot rely on additional techniques to re-
duce thermal conductivity (e.g., increased phonon scattering from defects, alloying, grain
boundaries, interfaces, nano-bulk compounds, complex crystal structures, etc.). On the
other hand, the lower vibrational frequency achieved in compounds with large average
17
Page 17 of 37
ACS Paragon Plus Environment
Chemistry of Materials
123456789101112131415161718192021222324252627282930313233343536373839404142434445464748495051525354555657585960
atomic weight has only a small impact on the electrical resistivity.
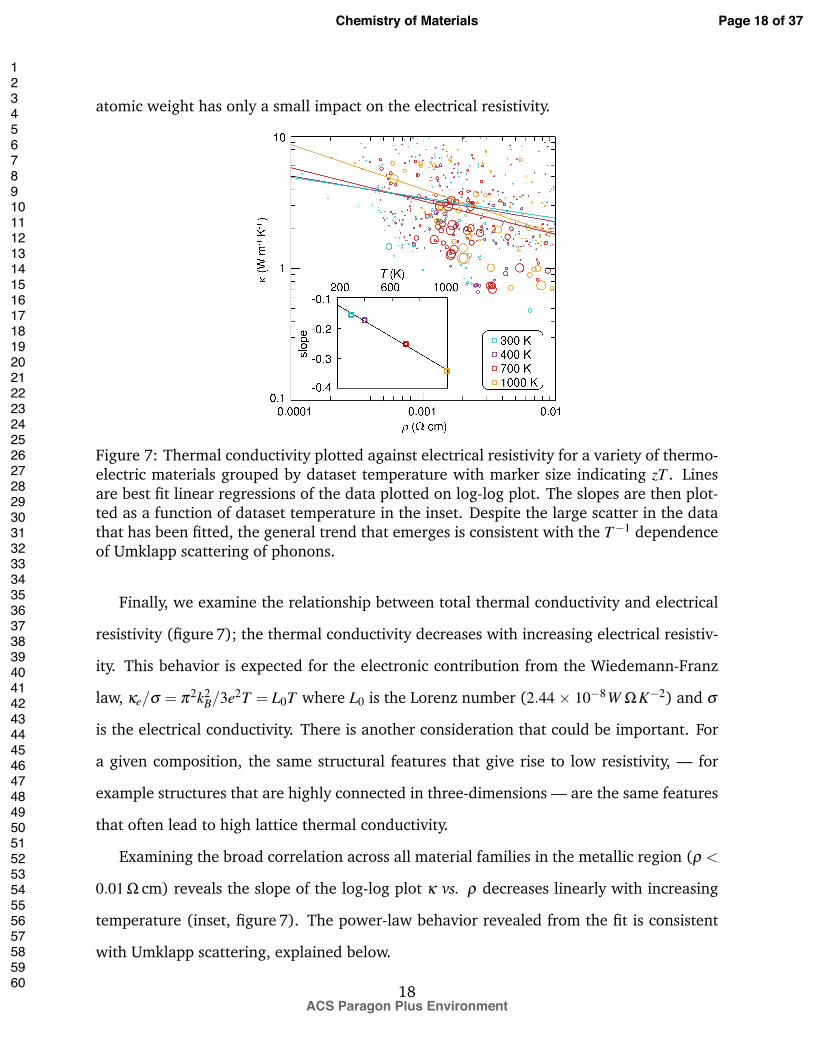
Figure 7: Thermal conductivity plotted against electrical resistivity for a variety of thermo-electric materials grouped by dataset temperature with marker size indicating zT . Linesare best fit linear regressions of the data plotted on log-log plot. The slopes are then plot-ted as a function of dataset temperature in the inset. Despite the large scatter in the datathat has been fitted, the general trend that emerges is consistent with the T
�1 dependenceof Umklapp scattering of phonons.
Finally, we examine the relationship between total thermal conductivity and electrical
resistivity (figure 7); the thermal conductivity decreases with increasing electrical resistiv-
ity. This behavior is expected for the electronic contribution from the Wiedemann-Franz
law, ke
/s = p2k
2B
/3e
2T = L0T where L0 is the Lorenz number (2.44 ⇥ 10�8
W WK
�2) and s
is the electrical conductivity. There is another consideration that could be important. For
a given composition, the same structural features that give rise to low resistivity, — for
example structures that are highly connected in three-dimensions — are the same features
that often lead to high lattice thermal conductivity.
Examining the broad correlation across all material families in the metallic region (r <
0.01 W cm) reveals the slope of the log-log plot k vs. r decreases linearly with increasing
temperature (inset, figure 7). The power-law behavior revealed from the fit is consistent
with Umklapp scattering, explained below.
18
Page 18 of 37
ACS Paragon Plus Environment
Chemistry of Materials
123456789101112131415161718192021222324252627282930313233343536373839404142434445464748495051525354555657585960
Examining correlations across many material families with disparate properties will
only provide general trends rather than precise values for a specific material family. Nev-
ertheless, there is insight in comparing the correlation (i.e. slope) at different temper-
atures. For example, while there is considerable scatter in the data at each tempera-
ture, the temperature dependence of the correlation is strongly linear (R
2 = 0.997), in
good agreement with the expected behavior as Umklapp scattering begins to dominate
at higher temperatures. The changing slope as a function of dataset temperature results
from increased phonon scattering lowering the phonon contribution to thermal conduc-
tivity at higher temperatures. When the lattice kl
is minimized, the electronic ke
dom-
inates, so changes in electrical resistivity have a larger impact on thermal conductivity.
The power dependence of temperature on k vs. r slope may result from the Umklapp
scattering, a three-phonon scattering process. According to the Bose-Einstein expression,
< n >= 1/(exp[¯hw/k
B
T ]� 1) ⇡ k
B
T/¯hw, the average phonon population, < n >, increases
with temperature which increases the likelihood of phonon-phonon scattering. In fact,
Grimvall47 has predicted a T
�1 temperature dependence for three-phonon scattering at
moderate temperatures (near the Debye temperature).
Resource considerations
In this section we review parameters beyond thermoelectric performance. We analyze re-
source considerations such as scarcity and supply risk of thermoelectric materials based on
their elemental composition. The implications of the analysis on the choice of thermoelec-
tric materials is discussed below. A combined analysis of performance and resource consid-
erations is necessary for identifying thermoelectric materials with the greatest promise of
widespread application. Scare elements could be employed in efforts to make high-impact
discoveries and to obtain better understanding of materials trends. However, when mate-
rials are meant for widespread deployment, the incorporation of scarce elements becomes
19
Page 19 of 37
ACS Paragon Plus Environment
Chemistry of Materials
123456789101112131415161718192021222324252627282930313233343536373839404142434445464748495051525354555657585960
an important point to consider during the design phase.
We begin by discussing scarcity which places a fundamental limit on the amount of
material available for use. The following section addresses HHI, a measure of geopolitical
influence. Abundance of raw materials is a key factor that determines cost, in addition
to other factors such as actuarial costs, packaging, transportation, and assembly, to name
a few. Technologies relying on scarce elements such as Re, Te, or Pt group metals, are
susceptible to large materials costs. For example, turbine engines consume 70% of the
world’s Re production, which drives the cost of Re.48 The cost of scarce materials can be
exacerbated when multiple technologies use the same element, such as the use of In for
transparent conducting oxides (TCO) and copper indium gallium selenide (CIGS) photo-
voltaics. Cost can also be high for relatively abundant materials where both the demand
and production are low, such as low purity Si.19
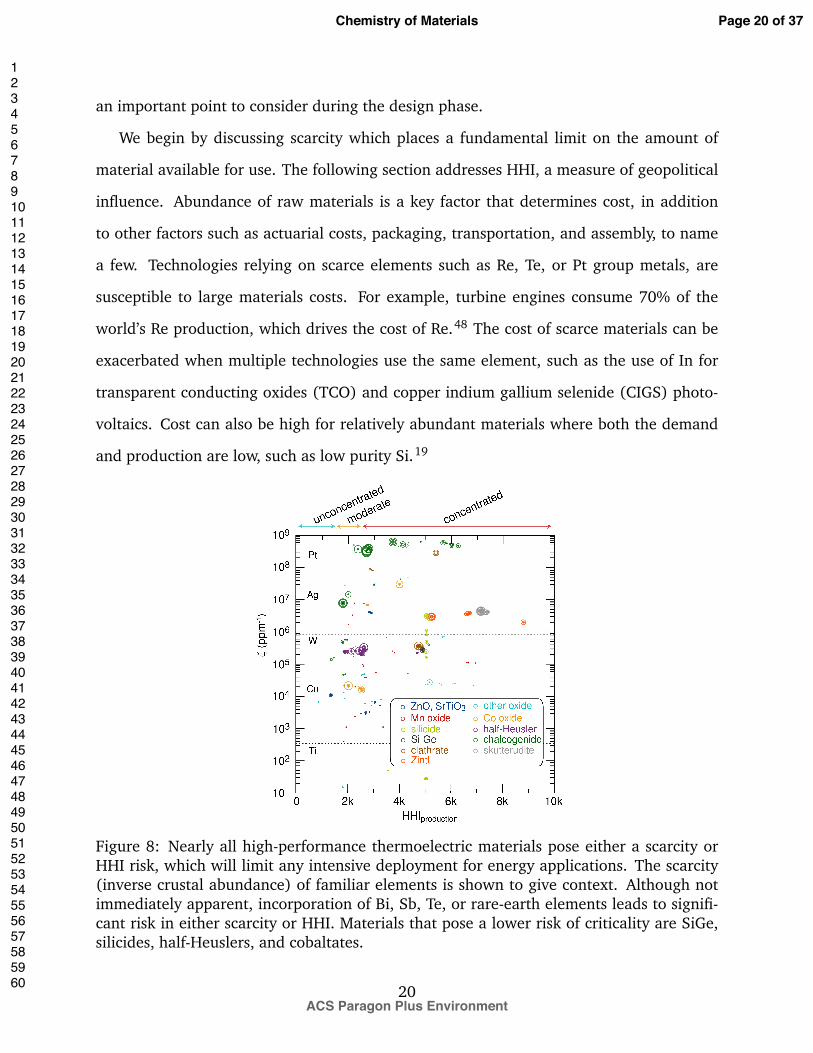
Figure 8: Nearly all high-performance thermoelectric materials pose either a scarcity orHHI risk, which will limit any intensive deployment for energy applications. The scarcity(inverse crustal abundance) of familiar elements is shown to give context. Although notimmediately apparent, incorporation of Bi, Sb, Te, or rare-earth elements leads to signifi-cant risk in either scarcity or HHI. Materials that pose a lower risk of criticality are SiGe,silicides, half-Heuslers, and cobaltates.
20
Page 20 of 37
ACS Paragon Plus Environment
Chemistry of Materials
123456789101112131415161718192021222324252627282930313233343536373839404142434445464748495051525354555657585960
Plotting scarcity against HHIP for thermoelectric materials is a useful tool to identify
technologies where materials cost can be a concern. About half of the highest efficiency
materials contain a large weight fraction of Te. (e.g. Be2Te3, PbTe, La3Te4, TAGS, Ag9TlTe5,
SbTe, or Tl9BiTe6.) Given that Te has one of the highest scarcity values, these materials
may pose problems for widespread deployment. Te may be rare, but its HHIP is not critical
because it is produced in many countries as a byproduct of Cu, reducing supply risks.
Additionally, with proper recycling and waste processing policies, Te could be recovered
and reprocessed, a practice already carried out by some photovoltaic companies.
An unanticipated finding from analysis of figure 8 was that incorporation of even small
amounts of scarce elements in otherwise Earth-abundant compounds may be problem-
atic. Mg2Si has a low scarcity of z = 27.3, but when doped with trace amounts of Bi
to Mg2Si0.993Bi0.007,37 z increases to 1.1⇥106 because of the extremely low crustal abun-
dance (0.025 ppm) and high atomic weight of Bi. Even 0.1% substitution of Bi on the Si
site results in a four orders of magnitude increase in z .
A compromise between performance and resource considerations is seen in oxide ma-
terials. Cobalt oxides, such as NaCo2O4, Ca2Co2O5, and Ca3Co4O9, as well as the reduced
ferroelectric oxide Sr0.61Ba0.39Nb2O6, have competitive zT values with scarcity values four
orders of magnitude lower than state-of-the-art chalcogenides, two orders of magnitude
lower than skutterudites (ACo4Sb12, A = caged atom) and Zintls (Zn4Sb3, Yb14MnSb11),
and one order of magnitude lower than clathrates (Ba8Ga18Ge28) and half-Heuslers (TiN-
iSn). ZnO and SrTiO3 are even more abundant, but have lower performance. It is worth
noting that, as with Mg2Si, if Bi is added to improve performance (e.g., Bi2Sr2Co2O8), a
dramatic increase in z is observed.
Determining the Herfindahl-Hirschman Index (HHI) for all elements has shown the
following elements to be most at risk for market abuse: Be, K, Br, Rb, Nb, Sb, Cs, W, the
rare-earth (RE) elements including Y, and the platinum group elements (PGE): Ru, Rh, Pd,
Os, Ir, Pt. These elements have HHI values of greater than 6000 in either production or
21
Page 21 of 37
ACS Paragon Plus Environment
Chemistry of Materials
123456789101112131415161718192021222324252627282930313233343536373839404142434445464748495051525354555657585960
reserves. As with scarcity, introduction of even small amounts of elements with high HHIP
or HHIR such as REs, Sb, or Tl, may not be justified for a marginal gain in performance.
Materials like Zintl or clathrate antimonides and rare-earth containing chalcogenides are
poor outliers compared to other thermoelectric materials in terms of HHIP risk.
The importance of HHI when considering thermoelectric materials can be illustrated
through recent price spikes in antimony. In 2011, a single country that was responsible for
nearly 90% of Sb mining halted much of its production. As a result, Sb prices rose over
15% in less than a year. While Sb is particularly concentrated, over 70% of elements ex-
ceed the 2500 threshold to be considered “highly concentrated” according to Federal Trade
Commission definition. This makes many thermoelectric materials sensitive to changing
market conditions. This analysis signals that emphasis should be placed on developing ma-
terials with a lower HHI. Examples of materials that have reasonable performance and low
HHI include S- and Se-containing chalcogenides, the half-Heusler materials low in Hf- and
Nb-content, and sodium cobalt oxides. Practical consideration of these criticality param-
eters, although not performance related, would benefit both material and experimental
design.
Future directions
Thermoelectric data mining provides insights, enabling rational material design. There
are, in addition to the properties described, a number of additional materials properties
and parameters that were not included that are nevertheless highly desired in comparing
different thermoelectric materials. For example, crystallographic data would allow for the
calculation of average atomic volume, unit cell volume, and number of atoms in the unit
cell. This could be valuable in looking at changes in thermal conductivity. Mechanical
properties, coefficients of thermal expansion, and high temperature stability indices would
be valuable in thermoelectric device design. Furthermore, additional non-performance re-
22
Page 22 of 37
ACS Paragon Plus Environment
Chemistry of Materials
123456789101112131415161718192021222324252627282930313233343536373839404142434445464748495051525354555657585960
lated parameters such as toxicity are of great interest in environmental and life-cycle anal-
yses of thermoelectric components. Some of these properties could be extracted from other
databases, measured, or approximated. Other properties, such as toxicity, are fundamen-
tally more challenging to obtain. A comprehensive approach to comparing toxicity across
compounds is not well established, since it depends on environmental transformations
and persistence, exposure route, form (e.g., oxidation state, presence of counter-ions), and
many other factors. Finally, adding a dimension of time to the plots we have shown may
increase their utility. For example, looking at the evolution of HHI over time may provide
a better ability to estimate risk and market volatility of particular materials.
The data-driven approach and visualization can be readily extended to other materi-
als functions. For example, photovoltaics, thermal barrier coatings, dielectrics, fuel cells,
transparent conducting oxides, gas turbine superalloys, and batteries are all areas of re-
search where progress depends on optimizing several competing requirements concur-
rently, that could benefit from a comprehensive, data-driven approach.
Closing remarks
The framework demonstrated here allows researchers obtain a birds-eye view of a large
domain of thermoelectrics research, and compare new materials of interest. The ther-
moelectric design space is large, and this overview of the field, including important non-
performance related parameters, allows researchers to focus on property regions and ma-
terial families best suited for a given application. In the case of power generation with
thermoelectrics, analysis of HHI, scarcity, and materials properties can be done visually.
Using the methods shown here, we highlight several families of materials that combine
good performance-related properties with non-critical resource availability: highly con-
ductive (electrically) early transition metal oxides, silicides with low bismuth content, and
half-Heuslers. We also observe that all high-zT materials are found in the metallic con-
23
Page 23 of 37
ACS Paragon Plus Environment
Chemistry of Materials
123456789101112131415161718192021222324252627282930313233343536373839404142434445464748495051525354555657585960
duction region 0.001 W cm to 0.01 W cm. This visualization framework is also valuable
from a design perspective, where it serves as a useful guide to identifying promising new
materials.
Acknowledgement
We thank the National Science Foundation for support of this research through NSF-DMR
1121053. RS acknowledges useful discussions with Ambuj Singh. MWG thanks the Nat-
ural Sciences and Engineering Council of Canada for support through a NSERC Postgrad-
uate Scholarship and the US Department of State for an International Fulbright Science
& Technology Award. The research at Harvard was supported by the Office of Naval Re-
search through contract N000141110894 and by the Harvard University Center for the
Environment.
24
Page 24 of 37
ACS Paragon Plus Environment
Chemistry of Materials
123456789101112131415161718192021222324252627282930313233343536373839404142434445464748495051525354555657585960
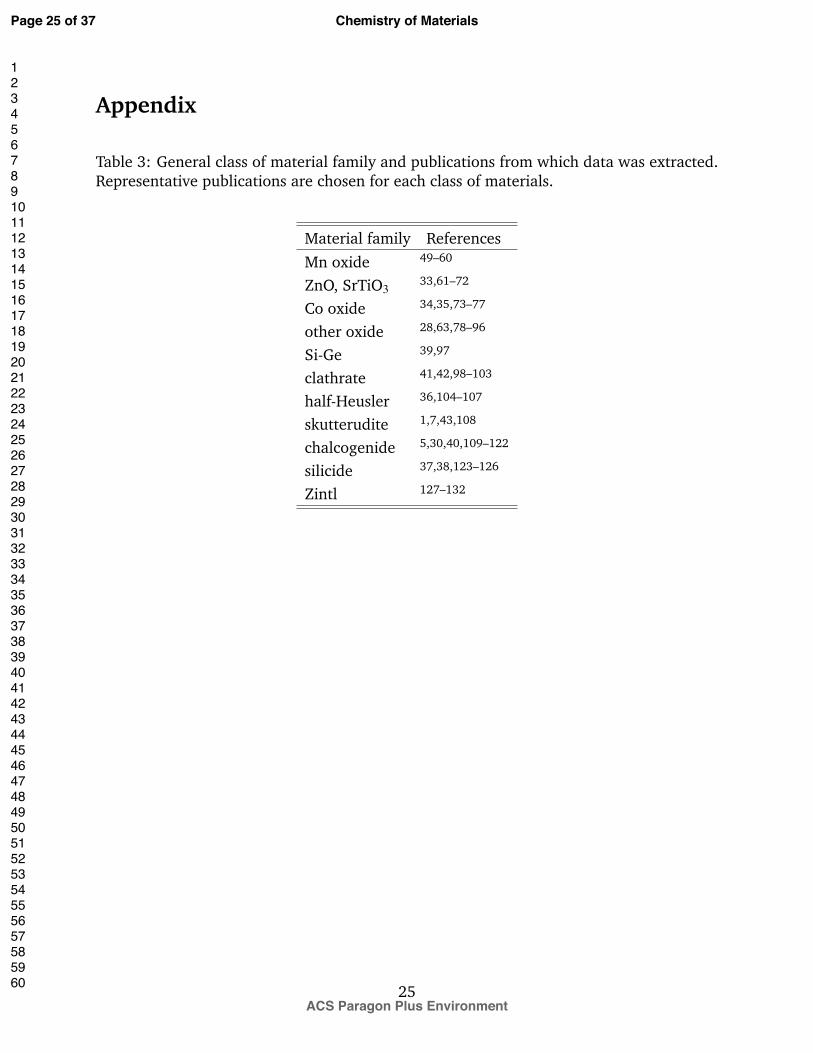
Appendix
Table 3: General class of material family and publications from which data was extracted.Representative publications are chosen for each class of materials.
Material family ReferencesMn oxide 49–60
ZnO, SrTiO333,61–72
Co oxide 34,35,73–77
other oxide 28,63,78–96
Si-Ge 39,97
clathrate 41,42,98–103
half-Heusler 36,104–107
skutterudite 1,7,43,108
chalcogenide 5,30,40,109–122
silicide 37,38,123–126
Zintl 127–132
25
Page 25 of 37
ACS Paragon Plus Environment
Chemistry of Materials
123456789101112131415161718192021222324252627282930313233343536373839404142434445464748495051525354555657585960
References
[1] Sales, B. C.; Mandrus, D.; Williams, R. K. Science 1996, 272, 1325–1328.
[2] Hicks, L. D.; Dresselhaus, M. S. Phys. Rev. B 1993, 47, 12727–12731.
[3] Dresselhaus, M. S.; Chen, G.; Tang, M. Y.; Yang, R. G.; Lee, H.; Wang, D. Z.;
Ren, Z. F.; Fleurial, J. P.; Gogna, P. Adv. Mater. 2007, 19, 1043–1053.
[4] Kauzlarich, S. M.; Brown, S. R.; Snyder, G. J. Dalton Trans. 2007, 2099–2107.
[5] Pei, Y.; Shi, X.; LaLonde, A.; Wang, H.; Chen, L.; Snyder, G. J. Nature 2011, 473,
66–69.
[6] Hsu, K. F.; Loo, S.; Guo, F.; Chen, W.; Dyck, J. S.; Uher, C.; Hogan, T.; Polychro-
niadis, E. K.; Kanatzidis, M. G. Science 2004, 303, 818–821.
[7] Biswas, K.; Good, M. S.; Roberts, K. C.; Subramanian, M. A.; Hendricks, T. J. J.
Mater. Res. 2011, 26, 1827–1835.
[8] Biswas, K.; He, J.; Blum, I. D.; Wu, C.-I.; Hogan, T. P.; Seidman, D. N.; Dravid, V. P.;
Kanatzidis, M. G. Nature 2012, 489, 414–418.
[9] Snyder, G. J.; Toberer, E. S. Nat. Mater. 2008, 7, 105–114.
[10] Nolas, G. S.; Sharp, J.; Goldsmid, H. J. Thermoelectrics : Basic principles and new
materials developments; Springer series in materials science 45; Springer: Berlin ;
New York, 2001; p 292.
[11] Goldsmid, H. J. Introduction to thermoelectricity; Springer: Heidelberg, 2009.
[12] Rowe, D. M. CRC Handbook of thermoelectrics; CRC Press: Boca Raton, FL, 1995.
[13] Rowe, D. M. Thermoelectrics handbook: Macro to nano; CRC press: Boca Raton, FL,
2006.
26
Page 26 of 37
ACS Paragon Plus Environment
Chemistry of Materials
123456789101112131415161718192021222324252627282930313233343536373839404142434445464748495051525354555657585960
[14] Bucholz, E. W.; Kong, C. S.; Marchman, K. R.; Sawyer, W. G.; Phillpot, S. R.; Sin-
nott, S. B.; Rajan, K. Tribol. Lett. 2012, 47, 211–221.
[15] Kong, C. S.; Villars, P.; Iwata, S.; Rajan, K. Comput. Sci. Discovery 2012, 5, 015004.
[16] Curtarolo, S.; Hart, G. L. W.; Nardelli, M. B.; Mingo, N.; Sanvito, S.; Levy, O. Nature
Materials 2013, 12, 191–201.
[17] Jonker, G. H. Philips Res. Rep. 1968, 23, 131–138.
[18] Graedel, T. E. Annu. Rev. Mater. Res. 2011, 41, 323–335.
[19] Homm, G.; Klar, P. J. Phys. Status Solidi RRL 2011, 5, 324–331.
[20] Herfindahl, O. C. Concentration in the US Steel Industry. Ph.D. thesis, Columbia
University, 1950.
[21] Hirschman, A. O. National power and the structure of foreign trade; California Uni-
versity Press: Berkeley, 1980.
[22] Rosenau-Tornow, D.; Buchholz, P.; Riemann, A.; Wagner, M. Resour. Policy 2009,
34, 161–175.
[23] Fact Sheet: Rare Earth Oxides (REO); POLINARES Working Paper, 2012; Vol. 37.
[24] Huwaldt, J. A. Plot Digitizer. 2011; http://plotdigitizer.sourceforge.
net/.
[25] Tummers, B. DataThief III. 2006; http://datathief.org/.
[26] U.S. Department of Justice and the Federal Trade Commission, Horizontal merger
guidelines; 2010.
[27] Haynes, W., Ed. CRC Handbook of chemistry and physics, 93rd ed.; CRC Press: Boca
Raton, FL, 2012.
27
Page 27 of 37
ACS Paragon Plus Environment
Chemistry of Materials
123456789101112131415161718192021222324252627282930313233343536373839404142434445464748495051525354555657585960
[28] Gaultois, M. W.; Barton, P. T.; Birkel, C. S.; Misch, L. M.; Rodriguez, E. E.;
Stucky, G. D.; Seshadri, R. J. Phys.: Condens. Matter 2013, 25, 186004.
[29] Bak, T.; Nowotny, J. J. Phys. Chem. C 2011, 115, 9746–9752.
[30] Heremans, J. P.; Jovovic, V.; Toberer, E. S.; Saramat, A.; Kurosaki, K.; Charoen-
phakdee, A.; Yamanaka, S.; Snyder, G. J. Science 2008, 321, 554–557.
[31] Koshibae, W.; Tsutsui, K.; Maekawa, S. Phys. Rev. B 2000, 62, 6869–6872.
[32] Singh, D. J.; Kasinathan, D. J. Electron. Mater. 2007, 36, 736–739.
[33] Tsubota, T.; Ohtaki, M.; Eguchi, K.; Arai, H. J. Mater. Chem. 1997, 7, 85–90.
[34] Fujita, K.; Mochida, T.; Nakamura, K. Jpn. J. Appl. Phys., Part 1 2001, 40, 4644–
4647.
[35] Funahashi, R.; Matsubara, I.; Ikuta, H.; Takeuchi, T.; Mizutani, U.; Sodeoka, S. Jpn.
J. Appl. Phys., Part 2 2000, 39, L1127–L1129.
[36] Sakurada, S.; Shutoh, N. Appl. Phys. Lett. 2005, 86, 082105.
[37] Bux, S. K.; Yeung, M. T.; Toberer, E. S.; Snyder, G. J.; Kaner, R. B.; Fleurial, J. P. J.
Mater. Chem. 2011, 21, 12259–12266.
[38] Fukano, M.; Iida, T.; Makino, K.; Akasaka, M.; Oguni, Y.; Takanashi, Y. MRS Proc.
2007, 1044, 1044–U06–13.
[39] Vining, C. B.; Laskow, W.; Hanson, J. O.; Vanderbeck, R. R.; Gorsuch, P. D. J. Appl.
Phys. 1991, 69, 4333–4340.
[40] Chung, D. Y.; Hogan, T.; Brazis, P.; Rocci-Lane, M.; Kannewurf, C.; Bastea, M.;
Uher, C.; Kanatzidis, M. G. Science 2000, 287, 1024–1027.
28
Page 28 of 37
ACS Paragon Plus Environment
Chemistry of Materials
123456789101112131415161718192021222324252627282930313233343536373839404142434445464748495051525354555657585960
[41] Anno, H.; Hokazono, M.; Kawamura, M.; Nagao, J.; Matsubara, K. 21st Interna-
tional Conference on Thermoelectrics; 2002; pp 77–80.
[42] Toberer, E. S.; Christensen, M.; Iversen, B. B.; Snyder, G. J. Phys. Rev. B 2008, 77,
075203.
[43] He, T.; Chen, J. Z.; Rosenfeld, H. D.; Subramanian, M. A. Chem. Mater. 2006, 18,
759–762.
[44] Funahashi, R.; Mikami, M.; Urata, S.; Kitawaki, M.; Kouuchi, T.; Mizuno, K. Meas.
Sci. Technol. 2005, 16, 70–80.
[45] DiSalvo, F. J. Science 1999, 285, 703–706.
[46] Clarke, D. R. Surf. Coat. Technol. 2003, 163, 67–74.
[47] Grimvall, G. Thermophysical properties of materials, 1st ed.; Elsevier: Amsterdam,
1999.
[48] Naumov, A. Russ. J. Non-Ferrous Met. 2007, 48, 418–423.
[49] Lan, J.; Lin, Y.; Mei, A.; Nan, C.; Liu, Y.; Zhang, B.; Li, J. J. Mater. Sci. Technol. 2009,
25, 535–538.
[50] Park, J. W.; Kwak, D. H.; Yoon, S. H.; Choi, S. C. J. Alloys Compd. 2009, 487,
550–555.
[51] Populoh, S.; Trottmann, M.; Aguire, M. H.; Weidenkaff, A. J. Mater. Res. 2011, 26,
1947–1952.
[52] Zhou, Y. Q.; Matsubara, I.; Funahashi, R.; Xu, G. J.; Shikano, M. Mater. Res. Bull.
2003, 38, 341–346.
[53] Lan, J. L.; Lin, Y. H.; Fang, H.; Mei, A.; Nan, C. W.; Liu, Y.; Xu, S. L.; Peters, M. J.
Am. Ceram. Soc. 2010, 93, 2121–2124.
29
Page 29 of 37
ACS Paragon Plus Environment
Chemistry of Materials
123456789101112131415161718192021222324252627282930313233343536373839404142434445464748495051525354555657585960
[54] Flahaut, D.; Mihara, T.; Funahashi, R.; Nabeshima, N.; Lee, K.; Ohta, H.;
Koumoto, K. J. Appl. Phys. 2006, 100, 084911.
[55] Kobayashi, T.; Takizawa, H.; Endo, T.; Sato, T.; Shimada, M.; Taguchi, H.; Na-
gao, M. J. Solid State Chem. 1991, 92, 116–129.
[56] Sparks, T. D.; Gurlo, A.; Clarke, D. R. J. Mater. Chem. 2012, 22, 4631–4636.
[57] Flahaut, D.; Funahashi, R.; Lee, K.; Ohta, H.; Koumoto, K. 25th International Con-
ference on Thermoelectrics; 2006; pp 103–106.
[58] Hejtmanek, J.; Jirak, Z.; Marysko, M.; Martin, C.; Maignan, A.; Hervieu, M.;
Raveau, B. Phys. Rev. B 1999, 60, 14057–14065.
[59] Kobayashi, W.; Terasaki, I.; Mikami, M.; Funahashi, R.; Nomura, T.; Katsufuji, T. J.
Appl. Phys. 2004, 95, 6825–6827.
[60] Ohtaki, M.; Koga, H.; Tokunaga, T.; Eguchi, K.; Arai, H. J. Solid State Chem. 1995,
120, 105–111.
[61] Kim, K. H.; Shim, S. H.; Shim, K. B.; Niihara, K.; Hojo, J. J. Am. Ceram. Soc. 2005,
88, 628–632.
[62] Berardan, D.; Guilmeau, E.; Maignan, A.; Raveau, B. Solid State Commun. 2008,
146, 97–101.
[63] Guilmeau, E.; Maignan, A.; Martin, C. J. Electron. Mater. 2009, 38, 1104–1108.
[64] Hebert, S.; Flahaut, D.; Martin, C.; Lemonnier, S.; Noudem, J.; Goupil, C.; Maig-
nan, A.; Hejtmanek, J. Prog. Solid State Chem. 2007, 35, 457–467.
[65] Wang, Y.; Lee, K. H.; Ohta, H.; Koumoto, K. J. Appl. Phys. 2009, 105, 103701.
[66] Muta, H.; Kurosaki, K.; Yamanaka, S. J. Alloys Compd. 2003, 350, 292–295.
30
Page 30 of 37
ACS Paragon Plus Environment
Chemistry of Materials
123456789101112131415161718192021222324252627282930313233343536373839404142434445464748495051525354555657585960
[67] Park, K.; Ko, K. Y.; Seo, W. S.; Cho, W. S.; Kim, J. G.; Kim, J. Y. J. Eur. Ceram. Soc.
2007, 27, 813–817.
[68] Sonne, M.; van Nong, N.; He, Z.; Pryds, N.; Linderoth, S. 8th European Conference
on Thermoelectrics; 2010.
[69] Wang, N.; He, H. C.; Li, X. A.; Han, L.; Zhang, C. Q. J. Alloys Compd. 2010, 506,
293–296.
[70] Obara, H.; Yamamoto, A.; Lee, C. H.; Kobayashi, K.; Matsumoto, A.; Funahashi, R.
Jpn. J. Appl. Phys., Part 2 2004, 43, L540–L542.
[71] Muta, H.; Kurosaki, K.; Yamanaka, S. J. Alloys Compd. 2004, 368, 22–24.
[72] Jood, P.; Mehta, R. J.; Zhang, Y.; Peleckis, G.; Wang, X.; Siegel, R. W.; Borca-
Tasciuc, T.; Dou, S. X.; Ramanath, G. Nano Lett. 2011, 11, 4337–4342.
[73] Funahashi, R.; Shikano, M. Appl. Phys. Lett. 2002, 81, 1459–1461.
[74] Iwasaki, K.; Ito, T.; Nagasaki, T.; Arita, Y.; Yoshino, M.; Matsui, T. J. Solid State
Chem. 2008, 181, 3145–3150.
[75] Nan, J.; Wu, J.; Deng, Y.; Nan, C. W. Solid State Commun. 2002, 124, 243–246.
[76] Shikano, M.; Funahashi, R. Appl. Phys. Lett. 2003, 82, 1851–1853.
[77] Xu, G. J.; Funahashi, R.; Shikano, M.; Matsubara, I.; Zhou, Y. Q. Appl. Phys. Lett.
2002, 80, 3760–3762.
[78] Shin, W.; Murayama, N. Jpn. J. Appl. Phys., Part 2 1999, 38, L1336–L1338.
[79] Zhou, Y. Q.; Matsubara, I.; Funahashi, R.; Sodeoka, S. Mater. Lett. 2001, 51, 347–
350.
[80] Yasukawa, M.; Kuniyoshi, S.; Kono, T. Solid State Commun. 2003, 126, 213–216.
31
Page 31 of 37
ACS Paragon Plus Environment
Chemistry of Materials
123456789101112131415161718192021222324252627282930313233343536373839404142434445464748495051525354555657585960
[81] Yasukawa, M.; Murayama, N. J. Mater. Sci. Lett. 1997, 16, 1731–1734.
[82] Funahashi, R.; Mikami, M.; Urata, S.; Kouuchi, T.; Mizuno, K.; Chong, K. MRS Proc.
2003, 793, S3.3.
[83] Sanmathi, C. S.; Retoux, R.; Noudem, J. G. 26th International Conference on Ther-
moelectrics; 2007; pp 171–174.
[84] Choi, M. Y.; Kim, J. S. Phys. Rev. B 1999, 59, 192–194.
[85] Wang, C. X.; Chen, X. B.; Zhu, A. P. Solid State Commun. 2012, 152, 1067–1071.
[86] Takagi, H.; Batlogg, B.; Kao, H. L.; Kwo, J.; Cava, R. J.; Krajewski, J. J.; Peck, W. F.
Phys. Rev. Lett. 1992, 69, 2975–2978.
[87] Dong, X.; Wang, H.; Hua, Z.; Peng, S.; Dong, L.; Wang, Y. J. Mater. Sci.: Mater.
Electron. 2012, 23, 1210–1214.
[88] Kuriyama, H.; Nohara, M.; Sasagawa, T.; Takubo, K.; Mizokawa, T.; Kimura, K.;
Takagi, H. 25th International Conference on Thermoelectrics; 2006; pp 97–98.
[89] Ono, Y.; Satoh, K.; Nozaki, T.; Kajitani, T. 25th International Conference on Thermo-
electrics; 2006; pp 92–96.
[90] Tinh, N.; Tsuji, T. In Physics and Engineering of New Materials; Cat, D., Pucci, A.,
Wandelt, K., Eds.; Springer Berlin Heidelberg, 2009; Vol. 127; pp 209–217.
[91] Maignan, A.; Eyert, V.; Martin, C.; Kremer, S.; Fresard, R.; Pelloquin, D. Phys. Rev.
B 2009, 80, 115103.
[92] Muta, H.; Kurosaki, K.; Uno, M.; Yamanaka, S. J. Alloys Compd. 2002, 335, 200–
202.
[93] Kurosaki, K.; Kobayashi, H.; Yamanaka, S. J. Alloys Compd. 2003, 350, 340–343.
32
Page 32 of 37
ACS Paragon Plus Environment
Chemistry of Materials
123456789101112131415161718192021222324252627282930313233343536373839404142434445464748495051525354555657585960
[94] Lee, S.; Wilke, R. H. T.; Trolier-McKinstry, S.; Zhang, S.; Randall, C. A. Appl. Phys.
Lett. 2010, 96, 031910.
[95] Lee, S.; Dursun, S.; Duran, C.; Randall, C. A. J. Mater. Res. 2011, 26, 26–30.
[96] Sakai, A.; Kanno, T.; Takahashi, K.; Omote, A.; Adachi, H.; Yamada, Y. J. Am. Ceram.
Soc. 2012, 95, 1750–1755.
[97] Joshi, G.; Lee, H.; Lan, Y.; Wang, X.; Zhu, G.; Wang, D.; Gould, R. W.; Cuff, D. C.;
Tang, M. Y.; Dresselhaus, M. S.; Chen, G.; Ren, Z. Nano Letters 2008, 8, 4670–4674.
[98] Saramat, A.; Svensson, G.; Palmqvist, A. E. C.; Stiewe, C.; Mueller, E.; Platzek, D.;
Williams, S. G. K.; Rowe, D. M.; Bryan, J. D.; Stucky, G. D. J. Appl. Phys. 2006, 99,
023708.
[99] Wolfing, B.; Kloc, C.; Teubner, J.; Bucher, E. Phys. Rev. Lett. 2001, 86, 4350–4353.
[100] Candolfi, C.; Aydemir, U.; Baitinger, M.; Oeschler, N.; Steglich, F.; Grin, Y. J. Appl.
Phys. 2012, 111, 043706.
[101] Nolas, G. S.; Cohn, J. L.; Slack, G. A.; Schujman, S. B. Appl. Phys. Lett. 1998, 73,
178–180.
[102] Kuznetsov, V. I.; Kuznetsova, L. A.; Kaliazin, A. E.; Rowe, D. M. 18th International
Conference on Thermoelectrics; 1999; pp 177–180.
[103] Roudebush, J. H.; Toberer, E. S.; Hope, H.; Snyder, G. J.; Kauzlarich, S. M. J. Solid
State Chem. 2011, 184, 1176–1185.
[104] Katsuyama, S.; Matsushima, H.; Ito, M. J. Alloys Compd. 2004, 385, 232–237.
[105] Kimura, Y.; Tamura, Y.; Kita, T. Appl. Phys. Lett. 2008, 92, 012105.
[106] Muta, H.; Kanemitsu, T.; Kurosaki, K.; Yamanaka, S. J. Alloys Compd. 2009, 469,
50–55.
33
Page 33 of 37
ACS Paragon Plus Environment
Chemistry of Materials
123456789101112131415161718192021222324252627282930313233343536373839404142434445464748495051525354555657585960
[107] Shutoh, N.; Sakurada, S. J. Alloys Compd. 2005, 389, 204–208.
[108] Fleurial, J. P.; Borshchevsky, A.; Caillat, T.; Morelli, D. T.; Meisner, G. P. 15th Inter-
national Conference on Thermoelectrics; 1996; pp 91–95.
[109] Scherrer, H.; Scherrer, S. In CRC Handbook of thermoelectrics; Rowe, D. M., Ed.; CRC
Press: Boca Raton, FL, 1995.
[110] Skrabek, E. A.; Trimmer, D. S. In CRC Handbook of thermoelectrics; Rowe, D. M.,
Ed.; CRC Press: Boca Raton, FL, 1995.
[111] Chung, D. Y.; Choi, K. S.; Iordanidis, L.; Schindler, J. L.; Brazis, P. W.; Kan-
newurf, C. R.; Chen, B. X.; Hu, S. Q.; Uher, C.; Kanatzidis, M. G. Chem. Mater.
1997, 9, 3060–3071.
[112] Gascoin, F.; Maignan, A. Chem. Mater. 2011, 23, 2510–2513.
[113] Kurosaki, K.; Kosuga, A.; Yamanaka, S. J. Alloys Compd. 2003, 351, 208–211.
[114] Ohta, M.; Yamamoto, A.; Obara, H. J. Electron. Mater. 2010, 39, 2117–2121.
[115] Wan, C. L.; Wang, Y. F.; Wang, N.; Koumoto, K. Materials 2010, 3, 2606–2617.
[116] Kanatzidis, M. G.; McCarthy, T. J.; Tanzer, T. A.; Chen, L. H.; Iordanidis, L.;
Hogan, T.; Kannewurf, C. R.; Uher, C.; Chen, B. X. Chem. Mater. 1996, 8, 1465–
1474.
[117] McGuire, M. A.; Reynolds, T. K.; DiSalvo, F. J. Chem. Mater. 2005, 17, 2875–2884.
[118] Kurosaki, K.; Kosuga, A.; Muta, H.; Uno, M.; Yamanaka, S. Appl. Phys. Lett. 2005,
87, 061919.
[119] Sharp, J. W.; Sales, B. C.; Mandrus, D. G.; Chakoumakos, B. C. Appl. Phys. Lett.
1999, 74, 3794–3796.
34
Page 34 of 37
ACS Paragon Plus Environment
Chemistry of Materials
123456789101112131415161718192021222324252627282930313233343536373839404142434445464748495051525354555657585960
[120] Liu, H. L.; Shi, X.; Xu, F. F.; Zhang, L. L.; Zhang, W. Q.; Chen, L. D.; Li, Q.; Uher, C.;
Day, T.; Snyder, G. J. Nat. Mater. 2012, 11, 422–425.
[121] May, A. F.; Flage-Larsen, E.; Snyder, G. J. Phys. Rev. B 2010, 81, 125205.
[122] Raghavendra, N.; Gascoin, F.; Takahashi, H.; Hebert, S.; Guilmeau, E.; Terasaki, I.
Thermoelectric Properties of Hollandite Chalcogenides AM5X8. Presented at EMRS
2012 Spring Meeting, Strasbourg, France, May 15–17.
[123] Mars, K.; Ihou-Mouko, H.; Pont, G.; Tobola, J.; Scherrer, H. J. Electron. Mater. 2009,
38, 1360–1364.
[124] Zhang, Q.; Zhao, X. B.; Yin, H.; Zhu, T. J. J. Alloys Compd. 2008, 464, 9–12.
[125] Ito, M.; Tada, T.; Hara, S. J. Alloys Compd. 2006, 408-412, 363–367.
[126] Akasaka, M.; Iida, T.; Nemoto, T.; Soga, J.; Sato, J.; Makino, K.; Fukano, M.;
Takanashi, Y. J. Cryst. Growth 2007, 304, 196–201.
[127] Brown, S. R.; Kauzlarich, S. M.; Gascoin, F.; Snyder, G. J. Chem. Mater. 2006, 18,
1873–1877.
[128] Caillat, T.; Fleurial, J. P.; Borshchevsky, A. J. Phys. Chem. Solids 1997, 58, 1119–
1125.
[129] Kitagawa, H.; Noguchi, H.; Kiyabu, T.; Itoh, M.; Noda, Y. J. Phys. Chem. Solids 2004,
65, 1223–1227.
[130] Toberer, E. S.; Rauwel, P.; Gariel, S.; Tafto, J.; Snyder, G. J. J. Mater. Chem. 2010,
20, 9877–9885.
[131] Zevalkink, A.; Toberer, E. S.; Zeier, W. G.; Flage-Larsen, E.; Snyder, G. J. Energy
Environ. Sci. 2011, 4, 510–518.
35
Page 35 of 37
ACS Paragon Plus Environment
Chemistry of Materials
123456789101112131415161718192021222324252627282930313233343536373839404142434445464748495051525354555657585960
[132] Toberer, E. S.; Zevalkink, A.; Crisosto, N.; Snyder, G. J. Adv. Funct. Mater. 2010, 20,
4375–4380.
36
Page 36 of 37
ACS Paragon Plus Environment
Chemistry of Materials
123456789101112131415161718192021222324252627282930313233343536373839404142434445464748495051525354555657585960
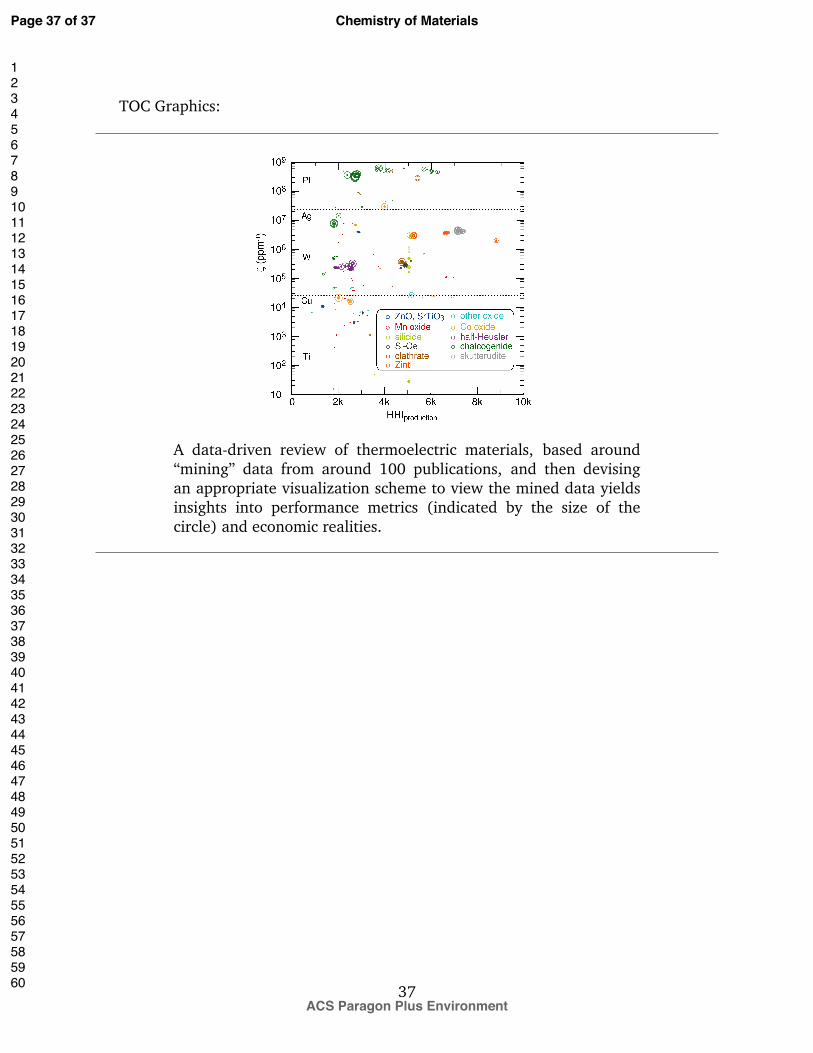
TOC Graphics:
A data-driven review of thermoelectric materials, based around“mining” data from around 100 publications, and then devisingan appropriate visualization scheme to view the mined data yieldsinsights into performance metrics (indicated by the size of thecircle) and economic realities.
37
Page 37 of 37
ACS Paragon Plus Environment
Chemistry of Materials
123456789101112131415161718192021222324252627282930313233343536373839404142434445464748495051525354555657585960