Embed Size (px)
Citation preview
A Comparison of Volumetric Workflows – LP360, PhotoScan and Pix4D
Lewis Graham Page 1 of 12 AirGon LLC April 3, 2017 www.AirGon.com
Lewis Graham
April 3, 2017
Introduction:
In the last quarter of 2016, we introduced (under our AirGon brand) the Bring Your Own Drone (BYOD)
Mapping Kit. This kit contains all the software one needs to turn a low-cost drone such as a Phantom 4
Pro or an Inspire 2 with x4s camera into a serious mapping platform.
Our presales technical team is sometimes asked the question “My application is fairly simple volumetric
computations. If I have Pix4D or PhotoScan, why do I also need LP360?” My folks asked me for a quick
summary to use when discussing this topic. I think it is a pretty good question and worthy of adding to
our general discussion papers. This discussion is rather extensive but it does contain a summary
workflow capabilities table at the end (Table 1).
The quick answer is somewhat similar to the question – “I am going to routinely overhaul engines. I
have this nice adjustable wrench I can make fit just about anything. Why do I need this set of wrenches,
sockets, extensions….?” All of us who have done a bit of mechanical or home work would laugh at this
question. We know that the difficulty of a job is inversely related to the quality of one’s tools (in fact,
the job is often our excuse for getting that new tool we have been wanting!). Doing analytic workflows
is analogous – you may get the job done without the proper tools but it is going to be painful, long,
involve a number of choice “plumbing words” and the finished product may be more than a bit rough
round the edges. Folks who care about time and quality get the proper tools for the job.
The Process:
In the detailed comparison of tools, I will be discussing basic stockpile computations only. Neither Pix4D
nor PhotoScan have the tools necessary to do volumetric differencing such as earthworks cut and fill or
borrow pit computations. This is not a criticism of these products – their core function is point cloud
and ortho generation, not analytic tools.
Neither Pix4D or PhotoScan have tools for earthworks cut & fill or borrow pit computations.
Computing volumes using a point cloud derived from dense image matching (DIM) involves a number of
steps. These steps include:
Horizontal and vertical accuracy testing
Removing vertical bias (if you are referencing the stockpile toes to a datum)
Removing low noise and related point cleaning
Digitizing toes
Quality Check (QC) of the toe placement
Defining the base surface

A Comparison of Volumetric Workflows – LP360, PhotoScan and Pix4D
Lewis Graham Page 2 of 12 AirGon LLC April 3, 2017 www.AirGon.com
Removal of non-pile overhead points (e.g. conveyors)
Computing volumes
Final QC
Wow, that is a lot of steps just to compute a volume!! Yes, it is but they are all necessary if your goal is
consistency between measurement epochs. One of the big complaints we hear from mining companies
is that the volumetric computations of static piles changes from month to month!
There are no serious tools in most point cloud generation software packages to do point cloud accuracy
testing (they certainly have robust tools for checking the photogrammetry but lack in the area of
product accuracy assessment). There are some basic tools for doing point classification (marking points
that should not be included in the computations) but they tend to be extremely tedious. For example,
cleaning low points is a fairly quick process in LP360 – the Low Noise automatic task followed by a quick
QC using the dynamic profile view. These tools are not present in the DIM generation software, not
even a dynamic profile viewing tool (something I consider a requirement for point cloud accuracy
assessment).
But let’s say that you have made it to the point of creating toes and computing volumes. How does the
experience differ between the available tools? Let’s first discuss how volumes are computed. Figure 1
depicts the generalized construction of a volume computation. The basic idea is to compute the volume
between a defined “base” and “hull” (the surface such as a gravel pile). The perimeter of the
computation is typically called the “toe” when performing stockpile volumetrics.
Figure 1: Volume Computations
The hull is usually straightforward – it is typically defined by the points that reside on the surface of the
pile, within the perimeter of the toe. The base is the more complex component of a volumetric
definition. It is generally defined by one of the following approaches:
Hull
Base
Toe

A Comparison of Volumetric Workflows – LP360, PhotoScan and Pix4D
Lewis Graham Page 3 of 12 AirGon LLC April 3, 2017 www.AirGon.com
Use the 3D vertices of the toe
Use a planar surface
Use a constraint model surface (so-called “breaklines” and mass points)
Use a second point cloud (for differentials such as borrow pits, cut & fill)
The first two are the simpler cases and both are supported by Pix4D, PhotoScan and LP360. The third
and fourth are more advanced algorithms and are supported only by LP360.
The most common simple approach to volumetrics is to define the base using the vertices of the toe
polygon. The most generalized implementation is to triangulate the vertices of the toe. If the
computation package supports 3D toes then the base formed by this triangulated surface is a set of
edge-matched 3D triangles. A less accurate approach is to define either a horizontal or sloped planar
surface using either a defined elevation value (“Z”) or some averaging of the elevation values of the toe
vertices.
To illustrate the various methods of defining a base, consider the simple stockpile depicted in Figure 2.
Here I have drawn a properly defined 3D toe using the automatic stockpile toe extractor in LP360 (this
tool alone is reason enough to add LP360 to your toolkit!). Note in the profile view in the lower portion
of Figure 2 that the elevation of the base of the stockpile changes. In this view, it is lower at point B
than point A.
Figure 2: A simple stockpile on a sloped surface
A Comparison of Volumetric Workflows – LP360, PhotoScan and Pix4D
Lewis Graham Page 4 of 12 AirGon LLC April 3, 2017 www.AirGon.com
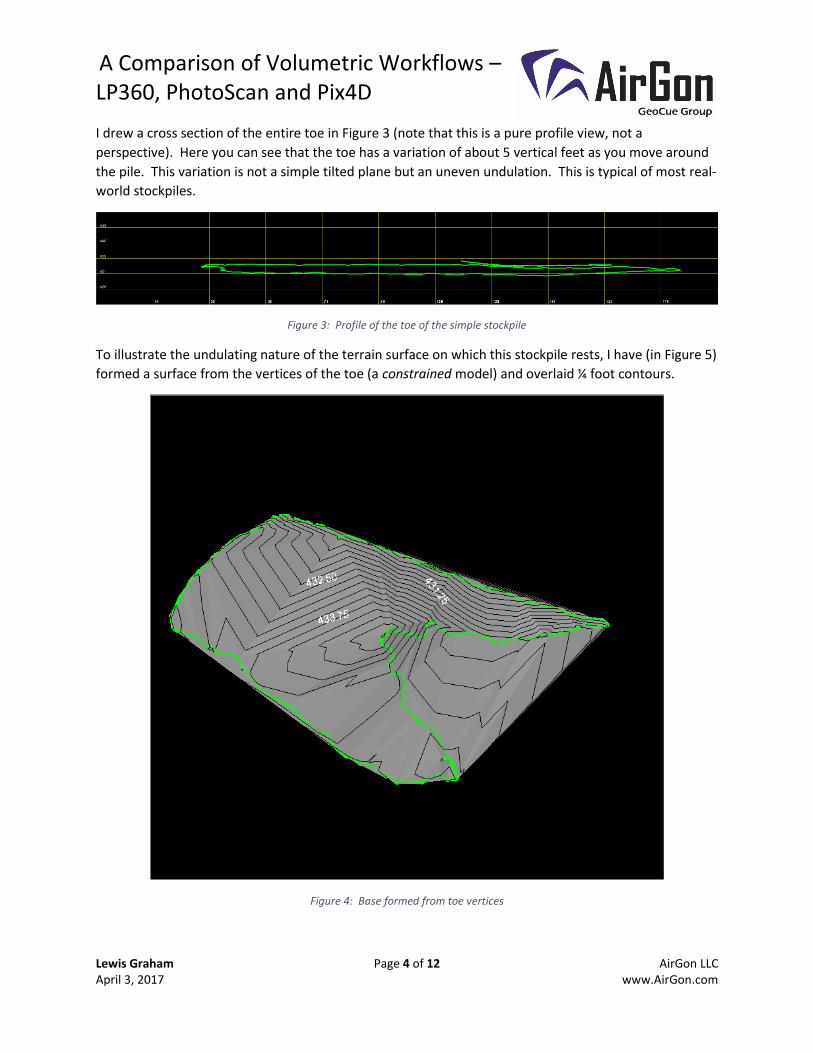
I drew a cross section of the entire toe in Figure 3 (note that this is a pure profile view, not a
perspective). Here you can see that the toe has a variation of about 5 vertical feet as you move around
the pile. This variation is not a simple tilted plane but an uneven undulation. This is typical of most real-
world stockpiles.
Figure 3: Profile of the toe of the simple stockpile
To illustrate the undulating nature of the terrain surface on which this stockpile rests, I have (in Figure 5)
formed a surface from the vertices of the toe (a constrained model) and overlaid ¼ foot contours.
Figure 4: Base formed from toe vertices
A Comparison of Volumetric Workflows – LP360, PhotoScan and Pix4D
Lewis Graham Page 5 of 12 AirGon LLC April 3, 2017 www.AirGon.com
With this background, let’s have a look at computing volumes in the three packages.
PhotoScan:
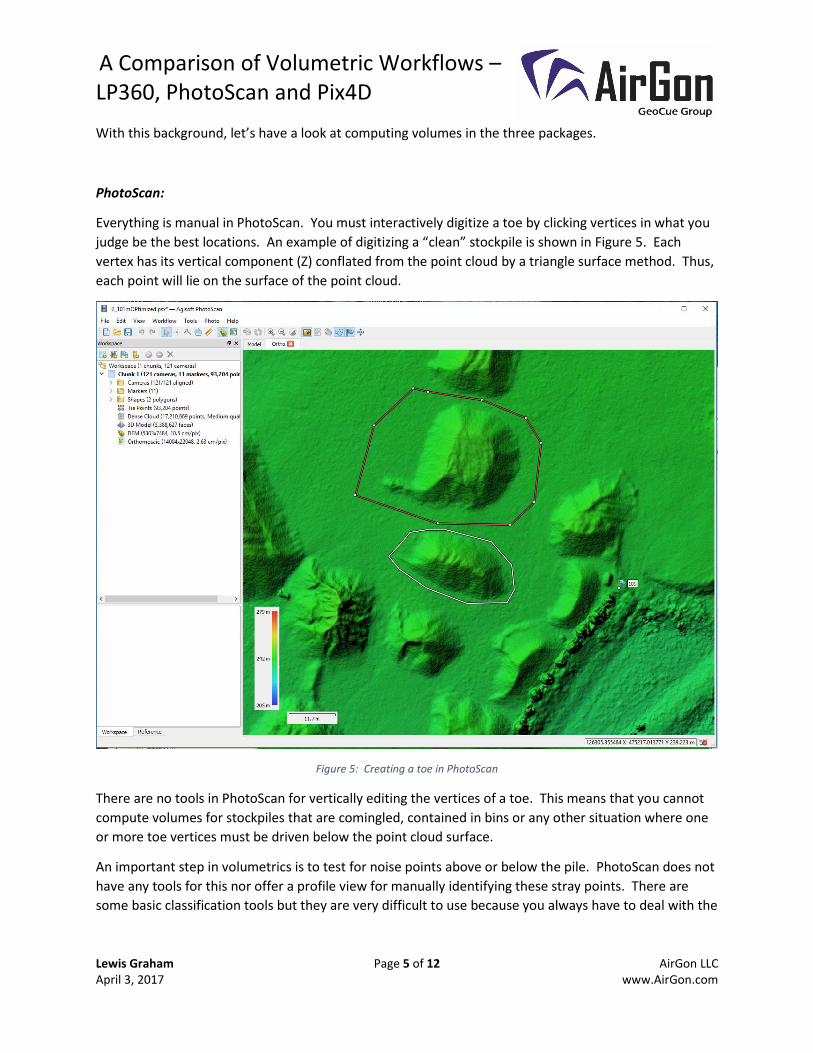
Everything is manual in PhotoScan. You must interactively digitize a toe by clicking vertices in what you
judge be the best locations. An example of digitizing a “clean” stockpile is shown in Figure 5. Each
vertex has its vertical component (Z) conflated from the point cloud by a triangle surface method. Thus,
each point will lie on the surface of the point cloud.
Figure 5: Creating a toe in PhotoScan
There are no tools in PhotoScan for vertically editing the vertices of a toe. This means that you cannot
compute volumes for stockpiles that are comingled, contained in bins or any other situation where one
or more toe vertices must be driven below the point cloud surface.
An important step in volumetrics is to test for noise points above or below the pile. PhotoScan does not
have any tools for this nor offer a profile view for manually identifying these stray points. There are
some basic classification tools but they are very difficult to use because you always have to deal with the
A Comparison of Volumetric Workflows – LP360, PhotoScan and Pix4D
Lewis Graham Page 6 of 12 AirGon LLC April 3, 2017 www.AirGon.com
entire point cloud. This is not a criticism of PhotoScan; it is a point cloud/ortho generation tool, not an
exploitation environment.
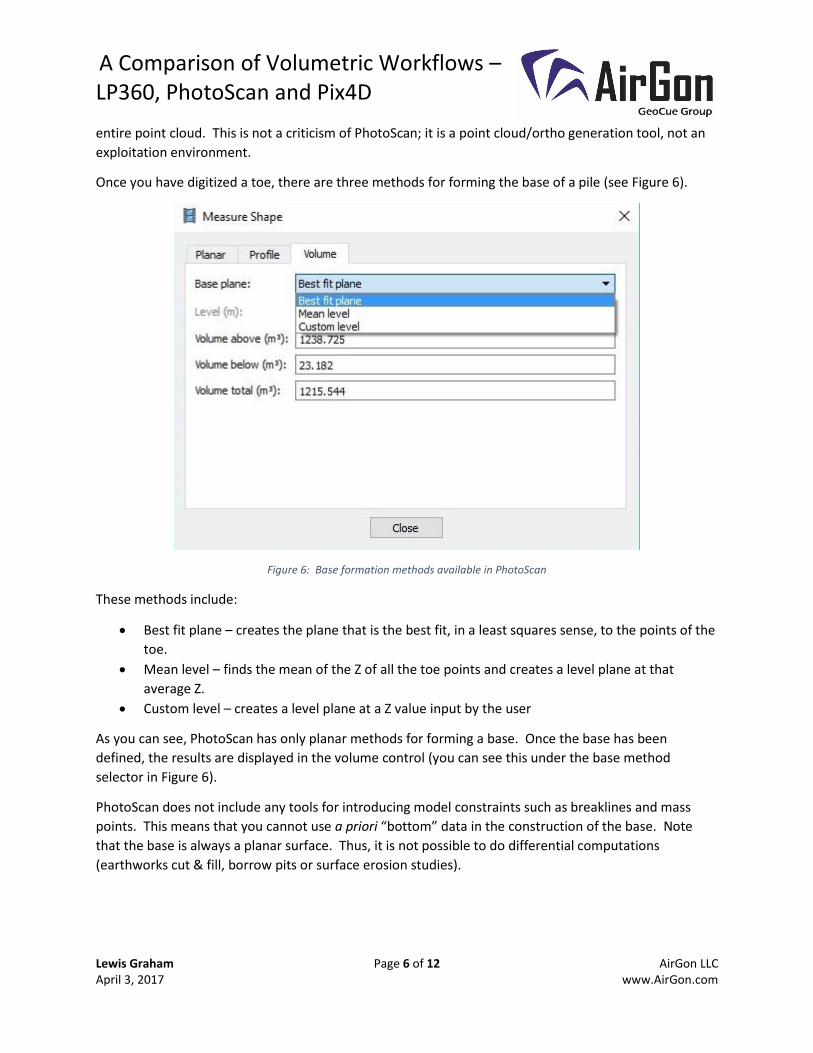
Once you have digitized a toe, there are three methods for forming the base of a pile (see Figure 6).
Figure 6: Base formation methods available in PhotoScan
These methods include:
Best fit plane – creates the plane that is the best fit, in a least squares sense, to the points of the
toe.
Mean level – finds the mean of the Z of all the toe points and creates a level plane at that
average Z.
Custom level – creates a level plane at a Z value input by the user
As you can see, PhotoScan has only planar methods for forming a base. Once the base has been
defined, the results are displayed in the volume control (you can see this under the base method
selector in Figure 6).
PhotoScan does not include any tools for introducing model constraints such as breaklines and mass
points. This means that you cannot use a priori “bottom” data in the construction of the base. Note
that the base is always a planar surface. Thus, it is not possible to do differential computations
(earthworks cut & fill, borrow pits or surface erosion studies).

A Comparison of Volumetric Workflows – LP360, PhotoScan and Pix4D
Lewis Graham Page 7 of 12 AirGon LLC April 3, 2017 www.AirGon.com
So, that’s it for PhotoScan. For each pile in the project, you draw the toe, select the computational
method for forming a base and either store the volumes as attributes on an exportable shape file or
cut/paste into Excel.
Pix4D:
Pix4D is also a completely manual environment for computing volumes. In fact, it only differs from
PhotoScan by including several additional base computation methods.
As in PhotoScan, you digitize a toe by clicking each vertex at your best guess of the proper location (an
example is shown in Figure 7). Inspecting and cleaning points prior to volumetric computation is much
the same as PhotoScan. You have only the single 3D view to manipulate and an interactive tool to
reclassify points.
Also like PhotoScan, Pix4D does not have tools for vertically editing toe vertices. Thus, you cannot
correctly compute volumes for piles where one or more toe vertices must be placed below the point
cloud surface (piles abutting banks, piles in bins, comingled piles – in general, most real world
stockpiles!).
Figure 7: A toe in Pix4D

A Comparison of Volumetric Workflows – LP360, PhotoScan and Pix4D
Lewis Graham Page 8 of 12 AirGon LLC April 3, 2017 www.AirGon.com
Pix4D includes more base definition methods than does PhotoScan. These are shown in Figure 8. The
first of these is Triangulated. This forms the base by forming a TIN of the toe vertices (similar to the
surface shown in Figure 4). The remaining methods are planer surface techniques. Pix4D expands on
the selections of PhotoScan by adding the ability to set a horizontal plane at the maximum or minimum
toe elevations. These are basically shortcuts since one can achieve the same result by using the Custom
Altitude method, keying these values in.
Figure 8: Base methods in Pix4D
The result of the volume computation is shown in the Volume dialog (Figure 7). You must then cut and
paste to your reporting application.
Like PhotoScan, the base cannot be a second point cloud nor are there tools to introduce model
constraints (breaklines, mass points). Thus, one cannot do differential volumetrics or use a priori
“bottom” data.
LP360:
PhotoScan and Pix4D are tools primarily aimed at creating point clouds from imagery and orthophotos.
They are not intended to be analytic extraction tools. LP360, on the other hand, is aimed at analytic
data processing – it does not have tools for generating the point cloud. Thus, it accepts data from either
A Comparison of Volumetric Workflows – LP360, PhotoScan and Pix4D
Lewis Graham Page 9 of 12 AirGon LLC April 3, 2017 www.AirGon.com
PhotoScan or Pix4D (or any other point cloud/ortho generator) and provides a robust set of analytic
tools.
The total volumetric workflow in LP360 includes tools for:
Measuring horizontal and vertical accuracy of the point cloud and the ortho. It is not possible to
do accurate differential volumes if the two data sets have different offsets from the datum.
Automatic and manual tools for removing noise points.
Profile view of data for manually locating noise points and (more importantly) editing out
overhead structures such as conveyors. There is also a 3D view that can be windowed in on a
stockpile.
Automatic toe digitization. This feature alone is the reason to add LP360 to your product
portfolio, even if you are only doing very simple stockpiles on a flat surface. A single mouse click
and you have the complete 3D toe! This feature saves about 2 hours of time on a very clean, 40
pile site. On complex sites, it can save literally days of work.
Automatic removal of overhead points. This is part of the automatic toe digitizing tool. The
algorithm looks for points above the pile such as conveyors and classifies these points out of the
set of points being used for volume computations.
Robust toe editing tools. These include tools for automatically “conflating” vertices to the point
cloud surface, to a plane or to linear interpolation while digitizing. The edit environment allows
you to dynamically view the vertical placement of vertices while editing. This is necessary when
modeling comingled piles or piles in bins or against walls. There are also tools that allow
splitting a toe or trimming areas where the toe is not conformant to the pile.
Feature Analyst – this is a comprehensive tool for quickly inspecting a toe. It will show
indicators of possible model defects such as a large vertical slope (which usually indicates that
the toes is moving up over the pile instead of conforming to the base).
Model Constraints – LP360 allows the introduction of multiple sources of model constraints in
the form of points, polylines and polygons (so-called “breaklines” and mass points). This allows
you to create base data from pre-existing surveys. Another important use for model constraints
is supplementing the point cloud by introducing survey points from RTK “pogo” surveying in
areas where the point cloud is weak such as vegetation.
Differential Volumetrics – the tools in LP360 for actual volume computations allow the use of a
point cloud model for both the surface and the base. Both surfaces can feature model
constraints. This capability enables computing how a volume changes between two or more
surveys. The most common use is for borrow pit and construction cut & fill computations.
There are also some nice convenience features such as created results in units other than the
units of measure (for example, reporting volumes in cubic yards when the map units are
meters).
The volumetric workflows in LP360 have been informed by both the service work we do internally as
well as input from our users. As of this writing, we are completely caught up on volumetrics (a rare
thing in software development!). We have no current customer requests in this area that are not
implemented in our most recent release (2017.1).

A Comparison of Volumetric Workflows – LP360, PhotoScan and Pix4D
Lewis Graham Page 10 of 12 AirGon LLC April 3, 2017 www.AirGon.com
Summary:
The basic summary is that Pix4D and PhotoScan are point cloud/ortho generation tools. They are
extremely good at this, some of the best tools in the industry. However, while each have basic tools for
doing a bit of a wide variety of tasks, they are not analytic environments (and were not intended to be).
Any point cloud workflow will require an analytic tool kit such as LP360. Thus I hope you can see that
LP360 does not compete with these tools; it simply provides the next step in an overall point cloud
processing workflow.
Nevertheless, I have constructed a summary comparison table of features necessary for a complete
volumetric analysis toolkit in Table 1.
Table 1: A comparison of Volumetric Analysis tools
Pix4D PhotoScan LP360
Global Horizontal and Vertical Accuracy testing √
Noise removal tools √
Profile view for inspection and classification √
Basic interactive classification tools √ √ √
Interactive toe digitizing √ √ √
Automatic toe creation √
Force toe vertices above or below surface √
Toe editing tools (move, split, form, …) √
Toe analysis tools such as slope, curvature √
Automatic reclassification of overhead points √
Support for model constraints (breaklines, mass points) √
Ability to use a second point cloud as the base (differential volumes such as borrow pits, cut & fill)
√
Batch processing of all volumes √
As you can see from this report, the tools in PhotoScan and Pix4D can be used to manually digitize a
simple toe and compute a volume based on a TIN (in the case of Pix4D) or planar surface (both
products), one pile at a time. If you have a typical stockpile situation of comingled or binned piles, a
priori model constraints, overhead structures, intruding vegetation and so forth, you will not be able to
successfully compute volumes using these base tools.
One of the best real world examples of the effectiveness of using the right tool for the job is a customer
we have in the pulp wood processing business. They measure the volume of their main wood chip
feeder stock pile on a monthly basis. When they first engaged with us, they were using Pix4D for both
creating the point cloud model and computing the volume. They were extremely frustrated with the
process of trying to compute the toe and exclude the overhead structures. They were spending over 8
hours trying to model this single pile (excluding the point cloud processing time!). Even after this large

A Comparison of Volumetric Workflows – LP360, PhotoScan and Pix4D
Lewis Graham Page 11 of 12 AirGon LLC April 3, 2017 www.AirGon.com
investment of time, they were not getting accurate volumes (this was during the time they were
transitioning to drone mapping so they had a parallel measuring activity that was being used as truth).
The main woodchip pile is shown in Figure 9. A single pass of LP360’s automatic toe extractor has been
run on the pile. This algorithm ran in 20 seconds. Note, in the profile section of the view, that the
overhead conveyor points were automatically reclassified to the “conveyor” class (areas still in grey are
outside of the toe). The toe needs a bit of editing in the grass area to the east and around the main
conveyor. The tools used for editing include the thinning tool and reshape tool. The total manual
editing time for this toe was about 6 minutes. Thus, this customer reduced their analysis time from over
8 hours to less than 10 minutes! In addition, after employing LP360 for cleanup and edit, their volumes
met expectation. This company has now transitioned their entire plant (including feeder stock log piles)
to drone-based volumetrics.
Figure 9: Wood chip pile after a single automatic pass of the LP360 toe extractor

A Comparison of Volumetric Workflows – LP360, PhotoScan and Pix4D
Lewis Graham Page 12 of 12 AirGon LLC April 3, 2017 www.AirGon.com
When performing analytic work, you are very concerned about both the time to perform the analytics
and the accuracy of the result. LP360 addresses both concerns better than any other tool currently on
the market.