Embed Size (px)
Citation preview
summaryThis case study compares the quantity and quality of dNa extracted using the Covaris truXTraC™ FFPe dNa kit to the QIaGeN® QIaamp® FFPe tissue kit. In the Covaris truXTraC workflow, the focused, short wavelength acoustic field generated by Covaris aFa allows for active paraffin removal without the use of organic solvents, and enables efficient tissue rehydration. This results in a highly simplified workflow, which ensures high yield extraction of nucleic acids. In the QIaGeN QIaamp workflow, paraffin is passively removed by Xylene or other proprietary solvents.
FFPe tissue sections from two different human tissue types were used and analyzed using the metrics of:
1. fluorescence microscopy of ffPe sections to determine the extent of paraffin embedding and removal
2. double stranded dna specific fluorescence assay utilizing Qubit® to determine the yield of double stranded dna
3. qPCr-based quality analysis utilizing a commercially available Human genomic dna Quantification and QC kit
4. whole genome sequencing on an illumina® Hiseq2500 to directly measure the representation of the genome in the extracted dna.
our data illustrate that the Covaris aFa technology for FFPe dNa extraction offers greater dNa extraction yield and significantly more robust and consistent whole genome sequencing results.
materials and metHodsTissue handlingFFPe kidney and uterus tissue blocks were stored at 4˚C upon delivery from
CHTN, and frozen matched tissues were stored at -80˚C. Prior to sectioning,
excess paraffin was trimmed from tissue blocks, and a microtome was used
to section tissue to 20 µm scrolls. 25 mg of the matched frozen tissue were
cut using a scalpel for dNa extraction.
Fluorescence microscopy after paraffin removal, samples were mounted on microscope slide (vWr)
and dried for at least 30 min. a fluorescent microscope (olympus model
IX73 with Fluorescence and eXI-bLu Camera) was used to record auto-
fluorescence of the paraffin remaining in the tissues after the removal
treatment.
DNA extraction and quantification (FFPE and fresh frozen tissue)Covaris truXTraC FFPe dNa kit was used with 20 µm sections according
to the kit protocol option C on even numbered sections. dNa from odd
numbered sections was extracted using QIaamp FFPe tissue kit according
to the kit protocol. dNa from matched frozen tissue was extraction using
QIaamp mini Kit, after cryofracturing the tissue using the Covaris CryoPrep.
DNA quantity normalizationIn order to obtain 5 µg of total dNa using the QIaGeN QIaamp FFPe tissue
kit, five 20 µm sections of kidney FFPe, and three sections of uterus tissue
were processed. For Covaris FFPe extraction, three kidney sections, and one
uterus sections were processed to achieve a 5 µg yield.
DNA concentration and quality assessmentThe concentration of extracted dNa was determined using the Qubit
Quant-it dsdNa br assay kit using either 5 or 10 µl of the extracted dNa
sample. qPCr quantification of the dNa, and quality assessment, was
carried out using KaPa® hgdNa Quantification and QC Kit according to the
supplier instructions.
Sequencing and data analysis5 µg of dNa from each sample type were submitted to elim
biopharmaceuticals Inc. for 2x100bp whole genome sequencing using
an Illumina HiSeq2500. reads were aligned using bW software package.
Coverage analysis of the aligned reads was carried out using bedTools
software package. Whole genome coverage analysis and viewing was
carried out using broad Institute’s IGv genome analysis software package.
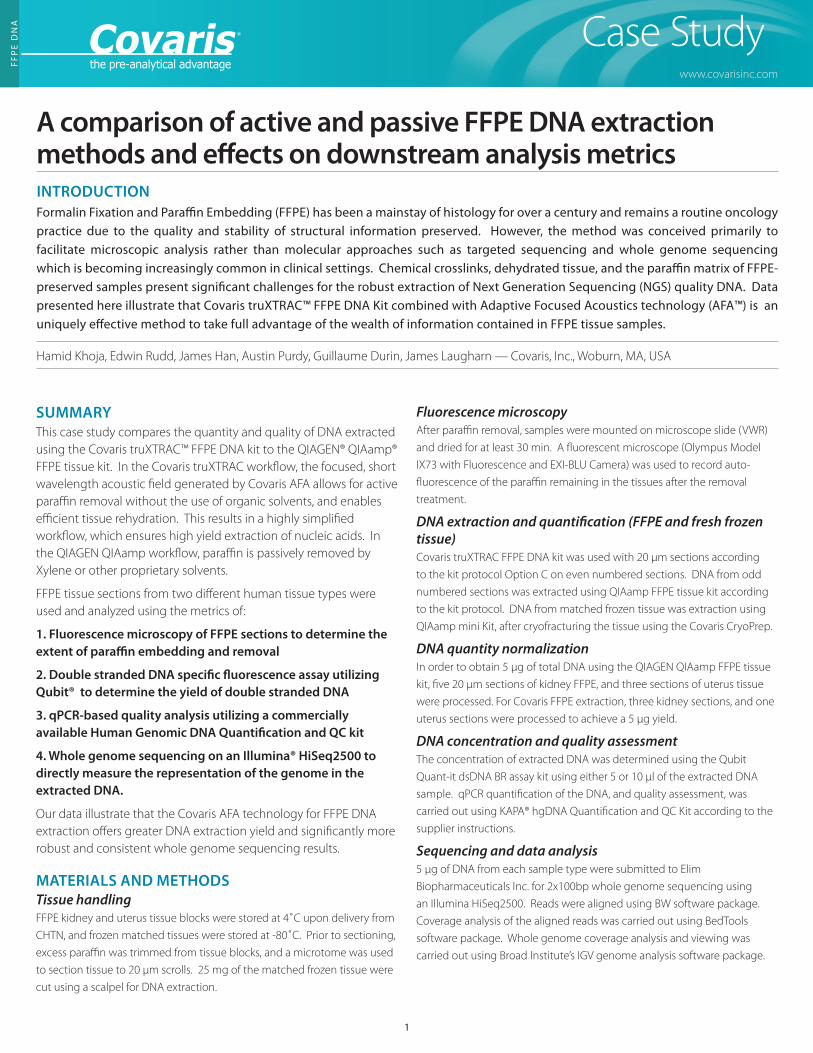
a comparison of active and passive ffPe dna extraction methods and effects on downstream analysis metricsintroduCtionFormalin Fixation and Paraffin Embedding (FFPE) has been a mainstay of histology for over a century and remains a routine oncology practice due to the quality and stability of structural information preserved. However, the method was conceived primarily to facilitate microscopic analysis rather than molecular approaches such as targeted sequencing and whole genome sequencing which is becoming increasingly common in clinical settings. Chemical crosslinks, dehydrated tissue, and the paraffin matrix of FFPE-preserved samples present significant challenges for the robust extraction of Next Generation Sequencing (NGS) quality DNA. Data presented here illustrate that Covaris truXTRAC™ FFPE DNA Kit combined with Adaptive Focused Acoustics technology (AFA™) is an uniquely effective method to take full advantage of the wealth of information contained in FFPE tissue samples.
Hamid Khoja, edwin rudd, James Han, austin Purdy, Guillaume durin, James Laugharn — Covaris, Inc., Woburn, ma, uSa
www.covarisinc.com
FF
PE
DN
A Case Study
1
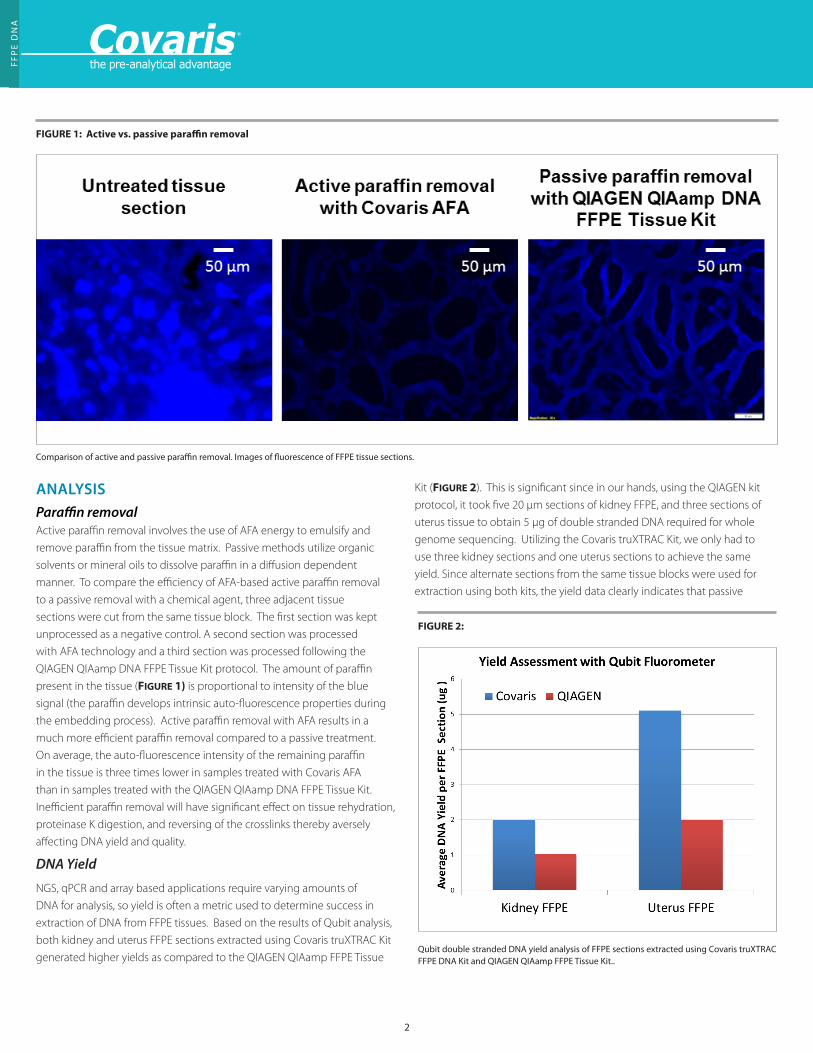
analysisParaffin removalactive paraffin removal involves the use of aFa energy to emulsify and
remove paraffin from the tissue matrix. Passive methods utilize organic
solvents or mineral oils to dissolve paraffin in a diffusion dependent
manner. To compare the efficiency of aFa-based active paraffin removal
to a passive removal with a chemical agent, three adjacent tissue
sections were cut from the same tissue block. The first section was kept
unprocessed as a negative control. a second section was processed
with aFa technology and a third section was processed following the
QIaGeN QIaamp dNa FFPe Tissue Kit protocol. The amount of paraffin
present in the tissue (Figure 1) is proportional to intensity of the blue
signal (the paraffin develops intrinsic auto-fluorescence properties during
the embedding process). active paraffin removal with aFa results in a
much more efficient paraffin removal compared to a passive treatment.
on average, the auto-fluorescence intensity of the remaining paraffin
in the tissue is three times lower in samples treated with Covaris aFa
than in samples treated with the QIaGeN QIaamp dNa FFPe Tissue Kit.
Inefficient paraffin removal will have significant effect on tissue rehydration,
proteinase K digestion, and reversing of the crosslinks thereby aversely
affecting dNa yield and quality.
DNA Yield
NGS, qPCr and array based applications require varying amounts of
dNa for analysis, so yield is often a metric used to determine success in
extraction of dNa from FFPe tissues. based on the results of Qubit analysis,
both kidney and uterus FFPe sections extracted using Covaris truXTraC Kit
generated higher yields as compared to the QIaGeN QIaamp FFPe Tissue
Kit (Figure 2). This is significant since in our hands, using the QIaGeN kit
protocol, it took five 20 µm sections of kidney FFPe, and three sections of
uterus tissue to obtain 5 µg of double stranded dNa required for whole
genome sequencing. utilizing the Covaris truXTraC Kit, we only had to
use three kidney sections and one uterus sections to achieve the same
yield. Since alternate sections from the same tissue blocks were used for
extraction using both kits, the yield data clearly indicates that passive
FIGURE 1: Active vs. passive paraffin removal
Comparison of active and passive paraffin removal. Images of fluorescence of FFPE tissue sections.
FIGURE 2:
Qubit double stranded DNA yield analysis of FFPE sections extracted using Covaris truXTRAC FFPE DNA Kit and QIAGEN QIAamp FFPE Tissue Kit..
FF
PE
DN
A
2
methods of dNa extraction from FFPe sections cannot maximize dNa
yield. This is likely due to inefficient paraffin removal and tissue rehydration,
rendering a significant portion of the tissue inaccessible for the extraction
reagents.
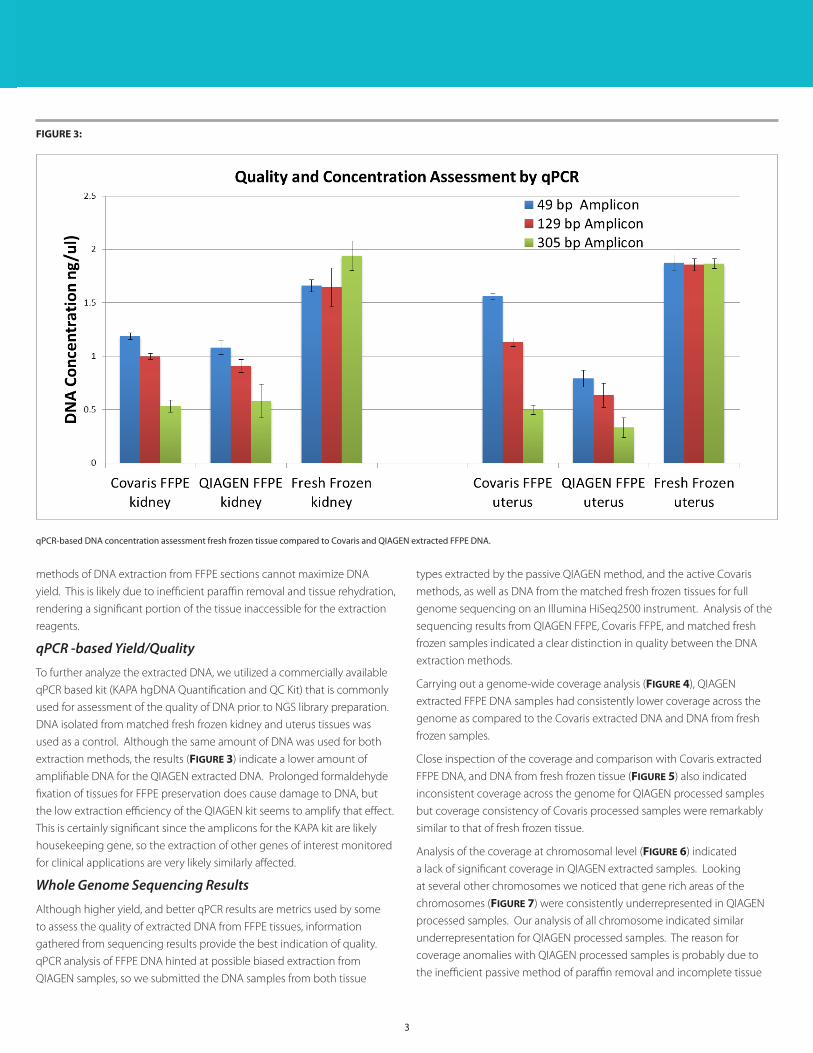
qPCR -based Yield/Quality
To further analyze the extracted dNa, we utilized a commercially available
qPCr based kit (KaPa hgdNa Quantification and QC Kit) that is commonly
used for assessment of the quality of dNa prior to NGS library preparation.
dNa isolated from matched fresh frozen kidney and uterus tissues was
used as a control. although the same amount of dNa was used for both
extraction methods, the results (Figure 3) indicate a lower amount of
amplifiable dNa for the QIaGeN extracted dNa. Prolonged formaldehyde
fixation of tissues for FFPe preservation does cause damage to dNa, but
the low extraction efficiency of the QIaGeN kit seems to amplify that effect.
This is certainly significant since the amplicons for the KaPa kit are likely
housekeeping gene, so the extraction of other genes of interest monitored
for clinical applications are very likely similarly affected.
Whole Genome Sequencing Results
although higher yield, and better qPCr results are metrics used by some
to assess the quality of extracted dNa from FFPe tissues, information
gathered from sequencing results provide the best indication of quality.
qPCr analysis of FFPe dNa hinted at possible biased extraction from
QIaGeN samples, so we submitted the dNa samples from both tissue
types extracted by the passive QIaGeN method, and the active Covaris
methods, as well as dNa from the matched fresh frozen tissues for full
genome sequencing on an Illumina HiSeq2500 instrument. analysis of the
sequencing results from QIaGeN FFPe, Covaris FFPe, and matched fresh
frozen samples indicated a clear distinction in quality between the dNa
extraction methods.
Carrying out a genome-wide coverage analysis (Figure 4), QIaGeN
extracted FFPe dNa samples had consistently lower coverage across the
genome as compared to the Covaris extracted dNa and dNa from fresh
frozen samples.
Close inspection of the coverage and comparison with Covaris extracted
FFPe dNa, and dNa from fresh frozen tissue (Figure 5) also indicated
inconsistent coverage across the genome for QIaGeN processed samples
but coverage consistency of Covaris processed samples were remarkably
similar to that of fresh frozen tissue.
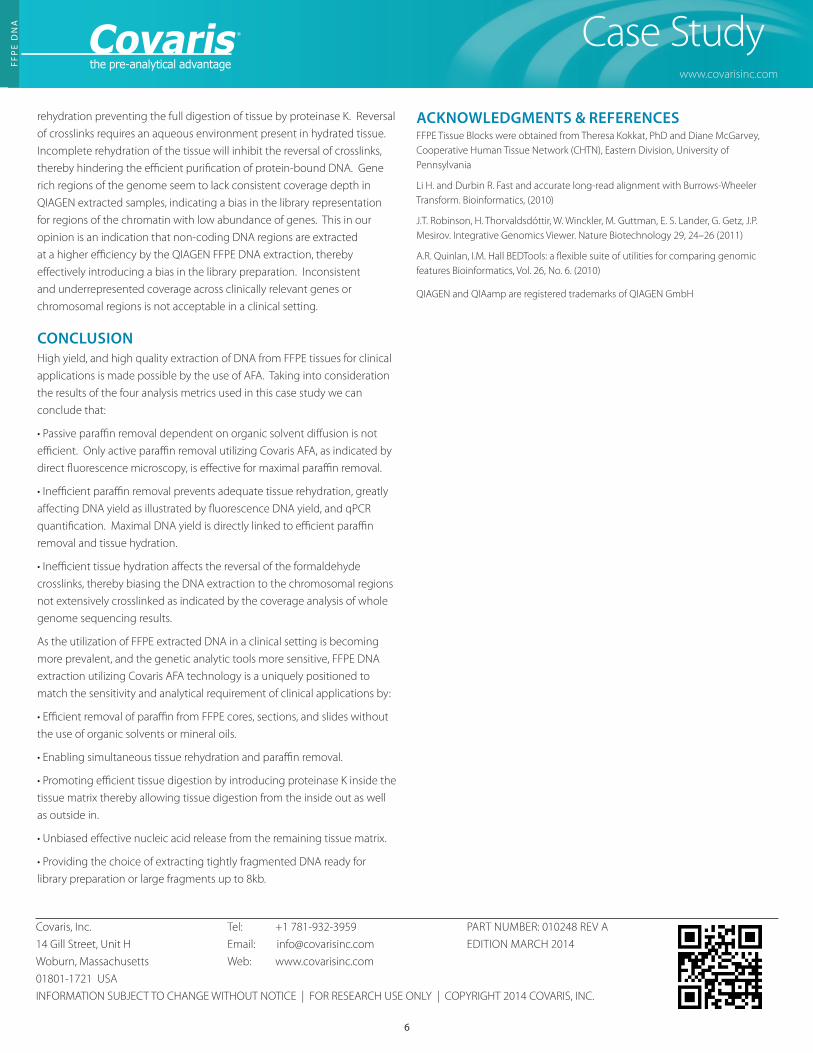
analysis of the coverage at chromosomal level (Figure 6) indicated
a lack of significant coverage in QIaGeN extracted samples. Looking
at several other chromosomes we noticed that gene rich areas of the
chromosomes (Figure 7) were consistently underrepresented in QIaGeN
processed samples. our analysis of all chromosome indicated similar
underrepresentation for QIaGeN processed samples. The reason for
coverage anomalies with QIaGeN processed samples is probably due to
the inefficient passive method of paraffin removal and incomplete tissue
FIGURE 3:
qPCR-based DNA concentration assessment fresh frozen tissue compared to Covaris and QIAGEN extracted FFPE DNA.
3
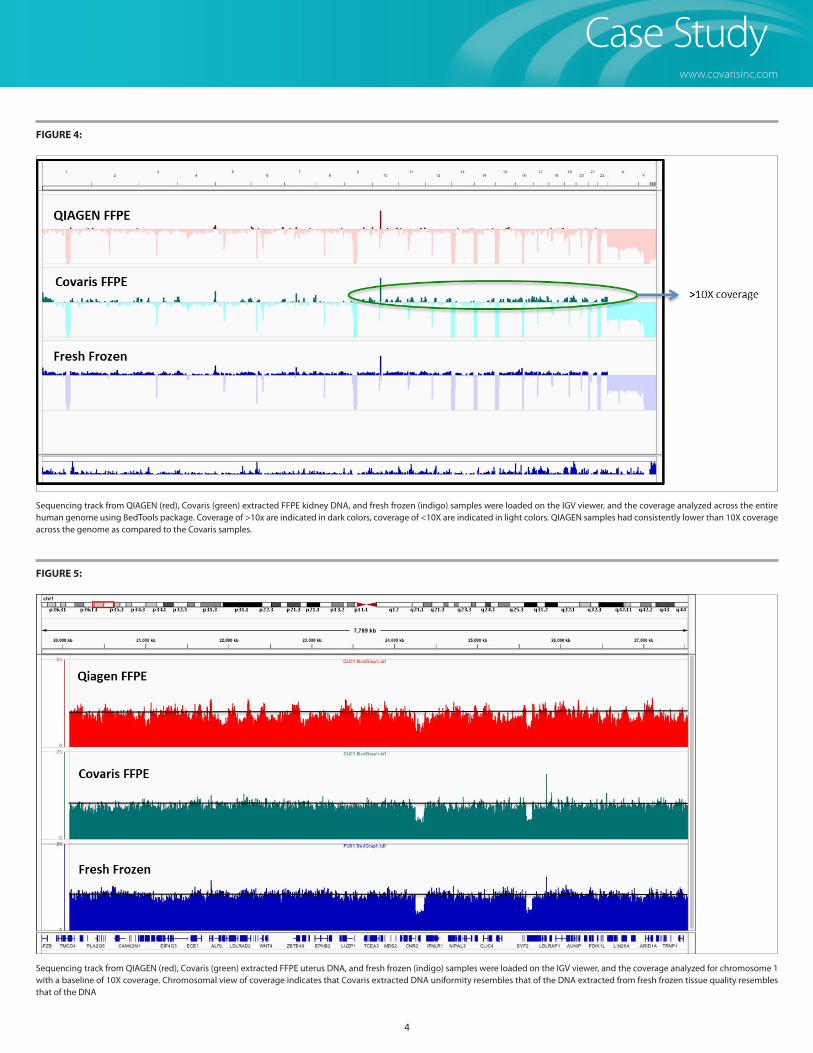
FIGURE 5:
Sequencing track from QIAGEN (red), Covaris (green) extracted FFPE uterus DNA, and fresh frozen (indigo) samples were loaded on the IGV viewer, and the coverage analyzed for chromosome 1 with a baseline of 10X coverage. Chromosomal view of coverage indicates that Covaris extracted DNA uniformity resembles that of the DNA extracted from fresh frozen tissue quality resembles that of the DNA
FIGURE 4:
Sequencing track from QIAGEN (red), Covaris (green) extracted FFPE kidney DNA, and fresh frozen (indigo) samples were loaded on the IGV viewer, and the coverage analyzed across the entire human genome using BedTools package. Coverage of >10x are indicated in dark colors, coverage of <10X are indicated in light colors. QIAGEN samples had consistently lower than 10X coverage across the genome as compared to the Covaris samples.
www.covarisinc.com
Case Study
4
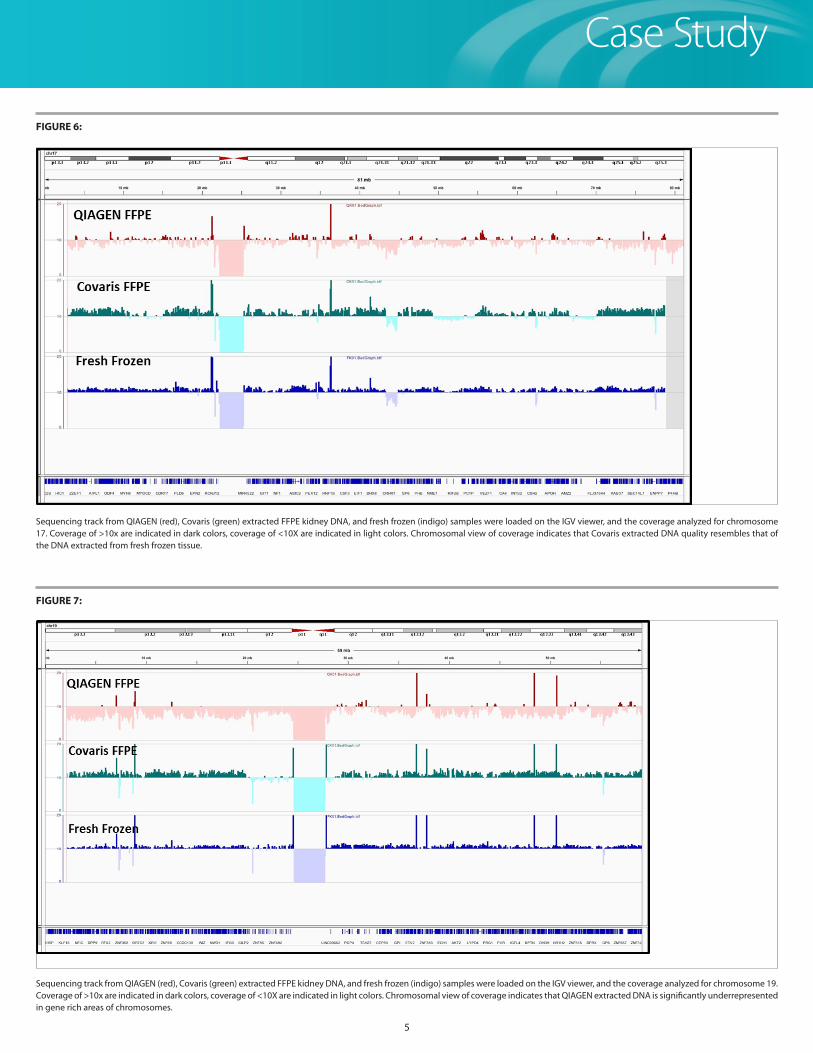
FIGURE 7:
Sequencing track from QIAGEN (red), Covaris (green) extracted FFPE kidney DNA, and fresh frozen (indigo) samples were loaded on the IGV viewer, and the coverage analyzed for chromosome 19. Coverage of >10x are indicated in dark colors, coverage of <10X are indicated in light colors. Chromosomal view of coverage indicates that QIAGEN extracted DNA is significantly underrepresented in gene rich areas of chromosomes.
FIGURE 6:
Sequencing track from QIAGEN (red), Covaris (green) extracted FFPE kidney DNA, and fresh frozen (indigo) samples were loaded on the IGV viewer, and the coverage analyzed for chromosome 17. Coverage of >10x are indicated in dark colors, coverage of <10X are indicated in light colors. Chromosomal view of coverage indicates that Covaris extracted DNA quality resembles that of the DNA extracted from fresh frozen tissue.
www.covarisinc.com
FF
PE
DN
A
5
Case Study
Covaris, Inc. Tel: +1 781-932-3959 ParT Number: 010248 rev a
14 Gill Street, unit H email: [email protected] edITIoN marCH 2014
Woburn, massachusetts Web: www.covarisinc.com
01801-1721 uSa
INFormaTIoN SubJeCT To CHaNGe WITHouT NoTICe | For reSearCH uSe oNLY | CoPYrIGHT 2014 CovarIS, INC.
rehydration preventing the full digestion of tissue by proteinase K. reversal
of crosslinks requires an aqueous environment present in hydrated tissue.
Incomplete rehydration of the tissue will inhibit the reversal of crosslinks,
thereby hindering the efficient purification of protein-bound dNa. Gene
rich regions of the genome seem to lack consistent coverage depth in
QIaGeN extracted samples, indicating a bias in the library representation
for regions of the chromatin with low abundance of genes. This in our
opinion is an indication that non-coding dNa regions are extracted
at a higher efficiency by the QIaGeN FFPe dNa extraction, thereby
effectively introducing a bias in the library preparation. Inconsistent
and underrepresented coverage across clinically relevant genes or
chromosomal regions is not acceptable in a clinical setting.
ConClusionHigh yield, and high quality extraction of dNa from FFPe tissues for clinical
applications is made possible by the use of aFa. Taking into consideration
the results of the four analysis metrics used in this case study we can
conclude that:
• Passive paraffin removal dependent on organic solvent diffusion is not
efficient. only active paraffin removal utilizing Covaris aFa, as indicated by
direct fluorescence microscopy, is effective for maximal paraffin removal.
• Inefficient paraffin removal prevents adequate tissue rehydration, greatly
affecting dNa yield as illustrated by fluorescence dNa yield, and qPCr
quantification. maximal dNa yield is directly linked to efficient paraffin
removal and tissue hydration.
• Inefficient tissue hydration affects the reversal of the formaldehyde
crosslinks, thereby biasing the dNa extraction to the chromosomal regions
not extensively crosslinked as indicated by the coverage analysis of whole
genome sequencing results.
as the utilization of FFPe extracted dNa in a clinical setting is becoming
more prevalent, and the genetic analytic tools more sensitive, FFPe dNa
extraction utilizing Covaris aFa technology is a uniquely positioned to
match the sensitivity and analytical requirement of clinical applications by:
• Efficient removal of paraffin from FFPE cores, sections, and slides without
the use of organic solvents or mineral oils.
• Enabling simultaneous tissue rehydration and paraffin removal.
• Promoting efficient tissue digestion by introducing proteinase K inside the
tissue matrix thereby allowing tissue digestion from the inside out as well
as outside in.
• Unbiased effective nucleic acid release from the remaining tissue matrix.
• Providing the choice of extracting tightly fragmented DNA ready for
library preparation or large fragments up to 8kb.
aCknowledgments & referenCesFFPe Tissue blocks were obtained from Theresa Kokkat, Phd and diane mcGarvey, Cooperative Human Tissue Network (CHTN), eastern division, university of Pennsylvania
Li H. and durbin r. Fast and accurate long-read alignment with burrows-Wheeler Transform. bioinformatics, (2010)
J.T. robinson, H. Thorvaldsdóttir, W. Winckler, m. Guttman, e. S. Lander, G. Getz, J.P. mesirov. Integrative Genomics viewer. Nature biotechnology 29, 24–26 (2011)
a.r. Quinlan, I.m. Hall bedTools: a flexible suite of utilities for comparing genomic features bioinformatics, vol. 26, No. 6. (2010)
QIaGeN and QIaamp are registered trademarks of QIaGeN GmbH
FF
PE
DN
A
6
FF
PE
DN
A
www.covarisinc.com
Case Study