Embed Size (px)
Citation preview
A Community Attitude Survey of Livingston County Voters
Regarding Public Transportation
March 2010
A study conducted jointly by:
Project conducted by:
� Hugh M. Clark, Ph.D., CJI Research Corporation � Robert R. Dykes, Triad Research Group � Kathy Severinski, Triad Research Group � Jennifer Yanke, Triad, Research Group � Mary Veit, CJI Research Corporation
CJI Research Corporation 180 South Ardmore Road Columbus, Ohio 43209 (614) 338-1008 TRIAD Research Group, Inc. 20325 Center Ridge Road, Suite 450 Cleveland, OH 44116 (440) 895-5353 This study was funded by a grant from the Michigan Department of Transportation to conduct public opinion surveys of Livingston County and Washtenaw County residents regarding current transit service and proposed rail service between Howell and Ann Arbor. The Ann Arbor Transportation Authority was the grant recipient and provided grant management for the project.
1. Page 3 Page 3
A Community Attitude Survey of Livingston County Voters
Regarding Public Transportation
1. Page 4 Page 4
Table of Contents Table of Contents ................................................................................................................................ 4 List of Figures ...................................................................................................................................... 6 Introduction .......................................................................................................................................... 7
Survey Methodology ........................................................................................................................ 8 Survey Purpose ............................................................................................................................... 9
Background: Attitudes toward Living in Livingston County ................................................................. 11 Satisfaction with living in Livingston County ................................................................................... 12 Is the sense of movement locally positive or negative? .................................................................. 13
Use of and Opinions toward L.E.T.S. and .......................................................................................... 15 Transit Service in General ................................................................................................................. 15
Awareness of L.E.T.S. ................................................................................................................... 16 Opinion of L.E.T.S. ........................................................................................................................ 17 Use of L.E.T.S. .............................................................................................................................. 18 Combined awareness and use of L.E.T.S. ..................................................................................... 19 Job Rating for L.E.T.S. ................................................................................................................... 20 Importance of providing public transit services in Livingston County .............................................. 21
The Initial Vote................................................................................................................................... 23 How people voted at the outset of the survey ................................................................................ 24
Voting tendencies of the demographic groups ............................................................................ 25 The vote and perceived importance of providing public transit service in Livingston County .......... 27
Consistency and Movement in a Property Tax Vote .......................................................................... 29 Vote movement.............................................................................................................................. 30 Consistency and movement of vote before and after exposure to pro and anti-levy statements ..... 31 How vote consistency and vote movement varies with demography .............................................. 32
Reasons People Vote Against a Tax to Expand Transit Services ...................................................... 37 In their own words, why voters oppose a transit tax ....................................................................... 38 Anti-levy arguments ....................................................................................................................... 39
Affordability and The Economy ................................................................................................... 39 Perceive relative importance of transit ........................................................................................ 40 Fairness and need for public transit service ................................................................................ 40 Use of money ............................................................................................................................. 41 Multivariate Analysis – The Economy ......................................................................................... 41
The dollar cost of the tax ................................................................................................................ 42 Arguments in Favor of a Tax to Expand Transit Services .................................................................. 45
In their own words, why voters would support a transit tax ............................................................. 46 Impact of knowing what L.E.T.S does ............................................................................................ 47 The issue vote and knowing who the L.E.T.S. clientele is .............................................................. 48 Importance of service improvements tested ................................................................................... 49 Impact on the community as reasons to support a transit tax ......................................................... 51
Impact on the community and vote consistency and movement groups ...................................... 53 Perceived benefits of transit ........................................................................................................... 54
Voter consistency groups ........................................................................................................... 55 Attitudes toward Possible Rail Service ............................................................................................... 57
Work outside the county ................................................................................................................ 58 Travel outside the county ............................................................................................................... 59 Awareness of WALLY .................................................................................................................... 60 Use of L.E.T.S. transit tax revenue for local share of WALLY ........................................................ 61
1. Page 5 Page 5
Using some of the transit money for WALLY by voter groups ........................................................ 62 Who WALLY would benefit more ................................................................................................... 63
Appendix A: Survey Questionnaire .................................................................................................... 65 Appendix B: Tables ........................................................................................................................... 73
1. Page 6 Page 6
List of Figures Figure 1 Livingston County divided into analysis regions ..................................................................... 8 Figure 2 Satisfaction with Livingston County ...................................................................................... 12 Figure 3 Is Livingston County better, worse, same as five years ago? ............................................... 13 Figure 4 Awareness of L.E.T.S. ......................................................................................................... 16 Figure 5 Overall opinion of L.E.T.S. ................................................................................................... 17 Figure 6 Use of L.E.T.S. .................................................................................................................... 18 Figure 7 Use of L.E.T.S. .................................................................................................................... 19 Figure 8 Job rating for L.E.T.S. .......................................................................................................... 20 Figure 9 Perceived importance of providing public transit in Livingston County ................................. 21 Figure 10 The Vote – Initial vote question only .................................................................................. 24 Figure 11 The vote and perceived importance of providing public transit ........................................... 27 Figure 12 Change from first to second vote question ......................................................................... 30 Figure 13 Vote and re-vote ................................................................................................................ 31 Figure 14 Demographics of the vote consistency and vote movement groupings (row percent – read left to right) ........................................................................................................................................ 34 Figure 15 The demography of the vote consistency and vote movement groupings (column percent, read top to bottom) ............................................................................................................................ 35 Figure 16 Agreement and disagreement with anti-levy arguments ..................................................... 39 Figure 17 Cost of the millage to typical homeowner ........................................................................... 42 Figure 18 Dollar cost of a levy and voter groups ................................................................................ 43 Figure 19 Impact on the vote of knowing that L.E.T.S. provides door-to-door services for seniors and persons with disabilities ..................................................................................................................... 47 Figure 20 The issue vote and knowing who the L.E.T.S. clientele is .................................................. 48 Figure 21 Importance of service improvements ................................................................................. 49 Figure 22 L.E.T.S. impacts on the community as reasons to support a tax ........................................ 51 Figure 23 How good each statement is as a reason to vote for a transit tax increase, by voter groups .......................................................................................................................................................... 53 Figure 24 Perceived benefits of transit ............................................................................................... 54 Figure 25 Voter groups and agreement/disagreement with pro-issue arguments ............................... 55 Figure 26 Work inside or outside Livingston County .......................................................................... 58 Figure 27 Frequency of traveling outside Livingston County in past month ........................................ 59 Figure 28 Awareness of WALLY ........................................................................................................ 60 Figure 29 Use of transit tax revenue for WALLY ................................................................................ 61 Figure 30 Use of transit tax for WALLY in relation to voter groups ..................................................... 62 Figure 31 Who will WALLY benefit most ............................................................................................ 63
1. Page 7 Page 7
Introduction
1. Page 8 Page 8
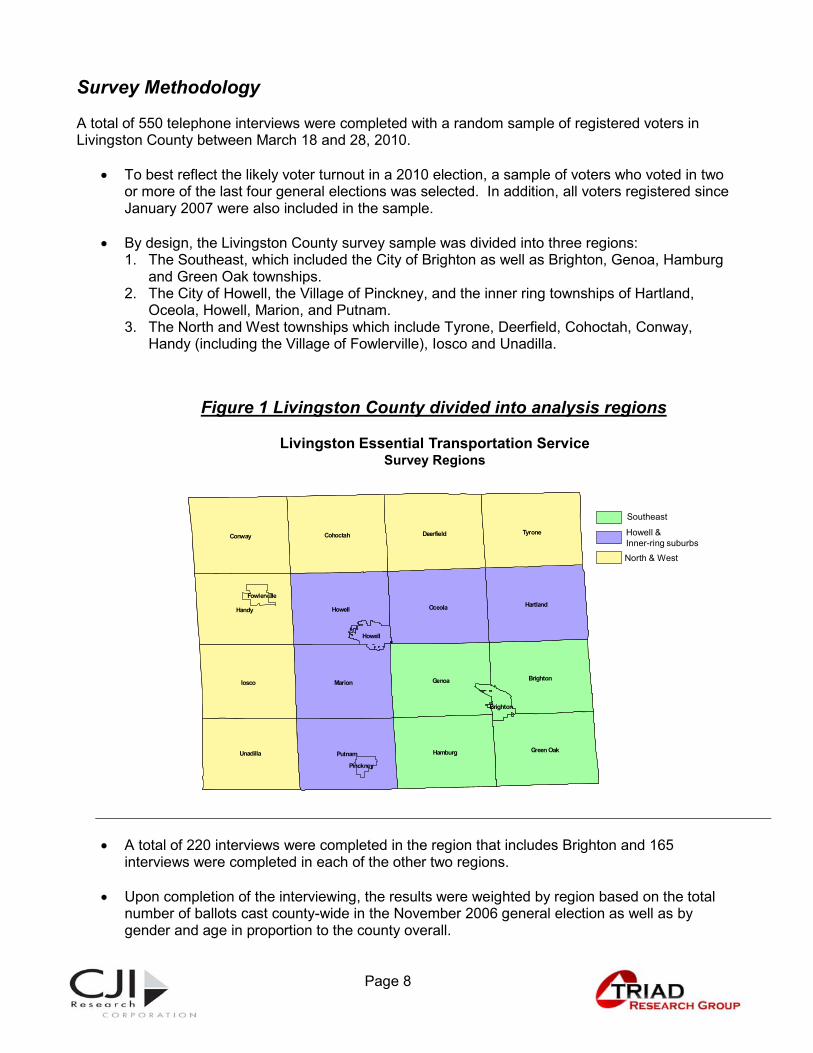
Survey Methodology A total of 550 telephone interviews were completed with a random sample of registered voters in Livingston County between March 18 and 28, 2010.
� To best reflect the likely voter turnout in a 2010 election, a sample of voters who voted in two or more of the last four general elections was selected. In addition, all voters registered since January 2007 were also included in the sample.
� By design, the Livingston County survey sample was divided into three regions:
1. The Southeast, which included the City of Brighton as well as Brighton, Genoa, Hamburg and Green Oak townships.
2. The City of Howell, the Village of Pinckney, and the inner ring townships of Hartland, Oceola, Howell, Marion, and Putnam.
3. The North and West townships which include Tyrone, Deerfield, Cohoctah, Conway, Handy (including the Village of Fowlerville), Iosco and Unadilla.
� A total of 220 interviews were completed in the region that includes Brighton and 165
interviews were completed in each of the other two regions. � Upon completion of the interviewing, the results were weighted by region based on the total
number of ballots cast county-wide in the November 2006 general election as well as by gender and age in proportion to the county overall.
Figure 1 Livingston County divided into analysis regions
Fowlerville
Pinckney
Iosco Genoa
Handy
Tyrone
Oceola
Marion
Conway
Howell
Putnam
Hartland
Unadilla
DeerfieldCohoctah
Brighton
Hamburg Green Oak
Howell
Brighton
Southeast
Howell & Inner-ring suburbs
North & West
Livingston Essential Transportation ServiceSurvey Regions
1. Page 9 Page 9
� Based on 550 respondents, the overall survey results have a margin of error of no more than ±4.18% at the 95% confidence level.
� Throughout the report, percentages are rounded to the nearest whole percent. This sometimes results in the sum of some percentages equaling 99% or 101%. This is not an error and should be ignored.
Survey Purpose
The survey had several purposes, including:
1. Examining attitudes and behaviors important to the background of a transit tax issue, including voters’ opinions of quality of life in Livingston County, awareness and household use of public transit and the perceived importance of providing transit service in the county.
2. Measuring voters’ support for a possible one-half mil property tax for L.E.T.S. and their
reasons for supporting or opposing a property tax, including the importance of services that public transit could offer if the tax is approved by voters.
3. Testing various reasons to vote for or against a property tax for L.E.T.S. in order to determine the obstacles for the tax issue and identify arguments that would help increase and strengthen support for a possible tax issue.
The reader unfamiliar with L.E.T.S. should understand that this is limited transportation service, and not a typical urban fixed route system. Consequently, one would anticipate that public knowledge of the system would be more limited that is found in some systems' service areas. The following description is taken from the Livingston County website:
� L.E.T.S. is a lift-equipped small bus system which offers transportation throughout Livingston County. � L.E.T.S. provides a dial-a-ride service within the county, limited service for persons to county dialysis
centers, and a Regional Service for medical appointments in Ingham, Genesee, Oakland and Washtenaw Counties. Reservations for the Regional Service may be taken up to six weeks in advance.
� MISSION STATEMENT: "To improve the quality of life for all residents of Livingston County, Michigan by developing, operating and maintaining efficient, user friendly, intermodal transportation that offers mobility to transit dependent citizens, promotes economic vitality, and is affordable and environmentally responsible."

1. Page 10 Page 10
1. Page 11 Page 11
Background: Attitudes toward Living in Livingston County
1. Page 12 Page 12
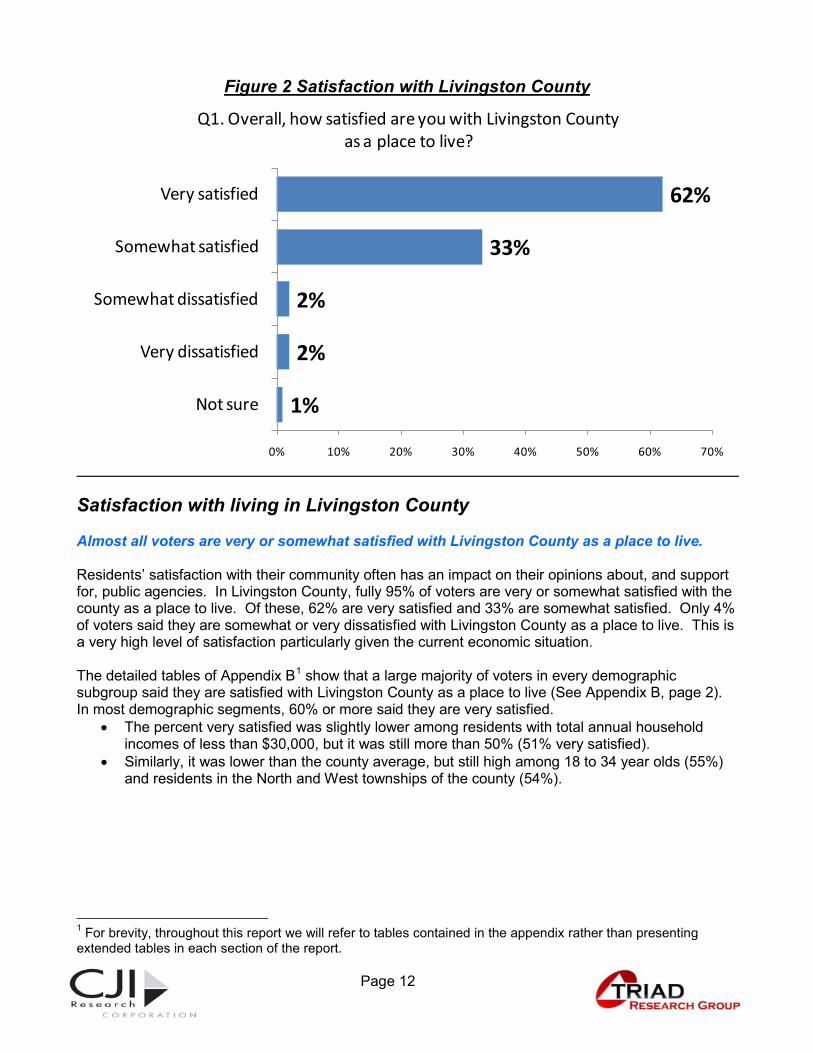
Figure 2 Satisfaction with Livingston County
Satisfaction with living in Livingston County Almost all voters are very or somewhat satisfied with Livingston County as a place to live. Residents’ satisfaction with their community often has an impact on their opinions about, and support for, public agencies. In Livingston County, fully 95% of voters are very or somewhat satisfied with the county as a place to live. Of these, 62% are very satisfied and 33% are somewhat satisfied. Only 4% of voters said they are somewhat or very dissatisfied with Livingston County as a place to live. This is a very high level of satisfaction particularly given the current economic situation. The detailed tables of Appendix B1
� The percent very satisfied was slightly lower among residents with total annual household incomes of less than $30,000, but it was still more than 50% (51% very satisfied).
show that a large majority of voters in every demographic subgroup said they are satisfied with Livingston County as a place to live (See Appendix B, page 2). In most demographic segments, 60% or more said they are very satisfied.
� Similarly, it was lower than the county average, but still high among 18 to 34 year olds (55%) and residents in the North and West townships of the county (54%).
1 For brevity, throughout this report we will refer to tables contained in the appendix rather than presenting extended tables in each section of the report.
1%
2%
2%
33%
62%
Not sure
Very dissatisfied
Somewhat dissatisfied
Somewhat satisfied
Very satisfied
0% 10% 20% 30% 40% 50% 60% 70%
Q1. Overall, how satisfied are you with Livingston County as a place to live?
1. Page 13 Page 13
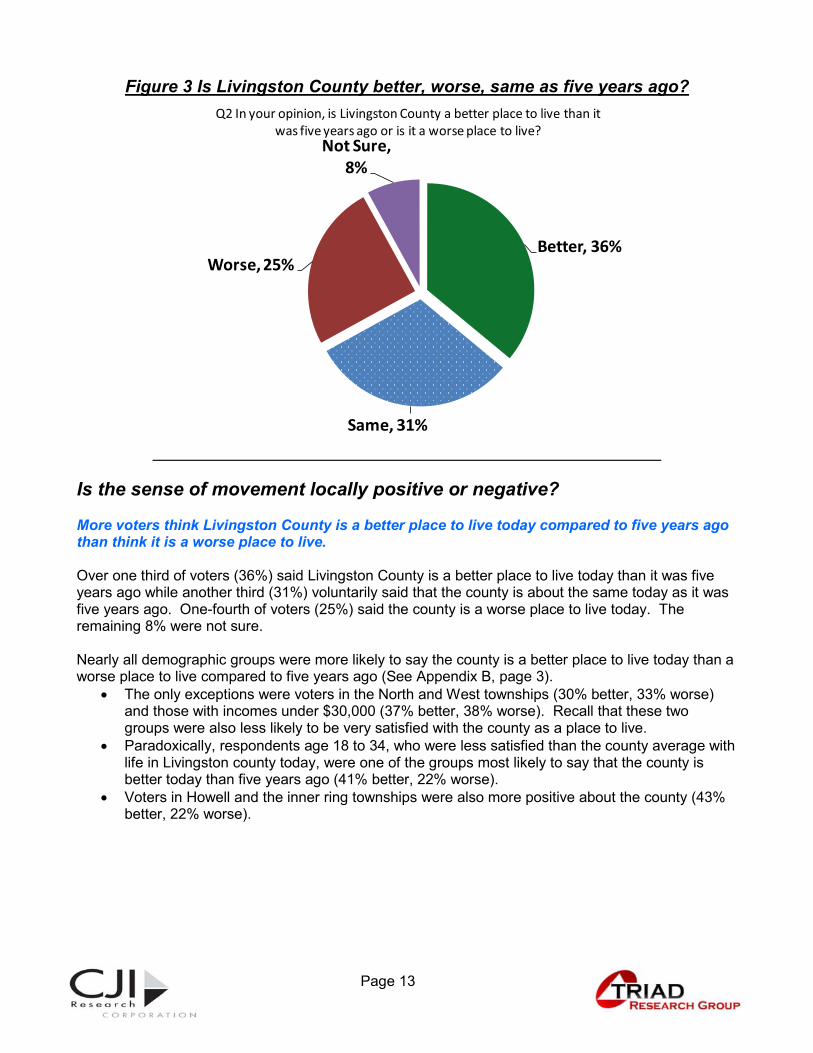
Figure 3 Is Livingston County better, worse, same as five years ago?
Is the sense of movement locally positive or negative? More voters think Livingston County is a better place to live today compared to five years ago than think it is a worse place to live. Over one third of voters (36%) said Livingston County is a better place to live today than it was five years ago while another third (31%) voluntarily said that the county is about the same today as it was five years ago. One-fourth of voters (25%) said the county is a worse place to live today. The remaining 8% were not sure. Nearly all demographic groups were more likely to say the county is a better place to live today than a worse place to live compared to five years ago (See Appendix B, page 3).
� The only exceptions were voters in the North and West townships (30% better, 33% worse) and those with incomes under $30,000 (37% better, 38% worse). Recall that these two groups were also less likely to be very satisfied with the county as a place to live.
� Paradoxically, respondents age 18 to 34, who were less satisfied than the county average with life in Livingston county today, were one of the groups most likely to say that the county is better today than five years ago (41% better, 22% worse).
� Voters in Howell and the inner ring townships were also more positive about the county (43% better, 22% worse).
Better, 36%
Same, 31%
Worse, 25%
Not Sure, 8%
Q2 In your opinion, is Livingston County a better place to live than it was five years ago or is it a worse place to live?

1. Page 14 Page 14
1. Page 15 Page 15
Use of and Opinions toward L.E.T.S. and Transit Service in General
1. Page 16 Page 16
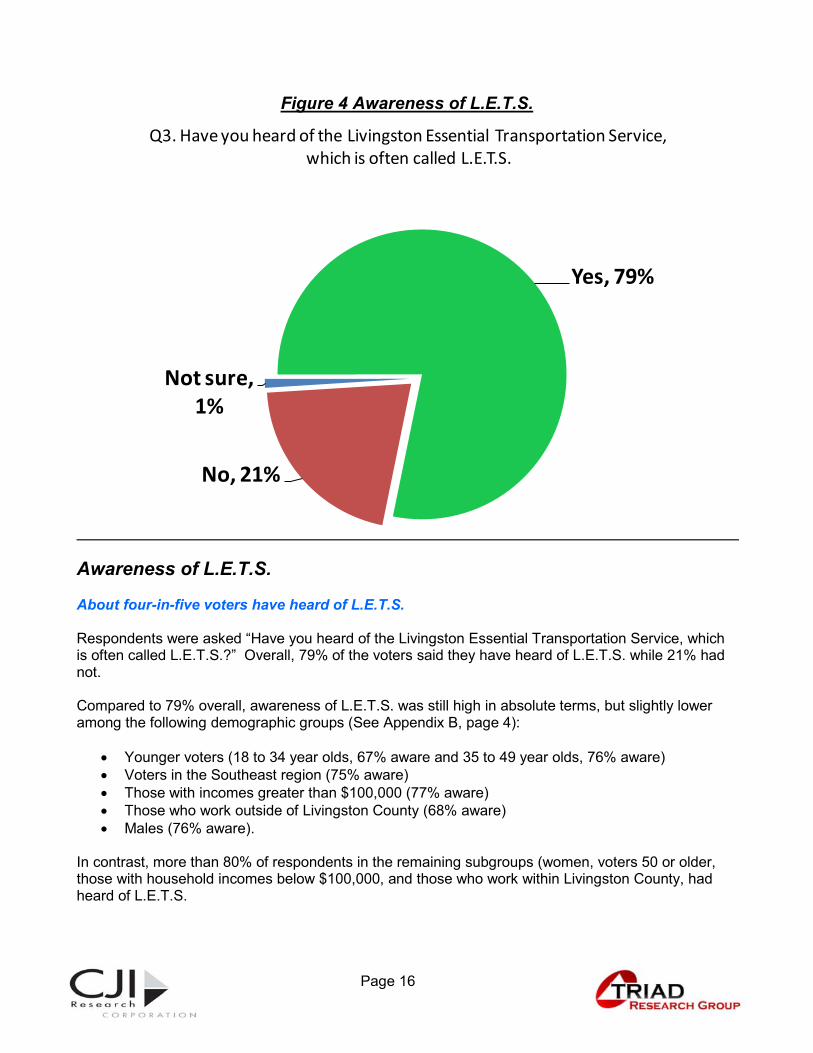
Figure 4 Awareness of L.E.T.S.
Awareness of L.E.T.S. About four-in-five voters have heard of L.E.T.S. Respondents were asked “Have you heard of the Livingston Essential Transportation Service, which is often called L.E.T.S.?” Overall, 79% of the voters said they have heard of L.E.T.S. while 21% had not. Compared to 79% overall, awareness of L.E.T.S. was still high in absolute terms, but slightly lower among the following demographic groups (See Appendix B, page 4):
� Younger voters (18 to 34 year olds, 67% aware and 35 to 49 year olds, 76% aware) � Voters in the Southeast region (75% aware) � Those with incomes greater than $100,000 (77% aware) � Those who work outside of Livingston County (68% aware) � Males (76% aware).
In contrast, more than 80% of respondents in the remaining subgroups (women, voters 50 or older, those with household incomes below $100,000, and those who work within Livingston County, had heard of L.E.T.S.
Yes, 79%
No, 21%
Not sure, 1%
Q3. Have you heard of the Livingston Essential Transportation Service,which is often called L.E.T.S.
1. Page 17 Page 17
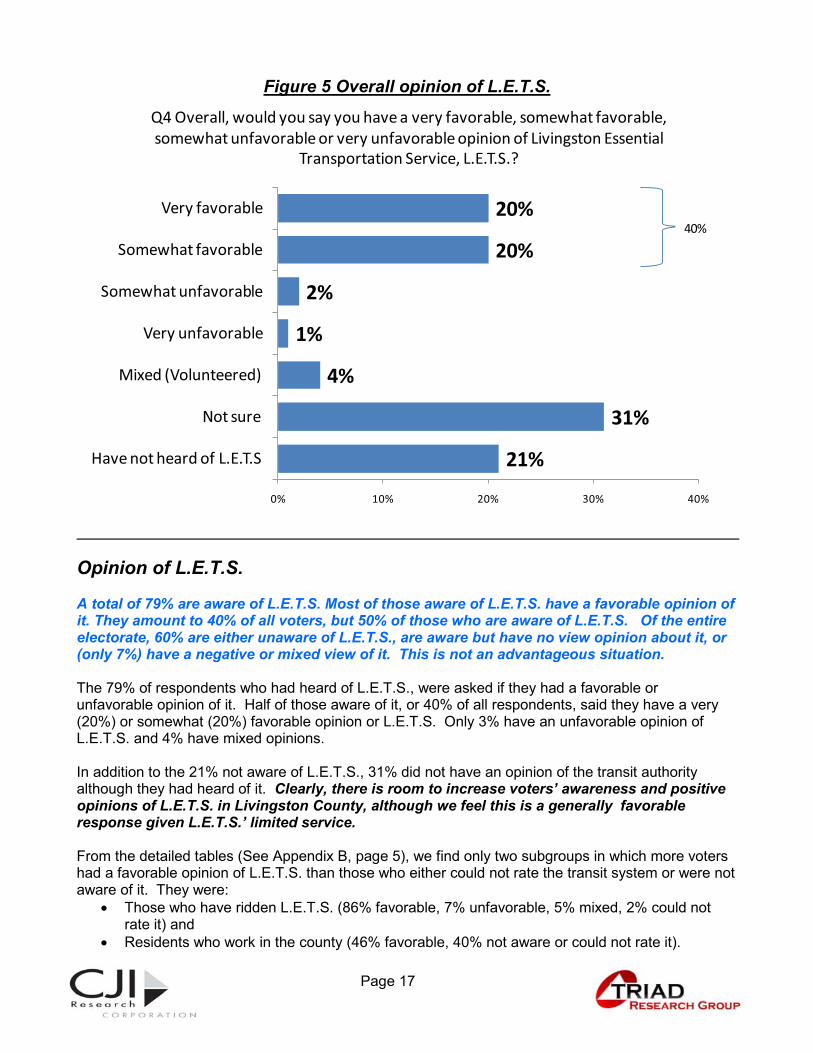
Figure 5 Overall opinion of L.E.T.S.
Opinion of L.E.T.S. A total of 79% are aware of L.E.T.S. Most of those aware of L.E.T.S. have a favorable opinion of it. They amount to 40% of all voters, but 50% of those who are aware of L.E.T.S. Of the entire electorate, 60% are either unaware of L.E.T.S., are aware but have no view opinion about it, or (only 7%) have a negative or mixed view of it. This is not an advantageous situation. The 79% of respondents who had heard of L.E.T.S., were asked if they had a favorable or unfavorable opinion of it. Half of those aware of it, or 40% of all respondents, said they have a very (20%) or somewhat (20%) favorable opinion or L.E.T.S. Only 3% have an unfavorable opinion of L.E.T.S. and 4% have mixed opinions. In addition to the 21% not aware of L.E.T.S., 31% did not have an opinion of the transit authority although they had heard of it. Clearly, there is room to increase voters’ awareness and positive opinions of L.E.T.S. in Livingston County, although we feel this is a generally favorable response given L.E.T.S.’ limited service. From the detailed tables (See Appendix B, page 5), we find only two subgroups in which more voters had a favorable opinion of L.E.T.S. than those who either could not rate the transit system or were not aware of it. They were:
� Those who have ridden L.E.T.S. (86% favorable, 7% unfavorable, 5% mixed, 2% could not rate it) and
� Residents who work in the county (46% favorable, 40% not aware or could not rate it).
21%
31%
4%
1%
2%
20%
20%
Have not heard of L.E.T.S
Not sure
Mixed (Volunteered)
Very unfavorable
Somewhat unfavorable
Somewhat favorable
Very favorable
0% 10% 20% 30% 40%
Q4 Overall, would you say you have a very favorable, somewhat favorable, somewhat unfavorable or very unfavorable opinion of Livingston Essential
Transportation Service, L.E.T.S.?
40%
1. Page 18 Page 18
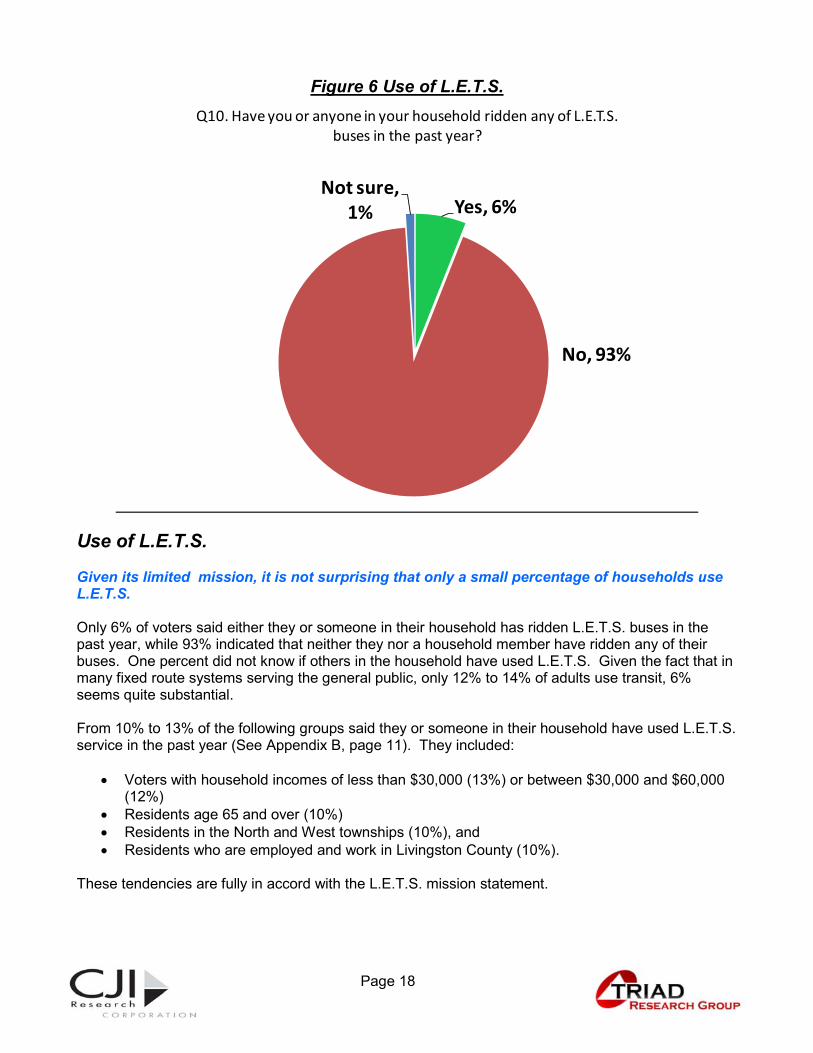
Figure 6 Use of L.E.T.S.
Use of L.E.T.S. Given its limited mission, it is not surprising that only a small percentage of households use L.E.T.S. Only 6% of voters said either they or someone in their household has ridden L.E.T.S. buses in the past year, while 93% indicated that neither they nor a household member have ridden any of their buses. One percent did not know if others in the household have used L.E.T.S. Given the fact that in many fixed route systems serving the general public, only 12% to 14% of adults use transit, 6% seems quite substantial. From 10% to 13% of the following groups said they or someone in their household have used L.E.T.S. service in the past year (See Appendix B, page 11). They included:
� Voters with household incomes of less than $30,000 (13%) or between $30,000 and $60,000 (12%)
� Residents age 65 and over (10%) � Residents in the North and West townships (10%), and � Residents who are employed and work in Livingston County (10%).
These tendencies are fully in accord with the L.E.T.S. mission statement.
Yes, 6%
No, 93%
Not sure, 1%
Q10. Have you or anyone in your household ridden any of L.E.T.S.buses in the past year?
1. Page 19 Page 19
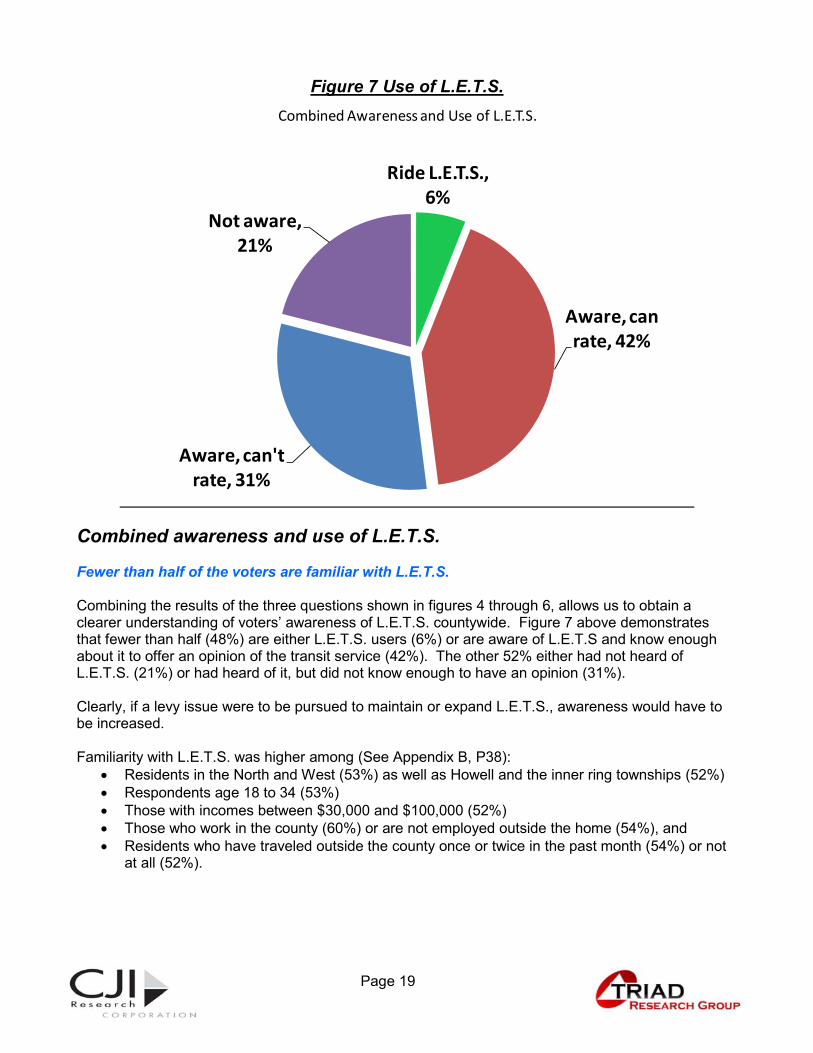
Figure 7 Use of L.E.T.S.
Combined awareness and use of L.E.T.S. Fewer than half of the voters are familiar with L.E.T.S. Combining the results of the three questions shown in figures 4 through 6, allows us to obtain a clearer understanding of voters’ awareness of L.E.T.S. countywide. Figure 7 above demonstrates that fewer than half (48%) are either L.E.T.S. users (6%) or are aware of L.E.T.S and know enough about it to offer an opinion of the transit service (42%). The other 52% either had not heard of L.E.T.S. (21%) or had heard of it, but did not know enough to have an opinion (31%). Clearly, if a levy issue were to be pursued to maintain or expand L.E.T.S., awareness would have to be increased. Familiarity with L.E.T.S. was higher among (See Appendix B, P38):
� Residents in the North and West (53%) as well as Howell and the inner ring townships (52%) � Respondents age 18 to 34 (53%) � Those with incomes between $30,000 and $100,000 (52%) � Those who work in the county (60%) or are not employed outside the home (54%), and � Residents who have traveled outside the county once or twice in the past month (54%) or not
at all (52%).
Ride L.E.T.S., 6%
Aware, can rate, 42%
Aware, can't rate, 31%
Not aware, 21%
Combined Awareness and Use of L.E.T.S.
1. Page 20 Page 20
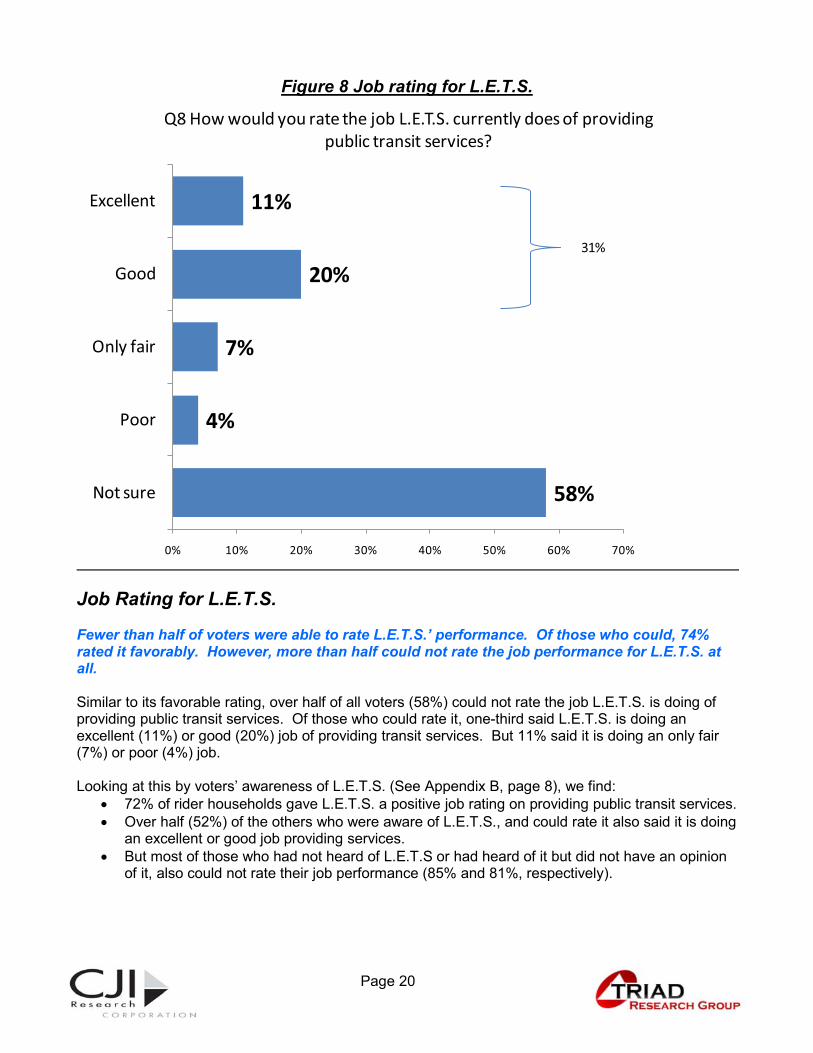
Figure 8 Job rating for L.E.T.S.
Job Rating for L.E.T.S. Fewer than half of voters were able to rate L.E.T.S.’ performance. Of those who could, 74% rated it favorably. However, more than half could not rate the job performance for L.E.T.S. at all. Similar to its favorable rating, over half of all voters (58%) could not rate the job L.E.T.S. is doing of providing public transit services. Of those who could rate it, one-third said L.E.T.S. is doing an excellent (11%) or good (20%) job of providing transit services. But 11% said it is doing an only fair (7%) or poor (4%) job. Looking at this by voters’ awareness of L.E.T.S. (See Appendix B, page 8), we find:
� 72% of rider households gave L.E.T.S. a positive job rating on providing public transit services. � Over half (52%) of the others who were aware of L.E.T.S., and could rate it also said it is doing
an excellent or good job providing services. � But most of those who had not heard of L.E.T.S or had heard of it but did not have an opinion
of it, also could not rate their job performance (85% and 81%, respectively).
58%
4%
7%
20%
11%
Not sure
Poor
Only fair
Good
Excellent
0% 10% 20% 30% 40% 50% 60% 70%
Q8 How would you rate the job L.E.T.S. currently does of providing public transit services?
31%
1. Page 21 Page 21
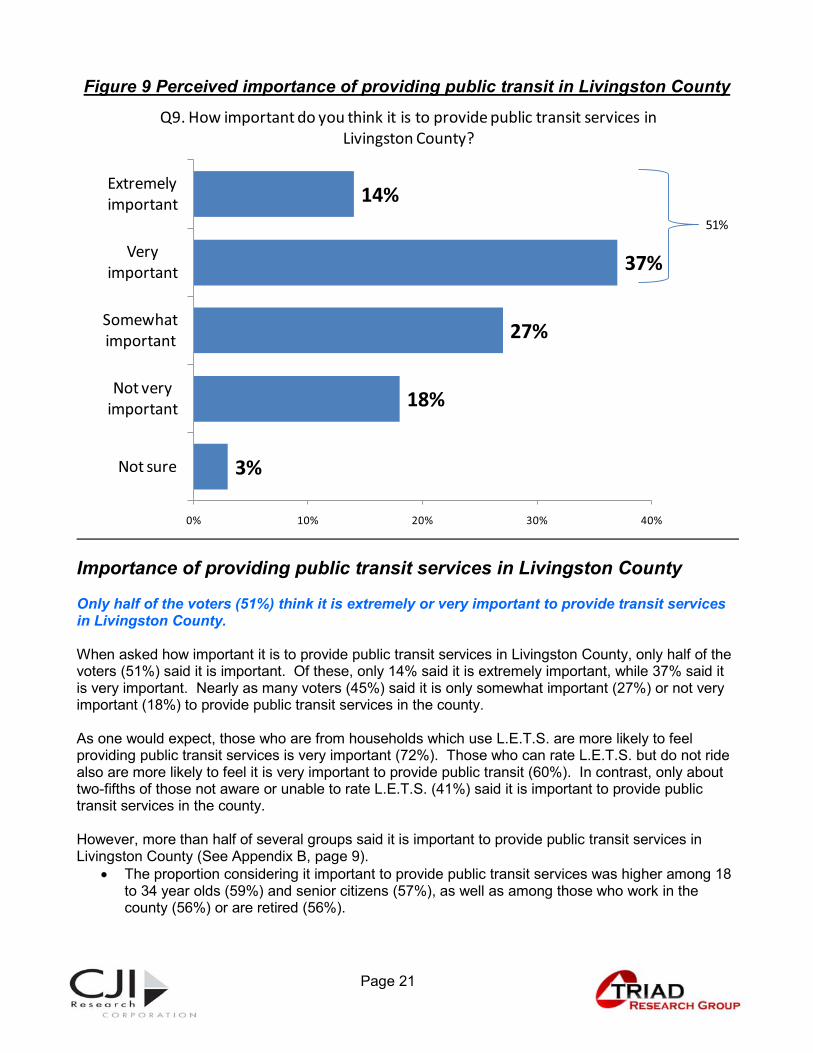
Figure 9 Perceived importance of providing public transit in Livingston County
Importance of providing public transit services in Livingston County Only half of the voters (51%) think it is extremely or very important to provide transit services in Livingston County. When asked how important it is to provide public transit services in Livingston County, only half of the voters (51%) said it is important. Of these, only 14% said it is extremely important, while 37% said it is very important. Nearly as many voters (45%) said it is only somewhat important (27%) or not very important (18%) to provide public transit services in the county. As one would expect, those who are from households which use L.E.T.S. are more likely to feel providing public transit services is very important (72%). Those who can rate L.E.T.S. but do not ride also are more likely to feel it is very important to provide public transit (60%). In contrast, only about two-fifths of those not aware or unable to rate L.E.T.S. (41%) said it is important to provide public transit services in the county. However, more than half of several groups said it is important to provide public transit services in Livingston County (See Appendix B, page 9).
� The proportion considering it important to provide public transit services was higher among 18 to 34 year olds (59%) and senior citizens (57%), as well as among those who work in the county (56%) or are retired (56%).
3%
18%
27%
37%
14%
Not sure
Not very important
Somewhat important
Very important
Extremely important
0% 10% 20% 30% 40%
Q9. How important do you think it is to provide public transit services in Livingston County?
51%
1. Page 22 Page 22
[In a later section (See page 23, "The Initial Vote") voter attitudes toward a transportation levy are discussed. We will show there that there also is a strong relationship between the perceived importance of providing public transit services and support for a transit levy. Specifically, 81% of the “Yes” voters said it is extremely or very important to provide public transit services in the county.] There were also a few subgroups where fewer than half said it is extremely or very important to provide public transportation. They were:
� 35 to 49 year olds (42%) � Those with incomes between $60,000 and $100,000 (47%) � Those who work outside the county (43%). � Fewer than half of male voters said that providing public transit is extremely or very important
(45%), while over half of female voters indicated it is important (56%). For a levy to be successful, L.E.T.S. will have to increase voters’ awareness and the perceived importance of providing public transit services in Livingston County. When facing a transit tax issue election, it is important to have a higher overall percentage saying it is important (70% or more would be desirable). It would also be desirable to have a balance closer to 50:50 between those who say it is extremely important and very important. As it stands, only 14% consider it extremely important and 37% very important for a total of only 51% and a ratio of almost 3:1.

1. Page 23 Page 23
The Initial Vote
1. Page 24 Page 24
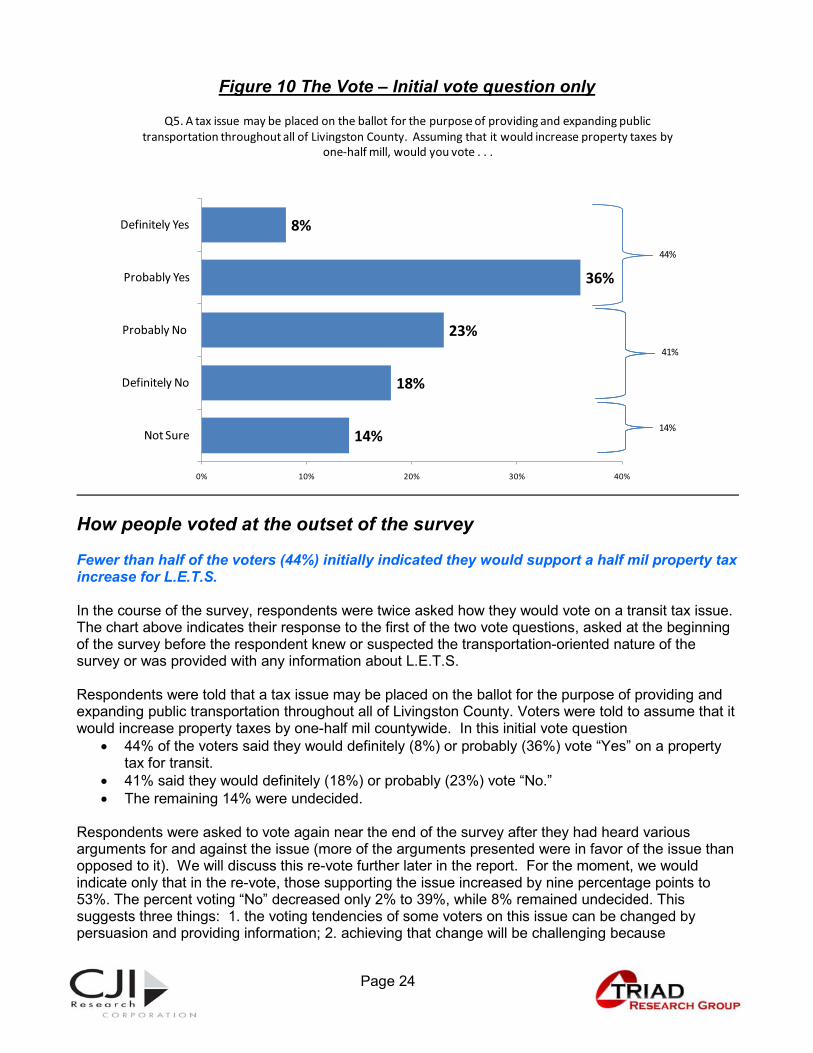
Figure 10 The Vote – Initial vote question only
How people voted at the outset of the survey Fewer than half of the voters (44%) initially indicated they would support a half mil property tax increase for L.E.T.S. In the course of the survey, respondents were twice asked how they would vote on a transit tax issue. The chart above indicates their response to the first of the two vote questions, asked at the beginning of the survey before the respondent knew or suspected the transportation-oriented nature of the survey or was provided with any information about L.E.T.S. Respondents were told that a tax issue may be placed on the ballot for the purpose of providing and expanding public transportation throughout all of Livingston County. Voters were told to assume that it would increase property taxes by one-half mil countywide. In this initial vote question
� 44% of the voters said they would definitely (8%) or probably (36%) vote “Yes” on a property tax for transit.
� 41% said they would definitely (18%) or probably (23%) vote “No.” � The remaining 14% were undecided.
Respondents were asked to vote again near the end of the survey after they had heard various arguments for and against the issue (more of the arguments presented were in favor of the issue than opposed to it). We will discuss this re-vote further later in the report. For the moment, we would indicate only that in the re-vote, those supporting the issue increased by nine percentage points to 53%. The percent voting “No” decreased only 2% to 39%, while 8% remained undecided. This suggests three things: 1. the voting tendencies of some voters on this issue can be changed by persuasion and providing information; 2. achieving that change will be challenging because
14%
18%
23%
36%
8%
Not Sure
Definitely No
Probably No
Probably Yes
Definitely Yes
0% 10% 20% 30% 40%
44%
41%
Q5. A tax issue may be placed on the ballot for the purpose of providing and expanding public transportation throughout all of Livingston County. Assuming that it would increase property taxes by
one-half mill, would you vote . . .
14%
1. Page 25 Page 25
movement is small even in a one-on-one interview situation; 3. A core opposition to a levy will stand at about 39% or 40% regardless of arguments and information provided. In our experience, for an issue to be successful, survey results prior to an election must have at least 55% of the voters saying they would vote “Yes” and no more than 30% saying they would vote “No.” The reason for needing more than a 50.1% “Yes” vote in a survey is that there will usually be attrition among supporters and little, if any, attrition among opponents. On transit tax issues (and some other issues) persons with lower tendencies to turn out to vote (e.g., lower income persons, younger persons) are more likely to favor the issue, but less likely to actually vote. In other words, surveys measure what people say they will do and not their actual voting behavior. It is also important to remember that on tax issues, an undecided vote on election eve is a “No” vote on election day because while a “Yes” vote literally has a monetary cost, a “No” vote appears to be without cost, and an undecided voter has at that point not been convinced to spend the additional money. The first vote in the survey (44% Yes and 41% No) does not meet either criterion: the 55% or greater pro-vote or the 30% or lower anti-vote. Too few voters support the issue and too many vote against it for it to pass. Passage would require a significant public information and persuasion effort. In addition, when we look at the strength of support for the tax increase, only 8% said they would definitely vote “Yes” on this issue initially, and in the second vote, this improved to only 16%. Furthermore, more voters said they would definitely vote “No” both in the first vote question (23%) and the second time asked (17%). Thus, most of the support is “soft” and a substantial numbers of voters are strongly opposed. Even with the 9-point increase in support from the first vote to the second, there is little chance of passing this property tax at this time. As we have seen, awareness of L.E.T.S. is low, use of L.E.T.S. is low, and only half think it is extremely or very important to provide public transit services in Livingston County. Thus, L.E.T.S. must increase residents’ awareness and perceived importance of public transit services in order to build support for a tax issue. Most importantly, this includes telling Livingston County residents who it is that uses L.E.T.S. and the reasons people use it, that is, the places they need to go. The L.E.T.S. clientele is one that usually evokes an empathetic response from voters. VOTING TENDENCIES OF THE DEMOGRAPHIC GROUPS There were several important differences by demographic group in support for the transit levy, all of which can be seen on page 6 of Appendix B. While, overall, voters were divided 44% in favor and 41% opposed on the levy issue, groups that tended to be more supportive of the issue included:
� Voters with incomes of $100,000 or more (57% in favor, 32% opposed) � Voters age 50 to 64 (50% in favor, 37% opposed) or 65 and over (47% in favor, 40% opposed) � Those who are not employed outside the home (51% in favor, 35% opposed), and � Those who travel outside the county at least once a week but less than five time a week (50%
in favor, 35% opposed). In addition:
� Females (45% in favor, 39% opposed) were somewhat more supportive and less opposed than males (43% in favor, 44% opposed).
� Support was a little higher among voters in Howell and the inner ring townships (47% in favor, 40% opposed) followed by voters in the Southeast (45% in favor, 44% opposed) than were voters in the North and West townships (42% in favor, 39% opposed).
1. Page 26 Page 26
The most variation, however, occurred by respondents’ familiarity with L.E.T.S.: � 61% of riders said they would support the levy initially while 33% would vote against. � Over half of those who could rate L.E.T.S. (53%) also said they would vote yes on the one-half
mil increase, while 34% would vote no. � But more of those not familiar with L.E.T.S. would vote no (48%) than would vote yes (35%).
1. Page 27 Page 27
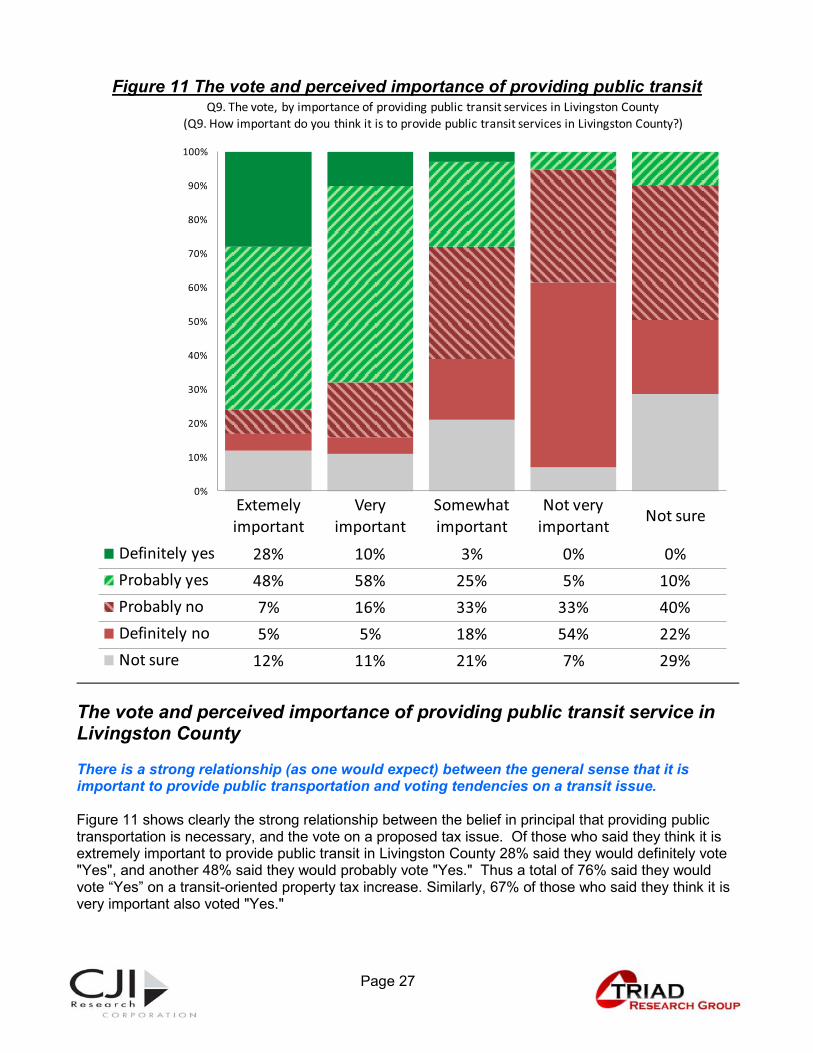
Figure 11 The vote and perceived importance of providing public transit
The vote and perceived importance of providing public transit service in Livingston County There is a strong relationship (as one would expect) between the general sense that it is important to provide public transportation and voting tendencies on a transit issue. Figure 11 shows clearly the strong relationship between the belief in principal that providing public transportation is necessary, and the vote on a proposed tax issue. Of those who said they think it is extremely important to provide public transit in Livingston County 28% said they would definitely vote "Yes", and another 48% said they would probably vote "Yes." Thus a total of 76% said they would vote “Yes” on a transit-oriented property tax increase. Similarly, 67% of those who said they think it is very important also voted "Yes."
0%
10%
20%
30%
40%
50%
60%
70%
80%
90%
100%
Extemely important
Very important
Somewhat important
Not very important Not sure
Definitely yes 28% 10% 3% 0% 0%Probably yes 48% 58% 25% 5% 10%Probably no 7% 16% 33% 33% 40%Definitely no 5% 5% 18% 54% 22%Not sure 12% 11% 21% 7% 29%
Q9. The vote, by importance of providing public transit services in Livingston County(Q9. How important do you think it is to provide public transit services in Livingston County?)
1. Page 28 Page 28
On the other hand, only 30% of those who rated providing public transit as only somewhat important would support the levy while 52% would vote against and 21% were undecided. Further, fully 87% of those who said public transit is not very important to provide in Livingston County would be opposed to a tax to expand transit services. Given that only 51% of the voters perceive providing the public transit as extremely or very important, the sense that public transit is an important public priority must be increased for a levy to be successful.
1. Page 29 Page 29
Consistency and Movement in a Property Tax Vote
1. Page 30 Page 30
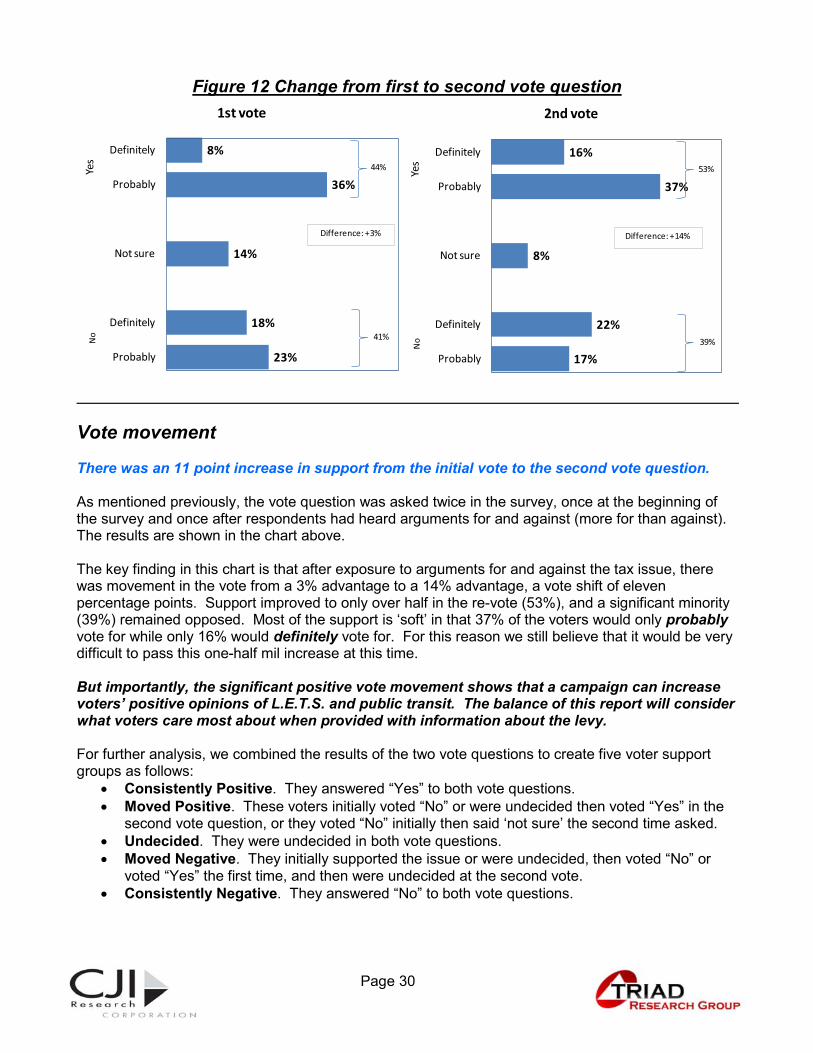
Figure 12 Change from first to second vote question
Vote movement There was an 11 point increase in support from the initial vote to the second vote question. As mentioned previously, the vote question was asked twice in the survey, once at the beginning of the survey and once after respondents had heard arguments for and against (more for than against). The results are shown in the chart above. The key finding in this chart is that after exposure to arguments for and against the tax issue, there was movement in the vote from a 3% advantage to a 14% advantage, a vote shift of eleven percentage points. Support improved to only over half in the re-vote (53%), and a significant minority (39%) remained opposed. Most of the support is ‘soft’ in that 37% of the voters would only probably vote for while only 16% would definitely vote for. For this reason we still believe that it would be very difficult to pass this one-half mil increase at this time. But importantly, the significant positive vote movement shows that a campaign can increase voters’ positive opinions of L.E.T.S. and public transit. The balance of this report will consider what voters care most about when provided with information about the levy. For further analysis, we combined the results of the two vote questions to create five voter support groups as follows:
� Consistently Positive. They answered “Yes” to both vote questions. � Moved Positive. These voters initially voted “No” or were undecided then voted “Yes” in the
second vote question, or they voted “No” initially then said ‘not sure’ the second time asked. � Undecided. They were undecided in both vote questions. � Moved Negative. They initially supported the issue or were undecided, then voted “No” or
voted “Yes” the first time, and then were undecided at the second vote. � Consistently Negative. They answered “No” to both vote questions.
23%
18%
14%
36%
8%
Probably
Definitely
Not sure
Probably
Definitely
Yes
1st vote
41%
Difference: +3%
No
44%
17%
22%
8%
37%
16%
Probably
Definitely
Not sure
Probably
Definitely
Yes
2nd vote
39%
Difference: +14%
53%
No
1. Page 31 Page 31
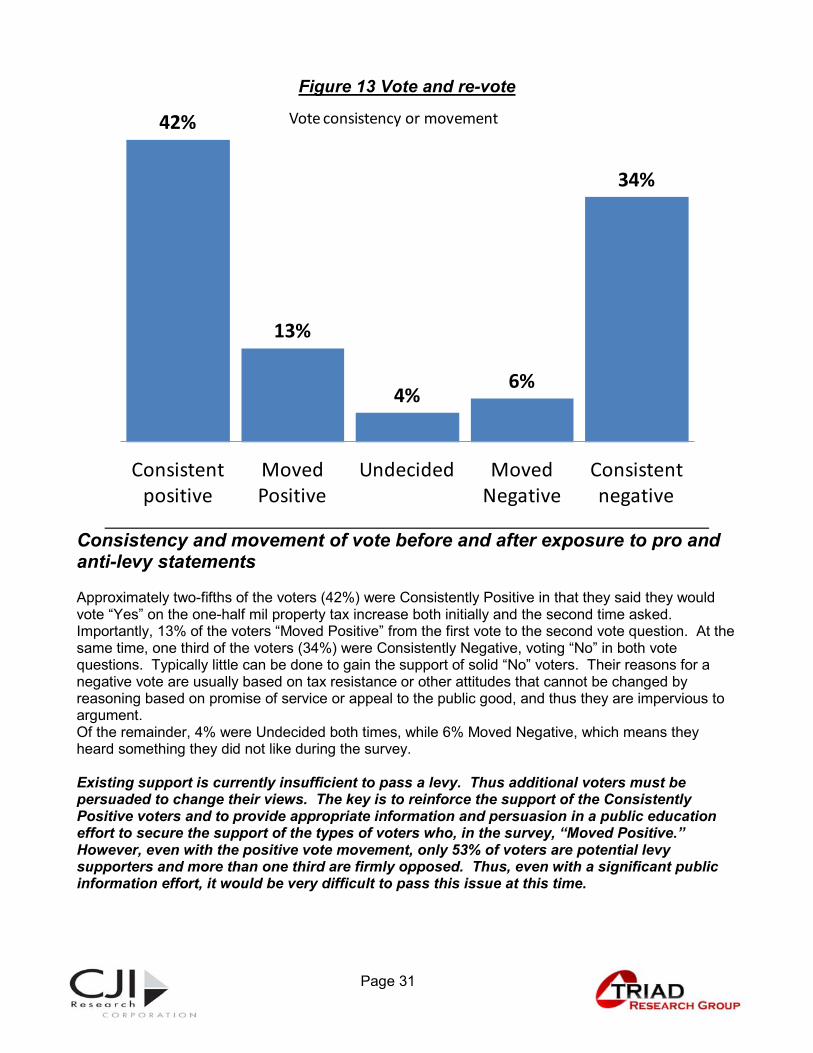
Figure 13 Vote and re-vote
Consistency and movement of vote before and after exposure to pro and anti-levy statements Approximately two-fifths of the voters (42%) were Consistently Positive in that they said they would vote “Yes” on the one-half mil property tax increase both initially and the second time asked. Importantly, 13% of the voters “Moved Positive” from the first vote to the second vote question. At the same time, one third of the voters (34%) were Consistently Negative, voting “No” in both vote questions. Typically little can be done to gain the support of solid “No” voters. Their reasons for a negative vote are usually based on tax resistance or other attitudes that cannot be changed by reasoning based on promise of service or appeal to the public good, and thus they are impervious to argument. Of the remainder, 4% were Undecided both times, while 6% Moved Negative, which means they heard something they did not like during the survey. Existing support is currently insufficient to pass a levy. Thus additional voters must be persuaded to change their views. The key is to reinforce the support of the Consistently Positive voters and to provide appropriate information and persuasion in a public education effort to secure the support of the types of voters who, in the survey, “Moved Positive.” However, even with the positive vote movement, only 53% of voters are potential levy supporters and more than one third are firmly opposed. Thus, even with a significant public information effort, it would be very difficult to pass this issue at this time.
42%
13%
4%6%
34%
Consistent positive
Moved Positive
Undecided Moved Negative
Consistent negative
Vote consistency or movement
1. Page 32 Page 32
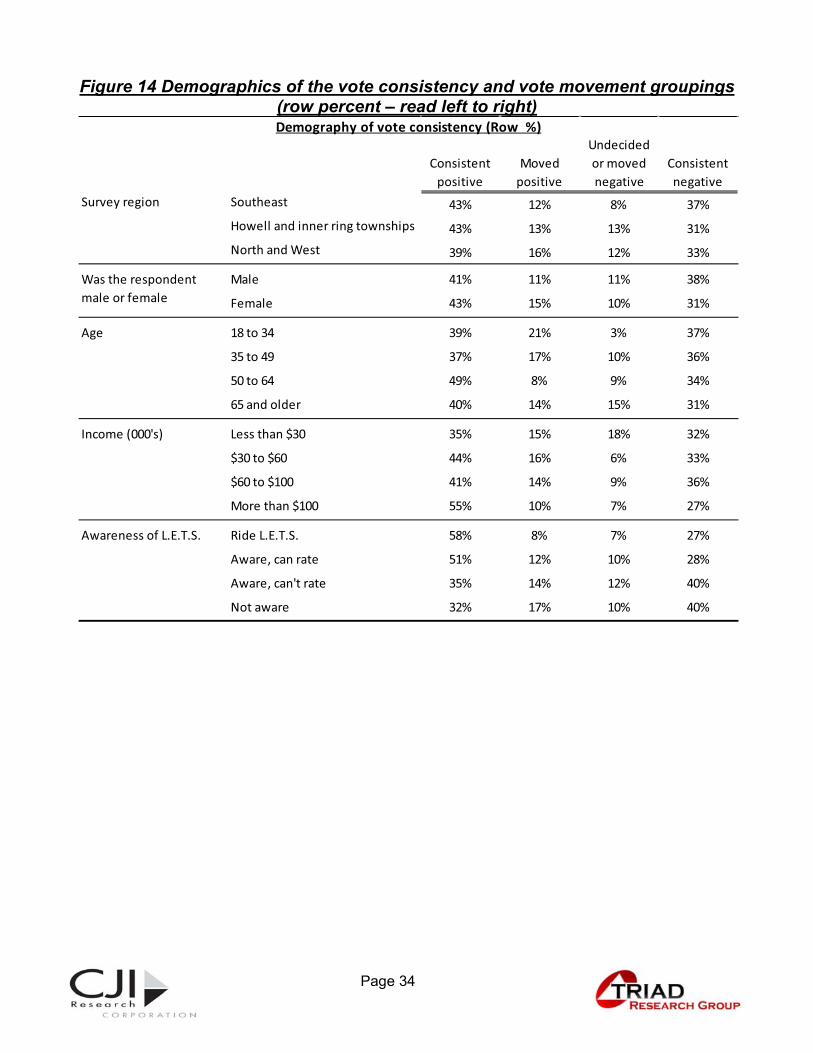
How vote consistency and vote movement varies with demography In the tables on the following two pages, we will examine the demography of vote consistency in two ways. First, we will consider vote consistency and movement within the several demographic groups. Second, we will consider the demographic characteristics within the four voter groups. In Figure 14 (following page), percentages are read left to right. For example, of voters in the Southeast part of the county, 43% responded in a Consistently Positive way, while 12% Moved Positive, 8% were consistently undecided or Moved Negative, and 37% were Consistently Negative. In reviewing Figure 14
1. Page 33 Page 33
Figure 14 on the following page, notice the following: Only three of the demographic groups contain more than half Consistently Positive voters:
� Voters with incomes of $100,000 or more (55%). This is not unusual. These voters have income and are willing to share. They are also likely to have higher levels of education than others.
� Those who said they or a household member use L.E.T.S. (58% - but keep in mind that they account for only 6% of all voter households).
� Those who do not ride, but could rate their opinion of L.E.T.S (51%).
We also find that . . . � The percent of Consistently Positive voters was slightly higher among 50 to 64 year olds
(49%) than seniors (40%) or voters under age 50 (38%). This is not surprising, given that the 50 to 64 year old period is often the period of peak earnings.
� 43% each of voters in the Howell and Southeast regions were Consistently Positive voters compared to 39% of voters in the North and West.
While overall 34% of all voters were Consistently Negative, the percentage was slightly higher among . . .
� Those not familiar with L.E.T.S. (40%) and � Those who work in Livingston County (40%).
1. Page 34 Page 34
Figure 14 Demographics of the vote consistency and vote movement groupings (row percent – read left to right)
Consistent positive
Moved positive
Undecided or moved negative
Consistent negative
Survey region Southeast 43% 12% 8% 37%Howell and inner ring townships 43% 13% 13% 31%North and West 39% 16% 12% 33%
Male 41% 11% 11% 38%
Female 43% 15% 10% 31%
Age 18 to 34 39% 21% 3% 37%
35 to 49 37% 17% 10% 36%
50 to 64 49% 8% 9% 34%
65 and older 40% 14% 15% 31%
Income (000's) Less than $30 35% 15% 18% 32%
$30 to $60 44% 16% 6% 33%
$60 to $100 41% 14% 9% 36%
More than $100 55% 10% 7% 27%
Ride L.E.T.S. 58% 8% 7% 27%
Aware, can rate 51% 12% 10% 28%
Aware, can't rate 35% 14% 12% 40%
Not aware 32% 17% 10% 40%
Awareness of L.E.T.S.
Demography of vote consistency (Row %)
Was the respondent male or female
1. Page 35 Page 35
Figure 15 The demography of the vote consistency and vote movement groupings (column percent, read top to bottom)
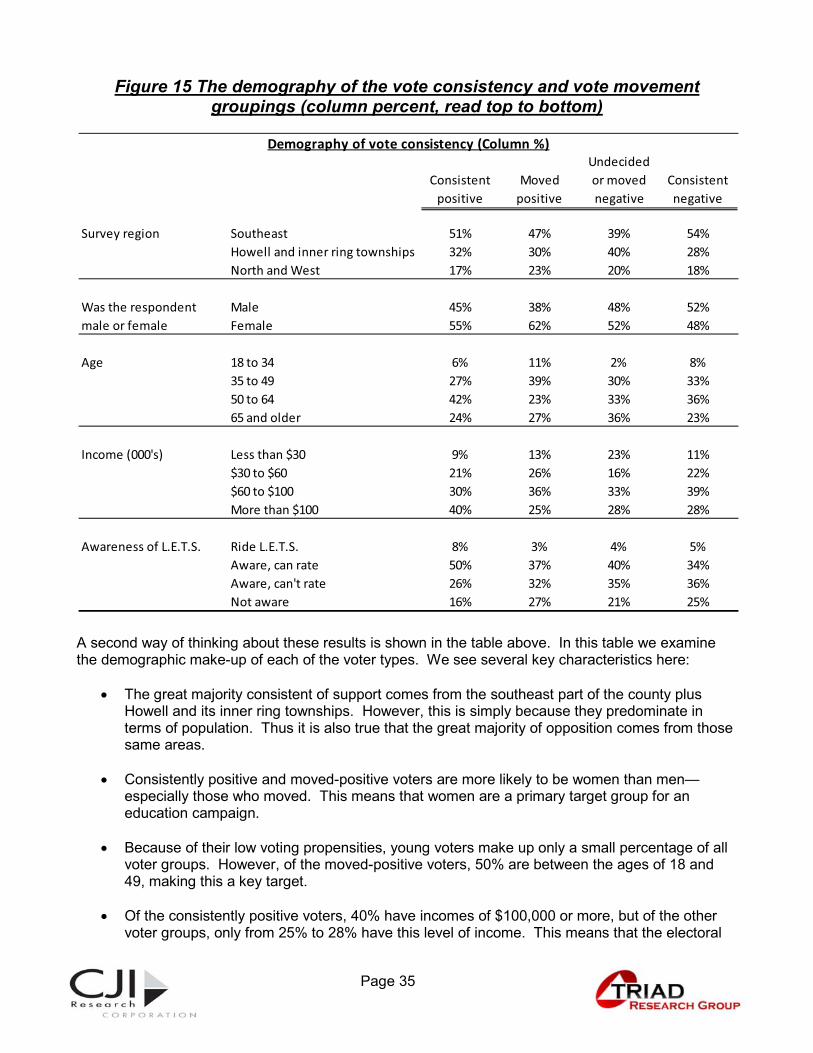
A second way of thinking about these results is shown in the table above. In this table we examine the demographic make-up of each of the voter types. We see several key characteristics here:
� The great majority consistent of support comes from the southeast part of the county plus Howell and its inner ring townships. However, this is simply because they predominate in terms of population. Thus it is also true that the great majority of opposition comes from those same areas.
� Consistently positive and moved-positive voters are more likely to be women than men—especially those who moved. This means that women are a primary target group for an education campaign.
� Because of their low voting propensities, young voters make up only a small percentage of all voter groups. However, of the moved-positive voters, 50% are between the ages of 18 and 49, making this a key target.
� Of the consistently positive voters, 40% have incomes of $100,000 or more, but of the other voter groups, only from 25% to 28% have this level of income. This means that the electoral
Consistent positive
Moved positive
Undecided or moved negative
Consistent negative
Survey region Southeast 51% 47% 39% 54%Howell and inner ring townships 32% 30% 40% 28%North and West 17% 23% 20% 18%
Male 45% 38% 48% 52%Female 55% 62% 52% 48%
Age 18 to 34 6% 11% 2% 8%35 to 49 27% 39% 30% 33%50 to 64 42% 23% 33% 36%65 and older 24% 27% 36% 23%
Income (000's) Less than $30 9% 13% 23% 11%$30 to $60 21% 26% 16% 22%$60 to $100 30% 36% 33% 39%More than $100 40% 25% 28% 28%
Ride L.E.T.S. 8% 3% 4% 5%Aware, can rate 50% 37% 40% 34%Aware, can't rate 26% 32% 35% 36%Not aware 16% 27% 21% 25%
Was the respondent male or female
Awareness of L.E.T.S.
Demography of vote consistency (Column %)
1. Page 36 Page 36
decision will rest on the willingness of those with more limited means to make public transportation a spending priority.
� Familiarity with L.E.T.S. is very important. Of those consistently positive on a transportation levy, 58% either use L.E.T.S (8%) or are sufficiently aware of it to offer a rating of its services. Of those who moved positive on a levy, a total of 57% were either unaware of L.E.T.S. (27%) or were aware of it but not aware enough to rate it. This implies that among the key factors in their vote movement was simply learning about L.E.T.S. in the course of the survey.
1. Page 37 Page 37
Reasons People Vote Against a Tax to Expand Transit Services
1. Page 38 Page 38
In their own words, why voters oppose a transit tax "Taxes" and "no use for the service" were the two main reasons given for voting “No” on the transit levy. After the first vote question, respondents voting no on the tax issue were asked to state in their own words the main reason for their negative vote. Nearly half of those opposed to the levy (45%) cited taxes – “too many,” “too high,” “no more” -- as their reason for voting no. Along with this, 18% said they cannot afford it, “do not have the money,” “bad economy,” “on a fixed income,” and similar answers. A number of respondents opposed to the levy do not see a need for the service and/or expanding transit service to the rest of the county:
� Buses do not come this far, live in rural area, not feasible (8%) � A lot of empty buses, waste of money, not a lot of demand, does not get used (4%) � Too many people have cars, do not see a need for it (5%) � Do not like the way public transportation is run, cannot be supported in small county (4%), and � System is fine as is, do not need to expand or improve it (3%).
And one fourth simply cited self-interest, saying . . .
� It would not benefit me, I do not use it, I would not use it (26%). Several reasons related to the need for more money or money management were also cited, including:
� Have enough money now (3%) � Other things are more important (3%) � Asking for a lot of money (2%), and � Find another way to fund, raise fares (<1%).
Also, 8% of the “No” voters said they need more information about the service or the tax. This is very rarely a meaningful request. It always true that the statement that "I need more information" is merely a way for a voter to avoid saying he or she either pays no attention to such things or will vote "No" regardless of the information provided.
1. Page 39 Page 39
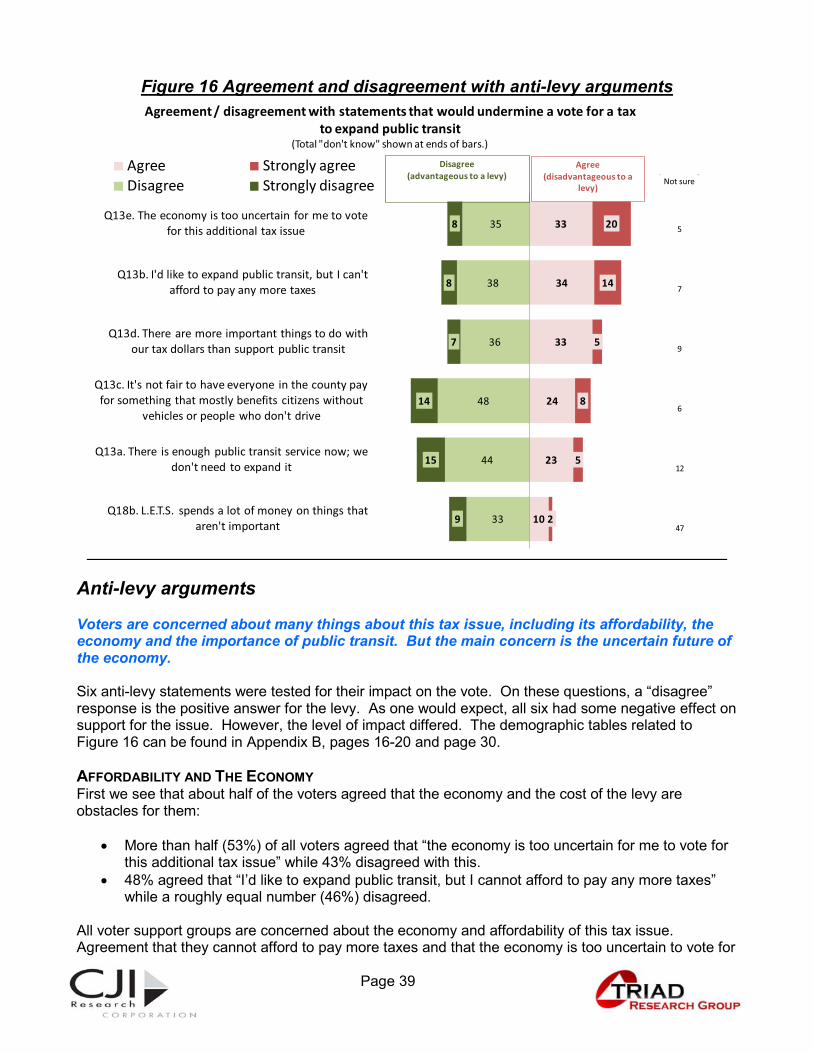
Figure 16 Agreement and disagreement with anti-levy arguments
Anti-levy arguments Voters are concerned about many things about this tax issue, including its affordability, the economy and the importance of public transit. But the main concern is the uncertain future of the economy. Six anti-levy statements were tested for their impact on the vote. On these questions, a “disagree” response is the positive answer for the levy. As one would expect, all six had some negative effect on support for the issue. However, the level of impact differed. The demographic tables related to Figure 16 can be found in Appendix B, pages 16-20 and page 30. AFFORDABILITY AND THE ECONOMY First we see that about half of the voters agreed that the economy and the cost of the levy are obstacles for them:
� More than half (53%) of all voters agreed that “the economy is too uncertain for me to vote for this additional tax issue” while 43% disagreed with this.
� 48% agreed that “I’d like to expand public transit, but I cannot afford to pay any more taxes” while a roughly equal number (46%) disagreed.
All voter support groups are concerned about the economy and affordability of this tax issue. Agreement that they cannot afford to pay more taxes and that the economy is too uncertain to vote for
10
23
24
33
34
33
2
5
8
5
14
20
33
44
48
36
38
35
9
15
14
7
8
8
Q18b. L.E.T.S. spends a lot of money on things that aren't important
Q13a. There is enough public transit service now; we don't need to expand it
Q13c. It's not fair to have everyone in the county pay for something that mostly benefits citizens without
vehicles or people who don't drive
Q13d. There are more important things to do with our tax dollars than support public transit
Q13b. I'd like to expand public transit, but I can't afford to pay any more taxes
Q13e. The economy is too uncertain for me to vote for this additional tax issue
Agreement / disagreement with statements that would undermine a vote for a tax to expand public transit
(Total "don't know" shown at ends of bars.)
Agree Strongly agreeDisagree Strongly disagree
Agree(disadvantageous to a
levy)
Disagree(advantageous to a levy) Not sure
5
7
9
6
12
47
1. Page 40 Page 40
this tax increase was particularly high among the Consistently Negative voters (68% and 80% agreed, respectively). In addition, well over half of the Moved Positive voters also agreed with both of these statements with 58% agreeing they cannot afford to pay more taxes and 61% agreeing that the economy is too uncertain to support a tax at this time. Even one fourth of the Consistently Positive voters agreed they cannot afford more taxes (25%) and that the economy is a concern (24%). This inconsistency within the core pro-issue vote is a serious weakness in the issue because so much of the pro-issue vote is "soft" and could easily defect. The economy and affordability would be serious challenges for this issue if L.E.T.S. decides to put it on the ballot. These results clearly indicate that now is not the right time to ask for this issue. PERCEIVE RELATIVE IMPORTANCE OF TRANSIT The relative importance of transit in the voter's mind is also a challenge for the transit issue. Specifically:
� 48% of voters agreed that “there are more important things to do with our tax dollars than support public transit,” while nearly as many (43%) disagreed.
Similar to the differences seen on affordability, four-fifths of Consistently Negative voters (80%) agreed that there are more important things to do with their tax dollars than support public transit. Only 15% of them disagreed with this. More of the Moved Positive voters also agreed (45%) than disagreed (41%) with this. And while 68% of Consistently Positive voters disagreed that “there are more important things to do with our tax money,” 23% of them agreed with this. Thus, even some of the core positive voters question the relative importance of supporting public transit. If L.E.T.S. moves forward with a transit issue, they must communicate the importance of providing public transit service. FAIRNESS AND NEED FOR PUBLIC TRANSIT SERVICE About one third of respondents overall agreed with two more negative statements tested, but three-fifths disagreed with each one:
� 32% agreed that “it’s not fair to have everyone in the county pay for something that mostly benefits citizens without vehicles or people who do not drive,” while 62% disagreed with this.
� Similarly, 28% of all voters agreed that “there is enough public transit service now, we do not need to expand it,” while 59% disagreed with this statement.
Here too there were significant differences between the core positive and negative voters. Over half of Consistently Negative voters agreed it’s not fair to have everyone pay for transit service (61%) and that we do not need to expand it (55%), while fewer than one tenth of Consistently Positive voters agreed with these two statements (9% and 7%, respectively). On these two items, voters who moved positive on the vote were more likely to disagree than agree.
1. Page 41 Page 41
USE OF MONEY
� Finally, only 12% of all voters agreed that “L.E.T.S. spends a lot of money on things that are not important” while 42% disagreed. It is important to note that nearly half of all voters (47%) said they “do not know” about L.E.T.S.’ use of money. In other words, over half of all voters (59%) either think the transit agency wastes a lot of money or they do not know. This makes L.E.T.S. highly vulnerable to any negative charges about its use of tax money. The vulnerability is a result of low awareness of L.E.T.S. and again points out the need to inform more voters about L.E.T.S. and what it does, before any potential opposition defines the issue differently.
MULTIVARIATE ANALYSIS – THE ECONOMY While there were major differences by the vote support groups on many of the reasons tested for voting against the additional tax, the one that most divided voters, as identified by using multivariate analysis, was the economy.
� 73% of Consistently Positive voters disagreed that the economy is too uncertain for me to vote for this additional tax issue, but even 24% of them agreed.
� But a large majority of the Moved Positive voters (61%), Undecided/Moved Negative voters (72%) and Consistently Negative voters (80%) agreed that the economy is a problem for them when it comes to supporting the transit levy.
In other words, of the 53% who agreed that the economy is too uncertain for them to support the transit issue, only 20% supported the transit tax initially while 62% were opposed. On the other hand, of the 43% of voters who disagreed and do not view the economy as an obstacle, 74% of them supported the issue while only 18% were opposed and 8% were undecided. Clearly, the currently weak economy is playing a major role in Livingston County voters’ support for tax issues and that fact suggests that some level of economic recovery would help greatly with a transit issue. Meanwhile, if not waiting for that eventuality is not an option, the best way to overcome voters’ concerns about the economy, is to increase voters’ perceptions of the need and importance of L.E.T.S'. services. Therefore, L.E.T.S should inform residents of its Dial-a-Ride service for older adults and persons with disabilities and the importance of providing and even expanding this service to the rest of the county.
1. Page 42 Page 42
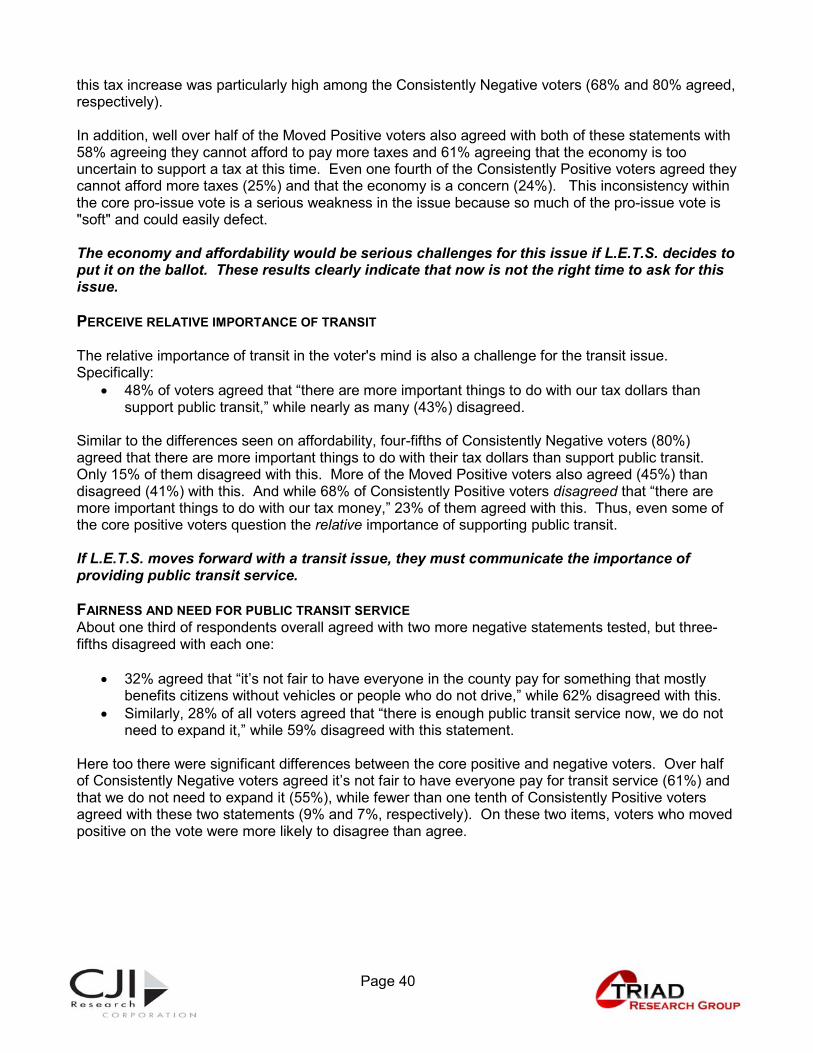
Figure 17 Cost of the millage to typical homeowner
The dollar cost of the tax
Knowing the actual dollar cost of the levy is not very helpful in gaining support, but neither is it a negative for the tax.
One third of the voters (31%) said they would be more likely to vote for the one-half mil tax when told that this tax increase would cost the owner of a $200,000 home about $4.00 a month more in taxes. About a fifth (22%) said the cost would make them less likely to vote for it. But a plurality of voters (40%) voluntarily said that a cost at that rate would make no difference to them, and 7% were not sure how to respond.
As shown in Figure 18 on the following page, the cost would be somewhat helpful in reinforcing support among the Consistently Positive voters as 53% said they would be more likely to support the tax increase knowing the dollar cost, and only 5% said it made them less likely to vote for it. The balance, 41%, volunteered that it made no difference to them. The cost could be somewhat helpful among the Moved Positive voters (41% more likely, 9% less likely, 35% no difference).
However, as one would assume, the dollar cost tends to be a reinforcing negative for the Consistently Negative voters with 46% less likely to vote “Yes” knowing the additional cost of the levy and 42% saying it makes no difference. In addition, 33% of the Undecided/Moved Negative voters were less likely to support the levy when told the cost and only 11% were more likely. In other words, while the $4.00 figure may appear quite nominal, and thus advantageous, its primary impact is to reinforce existing attitudes, not to change them.
7%
40%
22%
31%
Not sure
No difference (volunteered)
Less likely
More likely
0% 10% 20% 30% 40% 50%
Q7. What if you knew that this additional tax would cost the owner of a $200,000home about $4.00 a month more in taxes. Knowing that, would you be more
likely or less likely to vote for this one-half mill tax to expand public transit throughout Livingston County?
1. Page 43 Page 43
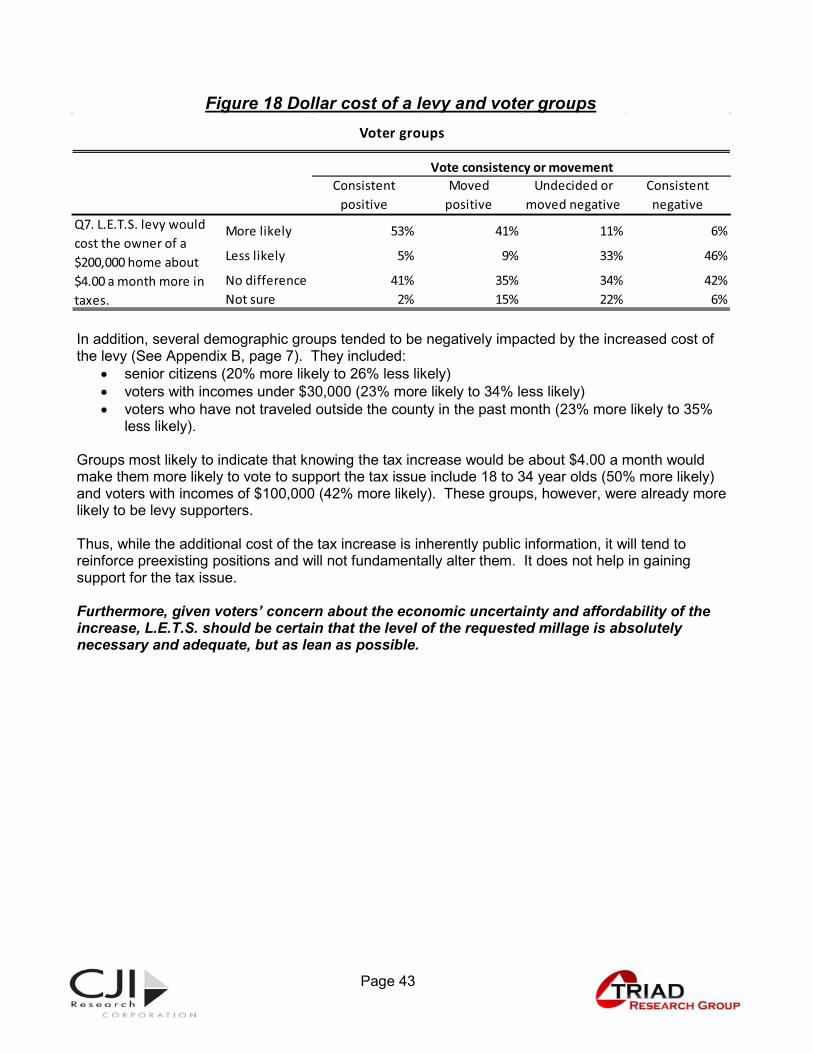
Figure 18 Dollar cost of a levy and voter groups
In addition, several demographic groups tended to be negatively impacted by the increased cost of the levy (See Appendix B, page 7). They included:
� senior citizens (20% more likely to 26% less likely) � voters with incomes under $30,000 (23% more likely to 34% less likely) � voters who have not traveled outside the county in the past month (23% more likely to 35%
less likely). Groups most likely to indicate that knowing the tax increase would be about $4.00 a month would make them more likely to vote to support the tax issue include 18 to 34 year olds (50% more likely) and voters with incomes of $100,000 (42% more likely). These groups, however, were already more likely to be levy supporters. Thus, while the additional cost of the tax increase is inherently public information, it will tend to reinforce preexisting positions and will not fundamentally alter them. It does not help in gaining support for the tax issue. Furthermore, given voters’ concern about the economic uncertainty and affordability of the increase, L.E.T.S. should be certain that the level of the requested millage is absolutely necessary and adequate, but as lean as possible.
Consistent positive
Moved positive
Undecided or moved negative
Consistent negative
More likely 53% 41% 11% 6%
Less likely 5% 9% 33% 46%
No difference 41% 35% 34% 42%Not sure 2% 15% 22% 6%
Vote consistency or movement
Q7. L.E.T.S. levy would cost the owner of a $200,000 home about $4.00 a month more in taxes.
Voter groups

1. Page 44 Page 44
1. Page 45 Page 45
Arguments in Favor of a Tax to Expand Transit Services
1. Page 46 Page 46
In their own words, why voters would support a transit tax Voters supporting L.E.T.S.’ property tax increase think public transit service needs to be expanded or that it is important. Following the first vote question, those voting “Yes” on the one-half mil property tax were asked, “What is your main reason for voting that way?” They responded in an open-ended manner and the comments were grouped as shown below. The main reasons given by supporters related to the need for or importance of providing public transportation:
� It’s needed, a good service, for people who do not drive, do not have cars, students, children (27%)
� It’s important, I believe in public transportation (22%) � People need public transportation (17%) � Elderly citizens, handicapped need transportation (15%) and � Services need to be expanded, to improve services (13%).
Some mentioned a few advantages or benefits of having public transit services:
� Good for the county, important to the community, increases property values (10%) � Saves on gas, energy, money; cuts down on cars, pollution, etc. (9%) and � Helps the economy, businesses, people find jobs (7%).
In addition, some use it or think they might use it:
� I use it, I know someone who uses it (3%) and � Might use it in the future (6%).
1. Page 47 Page 47
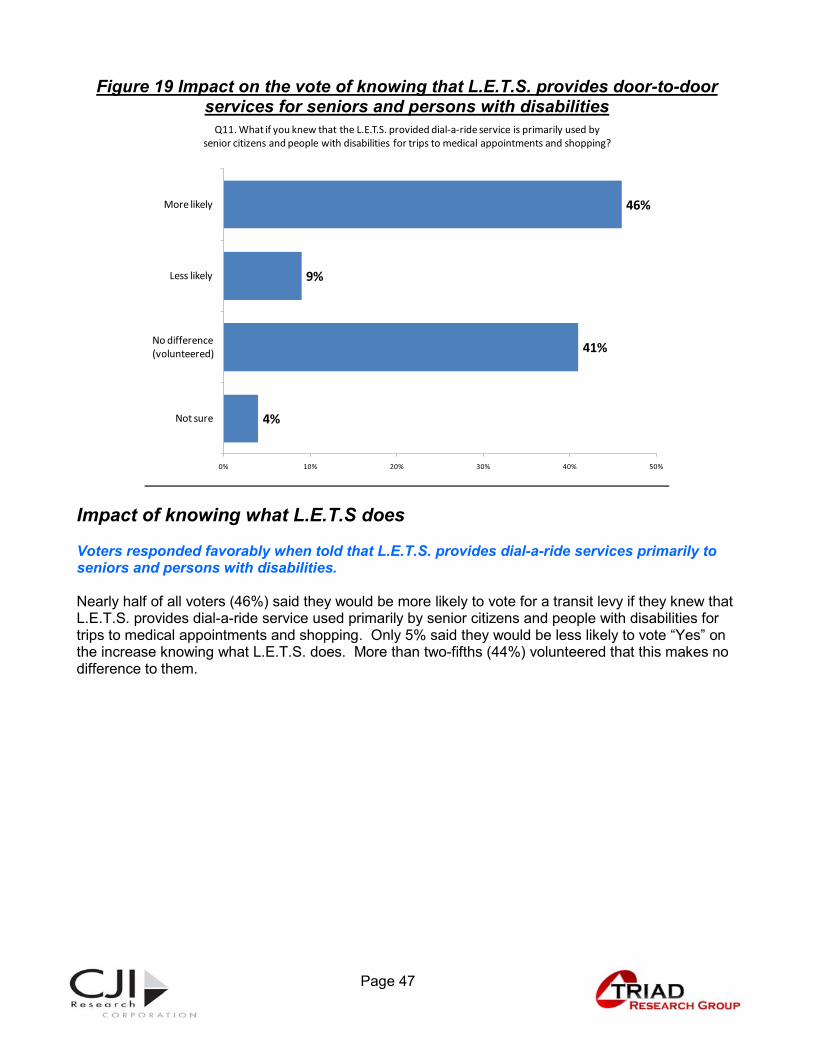
Figure 19 Impact on the vote of knowing that L.E.T.S. provides door-to-door services for seniors and persons with disabilities
Impact of knowing what L.E.T.S does Voters responded favorably when told that L.E.T.S. provides dial-a-ride services primarily to seniors and persons with disabilities. Nearly half of all voters (46%) said they would be more likely to vote for a transit levy if they knew that L.E.T.S. provides dial-a-ride service used primarily by senior citizens and people with disabilities for trips to medical appointments and shopping. Only 5% said they would be less likely to vote “Yes” on the increase knowing what L.E.T.S. does. More than two-fifths (44%) volunteered that this makes no difference to them.
4%
41%
9%
46%
Not sure
No difference (volunteered)
Less likely
More likely
0% 10% 20% 30% 40% 50%
Q11. What if you knew that the L.E.T.S. provided dial-a-ride service is primarily used by senior citizens and people with disabilities for trips to medical appointments and shopping?
1. Page 48 Page 48
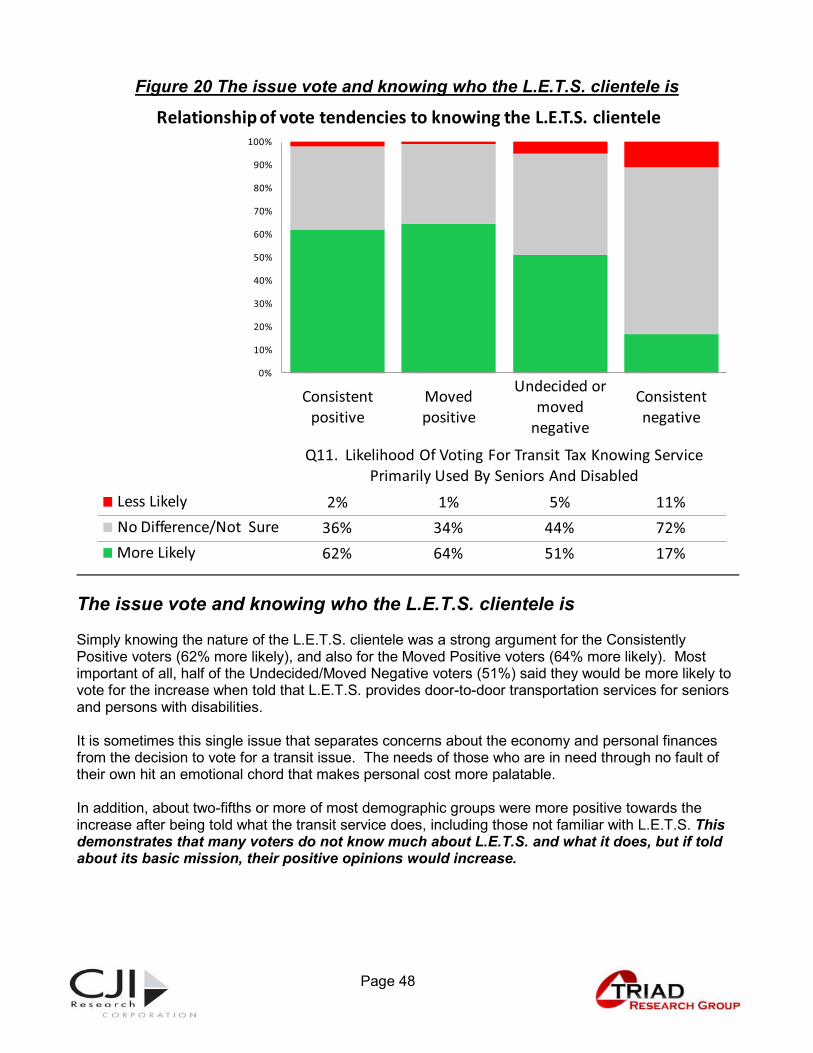
Figure 20 The issue vote and knowing who the L.E.T.S. clientele is
The issue vote and knowing who the L.E.T.S. clientele is Simply knowing the nature of the L.E.T.S. clientele was a strong argument for the Consistently Positive voters (62% more likely), and also for the Moved Positive voters (64% more likely). Most important of all, half of the Undecided/Moved Negative voters (51%) said they would be more likely to vote for the increase when told that L.E.T.S. provides door-to-door transportation services for seniors and persons with disabilities. It is sometimes this single issue that separates concerns about the economy and personal finances from the decision to vote for a transit issue. The needs of those who are in need through no fault of their own hit an emotional chord that makes personal cost more palatable. In addition, about two-fifths or more of most demographic groups were more positive towards the increase after being told what the transit service does, including those not familiar with L.E.T.S. This demonstrates that many voters do not know much about L.E.T.S. and what it does, but if told about its basic mission, their positive opinions would increase.
Consistent positive
Moved positive
Undecided or moved
negative
Consistent negative
Q11. Likelihood Of Voting For Transit Tax Knowing Service Primarily Used By Seniors And Disabled
Less Likely 2% 1% 5% 11%No Difference/Not Sure 36% 34% 44% 72%More Likely 62% 64% 51% 17%
0%
10%
20%
30%
40%
50%
60%
70%
80%
90%
100%
Relationship of vote tendencies to knowing the L.E.T.S. clientele
1. Page 49 Page 49
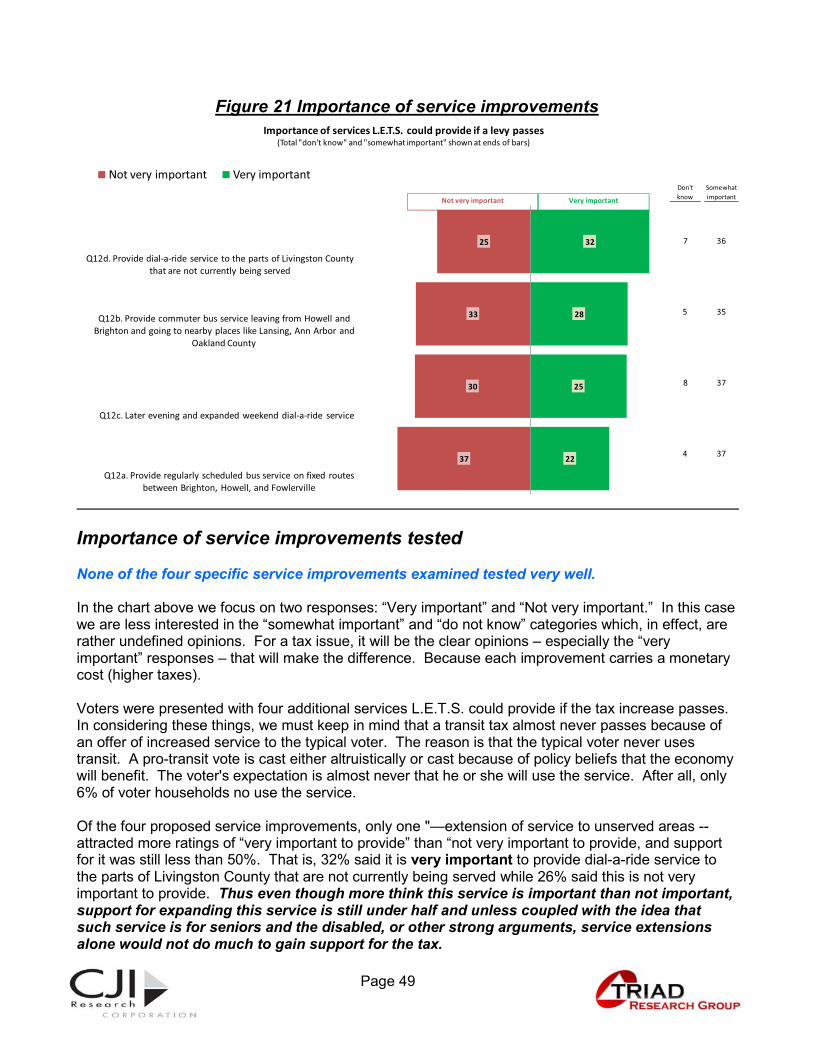
Figure 21 Importance of service improvements
Importance of service improvements tested None of the four specific service improvements examined tested very well. In the chart above we focus on two responses: “Very important” and “Not very important.” In this case we are less interested in the “somewhat important” and “do not know” categories which, in effect, are rather undefined opinions. For a tax issue, it will be the clear opinions – especially the “very important” responses – that will make the difference. Because each improvement carries a monetary cost (higher taxes). Voters were presented with four additional services L.E.T.S. could provide if the tax increase passes. In considering these things, we must keep in mind that a transit tax almost never passes because of an offer of increased service to the typical voter. The reason is that the typical voter never uses transit. A pro-transit vote is cast either altruistically or cast because of policy beliefs that the economy will benefit. The voter's expectation is almost never that he or she will use the service. After all, only 6% of voter households no use the service. Of the four proposed service improvements, only one "—extension of service to unserved areas -- attracted more ratings of “very important to provide” than “not very important to provide, and support for it was still less than 50%. That is, 32% said it is very important to provide dial-a-ride service to the parts of Livingston County that are not currently being served while 26% said this is not very important to provide. Thus even though more think this service is important than not important, support for expanding this service is still under half and unless coupled with the idea that such service is for seniors and the disabled, or other strong arguments, service extensions alone would not do much to gain support for the tax.
Don't know
Somewhat important
7 36
5 35
8 37
4 3737
30
33
25
22
25
28
32
Q12a. Provide regularly scheduled bus service on fixed routes between Brighton, Howell, and Fowlerville
Q12c. Later evening and expanded weekend dial-a-ride service
Q12b. Provide commuter bus service leaving from Howell and Brighton and going to nearby places like Lansing, Ann Arbor and
Oakland County
Q12d. Provide dial-a-ride service to the parts of Livingston County that are not currently being served
Importance of services L.E.T.S. could provide if a levy passes(Total "don't know" and "somewhat important" shown at ends of bars)
Not very important Very important
Very importantNot very important
1. Page 50 Page 50
Only about one fourth of voters rated each of the three other service improvements as very important for L.E.T.S. to provide while about one third said they are not very important to provide. They were:
� Commuter bus service leaving from Howell and Brighton and going to nearby places like Lansing, Ann Arbor and Oakland County (28% very important, 33% not very important)
� Later evening and expanded weekend dial-a-ride service (25% very important, 30% not very important) and
� Regularly scheduled bus service on fixed routes between Brighton, Howell and Fowlerville (22% very important, 37% not very important).
There was limited demographic variation in opinions on these proposed service improvements (See also Appendix B, pages 12-15). Outside of the Consistently Positive voters, there was little support for the four additional transit services tested.
� Over half of Consistently Positive voters (56%) said it is very important to provide dial-a-ride services to the rest of Livingston County, but only 27% of Moved Positive voters said expanding dial-a-ride services is very important and only 8% of Consistently Negative voters said this.
� Also, only one fourth of L.E.T.S. rider households (26%) said expanding dial-a-ride to the rest of the county is very important.
� On the other service improvement items, fewer than less than half of even the Consistently Positive voters rated each one as very important to provide.
� Regionally, 32% of voters in the Southeast said that providing commuter bus service from Howell and Brighton to places like Lansing, Ann Arbor and Oakland County is very important. In this they were more likely for feel such service was very important than voters in Howell and the inner ring townships (25%) or the North and West townships (21%).
� Voters in the North and West placed more importance on providing regular bus service on fixed routes between Brighton, Howell and Fowlerville (30%) than voters in the Southeast (20%) or Howell and the inner ring townships (20%).
Clearly, the proposed service improvements are not reasons enough to pass a tax, since after all, most people do not use public transit and many do not know about its current service. It would be better for L.E.T.S. to emphasize the types of people who are likely to use public transit, for what purpose and how it benefits them and the county or their community. It is clear, however, that voters think it is important to have, and may be willing to support, dial-a-ride services for seniors and those with disabilities.
1. Page 51 Page 51
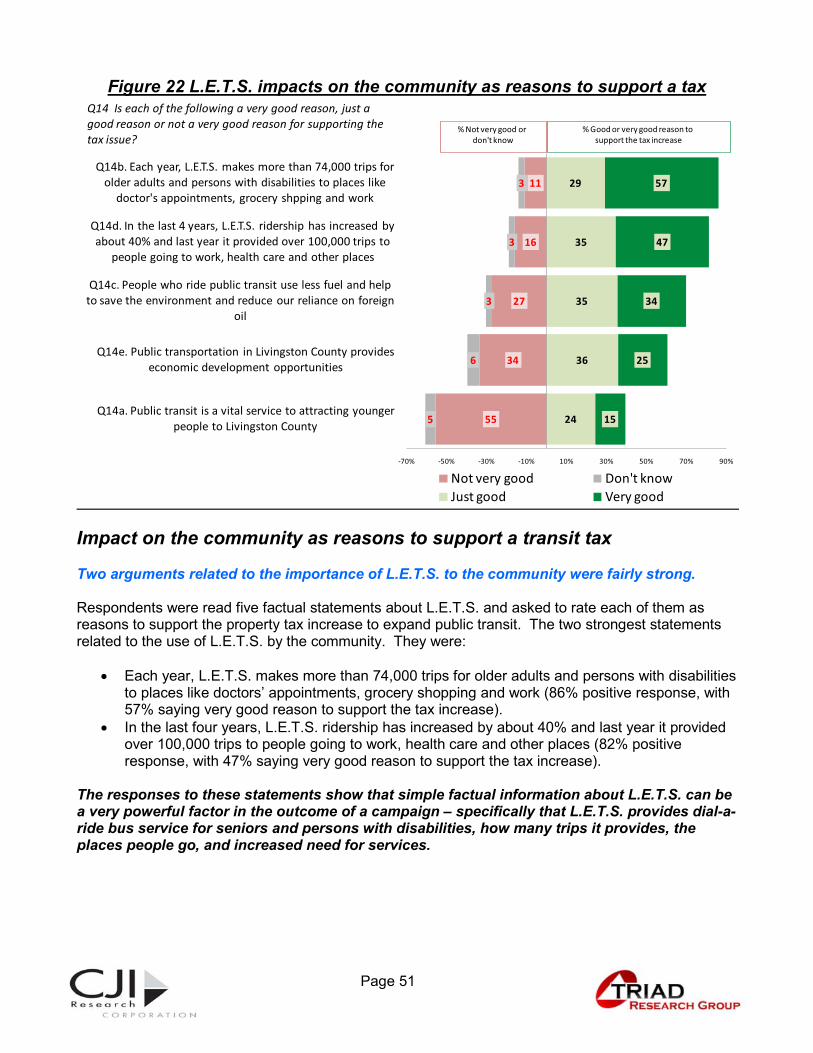
Figure 22 L.E.T.S. impacts on the community as reasons to support a tax
Impact on the community as reasons to support a transit tax Two arguments related to the importance of L.E.T.S. to the community were fairly strong. Respondents were read five factual statements about L.E.T.S. and asked to rate each of them as reasons to support the property tax increase to expand public transit. The two strongest statements related to the use of L.E.T.S. by the community. They were:
� Each year, L.E.T.S. makes more than 74,000 trips for older adults and persons with disabilities to places like doctors’ appointments, grocery shopping and work (86% positive response, with 57% saying very good reason to support the tax increase).
� In the last four years, L.E.T.S. ridership has increased by about 40% and last year it provided over 100,000 trips to people going to work, health care and other places (82% positive response, with 47% saying very good reason to support the tax increase).
The responses to these statements show that simple factual information about L.E.T.S. can be a very powerful factor in the outcome of a campaign – specifically that L.E.T.S. provides dial-a-ride bus service for seniors and persons with disabilities, how many trips it provides, the places people go, and increased need for services.
55
34
27
16
11
5
6
3
3
3
24
36
35
35
29
15
25
34
47
57
-70% -50% -30% -10% 10% 30% 50% 70% 90%
Q14a. Public transit is a vital service to attracting younger people to Livingston County
Q14e. Public transportation in Livingston County provides economic development opportunities
Q14c. People who ride public transit use less fuel and help to save the environment and reduce our reliance on foreign
oil
Q14d. In the last 4 years, L.E.T.S. ridership has increased by about 40% and last year it provided over 100,000 trips to
people going to work, health care and other places
Q14b. Each year, L.E.T.S. makes more than 74,000 trips for older adults and persons with disabilities to places like
doctor's appointments, grocery shpping and work
Not very good Don't knowJust good Very good
% Not very good or don't know
Q14 Is each of the following a very good reason, just a good reason or not a very good reason for supporting the tax issue?
% Good or very good reason to support the tax increase
1. Page 52 Page 52
Two more positive and factual statements were well received, but they were not as strong. They related to the economic benefit and the environmental impact:
� People who ride public transit use less fuel and help to save the environment and reduce our reliance on foreign oil (70% positive response, with 35% saying very good reason to support the tax increase) and
� Public transit in Livingston County provides economic development opportunities (61% positive, with 25% saying very good reason to support the tax increase).
These two statements can be used as secondary or supporting arguments, but are not strong enough to convince voters to support the tax issue. Less important to voters overall was that “public transit is a vital service to attracting younger people to Livingston County.” Less than two-fifths (39%) said this is a very good reason (15%) or only a good reason (24%) to support the tax, while over half (55%) said it is not a very good reason. This is not a reason to support a tax to expand public transit.
1. Page 53 Page 53
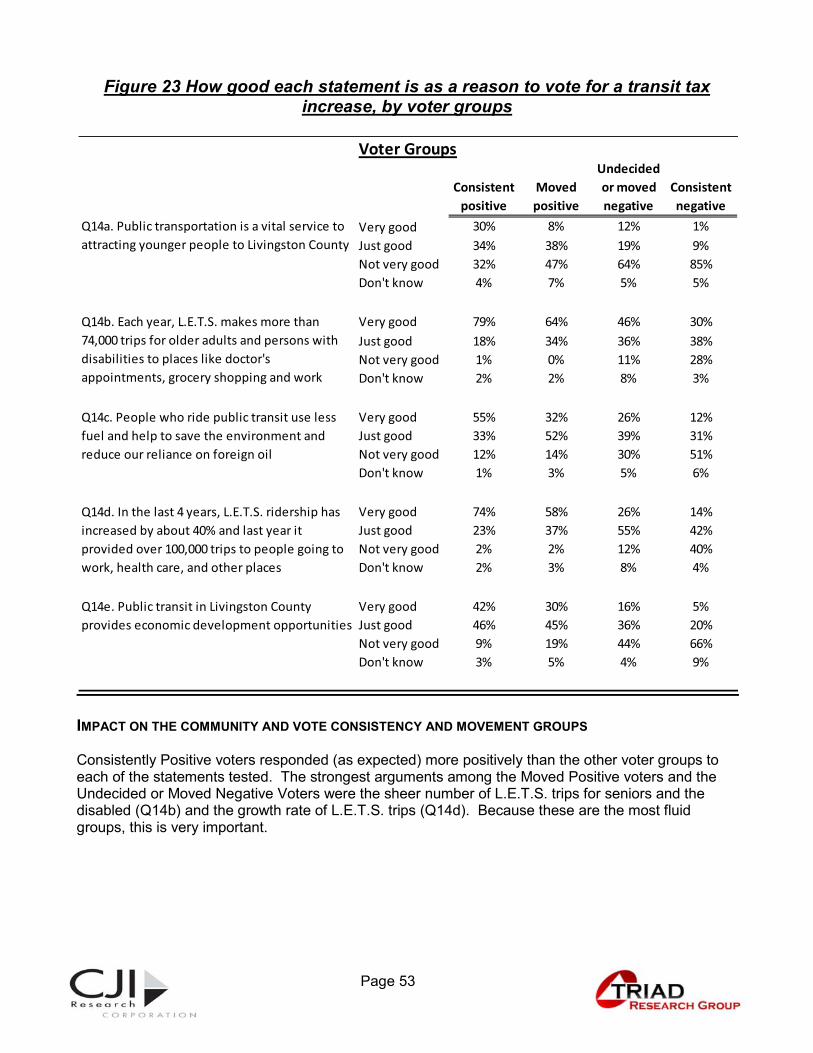
Figure 23 How good each statement is as a reason to vote for a transit tax increase, by voter groups
IMPACT ON THE COMMUNITY AND VOTE CONSISTENCY AND MOVEMENT GROUPS Consistently Positive voters responded (as expected) more positively than the other voter groups to each of the statements tested. The strongest arguments among the Moved Positive voters and the Undecided or Moved Negative Voters were the sheer number of L.E.T.S. trips for seniors and the disabled (Q14b) and the growth rate of L.E.T.S. trips (Q14d). Because these are the most fluid groups, this is very important.
Consistent positive
Moved positive
Undecided or moved negative
Consistent negative
Very good 30% 8% 12% 1%Just good 34% 38% 19% 9%Not very good 32% 47% 64% 85%Don't know 4% 7% 5% 5%
Very good 79% 64% 46% 30%Just good 18% 34% 36% 38%Not very good 1% 0% 11% 28%Don't know 2% 2% 8% 3%
Very good 55% 32% 26% 12%Just good 33% 52% 39% 31%Not very good 12% 14% 30% 51%Don't know 1% 3% 5% 6%
Very good 74% 58% 26% 14%Just good 23% 37% 55% 42%Not very good 2% 2% 12% 40%Don't know 2% 3% 8% 4%
Very good 42% 30% 16% 5%Just good 46% 45% 36% 20%Not very good 9% 19% 44% 66%Don't know 3% 5% 4% 9%
Voter Groups
Q14a. Public transportation is a vital service to attracting younger people to Livingston County
Q14b. Each year, L.E.T.S. makes more than 74,000 trips for older adults and persons with disabilities to places like doctor's appointments, grocery shopping and work
Q14c. People who ride public transit use less fuel and help to save the environment and reduce our reliance on foreign oil
Q14d. In the last 4 years, L.E.T.S. ridership has increased by about 40% and last year it provided over 100,000 trips to people going to work, health care, and other places
Q14e. Public transit in Livingston County provides economic development opportunities
1. Page 54 Page 54
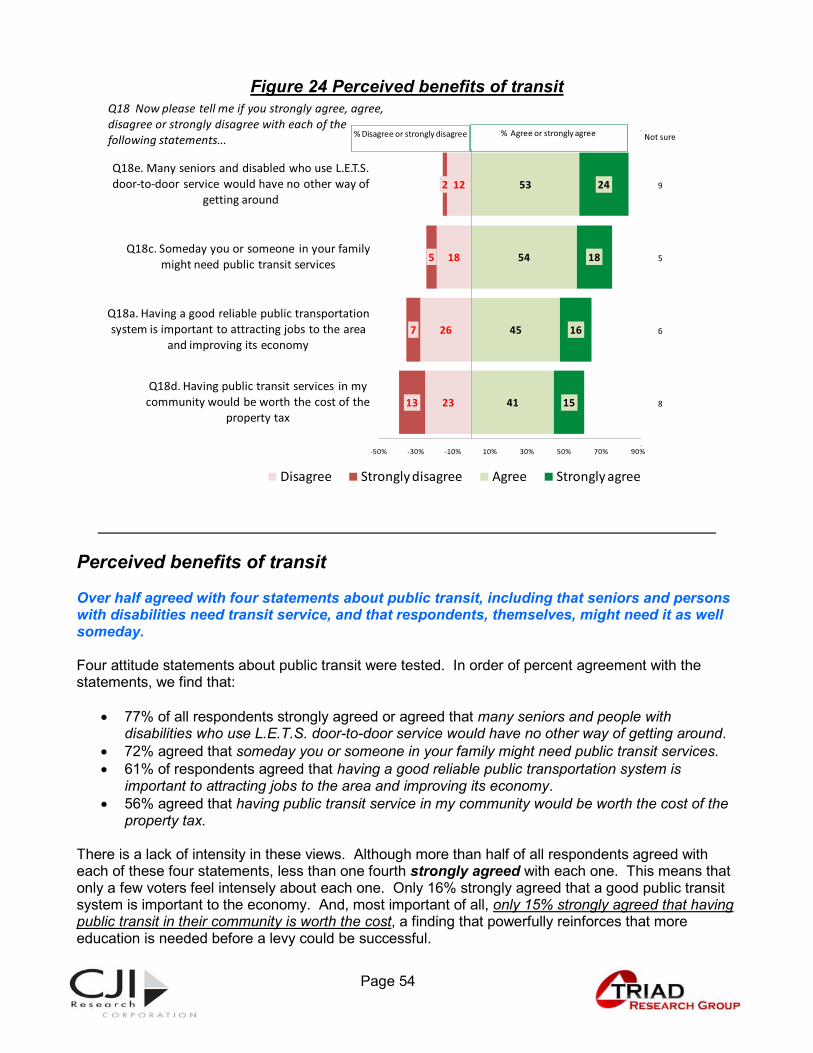
Figure 24 Perceived benefits of transit
Perceived benefits of transit Over half agreed with four statements about public transit, including that seniors and persons with disabilities need transit service, and that respondents, themselves, might need it as well someday. Four attitude statements about public transit were tested. In order of percent agreement with the statements, we find that:
� 77% of all respondents strongly agreed or agreed that many seniors and people with disabilities who use L.E.T.S. door-to-door service would have no other way of getting around.
� 72% agreed that someday you or someone in your family might need public transit services. � 61% of respondents agreed that having a good reliable public transportation system is
important to attracting jobs to the area and improving its economy. � 56% agreed that having public transit service in my community would be worth the cost of the
property tax. There is a lack of intensity in these views. Although more than half of all respondents agreed with each of these four statements, less than one fourth strongly agreed with each one. This means that only a few voters feel intensely about each one. Only 16% strongly agreed that a good public transit system is important to the economy. And, most important of all, only 15% strongly agreed that having public transit in their community is worth the cost, a finding that powerfully reinforces that more education is needed before a levy could be successful.
23
26
18
12
13
7
5
2
41
45
54
53
15
16
18
24
-50% -30% -10% 10% 30% 50% 70% 90%
Q18d. Having public transit services in my community would be worth the cost of the
property tax
Q18a. Having a good reliable public transportation system is important to attracting jobs to the area
and improving its economy
Q18c. Someday you or someone in your family might need public transit services
Q18e. Many seniors and disabled who use L.E.T.S. door-to-door service would have no other way of
getting around
Disagree Strongly disagree Agree Strongly agree
% Agree or strongly agree% Disagree or strongly disagree
Q18 Now please tell me if you strongly agree, agree, disagree or strongly disagree with each of the following statements... Not sure
9
5
6
8
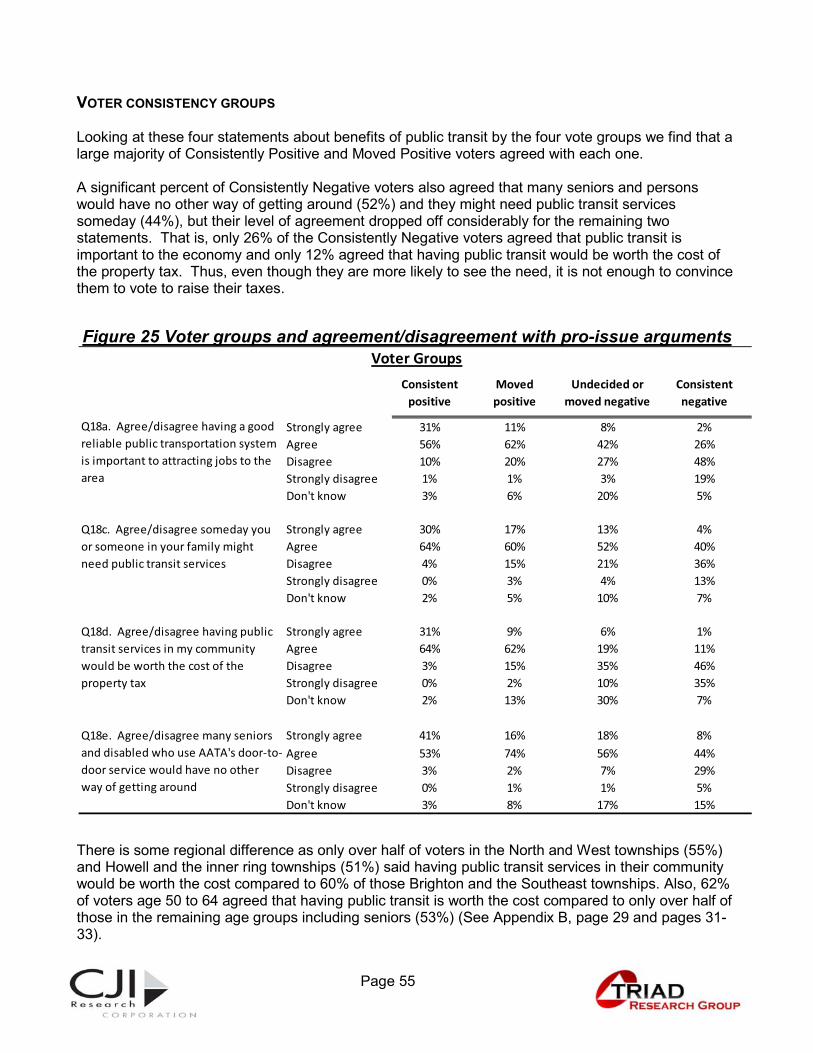
1. Page 55 Page 55
VOTER CONSISTENCY GROUPS Looking at these four statements about benefits of public transit by the four vote groups we find that a large majority of Consistently Positive and Moved Positive voters agreed with each one. A significant percent of Consistently Negative voters also agreed that many seniors and persons would have no other way of getting around (52%) and they might need public transit services someday (44%), but their level of agreement dropped off considerably for the remaining two statements. That is, only 26% of the Consistently Negative voters agreed that public transit is important to the economy and only 12% agreed that having public transit would be worth the cost of the property tax. Thus, even though they are more likely to see the need, it is not enough to convince them to vote to raise their taxes.
There is some regional difference as only over half of voters in the North and West townships (55%) and Howell and the inner ring townships (51%) said having public transit services in their community would be worth the cost compared to 60% of those Brighton and the Southeast townships. Also, 62% of voters age 50 to 64 agreed that having public transit is worth the cost compared to only over half of those in the remaining age groups including seniors (53%) (See Appendix B, page 29 and pages 31-33).
Figure 25 Voter groups and agreement/disagreement with pro-issue arguments
Consistent positive
Moved positive
Undecided or moved negative
Consistent negative
Strongly agree 31% 11% 8% 2%Agree 56% 62% 42% 26%Disagree 10% 20% 27% 48%Strongly disagree 1% 1% 3% 19%Don't know 3% 6% 20% 5%
Strongly agree 30% 17% 13% 4%Agree 64% 60% 52% 40%Disagree 4% 15% 21% 36%Strongly disagree 0% 3% 4% 13%Don't know 2% 5% 10% 7%
Strongly agree 31% 9% 6% 1%Agree 64% 62% 19% 11%Disagree 3% 15% 35% 46%Strongly disagree 0% 2% 10% 35%Don't know 2% 13% 30% 7%
Strongly agree 41% 16% 18% 8%Agree 53% 74% 56% 44%Disagree 3% 2% 7% 29%Strongly disagree 0% 1% 1% 5%Don't know 3% 8% 17% 15%
Q18a. Agree/disagree having a good reliable public transportation system is important to attracting jobs to the area
Q18c. Agree/disagree someday you or someone in your family might need public transit services
Q18d. Agree/disagree having public transit services in my community would be worth the cost of the property tax
Q18e. Agree/disagree many seniors and disabled who use AATA's door-to-door service would have no other way of getting around
Voter Groups

1. Page 56 Page 56
1. Page 57 Page 57
Attitudes toward Possible Rail Service
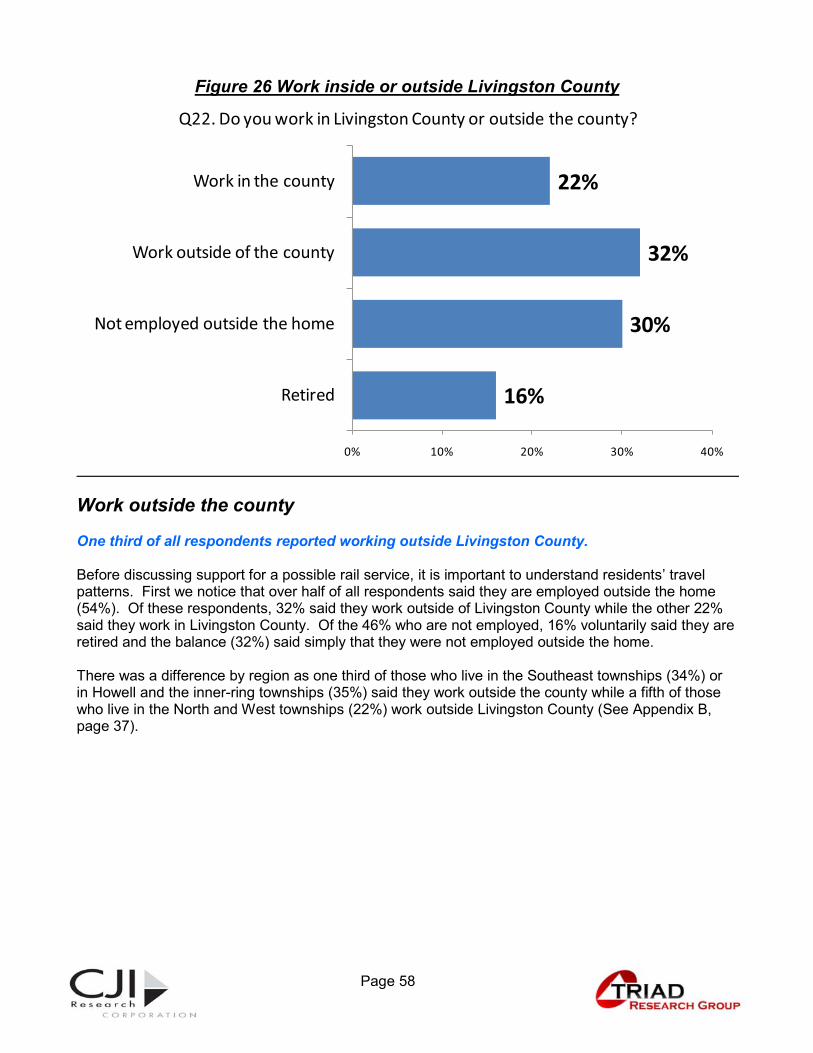
1. Page 58 Page 58
Figure 26 Work inside or outside Livingston County
Work outside the county One third of all respondents reported working outside Livingston County. Before discussing support for a possible rail service, it is important to understand residents’ travel patterns. First we notice that over half of all respondents said they are employed outside the home (54%). Of these respondents, 32% said they work outside of Livingston County while the other 22% said they work in Livingston County. Of the 46% who are not employed, 16% voluntarily said they are retired and the balance (32%) said simply that they were not employed outside the home. There was a difference by region as one third of those who live in the Southeast townships (34%) or in Howell and the inner-ring townships (35%) said they work outside the county while a fifth of those who live in the North and West townships (22%) work outside Livingston County (See Appendix B, page 37).
16%
30%
32%
22%
Retired
Not employed outside the home
Work outside of the county
Work in the county
0% 10% 20% 30% 40%
Q22. Do you work in Livingston County or outside the county?
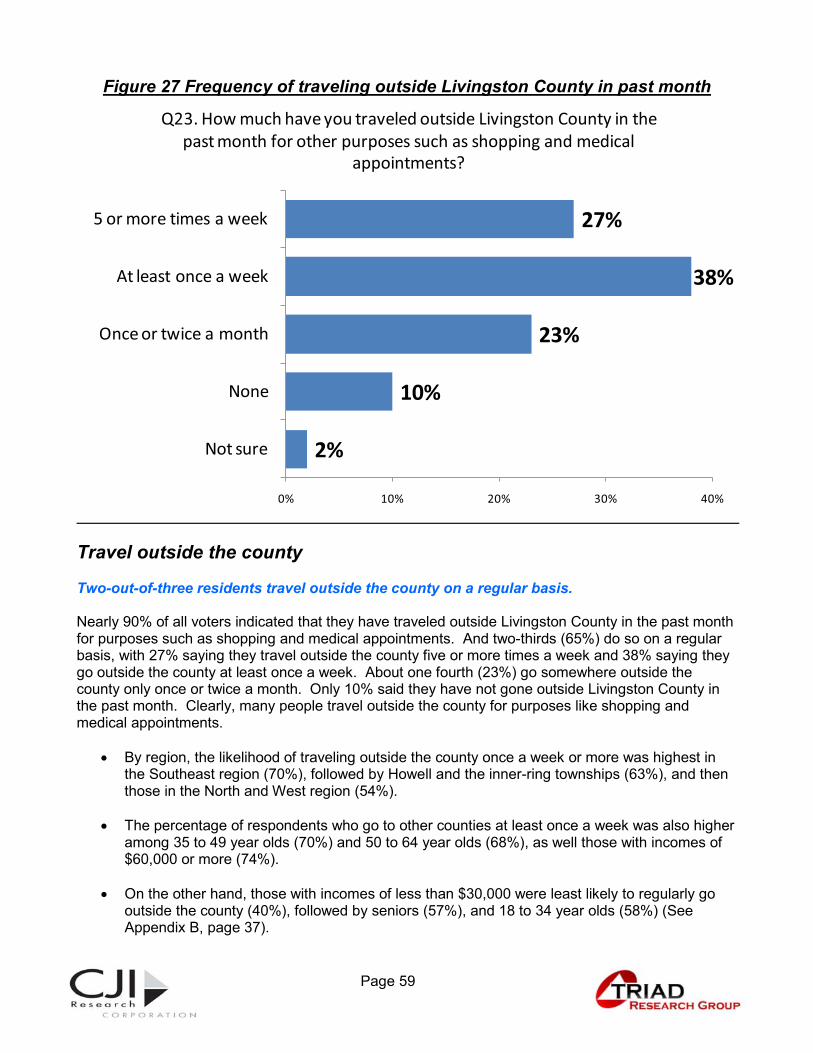
1. Page 59 Page 59
Figure 27 Frequency of traveling outside Livingston County in past month
Travel outside the county Two-out-of-three residents travel outside the county on a regular basis. Nearly 90% of all voters indicated that they have traveled outside Livingston County in the past month for purposes such as shopping and medical appointments. And two-thirds (65%) do so on a regular basis, with 27% saying they travel outside the county five or more times a week and 38% saying they go outside the county at least once a week. About one fourth (23%) go somewhere outside the county only once or twice a month. Only 10% said they have not gone outside Livingston County in the past month. Clearly, many people travel outside the county for purposes like shopping and medical appointments.
� By region, the likelihood of traveling outside the county once a week or more was highest in the Southeast region (70%), followed by Howell and the inner-ring townships (63%), and then those in the North and West region (54%).
� The percentage of respondents who go to other counties at least once a week was also higher
among 35 to 49 year olds (70%) and 50 to 64 year olds (68%), as well those with incomes of $60,000 or more (74%).
� On the other hand, those with incomes of less than $30,000 were least likely to regularly go
outside the county (40%), followed by seniors (57%), and 18 to 34 year olds (58%) (See Appendix B, page 37).
2%
10%
23%
38%
27%
Not sure
None
Once or twice a month
At least once a week
5 or more times a week
0% 10% 20% 30% 40%
Q23. How much have you traveled outside Livingston County in the past month for other purposes such as shopping and medical
appointments?
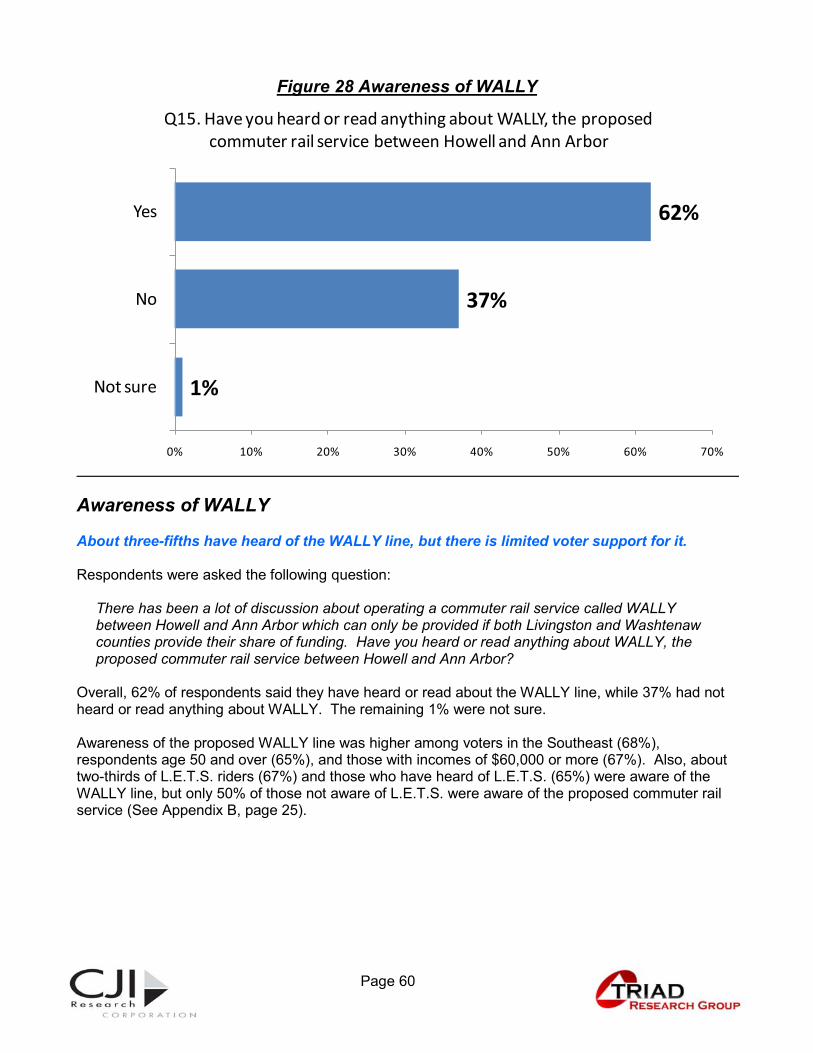
1. Page 60 Page 60
Figure 28 Awareness of WALLY
Awareness of WALLY About three-fifths have heard of the WALLY line, but there is limited voter support for it. Respondents were asked the following question:
There has been a lot of discussion about operating a commuter rail service called WALLY between Howell and Ann Arbor which can only be provided if both Livingston and Washtenaw counties provide their share of funding. Have you heard or read anything about WALLY, the proposed commuter rail service between Howell and Ann Arbor?
Overall, 62% of respondents said they have heard or read about the WALLY line, while 37% had not heard or read anything about WALLY. The remaining 1% were not sure. Awareness of the proposed WALLY line was higher among voters in the Southeast (68%), respondents age 50 and over (65%), and those with incomes of $60,000 or more (67%). Also, about two-thirds of L.E.T.S. riders (67%) and those who have heard of L.E.T.S. (65%) were aware of the WALLY line, but only 50% of those not aware of L.E.T.S. were aware of the proposed commuter rail service (See Appendix B, page 25).
1%
37%
62%
Not sure
No
Yes
0% 10% 20% 30% 40% 50% 60% 70%
Q15. Have you heard or read anything about WALLY, the proposed commuter rail service between Howell and Ann Arbor
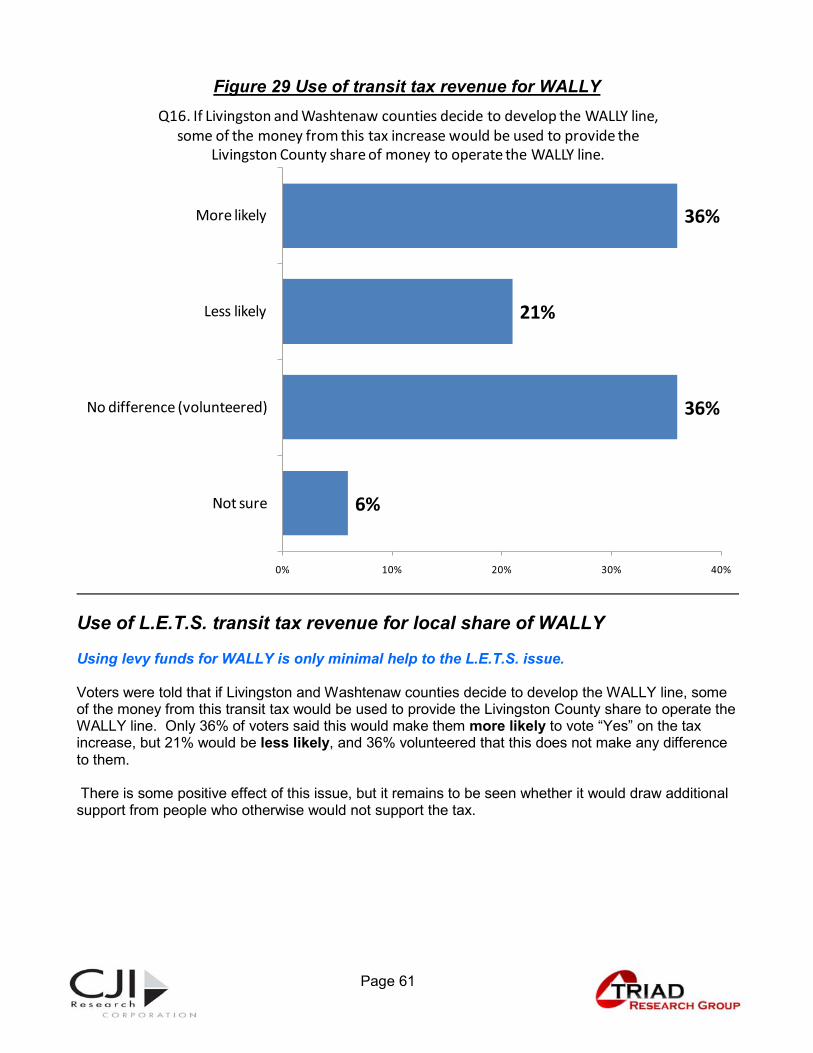
1. Page 61 Page 61
Figure 29 Use of transit tax revenue for WALLY
Use of L.E.T.S. transit tax revenue for local share of WALLY Using levy funds for WALLY is only minimal help to the L.E.T.S. issue. Voters were told that if Livingston and Washtenaw counties decide to develop the WALLY line, some of the money from this transit tax would be used to provide the Livingston County share to operate the WALLY line. Only 36% of voters said this would make them more likely to vote “Yes” on the tax increase, but 21% would be less likely, and 36% volunteered that this does not make any difference to them. There is some positive effect of this issue, but it remains to be seen whether it would draw additional support from people who otherwise would not support the tax.
6%
36%
21%
36%
Not sure
No difference (volunteered)
Less likely
More likely
0% 10% 20% 30% 40%
Q16. If Livingston and Washtenaw counties decide to develop the WALLY line, some of the money from this tax increase would be used to provide the
Livingston County share of money to operate the WALLY line.
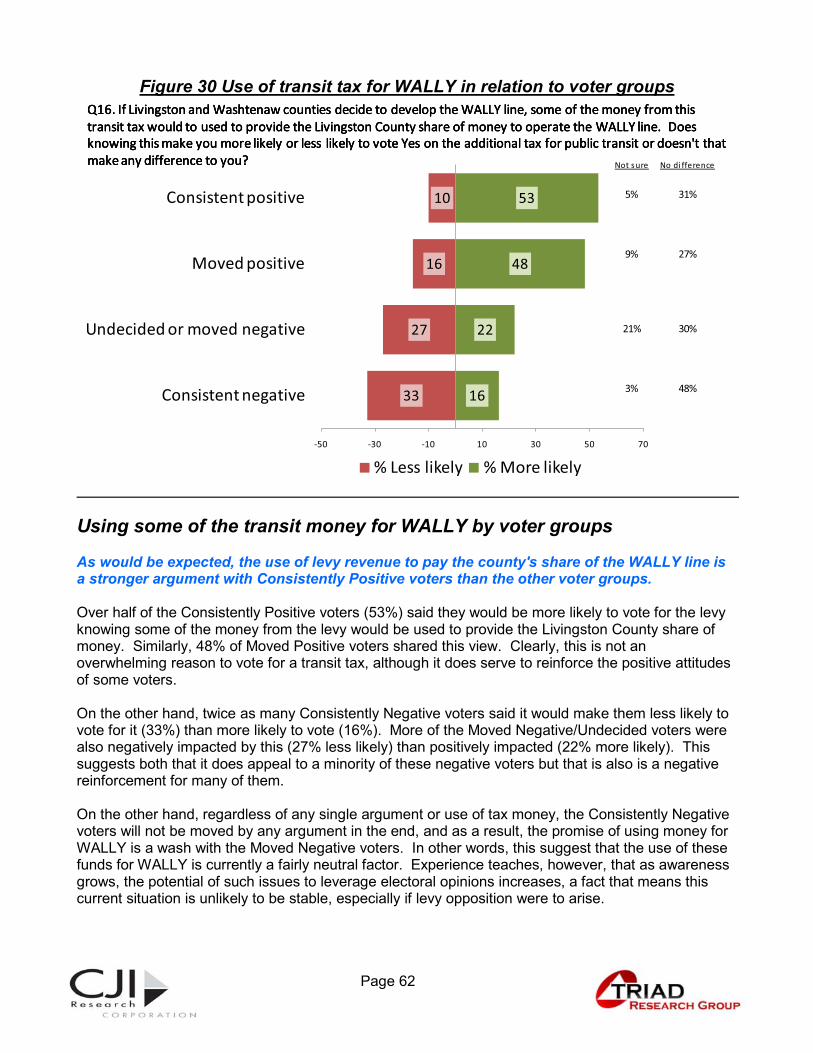
1. Page 62 Page 62
Figure 30 Use of transit tax for WALLY in relation to voter groups
Using some of the transit money for WALLY by voter groups As would be expected, the use of levy revenue to pay the county's share of the WALLY line is a stronger argument with Consistently Positive voters than the other voter groups. Over half of the Consistently Positive voters (53%) said they would be more likely to vote for the levy knowing some of the money from the levy would be used to provide the Livingston County share of money. Similarly, 48% of Moved Positive voters shared this view. Clearly, this is not an overwhelming reason to vote for a transit tax, although it does serve to reinforce the positive attitudes of some voters. On the other hand, twice as many Consistently Negative voters said it would make them less likely to vote for it (33%) than more likely to vote (16%). More of the Moved Negative/Undecided voters were also negatively impacted by this (27% less likely) than positively impacted (22% more likely). This suggests both that it does appeal to a minority of these negative voters but that is also is a negative reinforcement for many of them. On the other hand, regardless of any single argument or use of tax money, the Consistently Negative voters will not be moved by any argument in the end, and as a result, the promise of using money for WALLY is a wash with the Moved Negative voters. In other words, this suggest that the use of these funds for WALLY is currently a fairly neutral factor. Experience teaches, however, that as awareness grows, the potential of such issues to leverage electoral opinions increases, a fact that means this current situation is unlikely to be stable, especially if levy opposition were to arise.
33
27
16
10
16
22
48
53
-50 -30 -10 10 30 50 70
Consistent negative
Undecided or moved negative
Moved positive
Consistent positive
% Less likely % More likely
Q16. If Livingston and Washtenaw counties decide to develop the WALLY line, some of the money from this transit tax would to used to provide the Livingston County share of money to operate the WALLY line. Does knowing this make you more likely or less likely to vote Yes on the additional tax for public transit or doesn't that make any difference to you?
Q16. If Livingston and Washtenaw counties decide to develop the WALLY line, some of the money from this transit tax would to used to provide the Livingston County share of money to operate the WALLY line. Does knowing this make you more likely or less likely to vote Yes on the additional tax for public transit or doesn't that make any difference to you?
Q16. If Livingston and Washtenaw counties decide to develop the WALLY line, some of the money from this transit tax would to used to provide the Livingston County share of money to operate the WALLY line. Does knowing this make you more likely or less likely to vote Yes on the additional tax for public transit or doesn't that make any difference to you? Not sure No di fference
5% 31%
9% 27%
21% 30%
3% 48%
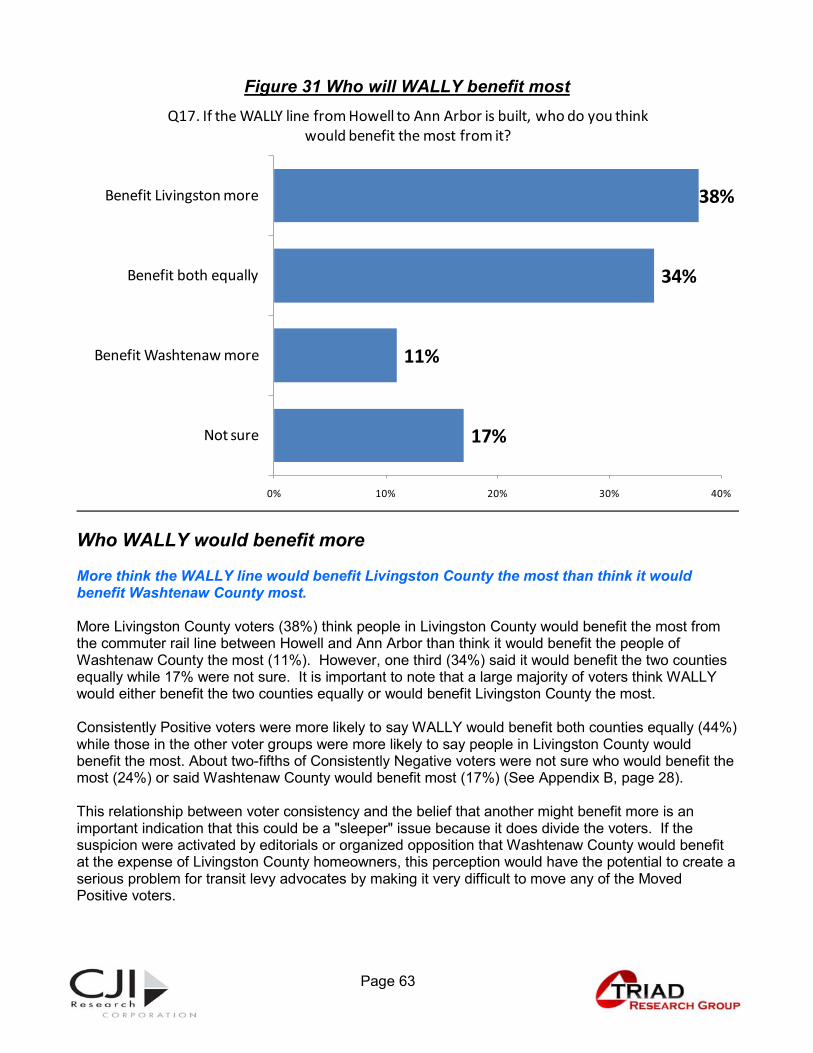
1. Page 63 Page 63
Figure 31 Who will WALLY benefit most
Who WALLY would benefit more More think the WALLY line would benefit Livingston County the most than think it would benefit Washtenaw County most. More Livingston County voters (38%) think people in Livingston County would benefit the most from the commuter rail line between Howell and Ann Arbor than think it would benefit the people of Washtenaw County the most (11%). However, one third (34%) said it would benefit the two counties equally while 17% were not sure. It is important to note that a large majority of voters think WALLY would either benefit the two counties equally or would benefit Livingston County the most. Consistently Positive voters were more likely to say WALLY would benefit both counties equally (44%) while those in the other voter groups were more likely to say people in Livingston County would benefit the most. About two-fifths of Consistently Negative voters were not sure who would benefit the most (24%) or said Washtenaw County would benefit most (17%) (See Appendix B, page 28). This relationship between voter consistency and the belief that another might benefit more is an important indication that this could be a "sleeper" issue because it does divide the voters. If the suspicion were activated by editorials or organized opposition that Washtenaw County would benefit at the expense of Livingston County homeowners, this perception would have the potential to create a serious problem for transit levy advocates by making it very difficult to move any of the Moved Positive voters.
17%
11%
34%
38%
Not sure
Benefit Washtenaw more
Benefit both equally
Benefit Livingston more
0% 10% 20% 30% 40%
Q17. If the WALLY line from Howell to Ann Arbor is built, who do you think would benefit the most from it?

1. Page 64 Page 64