Embed Size (px)
Citation preview

1 1
A CENTRAL ROLE FOR GAMMA-GLUTAMYL HYDROLASES IN PLANT FOLATE METABOLISM
By
TARIQ AZIZ AKHTAR
A DISSERTATION PRESENTED TO THE GRADUATE SCHOOL OF THE UNIVERSITY OF FLORIDA IN PARTIAL
FULFILLMENT OF THE REQUIREMENTS FOR THE DEGREE OF DOCTOR OF PHILOSOPHY
UNIVERSITY OF FLORIDA
2010

2 2
© 2010 Tariq Aziz Akhtar

3 3
Dedicated to Heidi Werner, Aziz Akhtar and to my wife, Hazel Lees for all of their love and sacrifice

4 4
ACKNOWLEDGEMENTS
I would like to thank the Plant Molecular and Cellular Biology Program for a tremendous
educational experience, particularly the faculty who tirelessly devote their time to mentor and
train students like myself. Special appreciation goes to my committee members for their
guidance and support. Most of all I thank my advisor, Andrew Hanson. You have taught me the
true meaning of dedication and responsibility, and for that I am eternally grateful.
5 5
TABLE OF CONTENTS page
ACKNOWLEDGEMENTS ............................................................................................................ 4
LIST OF TABLES .......................................................................................................................... 7
LIST OF FIGURES ......................................................................................................................... 8
INTRODUCTION ......................................................................................................................... 11
The Etymology of Folate ....................................................................................................... 11 Folate Structure and Chemistry.............................................................................................. 11 Folate Biosynthesis ................................................................................................................ 12 Folate Metabolism.................................................................................................................. 13 Folate Polyglutamylation ....................................................................................................... 14 Polyglutamyl Tail Cleavage ................................................................................................... 16 Gamma-Glutamyl Hydrolase ................................................................................................. 16 GGH Dimers and Inactive Isoforms in Plants ....................................................................... 18 GGH and Folate Metabolism ................................................................................................. 18 Research Objectives ............................................................................................................... 19
Tomato gamma-Glutamylhydrolases: Expression, Characterization, and Evidence for Heterodimer Formation .......................................................................................................... 24
Preface .................................................................................................................................... 24 Introduction ............................................................................................................................ 25 Results .................................................................................................................................... 26
Tomato has Three GGH Genes ....................................................................................... 26 Most Tissues Express LeGGH1 and LeGGH2 ............................................................... 28 Characterization of Recombinant Homodimers ............................................................. 28 Tomato GGHs Form Heterodimers in E. coli ................................................................. 30 GGH Dimers Do Not Dissociate and Reassociate .......................................................... 31 Characterization of GGH Heterodimers ......................................................................... 31 The Inactive LeGGH3 Homodimer Does Not Sequester Folate .................................... 32 LeGGH1 and LeGGH2 Form Heterodimers In Planta .................................................. 32
Discussion .............................................................................................................................. 33 Experimental Procedures ....................................................................................................... 36
Plant Materials ................................................................................................................ 36 Cloning of Tomato GGH Genes ..................................................................................... 37 Southern and Northern Analysis ..................................................................................... 38 Expression Constructs ..................................................................................................... 38 Recombinant Protein Expression and Purification ......................................................... 39 SDS-PAGE and Western Analysis ................................................................................. 40 Tomato Protein Extraction and GGH Assays ................................................................. 40 Folate Analysis of E. coli Cells Expressing GGH .......................................................... 42
6 6
Bimolecular Fluorescence Complementation (BiFC) ..................................................... 42 Acknowledgements ................................................................................................................ 44
A CENTRAL ROLE FOR GAMMA-GLUTAMYL HYDROLASES IN PLANT FOLATE METABOLISM ..................................................................................................................... 62
Preface .................................................................................................................................... 62 Introduction ............................................................................................................................ 62 Results .................................................................................................................................... 65
Overexpression of GGH in Arabidopsis and Tomato Fruit ............................................ 65 Folate Content and Polyglutamylation Status in Plants Over-expressing GGH ............. 66 Identification of T-DNA Insertion Mutants of GGH and Expression of the
Arabidopsis GGH Family............................................................................................ 66 GGH Activity and Bond Cleavage Specificity in the GGH Mutants ............................. 67 RNAi Mediated Knockdown of Residual GGH in the Individual GGH Knockouts ...... 68 Folate Content and Polyglutamylation Status in Arabidopsis Leaf Vacuoles ................ 69
Discussion .............................................................................................................................. 70 Experimental Procedures ....................................................................................................... 74
Plant Materials and Growth Conditions .......................................................................... 74 Identification of Arabidopsis T-DNA mutants ............................................................... 74 Plasmids and Constructs ................................................................................................. 74 Arabidopsis and Tomato Transformation ....................................................................... 76 GGH Activity Assays ..................................................................................................... 77 Quantitative Real-Time RT-PCR .................................................................................... 77 Vacuole Isolation ............................................................................................................ 78 Folate Analysis ............................................................................................................... 79
Acknowledgements ................................................................................................................ 79
Conclusions ................................................................................................................................... 95
LIST OF REFERENCES .............................................................................................................. 98
BIOGRAPHICAL SKETCH ...................................................................................................... 106

7 7
LIST OF TABLES
Table Page 1-1 GGHs in various organisms. ............................................................................................. 23
2-1 Kinetic parameters of LeGGH1 and LeGGH2 homodimers with PteGlu5 or pABAGlu5 as substrate...................................................................................................... 45
2-2 Synthetic oligonucleotides used in this study. .................................................................. 46
3-1 Synthetic oligonucleotides used in this study.. ................................................................. 80

8 8
LIST OF FIGURES
Figure Page 1-1 Chemical structures of tetrahydrofolate polyglutamates and its C1-substituted
derivatives. ........................................................................................................................ 20
1-2 The plant folate biosynthetic pathway.. ............................................................................ 21
1-3 Catalytic mechanism of gamma-glutamyl hydrolase.. ...................................................... 22
2-1 Tissue Structure of tetrahydrofolate polyglutamates.. ...................................................... 47
2-2 Southern blot analysis and GGH phylogeny.. ................................................................... 48
2-3 LeGGH gene expression and enzyme activity.. ................................................................ 49
2-4 Recombinant GGH purification, bond cleavage specificity, and in-vivo activity ............. 50
2-5 Conservation of the GGH dimer interface and evidence for formation of non-dissociating LeGGH homo- and heterodimers.. ................................................................ 52
2-6 The impact of heterodimer formation on GGH activity and bond cleavage specificity, and evaluation of folate binding by LeGGH3.. ................................................................. 54
2-7 Bimolecular fluorescence complementation (BiFC) evidence for GGH heterodimer formation in planta.. .......................................................................................................... 56
2-8 Alignment of GGH amino acid sequences.. ...................................................................... 58
2-9 E. coli expression constructs.. ........................................................................................... 59
2-10 Bimolecular fluorescence complementation constructs.. .................................................. 61
3-1 Structures of tetrahydrofolate polyglutamates and their C1-substituted derivatives.. ....... 84
3-2 Over-expression of GGH in tomato and Arabidopsis.. ..................................................... 85
3-3 Folate content and polyglutamylation status in plants overexpressing GGH.. ................. 87
3-4 Expression and identification of T-DNA insertion mutants of the Arabidopsis GGH family.. .............................................................................................................................. 88
3-5 GGH activity and bond cleavage specificity in the GGH mutants ................................... 90
3-6 RNAi mediated knockdown of residual GGH in the individual GGH knockouts and its effect on folate status.. .................................................................................................. 92
3-7 Folate content and polyglutamylation status in Arabidopsis leaf vacuoles.. .................... 94

9 9
Abstract of Dissertation Presented to the Graduate School of the
University of Florida in Partial Fulfillment of the Requirements for the Degree of Doctor of Philosophy
A CENTRAL ROLE FOR GAMMA-GLUTAMYL HYDROLASES IN PLANT FOLATE METABOLISM
By
Tariq Aziz Akhtar
May 2010
Chair: Andrew D. Hanson Major: Plant Molecular and Cellular Biology Animals cannot synthesize the B-vitamin folate and depend mainly on plants to supply
them with this essential cofactor. The majority of plant folates, like those from other organisms,
are conjugated to a short polyglutamate tail. However, the physiological significance of folate
polyglutamylation in plants remains unclear, and therefore was investigated in the following
study.
This work focused on the family of enzymes responsible for polyglutamate tail removal,
gamma-glutamyl hydrolase (GGH). Characterization of the tomato GGH gene family revealed
three genes encoding two homodimeric enzymes with distinct catalytic properties and a third
catalytically inactive isoform. It was further demonstrated that each GGH member can dimerize
with one another, resulting in heterodimers with catalytic properties midway between those of
the corresponding homodimers.
The consequences of enhanced and impaired folate polyglutamylation were probed by
modulating GGH expression in both Arabidopsis and tomato fruit. Overexpression of GGH
caused extensive deglutamylation and decreased total folate in Arabidopsis and tomato.
Conversely, RNAi-mediated knockdown of GGH activity by 99% in Arabidopsis increased total

10 10
folate content by 34%, which, at least in part, accumulated as polyglutamylated derivatives in the
vacuole.
Therefore, the results of this study are consistent with a model whereby polyglutamylated
folates enter the vacuole, are hydrolyzed by GGH and exit as monoglutamates. This model
further suggests that GGH inactivation could be employed as a strategy to enhance folate content
in plants by allowing polyglutamtes to accumulate in vacuoles.

11 11
CHAPTER 1 INTRODUCTION
The Etymology of Folate
In 1928, the Indian Medical Service asked Lucy Wills, a recent graduate of the London
School of Medicine for Women, to come to Bombay to investigate an anemia prevalent among
local female textile workers. Her initial reports documented a gross deficiency in fruit and
vegetable intake and suggested that the anemia was related to a ‘nutritional factor’ absent from
their diets. Upon manipulating the diets of albino rats suffering from macrocytic anemia, she
determined that this condition could be averted by adding yeast extract. The preventative factor
in yeast became known as the ‘Wills factor’ (Hoffbrand and Weir, 2001).
Years later, Mitchell isolated a growth factor for Streptococcus lactis from spinach leaves
that he called folic acid, from the Latin word folium (leaf). In 1945, folic acid was synthesized in
pure crystalline form and it became apparent that it was the Wills factor. Ensuing research by
Stokstad and colleagues determined that natural folates, unlike folic acid, were fully reduced
compounds substituted with various one carbon units and containing a polyglutamate side-chain.
Folate Structure and Chemistry
Tetrahydrofolate (THF) and its derivatives, collectively termed folates, together form the
group of cofactors known as vitamin B9. Folates are tripartite molecules composed of pteridine,
para-aminobenzoate (pABA), and glutamate moieties (Figure 1-1). One-carbon units at various
oxidation levels are attached to N5 of the pteridine ring, N10 of the pABA moiety, or are bridged
between these two positions, giving rise to seven folate species (Figure 1-1). These folates more
or less readily undergo oxidation to dihydrofolate and folic acid derivatives, which are
biologically inactive forms of the cofactor. In addition, folates quite readily undergo oxidative
cleavage of the C9-N10 bond, generating pteridine and p-aminobenzoylglutamate degradation

12 12
products. The majority of natural folates have a γ-linked polyglutamyl tail attached to the first
glutamate. The tail varies in length from two to eleven residues and critically impacts cofactor
activity and transport (Scott et al., 2000). In general, polyglutamates are the preferred substrates
for folate-utilizing enzymes, while monoglutamates are the transported forms (Suh et al., 2001).
Folate Biosynthesis
Plants, fungi, bacteria, and certain protozoa synthesize folates de novo while animals
have a strict dietary requirement, most of which comes from plant sources. Although the steps in
the folate biosynthesis pathway are shared, the synthesis pathway in plants differs from those in
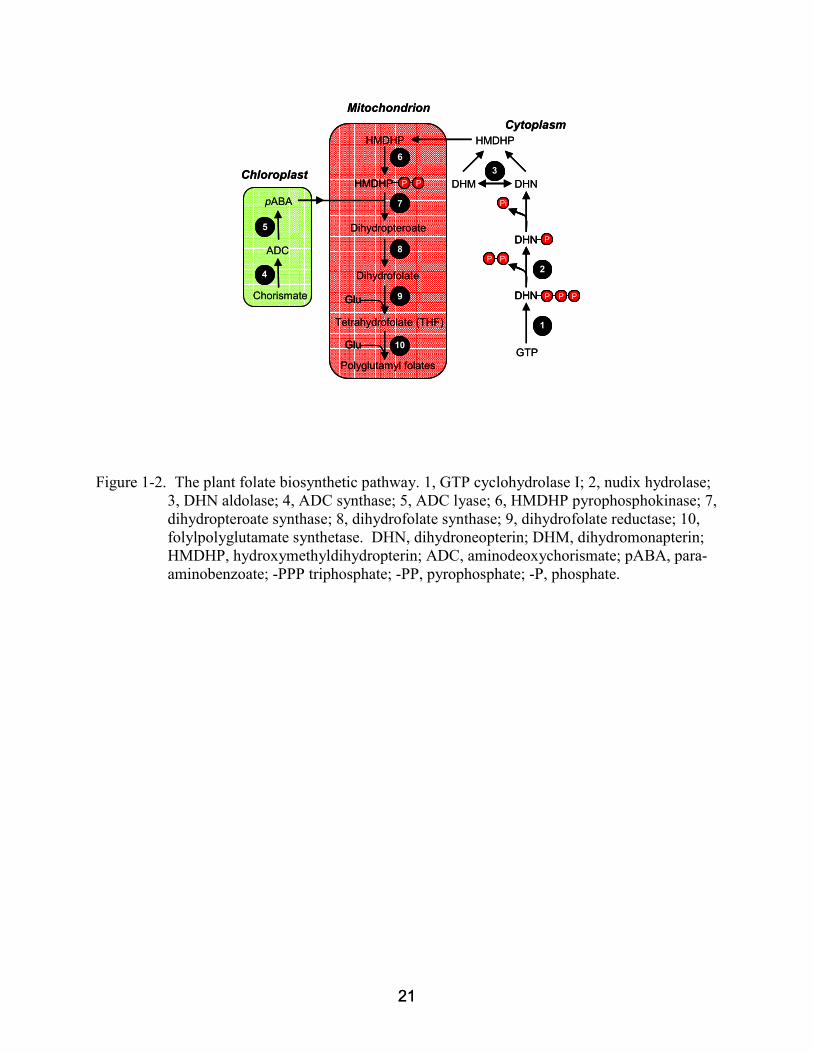
other groups in the way it is compartmented (Figure 1-2). The pteridine moiety of folate is
synthesized in the cytosol from GTP, which is converted into dihydroneopterin (DHN)
triphosphate by GTP cyclohydrolase (Basset et al., 2002). The triphosphate moiety is then
removed in two steps: hydrolysis of pyrophosphate via a specific nudix hydrolase (Klaus et al.,
2005a), followed by dephosphorylation by a non-specific phosphatase (Suzuki & Brown, 1974).
Next, DHN is cleaved by DHN aldolase to give hydroxymethyldihydropterin (HMDHP); DHN
aldolase can also epimerize DHN to dihydroxymonapterin (DHM), and cleave DHM (Goyer et
al., 2004). The pABA moiety originates in the chloroplast where chorismate is converted to
aminodeoxychorismate (ADC) by ADC synthase (Basset et al., 2004a), and ADC is
subsequently converted to pABA by ADC lyase (Basset et al., 2004b). The pABA then enters
the mitochondria where the remaining steps of folate synthesis take place (Neuburger et al.,
1996).
The HMDHP produced in the cytosol also enters the mitochondria where it is
pyrophosphorylated and condensed with pABA to produce dihydropteroate (DHP), a reaction
that is mediated by the bifunctional HMDHP pyrophosphokinase-DHP synthase (HPPK-DHPS)
(Rébeillé et al., 1997; Mouillon et al., 2002). The attachment of glutamate to DHP, mediated by

13 13
DHF synthetase, completes the synthesis of the first folate in the pathway, dihydrofolate (DHF)
(Iwai et al., 1980; Ravanel et al., 2001). Lastly, reduction of DHF, catalyzed by dihydrofolate
reductase (DHFR), generatest he biologically active form of the cofactor, tetrahydrofolate (THF)
(Wang et al., 1995). THF either exits the mitochondria for other folate requiring compartments
or is retained in this compartment by polyglutamylation. Folylpolyglutamate synthetase (FPGS,
EC 6.3.2.17) adds successive γ-linked glutamate residues in an ATP-dependent reaction and
produces the polyglutamylated forms of folate. In plants, additional FPGS isoforms are known
to exist in the cytosol and chloroplast (Cossins and Chen, 1997; Ravanel et al., 2001).
Folate Metabolism
The metabolic role of folate is to transfer and accept one carbon units at various oxidation
states. Reactions supported by folate form the foundation of what is collectively referred to as
one-carbon metabolism (Lucock, 2000; Hanson and Roje, 2001). During the course of these
reactions, various one-carbon units (formyl, methyl, methylene, methenyl, or formimino) are
added to THF, generating the different folate forms, and these forms then serve as one-carbon
donors.
For instance, two formyl group transfer reactions are required during the biosynthesis of
purines, each of which is provided by 10-formyl-THF. In addition, N-formylmethionine
synthesis, which is necessary for translation initiation in bacteria and eukaryotic organelles,
depends on an analogous formyl transfer from 10-formyl-THF. The THF that is generated by
one-carbon transfer reactions has several fates. Tetrahydrofolate is converted to 5-formimino-
THF in the histidine degradation pathway to glutamate. Alternatively, THF can accept one-
carbon units during sarcosine catabolism or via the serine to glycine interconversion to form
5,10-methylene-THF. Subsequently, this folate is required for the synthesis of pantothenate, a
precursor to coenzyme A, and for thymidine synthesis. In the latter reaction, thymidylate
14 14
synthase consumes 5,10-methylene-THF and generates DHF, which is subsequently reduced
back to THF by dihydrofolate reductase. The most reduced form of folate is 5-methyl-THF
whose exclusive function is to provide the methyl group required for the conversion of
homocysteine to methionine, which in turn is used to form S-adenosylmethionine, the universal
methyl donor.
Although the reactions supported by folate are indispensable, little is known about how
folate synthesis is regulated and what factors influence intracellular folate concentrations. In
animal systems, a correlation between intracellular folate content and the degree of folate
polyglutamylation has been demonstrated (Lowe et al. 1993; Sakamoto et al. 2008). Whether
this relationship holds true in plants or other organisms that produce folate is unknown.
Folate Polyglutamylation
The γ-linked polyglutamyl tail attached to folates is added, one glutamate at a time, by
folylpolyglutamate synthetase (FPGS, EC 6.3.2.17). In mammals, the cytosolic and
mitochondrial FPGS isoforms are generated by alternative splicing from a single gene (Chen et
al., 1996). In plants, multiple FPGS isoforms exist. In Arabidopsis, cytosolic, mitochondrial,
and plastidial isoforms have been characterized (Ravanel et al., 2001), although this FPGS
distribution pattern may not be typical of plants because several other plant genomes show no
evidence of cytosolic isoforms (Waller et al., 2009).
Polyglutamylation is believed to impact one-carbon metabolism since the enzymes that
use folates usually prefer polyglutamates to the monoglutamyl forms. For example, methionine
synthases from various organisms have a strict requirement for polyglutamylated 5-methyl-THF
to regenerate methionine from homocysteine, and cannot use the monoglutamyl form at all
(Whitfield et al., 1970; Cherest et al., 2000; Ravanel et al., 2004). In addition, pig liver

15 15
thymidylate synthase exhibits a 60% increase in affinity for 5,10-methylene-THF upon addition
of a single glutamate to the monoglutamyl form (Lu et al., 1984).
In plants, the glycine cleavage system and serine hydroxymethyltransferase that are
involved in the photorespiratory cycle have Km values for polyglutamates at least ten-fold lower
than for monoglutamates (Besson et al., 1993). Also, Chinese hamster ovary cell lines with
impaired FPGS activities exhibit auxotrophies for the end products of one-carbon metabolism
(Lin and Shane, 1994).
It has been estimated that the concentration of folate utilizing enzymes is roughly
equivalent to the total cellular folate concentration (Schirch and Strong, 1989). Since the
polyglutamyl tail also aids in ‘channeling’ of folates between the active sites of folate-dependent
enzymes, many of which exist as multimeric complexes (McGuire and Bertino, 1981), the
implications are that most cellular folate is associated with the enzymes of one-carbon
metabolism and that the concentrations of unbound cofactors are kept very low. Given that
enzyme-bound polyglutamates are less prone to C9-N10 bond cleavage compared to non-bound
forms (Gregory and Quinlivan 2002), folates are believed to be protected from oxidative
breakdown and therefore stabilized by polyglutamylation (Suh et al., 2001).
Most of the characterized animal and plant transporters of folate strongly prefer
monoglutamates (Zeng et al., 2001; Wielinga et al., 2005; Bedhomme et al. 2005; Klaus et al.
2005b; Raichaudhuri et al. 2009), with the ability to transport polyglutamates (if any) decreasing
as tail length increases (Shane and Stokstad, 1975). Polyglutamylation also increases the anionic
nature of folates and therefore impedes the passive diffusion of folates across biomembranes
(Appling et al., 1991). Hence, cellular and organellar polyglutamates are generally retained by
the cells or the organelles in which they reside (Shane, 1989).

16 16
Polyglutamyl Tail Cleavage
The polyglutamate tail on folates can be shortened or removed by three different classes
of enzymes, each of which predominates in particular organisms. Carboxypeptidase G (EC
3.4.17.11) is found only in certain bacteria and hydrolyzes both the terminal γ-linked glutamates
of the polyglutamyl tail and the amide bond between pABA and the first glutamate of folates
(Goldman and Levy, 1967; McCullough et al. 1971). In the intestinal brush border cells of
mammals, the membrane-bound glutamate carboxypeptidase II (GCPII, EC 3.4.17.21)
hydrolyzes polyglutamates prior to their absorption (dietary folates are only absorbed in the
monoglutamylated form) (Chandler et al., 1986; Wang et al., 1986). The third enzyme known to
cleave folate polyglutamates is gamma-glutamyl hydrolase (GGH, EC 3.4.19.9), a soluble
cysteine peptidase found in a mammals and plants (Bhandari et al., 1990; Lin et al. 1993; Yao et
al. 1996; Orsomando et al. 2005), though putative GGHs from a variety organisms are
represented in DNA sequence databases.
Gamma-Glutamyl Hydrolase
Much of what is known about GGH comes from studies of the mammalian enzymes.
Human GGH has been extensively characterized, due in large part to its role in vitiating
antifolate toxicity (Rhee et al., 1993; Cole et al., 2001). Antifolates, such as methotrexate
(MTX), disrupt folate metabolism and are used in treatment of various cancer and autoimmune
diseases (Bertino, 1993). Once taken up by the cell, MTX is retained via polyglutamylation and
competitively inhibits dihydrofolate reductase, essentially starving the cell of reduced folates.
Antifolate resistance is associated with elevated GGH activity, which hydrolyzes MTX
polyglutamates, promoting their efflux and thereby restoring normal folate metabolism.
However, the role played by GGH in folate metabolism is unclear. Besides folate polyglutam-

17 17
ates, GGH attacks polyglutamates of the folate breakdown product para-aminobenzoylglutamate
(pABA-Glu) and may consequently play a role in folate salvage (Orsomando et al., 2006).
GGH from mammals is a glycoprotein widely distributed in several tissues and is located
primarily in the lysosome, although detection of GGH in blood has been reported (Wang et al.
1993; Galivan et al., 2000). It is synthesized as a single 320 amino acid polypeptide chain and
exists in solution as a non-dissociating homodimer with reported molecular weights between 50
and 100kDa (Eisele et al., 2006). In plants, GGHs often exist in multiple copies (Lin et al., 1993;
Orsomando et al., 2005). Arabidopsis GGHs have catalytic properties similar to those of
mammalian GGHs and in pea leaves GGH activity has been localized to the vacuole (Orsomando
et al., 2005). This subcellular location is consistent with proteomic data from Arabidopsis leaf
vacuoles (Carter et al. 2004), although GGH protein from soybean has been detected in
intercellular fluid (Huangpu et al. 1996). Despite the modest differences in bond cleavage
specificity exhibited by GGH family members, the significance of multiple GGH gene products
in plants is not well understood.
Molecular modeling in combination with the crystal structure of human GGH revealed
that polyglutamate cleavage depends on a catalytic triad comprised of highly conserved cysteine,
histidine, and glutamate residues (Chave et al. 2000; Li et al, 2002). When one of these residues
is mutated, GGH becomes catalytically inactive or exhibits severely compromised activity
(Chave et al. 2000). Hydrolysis of polyglutamates by GGH occurs via an endo- and/or exopept-
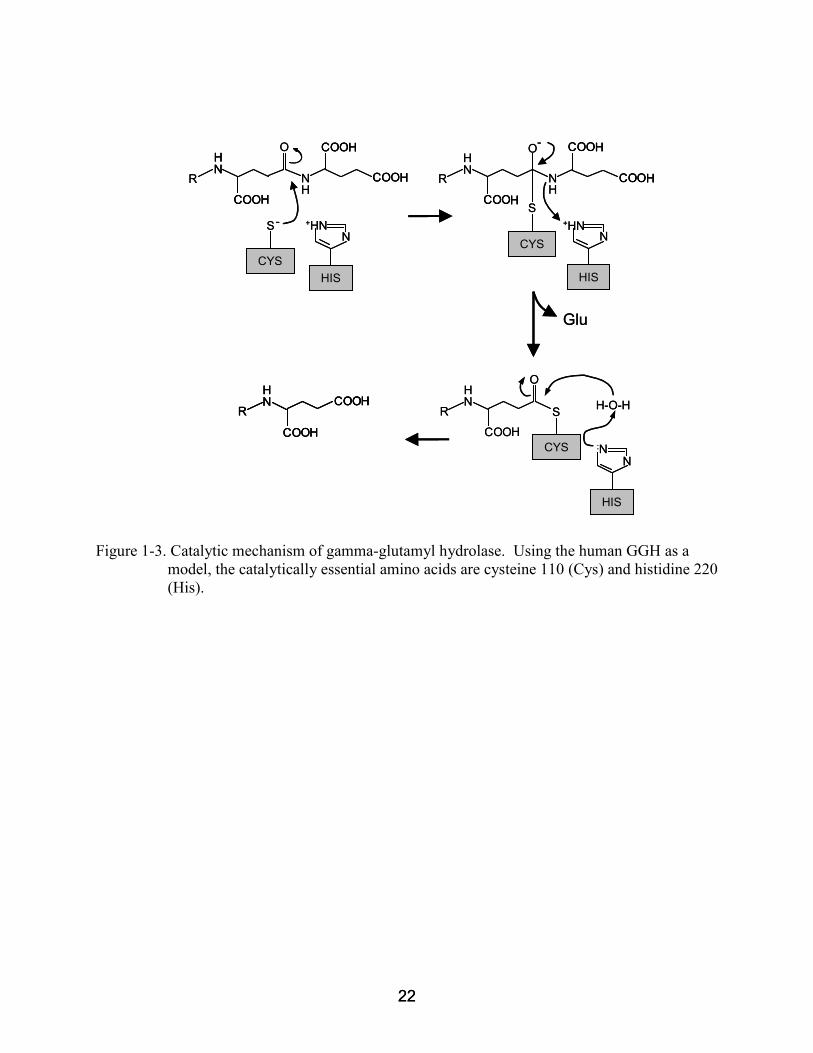
idase mechanism (Figure 1-3). First, nucleophilic attack at the carbonyl group of the γ-peptide
bond by the active site cysteine forms a thioester intermediate and releases glutamate(s). The
catalytically essential histidine then activates a water molecule that hydrolyzes the thioester

18 18
intermediate (Li et al. 2002). The exact role of the conserved active site glutamate residue is
unknown, but it is believed to provide structural integrity rather than function in catalysis.
GGH Dimers and Inactive Isoforms in Plants
The mechanism used by GGH to hydrolyze γ-glutamyl peptide bonds depends on a
catalytic amino acid triad(see above). Residues important for catalysis and substrate binding are
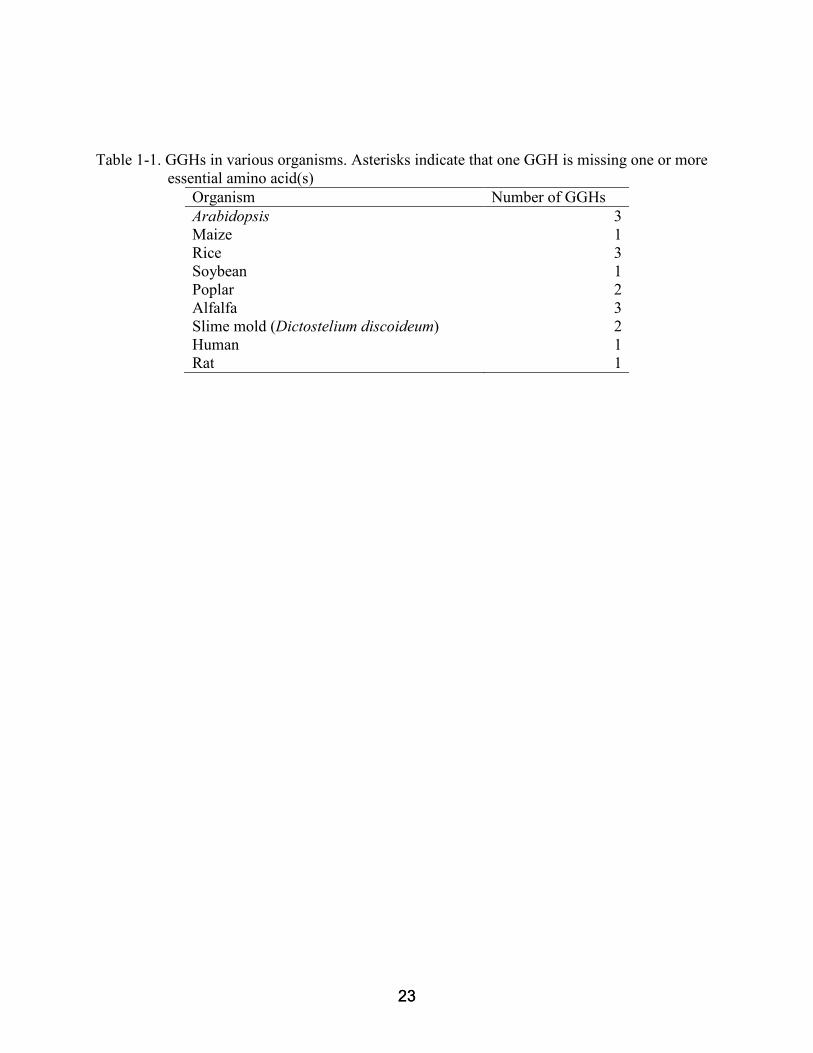
strictly conserved amongst all known GGHs, with three exceptions (Table 1-1). In one of the
tomato GGHs (LeGGH3), the cysteine that forms the thioester intermediate during catalysis is
absent and has been replaced by asparagine. Not only is this cysteine missing in one of the
soybean GGHs, but the essential histidine residue within the catalytic triad is also absent.
Finally, in the slime mold Dictyostelium dicoideum, a glutamine believed to be important for
substrate binding is notably absent. The exact role of these ‘inactive’ yet expressed GGH genes
is unknown. It is of interest that the species that have a GGH missing one or more essential
amino acids always have another GGH protein with the full suite of catalytically important
residues.
In addition to conserved catalytic residues, those at the dimer interface between GGH
monomers are relatively conserved amongst all GGHs, particularly from organisms with two or
more GGH gene products. But it is not known whether monomers encoded by different genes
form heterodimers and, if so, how this impacts catalytic activity. This point is especially relevant
in plants that contain catalytically incompetent GGH isoforms.
GGH and Folate Metabolism
Despite the importance of polyglutamyl tail length, nothing is known about how this is
regulated in plants and how it relates to overall folate homeostasis. Moreover, little is known
about these issues in animals and bacteria in which folate metabolism is otherwise well studied.
In experiments in the bacterium Lactococcus lactis (which lacks endogenous GGH), cytoplasmic

19 19
expression of mammalian GGH apparently led to complete folate deglutamylation and massive
folate efflux, but strikingly did not affect growth (Sybesma et al., 2003). Similarly, forced
overexpression of GGH in two human cell lines resulted in modest reductions in intracellular
folate content and tail length, yet no changes in growth (Cole et al., 2001). These observations
are difficult to reconcile, especially when considering that animal cell lines unable to
polyglutamylate folates due to impaired FPGS activity exhibit auxotrophies for the products of
C1 metabolism (Lin and Shane, 1994). The conspicuous absence of an effect on growth in these
experiments when GGH is overexpressed could be explained by culture maintenance on rich
media containing several times the physiological levels of folate and/or the end products of C1
metabolism. Thus, the true in vivo consequences of folate deglutamylation needs to be revisited,
as does the role of GGH in the metabolism of folate, particularly in plants which are a major
source of this vital cofactor.
Research Objectives
To better understand the role of GGH in plant folate metabolism, tomato was targeted
since this is a major vegetable fruit crop worldwide and is our model for folate engineering. The
first objective of this project was to clone and characterize the GGH gene family from tomato.
Using this information, the next objective was to explore the significance of the multiple GGH
isoforms in tomato, particularly whether individual GGH gene products can heterodimerize. The
final aim was to clarify the consequences of reduced and increased folate polyglutamylation in
tomato and Arabidopsis, by exploiting the GGH systems of these two plants.

20 20
Figure 1-1. Chemical structures of tetrahydrofolate polyglutamates and its C1-substituted derivatives. Folate is composed of pterin, pABA and glutamate moieties. A γ-linked polygluyamate tail of up to 8 residues is attached to the first glutamate. C1 units at various oxidation levels are attached to the N5 and/or N10
position of the pterin moiety.
γγγγ-Glu tailCOOH
CH
COOH
CH2
CH2
NH
CH
COOH
CH2
CH2
COOH
n
C
O
O
C
C
N
NHNR
5
NH
NH2
O
CH2
9
HH
HNR'
10CHN
HCH2
CH2
NH
O
pABAPterin Glu
Folate R R'
THF
5-Methyl-THF
H H
CH3 H
5-Formimino-THF CH=NH
5-Formyl-THF
10-Formyl-THF
CHO H
H CHO
5,10-Methylene-THF
5,10-Methenyl-THF
-CH2-
=CH-
H
γγγγ-Glu tailCOOH
CH
COOH
CH2
CH2
NH
CH
COOH
CH2
CH2
COOH
n
C
O
O
C
C
N
NHNR
5
NH
NH2
O
CH2
9
HH
HNR'
10CHN
HCH2
CH2
NH
O
pABAPterin Glu
Folate R R'
THF
5-Methyl-THF
H H
CH3 H
5-Formimino-THF CH=NH
5-Formyl-THF
10-Formyl-THF
CHO H
H CHO
5,10-Methylene-THF
5,10-Methenyl-THF
-CH2-
=CH-
H
21 21
Figure 1-2. The plant folate biosynthetic pathway. 1, GTP cyclohydrolase I; 2, nudix hydrolase; 3, DHN aldolase; 4, ADC synthase; 5, ADC lyase; 6, HMDHP pyrophosphokinase; 7, dihydropteroate synthase; 8, dihydrofolate synthase; 9, dihydrofolate reductase; 10, folylpolyglutamate synthetase. DHN, dihydroneopterin; DHM, dihydromonapterin; HMDHP, hydroxymethyldihydropterin; ADC, aminodeoxychorismate; pABA, para-aminobenzoate; -PPP triphosphate; -PP, pyrophosphate; -P, phosphate.
1
GTP
DHN PPP
P Pi2
PDHN
3
DHNDHM
HMDHP
Pi
Chloroplast
Chorismate
4
ADC
pABA
5
Cytoplasm
6
HMDHP
7
HMDHP P P
8
Dihydropteroate
Dihydrofolate
9
Tetrahydrofolate (THF)
Polyglutamyl folates
Glu
Glu
Mitochondrion
10
1
GTP
DHN PPPDHN PPP PPPPPPPP
P PiPPP Pi22
PDHN PPDHN
33
DHNDHM
HMDHP
PiPi
Chloroplast
Chorismate
44
ADC
pABA
55
Cytoplasm
66
HMDHP
77
HMDHP P PHMDHP P PP PPPP P
88
Dihydropteroate
Dihydrofolate
99
Tetrahydrofolate (THF)
Polyglutamyl folates
GluGlu
GluGlu
Mitochondrion
1010
22 22
Figure 1-3. Catalytic mechanism of gamma-glutamyl hydrolase. Using the human GGH as a model, the catalytically essential amino acids are cysteine 110 (Cys) and histidine 220 (His).
Glu
HN
OHN
CO HO
CO HO
CO HO
S
CYSHIS
N-
R
HN
CO HO
CO HOR
HN
OHN
CO HOS
+HNN
-
CO HO
CO HO
HIS
CYS
R
:NN
OHN
CO HO
S H-O-H
HIS
CYS
R
+HN
Glu
HN
OHNHN
CO HOCO HO
CO HOCO HO
CO HOCO HO
S
CYSHIS
N-
R
HN
CO HO
CO HOR
HN
CO HO
CO HOO HOR
HN
OHN
CO HOCO HOS
+HNN
-
CO HOCO HO
CO HOCO HO
HIS
CYS
R
:NN
OHN
CO HO
S H-O-H
HIS
CYS
R
+HN
23 23
Table 1-1. GGHs in various organisms. Asterisks indicate that one GGH is missing one or more
essential amino acid(s) Organism Number of GGHs Arabidopsis 3 Maize 1 Rice 3 Soybean 1 Poplar 2 Alfalfa 3 Slime mold (Dictostelium discoideum) 2 Human 1 Rat 1

24 24
CHAPTER 2 TOMATO GAMMA-GLUTAMYLHYDROLASES: EXPRESSION, CHARACTERIZATION,
AND EVIDENCE FOR HETERODIMER FORMATION
Preface
Folates typically have γ-linked polyglutamyl tails that make them better enzyme substr-
ates, and worse transport substrates, than the unglutamylated forms. The tail can be shortened or
removed by the vacuolar enzyme γ-glutamyl hydrolase (GGH). It is known that GGH is active as
a dimer and that plants can have several GGH genes whose homodimeric products differ funct-
ionally. However, it is not known whether GGH dimers dissociate under in vivo conditions, whe-
ther heterodimers form, or how heterodimerization impacts enzyme activity. These issues were
explored using the GGH system of tomato (Solanum lycopersicum). Tomato has three GGH
genes that, like those in other eudicots, apparently diverged recently. LeGGH1 and LeGGH2 are
expressed in fruit and all other organs whereas LeGGH3 is expressed mainly in flower buds. Le-
GGH1 and LeGGH2 homodimers differ in bond cleavage preference; the LeGGH3 homodimer
is catalytically inactive. Homodimers did not dissociate in physiological conditions. When co-ex-
pressed in Escherichia coli, LeGGH1 and LeGGH2 formed heterodimers with an intermediate
bond cleavage preference, while LeGGH3 formed heterodimers with LeGGH1 or LeGGH2 that
had half the activity of the matching homodimer. E. coli cells expressing LeGGH2 showed ~95%
reduction in folate polyglutamates but cells expressing LeGGH3 did not, confirming that
LeGGH2 can function in vivo and LeGGH3 cannot. The formation of LeGGH1-LeGGH2 hetero-
dimers was demonstrated in planta using bimolecular fluorescence complementation. Plant GGH
heterodimers thus appear to form wherever different GGH genes are expressed simultaneously,
and to have catalytic characteristics midway between those of the corresponding homodimers.
25 25
Introduction
Tetrahydrofolate (THF) and its one-carbon (C1) substituted forms (collectively termed
folates) are cofactors in one-carbon transfer reactions that form Ser, Gly, Met, purines,
thymidylate, pantothenate, and formyl-methionyl tRNA in nearly all organisms (Lucock, 2000;
Scott et al., 2000). Folates generally have a short, γ-linked polyglutamyl tail (Fig. 2-1) that
affects their biological activity. Folate-dependent enzymes typically prefer polyglutamates
whereas folate transporters prefer non-glutamylated forms (Shane, 1989; Matherly and Goldman,
2003). In addition, folates are less prone to oxidative breakdown when protein-bound than when
free (Suh et al., 2001). Polyglutamylation thus tends to enhance cofactor efficacy, to favor folate
retention in cells or subcellular compartments, and to protect folates from breakdown.
The polyglutamyl tail is added, one Glu at a time, by folylpolyglutamate synthase (EC
6.3.2.17), which occurs in nearly all organisms (Shane, 1989; Cossins and Chen, 1997). The tail
can be shortened or removed by γ-glutamyl hydrolase (GGH, EC 3.4.19.9), an endo- and/or exo-
peptidase that occurs only in animals and plants; it is lysosomal (and secreted) in animals, and
vacuolar in plants (Galivan et al., 2000; Orsomando et al., 2005). Besides folate polyglutamates,
GGH attacks polyglutamates of the folate breakdown product p-aminobenzoylglutamate (pABA-
Glu). Whereas animals have one GGH gene, plants often have small GGH gene families (Orso-
mando et al., 2005); these families have been little studied and their biological significance is
unclear.
Animal and plant GGHs are known to exist as non-dissociating homodimers in solution,
and dimerization appears to be required for catalytic activity (Orsomando et al., 2005; Eisele et
al., 2006). But it is not known whether monomers encoded by different genes form heterodimers
and, if so, how each monomer contributes to dimer activity. This point is important because re-
combinant plant GGH homodimers have distinct catalytic properties (Orsomando et al., 2005).

26 26
The characteristics of such homodimers might not reflect those of GGHs in planta if the latter
exist partly as heterodimers. Moreover, in soybean (Glycine max), one GGH gene encodes a pro-
tein that lacks catalytically vital residues and is presumably inactive (Huangpu et al., 1996; Orso-
mando et al., 2005). An inactive monomer might lower the activity of a catalytically competent
partner via dominant negative interaction. Also relevant to heterodimerization, animal GGH
dimers have been shown not to dissociate (Eisele et al., 2006); it is not known whether plant
GGH dimers do so. Non-dissociation would mean that only GGH monomers made in the same
cell at the same time could heterodimerize; dissociation would remove the time constraint.
We recently introduced tomato as a model to explore folate metabolism and its
engineering (Díaz de la Garza et al., 2007; Noiriel et al., 2007). Accordingly, in this study we
characterized tomato GGH genes and their recombinant products, emphasizing
heterodimerization and dimer stability, and investigated heterodimer formation in planta. Our
data indicated that GGH gene families evolved recently, that heterodimers form if different GGH
genes are expressed at the same time and place, and that each monomer in a heterodimer
contributes equally to its catalytic properties.
Results
Tomato has Three GGH Genes
Surveys of the TIGR and dbEST databases indicated the presence of three tomato GGH
genes. Two of these were represented by TIGR contigs (TC167575 and TC165736) comprising
ESTs from various tissues; the third was a singleton (BI931176) from flower buds. cDNA clones
for each sequence, all 5′ truncated, were acquired from the Sol Genomics Network and the
missing regions were obtained by 5′ RACE or RT-PCR based on recovered genomic sequence.
The TC167575-, TC165736-, and BI931176-type DNA sequences were renamed LeGGH1,

27 27
LeGGH2, and LeGGH3, respectively. The corresponding deduced protein sequences are shown
in Supplemental Figure S1.
Southern analysis of tomato cv. Ailsa Craig was performed to estimate gene copy
number, using gene-specific 3´-UTR probes and a full-length LeGGH2 probe (Fig. 2-2A).
Hybridization patterns were consistent with there being just three GGH genes because all major
bands detected by the full-length probe could be reconciled with those detected by the specific
probes. Although two minor hybridization signals were detected for LeGGH3, this was likely
due to the presence of sequence repeats in the 3′-UTR region of this gene, and hence the probe.
Mapping using introgression lines and gene-specific 3′-UTR hybridization probes indicated that
LeGGH1 and LeGGH3 are located in a 30-40 cM region on the long arm of chromosome 7 and
that LeGGH2 is on the short arm of chromosome 10 (data not shown).
The LeGGH genes encode proteins that are 60-72% identical to each other. Comparison of
these proteins with other plant and mammalian GGHs (Fig. 2-8) revealed four features. First, all
have predicted signal peptides, consistent with the lysosomal or vacuolar location of GGH
(Galivan et al., 2000; Orsomando et al., 2005). Second, catalytically essential residues (Cys 110
and His 220 in the mammalian enzyme) are conserved, with two exceptions: soybean GGH1
lacks both residues (as noted above) and LeGGH3 has Asn instead of Cys. Sequencing the
LeGGH3 gene from a second tomato cultivar (MicroTom) confirmed this substitution. Third, the
dimer interface region (Li et al., 2002) is conserved in plant GGHs. Last, all GGHs have a
conserved N-glycosylation motif near the N-terminus, suggesting that plant GGHs, like their
mammalian counterparts, are glycoproteins (Galivan et al., 2000).

28 28
Phylogenetic analysis placed plant GGHs in two subgroups corresponding to eudicots and
monocots (Fig. 2-2B). The eudicots all had two or three GGHs whereas monocots had one. The
sequences from each eudicot species branched together, generally with high bootstrap values,
implying that they diverged within the lineage leading to that species, and that the multiple GGH
genes of eudicots are paralogous. Interestingly, the GGHs lacking catalytically essential residues
(LeGGH3 and soybean GGH1) are both diverged substantially from their sisters in the same
species.
Most Tissues Express LeGGH1 and LeGGH2
The mRNA expression patterns in various tomato tissues were determined by Northern blot
analysis using specific 3´-UTR probes for each gene (Fig. 2-3A). LeGGH1 was expressed in
fruits throughout development and in all other tissues examined. LeGGH2 showed a similar
pattern, except for higher transcript levels in petals and stamens. LeGGH3 mRNA was barely
detectable in any tissues except flower buds, where it was relatively abundant.
To accompany the mRNA data, GGH activity was assayed in developing fruit and in other
tissues from which sufficient protein could be obtained (Fig. 2-3B). Activity fell markedly
during ripening, red-ripe fruit having only 5% of that in mature green fruit. A mixing experiment
established that this decline was not due to factors in mature fruit that inhibit GGH activity or
destroy it during extraction, for co-extraction of green and red-ripe fruit yielded activities equal
to the average of these tissues extracted separately (not shown). All other tissues had GGH
activity, flower buds having less than might be expected from the strength of the Northern
signals (Fig. 2-3B).
Characterization of Recombinant Homodimers
The three tomato GGH gene products were expressed in E. coli as the predicted mature
proteins with N-terminal His tags, as was done for the mammalian and Arabidopsis enzymes

29 29
(Chave et al., 2000; Orsomando et al., 2005). Recombinant proteins were purified by Ni2+
affinity chromatography; in the case of LeGGH1, an additional cation exchange step was requ-
ired. On SDS-PAGE, the LeGGH1 and LeGGH2 proteins migrated as 40- and 42-kD species,
respectively, consistent with their predicted molecular masses (36.4 and 36.7 kD) (Fig. 2-4A).
The LeGGH3 protein migrated as a single 39-kD species (not shown), again consistent with its
predicted mass (36.3 kD).
The bond cleavage specificities of LeGGH1 and LeGGH2 were determined from the reaction
products obtained when folic acid pentaglutamate (PteGlu5) or pABA pentaglutamate (pABA-
Glu5) was used as substrate (Fig. 2-4, B and C). LeGGH1 liberated PteGlu1 and to a lesser extent
PteGlu2 from PteGlu5, and pABAGlu2 and pABAGlu1 from pABAGlu5, indicating that it acts
solely as an endopeptidase. In contrast, LeGGH2 produced all possible cleavage products from
either PteGlu5 or pABAGlu5, yielding (in order of abundance) PteGlu1 > PteGlu4 > PteGlu3 >
PteGlu2, and pABAGlu4 > pABAGlu1 > pABAGlu3 > pABAGlu2, respectively, indicating that
LeGGH2 has both endo- and exopeptidase activity.
The kinetic constants for LeGGH1 and LeGGH2 for PteGlu5 and pABAGlu5 as substrates are
listed in Table 1. The Km values for PteGlu5, 1.20 µM and 1.38 µM for LeGGH1 and LeGGH2,
respectively, are comparable to those reported for the mammalian and Arabidopsis enzymes.
LeGGH1 and LeGGH2 both cleaved PteGlu5 more efficiently than pABAGlu5, as reflected by
the kcat/Km ratios. This is also true of Arabidopsis GGHs (Orsomando et al., 2005). The kcat values
for the tomato GGHs were lower than those reported for Arabidopsis.
No activity was found in purified LeGGH3, the assay being sensitive enough to detect 0.5%
of the activity observed for the other tomato proteins. This negative result is consistent with the
absence of the catalytically essential Cys residue in LeGGH3, and with the low GGH activity in

30 30
flower buds, which express predominantly LeGGH3 (Fig. 2-3A). To confirm that LeGGH3 has
no activity in vivo as well as in vitro, we compared the folate polyglutamylation profile of E. coli
cells expressing LeGGH3 with those of cells expressing LeGGH2 or harboring vector alone (Fig.
2-4D). The three strains had similar doubling times (5–6 h) although the lag phases were longer
for cells expressing the GGH proteins. Folates in the vector control were >90% polyglutamylated
and folates in cells expressing LeGGH2 were 85% deglutamylated. Cells expressing LeGGH3
had an identical profile to the vector control, indicating total lack of GGH activity.
Tomato GGHs Form Heterodimers in E. coli
The structure of recombinant human GGH reveals two active sites (Li et al., 2002). No
residue of either monomer participates directly in the active site of the other, but helix α2 is
important in forming both the dimer interface and the active site, suggesting that the active site
of each monomer might be affected by the monomer with which it is paired. If so, the catalytic
properties of heterodimers would not be predictable from those of homodimers. The
conservation of the dimer interface region in tomato GGHs (Fig. 2-5A) implies that, a priori,
heterodimerization is likely.
Heterodimer formation was investigated in E. coli by co-expressing pairs of individual GGH
proteins, each with a hexahistidine (His6) or FLAG affinity tag (Figure 2-9, 2-10 for constructs).
Cell extracts were analyzed by Western blotting using antibody to the His6 tag, before and after
affinity purification using the FLAG tag (Fig. 2-5B). The system was validated by showing that
cells expressing separate LeGGH2 proteins carrying His6 or FLAG tags formed a doubly tagged
homodimer, i.e., a protein that was retained by the FLAG affinity resin and recognized by the
His6 antibody. Heterodimers were then shown to form between His6-tagged LeGGH2 and FLAG-
tagged LeGGH1 or LeGGH3, and between His6-tagged LeGGH3 and FLAG-tagged LeGGH1.

31 31
GGH Dimers Do Not Dissociate and Reassociate
A similar approach was used to test whether dimers dissociate under physiological conditions.
Equimolar amounts of LeGGH2-FLAG and LeGGH3-His6 homodimers were mixed and incubat-
ed at 30°C in 0.1 M K-phosphate buffer, pH 6.0, containing 10% glycerol. At intervals, samples
were applied to the FLAG affinity resin, and the bound fraction was subjected to Western
analysis using His6 antibody. No His6-labeled protein was detected after as long as 4 h, indicat-
ing that the extent of homodimer dissociation and reassociation into heterodimers was negligible
(Fig. 2-5C). Controls showed that 2% heterodimer formation would have been detected (Fig. 2-
5C).
Characterization of GGH Heterodimers
The activities of affinity-purified hetero- and homodimers were compared using PteGlu5 as
substrate (Fig. 2-6A). The co-expression system outlined above enabled isolation of pure
preparations of dimers comprised of one His6- and one FLAG-tagged monomer following
sequential affinity purification steps on FLAG- and Ni2+-affinity resins. Tests with LeGGH2
homodimers confirmed that the doubly tagged enzyme had the same properties as the singly
His6-tagged version described above (Fig. 2-4B). LeGGH1-LeGGH2 heterodimers had a specific
activity similar to that of LeGGH2 homodimers, but heterodimers involving the inactive monom-
er LeGGH3 (LeGGH2-LeGGH3 and LeGGH1-LeGGH3) showed 50–60% less activity than di-
mers containing active monomers. LeGGH1 homodimers containing His6- and FLAG-tagged
monomers were not included in these tests because they could not be adequately purified.
That an inactive monomer roughly halves the activity of the GGH heterodimer suggests that
while dimer formation is necessary for activity, the catalytic function of each monomer is
independent of the other. To further dissect the situation, the bond cleavage specificity of each
dimer was assessed using PteGlu5 as substrate (Fig. 2-6B). As in the data of Figure 4, LeGGH1

32 32
cleaved PteGlu5 to PteGlu1 and PteGlu2, while LeGGH2 gave all possible cleavage products.
LeGGH1-LeGGH2 heterodimers also cleaved PteGlu5 to all possible products but the proportion
of each product reflected the bond cleavage specificity of the component monomers. Thus, the
heterodimer produced PteGlu3 and PteGlu4, which LeGGH1 alone cannot produce, yet in
amounts ~50% less than produced by the LeGGH2 homodimer (Fig. 2-6B). As might be
expected, when LeGGH1 or LeGGH2 was paired with the inactive LeGGH3 monomer, the bond
cleavage specificity of the heterodimer was that of the active component.
The Inactive LeGGH3 Homodimer Does Not Sequester Folate
Given the catalytic incompetence of the LeGGH3 homodimer, we tested whether this protein
has folate binding activity that could make folates unavailable for enzymatic reactions. The
activity of LeGGH2 was measured at a subsaturating concentration (1 µM) of PteGlu5 in the pre-
sence of various amounts of LeGGH3, so that the molar ratio PteGlu5/LeGGH3 ranged from 0.1
to 10 (Fig. 2-6C). Tight binding of PteGlu5 by LeGGH3 would limit its availability to LeGGH2
and so reduce product formation. The observed reduction in total cleavage products was modest
even at the highest LeGGH3 concentration tested (10 µM, 0.72 mg mL-1), which is at least 1000-
fold greater than that likely to occur in planta. Nor was there much effect on the nature of the
cleavage products except that PteGlu4, the result of exopeptidase action, became more prominent
at high LeGGH3 levels. These results make it unlikely that LeGGH3 sequesters folates in vivo.
LeGGH1 and LeGGH2 Form Heterodimers In Planta
A bimolecular fluorescence complementation approach was used to investigate whether
heterodimers form in plants. The entire open reading frames of LeGGH1 and LeGGH2
(including their signal peptides) were C-terminally fused via a linker to complementary
fragments of the yellow fluorescent protein (YFP) (Figure 2-10 for constructs). When co-trans-
formed into Arabidopsis protoplasts, control LeGGH2 constructs carrying complementary YFP

33 33
fragments gave fluorescence signals comparable to those obtained with intact YFP, demon-
strating homodimer formation as expected (Fig. 2-7). Similar signals were observed in
protoplasts co-transformed with LeGGH1 and LeGGH2 carrying complementary YFP
fragments, but not when the region specifying the mature protein was deleted from the
LeGGH1construct or when protoplasts were transformed with the complementary YFP
fragments alone (Fig. 2-7). The latter observations exclude the possibility that the fluorescence
complementation occurs merely because the complementing fragments are juxtaposed in the
same cell or subcellular compartment. Together, these data demonstrate that GGH heterodimers
can form in planta.
Discussion
Although generally considered to be physiologically important, GGH remains poorly
understood in plants. First, unlike animals, plants often have families of GGH genes, but the evo-
lutionary origin and functional significance of this diversity are unclear. Second, much of what is
known about GGH rests on studies of homodimers, but homodimers may not be the only – or
even the most important – forms in planta. Our results shed light on both these areas.
Like Arabidopsis, tomato proved to have three GGH genes, although differently
arranged; they are concatenated in Arabidopsis (Orsomando et al., 2005) but are on two different
chromosomes in tomato. A survey of plant genomes and phylogenetic analysis of plant GGH
sequences indicated that small GGH gene families are common among eudicots, and that these
families most probably arose from recent duplications of a single ancestral gene within various
lineages. Multiple GGH gene preservation in the eudicot lineage could be the outcome of
subfunctionalization (Ward and Durrett, 2004). Thus, LeGGH1 behaves exclusively as an endo-
peptidase, whereas LeGGH2 has an additional exopeptidase activity, so that the two enzymes in
a sense complement each other. The same is true of Arabidopsis AtGGH1 and AtGGH2

34 34
(Orsomando et al., 2005). Hence, it appears that individual eudicot GGH genes have undergone
subfunctionalization and as a result are somewhat complementary. That LeGGH1 and LeGGH2
are expressed in parallel and that their individual bond cleavage patterns are both reflected in
various tomato tissues supports this notion.
Surprisingly, one tomato gene (LeGGH3) was found to specify a non-functional protein
lacking a catalytic Cys residue. The product of the soybean GGH1 gene (Huangpu et al., 1996)
lacks the same residue and is thus also presumably non-functional. This coincidence encourages
speculation that such GGH genes confer some adaptive advantage but, if this exists, it seems not
to lie either in dominant negative regulatory interactions or in folate sequestration (see below).
All possible heterodimers between LeGGH1, LeGGH2, and LeGGH3 monomers were
shown to form when their genes were co-expressed in E. coli, and LeGGH1-LeGGH2
heterodimers were also demonstrated in Arabidopsis protoplasts. Such heterodimer formation
has not been shown previously for GGH from any source. The LeGGH1-LeGGH2 heterodimer
showed homodimer-like activity levels and a substrate preference midway between those of the
homodimers, suggesting that the active site of each monomer functions independently. This not-
ion is supported by the roughly halved activity of heterodimers between LeGGH1 or LeGGH2
and the inactive LeGGH3, and by the retention in these heterodimers of the substrate preference
of the active partner. Thus, each monomer in GGH dimers appears to function autonomously and
to contribute equally to activity and overall bond cleavage specificity. The halved activity of the
heterodimers containing a LeGGH3 subunit argues against the scenario, mooted for mammalian
GGHs, that the two active sites alternate in function, i.e., that dimers show half-of-the-sites react-
ivity (Eisele et al., 2006; Alexander et al., 2008).

35 35
The absence of a dominant negative effect (i.e. an activity loss of >50%) of LeGGH3 on
heterodimer activity excludes the possibility that LeGGH3 (or presumably soybean GGH1)
suppresses GGH activity when co-expressed with an active GGH. LeGGH3 expression merely
draws active monomers into heterodimeric associations without diminishing their activity. Nor
does LeGGH3 appear to bind folate polyglutamates tightly enough to protect them from attack
by active GGH, or presumably by other folate-dependent enzymes. Nevertheless, as noted above,
the occurrence of similar inactive GGH isoforms in both tomato and soybean warrants conjecture
that such isoforms are biologically significant. This view is reinforced by the high expression
level of the inactive soybean GGH1 compared to GGH2, as reflected by relative EST abundance
(266 versus 26, respectively; http://compbio.dfci.harvard.edu/tgi/cgi-
bin/tgi/gimain.pl?gudb=soybean, Soybean Gene Index). Furthermore, of two GGHs in the slime
mold Dictyostelium discoideum, GenBank XP637673 and XP636287, the latter lacks the
glutamine residue in the conserved catalytic center motif (QXHPE) of this family of hydrolases.
One possibility is that GGH proteins have an undiscovered second catalytic activity that does not
depend on residues essential to GGH activity. In this connection, it will be informative to see if
more examples of inactive GGH proteins emerge as genome and EST sequencing progresses.
The lack of dimer dissociation-reassociation implies that only genes that are expressed
simultaneously will give rise to heterodimers as sequential expression would produce
homodimers. However, as Northern analyses indicate that LeGGH1 and LeGGH2 are co-
expressed in most organs, it is likely that LeGGH1-LeGGH2 heterodimers occur throughout the
plant. That LeGGH1 and LeGGH2 are expressed at similar levels further suggests that these
heterodimers are the predominant GGH form in planta.

36 36
Finally, it is interesting to note that expressing LeGGH2 in E. coli caused massive folate
deglutamylation without preventing growth. A similar result has been reported in the bacterium
Lactococcus lactis; expressing mammalian GGH led to complete folate deglutamylation but not
to growth reduction (Sybesma et al., 2003). Such findings suggest that the polyglutamyl tail
might be less metabolically crucial than generally thought (e.g., Lowe et al., 1993, and references
therein). However, the role of polyglutamylation may be more prominent in plants due to
compartmentalization of folates in various organelles. Massive deglutamylation in planta, where
high demands for folate cofactors exist in mitochondria and to a lesser degree in chloroplasts,
might therefore have more severe effects. The presence of the folate tail generally prevents
transport of polyglutamates across membranes (Appling, 1991) so that folate polyglutamylation
in plant organelles likely favors folate retention, as it does in mammalian mitochondria (Shane,
1989). In this context, impairing vacuolar GGH activity could serve to trap polyglutamylated
folates already present in this compartment, where 20-60% of the total cellular folate pool
resides (Orsomando et al., 2005). With the GGH system in tomato now characterized, metabolic
engineering can in principle be used to explore the importance of folate polyglutamylation in this
important crop species.
Experimental Procedures
Plant Materials
Seed for Solanum lycopersicum cv. Ailsa craig (AC) were acquired from the Tomato
Genetics Resource Center (UC Davis, CA). In the summer of 2006 eight plants were grown to
maturity in soil containing slow release fertilizer in climate and light controlled greenhouses
(28oC/16 h day and 21oC/8 h night) at the Boyce Thompson Institute for Plant Research, Cornell
University, Ithaca, NY. Arabidopsis cell suspension cultures were maintained in MS medium

37 37
supplemented with 3% (w/v) sucrose, 1 mg L-1 2,4-dichlorophenoxycetic acid, and 1× MS
vitamin solution (Caisson Laboratories) with constant shaking in darkness. Culture medium was
replaced every 5 days by dilution of 1:5 (inoculum: fresh medium) and cells required for
experiments were taken 3-4 days after subculture.
Cloning of Tomato GGH Genes
Public sequence data from the Solanaceae Genomics Network (www.sgn.cornell.edu)
were utilized to identify EST sequences and corresponding cDNA clones for three tomato GGH
genes via BLAST with Arabidopsis homologs. The cDNA clones that form the Unigene for each
GGH gene (LeGGH1: SGN-U318513, SGN-U318514 and SGN-U336541; LeGGH2: SGN-
U328054; LeGGH3: SGN-U331140) were sequenced using M13 primers (M13forward: 5′-
GGAAACAGCTATGACCATG-3′, M13reverse: 5′-GTAAACGACGGCCAGT-3′). While
SGN-U318513 contained a full LeGGH2 predicted ORF, the available LeGGH1 and LeGGH3
cDNA harbored truncated cDNAs. The remaining LeGGH1 5′ sequence was recovered from
tomato BAC clone LeHBaEcoRI-174-D5 which was identified by screening an EcoRI tomato
BAC library (www.sgn.cornell.edu) arrayed on high-density nylon filters and probed with the 3′-
UTR spanning nucleotides 1290 to 1451 of the LeGGH1 cDNA sequence (labeling and
hybridization method described in Southern Blot Analysis). The remaining LeGGH3 5′ sequence
was recovered from a 5′-RACE product generated using the SMARTTM RACE cDNA
amplification kit (Clontech Laboratories Inc., CA) using primer 5′-TCGACCGGAGTCTCCG-
TCACCGGGATG-3′. Once full-length cDNA sequence was available for all three GGH genes,
RT-PCR was employed to recover and clone full-length cDNAs. RNA was extracted from
combined tomato flower buds spanning approximately -3 to +2 days post anthesis. Full length
cDNAs for LeGGH1, LeGGH2 and LeGGH3 were amplified using gene specific primers
designed in their respective 5′- and 3′- UTRs (see Supplemental Table S1) using the FastStart

38 38
High Fidelity PCR System (Roche, IN). Resulting cDNA fragments were ligated into the pGEM-
T Easy Vector System I (Promega, WI) and sequenced to verify integrity.
Southern and Northern Analysis
S. lycopersicum genomic DNA (cv. M82) and total RNA (cv. Ailsa Craig) extractions,
gel fractionation, blotting, and hybridizations were performed as described (Barry et al., 2005).
PCR-amplified probes from the 3´-UTR of each LeGGH gene (see Supplemental Table S1 for
PCR primers) were labeled as described by Feinberg and Vogelstein, (1983). Images were
obtained by exposing membranes (Hybond N+, Amersham) to a storage phosphor screen
(Molecular Dynamics) for 16 h prior to scanning by a Storm 840 Optical Scanner with software
packages Storm Control version 5.02 and ImageQuant version 5.2 (Molecular Dynamics).
Expression Constructs
To express LeGGHs in E. coli, the signal peptide sequences (Supplemental Figure S1) were
replaced by initiation codons using full length cDNAs as templates and PCR mediated by Pfu
Turbo polymerase (Stratagene); the primers (P1-P6) are given in Table 2-2 and the expression
constructs are diagrammed in Figure 2-9 and 2-10. The amplicons were cloned between the NdeI
and XhoI sites of pET28b (Novagen), which adds an N-terminal His6 tag; the three constructs
were named pHGGH1-3. Using these constructs as templates, the His6 tags were replaced with a
FLAG tag by PCR using primer P7 in combination with the reverse primers for each original
construct (P2, P4, and P6). The amplicons were cloned between the NcoI and XhoI sites of
pET28b, which generated N-terminal FLAG fusions of each GGH; these constructs were named
pFGGH1-3. To co-express individually tagged GGHs, the above constructs were utilized as
follows. Using pHGGH2 as template, primer pair P8/P4 were used to amplify the His6-tagged
GGH2 open reading frame which was subsequently cloned into the XhoI site of pFGGH2. The
resulting construct (pFHGGH2-2) encodes a bicistronic message composed of FLAG-GGH2 and

39 39
His6-GGH2 separated by a ribosome binding site. Similarly, the PCR product generated by prim-
er pair P8/P4 was cloned into the XhoI site of pFGGH3, yielding pFHGGH3-2, permitting co-
expression of FLAG-GGH3 and His6-GGH2. Using pFGGH1 as template, primer pair P7/P9
generated a PCR product that was cloned between the NcoI and NotI sites of pET28b. This
plasmid was then digested with BamHI and NotI and the PCR product generated with primer
pair P10/P11 using pHGGH2 as a template was ligated between these sites. The resulting
construct (pFHGGH1-2) co-expresses FLAG-GGH1 and His6-GGH2. To co-express FLAG-
GGH1 and His6-GGH3, XbaI-digested pHGGH3 was ligated to the fragment released from XbaI-
digested pFHGGH1-2 to create pFHGGH1-3. All constructs were cloned in E. coli DH10B cells
and sequence-verified.
Recombinant Protein Expression and Purification
The above constructs were electroporated into E. coli BL21-CodonPlus (DE3)-pRIL cells,
which were grown at 37°C in LB medium containing 75 µg mL-1 kanamycin and 25 µg mL-1
chloramphenicol. When A600 reached 0.6, isopropyl 1-thio-β-D-galactopyranoside was added to a
final concentration of 1 mM and incubation continued for 4 h at 27°C, at which point cells were
pelleted, washed in 50 mM potassium phosphate, 150 mM NaCl, pH 8.0, re-pelleted and frozen
at -80°C. Proteins were extracted as described (Orsomando et al., 2005) and His6-tagged proteins
were purified by Ni2+ affinity chromatography. In the case of LeGGH1, partially pure effluents
from Ni2+ affinity resin were applied to a Mono S 5/50 GL column (Amersham Biosciences)
equilibrated in Buffer A (100 mM potassium phosphate, pH 5.5). GGH activity was eluted (2 mL
min-1) with a 25-mL linear gradient of 0-1.0 M KCl in Buffer A, collecting 0.3-mL fractions
using an ÄKTApurifier UPC10 FPLC system (GE Healthcare). Active fractions were pooled,
desalted on PD-10 columns equilibrated with 100 mM potassium phosphate, pH 6.0, 10% (v/v)
glycerol, 10 mM β-mercaptoethanol, and concentrated to 0.3 mL in a Centricon-10 (Millipore).

40 40
FLAG-tagged proteins were purified using M2-affinity resin according to the manufacturer’s
instructions (Sigma); bound proteins were eluted with four column volumes of FLAG peptide
(150 µg mL-1) in 100 mM potassium phosphate, pH 6.0, 10% glycerol and immediately desalted
on Sephadex G-25 mini-columns (Helmerhorst and Stokes, 1980) equilibrated with the same
buffer plus 10 mM β-mercaptoethanol. If proteins were not to be used for activity assays they
were eluted from the M2-affinity resin with 0.1 M glycine, pH 3.5 and rapidly equilibrated with
one tenth the elution volume of 0.5 M Tris-HCl, 1.5 M NaCl, pH 7.4. Protein concentration was
estimated by the method of Bradford (1976) using bovine serum albumin as the standard.
SDS-PAGE and Western Analysis
Proteins were separated by SDS-PAGE using 10% (w/v) polyacrylamide gels (Sambrook
et al., 1989). For Western analysis, proteins were electrophoretically transferred to Immobilon-P
membranes (Millipore) using a Trans-Blot SD Semi-Dry transfer system (Bio-Rad). Blotted
membranes were incubated overnight in TBS (20 mM Tris-HCl, 150 mM NaCl, pH 7.5)
containing 5% (w/v) non-fat milk powder, washed with TBS containing 0.1% (v/v) Tween 20,
and incubated for 1 h with anti-His5 antibody (1:2000) (Qiagen) in TBS containing 5% (w/v)
non-fat milk powder. Membranes were then washed in TBS containing 0.1% (v/v) Tween 20 and
incubated with alkaline phosphatase-conjugated goat anti-mouse IgG (1:3000) (Bio-Rad) in TBS
containing 5% (w/v) non-fat milk powder. Alkaline phosphatase activity was detected by incub-
ating for 10 min in 100 mM Tris-HCl, pH 9.5, 100 mM NaCl, 5 mM MgCl2, 0.04% (w/v) nitro
blue tetrazolium, 0.02% (w/v) 5-bromo-4-chloroindolyl phosphate.
Tomato Protein Extraction and GGH Assays
Tomato tissue was ground in liquid N2 to a fine powder and proteins were extracted in
100 mM potassium phosphate, pH 6.0, 10% (v/v) glycerol, 10 mM β-mercaptoethanol, and 3%
(w/v) polyvinylpolypyrrolidone. Extracts were centrifuged (20,000g, 20 min, 4°C) and

41 41
supernatants were desalted on PD-10 columns in 100 mM potassium phosphate, pH 6.0, 10%
(v/v) glycerol, 10 mM β-mercaptoethanol (GGH buffer). GGH activity was measured as
described (Orsomando et al., 2005). Reactions were performed in GGH buffer and were initiated
by adding PteGlu5 or pABAGlu5 at a final concentration of 0.1 mM. Following incubation at
37°C for up to 8 h, reactions were stopped by boiling for 3 min and clarified by centrifugation.
Reaction products were separated by HPLC using a 5 µm, 25 × 0.46 cm Discovery C18 column
(Supelco), eluted with a 10-min linear gradient from 20 to 50% methanol in 50 mM sodium
phosphate, pH 6.0, containing 8 mM tetrabutylammonium bisulfate. PteGlun or pABAGlun
products were detected by absorption at 282 nm or by fluorescence (270 nm excitation, 350 nm
emission), respectively, and quantified relative to standards obtained from Schirks Laboratories
(Jona, Switzerland). For kinetic studies, initial rate of formation of total products were measured
when no more than 15% of the substrate was consumed. Bond cleavage specificity was
determined by plotting the extent of hydrolysis versus the relative concentration of the various
PteGlun or pABAGlun products, as described (Bhandari et al., 1990). These terms are defined as
follows.
(XGlu4 + XGlu3 + XGlu2 + XGlu1)
Extent of reaction = ___________________________________________________ (XGlu5 + XGlu4 + XGlu3 + XGlu2 + XGlu1)
(XGlun) Relative concentration = ___________________________________________________
(XGlu5 + XGlu4 + XGlu3 + XGlu2 + XGlu1)
Where XGlun = PteGlun or pABAGlun. The slope of the line corresponding to each product
measures the relative extent of its formation and therefore indicates the γ-glutamyl bond
cleavage specificity of each enzyme.

42 42
Folate Analysis of E. coli Cells Expressing GGH
E. coli BL21-CodonPlus (DE3)-pRIL cells were transformed with pHGGH2, pHGGH3,
and/or the pET28b vector alone, as described above. The vector alone was digested with XbaI
and XhoI, blunted with T4 DNA polymerase, and re-ligated to stop expression of the 52-residue
peptide encoded by the multiple cloning site. Cells were grown in 100 mL of M9 minimal
medium supplemented with 0.1% thiamine (w/v) at room temperature in the presence of 1 mM
IPTG until A600 was between 0.5 and 0.7 at which point cells were pelleted and stored at -80°C.
Folates were extracted and quantified by HPLC with electrochemical detection as described
(Naponelli et al., 2007). Cell pellets were resuspended in 5 mL of 50mM HEPES/CHES, pH 7.8,
2% (w/v) sodium ascorbate, 10 mM β-mercaptoethanol and boiled for 10 min followed by
centrifugation (13,000g, 10 min). The pellets were re-extracted in the same way and the extracts
were combined, split in two, and treated plus or minus rat plasma conjugase to determine total
folate or degree of folate polyglutamylation, respectively. Folates were purified on 2.5-mL folate
affinity columns prior to HPLC analysis (Gregory and Toth, 1988). The folate contents of cells
harboring vector, pHGGH2, and pHGGH3 were 1.10 ±0.12, 0.94 ±0.15, and 2.23 ±0.06 nmol
mg-1 protein, respectively. These values are all in the normal range for E. coli (Rohlman and
Matthews, 1990).
Bimolecular Fluorescence Complementation (BiFC)
BiFC vectors were constructed using the pBS-YFP vector (Genbank Accession
AY189981) as a template. The primers (P12-P20) used are listed in Supplemental Table S1 and
the BiFC vectors are illustrated in Figure 2-10. The N-terminal YFP fragment (YFPN, amino
acids 1-155) was amplified with primer pair P12/P13 and ligated into the NdeI/XhoI sites of
pET28b while the C-terminal YFP fragment (YFPC, amino acids 156-239) was amplified with
primer pair P14/P15 and ligated into the NdeI/XhoI sites of pFGGH2. This generated N-terminal
43 43
His6- and FLAG-tags fused via a linker to YFPN and YFPC, respectively. These tagged YFP
fragments were released by digestion with NcoI and XbaI. The pBS-YFP vector was digested
with NcoI/XbaI to release the full YFP sequence and replaced with either tagged YFPN or YFPC,
to generate pHNYFP or pFCYFP, respectively. pHNYFP and pFCYFP were each digested with
NcoI, blunted, and ligated to create an NsiI site immediately upstream of the tagged YFP
fragments. The full-length LeGGH2 sequence was amplified with primer pair P16/P17, digested
with PstI and ligated into NsiI-digested pHNYFP and pFCYFP creating pG2NYFP and
pG2CYFP, respectively. The full length LeGGH1 sequence was amplified with primer pair
P18/P19, digested with NcoI and ligated into the NcoI site of pHNYFP creating pG1NYFP. The
signal peptide region of LeGGH1 (amino acids 1-32) was amplified with primer pair P18/P20,
digested with NcoI and ligated into the NcoI site of pFCYFP creating pSPG1CYFP.
BiFC experiments were performed in Arabidopsis protoplasts isolated from cell
suspension culture. Cells were incubated in 1% (w/v) cellulose R-10, 0.25% (w/v) macerozyme
R-10 (Yakult), 0.4 M mannitol, 8 mM CaCl2, 5 mM MES-KOH, pH 5.7 for 4 h with gentle
agitation. Digested cells were passed through a 70 µm nylon mesh (Spectrum Laboratories) and
washed twice with washing buffer (0.4 M mannitol, 70 mM CaCl2, 5 mM MES-KOH, pH 5.7).
Protoplasts were purified by flotation on a 0.5 M sucrose solution, washed twice in washing
buffer and incubated in W5 solution (154 mM NaCl, 5 mM KCl, 125 mM CaCl2, 5 mM glucose,
2 mM MES-KOH, pH5.7) for 30 min on ice prior to transfection. Protoplasts were transfected
according to the methods of Sheen and colleagues, http://genetics.mgh.harvard.edu/sheenweb/
and fluorescence was visualized with an Olympus BX51 fluorescence microscope as described
(Paul et al., 2005).

44 44
Acknowledgements
We thank Dr. Albrecht von Arnim for providing the pBS-YFP vector, Dr. Anna-Lisa Paul for
technical guidance on BiFC imaging, Dr. Rob Ferl and Beth Laughner for providing the
Arabidopisis cell suspension culture, Dr. Thomas Ryan for advice on GGH construct design, and
Dr. D.L. Purich for suggesting the folate sequestration experiment.

45 45
Table 2-1. Kinetic parameters of LeGGH1 and LeGGH2 homodimers with PteGlu5 or pABAGlu5 as substrate
Homodimer PteGlu5 pABAGlu5
Km kcat kcat/Km Km kcat kcat/Km
µM s-1 s-1 M-1 µM s-1 s-1 M-1
LeGGH1 1.20 ± 0.09 1.69 ± 0.27 1.41 × 10⁶ 0.98 ± 0.05 0.96 ± 0.06 9.75 × 10⁵
LeGGH2 1.38 ± 0.13 2.13 ± 0.42 1.55 × 10⁶ 1.31 ± 0.2 1.08 ± 0.11 8.19 × 10⁵

46 46
Table 2-2. Synthetic oligonucleotides used in this study. Restriction sites are underlined. Start codons are in green and stop codons in red. Sequences complementary to the pET28b vector are in blue and the FLAG sequence is in italics. Co-Expression & BiFC Constructs (5′-3′) P1 GATCGATCCATATGAGTTGTCCTGCGCCGGAC P2 TGATCGTCGACCTACATAGAGCTCGAGGAAGA P3 GATCGATCCATATGAGCTGTCCGGCGACTGAT P4 TGATCCTCGAGCTACAGAGAGCTCAAGGTAGGACG P5 GATCGATCCATATGGGCTGTCCTTTGCCTGAC P6 TGATCCTCGAGCTAAACAGAGTCCATAGCAGG P7 TATACCATGGACTACAAAGACGATGACGACAAGAGCAGCGGCCTGGTG
C P8 TGATCCTCGAGGATAACAATTCCCCTCTAG P9 ATAAGAATGCGGCCGCTGATCGGATCCCTACATAGAGCTCGAGGAA
GA P10 TGATCGGATCCGATAACAATTCCCCTCTAG P11 ATAAGAATGCGGCCGCCTACAGAGAGCTCAAGGTAGGACG P12 GATCGATCCATATGGTGAGCAAGGGCGAGG P13 TGATCCTCGAGTGATCTCTAGACTAGGCCATGATATAGACGTTGTGG P14 GATCGATCCATATGGACAAGCAGAAGAACGGCATC P15 TGATCCTCGAGTGATCTCTAGACTACTTGTACAGCTCGTCCATGCC P16 TATACTGCAGATGGAAACCAATTTTTTGATTCC P17 TATACTGCAGCTCAGAGAGCTCAAGGTAGGACGC P18 TATACCATGGGAAACTACCTTTCGATTTC P19 TATACCATGGTCATAGAGCTCGAGGAAGAATGTGG P20 TATACCATGGACGACGGTAGAGTTAGGTAGGAATTAA Cloning of full length cDNAs Forward (5′-3′) Reverse (5′-3′) GGH1
CTAGTCCAGTACTCAGATATAAGTTACG
GTGGTCCAGAACGGATAAGCTTA
GGH2
GCATGTTCAATACTCACAGACC TCAGAGACTTGTGCTCCAATTC
GGH3
ATGTCTAACTACTTCCTCATTTCCC
CGATTGCTTGAAGCATGAATG
3′ UTR Hybridization Probes Forward (5′-3′) Reverse (5′-3′) GGH1
TTAGTGGATGTTGATCACGGGTT CACTTGGAAAGCATAAAGGTTCAG
GGH2
TTAGTGGATGTTGATCACGGGTT CACTTGGAAAGCATAAAGGTTCAG
GGH3
CAGAGGAAATGCATATGACCTAAG
GTTCAATTACAACTCGAAATATCTC

47 47
Figure 2-1. Tissue Structure of tetrahydrofolate polyglutamates. One carbon units at various oxidation levels can be coupled to the N5 and/or N10 positions. A γ-linked polyglutamyl tail of up to about six residues is attached to the first glutamate. Folates undergo oxidative cleavage of the C9-N10 bond yielding pterin and pABAGlun moieties. The arrows show bonds cleaved by GGH.
O
C
C
γγγγ-Glu tail
N
NHNH
5
NH
NH2
O
CH2
9
HH
HNH
10CH
COOH
NH
CH2
CH2
NH
O
CH
COOH
CH2
CH2
NH
CH
COOH
CH2
CH2
COOH
Pteroate
pABAGlu1
n
Folate
C
O
Pterin
O
C
C
γγγγ-Glu tail
N
NHNH
5
NH
NH2
O
CH2
9
HH
HNH
10CH
COOH
NH
CH2
CH2
NH
O
CH
COOH
CH2
CH2
NH
CH
COOH
CH2
CH2
COOH
Pteroate
pABAGlu1
n
Folate
C
O
Pterin

48 48
Figure 2-2. Southern blot analysis and GGH phylogeny. A, S. lycopersicum genomic DNA (10 µg) was digested with restriction enzymes BstnI, DraI, EcoRI, EcoRV, HaeIII, or ScaI. The digested samples were separated on a 1% agarose gel, blotted to nitrocellulose, and hybridized to gene-specific 32P-labeled probes corresponding to the 3′-UTR of each GGH gene (upper three frames) or to the coding region of LeGGH2 (lower frame). B, Evolutionary relationships of GGH sequences of tomato (Le), Arabidopsis (At), soybean (Gm), Populus trichocarpa (Pt), rice (Os), barley (Hv), and maize (Zm). Sequences were extracted from genome and EST databases. The tree was constructed by the Neighbor-Joining method. The percentages of replicate trees in which the associated taxa clustered together in the bootstrap test (1000 replicates) are shown next to branches. The tree is drawn to scale; evolutionary distances are in units of the number of amino acid substitutions per site.
BAtGGH2AtGGH3
AtGGH1Pt1Pt2
Gm1Gm2
LeGGH3LeGGH1LeGGH2ZmOsHv
44100
53100
9969
4638
47
75
100
0.05
Monocots
Eudicots
A
GGH2-coding
GGH3-3′
ScaI
BstnIDra
IEco
RI
EcoRV
HaeIII
ScaI
BstnIDra
IEco
RI
EcoRV
HaeIII
GGH1-3′
GGH2-3′
BAtGGH2AtGGH3
AtGGH1Pt1Pt2
Gm1Gm2
LeGGH3LeGGH1LeGGH2ZmOsHv
44100
53100
9969
4638
47
75
100
0.05
Monocots
Eudicots
AtGGH2AtGGH3
AtGGH1Pt1Pt2
Gm1Gm2
LeGGH3LeGGH1LeGGH2ZmOsHv
44100
53100
9969
4638
47
75
100
0.05
AtGGH2AtGGH3
AtGGH1Pt1Pt2
Gm1Gm2
LeGGH3LeGGH1LeGGH2ZmOsHv
44100
53100
9969
4638
47
75
100
0.050.05
Monocots
Eudicots
A
GGH2-coding
GGH3-3′
ScaI
BstnIDra
IEco
RI
EcoRV
HaeIII
ScaI
BstnIDra
IEco
RI
EcoRV
HaeIII
GGH1-3′
GGH2-3′
A
GGH2-codingGGH2-coding
GGH3-3′
ScaI
BstnIDra
IEco
RI
EcoRV
HaeIII
ScaI
BstnIDra
IEco
RI
EcoRV
HaeIII
ScaI
BstnIDra
IEco
RI
EcoRV
HaeIII
ScaI
BstnIDra
IEco
RI
EcoRV
HaeIII
GGH1-3′GGH1-3′
GGH2-3′GGH2-3′

49 49
Figure 2-3. LeGGH gene expression and enzyme activity. A, Northern analysis. Total RNA (15 µg) was fractionated on a 1% agarose-formaldehyde gel, blotted to a nylon membrane, and hybridized to gene-specific 32P-labeled probes corresponding to the 3′-UTR of each gene. B, GGH activity was assayed in desalted crude tissue extracts using 0.2 mM PteGlu5 as substrate. Specific activity values are the means ± SE of three independent experiments using tissue pooled from 3-5 different plants. MG, mature green fruit; Br, breaker stage fruit; RR, red ripe fruit; L, leaf; R, root; S, stem; Sh, shoot; P, pedicel; FB, flower bud; F, flower; Se, sepal; Pe, petal; St, stamen; C, carpel.
B
Spe
cific
activ
ity
(nm
olm
in-1
mg-
1pr
otei
n)
MG Br RR Sh F FB L R0
0.4
0.8
1.2
Fruit
L MG Br RR R S Sh P FB PeSe St C
GGH1
GGH2
GGH3
A
rRNA
Fruit
B
Spe
cific
activ
ity
(nm
olm
in-1
mg-
1pr
otei
n)
MGMG BrBr RRRR ShSh FF FBFB LL RR0
0.4
0.8
1.2
FruitFruit
L MG Br RR R S Sh P FB PeSe St C
GGH1
GGH2
GGH3
A
rRNA
Fruit
L MG Br RR R S Sh P FB PeSe St C
GGH1
GGH2
GGH3
A
rRNA
Fruit
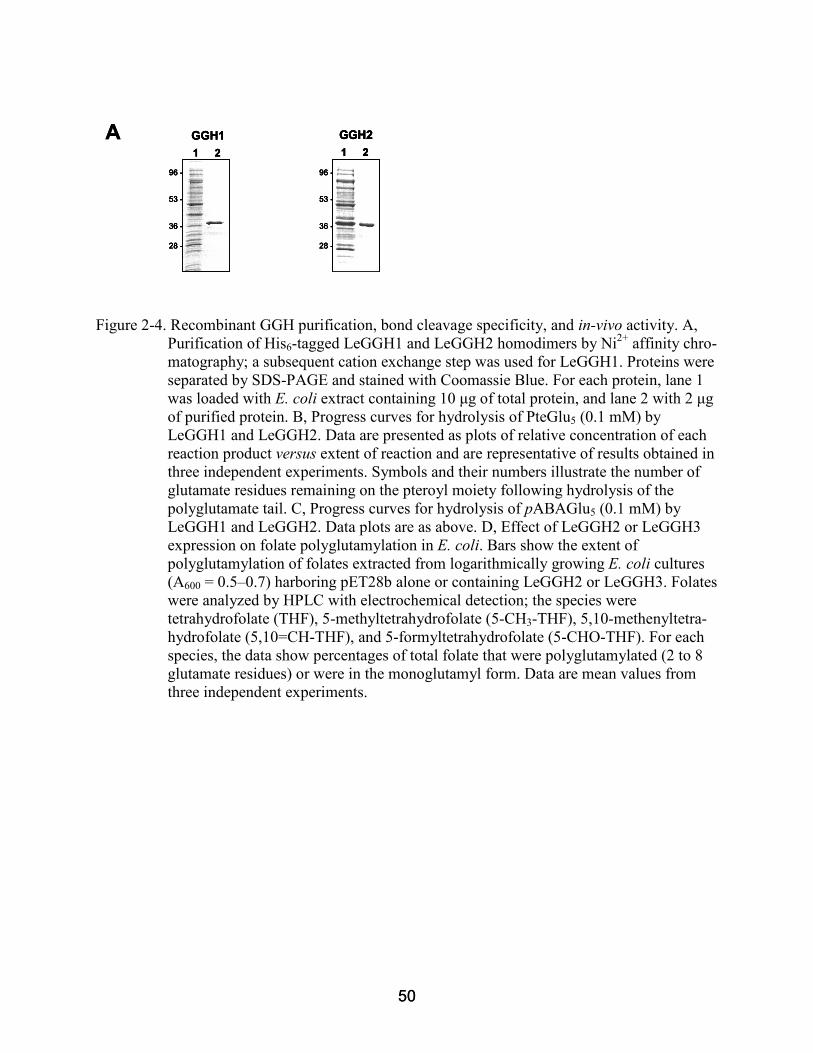
50 50
Figure 2-4. Recombinant GGH purification, bond cleavage specificity, and in-vivo activity. A,
Purification of His6-tagged LeGGH1 and LeGGH2 homodimers by Ni2+ affinity chro-matography; a subsequent cation exchange step was used for LeGGH1. Proteins were separated by SDS-PAGE and stained with Coomassie Blue. For each protein, lane 1 was loaded with E. coli extract containing 10 µg of total protein, and lane 2 with 2 µg of purified protein. B, Progress curves for hydrolysis of PteGlu5 (0.1 mM) by LeGGH1 and LeGGH2. Data are presented as plots of relative concentration of each reaction product versus extent of reaction and are representative of results obtained in three independent experiments. Symbols and their numbers illustrate the number of glutamate residues remaining on the pteroyl moiety following hydrolysis of the polyglutamate tail. C, Progress curves for hydrolysis of pABAGlu5 (0.1 mM) by LeGGH1 and LeGGH2. Data plots are as above. D, Effect of LeGGH2 or LeGGH3 expression on folate polyglutamylation in E. coli. Bars show the extent of polyglutamylation of folates extracted from logarithmically growing E. coli cultures (A600 = 0.5–0.7) harboring pET28b alone or containing LeGGH2 or LeGGH3. Folates were analyzed by HPLC with electrochemical detection; the species were tetrahydrofolate (THF), 5-methyltetrahydrofolate (5-CH3-THF), 5,10-methenyltetra-hydrofolate (5,10=CH-THF), and 5-formyltetrahydrofolate (5-CHO-THF). For each species, the data show percentages of total folate that were polyglutamylated (2 to 8 glutamate residues) or were in the monoglutamyl form. Data are mean values from three independent experiments.
A1 2
GGH2
96 -
53 -
36 -
28 -
1 2
GGH1
96 -
53 -
36 -
28 -
A1 2
GGH2
96 -
53 -
36 -
28 -
1 2
GGH21 2
GGH2
96 -
53 -
36 -
28 -
96 -
53 -
36 -
28 -
1 2
GGH1
96 -
53 -
36 -
28 -
1 2
GGH1
96 -
53 -
36 -
28 -
96 -
53 -
36 -
28 -

51 51
Figure 2-4. Continued
THF 5-CH3-THF 5,10=CH-THF 5-CHO-THF
Monoglutamates Polyglutamates
Percent of total folates
GGH3
GGH2
Vector
020406080100 20 40 60 80 100
D
C
Rel
ativ
eco
ncn
Extent of reaction
GGH2GGH1
0
0.02
0.04
0.06
0.08
0 0.05 0.1 0.15 0.2 0.250
0.02
0.04
0.06
0.08
0 0.05 0.1 0.15 0.2 0.25
1234
12
pABAGlu5 hydrolysis
BGGH2GGH1
0
0.04
0.08
0.12
0.16
0 0.05 0.1 0.15 0.2 0.25
1234
12
0
0.04
0.08
0.12
0.16
0 0.05 0.1 0.15 0.2 0.25
Rel
ativ
eco
ncn
PteGlu5 hydrolysis
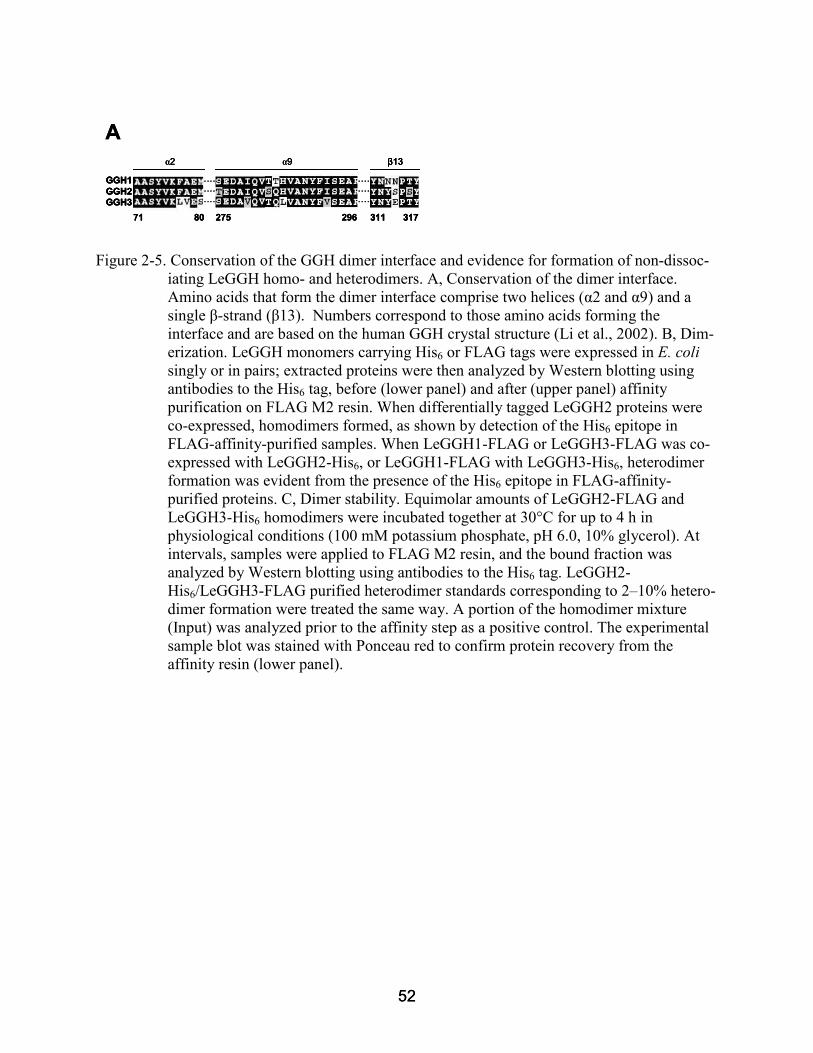
52 52
Figure 2-5. Conservation of the GGH dimer interface and evidence for formation of non-dissoc-iating LeGGH homo- and heterodimers. A, Conservation of the dimer interface. Amino acids that form the dimer interface comprise two helices (α2 and α9) and a single β-strand (β13). Numbers correspond to those amino acids forming the interface and are based on the human GGH crystal structure (Li et al., 2002). B, Dim-erization. LeGGH monomers carrying His6 or FLAG tags were expressed in E. coli singly or in pairs; extracted proteins were then analyzed by Western blotting using antibodies to the His6 tag, before (lower panel) and after (upper panel) affinity purification on FLAG M2 resin. When differentially tagged LeGGH2 proteins were co-expressed, homodimers formed, as shown by detection of the His6 epitope in FLAG-affinity-purified samples. When LeGGH1-FLAG or LeGGH3-FLAG was co-expressed with LeGGH2-His6, or LeGGH1-FLAG with LeGGH3-His6, heterodimer formation was evident from the presence of the His6 epitope in FLAG-affinity-purified proteins. C, Dimer stability. Equimolar amounts of LeGGH2-FLAG and LeGGH3-His6 homodimers were incubated together at 30°C for up to 4 h in physiological conditions (100 mM potassium phosphate, pH 6.0, 10% glycerol). At intervals, samples were applied to FLAG M2 resin, and the bound fraction was analyzed by Western blotting using antibodies to the His6 tag. LeGGH2-His6/LeGGH3-FLAG purified heterodimer standards corresponding to 2–10% hetero-dimer formation were treated the same way. A portion of the homodimer mixture (Input) was analyzed prior to the affinity step as a positive control. The experimental sample blot was stained with Ponceau red to confirm protein recovery from the affinity resin (lower panel).
A
71 80 275 296
GGH1GGH2GGH3
α2 α9
....
....
........
....
....
311 317
β13
A
71 80 275 296
GGH1GGH2GGH3
α2 α9
....
....
........
....
....
311 317
β13
71 80 275 296
GGH1GGH2GGH3
GGH1GGH2GGH3
α2 α9
....
....
....
....
....
....
....
....
........
....
....
....
....
....
....
....
....
311 317
β13
311 317
β13

53 53
Figure 2-5. Continued
B
Extract
Probe: Anti-His6
FLAG Affinity
GGH3-HIS
GGH2-HIS
GGH2-FLAG
GGH3-FLAG
GGH1-FLAG
-
-
-
-
+
-
+
-
-
-
-
-
+
-
-
-
+
+
-
-
-
-
+
-
+
-
-
+
+
-
+
-
-
-
+
+
-
-
-
-
C
Ponceau
Anti-His6
Dimerizationstandards (%)
5 1021 2
Hours
4Input
B
Extract
Probe: Anti-His6
FLAG Affinity
GGH3-HIS
GGH2-HIS
GGH2-FLAG
GGH3-FLAG
GGH1-FLAG
-
-
-
-
+
-
+
-
-
-
-
-
+
-
-
-
+
+
-
-
-
-
+
-
+
-
-
+
+
-
+
-
-
-
+
+
-
-
-
-
GGH3-HIS
GGH2-HIS
GGH2-FLAG
GGH3-FLAG
GGH1-FLAG
GGH3-HIS
GGH2-HIS
GGH2-FLAG
GGH3-FLAG
GGH1-FLAG
-
-
-
-
+
-
+
-
-
-
-
-
+
-
-
-
+
+
-
-
-
-
+
-
+
-
-
+
+
-
+
-
-
-
+
+
-
-
-
-
-
-
-
-
+
-
-
-
-
+
-
+
-
-
-
-
+
-
-
-
-
-
+
-
-
-
-
+
-
-
-
+
+
-
-
-
+
+
-
-
-
-
+
-
+
-
-
+
-
+
-
-
+
+
-
-
-
+
+
-
+
-
-
-
+
+
-
-
-
+
+
-
-
-
-
+
-
-
-
-
C
Ponceau
Anti-His6
Dimerizationstandards (%)
5 1021 2
Hours
4Input
Dimerizationstandards (%)
5 1021 2
Hours
4Input

54 54
Figure 2-6. The impact of heterodimer formation on GGH activity and bond cleavage specificity, and evaluation of folate binding by LeGGH3. A, GGH activity. Doubly His6- and FLAG-tagged homodimers of LeGGH2 (2-2) and heterodimers of LeGGH1 and LeGGH2 (1-2), LeGGH2 and LeGGH3 (2-3), or LeGGH1 and LeGGH3 (1-3) were affinity-purified and tested for total GGH activity. Data are means and SE for three experiments. The purity of the purified proteins was verified by SDS-PAGE and staining with Coomassie Blue (inset). Note that the LeGGH1, LeGGH2, and LeGGH3 proteins are resolved from each other. B, Products formed from PteGlu5 by GGH homo- and heterodimers. Homo- and heterodimers were as above, with the addition of the LeGGH1 homodimer (1-1). C, Effect on GGH activity and cleavage product profile of adding the catalytically inactive LeGGH3 homodimer (0–10 µM) to reaction mixtures containing 1 µM PteGlu5 and 5 ng of LeGGH2 homodimer.
AS
peci
fic a
ctiv
ity (µm
olm
in-1
mg-
1 )
0
2
3
4
5
6
1
2-2 1-2 2-3 1-3
2-2 1-2 2-3 1-353
36
28
GGH2GGH1GGH3
AS
peci
fic a
ctiv
ity (µm
olm
in-1
mg-
1 )
0
2
3
4
5
6
1
2-2 1-2 2-3 1-3
2-2 1-2 2-3 1-353
36
28
GGH2GGH1GGH3
2-2 1-2 2-3 1-353
36
28
GGH2GGH1GGH3
GGH2GGH1GGH3
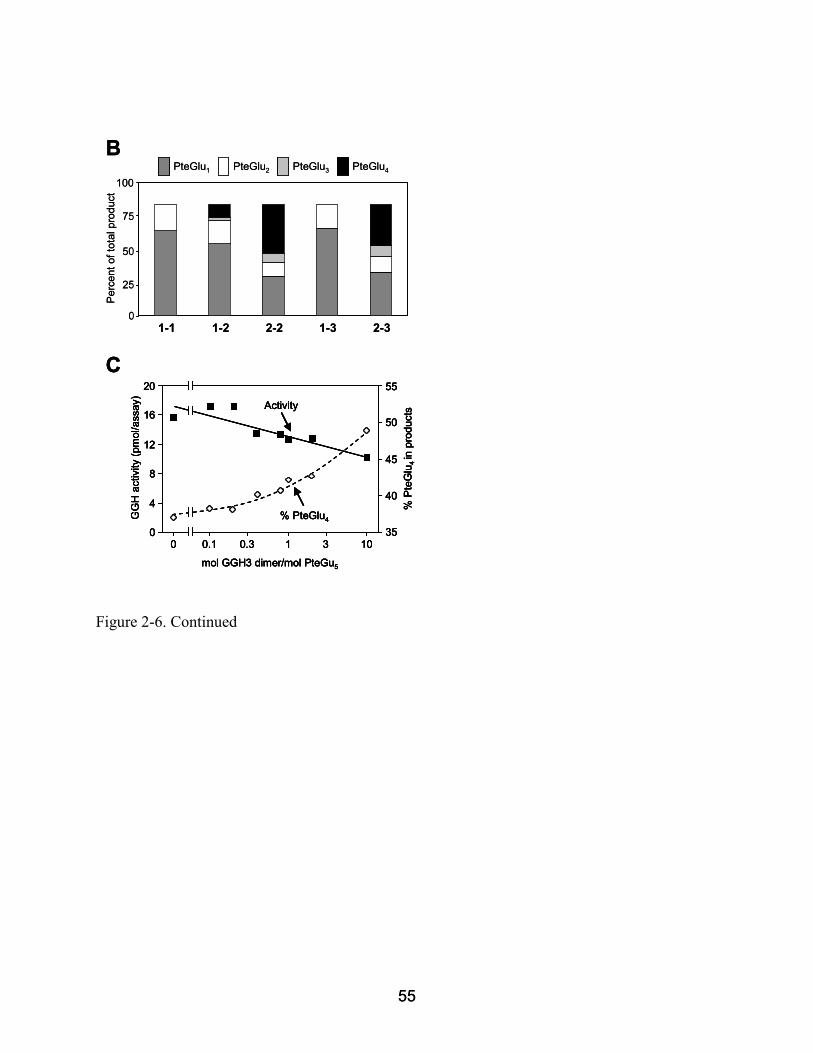
55 55
Figure 2-6. Continued
B
1-1 1-2 1-3 2-32-2
PteGlu1 PteGlu2 PteGlu3 PteGlu4
Per
cent
of t
otal
pro
duct
0
25
50
75
100
GG
H a
ctiv
ity (
pmol
/ass
ay)
Activity
4
8
12
16
20
0 35
40
45
% P
teG
lu4 in
pro
duct
s50
55
% PteGlu4
0 0.1 1 10
mol GGH3 dimer/mol PteGu5
0.3 3
C
B
1-1 1-2 1-3 2-32-2
PteGlu1 PteGlu2 PteGlu3 PteGlu4
Per
cent
of t
otal
pro
duct
0
25
50
75
100
GG
H a
ctiv
ity (
pmol
/ass
ay)
Activity
4
8
12
16
20
0 35
40
45
% P
teG
lu4 in
pro
duct
s50
55
% PteGlu4
0 0.1 1 10
mol GGH3 dimer/mol PteGu5
0.3 3
C
GG
H a
ctiv
ity (
pmol
/ass
ay)
Activity
4
8
12
16
20
0 35
40
45
% P
teG
lu4 in
pro
duct
s50
55
% PteGlu4
0 0.1 1 10
mol GGH3 dimer/mol PteGu5
0.3 3
GG
H a
ctiv
ity (
pmol
/ass
ay)
Activity
4
8
12
16
20
0 35
40
45
% P
teG
lu4 in
pro
duct
s50
55
% PteGlu4
0 0.1 1 10
mol GGH3 dimer/mol PteGu5
0.3 3
C

56 56
Figure 2-7. Bimolecular fluorescence complementation (BiFC) evidence for GGH heterodimer formation in planta. A, Representative fluorescence (i) and brightfield (ii) images of Arabidopsis protoplasts transiently expressing YFP, its N-terminal (YFPN) and C-terminal (YFPC) fragments, or YFPN and YFPC as fusions to LeGGH1, LeGGH2, and/or the signal peptide of LeGGH1 (sp1), as indicated on the right of the images. B, Percentage of the transformed protoplasts above exhibiting BiFC signals from a minimum of three independent experiments. BiFC intensity was visually scored as low, medium, or high (inset) from a minimum of 100 protoplasts viewed for each transformation. Note the lack of high intensity BiFC signals from protoplasts transformed with YFPN/YFPC or GGH1-YFPN /sp1-YFPC combinations.
A(i) (ii)
YFP
GGH2-YFPN
GGH2-YFPC
GGH1-YFPN
GGH2-YFPC
GGH1-YFPN
sp1-YFPC
YFPN
YFPC
A(i) (ii)
YFP
GGH2-YFPN
GGH2-YFPC
GGH1-YFPN
GGH2-YFPC
GGH1-YFPN
sp1-YFPC
YFPN
YFPC
(i) (ii)
YFPYFP
GGH2-YFPN
GGH2-YFPC
GGH2-YFPN
GGH2-YFPC
GGH2-YFPN
GGH2-YFPC
GGH1-YFPN
GGH2-YFPC
GGH1-YFPN
GGH2-YFPC
GGH1-YFPN
GGH2-YFPC
GGH1-YFPN
sp1-YFPC
GGH1-YFPN
sp1-YFPC
GGH1-YFPN
sp1-YFPC
YFPN
YFPC
YFPN
YFPC
YFPN
YFPC

57 57
Figure 2-7. Continued
B
0
10
20
30
40
50
60
Flu
ores
cent
pro
topl
asts
(%
of p
opul
atio
n)
YFP
GGH2-YFP N
GGH2-YFP C
GGH1-YFP N
GGH2-YFP C YFP N
YFP C
GGH1-YFP N
sp1-
YFP C
Low
Med
High
Intensity
B
0
10
20
30
40
50
60
Flu
ores
cent
pro
topl
asts
(%
of p
opul
atio
n)
YFP
GGH2-YFP N
GGH2-YFP C
GGH1-YFP N
GGH2-YFP C YFP N
YFP C
GGH1-YFP N
sp1-
YFP C
Low
Med
High
Intensity
0
10
20
30
40
50
60
Flu
ores
cent
pro
topl
asts
(%
of p
opul
atio
n)
YFP
GGH2-YFP N
GGH2-YFP C
GGH2-YFP N
GGH2-YFP C
GGH2-YFP N
GGH2-YFP C
GGH1-YFP N
GGH2-YFP C
GGH1-YFP N
GGH2-YFP C
GGH1-YFP N
GGH2-YFP C YFP N
YFP CYFP N
YFP CYFP N
YFP C
GGH1-YFP N
sp1-
YFP C
GGH1-YFP N
sp1-
YFP C
Low
Med
High
Intensity
Low
Med
High
LowLow
MedMed
HighHigh
Intensity

58 58
Figure 2-8. Alignment of GGH amino acid sequences. Representative GGH amino acid sequences for eudicots and dicots are illustrated and compared with rat GGH. Identical residues are shaded in black, similar residues are in gray, the predicted signal peptide regions are in blue, and potential N-glycosylation motifs (NXS/TX, where X is any residue except Pro) are in green. Based on human GGH, red arrows indicate catalytically essential residues and the regions that form the dimer interface are underlined with dots. Sequences for tomato (Le), Arabidopsis (At), soybean (Gm), Populus trichocarpa (Pt), rice (Os), barley (Hv), maize (Zm), and rat (Rn) were compiled from EST and genome databases.
AtGGH1 VNGVIFTGGWA--KKYDYFEIVKKIFTKALERNDAGEHFPVYGICLGFELMSIIISQNRDILERFDAEDNASSLQFVDNVNNDGTLFQRFPPELLKKLSTDCLVMQKHKYGITPANFQANPALSSFFEILT AtGGH2 VNGVILTGGWA--KEGLYFEIVKKIFNKVLERNDAGEHFPIYAICLGFELLTMIISQNRDIFEKMDARNSASSLQFVENVNIQGTIFQRFPPELLKKLGTDCLVMQNHRFGISPQSFEGNIALSNFFKIVT AtGGH3 VNGVIFTGGWA--KTGLYYDVVEKIFNKVMEKNDAGEHFPVYAMCLGFEILSMIISQNRDILERFNSVNYASSLQFFKNVNIEATVFQRFPPELLKKLSADCLVMQNHYFGISPDNFQGNPYLSSFFNIVT Pt1 VNGVLFTGGWA--KTGLYFDTAKAIFKEVLARNDAGVHFPVYAICLGFEILTMIISEDNQILETYNATDQASTLQFMENISIEGTVFQRFPPVLLKKLSTDCLVMQNHHYGISPQRFQGNEHLSSFFEILT Pt2 VNGVLFTGGWA--KTGLYFDTVKAIFKEILAKNDAGFHFPVYAICLGFEILTMIISEDNQILETFNGADQASTLQFMNNINIKGTVFRRFPPDLLKRLSTDCLVMQNHRYGISPQRFQESEHLSSFLEILT Gm1 VNGVLFTGGWA--VSGPYLDTLGNIFKKALERNDAGDHFPVIAFNLGGNLVIRIVSEQTDILEPFTASSLPSSLVLWNEANAKGSLFQRFPSDLLTQLKTDCLVLHNHRYAISPRKLQYNTKLSDFFEILA Gm2 VNGVLFTGGWA--KSGLYFETVTKIFKKILEKNDAGDHFPLFATCLGFELITMIISQDNNILEEFSASNQASTLQFVENANIGESVFQRFPPELLGKMSTDCLVMQNHRYGISPGKLLNNPKLSSFFEILT LeGGH1 VNGIIFTGGWA--KDGLYFDVIKGIFQKVLEKNDAGEHFPLLAICLGYELLTMIITNDNNILEEFSAASQASTVQFVENVNIEGTIFGRFPPVLLKKMSIDCLVMQNHHFGISPERFQVNKDLSSFFRVLT LeGGH2 VNGIIFTGGWS--KKGLYFEVVKGIFEKVLEKNDAGEHFPLLAICLGFELLTMIISKDNNILEEFSALHQASTVQFVENIKFEGTVFGRFPPVLLKKMTTHCLVMQNHRFGISPERLQANNDLCGFFKILT LeGGH3 VNGVIFPGGWA--KKGHYFETIKAIFGKVLEKNDAGEHFPLLAINHGFELLMMIVSKDNNILEKFSVSNQATKLHFVETVNIEDTIFGRFPPTLVKKLSKECLVLQSHKYGLSPEKFQANDDLSSFFIMLT Os VNGVLFTGGSV--KSGPYFETIKKVFQYVLDKNDAGIPFPLFAQCLGFELVSMIVSKDNNILESFSATNQASTLQFPNYSSLEGSVFERFDPDLIKKLSTSCLVMQNHKYGISPKTLRENVALSSFFKILT Hv VNGVLFTGGSV--KSGPYFETIKKVFQYVLDKNDAGVPFPLFAQCLGFELVSMIVSKDNNILESFHASDQASTLQFPNYSSLQGSVFERFHPDLIRKLSTSCLVMQNHKYGISPKRLRENDALSSFFKILT Zm LNGVLFTGGSE--KEGVYFDTIKRVFQYVLDKNDAGEPFPLFAQCLGFELVSMIVSKDNNILEAFDAQDQASTLQFPSY-ALEGSVFQRFDTDLIKKVSTNCLVMQNHRYGISPRRYRENDALSSFFKILT RnGGH INGVLLPGGGANLTHSGYSRVAKIFFTKALESFDNGDYFPVWGTCLGLEELSVLVSND-NLLTLTNTSSVKLPLNFTRD-SKQSRMFRNLPEELLNSLASENLTANFHKWSLSVKNFTENEKLKKFFNILT
AtGGH1 VNGVIFTGGWA--KKYDYFEIVKKIFTKALERNDAGEHFPVYGICLGFELMSIIISQNRDILERFDAEDNASSLQFVDNVNNDGTLFQRFPPELLKKLSTDCLVMQKHKYGITPANFQANPALSSFFEILTAtGGH2 VNGVILTGGWA--KEGLYFEIVKKIFNKVLERNDAGEHFPIYAICLGFELLTMIISQNRDIFEKMDARNSASSLQFVENVNIQGTIFQRFPPELLKKLGTDCLVMQNHRFGISPQSFEGNIALSNFFKIVTAtGGH3 VNGVIFTGGWA--KTGLYYDVVEKIFNKVMEKNDAGEHFPVYAMCLGFEILSMIISQNRDILERFNSVNYASSLQFFKNVNIEATVFQRFPPELLKKLSADCLVMQNHYFGISPDNFQGNPYLSSFFNIVTPt1 VNGVLFTGGWA--KTGLYFDTAKAIFKEVLARNDAGVHFPVYAICLGFEILTMIISEDNQILETYNATDQASTLQFMENISIEGTVFQRFPPVLLKKLSTDCLVMQNHHYGISPQRFQGNEHLSSFFEILTPt2 VNGVLFTGGWA--KTGLYFDTVKAIFKEILAKNDAGFHFPVYAICLGFEILTMIISEDNQILETFNGADQASTLQFMNNINIKGTVFRRFPPDLLKRLSTDCLVMQNHRYGISPQRFQESEHLSSFLEILTGm1 VNGVLFTGGWA--VSGPYLDTLGNIFKKALERNDAGDHFPVIAFNLGGNLVIRIVSEQTDILEPFTASSLPSSLVLWNEANAKGSLFQRFPSDLLTQLKTDCLVLHNHRYAISPRKLQYNTKLSDFFEILA Gm2 VNGVLFTGGWA--KSGLYFETVTKIFKKILEKNDAGDHFPLFATCLGFELITMIISQDNNILEEFSASNQASTLQFVENANIGESVFQRFPPELLGKMSTDCLVMQNHRYGISPGKLLNNPKLSSFFEILTLeGGH1 VNGIIFTGGWA--KDGLYFDVIKGIFQKVLEKNDAGEHFPLLAICLGYELLTMIITNDNNILEEFSAASQASTVQFVENVNIEGTIFGRFPPVLLKKMSIDCLVMQNHHFGISPERFQVNKDLSSFFRVLTLeGGH2 VNGIIFTGGWS--KKGLYFEVVKGIFEKVLEKNDAGEHFPLLAICLGFELLTMIISKDNNILEEFSALHQASTVQFVENIKFEGTVFGRFPPVLLKKMTTHCLVMQNHRFGISPERLQANNDLCGFFKILTLeGGH3 VNGVIFPGGWA--KKGHYFETIKAIFGKVLEKNDAGEHFPLLAINHGFELLMMIVSKDNNILEKFSVSNQATKLHFVETVNIEDTIFGRFPPTLVKKLSKECLVLQSHKYGLSPEKFQANDDLSSFFIMLTOs VNGVLFTGGSV--KSGPYFETIKKVFQYVLDKNDAGIPFPLFAQCLGFELVSMIVSKDNNILESFSATNQASTLQFPNYSSLEGSVFERFDPDLIKKLSTSCLVMQNHKYGISPKTLRENVALSSFFKILTHv VNGVLFTGGSV--KSGPYFETIKKVFQYVLDKNDAGVPFPLFAQCLGFELVSMIVSKDNNILESFHASDQASTLQFPNYSSLQGSVFERFHPDLIRKLSTSCLVMQNHKYGISPKRLRENDALSSFFKILTZm LNGVLFTGGSE--KEGVYFDTIKRVFQYVLDKNDAGEPFPLFAQCLGFELVSMIVSKDNNILEAFDAQDQASTLQFPSY-ALEGSVFQRFDTDLIKKVSTNCLVMQNHRYGISPRRYRENDALSSFFKILTRnGGH INGVLLPGGGANLTHSGYSRVAKIFFTKALESFDNGDYFPVWGTCLGLEELSVLVSND-NLLTLTNTSSVKLPLNFTRD-SKQSRMFRNLPEELLNSLASENLTANFHKWSLSVKNFTENEKLKKFFNILT
AtGGH1 TCIDENSKTYVSTVKAKRYPITGFQWHPEKNAFEWGSSA-IPHSEDAIQVTQHAASYLVSEARKSLN-RPESQKVLSNLIYNYKPTYCGYAGRGYDEVYIFTQPRSRF AtGGH2 TCVDDNGKVYVSTVQSTKYPVTGFQWHPEKNAFEWGSSK-IPHSEDAIQVTQHAANHLVSEARKSLN-RPESKKVLSNLIYNYKPTYCGYAGIGYDEVYIFTQQRSLL AtGGH3 TSADKDSKTFVSTIRSKRYPVTAFQWHPEKNAFEWGSSE-IPHSEDAIQVTQHAANYLVSEARKSMN-RPSSEKVLSNLIYNYKPTYSGYKGSGDDEVYIFTPt1 NSADEDNQVYVSTVQARNYPVTAFQWHPEKNAFEWGLSM-IPHSEDAIQVTQHVANFFVSEARKSLN-RPPARKVLDNLIYNYSPTYCGKAGKGYDEVYIFAEPETSNNTRCAVHGNCHGRVKL Pt2 TSTDEDNQVYVSTVQACGYPVTAFQWHPEKNAFEWGLSM-IPHSEDAIQVTQHIANFFVSEARKSLN-RPSSRKVLANLIYNYSPTYCGKAGKGYDEVYIFAEQKAPKYTRCAVHGDCHGHVKL Gm1 TSGDRDGKTFVSTARGRKYPVTVNLWQPEKNAFEWATSLKAPHTEDAIRVTQSTANFFISEARKSTN-TPDAQKVRDSLIYNYKPTFGGTAGKGYDQVYLFE Gm2 TCTDEDDKVYVSTVRSQNYPVTGFQWHPEKNAFEWGSPR-IPHTEDAIQITQYVANFLVSEARKSLN-RPVAQELLDNLIYNYSPTYCGKAGKGYDEVYIFAQA LeGGH1 TSTDENNKVYVSTIQAQRYPIAAFQWHPEKNAFEWGSSR-IPHSEDAIQVTTHVANYFISEARKSSN-KPVAREVLDSLIYNNNPTYGGKAGKGYDEVYLFIPHSSSSSM LeGGH2 TSVDKKNKVYVSSVQAQHYPITALQWHPEKNVFEWGSSQ-IPHTEDAIQVSQHVANYFISEARKSSNNKPATSKVLDNLIYNYSPSYAGKVRGSFEEVYLFTPRPTLSSL LeGGH3 TSTDTRNKVYVSTLKAENYPITALQWHPEKSAFEWGSSA-IPHSEDAVQVTQLVANYFVSEARKSSN-KPEAQKVLDNLIYNYEPTYSGKIGIGYDEVYVFN-SPAMDSV Os TSPDENGEVYVSTVQANKYPITCTQWHPEKAIFEFGKQM-IPHSEEAVQVTQNFANYFISQARKSQN-RPPADKVLDNLIYNYSPTFIGKKSKSFDVVYIFSHv TSPDENGEVYVSTVEAQKYPITCTQWHPEKAIFEWRKPM-IPHSEDAVQVTQHFANYFISQARKSPN-RPPADKVLDNLIYNYIPTFSGKTSKSFELVYLFSZm TSPDENGKVYVSTVQANNYPITCTQWHPEKAIFEWRKPM-IPHSEDAVQVTQHFANHFISQARKSPN-RPPADKVLDNLIYNYSPTFTGKKSKSFEEVYIFSRnGGH VNTDG-KTEFISSMEGYKYPIYAVQWHPEKAPFEWKKLRGISHAPNAVKTSFYLAKFFISEALKNDHHFENELEETESLIYQFCPVYTGNIS-SFQQAYMFN
• • • • • • • • • •
• • • • • • • • • • • • • • • • • • • • • • • • • • •
AtGGH1 MWRYICLPFFLLLWNDIGLAKEASESILLPSESGFDGSR-------SPVCSSPDPNLNYRPVIGILSHPGDG-------ASGRLTNDTSSTYIAASYVKFAEAGGARVIPLIYNEPEEVLFQKLELAtGGH2 MWSYVWLPLVALSLFKDSIIMAKAATILLPSQTGFDISR-------SPVCSAPDPNLNYRPVIGILSHPGDG-------ASGRLSNATDASSIAASYVKLAESGGARVIPLIFNEPEEILFQKLELAtGGH3 MWRFCFFLSLLFFDVSAVKSAESIFLPSQIGVEDSRVFESLSLSPVCSAADPNLNYKPVIGILTHPGEGRWDARLHSLKNYAYATNISYIAASYVKLAETGGARVIPLIYNEPEEILFQKLELPt1 MWNYLWIPFLISLSKELTLARSATATTSPSILLPSQLADD-SPS------APKCPAPDTNLNYRPVIGILSHPGDG-------ASGRLNNATNASYIAASYVKFVESAGARIIPLIYNEPREILFEKLNLPt2 MWSYLWIPFLMSLSKELTLARAATATTSSPSILPPSQLADDDSPS------VPRCSAPDIKLNYRPVIGILSHPGDG-------ASGRLNNETNASYIAASYVKFVESAGARVIPLIYNEPREILFEKLNLGm1 MPNDSVLSLFFFVTLFTCLLSATSHDDHIFLPSQLHDDDSVS---------CTATDPSLNYKPVIGILTHPGDG-------ASGRLSNATGVSYIAASYVKFVESGGARVIPLIYNESPENLNKKLDLGm2 SSDAVWVLFHLAFFSQCLPSAWAHSAILLPGQLARDSPQS---------CPAPDPNLYYKPVIGIVSHPGDG-------ASGRLSNATGASYIAASYVKFVEAAGARVVPLIYTEPPEKLLKKLELLeGGH1 MGNYLSISFFLLLCGITTAESQLFNSYLTLPS-----------SCPAPDPALNYRPIIGIVSHPGDG-------ATGRLSNATNVSYIAASYVKFAEMAGARVIPLIYTEPPQVLNQKLNLLeGGH2 MQMETNFLIPFFTIFIQLMSTHVKPQLIESQLNFP------------SCPATDPALNYRPVIGIVSHPGDG-------ASGRLNNASDVSYIAASYVKFAEMAGARVIPIIYTEPPEIINQKLNLLeGGH3 MSNYFLISLLTLSLFLVVTTIESAELFVPA-----------GCPLPDHNLNYRPVIGIISHPGDG-------DSGRINNSTGVSYIAASYVKLVESGGARVIPLLFDDSPQLLNQKLNLOs MGSPPPHRLLLLLAVAAVLHRSAAAAEGVIRLPRGR--------ACAAPTDPAAYDRPVIGIVSHPGDG-------AGGRVSNGTAASYIAASYVKFVESAGARVVPLIYNEPEERLLEKLSLHv MASLPQHLLPVLLLLALLGPSSAGAPGVIRLPRAG--------ACAAPADPAVYDRPVIGIVTHPGDG-------AAGRINNGTSTSYIGASYVKFVEAGGARVIPLIYNEPDERLLEKLNLZm MDSRCPHLLLLLPLLLLAALLPPPSSGVPEVIWLPTSGG----AGPLSCAPPDPAVYDRPVIGIVSHPGDG-------AGGRISNTTATSYIGASYVKFVEAAGSRVIPLVYNEPEDRLLEKLSLRnGGH MASLGRLLCAWVLLLCGLASPGLSGSYERGSKRPIIGIIMQECYG-----------NMTKLGRFYIAASYVKFIESAGARVVPIRLDLNDAQYETLFRS
AtGGH1 VNGVIFTGGWA--KKYDYFEIVKKIFTKALERNDAGEHFPVYGICLGFELMSIIISQNRDILERFDAEDNASSLQFVDNVNNDGTLFQRFPPELLKKLSTDCLVMQKHKYGITPANFQANPALSSFFEILT AtGGH2 VNGVILTGGWA--KEGLYFEIVKKIFNKVLERNDAGEHFPIYAICLGFELLTMIISQNRDIFEKMDARNSASSLQFVENVNIQGTIFQRFPPELLKKLGTDCLVMQNHRFGISPQSFEGNIALSNFFKIVT AtGGH3 VNGVIFTGGWA--KTGLYYDVVEKIFNKVMEKNDAGEHFPVYAMCLGFEILSMIISQNRDILERFNSVNYASSLQFFKNVNIEATVFQRFPPELLKKLSADCLVMQNHYFGISPDNFQGNPYLSSFFNIVT Pt1 VNGVLFTGGWA--KTGLYFDTAKAIFKEVLARNDAGVHFPVYAICLGFEILTMIISEDNQILETYNATDQASTLQFMENISIEGTVFQRFPPVLLKKLSTDCLVMQNHHYGISPQRFQGNEHLSSFFEILT Pt2 VNGVLFTGGWA--KTGLYFDTVKAIFKEILAKNDAGFHFPVYAICLGFEILTMIISEDNQILETFNGADQASTLQFMNNINIKGTVFRRFPPDLLKRLSTDCLVMQNHRYGISPQRFQESEHLSSFLEILT Gm1 VNGVLFTGGWA--VSGPYLDTLGNIFKKALERNDAGDHFPVIAFNLGGNLVIRIVSEQTDILEPFTASSLPSSLVLWNEANAKGSLFQRFPSDLLTQLKTDCLVLHNHRYAISPRKLQYNTKLSDFFEILA Gm2 VNGVLFTGGWA--KSGLYFETVTKIFKKILEKNDAGDHFPLFATCLGFELITMIISQDNNILEEFSASNQASTLQFVENANIGESVFQRFPPELLGKMSTDCLVMQNHRYGISPGKLLNNPKLSSFFEILT LeGGH1 VNGIIFTGGWA--KDGLYFDVIKGIFQKVLEKNDAGEHFPLLAICLGYELLTMIITNDNNILEEFSAASQASTVQFVENVNIEGTIFGRFPPVLLKKMSIDCLVMQNHHFGISPERFQVNKDLSSFFRVLT LeGGH2 VNGIIFTGGWS--KKGLYFEVVKGIFEKVLEKNDAGEHFPLLAICLGFELLTMIISKDNNILEEFSALHQASTVQFVENIKFEGTVFGRFPPVLLKKMTTHCLVMQNHRFGISPERLQANNDLCGFFKILT LeGGH3 VNGVIFPGGWA--KKGHYFETIKAIFGKVLEKNDAGEHFPLLAINHGFELLMMIVSKDNNILEKFSVSNQATKLHFVETVNIEDTIFGRFPPTLVKKLSKECLVLQSHKYGLSPEKFQANDDLSSFFIMLT Os VNGVLFTGGSV--KSGPYFETIKKVFQYVLDKNDAGIPFPLFAQCLGFELVSMIVSKDNNILESFSATNQASTLQFPNYSSLEGSVFERFDPDLIKKLSTSCLVMQNHKYGISPKTLRENVALSSFFKILT Hv VNGVLFTGGSV--KSGPYFETIKKVFQYVLDKNDAGVPFPLFAQCLGFELVSMIVSKDNNILESFHASDQASTLQFPNYSSLQGSVFERFHPDLIRKLSTSCLVMQNHKYGISPKRLRENDALSSFFKILT Zm LNGVLFTGGSE--KEGVYFDTIKRVFQYVLDKNDAGEPFPLFAQCLGFELVSMIVSKDNNILEAFDAQDQASTLQFPSY-ALEGSVFQRFDTDLIKKVSTNCLVMQNHRYGISPRRYRENDALSSFFKILT RnGGH INGVLLPGGGANLTHSGYSRVAKIFFTKALESFDNGDYFPVWGTCLGLEELSVLVSND-NLLTLTNTSSVKLPLNFTRD-SKQSRMFRNLPEELLNSLASENLTANFHKWSLSVKNFTENEKLKKFFNILT
AtGGH1 VNGVIFTGGWA--KKYDYFEIVKKIFTKALERNDAGEHFPVYGICLGFELMSIIISQNRDILERFDAEDNASSLQFVDNVNNDGTLFQRFPPELLKKLSTDCLVMQKHKYGITPANFQANPALSSFFEILTAtGGH2 VNGVILTGGWA--KEGLYFEIVKKIFNKVLERNDAGEHFPIYAICLGFELLTMIISQNRDIFEKMDARNSASSLQFVENVNIQGTIFQRFPPELLKKLGTDCLVMQNHRFGISPQSFEGNIALSNFFKIVTAtGGH3 VNGVIFTGGWA--KTGLYYDVVEKIFNKVMEKNDAGEHFPVYAMCLGFEILSMIISQNRDILERFNSVNYASSLQFFKNVNIEATVFQRFPPELLKKLSADCLVMQNHYFGISPDNFQGNPYLSSFFNIVTPt1 VNGVLFTGGWA--KTGLYFDTAKAIFKEVLARNDAGVHFPVYAICLGFEILTMIISEDNQILETYNATDQASTLQFMENISIEGTVFQRFPPVLLKKLSTDCLVMQNHHYGISPQRFQGNEHLSSFFEILTPt2 VNGVLFTGGWA--KTGLYFDTVKAIFKEILAKNDAGFHFPVYAICLGFEILTMIISEDNQILETFNGADQASTLQFMNNINIKGTVFRRFPPDLLKRLSTDCLVMQNHRYGISPQRFQESEHLSSFLEILTGm1 VNGVLFTGGWA--VSGPYLDTLGNIFKKALERNDAGDHFPVIAFNLGGNLVIRIVSEQTDILEPFTASSLPSSLVLWNEANAKGSLFQRFPSDLLTQLKTDCLVLHNHRYAISPRKLQYNTKLSDFFEILA Gm2 VNGVLFTGGWA--KSGLYFETVTKIFKKILEKNDAGDHFPLFATCLGFELITMIISQDNNILEEFSASNQASTLQFVENANIGESVFQRFPPELLGKMSTDCLVMQNHRYGISPGKLLNNPKLSSFFEILTLeGGH1 VNGIIFTGGWA--KDGLYFDVIKGIFQKVLEKNDAGEHFPLLAICLGYELLTMIITNDNNILEEFSAASQASTVQFVENVNIEGTIFGRFPPVLLKKMSIDCLVMQNHHFGISPERFQVNKDLSSFFRVLTLeGGH2 VNGIIFTGGWS--KKGLYFEVVKGIFEKVLEKNDAGEHFPLLAICLGFELLTMIISKDNNILEEFSALHQASTVQFVENIKFEGTVFGRFPPVLLKKMTTHCLVMQNHRFGISPERLQANNDLCGFFKILTLeGGH3 VNGVIFPGGWA--KKGHYFETIKAIFGKVLEKNDAGEHFPLLAINHGFELLMMIVSKDNNILEKFSVSNQATKLHFVETVNIEDTIFGRFPPTLVKKLSKECLVLQSHKYGLSPEKFQANDDLSSFFIMLTOs VNGVLFTGGSV--KSGPYFETIKKVFQYVLDKNDAGIPFPLFAQCLGFELVSMIVSKDNNILESFSATNQASTLQFPNYSSLEGSVFERFDPDLIKKLSTSCLVMQNHKYGISPKTLRENVALSSFFKILTHv VNGVLFTGGSV--KSGPYFETIKKVFQYVLDKNDAGVPFPLFAQCLGFELVSMIVSKDNNILESFHASDQASTLQFPNYSSLQGSVFERFHPDLIRKLSTSCLVMQNHKYGISPKRLRENDALSSFFKILTZm LNGVLFTGGSE--KEGVYFDTIKRVFQYVLDKNDAGEPFPLFAQCLGFELVSMIVSKDNNILEAFDAQDQASTLQFPSY-ALEGSVFQRFDTDLIKKVSTNCLVMQNHRYGISPRRYRENDALSSFFKILTRnGGH INGVLLPGGGANLTHSGYSRVAKIFFTKALESFDNGDYFPVWGTCLGLEELSVLVSND-NLLTLTNTSSVKLPLNFTRD-SKQSRMFRNLPEELLNSLASENLTANFHKWSLSVKNFTENEKLKKFFNILT
AtGGH1 TCIDENSKTYVSTVKAKRYPITGFQWHPEKNAFEWGSSA-IPHSEDAIQVTQHAASYLVSEARKSLN-RPESQKVLSNLIYNYKPTYCGYAGRGYDEVYIFTQPRSRF AtGGH2 TCVDDNGKVYVSTVQSTKYPVTGFQWHPEKNAFEWGSSK-IPHSEDAIQVTQHAANHLVSEARKSLN-RPESKKVLSNLIYNYKPTYCGYAGIGYDEVYIFTQQRSLL AtGGH3 TSADKDSKTFVSTIRSKRYPVTAFQWHPEKNAFEWGSSE-IPHSEDAIQVTQHAANYLVSEARKSMN-RPSSEKVLSNLIYNYKPTYSGYKGSGDDEVYIFTPt1 NSADEDNQVYVSTVQARNYPVTAFQWHPEKNAFEWGLSM-IPHSEDAIQVTQHVANFFVSEARKSLN-RPPARKVLDNLIYNYSPTYCGKAGKGYDEVYIFAEPETSNNTRCAVHGNCHGRVKL Pt2 TSTDEDNQVYVSTVQACGYPVTAFQWHPEKNAFEWGLSM-IPHSEDAIQVTQHIANFFVSEARKSLN-RPSSRKVLANLIYNYSPTYCGKAGKGYDEVYIFAEQKAPKYTRCAVHGDCHGHVKL Gm1 TSGDRDGKTFVSTARGRKYPVTVNLWQPEKNAFEWATSLKAPHTEDAIRVTQSTANFFISEARKSTN-TPDAQKVRDSLIYNYKPTFGGTAGKGYDQVYLFE Gm2 TCTDEDDKVYVSTVRSQNYPVTGFQWHPEKNAFEWGSPR-IPHTEDAIQITQYVANFLVSEARKSLN-RPVAQELLDNLIYNYSPTYCGKAGKGYDEVYIFAQA LeGGH1 TSTDENNKVYVSTIQAQRYPIAAFQWHPEKNAFEWGSSR-IPHSEDAIQVTTHVANYFISEARKSSN-KPVAREVLDSLIYNNNPTYGGKAGKGYDEVYLFIPHSSSSSM LeGGH2 TSVDKKNKVYVSSVQAQHYPITALQWHPEKNVFEWGSSQ-IPHTEDAIQVSQHVANYFISEARKSSNNKPATSKVLDNLIYNYSPSYAGKVRGSFEEVYLFTPRPTLSSL LeGGH3 TSTDTRNKVYVSTLKAENYPITALQWHPEKSAFEWGSSA-IPHSEDAVQVTQLVANYFVSEARKSSN-KPEAQKVLDNLIYNYEPTYSGKIGIGYDEVYVFN-SPAMDSV Os TSPDENGEVYVSTVQANKYPITCTQWHPEKAIFEFGKQM-IPHSEEAVQVTQNFANYFISQARKSQN-RPPADKVLDNLIYNYSPTFIGKKSKSFDVVYIFSHv TSPDENGEVYVSTVEAQKYPITCTQWHPEKAIFEWRKPM-IPHSEDAVQVTQHFANYFISQARKSPN-RPPADKVLDNLIYNYIPTFSGKTSKSFELVYLFSZm TSPDENGKVYVSTVQANNYPITCTQWHPEKAIFEWRKPM-IPHSEDAVQVTQHFANHFISQARKSPN-RPPADKVLDNLIYNYSPTFTGKKSKSFEEVYIFSRnGGH VNTDG-KTEFISSMEGYKYPIYAVQWHPEKAPFEWKKLRGISHAPNAVKTSFYLAKFFISEALKNDHHFENELEETESLIYQFCPVYTGNIS-SFQQAYMFN
AtGGH1 TCIDENSKTYVSTVKAKRYPITGFQWHPEKNAFEWGSSA-IPHSEDAIQVTQHAASYLVSEARKSLN-RPESQKVLSNLIYNYKPTYCGYAGRGYDEVYIFTQPRSRF AtGGH2 TCVDDNGKVYVSTVQSTKYPVTGFQWHPEKNAFEWGSSK-IPHSEDAIQVTQHAANHLVSEARKSLN-RPESKKVLSNLIYNYKPTYCGYAGIGYDEVYIFTQQRSLL AtGGH3 TSADKDSKTFVSTIRSKRYPVTAFQWHPEKNAFEWGSSE-IPHSEDAIQVTQHAANYLVSEARKSMN-RPSSEKVLSNLIYNYKPTYSGYKGSGDDEVYIFTPt1 NSADEDNQVYVSTVQARNYPVTAFQWHPEKNAFEWGLSM-IPHSEDAIQVTQHVANFFVSEARKSLN-RPPARKVLDNLIYNYSPTYCGKAGKGYDEVYIFAEPETSNNTRCAVHGNCHGRVKL Pt2 TSTDEDNQVYVSTVQACGYPVTAFQWHPEKNAFEWGLSM-IPHSEDAIQVTQHIANFFVSEARKSLN-RPSSRKVLANLIYNYSPTYCGKAGKGYDEVYIFAEQKAPKYTRCAVHGDCHGHVKL Gm1 TSGDRDGKTFVSTARGRKYPVTVNLWQPEKNAFEWATSLKAPHTEDAIRVTQSTANFFISEARKSTN-TPDAQKVRDSLIYNYKPTFGGTAGKGYDQVYLFE Gm2 TCTDEDDKVYVSTVRSQNYPVTGFQWHPEKNAFEWGSPR-IPHTEDAIQITQYVANFLVSEARKSLN-RPVAQELLDNLIYNYSPTYCGKAGKGYDEVYIFAQA LeGGH1 TSTDENNKVYVSTIQAQRYPIAAFQWHPEKNAFEWGSSR-IPHSEDAIQVTTHVANYFISEARKSSN-KPVAREVLDSLIYNNNPTYGGKAGKGYDEVYLFIPHSSSSSM LeGGH2 TSVDKKNKVYVSSVQAQHYPITALQWHPEKNVFEWGSSQ-IPHTEDAIQVSQHVANYFISEARKSSNNKPATSKVLDNLIYNYSPSYAGKVRGSFEEVYLFTPRPTLSSL LeGGH3 TSTDTRNKVYVSTLKAENYPITALQWHPEKSAFEWGSSA-IPHSEDAVQVTQLVANYFVSEARKSSN-KPEAQKVLDNLIYNYEPTYSGKIGIGYDEVYVFN-SPAMDSV Os TSPDENGEVYVSTVQANKYPITCTQWHPEKAIFEFGKQM-IPHSEEAVQVTQNFANYFISQARKSQN-RPPADKVLDNLIYNYSPTFIGKKSKSFDVVYIFSHv TSPDENGEVYVSTVEAQKYPITCTQWHPEKAIFEWRKPM-IPHSEDAVQVTQHFANYFISQARKSPN-RPPADKVLDNLIYNYIPTFSGKTSKSFELVYLFSZm TSPDENGKVYVSTVQANNYPITCTQWHPEKAIFEWRKPM-IPHSEDAVQVTQHFANHFISQARKSPN-RPPADKVLDNLIYNYSPTFTGKKSKSFEEVYIFSRnGGH VNTDG-KTEFISSMEGYKYPIYAVQWHPEKAPFEWKKLRGISHAPNAVKTSFYLAKFFISEALKNDHHFENELEETESLIYQFCPVYTGNIS-SFQQAYMFN
• • • • • • • • • •• • • • •• • • •• • • • • • • • • •• • • •• • • • •
• • • • • • • • • •• • • • •• • • •• • • • • • • • • •• • • •• • • • • • • • • • • • • • •• • • • •• • • •• • • • • • • • • •• • • •• • • • • • • • • • • •• • • • •• • • •• • • • • • •
AtGGH1 MWRYICLPFFLLLWNDIGLAKEASESILLPSESGFDGSR-------SPVCSSPDPNLNYRPVIGILSHPGDG-------ASGRLTNDTSSTYIAASYVKFAEAGGARVIPLIYNEPEEVLFQKLELAtGGH2 MWSYVWLPLVALSLFKDSIIMAKAATILLPSQTGFDISR-------SPVCSAPDPNLNYRPVIGILSHPGDG-------ASGRLSNATDASSIAASYVKLAESGGARVIPLIFNEPEEILFQKLELAtGGH3 MWRFCFFLSLLFFDVSAVKSAESIFLPSQIGVEDSRVFESLSLSPVCSAADPNLNYKPVIGILTHPGEGRWDARLHSLKNYAYATNISYIAASYVKLAETGGARVIPLIYNEPEEILFQKLELPt1 MWNYLWIPFLISLSKELTLARSATATTSPSILLPSQLADD-SPS------APKCPAPDTNLNYRPVIGILSHPGDG-------ASGRLNNATNASYIAASYVKFVESAGARIIPLIYNEPREILFEKLNLPt2 MWSYLWIPFLMSLSKELTLARAATATTSSPSILPPSQLADDDSPS------VPRCSAPDIKLNYRPVIGILSHPGDG-------ASGRLNNETNASYIAASYVKFVESAGARVIPLIYNEPREILFEKLNLGm1 MPNDSVLSLFFFVTLFTCLLSATSHDDHIFLPSQLHDDDSVS---------CTATDPSLNYKPVIGILTHPGDG-------ASGRLSNATGVSYIAASYVKFVESGGARVIPLIYNESPENLNKKLDLGm2 SSDAVWVLFHLAFFSQCLPSAWAHSAILLPGQLARDSPQS---------CPAPDPNLYYKPVIGIVSHPGDG-------ASGRLSNATGASYIAASYVKFVEAAGARVVPLIYTEPPEKLLKKLELLeGGH1 MGNYLSISFFLLLCGITTAESQLFNSYLTLPS-----------SCPAPDPALNYRPIIGIVSHPGDG-------ATGRLSNATNVSYIAASYVKFAEMAGARVIPLIYTEPPQVLNQKLNLLeGGH2 MQMETNFLIPFFTIFIQLMSTHVKPQLIESQLNFP------------SCPATDPALNYRPVIGIVSHPGDG-------ASGRLNNASDVSYIAASYVKFAEMAGARVIPIIYTEPPEIINQKLNLLeGGH3 MSNYFLISLLTLSLFLVVTTIESAELFVPA-----------GCPLPDHNLNYRPVIGIISHPGDG-------DSGRINNSTGVSYIAASYVKLVESGGARVIPLLFDDSPQLLNQKLNLOs MGSPPPHRLLLLLAVAAVLHRSAAAAEGVIRLPRGR--------ACAAPTDPAAYDRPVIGIVSHPGDG-------AGGRVSNGTAASYIAASYVKFVESAGARVVPLIYNEPEERLLEKLSLHv MASLPQHLLPVLLLLALLGPSSAGAPGVIRLPRAG--------ACAAPADPAVYDRPVIGIVTHPGDG-------AAGRINNGTSTSYIGASYVKFVEAGGARVIPLIYNEPDERLLEKLNLZm MDSRCPHLLLLLPLLLLAALLPPPSSGVPEVIWLPTSGG----AGPLSCAPPDPAVYDRPVIGIVSHPGDG-------AGGRISNTTATSYIGASYVKFVEAAGSRVIPLVYNEPEDRLLEKLSLRnGGH MASLGRLLCAWVLLLCGLASPGLSGSYERGSKRPIIGIIMQECYG-----------NMTKLGRFYIAASYVKFIESAGARVVPIRLDLNDAQYETLFRS

59 59
Figure 2-9. E. coli expression constructs. A, Schematic of the pET28b vector utilized to recombinantly express the tomato GGHs in E. coli. B, Expression constructs for individual GGHs. Sequences corresponding to the predicted mature GGH proteins were N-terminally fused to either the His6 tag (pHGGH1, 2, or 3) or in its place, a sequence encoding the FLAG octapeptide (pFGGH1, 2, or 3). T7, T7 promoter; laco, lac operator; rbs, ribosome binding site; Kan, kanamycin resistance; f1 origin, origin of replication for f1 phage; lacI, lactose repressor; ori, pBR322 origin of replication;. C, Co-expression constructs of individually tagged GGHs. FLAG- and His6-tagged GGHs are co-expressed as a bicistronic message which incorporates an rbs between each tagged GGH sequence. The combinations of co-expressed GGHs are indicated to the right of each illustration.
A
f1 origin
ori
lacI
Kan
Xba I
laco T7
Bgl II
rbs
Nco I
HIS
Nde IBamH I
Xba I
EcoR I
Sac I
Sal I
Hind IIISac I
Not IXho I
MCS
pET28b
A
f1 origin
ori
lacI
Kan
Xba IXba I
lacolaco T7T7
Bgl IIBgl II
rbsrbs
Nco INco I
HIS
Nde INde IBamH I
Xba I
EcoR I
Sac I
Sal I
Hind IIISac I
Not IXho I
MCS
BamH I
Xba I
EcoR I
Sac I
Sal I
Hind IIISac I
Not IXho I BamH I
Xba I
EcoR I
Sac I
Sal I
Hind IIISac I
Not IXho I BamH IBamH I
Xba IXba I
EcoR IEcoR I
Sac ISac I
Sal ISal I
Hind IIIHind IIISac ISac I
Not INot IXho IXho I
MCS
pET28b

60 60
Figure 2-9. Continued
pHGGH1
pHGGH2
pHGGH3
pFGGH1
pFGGH2
pFGGH3
rbs HIS GGH 1
Sal INco I Nde I
rbs HIS GGH 2
Xho INco I Nde I
rbs HIS GGH 3
Xho INco I Nde I
Xba I
Xba I
Xba I
rbs FLAG GGH 1
Sal INco I Nde I
rbs FLAG GGH 2
Xho INco I Nde I
rbs FLAG GGH 3
Xho INco I Nde I
Xba I
Xba I
Xba I
B
rbs FLAG GGH 2
Xba I Nco I Nde I
rbs HIS GGH 2
rbs FLAG GGH 1
Xba I BamH INco I Nde I
rbs HIS GGH 3
Xho INco I Nde I
rbs FLAG GGH 3
Xba I Xho INco I Nde I
rbs HIS GGH 2
Xho INco I Nde I
rbs HIS GGH 2
Xba I
Xba I
Xba I
Xba I Not INco I Nde I
rbs GGH 1
Xba I Nco I Nde I BamH I
FLAG
pFHGGH2-2
pFHGGH1-2
pFHGGH1-3
pFHGGH3-2
Xho INco I Nde IXho IC
pHGGH1
pHGGH2
pHGGH3
pFGGH1
pFGGH2
pFGGH3
rbs HIS GGH 1
Sal INco I Nde I
rbs HIS GGH 2
Xho INco I Nde I
rbs HIS GGH 3
Xho INco I Nde I
Xba I
Xba I
Xba I
rbs FLAG GGH 1
Sal INco I Nde I
rbs FLAG GGH 2
Xho INco I Nde I
rbs FLAG GGH 3
Xho INco I Nde I
Xba I
Xba I
Xba I
BpHGGH1
pHGGH2
pHGGH3
pHGGH1
pHGGH2
pHGGH3
pFGGH1
pFGGH2
pFGGH3
pFGGH1
pFGGH2
pFGGH3
rbsrbs HIS GGH 1
Sal INco I Nde I
rbsrbs HIS GGH 2
Xho INco I Nde I
rbsrbs HIS GGH 3
Xho INco I Nde I
Xba IXba I
Xba IXba I
Xba IXba I
rbsrbs FLAG GGH 1
Sal INco I Nde I
rbsrbs FLAG GGH 2
Xho INco I Nde I
rbsrbs FLAG GGH 3
Xho INco I Nde I
Xba IXba I
Xba IXba I
Xba IXba I
B
rbs FLAG GGH 2
Xba I Nco I Nde I
rbs HIS GGH 2
rbs FLAG GGH 1
Xba I BamH INco I Nde I
rbs HIS GGH 3
Xho INco I Nde I
rbs FLAG GGH 3
Xba I Xho INco I Nde I
rbs HIS GGH 2
Xho INco I Nde I
rbs HIS GGH 2
Xba I
Xba I
Xba I
Xba I Not INco I Nde I
rbs GGH 1
Xba I Nco I Nde I BamH I
FLAG
pFHGGH2-2
pFHGGH1-2
pFHGGH1-3
pFHGGH3-2
Xho INco I Nde IXho ICrbs FLAG GGH 2
Xba I Nco I Nde I
rbs HIS GGH 2
rbs FLAG GGH 1
Xba I BamH INco I Nde I
rbs HIS GGH 3
Xho INco I Nde I
rbs FLAG GGH 3
Xba I Xho INco I Nde I
rbs HIS GGH 2
Xho INco I Nde I
rbs HIS GGH 2
Xba I
Xba I
Xba I
Xba I Not INco I Nde I
rbs GGH 1
Xba I Nco I Nde I BamH I
FLAG
pFHGGH2-2
pFHGGH1-2
pFHGGH1-3
pFHGGH3-2
rbs FLAG GGH 2
Xba I Nco I Nde I
rbsrbs FLAG GGH 2
Xba I Nco I Nde I
rbsrbs HIS GGH 2
rbsrbs FLAG GGH 1
Xba I BamH INco I Nde I
rbsrbs HIS GGH 3
Xho INco I Nde I
rbsrbs FLAG GGH 3
Xba I Xho INco I Nde I
rbsrbs HIS GGH 2
Xho INco I Nde I
rbsrbs HIS GGH 2
Xba IXba I
Xba IXba I
Xba IXba I
Xba I Not INco I Nde I
rbsrbs GGH 1
Xba I Nco I Nde I BamH I
FLAG
pFHGGH2-2
pFHGGH1-2
pFHGGH1-3
pFHGGH3-2
Xho INco I Nde IXho IC

61 61
Figure 2-10. Bimolecular fluorescence complementation constructs. The YFP sequence within the pBS-YFP vector was replaced with either the (i) His6-tagged N-terminal YFP fragment (YFPN), (ii) FLAG-tagged C-terminal YFP fragment (YFPC), (iii) full-length GGH1 fused to YFPN, (iv) full-length GGH2 fused to YFPN, (v) full-length GGH2 fused to YFPC, or (vi) the signal peptide of GGH1 fused to YFPC.
pBS-YFPGenBank Acc No. AY189981
35S Terminator
Translational enhancer
35S Promoter
Ampicillin Resistance
BamHI (2557)
ClaI (684)HindIII (689)
Nco I (1602)
SmaI (2553)
XmaI (2551)
XbaI (2328)
KpnI (658)
SalI (674)
ApaLI (3299)
ApaLI (4545)
EcoRI (701)
EcoRI (1467)
AvaI (668)
AvaI (1462)
AvaI (2551)
Pst I (711)
Pst I (2549)
(iii) pG1NYFP
(vi) pSPG1CYFP
(ii) pFCYFP
(i) pHNYFP
(iv) pG2NYFP
(v) pG2CYFP
GGH 1 HIS YFPN
Nde INco I Xba INco I
Nde I
FLAG YFPC
Xba I
spGGH 1
Nco I Nco I
Nde I
FLAG YFPC
Xba INco I
HIS YFPN
Xba INde INco I
GGH 2 HIS YFPN
Xba INde INco I
Nde I
FLAG YFPC
Xba I
GGH 2
Nco I
pBS-YFPGenBank Acc No. AY189981
35S Terminator
Translational enhancer
35S Promoter
Ampicillin Resistance
BamHI (2557)
ClaI (684)HindIII (689)
Nco I (1602)
SmaI (2553)
XmaI (2551)
XbaI (2328)
KpnI (658)
SalI (674)
ApaLI (3299)
ApaLI (4545)
EcoRI (701)
EcoRI (1467)
AvaI (668)
AvaI (1462)
AvaI (2551)
Pst I (711)
Pst I (2549)
(iii) pG1NYFP
(vi) pSPG1CYFP
(ii) pFCYFP
(i) pHNYFP
(iv) pG2NYFP
(v) pG2CYFP
GGH 1 HIS YFPN
Nde INco I Xba INco I
Nde I
FLAG YFPC
Xba I
spGGH 1
Nco I Nco I
Nde I
FLAG YFPC
Xba INco I
HIS YFPN
Xba INde INco I
GGH 2 HIS YFPN
Xba INde INco I
Nde I
FLAG YFPC
Xba I
GGH 2
Nco I
(iii) pG1NYFP
(vi) pSPG1CYFP
(ii) pFCYFP
(i) pHNYFP
(iv) pG2NYFP
(v) pG2CYFP
GGH 1 HIS YFPN
Nde INco I Xba INco I
Nde I
FLAG YFPC
Xba I
spGGH 1
Nco I Nco I
Nde I
FLAG YFPC
Xba INco I
HIS YFPN
Xba INde INco I
GGH 2 HIS YFPN
Xba INde INco I
Nde I
FLAG YFPC
Xba I
GGH 2
Nco I
GGH 1 HISHIS YFPN
Nde INde INco INco I Xba IXba INco INco I
Nde I
FLAGFLAG YFPC
Xba IXba I
spGGH 1
Nco INco I Nco INco I
Nde I
FLAGFLAG YFPC
Xba IXba INco INco I
HIS YFPN
Xba IXba INde INde INco INco I
GGH 2 HIS YFPN
Xba INde I
GGH 2GGH 2 HIS YFPN
Xba IXba INde INde INco INco I
Nde I
FLAGFLAG YFPC
Xba IXba I
GGH 2GGH 2
Nco I

62
CHAPTER 3 A CENTRAL ROLE FOR GAMMA-GLUTAMYL HYDROLASES IN PLANT FOLATE
METABOLISM
Preface
Cellular folates exist mainly as poly-γ-glutamate derivatives and the polyglutamyl tail is believed
to impact folate efficacy and stability. The tail can be removed by gamma-glutamyl hydrolase
(GGH, EC 3.4.19.9), a vacuolar enzyme whose role in folate homeostasis remains unclear. In
order to probe the function of GGH, we modulated its level of expression and subcellular
location in transgenic Arabidopsis plants and tomato fruit. Three-fold overexpression of GGH in
vacuoles caused extensive deglutamylation of folate polyglutamates and lowered total folate
content in Arabidopsis and tomato. No such effects were seen when GGH was overexpressed to
a similar extent in the cytosol. Disruption of either of the major Arabidopsis GGH genes
(AtGGH1 and AtGGH2) alone did not significantly affect folate status. However, a combination
of T-DNA insertion mutagenesis of one gene plus RNAi-mediated suppression of the other
(which lowered total GGH activity by 99%) increased total folate content by 34%. The excess
folate accumulated as polyglutamate derivatives in the vacuole. Taken together, these results
suggest a model in which (i) folates continuously enter the vacuole as polyglutamates,
accumulate there, are hydrolyzed by GGH, and exit as monoglutamates, and (ii) GGH
consequently has an important influence on polyglutamyl tail length and hence on folate stability
and cellular folate content.
Introduction
Tetrahydrofolate (THF) and its derivatives, collectively termed folates, are indispensable
cofactors in one carbon (C1) metabolism. Folates provide C1 units at various oxidation levels
(methyl, methylene, or formyl) to acceptor molecules during the synthesis of purines,
63
thymidylate, pantothenate, formyl-methionyl tRNA, and methionine in nearly all organisms
(Scott et al., 2000). Moreover, the involvement of folates in the activated methyl cycle renders
the synthesis of certain methylated products such as choline, lignin, and chlorophyll indirectly
dependent upon folates (Hanson and Roje, 2001; Rébeillé et al., 2006).
Plants and microbes synthesize folates de novo whereas animals have a strict dietary
requirement, most of which comes from plant sources. Plant folates are assembled in the
mitochondria from pterin, p-aminobenzoate (pABA), and glutamate precursors (Figure 3-1). In
vivo, the majority of folates are conjugated to a γ-linked polyglutamyl tail of up to eight
glutamate residues. The tail is added, one glutamate at a time, by folylpolyglutamate synthetase
(FPGS, EC 6.3.2.17). In animals and plants, multiple FPGS isoforms exist, each of which is
targeted to a distinct subcellular location (Chen et al. 1996; Ravanel et al. 2001). The
polyglutamyl tail is shortened or removed by gamma-glutamyl hydrolase (GGH, EC 3.4.19.9), a
vacuolar endo- and/or exo-peptidase found in both animals and plants (Wang et al. 1993;
Orsomando et al. 2005). As part of the folate salvage pathway (Orsomando et al. 2006), GGH
also hydrolyzes polyglutamates of the folate breakdown product, pABA polyglutamate.
Polyglutamylation has the potential to directly affect C1 metabolism because the enzymes
that use folates prefer polyglutamates to the monoglutamylated forms. For example, methionine
synthases from a variety of organisms are unable to use monoglutamylated 5-methyl-THF to
regenerate methionine from homocysteine (Whitfield et al. 1970; Cherest et al. 2000; Ravanel et
al. 2004). In addition, the polyglutamyl tail also aids in ‘channeling’ of folates between the active
sites of folate-dependent enzymes, many of which exist as multimeric complexes (Schirch &
Strong 1989). Furthermore, because enzyme-bound polyglutamates are less prone to oxidative
breakdown than non-bound forms, folates are stabilized by polyglutamylation (Suh et al. 2001).

64
Polyglutamylation also increases the anionic nature of folates and impedes the passive diffusion
of folates across biomembranes (Appling 1991). Also, the ability of folate transporters to shuttle
folates across membranes decreases as polyglutamyl tail length increases (Shane & Stokstad
1975). Hence, cellular and organellar polyglutamates are generally retained by cells or within the
organelles in which they reside (Shane 1989).
Animal cells that are deficient in FPGS activity exhibit auxotrophies for the end products
of C1 metabolism, however the impacts of impaired polyglutamylation in plants are unknown.
Also unclear is the functional role of GGH in relation to folate homeostasis. In bacteria,
overexpression of GGH results in extensive deconjugation of polyglutamates and decreased
folate retention, without a major effect on growth rate (Sybesma et al. 2003; Akhtar et al. 2008).
In animal systems, enhanced GGH expression decreases polyglutamate abundance and
intracellular folate content (Li et al. 1993; Rhee et al. 1993; Cole et al. 2001), whereas increased
FPGS activity is associated with higher intracellular folate content (Lowe et al. 1993; Sakamoto
et al. 2008). Both these observations imply a positive relationship between polyglutamate tail
length and intracellular folate levels.
This study exploited the recently characterized GGH systems of tomato and Arabidopsis
(Orsomando et al. 2005; Akhtar et al. 2008) to determine the consequences of altered GGH
activity on folate status. Modulating GGH activity revealed that total cellular folate levels are
influenced by the extent of GGH-mediated hydrolysis of vacuolar polyglutamates.

65
Results
Overexpression of GGH in Arabidopsis and Tomato Fruit
The recently characterized GGH families from Arabidopsis and tomato each contain two
members that hydrolyze folate polyglutamates (Orsomando et al. 2005; Akhtar et al. 2008), but
the contribution that GGH makes to folate metabolism in both plants is unclear. Therefore, we
first enhanced GGH activity in Arabidopsis and tomato fruit by overexpressing AtGGH2 and
LeGGH2, respectively. These proteins exhibit both endo- and exopeptidase activity towards
polyglutamates. Two versions of these GGHs were introduced in planta – the native full-length
(FL) protein containing the predicted signal peptide or a truncated version (TR) missing the
signal peptide region. In Arabidopsis, each GGH was fused to a hexahistidine (His6) epitope
located at the C- and N-terminus of the FL and TR versions of the protein, respectively. The
constitutively active 35S promoter from the figwort mosaic virus was used to drive expression in
Arabidopsis (Richins et al. 1987), while in tomato the E8 promoter was utilized to restrict
expression to the late stages of fruit development (Kneissl & Deikman 1996). Several transgenic
lines were obtained from both Arabidopsis and tomato plants harboring each construct. For each
version, three independent lines exhibiting an approximately three-fold increase in total GGH
activity were selected for further analysis (Fig. 3-2a). Tomato fruit from the LeGGH2-FL lines
and siliques from the AtGGH2-FL lines were consistently smaller with few seeds, while the lines
expressing the truncated version were indistinguishable from wild type.
Targeting of the overexpressed GGHs was checked in Arabidopsis by assaying GGH
activity in vacuoles isolated from wild type leaves and those expressing AtGGH2-FL or
AtGGH2-TR. The truncated protein was predicted to be localized in the cytosol, as is usual for
vacuolar proteins without their targeting peptide (Frigerio et al. 1998). Vacuolar GGH activity
was about four-fold higher for AtGGH2-FL than for the wild type, whereas that for AtGGH2-TR

66
was the same as wild type (Fig. 3-2b). Moreover, when vacuolar protein extracts from both lines
were probed for the His6 epitope, only those from GGH2-FL gave positive signals (Fig. 3-2b,
inset). The full-length native protein was thus sent to the vacuole and the truncated one was not.
Furthermore, since the -fold increase in activity in the AtGGH2-FL vacuoles is similar to that
measured in crude extracts it may be further concluded that native AtGGH2 was sent solely to
vacuoles. Despite reports that removal of signal peptides from vacuolar proteins occasionally
results in their secretion to the apoplast (Matsuoka & Neuhaus 1999), we observed no difference
in GGH activity in protoplasts isolated from the lines overexpressing native or truncated
enzymes, suggesting that the enhanced activity was in both cases intracellular.
Folate Content and Polyglutamylation Status in Plants Over-expressing GGH
To examine the relationship between GGH and folate status, we measured total folate
levels in both Arabidopsis and tomato lines with enhanced GGH activity. The major folate
species in wild type Arabidopsis leaf tissue was 5,10-methenyl-THF, whereas 5-methyl-THF
dominated in tomato fruit. In Arabidopsis leaves and tomato fruit expressing vacuole-targeted,
native GGH, total folate levels dropped by 39 and 46%, respectively (Fig. 3-3a). Overexpression
of the truncated AtGGH2 or LeGGH2 did not significantly alter folate content. The degree of
folate polyglutamylation was severely impaired only in lines expressing native GGH (Fig. 3-3b,
c). The trend toward an increasingly monoglutamylated folate pool was at the expense of the
longer chain folates (six or more glutamates), which were most significantly affected (Fig. 3-3c).
Identification of T-DNA Insertion Mutants of GGH and Expression of the Arabidopsis GGH Family
The consequences of GGH inactivation have never been explored in plants. We therefore
turned to the recently described Arabidopsis GGH system to further investigate this scenario
(Orsomando et al. 2005). The Arabidopsis GGH family is comprised of three genes, AtGGH1,
67
AtGGH2, and AtGGH3, arranged in tandem on chromosome 1. We first used real-time PCR to
probe the expression of each family member in various tissues (Fig. 3-4a). AtGGH1 and
AtGGH2 were expressed in all tissues examined, with AtGGH1 predominating in roots and
AtGGH2 in leaves. Conversely, AtGGH3 was expressed at very low levels in all tissues
suggesting that the corresponding isozyme may not be physiologically relevant. Furthermore,
when recombinantly expressed in E. coli, AtGGH1 and AtGGH2 are enzymatically active
(Orsomando et al. 2005), while AtGGH3 is not (data not shown). Taken together, AtGGH1 and
AtGGH2 are likely to be the sole contributors to Arabidopsis GGH activity.
Based on the premise that only AtGGH1 and AtGGH2 are physiologically relevant, two
independent T-DNA mutant lines of were obtained for AtGGH1 and AtGGH2 (Fig. 3-4b). Wild
type segregants and plants homozygous for the T-DNA insertion were identified by PCR using
primers flanking the insertion site along with a third primer specific for the T-DNA left border
(Fig. 3-4c). The position of the T-DNAs within the exon regions of each corresponding AtGGH
gene was confirmed by sequencing the left border junction. The absence of additional T-DNA
insertions within each line was confirmed by PCR designed to amplify the nptII marker gene
carried by each T-DNA; amplicons were not seen in any wild type segregants but were present in
all the mutants (Fig. 3-4c). The individual GGH mutant alleles were named ggh1-1, ggh1-2,
ggh2-1 and ggh2-2.
GGH Activity and Bond Cleavage Specificity in the GGH Mutants
To probe the effects of T-DNA insertion in AtGGH1 and AtGGH2, total GGH activity
was measured in crude protein extracts from roots and leaves from the mutant lines (Figure 3-
5a). In both ggh1-1 and ggh1-2, total activity was unaltered in leaves and reduced by only ~10%
in roots. Conversely, both ggh2-1 and ggh2-2 showed great reductions in GGH activity in both
leaves and roots, averaging ~90% and ~82% in roots, respectively. Additionally, with primers

68
designed to measure expression of AtGGH1 or AtGGH2, no mRNA signal in either
corresponding GGH mutant plant could be detected by semi-quantitaive RT-PCR (Fig. 3-5a,
inset). These data show clearly that AtGGH2 is the main contributor to total Arabidopsis GGH
activity.
Because AtGGH1 and AtGGH2 exhibit distinct γ-glutamate bond cleavage patterns
(Orsomando et al. 2005), their individual contributions to total GGH activity can be monitored in
toatal protein extracts. Specifically, GGH1 cleaves folate pentaglutamate (PteGlu5) to PteGlu2
and PteGlu3, while GGH2 yields mainly PteGlu1 and a modest amount of PteGlu2. On this basis,
comparison of wild-type tissues revealed that leaves contain almost exclusively GGH2 and roots
both GGH1 and GGH2 isozymes (Fig. 3-5b). Likewise, inspection of the cleavage patterns in
mutant lines showed that AtGGH1 and AtGGH2 mutants exhibited bond cleavage profiles
identical to recombinant AtGGH2 and AtGGH1, respectively (Fig. 3-5b). The reciprocal
consistency of these data also reinforces the probability that the third gene, AtGGH3, encodes a
catalytically inactive GGH isozyme, as reported in other plant species (Akhtar et al. 2008).
RNAi Mediated Knockdown of Residual GGH in the Individual GGH Knockouts
As the single GGH mutants retained substantial GGH activity and the tandem
organization of the Arabidopsis GGH genes precludes generation of double mutants, we pursued
RNAi-mediated downregulation of AtGGH1 and AtGGH2 in the ggh2-1 and ggh1-2 mutant
backgrounds, respectively.
In ggh2-1 mutants targeted for AtGGH1 knockdown (AtGGH1RNAi ggh2-1), three
independent lines were obtained that exhibited 75 to 83% knockdown in AtGGH1 mRNA in
rosette leaves, relative to wild type levels. Among three independent AtGGH2RNAi ggh1-2 lines,
AtGGH2 mRNA levels were reduced on average by 88% (Fig. 3-6a). In these lines with lowered
GGH gene expression, total GGH activity in rosette leaf tissue was measured and compared to

69
wild type (Fig. 3-6b). The average residual GGH activity in the three independent RNAi lines
targeting AtGGH1 and AtGGH2 was 0.008 and 0.02 nmol min-1 mg-1 protein, respectively,
representing 99% and 98% knockdown in activity.
Total leaf folate content in the RNAi lines was measured and compared to wild type and
to the individual mutant lines into which each RNAi construct was introduced. Relative to wild
type plants, there were no significant changes in total folate content in either ggh1-2 or ggh2-1
single mutants (Fig. 6c) even though the latter had only ~10% of wild type activity. However,
both AtGGH1RNAi ggh2-1 and AtGGH2RNAi ggh1-2 lines exhibited significantly higher folate
content (~30%), the increase being due mainly to 5,10-methenyl-THF, the predominant folate
species in rosette leaf tissue (Fig. 3a). The degree of polyglutamylation of this folate was
strikingly enhanced in both RNAi lines, to > 96% (Figure 3-6c).
Folate Content and Polyglutamylation Status in Arabidopsis Leaf Vacuoles
The increase in total folate content observed upon GGH down-regulation coupled with
the decrease in total folate resulting from GGH overexpression in its native vacuolar lcoation
implies a significant role for the vacuole in folate homeostasis. To further examine this, we
measured the vacuolar folate contents in Arabidopsis plants with up- or downregulated GGH
activity.
Intact vacuoles were isolated from leaf protoplasts derived from plants overexpressing
GGH (AtGGH2-FL), from plants with 1% of normal GGH activity (AtGGH1RNAi ggh2-1), and
from wild type controls. The total vacuolar folate contents essentially mirrored those of leaf
extracts from the same plants, i.e. vacuolar folate contents decreased significantly in AtGGH2-
FL plants and increased in AtGGH1RNAi ggh2-1 plants, relative to vacuoles from wild type plants
(Fig. 3-7a.). In lines expressing cytosolic GGH (AtGGH2-TR), no changes in vacuolar folate
content or the degree of polyglutamylation were observed (not shown).

70
The two main folate species in all vacuoles isolated were 10-formyl-DHF, an oxidation
product routinely formed during organelle isolation (Goyer et al. 2005) and 5-methyl-THF,
which is the predominant folate in pea leaf vacuoles (Orsomando et al. 2005). The polyglutamate
distributions of vacuolar 5-CH3-THF in AtGGH2-FL and wild type plants were very similar;
lines with enhanced GGH activity had only a slightly higher proportion of monoglutamates
(67%) compared to wild type (48%). However, vacuoles from AtGGH1RNAi ggh2-1 plants
exhibited >97% of the 5-methyl-THF in its polyglutamylated form (Fig. 3-7b).
Discussion
Little is known about how intracellular folate status is regulated, or about the role of
GGH in this process. The widely held notion that polyglutamylation critically impacts folate
homeostasis is only indirectly supported in animal systems (Suh et al. 2001) and has never been
directly explored in plants. Additionally, the few studies examining the relationship between
GGH activity and folate status have yielded conflicting results (Cole et al. 2003; Sybesma et al.
2003; Sakamoto et al. 2008). This study aimed to clarify these issues. By modulating GGH
activity we establish a correlative relationship between polyglutamate tail length and the quantity
of total cellular folates, and also reinforces the significance of GGH in this relationship.
The GGH systems described in this study supports a model in which vacuolar folate
polyglutamates represent a storage form of this cofactor. Depending on the prevailing cellular
folate demand, polyglutamates are hydrolyzed by GGH, exit the vacuole as monoglutamates and
are subsequently reglutamylated. Because monoglutamates are generally poor substrates and
readily undergo oxidative breakdown (Gregory & Quinlivan 2002), their release from the
vacuole – and by extension GGH activity – presumably require strict control. That this is the
case is attested by the observation that plants with only a three-fold elevation of vacuolar GGH
activity had up to 46% less total folate than wild type controls. Indeed, it has been estimated that

71
the concentration of folate utilizing enzymes is roughly equivalent to the total cellular folate
concentration, implying a very low proportion of free unbound folate monoglutamates (Schirch
& Strong 1989). Therefore, balancing polyglutamyl tail synthesis and removal appears to be
crucial in maintaining adequate folate levels.
The co-occurrence of GGH and folate polyglutamates in the vacuole implies that
vacuolar polyglutamates are protected in some way from attack by resident GGH. There are no
reports of folate binding proteins (FBPs) or potent vacuolar GGH inhibitors in plants, although
FBPs are known to protect folates from tail cleavage and oxidative breakdown in mammals
(Henderson 1990; Scott et al. 2000). On the other hand, polyglutamate tails linked via their α-
COOH groups would be recalcitrant to GGH hydrolysis, and reports of such polyglutamates have
often been overlooked in this context (Ferone et al. 1986; Li et al. 2003). Alternatively, the de
novo synthesis of polyglutamates within the vacuole could account for their presence but neither
FPGS nor the ATP required for tail elongation are present in this compartment. Polyglutamate
synthesis by transpeptidation is a possibility since plants are known to possess vacuolar gamma-
glutamyl transpeptidase activity (Ohkama-Ohtsu et al. 2007). However, such a scenario would
amalgamate the anabolic activity of tail synthesis with the catabolic process of tail cleavage
within the same compartment. It is far more likely that polyglutamates that enter the vacuole are
somehow sequestered away from GGH in either membrane-bound intravacuolar inclusions, such
as those described for anthocyanins (Pecket & Small 1980) or in a subpopulation of vacuoles
devoid of GGH activity that exist within the same tissue where GGH is found (Raichaudhuri et
al. 2009).
That polyglutamylated folates are stored within the vacuole implies the existence of a
tonoplast transport system for polyglutamates. Such a system is unlike the folate carriers so far

72
described in plants, which accept only monoglutamates (Bedhomme et al. 2005; Klaus et al.
2005; Raichaudhuri et al. 2009). An analogous polyglutamate transport system has been
demonstrated in animal lysosomes, although its molecular basis has not been elucidated
(Barrueco & Sirotnak 1991). Where then do the transported polyglutamates originate and how do
they enter the vacuole? The small cytosolic pool of polyglutamates is one source and animal
mitochondria are known to export short chain polyglutamates into this compartment (Lin &
Shane 1994; Kim & Shane 1994). However expression of GGH in the cytosol, at levels that
would in principle hydrolyze this folate pool within seconds were the GGH to have free access to
the polyglutamates (see below), did not significantly change the vacuolar folate content or its
degree of polyglutamylation. An intravesicular transport system that shuttles polyglutamates
between compartments could explain the delivery of polyglutamates to the vacuole.
Alternatively, a hitherto undiscovered vacuolar polyglutamate transporter may exist, though
rigorous screening for such activity has yet to uncover any positive results (Eudes et al. 2009).
Targeting GGH to the cytosol had no effect on growth, development, or cellular folate
status. Considering that the cytosolic pool of folates is relatively small (Orsomando et al. 2005)
and likely protein bound, it is possible that cytosolic GGH simply did not encounter these
folates. If accessible, however, the cytosolic pool of polyglutamates would be hydrolyzed in
seconds. Accordingly, polyglutamylation of cytosolic folates is perhaps dispensable in plants.
Indeed, there is no indication for cytosolic FPGS isoforms in non-Arabidopsis plant genomes or
ESTs (Waller et al. 2009). Also, the majority of plant folate-dependent enzymes in the cytosol
are also represented by mitochondrial or plastidial isoforms, rendering these compartments
autonomous for the synthesis of the end products of C1 metabolism (Neuburger et al. 1996;
Ravanel et al. 2004). The lone exception being methylenetetrahydrofolate reductase (MTHFR)

73
which catalyzes the reduction of 5,10-methylene-THF to 5-methyl-THF exclusively in the
cytosol (Roje et al. 1999). Interestingly, MTHFRs from plants, like their mammalian
counterparts, are able to efficiently use folate monoglutamate substrates (Mathews & Baugh
1980). If cytosolic folate polyglutamylation is indeed expendable, this questions the metabolic
essentiality of plant folate polyglutamylation in general. In animal cells and bacteria, massive
folate deglutamylation via GGH overexpression only marginally affects growth rate (Cole et al.
2003; Sybesma et al. 2003; Akhtar et al. 2005). An intriguing question therefore arises – what
are the consequences of FPGS inactivation in plants?
The results of this study are also relevant to metabolic engineering (‘biofortification’) of
folate content in plants (Beakaert et al. 2008). The strategies used to date have all targeted the
initial steps of the synthesis pathway, and have not sought to exploit the role of
polyglutamylation in folate storage and stability. In fact, engineering efforts in tomato result in
enhanced folate content predominantly in the monoglutamylated forms (Sybesma et al. 2003;
Diaz de la Garza 2007). The question remains whether such gains in folate content are all for
naught, considering the lability of non-glutamylated species and the massive folate breakdown
associated with post-harvest fruits and vegetables (Scott et al., 2000). With folate engineering
strategies in place, the next challenge will be to establish what factors regulate polyglutamate
synthesis and to incorporate the vacuole as a potential polyglutamate storage site in future folate
biofortification efforts.

74
Experimental Procedures
Plant Materials and Growth Conditions
Wild type Arabidopsis thaliana (Col-0 ecotype) seeds were from Lehle Seeds and tomato
(Solanum lycopersicum cv. Micro-Tom) seed were from the Ball seed company. Arabidopsis
and tomato plants were grown in potting soil in a growth chamber at 22-25°C under a 12-h
photoperiod (~80 and 200 µmol m-2 s-1 fluence rate, respectively). Arabidopsis roots were
obtained from liquid cultured plants grown in half-strength MS medium containing 1% sucrose
(Prabhu et al. 1996). Red and red-ripe tomato fruit were defined as breaker plus 3 and 7 days,
respectively.
Identification of Arabidopsis T-DNA mutants
Two GGH1 mutant lines, SALK 018537 and SAIL 258C07, and one GGH2 mutant line,
SALK 145009, were from the Arabidopsis Biological Resource Center (ABRC, Columbus, OH).
The GGH2 mutant T-DNA insertion line GABI-Kat 109A04 was provided by Bernd Weisshaar
(Max-Planck-Institute for Plant Breeding Research, Germany). Wild type or homozygous
mutant segregants were identified by PCR using gene-specific primers flanking the T-DNA
insertion and a T-DNA specific primer. Genomic DNA was extracted according to Edwards et al.
(1991). The insertion site was confirmed by sequencing the PCR amplicon obtained from
screened mutant homozygotes. In each line, PCR targeting the selectable marker gene on the T-
DNA failed to amplify any products in wild type segregants indicating the absence of secondary
T-DNA insertions. Homozygous mutants and wild type segregants were selfed and their progeny
were used for experiments. All primers are listed in Table 1.
Plasmids and Constructs
Standard molecular methods were used to generate over-expression and RNAi constructs,
as summarized below. The pFMV, pHK1001 and pMON10086 vectors were kindly provided by

75
Dr. Harry Klee (UF, Gainesville, Florida) and individual GGH cDNAs were obtained as
previously described (Orsomando et al. 2005; Akhtar et al. 2008). RNAi constructs targeting
AtGGH1 and AtGGH2 were prepared as follows. From GGH1 cDNA, two PCR products
corresponding to bases 532-863 and 532-1068 were amplified by high-fidelity PCR with primers
1AB-5'/1AB-3' and 1AC-5'/1AC-3', respectively. The PCR products were digested with KpnI
and ligated in a sense/antisense orientation which forms the hairpin construct targeting AtGGH1.
Likewise, primers 2AB-5'/2AB-3' and 2AC-5'/2AC-3' were used to PCR-amplify two fragments
from AtGGH2 cDNA (corresponding to bases 232-518 and 232-721, respectively), digested with
KpnI and ligated to form the hairpin construct targeting AtGGH2. Each hairpin was digested
with BamHI/XbaI and ligated into the corresponding sites of pFMV, which places each hairpin
under the control of the constitutively active figwort mosaic virus (FMV) promoter and nopaline
synthase (nos) terminator. To overexpress AtGGH2, the full-length AtGGH2 cDNA
(At1g78680) was amplified using primers AtG2FLF/AtG2FLR, digested with NcoI/XhoI and
ligated into the corresponding sites in pET28b (Novagen), which adds a C-terminal His6 epitope
to the corresponding protein. Using this construct as a template, a C-terminally tagged His6 full-
length AtGGH2 sequence was amplified using HISFLG2F/HISFLG2R, digested with XbaI/KpnI
and ligated to the corresponding sites of pFMV. To overexpress a truncated version of AtGGH2
without the signal peptide, the short version of this cDNA as described by Orsomando et al.
(2005) was used as a template to amplify a N-terminally His6 tagged cDNA with
FMVATG2F/FMVATG2R primers. This amplicon was digested with XbaI/KpnI and ligated to
the corresponding sites of pFMV. The pFMV constructs, containing either RNAi or
overexpression cassettes, were digested with NotI and ligated to the NotI-digested binary vector
pHK1001 and subsequently introduced into Argobacterium tumefaciens (ABI strain) by
76
electroporation. To overexpress LeGGH2 in tomato, the full-length and truncated versions of
LeGGH2 (Akhtar et al. 2008) were amplified using primers FLLEGGH2F/FLLEGGH2R or
TRCLEGGH2F2/FLLEGGH2R, digested with NotI/AscI, and ligated into the corresponding
sites of pMON10086. Each construct was introduced into A. tumefaciens (ABI strain) by
electroporation.
Arabidopsis and Tomato Transformation
Agrobacterium-mediated transformation of wild type or individual Arabidopsis GGH
mutants was performed by the ‘floral-dip’ method (Zhang et al., 2006). Kanamycin resistant
seedlings were recovered from surface sterilized T1 seeds plated on solid Murashige and Skoog
medium containing 1% sucrose and 0.6% agar supplemented with 50 mg l-1 kanamycin. T2
progenies segregating 3:1 (kanamycin resitant : kanamycin sensitive) were identified and
resistant plants were screened for GGH activity (see below). Several independent lines with
enhanced GGH activity were selfed and homozygous T3 plants exhibiting 100% resistance on
selection medium were used for analysis. Agrobacterium-mediated tomato transformation was
performed according to the method of Sun et al. (2006). Transformants were selected and
regenerated on medium supplemented with 100 mg l-1 kanamycin. Plantlets containing the
ProE8:LeGGH2-FL or ProE8:LeGGH2-TR construct were identified by PCR performed on
genomic DNA prepared using primers located in the E8 promoter and within the coding region
of LeGGH2 (see Table 1). Independent primary transformants were transferred to potting soil
and those with T0 fruit exhibiting significantly higher GGH activity were identified and selfed.
Transgenic T1 plants were confirmed by PCR as above, and T1 fruit was used for analysis.

77
GGH Activity Assays
Plant tissues were pulverized in liquid nitrogen and protein was extracted in 100 mM K-
phosphate, pH 6.0, 10% glycerol, 10 mM a-mercaptoethanol, 3% PVPP. After centrifugation
(20,000 × g, 4 °C, 20 min) and desalting of supernatants on PD-10 columns (Amersham
Biosciences) equilibrated in the same buffer without PVPP, protein concentrations were
measured by the method of Bradford (Bradford 1976). GGH assays were performed using 0.1
mM PteGlu5 substrate as previously described (Orsomando et al. 2005). GGH activity was
calculated as the sum of all formed products (from PteGlu1 to PteGlu4), linearly accumulating as
a function of time. The extent of hydrolysis and the relative concentration of each PteGlun were
calculated and plotted according to Orsomando et al. (2005). The slope of the line corresponding
to each product measures the relative extent of its formation, thus indicating the γ-glutamyl bond
specificity of the enzyme.
Quantitative Real-Time RT-PCR
Absolute quantification of individual GGH gene expression during development was
performed on the Applied Biosystems Gene-Amp 5700 PCR system (ABI, Foster City, CA).
Total RNA from Arabidopsis tissues was extracted using the RNeasy Plant Mini Kit (Qiagen),
and treated with DNase (DNA-free™ Kit, Ambion) according to the manufacturer’s instructions.
RT-PCR reactions (25-µl final volumes) included the Taq-Man One-Step RT-PCR Master Mix
reagents (ABI), plus 250 ng total RNA, 300 nM of each primer, and 150-250 nM Taq-Man
probe. Primers and Taq-Man probes were designed using the Applied Biosystems Primer
Express software. Standard curves for each GGH amplicon were constructed according to Goyer
et al. (2004). Plasmid templates were from RZPD (Deutsches Ressourcenzentrum für
Genomforschung GmbH, Berlin, Germany) for GGH1 (clone ID MPIZp2001J243Q, GenBank
CF653065), and from ABRC for both GGH2 (clone IDs 89D12, GenBank AY096428) and

78
GGH3 (clone ID U12630, GenBank BT000554) and in vitro transcription in the presence of [5,6-
3H]UTP was performed using the MAXIscriptTM kit (Ambion), according to the manufacturer’s
instructions. Controls without reverse transcriptase were run in parallel to exclude genomic DNA
contamination. Relative quantification of GGH gene expression in Arabidopsis transgenic plants
was conducted using an Applied Biosystems 7300 Real-time PCR system (ABI). Total RNA
was extracted from 4 week old rosette leaf tissue as above, except DNase treatment was
performed using the RNase-Free DNase Set (Qiagen). RNA samples were reverse transcribed to
cDNA by using the High-Capacity cDNA Reverse Transcription Kit (ABI) with random
hexamers. PCR employed the ABI universal cycling conditions using SYBR GREEN PCR
Master Mix (ABI) in a 25 µl reaction containing 6.25 µl of diluted cDNA (1:20) and a 300 nM
concentration of each primer. The UBI10 gene (At4g05320) served as an internal control and
expression values were calculated according to the 2-∆C′T method (Livak and Schmittgen, 2001).
Semiquantitative RT-PCR was also performed on cDNA prepared as described above under the
following cycling conditions: 95°C for 10 min, 35 cycles of 95 °C for 1 min, 45 °C or 58 °C
(depending on primer pairs for GGH1 or GGH2, respectively) for 1 min, 72 °C for 1 min, then
72 °C for 10 min. All primers are listed in Table 1.
Vacuole Isolation
Arabidopsis rosette leaf vacuoles were isolated as described by Robert et al. (2007), with
the following modifications. Leaf tissue was digested in 30-cm Petri plates containing protoplast
enzyme solution without vacuum infiltration for a period of 3-4 h. Protoplasts were recovered by
passing digested tissue through a 70 µM nylon mesh (Spectrum Laboratories). The vacuolar
marker enzyme, α-mannosidase, was assayed as described (Nok et al. 2000) to assess the relative
enrichment of each vacuole preparation.

79
Folate Analysis
Folates were extracted from leaf tissue (~0.5 g) and red-ripe tomato fruit (~2 g) by
Polytron homogenization in 10-15 mL of 50 mM Na-HEPES, 50 mM CHES, adjusted to pH 7.85
with HCl, containing 2% (w/v) sodium ascorbate, 1 mM CaCl2 and 10 mM β-mercaptoethanol.
Extracts were immediately incubated in a 100˚C water bath for 10 minutes and then centrifuged
(13,000 × g, 15 min). Clarified crude extracts were split in two, and treated plus or minus rat
plasma conjugase to determine total folate or degree of polyglutamylation. Folates were purified
on folate binding columns and analyzed as previously described (Gregory and Toth, 1988). For
vacuolar folate analysis, the folate binding column was scaled down to 1 mL and washing and
elution buffers were reduced proportionately. Folates were quantified by HPLC with
electrochemical detection as previously described (Goyer et al. 2005; Orsomando et al. 2005).
Detector response was calibrated with authentic THF, 5-formyl-THF, 5-methyl-THF, 5,10-
methenyl-THF, and 10-formyl-DHF, obtained from Schirks Laboratories (Jona, Switzerland).
Acknowledgements
We thank Drs. Denise Tieman and Mark Taylor for advice on tomato transformation and construct design, Drs. Valeria Naponelli and Rocío Díaz de la Garza for help with folate analysis, and Drs. Harry Klee and Kevin Folta for critical reading of the manuscript. This project was supported by National Science Foundation grant no. MCB-0443709 and by an endowment from the C.V. Griffin, Sr. Foundation.
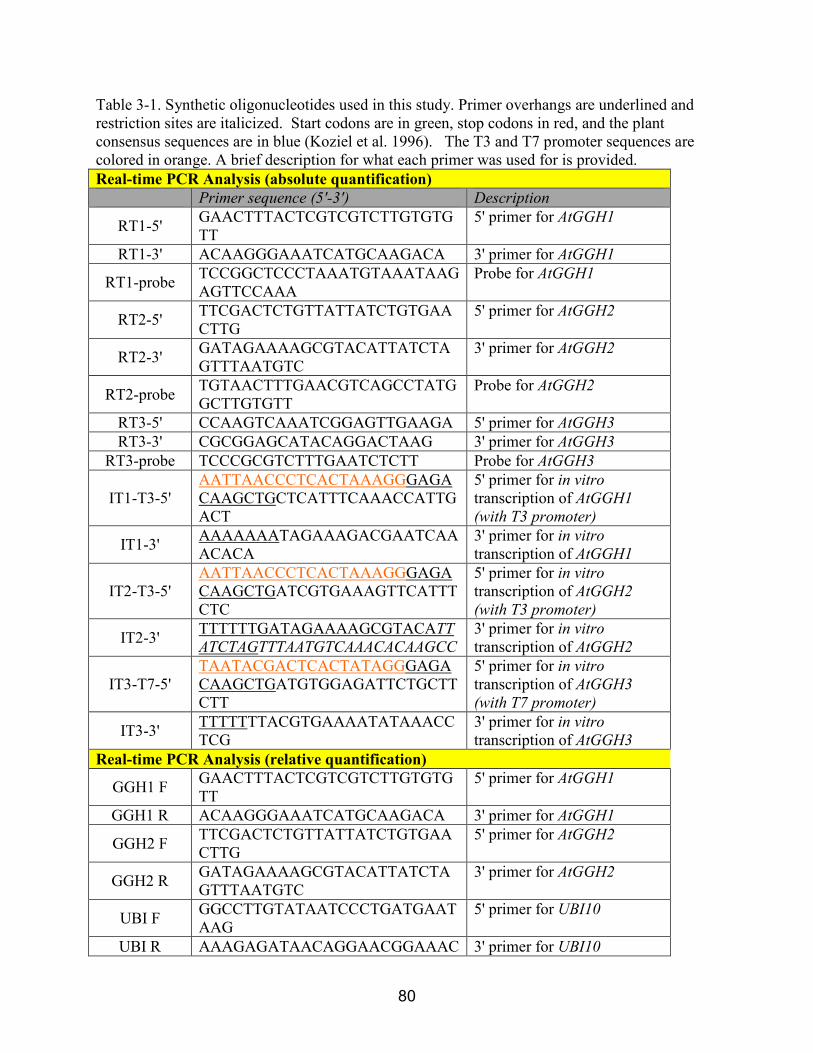
80
Table 3-1. Synthetic oligonucleotides used in this study. Primer overhangs are underlined and restriction sites are italicized. Start codons are in green, stop codons in red, and the plant consensus sequences are in blue (Koziel et al. 1996). The T3 and T7 promoter sequences are colored in orange. A brief description for what each primer was used for is provided. Real-time PCR Analysis (absolute quantification) Primer sequence (5′-3′) Description
RT1-5' GAACTTTACTCGTCGTCTTGTGTGTT
5' primer for AtGGH1
RT1-3' ACAAGGGAAATCATGCAAGACA 3' primer for AtGGH1
RT1-probe TCCGGCTCCCTAAATGTAAATAAGAGTTCCAAA
Probe for AtGGH1
RT2-5' TTCGACTCTGTTATTATCTGTGAACTTG
5' primer for AtGGH2
RT2-3' GATAGAAAAGCGTACATTATCTAGTTTAATGTC
3' primer for AtGGH2
RT2-probe TGTAACTTTGAACGTCAGCCTATGGCTTGTGTT
Probe for AtGGH2
RT3-5' CCAAGTCAAATCGGAGTTGAAGA 5' primer for AtGGH3 RT3-3' CGCGGAGCATACAGGACTAAG 3' primer for AtGGH3
RT3-probe TCCCGCGTCTTTGAATCTCTT Probe for AtGGH3
IT1-T3-5' AATTAACCCTCACTAAAGGGAGACAAGCTGCTCATTTCAAACCATTGACT
5' primer for in vitro transcription of AtGGH1 (with T3 promoter)
IT1-3' AAAAAAATAGAAAGACGAATCAAACACA
3' primer for in vitro transcription of AtGGH1
IT2-T3-5' AATTAACCCTCACTAAAGGGAGACAAGCTGATCGTGAAAGTTCATTTCTC
5' primer for in vitro transcription of AtGGH2 (with T3 promoter)
IT2-3' TTTTTTGATAGAAAAGCGTACATTATCTAGTTTAATGTCAAACACAAGCC
3' primer for in vitro transcription of AtGGH2
IT3-T7-5' TAATACGACTCACTATAGGGAGACAAGCTGATGTGGAGATTCTGCTTCTT
5' primer for in vitro transcription of AtGGH3 (with T7 promoter)
IT3-3' TTTTTTTACGTGAAAATATAAACCTCG
3' primer for in vitro transcription of AtGGH3
Real-time PCR Analysis (relative quantification)
GGH1 F GAACTTTACTCGTCGTCTTGTGTGTT
5' primer for AtGGH1
GGH1 R ACAAGGGAAATCATGCAAGACA 3' primer for AtGGH1
GGH2 F TTCGACTCTGTTATTATCTGTGAACTTG
5' primer for AtGGH2
GGH2 R GATAGAAAAGCGTACATTATCTAGTTTAATGTC
3' primer for AtGGH2
UBI F GGCCTTGTATAATCCCTGATGAATAAG
5' primer for UBI10
UBI R AAAGAGATAACAGGAACGGAAAC 3' primer for UBI10

81
ATAGT Screening of AtGGH T-DNA mutant lines and transgenic tomato plantlets Primer sequence (5′-3′) Description SK018537-
LP GTCAAAGATCCAAAGCAAGGG 5' primer for SALK 018537 line
SK018537-RP AAGCAATCCAATTCTTCAGCG 3' primer for SALK 018537
line SK145009-
LP CAATTGAATGAAAAACAGAACTCG
5' primer for SALK 145009 line
SK145009-RP AAATATCCAGTGACCGGCTTC 3' primer for SALK 145009
line SL258C07-
LP CAACTTGGGCAGAAGAATCAG 5' primer for SAIL 258C07 line
SL258C07-RP GCTACCATGGAGGGAAGGAAG 3' primer for SAIL 258C07
line GK109A04-
LP CGAGAGGATACACAGGAGAGG 5' primer for GABI-Kat 109A04 line
GK109A04-RP AAGCAACTTTTCTTGCCACTTC 3' primer for GABI-Kat
109A04 line
LBa1 TGGTTCACGTAGTGGGCCATCG T-DNA specific primer for SALK lines
LB2 GCTTCCTATTATATCTTCCCAAATTACCAATACA
T-DNA specific primer for SAIL lines
GKLB ATATTGACCATCATACTCATTGC T-DNA specific primer for GABI-Kat lines
NPTII-5' GATGCGCTGCGAATCGGG 5' primer for NPTII selection marker in SALK lines
NPTII-3' TCGGCTATGACTGGGCACAACA 3' primer for NPTII selection marker in SALK lines
BASTA-5' TGCACCATCGTCAACCAC 5' primer for BASTA selection marker in SAIL lines
BASTA-3' TACCGGCAGGCTGAAGTC 3' primer for BASTA selection marker in SAIL lines
SUL-5' ATGGCTTCTATGATATCCTCTTCAGC
5' primer for SUL selection marker in GABI-Kat lines
SUL-3' CTAGGCATGATCTAACCCTCGGTC 3' primer for SUL selection marker in GABI-Kat lines
E8-Promoter CACAGTGCAAAAGACGGGGATCC 5' primer within E8 promoter in transgenic tomato plants
GGH-Screen TGGCAAGAAGAGGAAAATGCTCACC
3' primer within GGH2 coding region in transgenic tomato plants
Semi-quantitative RT-PCR Analysis Primer name Primer sequence (5′-3′) Description

82
GGH1-RT-PCR-5' GGCTTCTGAGTCGATTTTGC 5' primer for AtGGH1
GGH1-RT-PCR-3' AAAGCAGGATTGGCTTGAAA 3' primer for AtGGH1
GGH2-RT-PCR-5' TGTCAAACACAAGCCATAGGC 5' primer for AtGGH2
GGH2-RT-PCR-3' CTCACCACAAAGCTTTGAAGG 3' primer for AtGGH2
Synthesis of Hairpin-loop RNAi Constructs Primer name Primer sequence (5′-3′) Description
1AC-5' AATGCTCTAGAATCATAAGTCAGAACAGAG
To create the long arm of RNAi hairpin targeting AtGGH1
1AC-3' ATCGGTACCTTGTGTGAAAATGTAAACCT
1AB-5' ATGGGATCCATCATAAGTCAGAACAGAGA
To create the short arm of RNAi hairpin targeting AtGGH1
1AB-3' ATAGGTACCAATGCATTTTTCTCAGGATG
2AC-5' TATATTCTAGATCCATTGCGGCTTCGTA
To create the long arm of RNAi hairpin targeting AtGGH2
2AC-3' AGCGGTACCTGACAATTTTAAAGAAATTAGA
2AB-5' AATGGATCCTCCATTGCGGCTTCGTA
To create the short arm of RNAi hairpin targeting AtGGH2
2AB-3' AGCGGTACCTCAAAAATGTCTCTGTTCTG
Synthesis of GGH overexpression constructs Primer name Primer sequence (5′-3′) Description AtG2FLF TATACCATGGATGTGGAGCTACGT
TTGGTTACCG 5' primer for cloning full-length AtGGH2
AtG2FLR TATACTCGAGAAGGGATCGTTGTTGTGTGAAG
3' primer for cloning full-length AtGGH2
HISFLG2F TATATCTAGAATGTGGAGCTACGTTTGGTTACCG
5' primer for cloning full-length C-terminally His6-tagged AtGGH2
HISFLG2R TGATCGGTACCTCAGTGGTGGTGGTGGTGGTGC
3' primer for cloning full-length C-terminally His6-tagged AtGGH2
FMVAtG2FLF
TATATCTAGAATGGGCAGCAGCCATCATCATCATC
5' primer for cloning truncated N-terminally His6-tagged AtGGH2
FMVAtG2F TGATCGGTACCTTAGAGAAGGGAT 3' primer for cloning

83
LR CGTTGTTGTGTGAAG truncated N-terminally His6-tagged AtGGH2
FLLEGGH2F
ATAAGAATGCGGCCGCTAAACAATGCAAATGGAAACCAATTTT
5' primer for cloning full-length LeGGH2
FLLEGGH2R
TTACTGGCGCGCCCTACAGAGAGCTCAAGGT
3' primer for cloning full-length & truncated LeGGH2
TRLEGGH2F2
ATAAGAATGCGGCCGCTAAACAATGAGCTGTCCGGCGACTG
5' primer for cloning truncated LeGGH2

84
Figure 3-1. Structures of tetrahydrofolate polyglutamates and their C1-substituted derivatives. Folates are composed of pterin, pABA and glutamate moieties. A γ-linked polyglutamate tail of up to eight residues is attached to the first glutamate. C1 units at various oxidation levels are attached to the N5 and/or N10 position of the pterin moiety. Folates readily undergo oxidative cleavage of the C9-N10 bond yielding pterin and pABA-glutamate moieties. Arrows indicate the bonds cleaved by GGH.
γγγγ-Glu tailCOOH
CH
COOH
CH2
CH2
NH
CH
COOH
CH2
CH2
COOH
n
C
O
O
C
C
N
NHNR
5
NH
NH2
O
CH2
9
HH
HNR'
10CHN
HCH2
CH2
NH
O
pABAPterin Glu
Folate R R'
THF
5-Methyl-THF
H H
CH3 H
5-Formimino-THF CH=NH
5-Formyl-THF
10-Formyl-THF
CHO H
H CHO
5,10-Methylene-THF
5,10-Methenyl-THF
-CH2-
=CH-
H
γγγγ-Glu tailCOOH
CH
COOH
CH2
CH2
NH
CH
COOH
CH2
CH2
COOH
n
C
O
O
C
C
N
NHNR
5
NH
NH2
O
CH2
9
HH
HNR'
10CHN
HCH2
CH2
NH
O
pABAPterin Glu γγγγ-Glu tailCOOH
CH
COOH
CH2
CH2
NH
CH
COOH
CH2
CH2
COOH
n
C
O
O
C
C
N
NHNR
5
NH
NH2
O
CH2
9
HH
HNR'
10CHN
HCH2
CH2
NH
O
pABAPterin Glu
Folate R R'
THF
5-Methyl-THF
H H
CH3 H
5-Formimino-THF CH=NH
5-Formyl-THF
10-Formyl-THF
CHO H
H CHO
5,10-Methylene-THF
5,10-Methenyl-THF
-CH2-
=CH-
H

85
Figure 3-2. Over-expression of GGH in tomato and Arabidopsis. (a) Over-expression of the tomato and Arabidopsis cDNAs encoding the full-length GGH2 (FL-GGH2) or a truncated version missing the signal peptide (TR-GGH2). Expression in tomato was driven by the fruit-specific E8 promoter and in Arabidopsis by the figwort mosaic virus 35S promoter. Data for three independent lines exhibiting significantly (P <0.05) higher GGH activity in tomato fruit (T2 generation) and Arabidopsis leaf tissue (T3 generation) are presented. GGH activity was assayed in desalted crude tissue extracts from red tomato fruit or 4-week old Arabidopsis rosette leaf tissue. Specific activity values are the means ± SE of three independent experiments from three to five different plants from each independent line. (b) Arabidopsis vacuolar GGH activity in wild type and AtGGH2 over-expressing lines. Vacuoles were purified on a Ficoll gradient and harvested from the 0-4% Ficoll interface as shown. The neutral red dye staining indicates the presence of intact vacuoles. Note the enhanced GGH activity only in vacuoles from AtGGH2-FL lines. Vacuolar protein extracts (8-10 µg) from AtGGH2-TR (TR) and AtGGH2-FL (FL) lines were also subject to immunoblot analysis using antibodies against the His6 epitope (inset). Equal protein loading was verified by staining the immunoblot with Ponceau red. Specific activity values are the means ± SE of three independent vacuole preparations.
A
WT F-2 F-4 F-14 T-4 T-60
0.1
0.2
0.3
0.4
T-11
Wild type FL-GGH2 TR-GGH2
GG
H a
ctiv
ity
(nm
olm
in-1
mg-
1pr
otei
n) Tomato
0
2
4
6
WT 7-8 7-10 7-5 2-4 2-12 2-9
Arabidopsis
GG
H a
ctiv
ity
(nm
olm
in-1
mg-
1pr
otei
n)
A
WT F-2 F-4 F-14 T-4 T-60
0.1
0.2
0.3
0.4
T-11
Wild type FL-GGH2 TR-GGH2Wild type FL-GGH2 TR-GGH2
GG
H a
ctiv
ity
(nm
olm
in-1
mg-
1pr
otei
n)G
GH
act
ivity
(n
mol
min
-1m
g-1
prot
ein) Tomato
0
2
4
6
WT 7-8 7-10 7-5 2-4 2-12 2-9
Arabidopsis
GG
H a
ctiv
ity
(nm
olm
in-1
mg-
1pr
otei
n)G
GH
act
ivity
(n
mol
min
-1m
g-1
prot
ein)

86
Figure 3-2. Continued
BV
acuo
lar
GG
H a
ctiv
ity
(nm
olm
in-1
mg-
1pr
otei
n)
WT
AtGGH2-
TR
AtGGH2-
FL
0%
4%
10%
50 ─37 ─ Anti-His6
TR FL
0
10
20
30
40
50
BV
acuo
lar
GG
H a
ctiv
ity
(nm
olm
in-1
mg-
1pr
otei
n)
WT
AtGGH2-
TR
AtGGH2-
FL
0%
4%
10%
50 ─37 ─ Anti-His6
TR FL
0
10
20
30
40
50
Vac
uola
r G
GH
act
ivity
(n
mol
min
-1m
g-1
prot
ein)
Vac
uola
r G
GH
act
ivity
(n
mol
min
-1m
g-1
prot
ein)
WT
AtGGH2-
TR
AtGGH2-
FL
0%
4%
10%
50 ─37 ─ Anti-His6
TR FL
0
10
20
30
40
50
WT
AtGGH2-
TR
AtGGH2-
FL
0%
4%
10%
50 ─37 ─ Anti-His6
TR FL
0
10
20
30
40
50
0
10
20
30
40
50

87
Figure 3-3. Folate content and polyglutamylation status in plants overexpressing GGH. (a) Total folate content in 4-week old Arabidopsis rosette leaves (upper panel) and red tomato fruit (lower panel) overexpressing the truncated (TR) or full-length (FL) GGH2, relative to wild type controls. The major folate species detected were tetrahydrofolate (THF), 5-methyltetrahydrofolate (5-CH3-THF), 5,10-methenyltetrahydrofolate (5,10=CH-THF), and 5-formyltetrahydrofolate (5-CHO-THF). For analysis, 1-2 g of Arabidopsis or tomato fruit tissue was pooled from three independent transformants; wild type samples were pooled from three individual plants. Data are the mean values ±SE from six independent extractions and asterisks indicate significant difference (P < 0.05, t-test) from wild type. (b) Representative HPLC chromatogram obtained from folate polyglutamate analysis of Arabidopsis leaf or tomato fruit tissue. The detector channel that specifically responds to 5-CH3-THF at 0 mV is illustrated. Numbers above each peak represent the length of the polyglutamate tail associated with this folate species. (c) Folate polyglutamylation in Arabidopsis and tomato fruit. The number of glutamates on the polyglutamyl tail of the major folate species in Arabidopsis (5,10=CH-THF) and tomato (5-CH3-THF) are shown as percentages of the total. Wild type and transgenic tissue was prepared as above. Asterisks indicate significant difference (P < 0.05, t-test) when compared to wild type within each category of tail length.
Det
ecto
r re
spon
se (
µA)
0
0.3
0.2
0.1
WT GGH2-TR GGH2-FL
1
2
3 45
67
8
20 24 28 32Retention time (min)
BA5-CH3-THFTHF 5,10=CH-THF
5-CHO-THF
Fol
ate
(nm
olg-
1fr
esh
wt)
0
0.4
0.8
1.2
1.6
WT
Arabidopsis
*
AtGGH2-
TR
AtGGH2-
FL
LeGGH2-
TR
LeGGH2-
FLW
T
Fol
ate
(nm
olg-
1fr
esh
wt)
0
0.2
0.4
0.6
0.8Tomato
*
C
# glutamates1 2+3 4+5 >6
LeGGH2-FL
Wild typeLeGGH2-TR
0
20
40
60
80
% o
f 5-C
H3-
TH
F
Tomato
**
% o
f 5,1
0=C
H-T
HF
AtGGH2-TRAtGGH2-FL
Wild type
0
20
40
60
80Arabidopsis
*
* **
Det
ecto
r re
spon
se (
µA)
0
0.3
0.2
0.1
WT GGH2-TR GGH2-FL
1
2
3 45
67
8
20 24 28 32Retention time (min)
Det
ecto
r re
spon
se (
µA)
0
0.3
0.2
0.1
WT GGH2-TR GGH2-FL
1
2
3 45
67
8
WT GGH2-TR GGH2-FLWT GGH2-TR GGH2-FL
1
2
3 45
67
8
1
2
3 45
67
8
20 24 28 32Retention time (min)
BA5-CH3-THFTHF 5,10=CH-THF
5-CHO-THF
Fol
ate
(nm
olg-
1fr
esh
wt)
0
0.4
0.8
1.2
1.6
WT
Arabidopsis
*
AtGGH2-
TR
AtGGH2-
FL
5-CH3-THFTHF 5,10=CH-THFTHF 5,10=CH-THF
5-CHO-THF
Fol
ate
(nm
olg-
1fr
esh
wt)
0
0.4
0.8
1.2
1.6
0
0.4
0.8
1.2
1.6
WT
Arabidopsis
*
AtGGH2-
TR
AtGGH2-
FL
LeGGH2-
TR
LeGGH2-
FLW
T
Fol
ate
(nm
olg-
1fr
esh
wt)
0
0.2
0.4
0.6
0.8Tomato
*
LeGGH2-
TR
LeGGH2-
FLW
T
Fol
ate
(nm
olg-
1fr
esh
wt)
0
0.2
0.4
0.6
0.8Tomato
*
C
# glutamates1 2+3 4+5 >6
LeGGH2-FL
Wild typeLeGGH2-TR
0
20
40
60
80
% o
f 5-C
H3-
TH
F
Tomato
**
% o
f 5,1
0=C
H-T
HF
# glutamates1 2+3 4+5 >6
LeGGH2-FL
Wild typeWild typeLeGGH2-TRLeGGH2-TR
0
20
40
60
80
% o
f 5-C
H3-
TH
F
Tomato
**
% o
f 5,1
0=C
H-T
HF
AtGGH2-TRAtGGH2-FL
Wild type
0
20
40
60
80Arabidopsis
*
* **
AtGGH2-TRAtGGH2-FL
Wild typeAtGGH2-TRAtGGH2-FL
Wild type
0
20
40
60
80
0
20
40
60
80Arabidopsis
*
* **

88
Figure 3-4. Expression and identification of T-DNA insertion mutants of the Arabidopsis GGH family. (a) Expression levels of the three Arabidopsis GGH mRNAs. Young leaves were collected from 2-3 week-old plants; stems, siliques, and mature leaves were from 4-6 week-old plants. Roots were from 2-month old liquid cultures. Absolute quantification was performed by real time PCR. (b) Structures of the Arabidopsis GGH1 (At1g78660) and GGH2 (At1g78680) genes and orientation of the T-DNA insertions. Introns, exons, and untranslated regions of the mature mRNAs are represented by lines, and white or black boxes, respectively. T-DNA insertion lines were selected from the SALK, SAIL, and GABI-Kat collections. Arrows represent each T-DNA (right-left border orientation), verified by sequencing of the left border junction, but are not drawn to scale. (c) Analysis of GGH mutant genotypes by PCR. Pooled genomic DNA samples (>20 individuals) from wild-type segregants (WT) and homozygous mutants (KO) were used as PCR templates; primers either flanked the T-DNA insertion plus a left-border T-DNA-specific primer (lanes 1 and 2) or targeted the selectable marker gene (lanes 3 and 4). Sizes of the amplicons (in kb) are indicated on the left.
Roots Siliques Stems YoungLeaves
MatureLeaves
0
1
2
3
4 At1g78660 (GGH1)
At1g78680 (GGH2)At1g78670 (GGH3)
A
B 0.5 kb
SAIL 258C07
SALK 018537
At1g78660
SALK 145009
GABI-Kat 109A04
At1g78680
(ggh1-2)
(ggh1-1)
(ggh2-2)
(ggh2-1)
Cop
ies
x 10
6/
250
ngto
tal R
NA
Roots Siliques Stems YoungLeaves
MatureLeaves
0
1
2
3
4 At1g78660 (GGH1)
At1g78680 (GGH2)At1g78670 (GGH3)
A
B 0.5 kb
SAIL 258C07
SALK 018537
At1g78660
SALK 145009
GABI-Kat 109A04
At1g78680
(ggh1-2)
(ggh1-1)
(ggh2-2)
(ggh2-1)
Cop
ies
x 10
6/
250
ngto
tal R
NA
Cop
ies
x 10
6/
250
ngto
tal R
NA

89
Figure 3-4. Continued
C
800
400
600
800
400
600
ggh1-1
41 2 3
WT KO WT KO
ggh2-2
1 2 3 4
WT KO WT KO
ggh2-1
1 2 3 4
WT KO WT KO
1 2 3 4
WT KO WT KO
ggh1-2C
800
400
600
800
400
600
ggh1-1
41 2 3
WT KO WT KO
ggh2-2
1 2 3 4
WT KO WT KO
ggh2-1
1 2 3 4
WT KO WT KO
1 2 3 4
WT KO WT KO
ggh1-2
800
400
600
800
400
600
ggh1-1
41 2 3
WT KO WT KO
800
400
600
800
400
600
ggh1-1
41 2 3
WT KO WT KO
ggh2-2
1 2 3 4
WT KO WT KO
ggh2-2
1 2 3 4
WT KO WT KO
ggh2-1
1 2 3 4
WT KO WT KO
ggh2-1
1 2 3 4
WT KO WT KO
1 2 3 4
WT KO WT KO
ggh1-2
1 2 3 4
WT KO WT
1 2 3 4
WT KO WT KO
ggh1-2

90
Figure 3-5. GGH activity and bond cleavage specificity in the GGH mutants. (a) Total GGH activity in wild type (WT) and individual GGH mutant lines. Roots were collected from 6- to 8-week old plants grown in liquid medium and leaf tissue was from rosette leaves from 4- to 6-week old plants grown on potting soil. Semiquantitative RT-PCR indicates the presence and absence of functional mRNAs coding for GGH1 and GGH2 in WT and individual mutant (KO) lines, respectively (inset). Data are the means and SE from three independent experiments and asterisks indicate significant difference (P < 0.05, t-test) when compared to wild type. (b) GGH bond cleavage specificity in WT and individual mutant lines. GGH activity was assayed in desalted tissue extracts. Progress curves for the initial stages of hydrolysis are presented as plots of relative concentration of each reaction product formed (PteGlu1, PteGlu2, or PteGlu3) versus the extent of reaction (see materials & methods). Progress curves from wild type leaf and root tissue (upper panel) are compared to those from the individual GGH mutants (middle panel) and those from purified recombinant GGH1 and GGH2 (lower panel). Data for the individual GGH mutants was derived from pooled leaf and root tissue from the two GGH1 mutant lines (ggh1-1 and ggh1-2) or from the two GGH2 mutant lines (ggh2-1 and ggh2-2). Data are representative of results obtained in three independent experiments.
A
GG
H a
ctiv
ity
(nm
olm
in-1
mg-
1pr
otei
n)
ggh1-2 ggh2-1
KOWT
ggh2-2
WT KO
ggh1-1
KOWT KO WT
WT ggh1-1 ggh1-2 ggh2-1 ggh2-2
RootLeaf
0
1
2
10
8——
600 —500 —
* *
*
* *
*
A
GG
H a
ctiv
ity
(nm
olm
in-1
mg-
1pr
otei
n)
ggh1-2 ggh2-1
KOWT
ggh2-2
WT KO
ggh1-1
KOWT KO WT
WT ggh1-1 ggh1-2 ggh2-1 ggh2-2
RootLeaf
0
1
2
10
8——
GG
H a
ctiv
ity
(nm
olm
in-1
mg-
1pr
otei
n)
ggh1-2 ggh2-1
KOWT
ggh2-2
WT KO
ggh1-1
KOWT KO WT
WT ggh1-1 ggh1-2 ggh2-1 ggh2-2
RootLeaf
0
1
2
10
8——
GG
H a
ctiv
ity
(nm
olm
in-1
mg-
1pr
otei
n)
ggh1-2 ggh2-1
KOWT
ggh2-2
WT KO
ggh1-1
KOWT KO WT
WT ggh1-1 ggh1-2 ggh2-1 ggh2-2
RootRootLeafLeaf
0
1
2
10
8————
600 —500 —
* *
*
* *
*
* *
*
* *
*

91
Figure 3-5. Continued
B PteGlu1 PteGlu2 PteGlu3
Extent of reaction
Rel
ativ
e pr
oduc
t con
cent
ratio
n 0 0.2 0.40
0.1
0.2
0.3Wild type root
0.10
0 0.05
0.025
0.05
0.075Wild type leaf
0 0.05 0.10
0.025
0.05
0.075GGH2 KO
0 0.20
0.1
0.2
0.3GGH1 KO
0.4
0 0.2 0.40
0.1
0.2
0.3
RecombinantGGH1
0 0.2 0.40
0.1
0.2
0.3
RecombinantGGH2
B PteGlu1 PteGlu2 PteGlu3PteGlu1PteGlu1 PteGlu2PteGlu2 PteGlu3PteGlu3
Extent of reaction
Rel
ativ
e pr
oduc
t con
cent
ratio
n 0 0.2 0.40
0.1
0.2
0.3Wild type root
0.10
0 0.05
0.025
0.05
0.075Wild type leaf
0 0.2 0.40
0.1
0.2
0.3Wild type root
0 0.2 0.40 0.2 0.40
0.1
0.2
0.3Wild type root
0.10
0 0.05
0.025
0.05
0.075Wild type leaf
00 0.05
0.025
0.05
0.075Wild type leaf
0 0.05 0.10
0.025
0.05
0.075GGH2 KO
0 0.20
0.1
0.2
0.3GGH1 KO
0.4 0 0.05 0.10
0.025
0.05
0.075GGH2 KO
0 0.05 0.10
0.025
0.05
0.075GGH2 KO
0 0.20
0.1
0.2
0.3GGH1 KO
0.40 0.20
0.1
0.2
0.3GGH1 KO
0.4
0 0.2 0.40
0.1
0.2
0.3
RecombinantGGH1
0 0.2 0.40
0.1
0.2
0.3
RecombinantGGH2
0 0.2 0.40
0.1
0.2
0.3
RecombinantGGH1
0 0.2 0.40
0.1
0.2
0.3
RecombinantGGH2

92
Figure 3-6. RNAi mediated knockdown of residual GGH in the individual GGH knockouts and its effect on folate status. (a) Transcript abundance of GGH1 (left) and GGH2 (right) in wild type and three independent RNAi lines targeting GGH1 or GGH2 in the ggh2-1 or ggh1-2 mutant backgrounds, respectively. Relative quantification of GGH gene expression was by real-time PCR. (b) Total GGH activity in the three RNAi lines described above. For comparison, GGH activity in wild type and in the individual GGH mutants is presented (right panel). (c) Folate content and polyglutamyl tail length distribution. Total folate and its major forms in wild type and individual GGH mutants are compared to those in the RNAi lines (left panel); Asterisks indicate significant difference (P < 0.05, t-test) when compared to wild type. Polyglutamyl tail length (right panel) as a percentage of the major folate species (5,10=CH-THF) in the same plants. Data are the means ±SE from six independent extractions from rosette leaf tissue randomly sampled from three different plants for each genetic background. For folate analysis of each RNAi line, leaf tissue from the three independent lines described above were pooled. Asterisks indicate significant difference (P < 0.05, t-test) when compared to wild type within each category of tail length.
A AtGGH2RNAi ggh1-2
0
20
40
60
80
100
120
WT
AtGGH1 AtGGH2
AtGGH1RNAi ggh2-1
Rel
ativ
e ex
pres
sion
(%
WT
)
WT1-38 1-6 1-29 2-37 2-29 2-22
B
GG
H a
ctiv
ity (
nmol
min
-1m
g-1 )
AtGGH1RNAi ggh2-1
AtGGH2RNAi ggh1-2
——
0.08
0
0.04
0.12
2.0
2.2
1-38 1-6 1-29 2-37 2-29 2-22W
T
ggh1
-2
ggh2
-1
A AtGGH2RNAi ggh1-2
0
20
40
60
80
100
120
WTWT
AtGGH1 AtGGH2
AtGGH1RNAi ggh2-1
Rel
ativ
e ex
pres
sion
(%
WT
)
WTWT1-38 1-6 1-29 2-37 2-29 2-221-38 1-6 1-291-38 1-6 1-29 2-37 2-29 2-222-37 2-29 2-22
B
GG
H a
ctiv
ity (
nmol
min
-1m
g-1 )
AtGGH1RNAi ggh2-1
AtGGH2RNAi ggh1-2
————
0.08
0
0.04
0.12
2.0
2.2
1-38 1-6 1-29 2-37 2-29 2-22W
T
ggh1
-2
ggh2
-1

93
Figure 3-6. Continued
C
AtGGH2
RNAi
ggh1
-2
5,10=CH-THF
5-CHO-THF
Fol
ate
(nm
olg-
1fr
esh
wt)
THF
5-CH3-THF
WT
GGH1 KO
GGH2 KO
AtGGH1
RNAi
ggh2
-1
0
0.5
1.0
1.5
2.0
2.5
**
% o
f 5,1
0=C
H-T
HF
0
10
20
30
40
50
60
70
80
# glutamates
AtGGH1RNAi ggh2-1
Wild type
AtGGH2RNAi ggh1-2
1 2+3 4+5 > 6
*
*
*
**
** *
C
AtGGH2
RNAi
ggh1
-2
5,10=CH-THF
5-CHO-THF
Fol
ate
(nm
olg-
1fr
esh
wt)
THF
5-CH3-THF
WT
GGH1 KO
GGH2 KO
AtGGH1
RNAi
ggh2
-1
0
0.5
1.0
1.5
2.0
2.5
**
C
AtGGH2
RNAi
ggh1
-2
AtGGH2
RNAi
ggh1
-2
5,10=CH-THF
5-CHO-THF
5,10=CH-THF5,10=CH-THF
5-CHO-THF5-CHO-THF
Fol
ate
(nm
olg-
1fr
esh
wt)
THF
5-CH3-THF
WT
GGH1 KO
GGH2 KO
AtGGH1
RNAi
ggh2
-1
0
0.5
1.0
1.5
2.0
2.5
**
Fol
ate
(nm
olg-
1fr
esh
wt)
THF
5-CH3-THF
THFTHF
5-CH3-THF
WT
GGH1 KO
GGH2 KO
WT
GGH1 KO
GGH2 KO
AtGGH1
RNAi
ggh2
-1
AtGGH1
RNAi
ggh2
-1
0
0.5
1.0
1.5
2.0
2.5
0
0.5
1.0
1.5
2.0
2.5
**
% o
f 5,1
0=C
H-T
HF
0
10
20
30
40
50
60
70
80
# glutamates
AtGGH1RNAi ggh2-1
Wild type
AtGGH2RNAi ggh1-2
1 2+3 4+5 > 6
*
*
*
**
** *
% o
f 5,1
0=C
H-T
HF
0
10
20
30
40
50
60
70
80
# glutamates
AtGGH1RNAi ggh2-1
Wild type
AtGGH2RNAi ggh1-2
1 2+3 4+5 > 6
*
*
*
**
** *0
10
20
30
40
50
60
70
80
0
10
20
30
40
50
60
70
80
# glutamates
AtGGH1RNAi ggh2-1
Wild type
AtGGH2RNAi ggh1-2
11 2+32+3 4+54+5 > 6
*
*
> 6
*
> 6> 6
*
*
*
**
** *
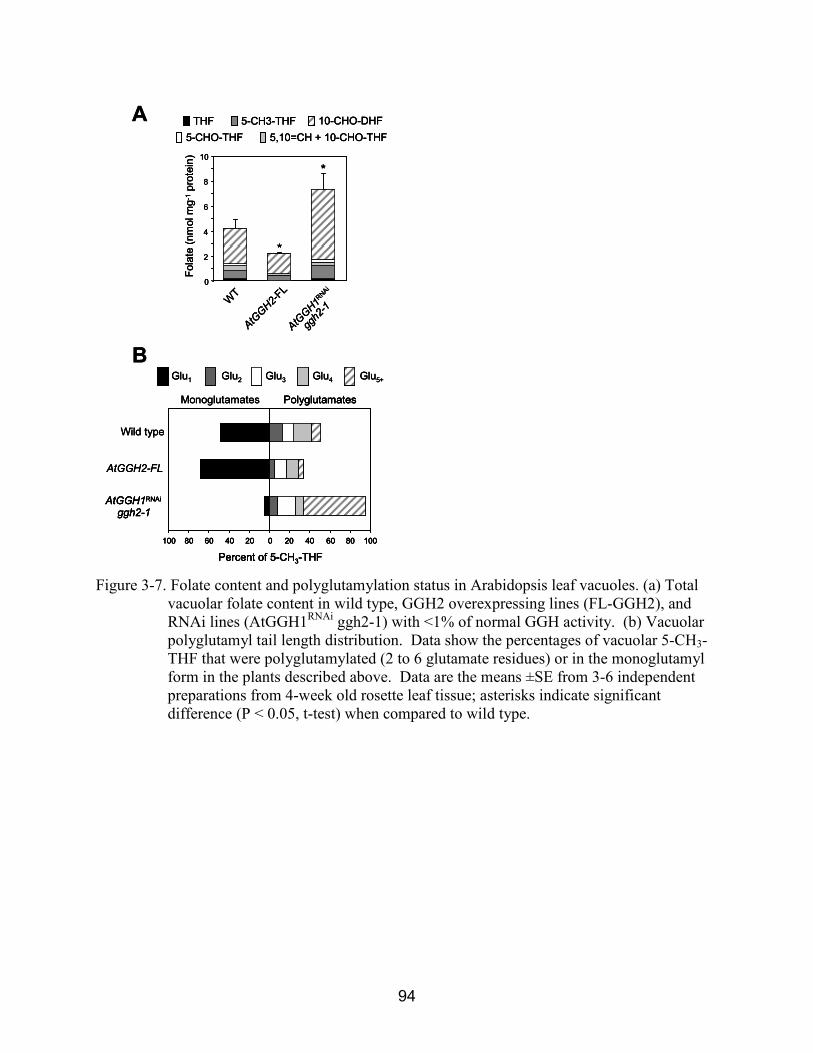
94
Figure 3-7. Folate content and polyglutamylation status in Arabidopsis leaf vacuoles. (a) Total vacuolar folate content in wild type, GGH2 overexpressing lines (FL-GGH2), and RNAi lines (AtGGH1RNAi ggh2-1) with <1% of normal GGH activity. (b) Vacuolar polyglutamyl tail length distribution. Data show the percentages of vacuolar 5-CH3-THF that were polyglutamylated (2 to 6 glutamate residues) or in the monoglutamyl form in the plants described above. Data are the means ±SE from 3-6 independent preparations from 4-week old rosette leaf tissue; asterisks indicate significant difference (P < 0.05, t-test) when compared to wild type.
Monoglutamates
AtGGH2-FL
Wild type
AtGGH1RNAi
ggh2-1
Glu1 Glu2 Glu3 Glu4 Glu5+
Polyglutamates
Percent of 5-CH3-THF
020406080100 20 40 60 80 100
B
A
WT
AtGGH2-
FL0
2
4
6
8
10
Fol
ate
(nm
olm
g-1
prot
ein)
AtGGH1R
NAi
ggh2
-1
THF 5-CH3-THF
5,10=CH + 10-CHO-THF
10-CHO-DHF
5-CHO-THF
*
*
Monoglutamates
AtGGH2-FL
Wild type
AtGGH1RNAi
ggh2-1
Glu1 Glu2 Glu3 Glu4 Glu5+
Polyglutamates
Percent of 5-CH3-THF
020406080100 20 40 60 80 100
Monoglutamates
AtGGH2-FL
Wild type
AtGGH1RNAi
ggh2-1AtGGH1RNAi
ggh2-1
Glu1 Glu2 Glu3 Glu4 Glu5+
Polyglutamates
Percent of 5-CH3-THF
020406080100 20 40 60 80 100
Polyglutamates
Percent of 5-CH3-THF
020406080100 20 40 60 80 100
B
A
WT
AtGGH2-
FL0
2
4
6
8
10
Fol
ate
(nm
olm
g-1
prot
ein)
AtGGH1R
NAi
ggh2
-1
THF 5-CH3-THF
5,10=CH + 10-CHO-THF
10-CHO-DHF
5-CHO-THF
*
*
WT
AtGGH2-
FL0
2
4
6
8
10
Fol
ate
(nm
olm
g-1
prot
ein)
AtGGH1R
NAi
ggh2
-1
THF 5-CH3-THF
5,10=CH + 10-CHO-THF
10-CHO-DHF
5-CHO-THF
*
*

95
CHAPTER 4
CONCLUSIONS
This study set out to characterize gamma-glutamyl hydrolase (GGH) from Solanum
lycopersicum (tomato) and to clarify the role of polyglutamylation in plant folate metabolism. As
part of our ongoing effort in tomato folate engineering, we first targeted the tomato GGH family,
which proved to have three GGH genes (Chapter 2). Two of these gene products exhibited endo-
and/or exopeptidase activity towards folate polyglutamates. Using this information as a guide,
we next disturbed folate polyglutamylation by overexpressing GGH in tomato fruit and in the
model plant, Arabidopsis thaliana (Chapter 3). Overexpression led to substantial
deglutamylation and 39% and 46% declines in folate content in tomato fruit and Arabidopsis
leaves, respectively. Furthermore, RNAi-mediated knockdown of GGH activity by 99% in
Arabidopsis enhanced polyglutamate tail length and increased total folate content by 34%.
Therefore, polyglutamylation critically impacts intracellular folate content which, at least in part,
appears to be determined by the level of GGH activity.
In Chapter 2, we described the characterization of the tomato GGH family which encoded
for two catalytically distinct isoforms (LeGGH1 and LeGGH2) and a third catalytically
incompetent member (LeGGH3). LeGGH1 behaved exclusively as an endopeptidase while
LeGGH2 exhibited an additional exopeptidase activity towards folate polyglutamates. Hence, the
folate cleavage products of LeGGH1 were only processed by the action of LeGGH2 and
therefore the individual GGHs, in a sense, complemented one other. That LeGGH1 and LeGGH2
were expressed in parallel and that their individual bond cleavage patterns were both reflected in
various tomato tissues supports this notion. More generally, this illustrates a paradigm for how

96
paralogous genes that undergo subfunctionalization can provide additional metabolic flexibility
to an organism.
The inactive LeGGH3 isoform was shown to be missing a catalytically essential cysteine
residue and it was therefore surprising that this gene had been retained in tomato throughout
evolution. This may have biological significance as similar mutations are found in GGHs from
soybean and from slime mold (Dictyostelium discoideum). It was first posited that the conserved
dimer interface region amongst GGHs would permit LeGGH3 from participating in dominant
negative-type interactions with catalytically competent partners. However, our data excluded
this possibility as well as the scenario that LeGGH3 is a folate-binding protein that protects
folates from GGH attack or from oxidative degradation. The precise biological significance of
LeGGH3 and similar non-active GGH proteins thus remains unclear.
In Chapter 3, we explored the role of polyglutamylation in plants by modulating GGH
activity in both tomato fruit and Arabidopsis. A remarkably similar trend was observed in both
systems, in which deglutamylation lowered folate content. The relationship between
polyglutamate tail length and intracellular folate status was reinforced by the increase in folate
content seen in Arabidopsis following RNAi-mediated knockdown of GGH actvity.
We observed that a 38% decline in folate content had little impact on vegetative growth
in Arabidopsis, yet severely impaired reproduction. Tomato was similarly affected and exhibited
largely seedless fruit. This consequence of GGH overexpression may have agronomic
importance, given that parthenocarpy is a desirable trait for many commercial fruits (Varoquaux
et al., 2000). In this connection it is noteworthy that folates accumulate upon down-regulation of
GGH in Arabidopsis. Such a maneuver could, in theory, be combined with the already
successful folate engineering strategies that have been employed in plants (Beakaert et al., 2008).

97
In this way, folates enhanced through biofortification could be sequestered as polyglutamylated
derivates in the vacuole.
If the absence of GGH leads to accumulation of folate in the vacuole, then the tonoplast
represents a barrier between the metabolically active folate pool and those that are potential
storage forms of the cofactor. This raises an important question – how do polyglutamates enter
the vacuole in the first place? If polyglutamates traverse the cytosol en route to the vacuole, then
it is hard to reconcile their presence in the vacuoles of plants that overexpress cytosolic GGH
(which would hydrolyze any polyglutamates within seconds). Given the absence of vacuolar
polyglutamate transporters in plants or animals, one must invoke a novel transport mechanism.
An additional question that arises from this work is why does cytosolic expression of
GGH not have detrimental consequences, given the long standing thesis that polyglutamylation
critically impacts the fate of C1 metabolism? Therefore, one must question the role of
polyglutamylation in general. Animal cells and bacteria that overexpress GGH can also
withstand massive folate deglutamylation (Cole et al. 2001; Symbesma et al. 2003; Akhtar et al.
2008) with only mild effects on growth rate. Thus, a key challenge in future plant folate research
will be to examine the consequences of impaired FPGS activity. Such a study, together with this
work, will no doubt shed light onto the metabolic essentiality of plant folate polyglutamylation.

98
LIST OF REFERENCES
Akhtar TA, McQuinn RP, Naponelli V, Gregory JF, 3rd, Giovannoni JJ, Hanson AD (2008)
Tomato gamma-glutamylhydrolases: expression, characterization, and evidence for heterodimer formation. Plant Physiol 148: 775-785
Alexander JP, Ryan TJ, Ballou DP, Coward JK (2008) Gamma-glutamyl hydrolase: kinetic
characterization of isopeptide hydrolysis using fluorogenic substrates. Biochemistry 47: 1228-1239
Appling DR (1991) Compartmentation of folate-mediated one-carbon metabolism in eukaryotes.
Faseb J 5: 2645-2651 Atkinson IJ, Nargang FE, Cossins EA (1998) Folylpolyglutamate synthesis in Neurospora
crassa: primary structure of the folylpolyglutamate synthetase gene and elucidation of the met-6 mutation. Phytochemistry 49: 2221-2232
Barrueco JR, Sirotnak FM (1991) Evidence for the facilitated transport of methotrexate
polyglutamates into lysosomes derived from S180 cells. Basic properties and specificity for polyglutamate chain length. J Biol Chem 266: 11732-11737
Barry CS, McQuinn RP, Thompson AJ, Seymour GB, Grierson D, Giovannoni JJ (2005)
Ethylene insensitivity conferred by the Green-ripe and Never-ripe 2 ripening mutants of tomato. Plant Physiol 138: 267-275
Basset G, Quinlivan EP, Ziemak MJ, Diaz De La Garza R, Fischer M, Schiffmann S, Bacher A,
Gregory JF, 3rd, Hanson AD (2002) Folate synthesis in plants: the first step of the pterin branch is mediated by a unique bimodular GTP cyclohydrolase I. Proc Natl Acad Sci U S A 99: 12489-12494
Basset GJ, Quinlivan EP, Ravanel S, Rebeille F, Nichols BP, Shinozaki K, Seki M, Adams-
Phillips LC, Giovannoni JJ, Gregory JF, 3rd, Hanson AD (2004) Folate synthesis in plants: the p-aminobenzoate branch is initiated by a bifunctional PabA-PabB protein that is targeted to plastids. Proc Natl Acad Sci U S A 101: 1496-1501
Basset GJ, Ravanel S, Quinlivan EP, White R, Giovannoni JJ, Rebeille F, Nichols BP, Shinozaki
K, Seki M, Gregory JF, 3rd, Hanson AD (2004) Folate synthesis in plants: the last step of the p-aminobenzoate branch is catalyzed by a plastidial aminodeoxychorismate lyase. Plant J 40: 453-461
Bedhomme M, Hoffmann M, McCarthy EA, Gambonnet B, Moran RG, Rebeille F, Ravanel S
(2005) Folate metabolism in plants: an Arabidopsis homolog of the mammalian mitochondrial folate transporter mediates folate import into chloroplasts. J Biol Chem 280: 34823-34831

99
Bekaert S, Storozhenko S, Mehrshahi P, Bennett MJ, Lambert W, Gregory JF, 3rd, Schubert K, Hugenholtz J, Van Der Straeten D, Hanson AD (2008) Folate biofortification in food plants. Trends Plant Sci 13: 28-35
Bertino JR (1993) Karnofsky memorial lecture. Ode to methotrexate. J Clin Oncol 11: 5-14 Besson V, Rebeille F, Neuburger M, Douce R, Cossins EA (1993) Effects of tetrahydrofolate
polyglutamates on the kinetic parameters of serine hydroxymethyltransferase and glycine decarboxylase from pea leaf mitochondria. Biochem J 292 (Pt 2): 425-430
Bhandari SD, Gregory JF, 3rd, Renuart DR, Merritt AM (1990) Properties of
pteroylpolyglutamate hydrolase in pancreatic juice of the pig. J Nutr 120: 467-475 Bradford MM (1976) A rapid and sensitive method for the quantitation of microgram quantities
of protein utilizing the principle of protein-dye binding. Anal Biochem 72: 248-254 Carter C, Pan S, Zouhar J, Avila EL, Girke T, Raikhel NV (2004) The vegetative vacuole
proteome of Arabidopsis thaliana reveals predicted and unexpected proteins. Plant Cell 16: 3285-3303
Chandler CJ, Wang TT, Halsted CH (1986) Pteroylpolyglutamate hydrolase from human jejunal
brush borders. Purification and characterization. J Biol Chem 261: 928-933 Chave KJ, Auger IE, Galivan J, Ryan TJ (2000) Molecular modeling and site-directed
mutagenesis define the catalytic motif in human gamma -glutamyl hydrolase. J Biol Chem 275: 40365-40370
Chen L, Qi H, Korenberg J, Garrow TA, Choi YJ, Shane B (1996) Purification and properties of
human cytosolic folylpoly-gamma-glutamate synthetase and organization, localization, and differential splicing of its gene. J Biol Chem 271: 13077-13087
Cherest H, Thomas D, Surdin-Kerjan Y (2000) Polyglutamylation of folate coenzymes is
necessary for methionine biosynthesis and maintenance of intact mitochondrial genome in Saccharomyces cerevisiae. J Biol Chem 275: 14056-14063
Cole PD, Kamen BA, Gorlick R, Banerjee D, Smith AK, Magill E, Bertino JR (2001) Effects of
overexpression of gamma-Glutamyl hydrolase on methotrexate metabolism and resistance. Cancer Res 61: 4599-4604
Cossins EA, Chen L (1997) Folates and one-carbon metabolism in plants and fungi.
Phytochemistry 45: 437-452 Diaz de la Garza RI, Gregory JF, 3rd, Hanson AD (2007) Folate biofortification of tomato fruit.
Proc Natl Acad Sci U S A 104: 4218-4222

100
Edwards K, Johnstone C, Thompson C (1991) A simple and rapid method for the preparation of plant genomic DNA for PCR analysis. Nucleic Acids Res 19: 1349
Eisele LE, Chave KJ, Lehning AC, Ryan TJ (2006) Characterization of Human gamma-glutamyl
hydrolase in solution demonstrates that the enzyme is a non-dissociating homodimer. Biochim Biophys Acta 1764: 1479-1486
Eudes A, Kunji ER, Noiriel A, Klaus SM, Vickers TJ, Beverley SM, Gregory JF, 3rd, Hanson
AD Identification of transport-critical residues in a folate transporter from the folate-biopterin transporter (FBT) family. J Biol Chem 285: 2867-2875
Feinberg AP, Vogelstein B (1983) A technique for radiolabeling DNA restriction endonuclease
fragments to high specific activity. Anal Biochem 132: 6-13 Ferone R, Hanlon MH, Singer SC, Hunt DF (1986) alpha-Carboxyl-linked glutamates in the
folylpolyglutamates of Escherichia coli. J Biol Chem 261: 16356-16362 Galivan J, Ryan TJ, Chave K, Rhee M, Yao R, Yin D (2000) Glutamyl hydrolase.
pharmacological role and enzymatic characterization. Pharmacol Ther 85: 207-215 Goldman P, Levy CC (1967) Carboxypeptidase G: purification and properties. Proc Natl Acad
Sci U S A 58: 1299-1306 Goyer A, Collakova E, Diaz de la Garza R, Quinlivan EP, Williamson J, Gregory JF, 3rd,
Shachar-Hill Y, Hanson AD (2005) 5-Formyltetrahydrofolate is an inhibitory but well tolerated metabolite in Arabidopsis leaves. J Biol Chem 280: 26137-26142
Goyer A, Illarionova V, Roje S, Fischer M, Bacher A, Hanson AD (2004) Folate biosynthesis in
higher plants. cDNA cloning, heterologous expression, and characterization of dihydroneopterin aldolases. Plant Physiol 135: 103-111
Goyer A, Johnson TL, Olsen LJ, Collakova E, Shachar-Hill Y, Rhodes D, Hanson AD (2004)
Characterization and metabolic function of a peroxisomal sarcosine and pipecolate oxidase from Arabidopsis. J Biol Chem 279: 16947-16953
Gregory JF, 3rd, Quinlivan EP (2002) In vivo kinetics of folate metabolism. Annu Rev Nutr 22:
199-220 Gregory JF, 3rd, Toth JP (1988) Chemical synthesis of deuterated folate monoglutamate and in
vivo assessment of urinary excretion of deuterated folates in man. Anal Biochem 170: 94-104
Hanson AD, Roje S (2001) One-Carbon Metabolism In Higher Plants. Annu Rev Plant Physiol
Plant Mol Biol 52: 119-137
101
Helmerhorst E, Stokes GB (1980) Microcentrifuge desalting: a rapid, quantitative method for desalting small amounts of protein. Anal Biochem 104: 130-135
Henderson GB (1990) Folate-binding proteins. Annu Rev Nutr 10: 319-335 Huangpu J, Pak JH, Graham MC, Rickle SA, Graham JS (1996) Purification and molecular
analysis of an extracellular gamma-glutamyl hydrolase present in young tissues of the soybean plant. Biochem Biophys Res Commun 228: 1-6
Iwai K, Ikeda M, Kobashi M (1980) Intracellular distribution, purification, and properties of
dihydrofolate synthetase from pea seedlings. Methods Enzymol 66: 581-585 Jabrin S, Ravanel S, Gambonnet B, Douce R, Rebeille F (2003) One-carbon metabolism in
plants. Regulation of tetrahydrofolate synthesis during germination and seedling development. Plant Physiol 131: 1431-1439
Kim JS, Shane B (1994) Role of folylpolyglutamate synthetase in the metabolism and
cytotoxicity of 5-deazaacyclotetrahydrofolate, an anti-purine drug. J Biol Chem 269: 9714-9720
Klaus SM, Kunji ER, Bozzo GG, Noiriel A, de la Garza RD, Basset GJ, Ravanel S, Rebeille F,
Gregory JF, 3rd, Hanson AD (2005) Higher plant plastids and cyanobacteria have folate carriers related to those of trypanosomatids. J Biol Chem 280: 38457-38463
Klaus SM, Wegkamp A, Sybesma W, Hugenholtz J, Gregory JF, 3rd, Hanson AD (2005) A
nudix enzyme removes pyrophosphate from dihydroneopterin triphosphate in the folate synthesis pathway of bacteria and plants. J Biol Chem 280: 5274-5280
Kneissl ML, Deikman J (1996) The Tomato E8 Gene Influences Ethylene Biosynthesis in Fruit
but Not in Flowers. Plant Physiol 112: 537-547 Li H, Ryan TJ, Chave KJ, Van Roey P (2002) Three-dimensional structure of human gamma -
glutamyl hydrolase. A class I glatamine amidotransferase adapted for a complex substate. J Biol Chem 277: 24522-24529
Li H, Xu H, Graham DE, White RH (2003) Glutathione synthetase homologs encode alpha-L-
glutamate ligases for methanogenic coenzyme F420 and tetrahydrosarcinapterin biosyntheses. Proc Natl Acad Sci U S A 100: 9785-9790
Li WW, Waltham M, Tong W, Schweitzer BI, Bertino JR (1993) Increased activity of gamma-
glutamyl hydrolase in human sarcoma cell lines: a novel mechanism of intrinsic resistance to methotrexate (MTX). Adv Exp Med Biol 338: 635-638
Lin BF, Shane B (1994) Expression of Escherichia coli folylpolyglutamate synthetase in the
Chinese hamster ovary cell mitochondrion. J Biol Chem 269: 9705-9713

102
Loizeau K, De Brouwer V, Gambonnet B, Yu A, Renou JP, Van Der Straeten D, Lambert WE, Rebeille F, Ravanel S (2008) A genome-wide and metabolic analysis determined the adaptive response of Arabidopsis cells to folate depletion induced by methotrexate. Plant Physiol 148: 2083-2095
Lowe KE, Osborne CB, Lin BF, Kim JS, Hsu JC, Shane B (1993) Regulation of folate and one-
carbon metabolism in mammalian cells. II. Effect of folylpoly-gamma-glutamate synthetase substrate specificity and level on folate metabolism and folylpoly-gamma-glutamate specificity of metabolic cycles of one-carbon metabolism. J Biol Chem 268: 21665-21673
Lu YZ, Aiello PD, Matthews RG (1984) Studies on the polyglutamate specificity of thymidylate
synthase from fetal pig liver. Biochemistry 23: 6870-6876 Lucock M (2000) Folic acid: nutritional biochemistry, molecular biology, and role in disease
processes. Mol Genet Metab 71: 121-138 Matherly LH, Goldman DI (2003) Membrane transport of folates. Vitam Horm 66: 403-456 Matthews RG, Baugh CM (1980) Interactions of pig liver methylenetetrahydrofolate reductase
with methylenetetrahydropteroylpolyglutamate substrates and with dihydropteroylpolyglutamate inhibitors. Biochemistry 19: 2040-2045
McCullough JL, Chabner BA, Bertino JR (1971) Purification and properties of carboxypeptidase
G 1. J Biol Chem 246: 7207-7213 McGuire JJ, Bertino JR (1981) Enzymatic synthesis and function of folylpolyglutamates. Mol
Cell Biochem 38 Spec No: 19-48 Mouillon JM, Ravanel S, Douce R, Rebeille F (2002) Folate synthesis in higher-plant
mitochondria: coupling between the dihydropterin pyrophosphokinase and the dihydropteroate synthase activities. Biochem J 363: 313-319
Naponelli V, Hanson AD, Gregory JF, 3rd (2007) Improved methods for the preparation of
[3H]folate polyglutamates: biosynthesis with Lactobacillus casei and enzymatic synthesis with Escherichia coli folylpolyglutamate synthetase. Anal Biochem 371: 127-134
Neuburger M, Rebeille F, Jourdain A, Nakamura S, Douce R (1996) Mitochondria are a major
site for folate and thymidylate synthesis in plants. J Biol Chem 271: 9466-9472 Noiriel A, Naponelli V, Gregory JF, 3rd, Hanson AD (2007) Pterin and folate salvage. Plants and
Escherichia coli lack capacity to reduce oxidized pterins. Plant Physiol 143: 1101-1109 Nok AJ, Shuaibu MN, Kanbara H, Yanagi T (2000) Purification and partial characterization of
alpha-mannosidase from Trypanosoma rangeli. Parasitol Res 86: 923-928

103
Ohkama-Ohtsu N, Zhao P, Xiang C, Oliver DJ (2007) Glutathione conjugates in the vacuole are degraded by gamma-glutamyl transpeptidase GGT3 in Arabidopsis. Plant J 49: 878-888
Orsomando G, Bozzo GG, de la Garza RD, Basset GJ, Quinlivan EP, Naponelli V, Rebeille F,
Ravanel S, Gregory JF, 3rd, Hanson AD (2006) Evidence for folate-salvage reactions in plants. Plant J 46: 426-435
Orsomando G, de la Garza RD, Green BJ, Peng M, Rea PA, Ryan TJ, Gregory JF, 3rd, Hanson
AD (2005) Plant gamma-glutamyl hydrolases and folate polyglutamates: characterization, compartmentation, and co-occurrence in vacuoles. J Biol Chem 280: 28877-28884
Osborne CB, Lowe KE, Shane B (1993) Regulation of folate and one-carbon metabolism in
mammalian cells. I. Folate metabolism in Chinese hamster ovary cells expressing Escherichia coli or human folylpoly-gamma-glutamate synthetase activity. J Biol Chem 268: 21657-21664
Paul AL, Sehnke PC, Ferl RJ (2005) Isoform-specific subcellular localization among 14-3-3
proteins in Arabidopsis seems to be driven by client interactions. Mol Biol Cell 16: 1735-1743
Prabhu V, Chatson KB, Abrams GD, King J (1996) 13C nuclear magnetic resonance detection of
interactions of serine hydroxymethyltransferase with C1-tetrahydrofolate synthase and glycine decarboxylase complex activities in Arabidopsis. Plant Physiol 112: 207-216
Raichaudhuri A, Peng M, Naponelli V, Chen S, Sanchez-Fernandez R, Gu H, Gregory JF, 3rd,
Hanson AD, Rea PA (2009) Plant Vacuolar ATP-binding Cassette Transporters That Translocate Folates and Antifolates in Vitro and Contribute to Antifolate Tolerance in Vivo. J Biol Chem 284: 8449-8460
Ravanel S, Block MA, Rippert P, Jabrin S, Curien G, Rebeille F, Douce R (2004) Methionine
metabolism in plants: chloroplasts are autonomous for de novo methionine synthesis and can import S-adenosylmethionine from the cytosol. J Biol Chem 279: 22548-22557
Ravanel S, Cherest H, Jabrin S, Grunwald D, Surdin-Kerjan Y, Douce R, Rebeille F (2001)
Tetrahydrofolate biosynthesis in plants: molecular and functional characterization of dihydrofolate synthetase and three isoforms of folylpolyglutamate synthetase in Arabidopsis thaliana. Proc Natl Acad Sci U S A 98: 15360-15365
Rebeille F, Macherel D, Mouillon JM, Garin J, Douce R (1997) Folate biosynthesis in higher
plants: purification and molecular cloning of a bifunctional 6-hydroxymethyl-7,8-dihydropterin pyrophosphokinase/7,8-dihydropteroate synthase localized in mitochondria. Embo J 16: 947-957
Rhee MS, Wang Y, Nair MG, Galivan J (1993) Acquisition of resistance to antifolates caused by
enhanced gamma-glutamyl hydrolase activity. Cancer Res 53: 2227-2230

104
Richins RD, Scholthof HB, Shepherd RJ (1987) Sequence of figwort mosaic virus DNA (caulimovirus group). Nucleic Acids Res 15: 8451-8466
Robert S, Zouhar J, Carter C, Raikhel N (2007) Isolation of intact vacuoles from Arabidopsis
rosette leaf-derived protoplasts. Nat Protoc 2: 259-262 Rohlman CE, Matthews RG (1990) Role of purine biosynthetic intermediates in response to
folate stress in Escherichia coli. J Bacteriol 172: 7200-7210 Roje S, Wang H, McNeil SD, Raymond RK, Appling DR, Shachar-Hill Y, Bohnert HJ, Hanson
AD (1999) Isolation, characterization, and functional expression of cDNAs encoding NADH-dependent methylenetetrahydrofolate reductase from higher plants. J Biol Chem 274: 36089-36096
Sakamoto E, Tsukioka S, Oie S, Kobunai T, Tsujimoto H, Sakamoto K, Okayama Y, Sugimoto
Y, Oka T, Fukushima M, Oka T (2008) Folylpolyglutamate synthase and gamma-glutamyl hydrolase regulate leucovorin-enhanced 5-fluorouracil anticancer activity. Biochem Biophys Res Commun 365: 801-807
Schirch V, Strong WB (1989) Interaction of folylpolyglutamates with enzymes in one-carbon
metabolism. Arch Biochem Biophys 269: 371-380 Shane B (1989) Folylpolyglutamate synthesis and role in the regulation of one-carbon
metabolism. Vitam Horm 45: 263-335 Shane B, Stokstad EL (1975) Transport and metabolism of folates by bacteria. J Biol Chem 250:
2243-2253 Suh JR, Herbig AK, Stover PJ (2001) New perspectives on folate catabolism. Annu Rev Nutr 21:
255-282 Suzuki Y, Brown GM (1974) The biosynthesis of folic acid. XII. Purification and properties of
dihydroneopterin triphosphate pyrophosphohydrolase. J Biol Chem 249: 2405-2410 Sybesma W, Van Den Born E, Starrenburg M, Mierau I, Kleerebezem M, De Vos WM,
Hugenholtz J (2003) Controlled modulation of folate polyglutamyl tail length by metabolic engineering of Lactococcus lactis. Appl Environ Microbiol 69: 7101-7107
Varoquaux F, Blanvillain R, Delseny M, Gallois P (2000) Less is better: new approaches for
seedless fruit production. Trends Biotechnol 18: 233-242 Waller JC, Akhtar TA, Lara-Nunez A, Gregory JF, 3rd, McQuinn RP, Giovannoni JJ, Hanson
AD Developmental and feedforward control of the expression of folate biosynthesis genes in tomato fruit. Mol Plant 3: 66-77
105
Wang M, Ratnam S, Freisheim JH (1995) Cloning, nucleotide sequence and expression of the bifunctional dihydrofolate reductase-thymidylate synthase from Glycine max. Biochim Biophys Acta 1261: 325-336
Wang TT, Chandler CJ, Halsted CH (1986) Intracellular pteroylpolyglutamate hydrolase from
human jejunal mucosa. Isolation and characterization. J Biol Chem 261: 13551-13555 Wang Y, Dias JA, Nimec Z, Rotundo R, O'Connor BM, Freisheim J, Galivan J (1993) The
properties and function of gamma-glutamyl hydrolase and poly-gamma-glutamate. Adv Enzyme Regul 33: 207-218
Whitfield CD, Steers EJ, Jr., Weissbach H (1970) Purification and properties of 5-
methyltetrahydropteroyltriglutamate-homocysteine transmethylase. J Biol Chem 245: 390-401
Wielinga P, Hooijberg JH, Gunnarsdottir S, Kathmann I, Reid G, Zelcer N, van der Born K, de
Haas M, van der Heijden I, Kaspers G, Wijnholds J, Jansen G, Peters G, Borst P (2005) The human multidrug resistance protein MRP5 transports folates and can mediate cellular resistance against antifolates. Cancer Res 65: 4425-4430
Yao R, Schneider E, Ryan TJ, Galivan J (1996) Human gamma-glutamyl hydrolase: cloning and
characterization of the enzyme expressed in vitro. Proc Natl Acad Sci U S A 93: 10134-10138
Zeng H, Chen ZS, Belinsky MG, Rea PA, Kruh GD (2001) Transport of methotrexate (MTX)
and folates by multidrug resistance protein (MRP) 3 and MRP1: effect of polyglutamylation on MTX transport. Cancer Res 61: 7225-7232
Zhang X, Henriques R, Lin SS, Niu QW, Chua NH (2006) Agrobacterium-mediated
transformation of Arabidopsis thaliana using the floral dip method. Nat Protoc 1: 641-646

106
BIOGRAPHICAL SKETCH
Tariq Aziz Akhtar was born in Toronto, Ontario, Canada. He attended Crescent School,
an all-boys independent high school in Toronto, where he graduated in 1995. Tariq then moved
to Switzerland where he attended school, worked and traveled. In 1997, he returned to Canada
and attended the University of Waterloo where he earned his Bachelor of Science in general
science in 1995 and Master of Science in biology in 2003. In 2006, Tariq began his PhD. with
Dr. Andrew Hanson at the University of Florida. Upon completion of his PhD. Program, Tariq
began his post-doctoral work at the University of Michigan with Dr. Eran Pichersky.