Embed Size (px)
Citation preview
UNITED STATES
SECURITIES AND EXCHANGE COMMISSIONWASHINGTON, D.C. 20549
FORM 10-K(Mark one)
☒ ANNUAL REPORT PURSUANT TO SECTION 13 OR 15(d) OF THE SECURITIES EXCHANGE ACT OF 1934For the fiscal year ended December 31, 2018
OR
☐ TRANSITION REPORT PURSUANT TO SECTION 13 OR 15(d) OF THE SECURITIES EXCHANGE ACT OF 1934For the transition period from ___________ to ______________
COMMISSION FILE NUMBER 1-16483
Mondelēz International, Inc.(Exact name of registrant as specified in its charter)
Virginia 52-2284372(State or other jurisdiction ofincorporation or organization)
(I.R.S. EmployerIdentification No.)
Three Parkway North, Deerfield, Illinois 60015(Address of principal executive offices) (Zip Code)
Registrant’s telephone number, including area code: 847-943-4000Securities registered pursuant to Section 12(b) of the Act:
Title of each class Name of each exchange on which registeredClass A Common Stock, no par value The Nasdaq Global Select Market
2.375% Notes due 2021 New York Stock Exchange LLC1.000% Notes due 2022 New York Stock Exchange LLC1.625% Notes due 2023 New York Stock Exchange LLC1.625% Notes due 2027 New York Stock Exchange LLC2.375% Notes due 2035 New York Stock Exchange LLC4.500% Notes due 2035 New York Stock Exchange LLC3.875% Notes due 2045 New York Stock Exchange LLC
Securities registered pursuant to Section 12(g) of the Act: NoneIndicate by check mark if the registrant is a well-known seasoned issuer, as defined in Rule 405 of the Securities Act. Yes ☒ No ☐Indicate by check mark if the registrant is not required to file reports pursuant to Section 13 or Section 15(d) of the Act. Yes ☐ No ☒Note: Checking the box above will not relieve any registrant required to file reports pursuant to Section 13 or 15(d) of the Exchange Act from their obligations under those
Sections.Indicate by check mark whether the registrant (1) has filed all reports required to be filed by Section 13 or 15(d) of the Securities Exchange Act of 1934 during the
preceding 12 months (or for such shorter period that the registrant was required to file such reports), and (2) has been subject to such filing requirements for the past90 days. Yes ☒ No ☐
Indicate by check mark whether the registrant has submitted electronically every Interactive Data File required to be submitted pursuant to Rule 405 of Regulation S-T (§232.405 of this chapter) during the preceding 12 months (or for such shorter period that the registrant was required to submit such files). Yes ☒ No ☐
Indicate by check mark if disclosure of delinquent filers pursuant to Item 405 of Regulation S-K (§ 229.405 of this chapter) is not contained herein, and will not be contained,to the best of registrant’s knowledge, in definitive proxy or information statements incorporated by reference in Part III of this Form 10-K or any amendment to this Form 10-K. ☒
Indicate by check mark whether the registrant is a large accelerated filer, an accelerated filer, a non-accelerated filer, a smaller reporting company, or an emerging growthcompany. See the definitions of “large accelerated filer,” “accelerated filer,” “smaller reporting company,” and “emerging growth company” in Rule 12b-2 of the Exchange Act.
Large accelerated filer ☒ Accelerated filer ☐Non-accelerated filer ☐ Smaller reporting company ☐ Emerging growth company ☐
If an emerging growth company, indicate by check mark if the registrant has elected not to use the extended transition period for complying with any new or revisedfinancial accounting standards provided pursuant to Section 13(a) of the Exchange Act. ☐
Indicate by check mark whether the registrant is a shell company (as defined in Rule 12b-2 of the Act). Yes ☐ No ☒The aggregate market value of the shares of Class A Common Stock held by non-affiliates of the registrant, computed by reference to the closing price of such stock on
June 30, 2018, was $59 billion. At February 1, 2019, there were 1,444,169,449 shares of the registrant’s Class A Common Stock outstanding.Documents Incorporated by Reference
Portions of the registrant’s definitive proxy statement to be filed with the Securities and Exchange Commission in connection with its annual meeting of shareholdersexpected to be held on May 15, 2019 are incorporated by reference into Part III hereof.
Table of Contents
Mondelēz International, Inc.
Page No.Part I – Item 1. Business 2Item 1A. Risk Factors 10Item 1B. Unresolved Staff Comments 20Item 2. Properties 21Item 3. Legal Proceedings 21Item 4. Mine Safety Disclosures 21
Part II – Item 5. Market for Registrant’s Common Equity, Related Stockholder Matters
and Issuer Purchases of Equity Securities 22Item 6. Selected Financial Data 24Item 7. Management’s Discussion and Analysis of Financial Condition and Results of Operations: 26
Summary of Results 28
Financial Outlook 29
Discussion and Analysis of Historical Results 32
Critical Accounting Estimates 48
Liquidity and Capital Resources 51
Commodity Trends 52
Off-Balance Sheet Arrangements and Aggregate Contractual Obligations 52
Equity and Dividends 54
Non-GAAP Financial Measures 55Item 7A. Quantitative and Qualitative Disclosures about Market Risk 62Item 8. Financial Statements and Supplementary Data: 64
Report of Independent Registered Public Accounting Firm 64
Consolidated Statements of Earnings for the Years Ended December 31, 2018, 2017 and 2016 66
Consolidated Statements of Comprehensive Earnings for the Years Ended December 31, 2018, 2017 and 2016 67
Consolidated Balance Sheets as of December 31, 2018 and 2017 68
Consolidated Statements of Equity for the Years Ended December 31, 2018, 2017 and 2016 69
Consolidated Statements of Cash Flows for the Years Ended December 31, 2018, 2017 and 2016 70
Notes to Consolidated Financial Statements 71Item 9. Changes in and Disagreements with Accountants on Accounting and Financial Disclosure 124Item 9A. Controls and Procedures 124Item 9B. Other Information 125
Part III – Item 10. Directors, Executive Officers and Corporate Governance 126Item 11. Executive Compensation 126
Item 12. Security Ownership of Certain Beneficial Owners and Management and Related Stockholder Matters 126
Item 13. Certain Relationships and Related Transactions, and Director Independence 126Item 14. Principal Accountant Fees and Services 126
Part IV – Item 15. Exhibits and Financial Statement Schedules 127
Item 16. Form 10-K Summary 131
Signatures 132
Valuation and Qualifying Accounts S-1
In this report, for all periods presented, “we,” “us,” “our,” “the Company” and “Mondelēz International” refer to Mondelēz International, Inc. andsubsidiaries. References to “Common Stock” refer to our Class A Common Stock.
i
Table of Contents
Forward-Looking Statements
This report contains a number of forward-looking statements. Words, and variations of words, such as “will,” “may,” “expect,” “would,” “could,”“might,” “plan,” “believe,” “estimate,” “anticipate,” “likely,” “drive,” “seek,” “aim,” “potential,” “objective,” “project,” “outlook” and similar expressionsare intended to identify our forward-looking statements, including but not limited to statements about: our future performance, including our futurerevenue growth, profitability and earnings; our new strategic plan and our plan to accelerate consumer-centric growth, drive operational excellenceand create a winning growth culture; our leadership position in snacking; our ability to meet consumer needs and demand and identify innovationand renovation opportunities; the results of driving operational excellence; price volatility and pricing actions; the cost environment and measuresto address increased costs; our tax rate, tax positions, transition tax liability and the impact of U.S. tax reform on our future results; market share;the United Kingdom’s planned exit from the European Union and its impact on our results, including if the United Kingdom exits the EuropeanUnion without an agreement; the costs of, timing of expenditures under and completion of our restructuring program; category growth; our effect ondemand and our market position; consumer snacking behaviors; commodity prices and supply; investments; research, development andinnovation; political and economic conditions and volatility; the effect of the imposition of increased or new tariffs, quotas, trade barriers or similarrestrictions on our sales or key commodities and potential changes in U.S. trade programs, trade relations, regulations, taxes or fiscal policies;currency exchange rates, controls and restrictions and volatility in foreign currencies; the application of highly inflationary accounting for ourArgentinian subsidiaries and the potential for and impacts from currency devaluation in other countries; our e-commerce channel strategies;manufacturing and distribution capacity; changes in laws and regulations, regulatory compliance and related costs; our ownership interest in KeurigDr Pepper; matters related to the acquisition of a U.S. premium biscuit company and the acquisition of a biscuit operation in Vietnam; the outcomeand effects on us of legal proceedings and government investigations; the estimated value of goodwill and intangible assets; amortization expensefor intangible assets; impairment of goodwill and intangible assets and our projections of operating results and other factors that may affect ourimpairment testing; our accounting estimates and judgments and the impact of new accounting pronouncements; pension obligations, expenses,contributions and assumptions; employee benefit plan expenses, obligations and assumptions; compensation expense; sustainability initiatives;the Brazilian indirect tax matter; our liability related to our withdrawal from the Bakery and Confectionery Union and Industry International PensionFund and timing of receipt of the assessment from the Fund; the impacts of the malware incident; our ability to prevent and respond tocybersecurity breaches and disruptions; our liquidity, funding sources and uses of funding, including our use of commercial paper; the plannedphase out of London Interbank Offered Rates; interest expense; our risk management program, including the use of financial instruments and theimpacts and effectiveness of our hedging activities; working capital; capital expenditures and funding; share repurchases; dividends; long-termvalue for our shareholders; compliance with financial and long-term debt covenants; guarantees; and our contractual obligations.
These forward-looking statements involve risks and uncertainties, many of which are beyond our control. Important factors that could cause actualresults to differ materially from those described in our forward-looking statements include, but are not limited to, risks from operating globallyincluding in emerging markets; changes in currency exchange rates, controls and restrictions; continued volatility of commodity and other inputcosts; weakness in economic conditions; weakness in consumer spending; pricing actions; tax matters including changes in tax rates and laws,disagreements with taxing authorities and imposition of new taxes; use of information technology and third party service providers; unanticipateddisruptions to our business, such as the malware incident, cyberattacks or other security breaches; competition; protection of our reputation andbrand image; our ability to innovate and differentiate our products; the restructuring program and our other transformation initiatives not yielding theanticipated benefits; changes in the assumptions on which the restructuring program is based; management of our workforce; consolidation ofretail customers and competition with retailer and other economy brands; changes in our relationships with suppliers or customers; legal,regulatory, tax or benefit law changes, claims or actions; strategic transactions; significant changes in valuation factors that may adversely affectour impairment testing of goodwill and intangible assets; perceived or actual product quality issues or product recalls; failure to maintain effectiveinternal control over financial reporting; volatility of and access to capital or other markets; pension costs; and our ability to protect our intellectualproperty and intangible assets. We disclaim and do not undertake any obligation to update or revise any forward-looking statement in this reportexcept as required by applicable law or regulation.
1
Table of Contents
PART IItem 1. Business.
General
We are one of the world’s largest snack companies with global net revenues of $25.9 billion and net earnings of $3.4 billion in 2018. We make andsell primarily snacks, including biscuits (cookies, crackers and salted snacks), chocolate, gum & candy as well as various cheese & grocery andpowdered beverage products. We have operations in more than 80 countries and sell our products in over 150 countries around the world. Ourportfolio includes iconic snack brands such as Cadbury, Milka and Toblerone chocolate; Oreo, belVita and LU biscuits; Halls candy; Trident gumand Tang powdered beverages.
We are proud members of the Dow Jones Sustainability Index, Standard and Poor’s 500 and Nasdaq 100. Our Common Stock trades on TheNasdaq Global Select Market under the symbol “MDLZ.” Mondelēz International has been incorporated in the Commonwealth of Virginia since2000.
Strategy
We aim to be the global leader in snacking by focusing on growth, execution and culture and leveraging our strong foundation of iconic global andlocal brands, an attractive global footprint, and deep innovation, marketing and distribution capabilities. In September 2018, we announced our new strategic plan that builds on our strong foundations, including our unique portfolio of iconic global andlocal brands, our attractive global footprint, our market leadership in developed and emerging markets and our margin expansion in recent yearsthat will allow us to make ongoing investments in our product portfolio.
Our plan to drive long-term growth includes three strategic priorities: accelerating consumer-centric growth, driving operational excellence andcreating a winning growth culture.
• Accelerate consumer-centric growth. As demands on consumers’ time increase and consumer eating habits evolve, we aim to meetconsumers' needs for what they eat, why they buy and how and where they buy. We have developed a new approach, which we calldemand spaces, to identify and address how consumers snack across different emotional or functional needs and occasions that webelieve will allow us to meet consumer needs and identify innovation and renovation opportunities. We are also evolving our innovationapproach to meet diverse, local consumer needs and we plan to test, learn and scale new product offerings quickly to meet evolving localand global snacking demand. We believe our greater understanding of consumers’ snacking needs will lead to meeting more of their needsand demand for snacks.
• Drive operational excellence. Over the last five years, we have driven productivity gains and cost improvements across our business andincreased our operating margins as a result. We plan to continue to improve efficiency by leveraging our global shared services platform,driving greater efficiencies in our supply chain and continuing to utilize Zero-Based Budgeting (“ZBB”) across our operations. We plan tofocus on continuous improvement with a special focus on the consumer-facing areas of our business such as sales, marketing andcustomer service. We expect the improvements and efficiencies we drive will provide funds for growth and continue to expand profitdollars.
• Build a winning growth culture. To support the acceleration of our growth, we are shifting toward a more agile, digital and local-firstcommercial focus. We are giving our local teams more autonomy to drive commercial and innovation plans as they are closer to the needsand desires of consumers. We will continue to leverage the efficiency and scale of our regional operating units while empowering our localcommercial operations to respond faster to changing consumer preferences and capitalize on growth opportunities. Our digitaltransformation program will also help to enable consumer demand and sales opportunities. We believe these shifts will help drive profitabletop-line growth.
We run our business with a long-term perspective, and we believe the successful implementation of our strategic plan will drive top- and bottom-line growth and enable us to create long-term value for our shareholders.
2
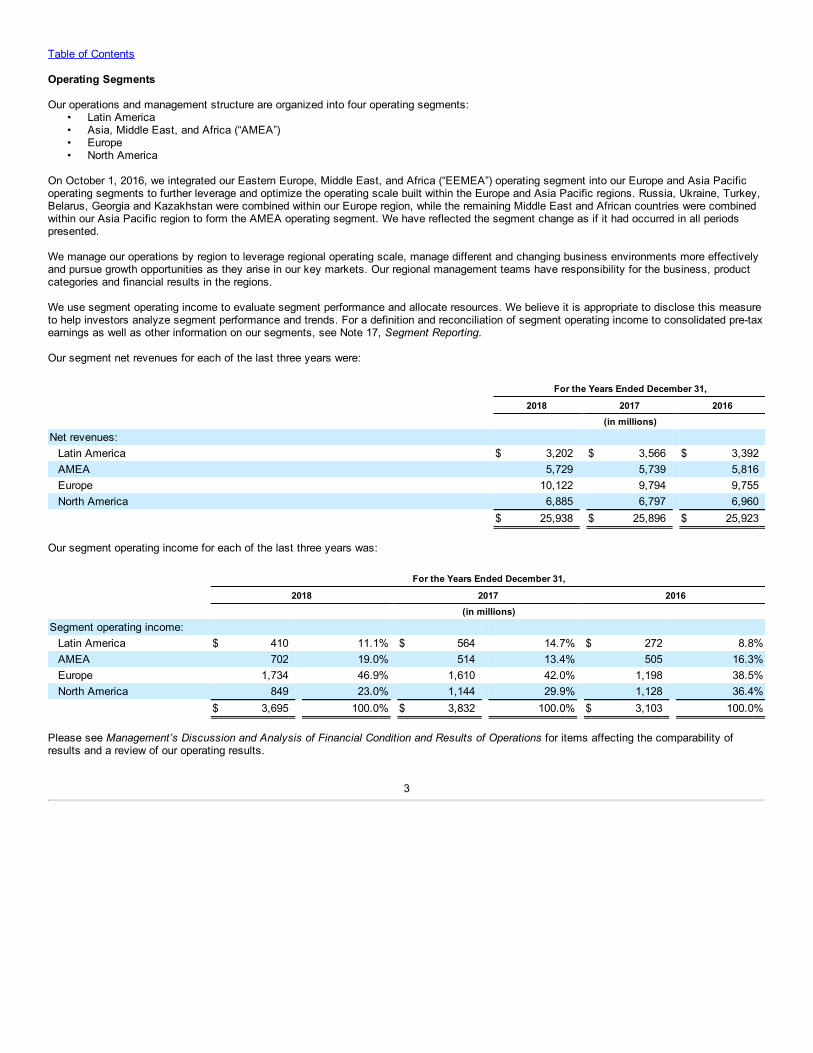
Table of Contents
Operating Segments
Our operations and management structure are organized into four operating segments:• Latin America• Asia, Middle East, and Africa (“AMEA”)• Europe• North America
On October 1, 2016, we integrated our Eastern Europe, Middle East, and Africa (“EEMEA”) operating segment into our Europe and Asia Pacificoperating segments to further leverage and optimize the operating scale built within the Europe and Asia Pacific regions. Russia, Ukraine, Turkey,Belarus, Georgia and Kazakhstan were combined within our Europe region, while the remaining Middle East and African countries were combinedwithin our Asia Pacific region to form the AMEA operating segment. We have reflected the segment change as if it had occurred in all periodspresented.
We manage our operations by region to leverage regional operating scale, manage different and changing business environments more effectivelyand pursue growth opportunities as they arise in our key markets. Our regional management teams have responsibility for the business, productcategories and financial results in the regions.
We use segment operating income to evaluate segment performance and allocate resources. We believe it is appropriate to disclose this measureto help investors analyze segment performance and trends. For a definition and reconciliation of segment operating income to consolidated pre-taxearnings as well as other information on our segments, see Note 17, Segment Reporting.
Our segment net revenues for each of the last three years were:
For the Years Ended December 31,
2018 2017 2016 (in millions)Net revenues:
Latin America $ 3,202 $ 3,566 $ 3,392AMEA 5,729 5,739 5,816Europe 10,122 9,794 9,755North America 6,885 6,797 6,960
$ 25,938 $ 25,896 $ 25,923
Our segment operating income for each of the last three years was:
For the Years Ended December 31,
2018 2017 2016 (in millions)Segment operating income:
Latin America $ 410 11.1% $ 564 14.7% $ 272 8.8%AMEA 702 19.0% 514 13.4% 505 16.3%Europe 1,734 46.9% 1,610 42.0% 1,198 38.5%North America 849 23.0% 1,144 29.9% 1,128 36.4%
$ 3,695 100.0% $ 3,832 100.0% $ 3,103 100.0%
Please see Management’s Discussion and Analysis of Financial Condition and Results of Operations for items affecting the comparability ofresults and a review of our operating results.
3
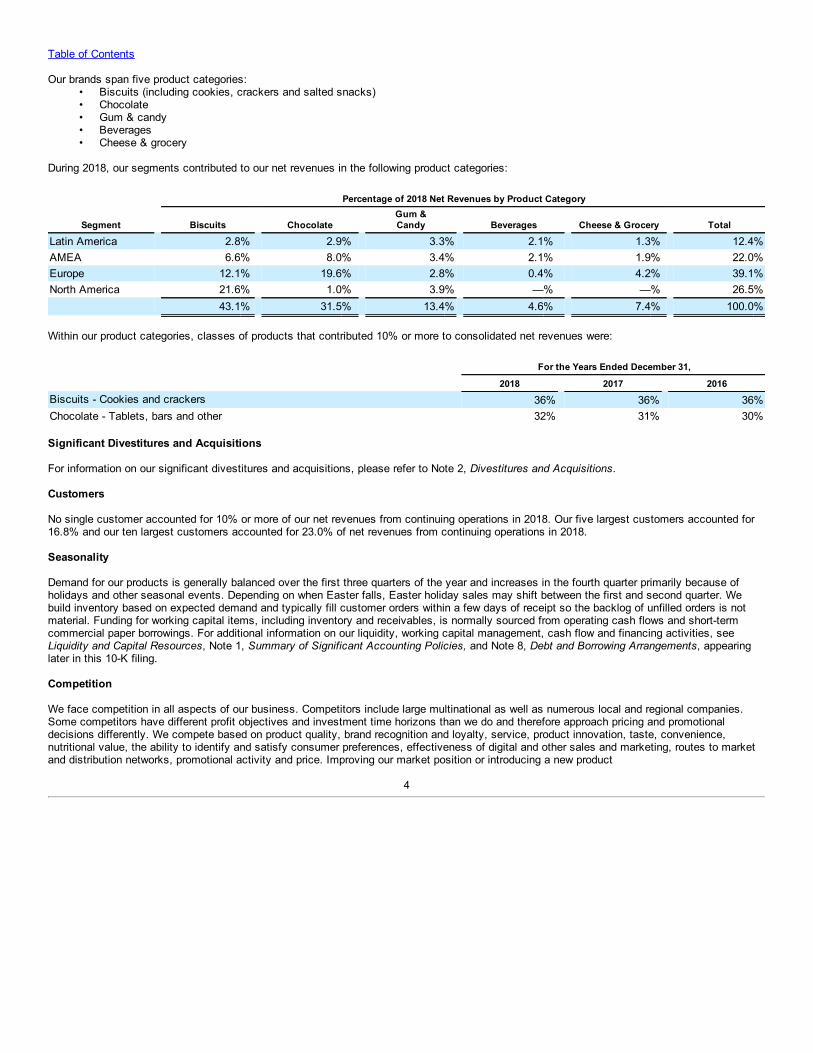
Table of Contents
Our brands span five product categories:• Biscuits (including cookies, crackers and salted snacks)• Chocolate• Gum & candy• Beverages• Cheese & grocery
During 2018, our segments contributed to our net revenues in the following product categories:
Percentage of 2018 Net Revenues by Product Category
Segment Biscuits Chocolate Gum &Candy Beverages Cheese & Grocery Total
Latin America 2.8% 2.9% 3.3% 2.1% 1.3% 12.4%AMEA 6.6% 8.0% 3.4% 2.1% 1.9% 22.0%Europe 12.1% 19.6% 2.8% 0.4% 4.2% 39.1%North America 21.6% 1.0% 3.9% —% —% 26.5% 43.1% 31.5% 13.4% 4.6% 7.4% 100.0%
Within our product categories, classes of products that contributed 10% or more to consolidated net revenues were:
For the Years Ended December 31,
2018 2017 2016Biscuits - Cookies and crackers 36% 36% 36%Chocolate - Tablets, bars and other 32% 31% 30%
Significant Divestitures and Acquisitions
For information on our significant divestitures and acquisitions, please refer to Note 2, Divestitures and Acquisitions.
Customers
No single customer accounted for 10% or more of our net revenues from continuing operations in 2018. Our five largest customers accounted for16.8% and our ten largest customers accounted for 23.0% of net revenues from continuing operations in 2018.
Seasonality
Demand for our products is generally balanced over the first three quarters of the year and increases in the fourth quarter primarily because ofholidays and other seasonal events. Depending on when Easter falls, Easter holiday sales may shift between the first and second quarter. Webuild inventory based on expected demand and typically fill customer orders within a few days of receipt so the backlog of unfilled orders is notmaterial. Funding for working capital items, including inventory and receivables, is normally sourced from operating cash flows and short-termcommercial paper borrowings. For additional information on our liquidity, working capital management, cash flow and financing activities, seeLiquidity and Capital Resources, Note 1, Summary of Significant Accounting Policies, and Note 8, Debt and Borrowing Arrangements, appearinglater in this 10-K filing.
Competition
We face competition in all aspects of our business. Competitors include large multinational as well as numerous local and regional companies.Some competitors have different profit objectives and investment time horizons than we do and therefore approach pricing and promotionaldecisions differently. We compete based on product quality, brand recognition and loyalty, service, product innovation, taste, convenience,nutritional value, the ability to identify and satisfy consumer preferences, effectiveness of digital and other sales and marketing, routes to marketand distribution networks, promotional activity and price. Improving our market position or introducing a new product
4
Table of Contents
requires substantial research, development, advertising and promotional expenditures. We believe these investments lead to better products forthe consumer and support our growth and market position.
Distribution and Marketing
We generally sell our products to supermarket chains, wholesalers, supercenters, club stores, mass merchandisers, distributors, conveniencestores, gasoline stations, drug stores, value stores and other retail food outlets. We distribute our products through direct store delivery, company-owned and satellite warehouses, distribution centers and other facilities. We use the services of independent sales offices and agents in some ofour international locations.
Through our global e-commerce organization and capabilities, we pursue online growth with partners in key markets around the world, includingboth pure e-tailers and brick-and-mortar retailers. We continue to invest in both talent and digital capabilities. Our e-commerce channel strategieswill play a critical role in our ambition to be the best snacking company in the world.
We conduct marketing efforts through three principal sets of activities: (i) consumer marketing and advertising including on-air, print, outdoor,digital and social media and other product promotions; (ii) consumer sales incentives such as coupons and rebates; and (iii) trade promotions tosupport price features, displays and other merchandising of our products by our customers.
Raw Materials and Packaging
We purchase and use large quantities of commodities, including cocoa, dairy, wheat, palm and other vegetable oils, sugar and other sweeteners,flavoring agents and nuts. In addition, we purchase and use significant quantities of packaging materials to package our products and natural gas,fuels and electricity for our factories and warehouses. We monitor worldwide supply, commodity cost and currency trends so we can cost-effectively secure ingredients, packaging and fuel required for production.
A number of external factors such as weather conditions, commodity market conditions, currency fluctuations and the effects of governmentalagricultural or other programs affect the cost and availability of raw materials and agricultural materials used in our products. We address highercommodity costs and currency impacts primarily through hedging, higher pricing and manufacturing and overhead cost control. We use hedgingtechniques to limit the impact of fluctuations in the cost of our principal raw materials; however, we may not be able to fully hedge againstcommodity cost changes, and our hedging strategies may not protect us from increases in specific raw material costs.
While the costs of our principal raw materials fluctuate, we believe there will continue to be an adequate supply of the raw materials we use andthat they will generally remain available from numerous sources. For additional information on our commodity costs, refer to the CommodityTrends section within Management’s Discussion and Analysis of Financial Condition and Results of Operations.
Intellectual Property
Our intellectual property rights (including trademarks, patents, copyrights, registered designs, proprietary trade secrets, technology and know-how)are material to our business.
We own numerous trademarks and patents in many countries around the world. Depending on the country, trademarks remain valid for as long asthey are in use or their registration status is maintained. Trademark registrations generally are for renewable, fixed terms. We also have patents fora number of current and potential products. Our patents cover inventions ranging from packaging techniques to processes relating to specificproducts and to the products themselves. Our issued patents extend for varying periods according to the date of patent application filing or grantand the legal term of patents in the various countries where patent protection is obtained. The actual protection afforded by a patent, which canvary from country to country, depends upon the type of patent, the scope of its coverage as determined by the patent office or courts in thecountry, and the availability of legal remedies in the country. While our patent portfolio is material to our business, the loss of one patent or a groupof related patents would not have a material adverse effect on our business.
5
Table of Contents
From time to time, we grant third parties licenses to use one or more of our trademarks, patents and/or proprietary trade secrets in connection withthe manufacture, sale or distribution of third party products. Similarly, we sell some products under brands, patents and/or proprietary trade secretswe license from third parties. In our agreement with Kraft Foods Group, Inc. (“Kraft Foods Group,” which is now part of The Kraft Heinz Company),we each granted the other party various licenses to use certain of our and their respective intellectual property rights in named jurisdictionsfollowing the spin-off of our North American grocery business.
Research and Development
We pursue four objectives in research and development: product safety and quality, growth through new products, superior consumer satisfactionand reduced costs. Our innovation efforts focus on anticipating consumer demands and adapting quickly to changing market trends. Well-beingand healthy snacking are a significant focus of our current research and development initiatives. These initiatives aim to accelerate our growth andmargins by addressing consumer needs and market trends and leveraging scalable innovation platforms and breakthrough technologies. We are inthe process of completing a $65 million plan to build out and modernize our network of global research and development facilities. We celebratedthe official opening of our Wroclaw, Poland technical center in 2017, and during 2018 we completed the modernization at the technical centerslocated at Suzhou, China; Jurong, Singapore and Thane, India. We are focusing our technical resources at eleven large locations to drive growthand innovation. Our network of technical centers enable greater effectiveness, improved efficiency and accelerated project delivery. Theselocations are in Curitiba, Brazil; Suzhou, China; Thane, India; Mexico City, Mexico; East Hanover, New Jersey; Wroclaw, Poland; Jurong,Singapore; Bournville, United Kingdom; Reading, United Kingdom; Saclay, France and Munich, Germany.
At December 31, 2018, we had approximately 2,400 scientists and engineers, of which 1,800 are primarily focused on research and developmentand the remainder are primarily focused on quality assurance and regulatory affairs. Our research and development expense was $362 million in2018, $366 million in 2017 and $376 million in 2016.
Regulation
Our food products and ingredients are subject to local, national and multinational regulations related to labeling, health and nutrition claims,packaging, pricing, marketing and advertising, privacy and related areas. In addition, various jurisdictions regulate our operations by licensing andinspecting our manufacturing plants and facilities, enforcing standards for select food products, grading food products, and regulating tradepractices related to the sale and pricing of our food products. Many of the food commodities we use in our operations are subject to governmentagricultural policy and intervention, and the scrutiny of human rights issues in industry supply chains has led to developing regulation in manycountries. These policies have substantial effects on prices and supplies and are subject to periodic governmental and administrative review.
Examples of laws and regulations that affect our business include selective food taxes, labeling requirements such as front-of-pack labeling andnutrient profiling, marketing restrictions, potential withdrawal of trade concessions as dispute settlement retaliation and sanctions on sales orsourcing of raw materials. We will continue to monitor developments in laws and regulations. At this time, we do not expect the cost of complyingwith new laws and regulations will be material. Also refer to Note 1, Summary of Significant Accounting Policies – Currency Translation and HighlyInflationary Accounting, for additional information on government regulations and currency-related impacts on our operations in the UnitedKingdom, Argentina and other countries.
Environmental Regulation
Throughout the countries in which we do business, we are subject to local, national and multinational environmental laws and regulations relating tothe protection of the environment. We have programs across our business units designed to meet applicable environmental compliancerequirements. In the United States, the laws and regulations include the Clean Air Act, the Clean Water Act, the Resource Conservation andRecovery Act and the Comprehensive Environmental Response, Compensation, and Liability Act. We track regulatory developments in variousjurisdictions relating to the use of plastic in packaging materials and taxes linked to the costs of waste so that we can comply with evolvingrequirements. Based on information currently available, we believe that our compliance with environmental laws and regulations will not have amaterial effect on our financial results.
6
Table of Contents
Sustainability and Well-Being
A key strategic priority for us is to create a positive impact for people and our planet. Many of the challenges facing people and the planet areinterrelated, so we design our core programs and initiatives holistically by working to reduce our environmental footprint, supporting farmers whogrow our key ingredients, helping people to snack mindfully and investing in healthy lifestyle community programs through the MondelēzInternational Foundation. We continue to leverage our global operating scale to secure sustainable raw materials and work with suppliers to drivemeaningful social and environmental changes, focusing where we can make the greatest impact. For example, we launched our Cocoa Lifeprogram in 2012 and continue to invest up to $400 million through 2022 to build a sustainable cocoa supply. We are also improving sustainability inour wheat supply by working with farmers in North America and through our Harmony program in Europe.
Our 2020 sustainability goals aim to place us at the forefront in the fight against climate change with ambitious targets for an end-to-end approachto reduce our carbon footprint, including reducing our absolute CO2 emissions from manufacturing and addressing deforestation in key raw materialsupply chains. We are working to cut our absolute water footprint in manufacturing, focusing on priority sites where water is most scarce. We alsocontinue to work on reducing waste in manufacturing and packaging.
Within well-being we are focused on mindful snacking to empower people to choose the right snack for the right moment. Expanding our portioncontrol options - snacks that are 200 calories or less and are individually wrapped - enables people to enjoy the treats they love, become moremindful about what they eat and help manage their daily calories intake. At the end of 2017, our portion control options represented approximately13% of revenue, becoming a meaningful segment of our portfolio. Mindful snacking is an important area of focus for us and aligns with our purposeto empower people to snack right.
The Governance, Membership and Public Affairs Committee of our Board of Directors is responsible for overseeing our Impact strategy. OurImpact goals are part of our strategic planning process, and therefore, progress and key activities are regularly reported to the Board of Directorsand the business leadership teams. Climate change, CO2, energy, well-being and other sustainability matters are key focus areas in our strategy.
We have a robust Enterprise Risk Management ("ERM") process for identifying, measuring, monitoring and managing risks, with oversight by theRisk and Compliance Committee ("MRCC"), which reports annually to the Audit Committee of our Board of Directors. The purpose of the MRCC isto oversee how we identify and assess the most significant inherent risks to our business so we may adequately mitigate them or monitor themacross the Company. All identified risks are vetted by the MRCC and remain under the MRCC’s governance. Ownership of specific risks isassigned at the Mondelēz Leadership Team ("MLT") level (MLT members report directly to the CEO). As owners of each specific risk, MLTmembers are responsible for verifying that appropriate mitigation controls and monitoring systems are in place. The risk universe considered duringthis process is wide and varied. Climate change is included in this risk universe as well as other sustainability and well-being issues.
Our ERM methodology is governed by the MRCC and includes annual reviews with our four operating regions, considering Company-level risks byusing information gathered at the asset level (regions, countries, individual facilities and separate business units). The resulting climate change,sustainability and well-being risks are captured as follows within the ERM framework: commodities, reputation and brand image, unanticipatedbusiness disruptions, changes in regulations and changes in consumer preferences.
In addition, we work with internal and external experts to review the impact of major societal issues on our business and to shape our strategicresponses to them. Materials and processes that guide our assessment include our ERM process; analysis of stakeholder and regulatory issues;our total greenhouse gas, land and water footprint; proprietary consumer insight data; and publicly available data on societal issues, includingstatistics and reports from authorities, non-governmental organizations and peer companies.
We have been recognized for our ongoing economic, environmental and social contributions. Each year since we created Mondelēz International in2012 we have been listed on the Dow Jones Sustainability Index (“DJSI”) – World and North American Indices. The DJSI selects the top 10% ofglobal companies and top 20% of North American companies based on an extensive review of financial and sustainability programs within eachindustry. We are at the 92nd percentile of our industry and achieved perfect scores in the areas of health & nutrition and addressing water-relatedrisks.
7
Table of Contents
We also participate in CDP Climate and Water disclosures and continue to work to reduce our carbon and water footprints. From 2013 to 2017, wereported CO2 emission reductions from manufacturing of 10% and reduced incoming water usage by 25% in priority factories where water is mostscarce. We are committed to continue this and other related work in the areas of sustainable resources and agriculture, well-being snacks,community partnerships and safety of our products and people.
Employees
We employed through our consolidated subsidiaries approximately 80,000 people worldwide at December 31, 2018 and approximately 83,000 atDecember 31, 2017. Employees represented by labor unions or workers’ councils represent approximately 60% of our 68,000 employees outsidethe United States and approximately 28% of our 12,000 U.S. employees. Our business units are subject to various local, national and multinationallaws and regulations relating to their relationships with their employees. In accordance with European Union requirements, we also haveestablished a European Workers Council composed of management and elected members of our workforce. We or our subsidiaries are a party tonumerous collective bargaining agreements and we work to renegotiate these collective bargaining agreements on satisfactory terms when theyexpire.
International Operations
Based on where we sell our products, we generated 75.3% of our 2018 net revenues, 75.8% of our 2017 net revenues and 75.6% of our 2016 netrevenues from continuing operations outside the United States. We sell our products to consumers in over 150 countries. At December 31, 2018,we had operations in more than 80 countries and made our products at approximately 132 manufacturing and processing facilities in 52 countries.Refer to Note 17, Segment Reporting, for additional information on our U.S. and non-U.S. operations. Refer to Item 2, Properties, for moreinformation on our manufacturing and other facilities. Also, for a discussion of risks related to our operations outside the United States, see Item1A, Risk Factors.
Executive Officers of the Registrant
The following are our executive officers as of February 8, 2019:
Name Age TitleDirk Van de Put 58 Chief Executive OfficerLuca Zaramella 49 Executive Vice President and Chief Financial OfficerPaulette Alviti 48 Executive Vice President and Chief Human Resources OfficerMaurizio Brusadelli 50 Executive Vice President and President, Asia Pacific, Middle East and AfricaTimothy P. Cofer 50 Executive Vice President and Chief Growth OfficerVinzenz P. Gruber 53 Executive Vice President and President, EuropeRobin S. Hargrove 53 Executive Vice President, Research, Development, Quality & InnovationAlejandro R. Lorenzo 47 Executive Vice President and President, Latin AmericaDaniel P. Myers 63 Executive Vice President, Integrated Supply ChainGerhard W. Pleuhs 62 Executive Vice President and General CounselHenry Glendon (Glen) Walter IV 50 Executive Vice President and President, North America
Mr. Van de Put became Chief Executive Officer and a director in November 2017 and became Chairman of the Board of Directors in April 2018. Heformerly served as President and Chief Executive Officer of McCain Foods Limited, a multinational frozen food provider, from July 2011 toNovember 2017 and as its Chief Operating Officer from May 2010 to July 2011. Mr. Van de Put served as President and Chief Executive Officer,Global Over-the-Counter, Consumer Health Division of Novartis AG, a global healthcare company, from 2009 to 2010. Prior to that, he worked for24 years in a variety of leadership positions for several global food and beverage providers, including Danone SA, The Coca-Cola Company andMars, Incorporated.
8
Table of Contents
Mr. Zaramella became Executive Vice President and Chief Financial Officer in August 2018. He previously served as Senior Vice PresidentCorporate Finance, CFO Commercial and Treasurer from June 2016 to July 2018. He also served as Interim Lead Finance North America fromApril to November 2017. Prior to that, he served as Senior Vice President and Corporate Controller from December 2014 to August 2016 andSenior Vice President, Finance of Mondelēz Europe from October 2011 to November 2014. Mr. Zaramella joined Mondelēz International in 1996.
Ms. Alviti became Executive Vice President and Chief Human Resource Officer in June 2018. Before joining Mondelēz International, Ms. Alvitiserved as Senior Vice President and Chief Human Resources Officer of Foot Locker, Inc., a leading global retailer of athletically inspired shoesand apparel, from June 2013 to May 2018. Prior to that, Ms. Alviti spent 17 years at PepsiCo, Inc., a global snack and beverage company, invarious leadership roles, including Senior Vice President and Chief Human Resources Officer Asia, Middle East, Africa from March 2010 to May2013.
Mr. Brusadelli became Executive Vice President and President, Asia Pacific in January 2016 and Executive Vice President and President, AsiaPacific, Middle East and Africa in October 2016. He previously served as President Biscuits Business, South East Asia, Japan and Sales AsiaPacific from September 2015 to December 2015, President Markets and Sales Asia Pacific from September 2014 to September 2015 andPresident United Kingdom, Ireland and Nordics from September 2012 to August 2014. Prior to that, Mr. Brusadelli held various positions ofincreasing responsibility. Mr. Brusadelli joined Mondelēz International in 1993.
Mr. Cofer became Executive Vice President and Chief Growth Officer in January 2016 and served as Interim President, North America from Aprilto November 2017. Mr. Cofer served as Executive Vice President and President, Asia Pacific and EEMEA from September 2013 to December2015 and Executive Vice President and President, Europe from August 2011 to September 2013. Prior to that, Mr. Cofer held various positions ofincreasing responsibility. Mr. Cofer joined Mondelēz International in 1992.
Mr. Gruber became Executive Vice President and President, Europe on January 1, 2019. He previously served as President, Western Europe fromOctober 2016 to December 2018 and President, Chocolate, Europe from August 2011 to September 2016. Mr. Gruber was formerly employed byMondelēz International, in various capacities, from 1989 until 2000 and resumed his employment in September 2007.
Mr. Hargrove became Executive Vice President, Research, Development, Quality and Innovation in April 2015. Prior to that, he served as SeniorVice President, Research, Development & Quality for Mondelēz Europe from January 2013 to March 2015. Before joining Mondelēz International,Mr. Hargrove worked at PepsiCo, Inc., a global snack and beverage company, for 19 years in a variety of leadership positions, most recently asSenior Vice President, Research and Development, Europe from December 2006 to December 2012.
Mr. Lorenzo became Executive Vice President and President, Latin America in January 2017. Mr. Lorenzo served as President, Global BiscuitsCategory from January 2015 to December 2016 and President, Brazil from September 2012 to December 2014. Prior to that, Mr. Lorenzo heldvarious positions of increasing responsibility. Mr. Lorenzo joined Mondelēz International in 2003.
Mr. Myers became Executive Vice President, Integrated Supply Chain in September 2011. Prior to that, he worked for Procter & Gamble ("P&G"),a consumer products company, for 33 years in a variety of leadership positions, most recently serving as Vice President, Product Supply forP&G’s Global Hair Care business from September 2007 to August 2011.
Mr. Pleuhs became Executive Vice President and General Counsel in April 2012. In this role, Mr. Pleuhs oversees the legal, compliance, security,corporate and governance affairs functions within Mondelēz International. He has served in various positions of increasing responsibility sincejoining Mondelēz International in 1990. Mr. Pleuhs has a law degree from the University of Kiel, Germany and is licensed to practice law inGermany and admitted as house counsel in Illinois.
Mr. Walter became Executive Vice President and President, North America in November 2017. Before joining Mondelēz International, Mr. Walterworked at The Coca-Cola Company, a global beverage company, in a variety of leadership positions, most recently as Chief Executive Officer ofCoca-Cola Industries China from February 2014 to October 2017 and President and Chief Operating Officer of Cola-Cola Refreshments in NorthAmerica from January 2013 to February 2014.
9
Table of Contents
Ethics and Governance
We adopted the Mondelēz International Code of Conduct, which qualifies as a code of ethics under Item 406 of Regulation S-K. The code appliesto all of our employees, including our principal executive officer, principal financial officer, principal accounting officer or controller, and personsperforming similar functions. Our code of ethics is available free of charge on our web site at www.mondelezinternational.com/investors/corporate-governance and will be provided free of charge to any shareholder submitting a written request to: Corporate Secretary, Mondelēz International,Inc., Three Parkway North, Deerfield, IL 60015. We will disclose any waiver we grant to an executive officer or director under our code of ethics, orcertain amendments to the code of ethics, on our web site at www.mondelezinternational.com/investors/corporate-governance.
In addition, we adopted Corporate Governance Guidelines, charters for each of the Board’s four standing committees and the Code of BusinessConduct and Ethics for Non-Employee Directors. All of these materials are available on our web site atwww.mondelezinternational.com/investors/corporate-governance and will be provided free of charge to any shareholder requesting a copy bywriting to: Corporate Secretary, Mondelēz International, Inc., Three Parkway North, Deerfield, IL 60015.
Available Information
Our Internet address is www.mondelezinternational.com. Our Annual Reports on Form 10-K, Quarterly Reports on Form 10-Q, Current Reports onForm 8-K and amendments to those reports filed or furnished pursuant to Section 13(a) or 15(d) of the Securities Exchange Act of 1934, asamended (the “Exchange Act”), are available free of charge as soon as possible after we electronically file them with, or furnish them to, the U.S.Securities and Exchange Commission (the “SEC”). You can access our filings with the SEC by visiting ir.mondelezinternational.com/sec-filings.The information on our web site is not, and shall not be deemed to be, a part of this Annual Report on Form 10-K or incorporated into any otherfilings we make with the SEC.
Item 1A. Risk Factors.
You should read the following risk factors carefully when evaluating our business and the forward-looking information contained in this AnnualReport on Form 10-K. Any of the following risks could materially and adversely affect our business, operating results, financial condition and theactual outcome of matters described in this Annual Report on Form 10-K. While we believe we have identified and discussed below the key riskfactors affecting our business, there may be additional risks and uncertainties that we do not presently know or that we do not currently believe tobe significant that may adversely affect our business, performance or financial condition in the future.
We operate in a highly competitive industry and could be adversely affected if we do not effectively execute our strategy and timelyrespond to pricing and other competitive pressures.
The food and snacking industry is highly competitive. Our principal competitors include food, snack and beverage companies that operate inmultiple geographic areas and numerous local and regional companies. If we do not effectively respond to challenges from our competitors, ourbusiness could be adversely affected.
Competitor and customer pressures require that we timely and effectively respond to new distribution channels and technological developmentsand may require that we reduce our prices. These pressures may also restrict our ability to increase prices in response to commodity and othercost increases. Failure to effectively and timely assess new or developing trends, technological advancements or changes in distribution methodsand set proper pricing or effective trade incentives may negatively impact our operating results, achievement of our strategic and financial goalsand our ability to capitalize on new revenue or value-producing opportunities. The rapid emergence of new distribution channels, such as e-commerce, may disrupt our current operations or strategies more quickly than we planned for, create consumer price deflation, alter the buyingbehavior of consumers or disrupt our retail customer relationships. We may need to increase or reallocate spending on existing and newdistribution channels and technologies, marketing, advertising and new product innovation to protect or increase revenues, market share and brandsignificance. These expenditures may not be successful, including those related to our e-commerce and other technology-focused efforts, andmight not result in trade and consumer acceptance of our efforts, which could materially and adversely affect our product sales, financial conditionand results of operations. Additionally, if we reduce prices or our costs increase but we cannot increase sales volumes to offset those changes,then our financial condition and results of operations will suffer.
10
Table of Contents
In September 2018, we announced our new strategy, which focuses on accelerating consumer-centric and volume-driven growth, operationalexcellence driven by cost discipline and continuous operational improvement including in areas like sales execution, and building a winning growthculture with a “local first” commercial approach. If we do not achieve these objectives, effectively implement our strategy in a way that minimizesdisruptions to our business or effectively adjust our culture to this change in strategy, our financial condition and results of operations could bematerially and adversely affected.
Maintaining and enhancing our reputation and brand image and health is essential to our business success.
Our success depends on our ability to maintain and enhance the health of our brands’ equity, launch our brands in new geographies, expand intonew distribution platforms, including e-commerce, and evolve our brands with new product offerings that meet consumer expectations.
We seek to strengthen our brands through product renovation, innovation and marketing investments, including consumer-relevant advertising andconsumer promotions. Failure to effectively address the continuing global focus on well-being, changing consumer acceptance of certainingredients, nutritional expectations of our products, and the sustainability of our ingredients and our packaging could adversely affect our brands’health. Increased attention from the media, shareholders, activists and other stakeholders in these areas as well as on the role of food marketingcould adversely affect our brand image. Undue caution or inaction on our part in addressing these challenges and trends could weaken ourcompetitive position. Such pressures could also lead to stricter regulations and increased focus on food and snacking marketing practices.Increased legal or regulatory restrictions on our labeling, advertising and consumer promotions, or our response to those restrictions, could limitour efforts to maintain, extend and expand our brands. Moreover, adverse publicity or regulatory or legal action against us on product quality andsafety, where we manufacture our products, antitrust, bribery and corruption, or environmental risks or human and workplace rights across oursupply chain could damage our reputation and brand health. Such actions could undermine our customers’ and shareholders’ confidence andreduce demand for our products, even if the regulatory or legal action is unfounded or these matters are immaterial to our operations. Our productsponsorship relationships, including those with celebrity spokespersons or group affiliations, could also subject us to negative publicity.
In addition, our success in maintaining and enhancing our brand image depends on our ability to anticipate change and adapt to a rapidly changingmarketing and media environment, including our increasing reliance on social media and online, digital and mobile dissemination of marketing andadvertising campaigns and the increasing accessibility and speed of dissemination of information. A variety of legal and regulatory restrictions limithow and to whom we market our products. These restrictions may limit our brand renovation, innovation and promotion plans, particularly as socialmedia and the communications environment continue to evolve. Negative posts or comments about us or our brands on social media or web sites(whether factual or not) or security breaches related to use of our social media and failure to respond effectively to these posts, comments oractivities could damage our reputation and brand image across the various regions in which we operate. In addition, we might fail to investsufficiently in maintaining, extending and expanding our brands, our marketing efforts might not achieve desired results and we might be requiredto recognize impairment charges on our brands or related intangible assets or goodwill. Furthermore, third parties may sell counterfeit or imitationversions of our products that are inferior or pose safety risks. If consumers confuse these counterfeit products for our products or have a badexperience with the counterfeit brand, they might refrain from purchasing our brands in the future, which could harm our brand image and sales. Ifwe do not successfully maintain and enhance our reputation and brand health, then our brands, product sales, financial condition and results ofoperations could be materially and adversely affected.
We must correctly predict, identify and interpret changes in consumer preferences and demand and offer new and improved productsthat meet those changes.
Consumer preferences for food and snacking products change continually. Our success depends on our ability to predict, identify and interpret thetastes, dietary habits, packaging, sales channel and other preferences of consumers around the world and to offer products that appeal to thesepreferences in the places and ways consumers want to shop. There may be shifts in the relative size of shopping channels in addition to theincreasing role of e-commerce for consumers. Our success relies upon managing this complexity to bring our products to consumers effectively.Moreover, weak economic conditions, recession, equity market volatility or other factors, such as severe weather events, could affect consumerpreferences and demand. If we do not offer products that
11
Table of Contents
appeal to consumers or if we misjudge consumer demand for our products, we will not be able to meet our growth targets, our sales and marketshare will decrease and our profitability could suffer.
We must distinguish between short-term fads and trends and long-term changes in consumer preferences. If we do not accurately predict whichshifts in consumer preferences or category trends will be long-term, or if we fail to introduce new and improved products to satisfy those changingpreferences, our sales could decline. In addition, because of our varied and geographically diverse consumer base, we must be responsive to localconsumer needs, including with respect to when and how consumers snack and their desire for premium or value offerings, provide an array ofproducts that satisfy the broad spectrum of consumer preferences and use data-driven marketing and advertising to reach consumers at the righttime with the right message. If we fail to expand our product offerings successfully across product categories, rapidly develop products in fastergrowing and more profitable categories or reach consumers in efficient and effective ways leveraging data and analytics, demand for our productscould decrease and our profitability could suffer.
Prolonged negative perceptions concerning the health, environmental and social implications of certain food products and ingredients couldinfluence consumer preferences and acceptance of some of our products and marketing programs. For example, consumers have increasinglyfocused on well-being, including reducing sodium and added sugar consumption, as well as the source and authenticity of the foods theyconsume. Contemporizing our brand portfolio by developing more well-being products and refining their ingredient and nutrition profiles of existingproducts is critical to our growth. In addition, consumer preferences differ by region, and we must monitor and adjust our use of ingredients torespond to these regional preferences. We might be unsuccessful in our efforts to effectively respond to changing consumer preferences andsocial expectations. Continued negative perceptions and failure to satisfy consumer preferences could materially and adversely affect ourreputation, product sales, financial condition and results of operations.
We are subject to risks from operating globally.
We are a global company and generated 75.3% of our 2018 net revenues, 75.8% of our 2017 net revenues and 75.6% of our 2016 net revenuesoutside the United States. We manufacture and market our products in over 150 countries and have operations in more than 80 countries.Therefore, we are subject to risks inherent in global operations. Those risks include:
• compliance with U.S. laws affecting operations outside of the United States, including anti-bribery laws such as the Foreign CorruptPractices Act (“FCPA”);
• the imposition of increased or new tariffs, quotas, trade barriers or similar restrictions on our sales or key commodities like cocoa,potential changes in U.S. trade programs and trade relations with other countries, or regulations, taxes or policies that might negativelyaffect our sales or profitability;
• compliance with antitrust and competition laws, trade laws, data privacy laws, anti-bribery laws, and a variety of other local, national andmultinational regulations and laws in multiple regimes;
• currency devaluations or fluctuations in currency values, including in developing markets such as Argentina, Brazil, China, Mexico,Russia, Turkey, Egypt, Nigeria, Ukraine and South Africa as well as in developed markets such as the United Kingdom and othercountries within the European Union. This includes events like applying highly inflationary accounting as we did for our Argentineansubsidiaries beginning in July 2018;
• changes in capital controls, including currency exchange controls, government currency policies such as demonetization in India or otherlimits on our ability to import raw materials or finished product into various countries or repatriate cash from outside the United States;
• increased sovereign risk, such as default by or deterioration in the economies and credit ratings of governments, particularly in our LatinAmerica and AMEA regions;
• changes in local regulations and laws, the uncertainty of enforcement of remedies in non-U.S. jurisdictions, and foreign ownershiprestrictions and the potential for nationalization or expropriation of property or other resources;
• varying abilities to enforce intellectual property and contractual rights;• discriminatory or conflicting fiscal policies;• greater risk of uncollectible accounts and longer collection cycles; and• design, implementation and use of effective control environment processes across our diverse operations and employee base.
12
Table of Contents
In addition, political and economic changes or volatility, geopolitical regional conflicts, terrorist activity, political unrest, civil strife, acts of war,travel or immigration restrictions, public corruption, expropriation and other economic or political uncertainties, including inaccuracies in ourassumptions about these factors, could interrupt and negatively affect our business operations or customer demand. High unemployment or theslowdown in economic growth in some markets could constrain consumer spending. Declining consumer purchasing power could result in loss ofmarket share and adversely impact our profitability. Continued instability in the banking and governmental sectors of certain countries or thedynamics and uncertainties associated with the United Kingdom’s planned exit from the European Union (“Brexit”) could have a negative effect onour business. (See below and Management’s Discussion and Analysis of Financial Condition and Results of Operations - Financial Outlook formore information on Brexit.)
All of these factors could result in increased costs or decreased revenues, and could materially and adversely affect our product sales, financialcondition, results of operations, and our relationships with customers, suppliers and employees in the short or long term.
Tax matters, including changes in tax laws and rates, disagreements with taxing authorities and imposition of new taxes, couldadversely impact our results of operations and financial condition.
In December 2017, the United States enacted tax reform legislation (“U.S. tax reform”). The legislation implements many new U.S. domestic andinternational tax provisions. Many aspects of U.S. tax reform remain unclear, and although additional clarifying guidance is expected to be issued(by the Internal Revenue Service (“IRS”), the U.S. Treasury Department or via a technical correction law change), it may not be clarified for sometime. In addition, a number of U.S. states have not yet updated their laws to take into account the new federal legislation. As a result, there maybe further impacts of the new law on our results of operations and financial condition. It is possible that U.S. tax reform, or interpretations under it,could change and could have an adverse effect on us, and such effect could be material.
In addition, foreign jurisdictions may enact tax legislation that could significantly affect our ongoing operations. For example, foreign tax authoritiescould impose rate changes along with additional corporate tax provisions that would disallow or tax perceived base erosion or profit shiftingpayments or subject us to new types of taxes such as digital taxes. Aspects of U.S. tax reform may lead foreign jurisdictions to respond byenacting additional tax legislation that is unfavorable to us.
Adverse changes in the underlying profitability or financial outlook of our operations in several jurisdictions could lead to changes in the realizabilityof our deferred tax assets and result in a charge to our income tax provision. Additionally, changes in tax laws in the U.S. or in other countrieswhere we have significant operations could materially affect deferred tax assets and liabilities and our income tax provision.
We are also subject to tax audits by governmental authorities. Although we believe our tax estimates are reasonable, if a taxing authoritydisagrees with the positions we have taken, we could face additional tax liabilities, including interest and penalties. Unexpected results from one ormore such tax audits could significantly adversely affect our income tax provision and our results of operations.
Our operations in certain emerging markets expose us to political, economic and regulatory risks.
Our growth strategy depends in part on our ability to expand our operations in emerging markets, including among others Brazil, China, India,Mexico, Russia, Argentina, the Middle East, Africa, Southeast Asia and Ukraine. However, some emerging markets have greater political,economic and currency volatility and greater vulnerability to infrastructure and labor disruptions than more established markets. In many countries,particularly those with emerging economies, engaging in business practices prohibited by laws and regulations with extraterritorial reach, such asthe FCPA and the U.K. Bribery Act, or local anti-bribery laws may be more common. These laws generally prohibit companies and theiremployees, contractors or agents from making improper payments to government officials, including in connection with obtaining permits orengaging in other actions necessary to do business. Failure to comply with these laws could subject us to civil and criminal penalties that couldmaterially and adversely affect our reputation, financial condition and results of operations.
In addition, competition in emerging markets is increasing as our competitors grow their global operations and low cost local manufacturersimprove and expand their production capacities. Our success in emerging markets is critical to achieving our growth strategy. If we cannotsuccessfully increase our business in emerging markets and
13
Table of Contents
manage associated political, economic and regulatory risks, our product sales, financial condition and results of operations could be adverselyaffected.
Our use of information technology and third-party service providers exposes us to cybersecurity breaches and other businessdisruptions that could adversely affect us.
We use information technology and third party service providers to support our global business processes and activities, including supportingcritical business operations such as manufacturing and distribution; communicating with our suppliers, customers and employees; maintainingeffective accounting processes and financial and disclosure controls; executing mergers and acquisitions and other corporate transactions;conducting research and development activities; meeting regulatory, legal and tax requirements; and executing various digital marketing andconsumer promotion activities. Global shared service centers managed by third parties provide an increasing amount of services important toconducting our business, including a number of accounting, internal control, human resources and computing functions.
Continuity of business applications and services has been, and may in the future be, disrupted by events such as infection by viruses or malware,including a malware incident in June 2017 that affected a significant portion of our global sales, distribution and financial networks (the “malwareincident”) (see Management’s Discussion and Analysis of Financial Condition and Results of Operations - Significant Items AffectingComparability - Malware Incident); other cybersecurity attacks; issues with or errors in systems’ maintenance or security; power outages; hardwareor software failures; denial of service attacks; telecommunication failures; natural disasters; terrorist attacks; and other catastrophic occurrences.Our use of new and emerging technologies such as cloud-based services and mobile applications continues to evolve, presenting new andadditional risks in managing access to our data, relying on third-parties to manage and safeguard data, ensuring access to our systems andavailability of third-party systems.
Cybersecurity breaches of our or third party systems, whether from circumvention of security systems, denial-of-service attacks or othercyberattacks such as hacking, phishing attacks, computer viruses, ransomware or malware, employee or insider error, malfeasance, socialengineering, physical breaches or other actions may cause confidential information belonging to us or our employees, customers, consumers,partners, suppliers, or governmental or regulatory authorities to be misused or breached. When risks such as these materialize, the need for us tocoordinate with various third-party service providers and for third party service providers to coordinate amongst themselves might increasechallenges and costs to resolve related issues. Additionally, if new initiatives, such as those related to e-commerce and direct sales, increase theamount of confidential information that we process and maintain, it could increase our potential exposure from a cybersecurity breach. If ourcontrols, disaster recovery and business continuity plans or those of our third-party providers do not effectively respond to or resolve the issuesrelated to any such disruptions in a timely manner, our product sales, financial condition and results of operations may be materially and adverselyaffected, and we might experience delays in reporting our financial results, loss of intellectual property and damage to our reputation or brands.
We continue to devote focused resources to network security, backup and disaster recovery, enhanced training and other security measures toprotect our systems and data, such as advanced email protection to reduce the likelihood of credential thefts and electronic fraud attempts. Wealso focus on enhancing the monitoring and detection of threats in our environment, including but not limited to the manufacturing environment andoperational technologies, as well as adjusting information security controls based on the updated threat. However, security measures cannotprovide absolute security or guarantee that we will be successful in preventing or responding to every breach or disruption on a timely basis. Dueto the constantly evolving and complex nature of security threats, we cannot predict the form and impact of any future incident, and the cost andoperational expense of implementing, maintaining and enhancing protective measures to guard against increasingly complex and sophisticatedcyber threats could increase significantly.
We regularly move data across national borders to conduct our operations, and we are subject to a variety of continuously evolving and developinglaws and regulations in numerous jurisdictions regarding privacy, data protection and data security, including those related to the collection,storage, handling, use, disclosure, transfer and security of personal data. Privacy and data protection laws may be interpreted and applieddifferently from country to country and may create inconsistent or conflicting requirements. The European Union’s General Data ProtectionRegulation (“GDPR”), which greatly increases the jurisdictional reach of European Union law and became effective in May 2018, adds a broad arrayof requirements for handling personal data including the public disclosure of significant data breaches, and imposes substantial penalties for non-compliance of up to the greater of
14
Table of Contents
€20 million or 4% of global annual revenue for the preceding financial year. Our efforts to comply with GDPR and other privacy and data protectionlaws may impose significant costs and challenges that are likely to increase over time, and we could incur substantial penalties or litigation relatedto violation of existing or future data privacy laws and regulations.
Unanticipated business disruptions could adversely affect our ability to provide our products to our customers.
We manufacture and source products and materials on a global scale. We utilize an integrated supply chain - a complex network of suppliers andmaterial needs, owned manufacturing locations, co-manufacturing locations, distribution networks, shared service delivery centers and informationsystems that support our ability to provide our products to our customers consistently. Factors that are hard to predict or beyond our control, likeweather (including any potential effects of climate change), natural disasters, supply and commodity shortages, fire, explosions, terrorism, politicalunrest, cybersecurity breaches, generalized labor unrest or health pandemics could damage or disrupt our operations or those of our suppliers,their suppliers or our co-manufacturers. If we do not effectively plan for and respond to disruptions in our operations, for example, by findingalternative suppliers or replacing capacity at key or sole manufacturing or distribution locations, or cannot quickly repair damage to our information,production or supply systems, we may be late in delivering or unable to deliver products to our customers such as occurred in connection with themalware incident (see Management’s Discussion and Analysis of Financial Condition and Results of Operations - Significant Items AffectingComparability - Malware Incident), and the quality and safety of our products might be negatively affected. If a material or extended disruptionoccurs, we may lose our customers’ or business partners’ confidence or suffer damage to our reputation, and long-term consumer demand for ourproducts could decline. In addition, we might not have the functions, processes or organizational capability necessary to achieve on ouranticipated timeframes our strategic ambition to reconfigure our supply chain and continue to drive efficiencies to fuel growth. Further, our ability tosupply multiple markets with a streamlined manufacturing footprint may be negatively impacted by portfolio complexity, significant changes intrade policies, changes in volume produced and changes to regulatory restrictions or labor-related constraints on our ability to adjust productioncapacity in the markets in which we operate. These events could materially and adversely affect our product sales, financial condition and resultsof operations.
We are subject to currency exchange rate fluctuations.
At December 31, 2018, we sold our products in over 150 countries and had operations in more than 80 countries. Consequently, a significantportion of our business is exposed to currency exchange rate fluctuations. Our financial results and capital ratios are sensitive to movements incurrency exchange rates because a large portion of our assets, liabilities, revenue and expenses must be translated into U.S. dollars for reportingpurposes or converted into U.S. dollars to service obligations such as our U.S. dollar-denominated indebtedness and to pay dividends to ourshareholders. In addition, movements in currency exchange rates can affect transaction costs because we source product ingredients fromvarious countries. We seek to mitigate our exposure to exchange rate fluctuations, primarily on cross-currency transactions, but our efforts maynot be successful. We hedge a number of risks including exposures to foreign exchange rate movements and volatility of interest rates that couldimpact our future borrowing costs. Hedging of these risks could potentially subject us to counter-party credit risk. In addition, local economies,monetary policies and currency hedging availability can affect our ability to hedge against currency-related economic losses. We might not be ableto successfully mitigate our exposure to currency risks due to factors such as continued global and local market volatility, actions by foreigngovernments, political uncertainty, inflation and limited hedging opportunities. Accordingly, changes in the currency exchange rates that we use totranslate our results into U.S. dollars for financial reporting purposes or for transactions involving multiple currencies could materially andadversely affect future demand for our products, our financial condition and results of operations, and our relationships with customers, suppliersand employees in the short or long-term.
Commodity and other input prices are volatile and may increase or decrease significantly or availability of commodities may becomeconstrained.
We purchase and use large quantities of commodities, including cocoa, dairy, wheat, palm and other vegetable oils, sugar and other sweeteners,flavoring agents and nuts. In addition, we purchase and use significant quantities of product packaging materials, natural gas, fuel and electricityfor our factories and warehouses, and we also incur expenses in connection with the transportation and delivery of our products. Prices for rawmaterials, other supplies and services and energy are volatile and can fluctuate due to conditions that are difficult to predict. These conditionsinclude global competition for resources, currency fluctuations, geopolitical conditions or conflicts, tariffs
15
Table of Contents
or other trade barriers, severe weather, the potential longer-term consequences of climate change on agricultural productivity, crop disease orpests, water risk, health pandemics, consumer or industrial demand, and changes in governmental trade, alternative energy and agriculturalprograms. Increasing focus on climate change, deforestation, water, plastic waste, animal welfare and human rights concerns and other risksassociated with the global food system may lead to increased government intervention and consumer or activist responses, and could adverselyaffect our or our suppliers’ reputation and business and our ability to procure the materials we need to operate our business. Some of thecommodities we purchase are grown by smallholder farmers, and they might lack the capacity to invest to increase productivity or adapt tochanging conditions. Although we monitor our exposure to commodity prices and hedge against input price increases, we cannot fully hedgeagainst changes in commodity costs, and our hedging strategies may not protect us from increases in specific raw material costs. Continuedvolatility in the prices of commodities and other supplies we purchase or changes in the types of commodities we purchase as we continue toevolve our product and packaging portfolio could increase or decrease the costs of our products, and our profitability could suffer as a result.Moreover, increases in the price of our products, including increases to cover higher input, packaging and transportation costs, may result in lowersales volumes, while decreases in input costs could require us to lower our prices and thereby affect our revenues, profits or margins. Likewise,constraints in the supply or availability of key commodities, including necessary services such as transportation, may limit our ability to grow ournet revenues and earnings. If our mitigation activities are not effective, if we are unable to price to cover increased costs or must reduce ourprices, or if we are limited by supply or distribution constraints, our financial condition and results of operations could be materially adverselyaffected.
Complying with changes in and inconsistencies among laws and regulations in many countries in which we operate could increase ourcosts.
Our activities throughout the world are highly regulated and subject to government oversight. Various laws and regulations govern food production,packaging, storage, distribution, sales, advertising, labeling and marketing, as well as licensing, trade, labor, tax and environmental matters,privacy, and health and safety practices. Government authorities regularly change laws and regulations as well as their interpretations. Ourcompliance with new or revised laws and regulations or the interpretation and application of existing laws and regulations could materially andadversely affect our product sales, financial condition and results of operations. For instance, our financial condition and results of operationscould be negatively affected by the regulatory and economic impact of changes in taxation and trade relations among the United States and othercountries, including a new United States-Mexico-Canada Agreement, China or changes in the European Union such as Brexit.
We continue to monitor Brexit and its potential impacts on our results of operations and financial condition. Volatility in foreign currencies isexpected to continue as the United Kingdom executes its exit from the European Union. If the United Kingdom's membership in the EuropeanUnion terminates in March 2019 without an agreement, there could be increased costs from re-imposition of tariffs on trade between the UnitedKingdom and European Union, shipping delays because of the need for customs inspections and procedures and shortages of certain goods. TheUnited Kingdom will also need to negotiate its own tax and trade treaties with countries all over the world, which could take years to complete. Thispotential scenario is usually referred to as a “hard Brexit.” In the case of a hard Brexit, our exposure to disruptions to our supply chain, theimposition of tariffs and currency devaluation in the U.K. could result in a material impact to our consolidated revenue, earnings and cash flow. In2018, we generated 8.6% of our net revenues in the United Kingdom and our supply chain in this market relies on imports of raw and packagingmaterials as well as finished goods. (See Management’s Discussion and Analysis of Financial Condition and Results of Operations - FinancialOutlook for more information on Brexit.)
We may be unable to hire or retain and develop key personnel or a highly skilled and diverse global workforce or manage changes inour workforce.
We must hire, retain and develop effective leaders and a highly skilled and diverse global workforce. We compete to hire new personnel with avariety of capabilities in the many countries in which we manufacture and market our products and then to develop and retain their skills andcompetencies. Unplanned turnover, failure to attract and develop personnel with key emerging capabilities such as e-commerce and digitalmarketing skills, or failure to develop adequate succession plans for leadership positions or to hire and retain a workforce with the skills and in thelocations we need to operate and grow our business could deplete our institutional knowledge base and erode our competitiveness. Changes in ouroperating model and business processes, including building a winning growth culture, implementing our “local first” commercial approach, utilizingour global shared services capability and reconfiguring our supply chain, could lead to operational challenges, increased competition for employeeswith the skills we require to achieve our business goals and higher employee turnover, including of employees with key
16
Table of Contents
capabilities. Failure to achieve a more diverse workforce and leadership team, compensate our employees competitively and fairly or maintain asafe and inclusive environment could affect our reputation and also result in lower performance and an inability to retain valuable employees.
We might be unable to manage appropriately changes in, or that affect, our workforce or satisfy the legal requirements associated with how wemanage and compensate our employees. This includes our management of employees represented by labor unions or workers’ councils, whorepresent approximately 60% of our 68,000 employees outside the United States and approximately 28% of our 12,000 U.S. employees. Strikes,work stoppages or other forms of labor unrest by our employees or those of our suppliers or distributors, or situations like the renegotiation ofcollective bargaining agreements that expired in February 2016 and that cover eight U.S. facilities, could cause disruptions to our supply chain,manufacturing or distribution processes. Changes in immigration laws and policies, including in connection with Brexit, could also make it moredifficult for us to recruit or relocate skilled employees.
These risks could materially and adversely affect our reputation, ability to meet the needs of our customers, product sales, financial condition andresults of operations.
Our retail customers are consolidating and we must leverage our value proposition in order to compete against retailer and othereconomy brands.
Retail customers, such as supermarkets, discounters, e-commerce merchants, warehouse clubs and food distributors in the European Union, theUnited States and other major markets, continue to consolidate, form buying alliances or be acquired by new entrants in the food retail market,resulting in fewer, larger customers. Large retail customers and customer alliances can delist our products or reduce the shelf space allotted to ourproducts and demand lower pricing, increased promotional programs or longer payment terms. Retail customers might also adopt these tactics intheir dealings with us in response to the significant growth in online retailing for consumer products, which is outpacing the growth of traditionalretail channels. The continued growth of e-commerce and the increasing prevalence of business-to-business e-commerce could lead to furtherconsolidation as these new suppliers enhance their regional and local distribution networks in order to achieve national distribution capability. Inaddition, larger retail customers have the scale to develop supply chains that permit them to operate with reduced inventories or to develop andmarket their own retailer and other economy brands that compete with some of our products. Our products must provide higher quality or value toour consumers than the less expensive alternatives, particularly during periods of economic uncertainty. Consumers may not buy our products ifconsumers perceive little difference between the quality or value of our products and those of retailer or other economy brands. If consumersswitch to purchasing or otherwise prefer the retailer or other economy brands, then we could lose market share or sales volumes, or we may needto shift our product mix to lower margin offerings.
Retail consolidation also increases the risk that adverse changes in our customers’ business operations or financial performance will have acorresponding material adverse effect on us. For example, if our customers cannot access sufficient funds or financing, then they may delay,decrease or cancel purchases of our products, or delay or fail to pay us for previous purchases.
If we do not effectively respond to retail consolidation, increasing retail power and competition from retailer and other economy brands, ourreputation, brands, product sales, financial condition and results of operations could be materially and adversely affected.
We are subject to changes in our relationships with significant customers, suppliers or distributors.
During 2018, our five largest customers accounted for 16.8% of our net revenues. There can be no assurance that our customers will continue topurchase our products in the same mix or quantities or on the same terms as in the past, particularly as increasingly powerful retailers continue todemand lower pricing and develop their own brands. The loss of or disruptions related to significant customers could result in a material reductionin sales or change in the mix of products we sell to a significant customer. This could materially and adversely affect our product sales, financialcondition and results of operations.
Additionally, disputes with significant suppliers or distributors, including disputes related to pricing or performance, could adversely affect ourability to supply or deliver products to our customers or operate our business and could materially and adversely affect our product sales, financialcondition and results of operations.
17
Table of Contents
We may decide or be required to recall products or be subjected to product liability claims.
We could decide, or laws or regulations could require us, to recall products due to suspected or confirmed deliberate or unintentional productcontamination, including contamination of ingredients we use in our products that third parties supply, spoilage or other adulteration, productmislabeling or product tampering. In addition, if another company recalls or experiences negative publicity related to a product in a category inwhich we compete, consumers might reduce their overall consumption of products in this category. Any of these events could materially andadversely affect our reputation, brands, product sales, financial condition and results of operations.
We may also suffer losses if our products or operations or those of our suppliers violate applicable laws or regulations, or if our or our suppliers’products cause injury, illness or death. In addition, our marketing could face claims of false or deceptive advertising or other criticism. Asignificant product liability or other legal judgment against us, a related regulatory enforcement action, a widespread product recall or attempts tomanipulate us based on threats related to the safety of our products could materially and adversely affect our reputation and profitability.Moreover, even if a product liability, consumer fraud or other claim is unsuccessful, has no merit or is not pursued, the negative publicitysurrounding assertions against our products or processes could materially and adversely affect our reputation, brands, product sales, productinventory, financial condition and results of operations.
We could be subject to legal or tax claims or other regulatory enforcement actions.
We are a large snack food company operating in highly regulated environments and constantly evolving legal, tax and regulatory frameworksaround the world. Consequently, we are subject to greater risk of litigation, legal or tax claims, or other regulatory enforcement actions. There canbe no assurance that our employees, contractors or agents will not violate policies and procedures we have implemented to promote compliancewith existing laws and regulations. Moreover, a failure to maintain effective control environment processes, including in connection with our globalshared services capability, could lead to violations, unintentional or otherwise, of laws and regulations. Litigation, legal or tax claims, or regulatoryenforcement actions arising out of our failure or alleged failure to comply with applicable laws, regulations or controls, could subject us to civil andcriminal penalties that could materially and adversely affect our reputation, product sales, financial condition and results of operations.
We may not successfully identify, complete or manage strategic transactions.
We regularly evaluate a variety of potential strategic transactions, including acquisitions, divestitures, joint ventures, equity method investmentsand other strategic alliances that could further our strategic business objectives. We may not successfully identify, complete or manage the riskspresented by these strategic transactions. Our success depends, in part, upon our ability to identify suitable transactions; negotiate favorablecontractual terms; comply with applicable regulations and receive necessary consents, clearances and approvals (including regulatory andantitrust clearances and approvals); integrate or separate businesses; realize the full extent of the benefits, cost savings or synergies presentedby strategic transactions; effectively implement control environment processes with employees joining us as a result of a transaction; minimizeadverse effects on existing business relationships with suppliers and customers; achieve accurate estimates of fair value; minimize potential lossof customers or key employees; and minimize indemnities and potential disputes with buyers, sellers and strategic partners. In addition, executionor oversight of strategic transactions may result in the diversion of management attention from our existing business and may present financial,managerial and operational risks.
With respect to acquisitions and joint ventures in particular, we are also exposed to potential risks based on our ability to conform standards,controls, policies and procedures, and business cultures; consolidate and streamline operations and infrastructures; identify and eliminate, asappropriate, redundant and underperforming operations and assets; manage inefficiencies associated with the integration of operations; andcoordinate timely and ongoing compliance with antitrust and competition laws in the United States, the European Union and other jurisdictions.Joint ventures and similar strategic alliances pose additional risks, as we share ownership in both public and private companies and in somecases management responsibilities with one or more other parties whose objectives for the alliance may diverge from ours over time, who may nothave the same priorities, strategies or resources as we do, or whose interpretation of applicable policies may differ from our own. Transactions orventures into which we enter might not meet our financial and non-financial control and compliance expectations or yield the anticipated benefits.Depending on the nature of the business ventures, including whether they operate globally, these ventures could also be subject to many of thesame risks we are, including political, economic, regulatory and compliance risks, currency exchange rate fluctuations, and volatility of commodityand other input prices. Either partner might fail to
18
Table of Contents
recognize an alliance relationship that could expose the business to higher risk or make the venture not as productive as expected.
Furthermore, we may not be able to complete, on terms favorable to us, desired or proposed divestitures of businesses that do not meet ourstrategic objectives or our growth or profitability targets. Our divestiture activities, or related activities such as reorganizations, restructuringprograms and transformation initiatives, may require us to recognize impairment charges or to take action to reduce costs that remain after wecomplete a divestiture. Gains or losses on the sales of, or lost operating income from, those businesses may also affect our profitability.
Any of these risks could materially and adversely affect our business, product sales, financial condition and results of operations.
We could fail to maintain effective internal control over financial reporting.
The accuracy of our financial reporting depends on the effectiveness of our internal control over financial reporting. Internal control over financialreporting can provide only reasonable assurance with respect to the preparation and fair presentation of financial statements and may not preventor detect misstatements because of its inherent limitations. These limitations include, among others, the possibility of human error, inadequacy orcircumvention of controls and fraud. If we do not maintain effective internal control over financial reporting or design and implement controlssufficient to provide reasonable assurance with respect to the preparation and fair presentation of our financial statements, including in connectionwith controls executed for us by third parties, we might fail to timely detect any misappropriation of corporate assets or inappropriate allocation oruse of funds and could be unable to file accurate financial reports on a timely basis. As a result, our reputation, results of operations and stockprice could be materially adversely affected.
Weak financial performance, downgrades in our credit ratings, illiquid global capital markets and volatile global economic conditionscould limit our access to the global capital markets, reduce our liquidity and increase our borrowing costs.
We access the long-term and short-term global capital markets to obtain financing. Our financial performance, our short-and long-term debt creditratings, interest rates, the stability of financial institutions with which we partner, the liquidity of the overall global capital markets and the state ofthe global economy, including the food industry, could affect our access to, and the availability or cost of, financing on acceptable terms andconditions and our ability to pay dividends in the future. There can be no assurance that we will have access to the global capital markets onterms we find acceptable.
We regularly access the commercial paper markets in the United States and Europe for ongoing funding requirements. A downgrade in our creditratings by a credit rating agency could increase our borrowing costs and adversely affect our ability to issue commercial paper. Disruptions in theglobal commercial paper market or other effects of volatile economic conditions on the global credit markets also could reduce the amount ofcommercial paper that we could issue and raise our borrowing costs for both short- and long-term debt offerings.
Limitations on our ability to access the global capital markets, a reduction in our liquidity or an increase in our borrowing costs could materially andadversely affect our financial condition and results of operations.
Volatility in the equity markets, interest rates, our participation in multiemployer pension plans and other factors could increase ourcosts relating to our employees’ pensions.
We sponsor a number of defined benefit pension plans for our employees throughout the world and also contribute toward our employees’ pensionsunder defined benefit plans that we do not sponsor. At the end of 2018, the projected benefit obligation of the defined benefit pension plans wesponsor was $11.1 billion and plan assets were $10.0 billion.
For defined benefit pension plans that we maintain, the difference between plan obligations and assets, or the funded status of the plans,significantly affects the net periodic benefit costs of our pension plans and the ongoing funding requirements of those plans. Our largest fundeddefined benefit pension plans are funded with trust assets invested in a globally diversified portfolio of investments, including equities andcorporate and government debt. Among other factors, changes in interest rates, mortality rates, early retirement rates, investment returns, fundingrequirements in the jurisdictions in which the plans operate and the market value of plan assets can affect the level
19
Table of Contents
of plan funding, cause volatility in the net periodic pension cost and increase our future funding requirements. Legislative and other governmentalregulatory actions may also increase funding requirements for our pension plans’ benefits obligation. Volatility in the global capital markets mayincrease the risk that we will be required to make additional cash contributions to the pension plans and recognize further increases in our netperiodic pension cost.
We also participate in multiemployer pension plans for certain U.S. represented employees. As a participating employer under multiemployerpension plans, we may owe more than the contributions we are required to make under the applicable collective bargaining agreements. Forexample, if we partially or completely withdraw from a multiemployer pension plan, we may be required to pay a partial or complete withdrawalliability. This withdrawal liability will generally increase if there is also a mass withdrawal of other participating employers or if the plan terminates.In the fourth quarter of 2018, we executed a complete withdrawal from the Bakery and Confectionery Union and Industry International PensionFund (the “Fund”). We estimated a withdrawal liability of $573 million, which represents our best estimate of the withdrawal liability absent anassessment from the Fund. We anticipate receiving an assessment in 2019, and the ultimate withdrawal liability may change from the currentlyestimated amount. We expect to pay the liability over a period of 20 years from the date of the assessment. In 2018, we recorded a $423 milliondiscounted liability and $6 million of accrued interest to date and related charges in earnings. See Note 10, Benefit Plans, to the consolidatedfinancial statements for more information on our multiemployer pension plans.
A significant increase in our pension benefit obligations or funding requirements could curtail our ability to invest in the business and adverselyaffect our financial condition and results of operations.
Our failure to protect our valuable intellectual property rights could reduce the value of our products and brands.
We consider our intellectual property rights, particularly and most notably our trademarks, but also our patents, trade secrets, copyrights andlicensing agreements, to be a significant and valuable part of our business. We attempt to protect our intellectual property rights by takingadvantage of a combination of patent, trademark, copyright and trade secret laws in various countries, as well as licensing agreements, third partynondisclosure and assignment agreements and policing of third party misuses of our intellectual property. Our failure to obtain or adequatelyprotect our intellectual property rights, or any change in law or other changes that serve to lessen or remove the current legal protections of ourintellectual property, may diminish our competitiveness and could materially harm our business.
We may be unaware of third party claims of intellectual property infringement relating to our technology, brands or products. Any litigation regardingpatents or other intellectual property could be costly and time-consuming and could divert management’s and other key personnel’s attention fromour business operations. Third party claims of intellectual property infringement might require us to pay monetary damages or enter into costlylicense agreements. We also may be subject to injunctions against development and sale of certain of our products. Any of these occurrencescould materially and adversely affect our reputation, ability to introduce new products or improve the quality of existing products, product sales,financial condition and results of operations.
Item 1B. Unresolved Staff Comments.
None.
20
Table of Contents
Item 2. Properties.
On December 31, 2018, we had approximately 132 manufacturing and processing facilities in 52 countries and 123 distribution centers and depotsworldwide. During 2018, we disposed of 6 manufacturing facilities mainly in business divestitures and we increased the number of distributionfacilities by 15 primarily due to the addition of several small storage locations included within the distribution centers we own or lease. In additionto our owned or leased properties listed below, we also utilize a highly distributed network of warehouses and distribution centers that are owned orleased by third party logistics partners, contract manufacturers, co-packers or other strategic partners. We believe we have or will add sufficientcapacity to meet our planned operating needs. It is our practice to maintain all of our plants and other facilities in good condition.
As of December 31, 2018
Number ofManufacturing
Facilities
Number ofDistribution
Facilities
Latin America (1) 16 5AMEA 44 25Europe 57 36North America 15 57Total 132 123
Owned 120 14Leased 12 109Total 132 123
(1) Excludes our deconsolidated Venezuela operations. Refer to Note 1, Summary of Significant Accounting Policies, for more information.
Item 3. Legal Proceedings.
Information regarding legal proceedings is available in Note 13, Commitments and Contingencies, to the consolidated financial statements in thisreport.
Item 4. Mine Safety Disclosures.
Not applicable.
21
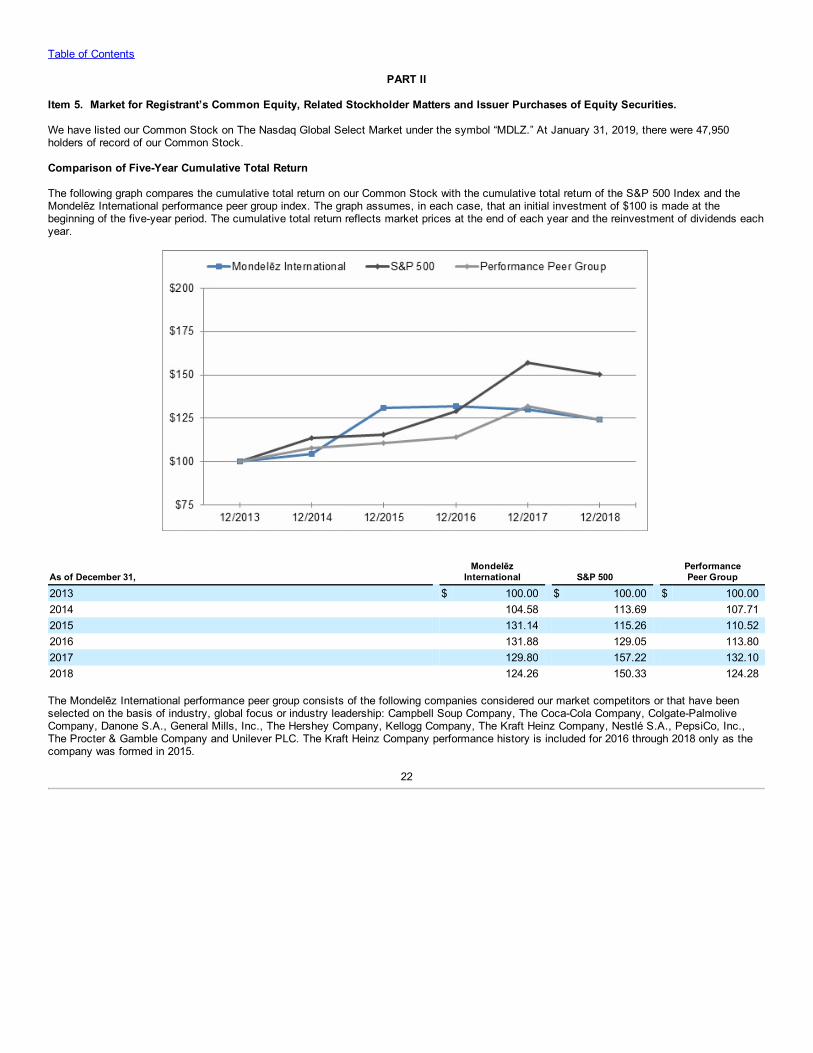
Table of Contents
PART II
Item 5. Market for Registrant’s Common Equity, Related Stockholder Matters and Issuer Purchases of Equity Securities.
We have listed our Common Stock on The Nasdaq Global Select Market under the symbol “MDLZ.” At January 31, 2019, there were 47,950holders of record of our Common Stock.
Comparison of Five-Year Cumulative Total Return
The following graph compares the cumulative total return on our Common Stock with the cumulative total return of the S&P 500 Index and theMondelēz International performance peer group index. The graph assumes, in each case, that an initial investment of $100 is made at thebeginning of the five-year period. The cumulative total return reflects market prices at the end of each year and the reinvestment of dividends eachyear.
As of December 31, Mondelēz
International S&P 500 Performance Peer Group
2013 $ 100.00 $ 100.00 $ 100.002014 104.58 113.69 107.712015 131.14 115.26 110.522016 131.88 129.05 113.802017 129.80 157.22 132.102018 124.26 150.33 124.28
The Mondelēz International performance peer group consists of the following companies considered our market competitors or that have beenselected on the basis of industry, global focus or industry leadership: Campbell Soup Company, The Coca-Cola Company, Colgate-PalmoliveCompany, Danone S.A., General Mills, Inc., The Hershey Company, Kellogg Company, The Kraft Heinz Company, Nestlé S.A., PepsiCo, Inc.,The Procter & Gamble Company and Unilever PLC. The Kraft Heinz Company performance history is included for 2016 through 2018 only as thecompany was formed in 2015.
22
Table of Contents
Issuer Purchases of Equity Securities
Our stock repurchase activity for each of the three months in the quarter ended December 31, 2018 was:
Period Total Number of Shares
Purchased (1) Average Price Paid
per Share (1)
Total Number of SharesPurchased as
Part of PubliclyAnnounced Plans or
Programs (2)
Approximate Dollar Value ofShares That May Yet Be
Purchased Under the Plansor Programs (2)
October 1-31, 2018 3,397,244 $ 41.72 3,346,525 $ 4,869November 1-30, 2018 3,416,398 43.97 3,369,178 4,721December 1-31, 2018 1,587,127 44.24 1,585,745 4,650For the Quarter Ended
December 31, 2018 8,400,769 43.11 8,301,448
(1) The total number of shares purchased (and the average price paid per share) reflects: (i) shares purchased pursuant to the repurchase program
described in (2) below; and (ii) shares tendered to us by employees who used shares to exercise options and to pay the related taxes for grants ofrestricted stock and deferred stock units that vested, totaling 50,719 shares, 47,220 shares and 1,382 shares for the fiscal months of October, Novemberand December 2018, respectively.
(2) Dollar values stated in millions. Our Board of Directors has authorized the repurchase of $19.7 billion of our Common Stock through December 31, 2020.Specifically, on March 12, 2013, our Board of Directors authorized the repurchase of up to the lesser of 40 million shares or $1.2 billion of our CommonStock through March 12, 2016. On August 6, 2013, our Audit Committee, with authorization delegated from our Board of Directors, increased therepurchase program capacity to $6.0 billion of Common Stock repurchases and extended the expiration date to December 31, 2016. On December 3,2013, our Board of Directors approved an increase of $1.7 billion to the program related to a new accelerated share repurchase program, whichconcluded in May 2014. On July 29, 2015, our Finance Committee, with authorization delegated from our Board of Directors, approved a $6.0 billionincrease that raised the repurchase program capacity to $13.7 billion and extended the program through December 31, 2018. On January 31, 2018 ourFinance Committee, with authorization delegated from our Board of Directors, approved an increase of $6.0 billion in the share repurchase program,raising the authorization to $19.7 billion of Common Stock repurchases, and extended the program through December 31, 2020. See related informationin Note 12, Capital Stock.
23
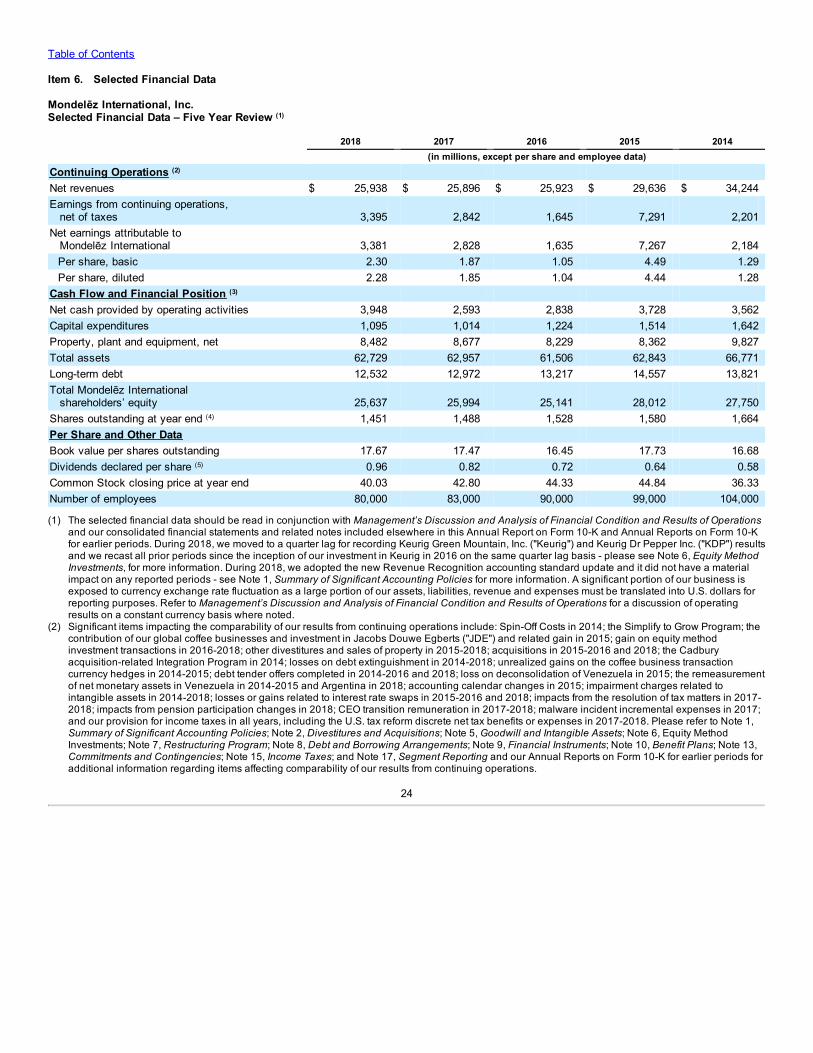
Table of Contents
Item 6. Selected Financial Data
Mondelēz International, Inc.Selected Financial Data – Five Year Review (1)
2018 2017 2016 2015 2014 (in millions, except per share and employee data)Continuing Operations (2) Net revenues $ 25,938 $ 25,896 $ 25,923 $ 29,636 $ 34,244Earnings from continuing operations, net of taxes 3,395 2,842 1,645 7,291 2,201Net earnings attributable to Mondelēz International 3,381 2,828 1,635 7,267 2,184
Per share, basic 2.30 1.87 1.05 4.49 1.29Per share, diluted 2.28 1.85 1.04 4.44 1.28
Cash Flow and Financial Position (3) Net cash provided by operating activities 3,948 2,593 2,838 3,728 3,562Capital expenditures 1,095 1,014 1,224 1,514 1,642Property, plant and equipment, net 8,482 8,677 8,229 8,362 9,827Total assets 62,729 62,957 61,506 62,843 66,771Long-term debt 12,532 12,972 13,217 14,557 13,821Total Mondelēz International shareholders’ equity 25,637 25,994 25,141 28,012 27,750Shares outstanding at year end (4) 1,451 1,488 1,528 1,580 1,664Per Share and Other Data Book value per shares outstanding 17.67 17.47 16.45 17.73 16.68Dividends declared per share (5) 0.96 0.82 0.72 0.64 0.58Common Stock closing price at year end 40.03 42.80 44.33 44.84 36.33Number of employees 80,000 83,000 90,000 99,000 104,000 (1) The selected financial data should be read in conjunction with Management’s Discussion and Analysis of Financial Condition and Results of Operations
and our consolidated financial statements and related notes included elsewhere in this Annual Report on Form 10-K and Annual Reports on Form 10-Kfor earlier periods. During 2018, we moved to a quarter lag for recording Keurig Green Mountain, Inc. ("Keurig") and Keurig Dr Pepper Inc. ("KDP") resultsand we recast all prior periods since the inception of our investment in Keurig in 2016 on the same quarter lag basis - please see Note 6, Equity MethodInvestments, for more information. During 2018, we adopted the new Revenue Recognition accounting standard update and it did not have a materialimpact on any reported periods - see Note 1, Summary of Significant Accounting Policies for more information. A significant portion of our business isexposed to currency exchange rate fluctuation as a large portion of our assets, liabilities, revenue and expenses must be translated into U.S. dollars forreporting purposes. Refer to Management’s Discussion and Analysis of Financial Condition and Results of Operations for a discussion of operatingresults on a constant currency basis where noted.
(2) Significant items impacting the comparability of our results from continuing operations include: Spin-Off Costs in 2014; the Simplify to Grow Program; thecontribution of our global coffee businesses and investment in Jacobs Douwe Egberts ("JDE") and related gain in 2015; gain on equity methodinvestment transactions in 2016-2018; other divestitures and sales of property in 2015-2018; acquisitions in 2015-2016 and 2018; the Cadburyacquisition-related Integration Program in 2014; losses on debt extinguishment in 2014-2018; unrealized gains on the coffee business transactioncurrency hedges in 2014-2015; debt tender offers completed in 2014-2016 and 2018; loss on deconsolidation of Venezuela in 2015; the remeasurementof net monetary assets in Venezuela in 2014-2015 and Argentina in 2018; accounting calendar changes in 2015; impairment charges related tointangible assets in 2014-2018; losses or gains related to interest rate swaps in 2015-2016 and 2018; impacts from the resolution of tax matters in 2017-2018; impacts from pension participation changes in 2018; CEO transition remuneration in 2017-2018; malware incident incremental expenses in 2017;and our provision for income taxes in all years, including the U.S. tax reform discrete net tax benefits or expenses in 2017-2018. Please refer to Note 1,Summary of Significant Accounting Policies; Note 2, Divestitures and Acquisitions; Note 5, Goodwill and Intangible Assets; Note 6, Equity MethodInvestments; Note 7, Restructuring Program; Note 8, Debt and Borrowing Arrangements; Note 9, Financial Instruments; Note 10, Benefit Plans; Note 13,Commitments and Contingencies; Note 15, Income Taxes; and Note 17, Segment Reporting and our Annual Reports on Form 10-K for earlier periods foradditional information regarding items affecting comparability of our results from continuing operations.
24

Table of Contents
(3) Items impacting comparability primarily relate to the Keurig and JDE coffee business transactions in 2014-2016 and the loss on deconsolidation ofVenezuela in 2015. Beginning in 2015, debt issuance costs related to recognized debt liabilities were recorded as a deduction from the related debtobligations instead of as long-term other assets on the consolidated balance sheet and we made this reclassification in the prior period presented forconsistency. Please also refer to our previously filed Annual Reports on Form 10-K for additional information.
(4) Refer to Note 12, Capital Stock, for additional information on our share repurchase program activity.(5) Refer to the Equity and Dividends section within Management’s Discussion and Analysis of Financial Condition and Results of Operations for information
on our dividends.
25
Table of Contents
Item 7. Management’s Discussion and Analysis of Financial Condition and Results of Operations.
The following discussion and analysis contains forward-looking statements. It should be read in conjunction with the other sections of this AnnualReport on Form 10-K, including the consolidated financial statements and related notes contained in Forward-Looking Statements and Item 1A,Risk Factors.
Description of the Company
We make and sell primarily snacks, including biscuits (cookies, crackers and salted snacks), chocolate, gum & candy as well as variouscheese & grocery and powdered beverage products. We have operations in more than 80 countries and sell our products in over 150 countries.
We aim to be the global leader in snacking. Our strategy is to drive long-term growth by focusing on three strategic priorities: acceleratingconsumer-centric growth, driving operational excellence and creating a winning growth culture. We believe the successful implementation of ourstrategic priorities and our leveraging our strong foundation of iconic global and local brands, an attractive global footprint, and deep innovation,marketing and distribution capabilities will drive top- and bottom-line growth, enabling us to continue to create long-term value for our shareholders.
Significant Items Affecting Comparability
Keurig Dr Pepper Transaction
On July 9, 2018, Keurig Green Mountain, Inc. ("Keurig") closed on its definitive merger agreement with Dr Pepper Snapple Group, Inc., and formedKeurig Dr Pepper Inc. (NYSE: "KDP"), a publicly traded company. Following the close of the transaction, our 24.2% investment in Keurig togetherwith our shareholder loan receivable became a 13.8% investment in KDP. During the third quarter of 2018, we recorded a preliminary pre-tax gainof $757 million reported as a gain on equity method transaction and $184 million of deferred tax expense reported in the provision for income taxes(or $573 million after-tax gain) related to the change in our ownership interest while KDP finalized the valuation for the transaction. During our fourthquarter of 2018, KDP finalized its opening balance sheet and we increased our pre-tax gain by $21 million (or $13 million after tax) to $778 million(or $586 million after tax) for 2018. We hold two director positions on the KDP board as well as additional governance rights. As we continue tohave significant influence, we continue to account for our investment in KDP under the equity method, resulting in recognizing our share of theirearnings within our earnings and our share of their dividends within our cash flows. In connection with this transaction, we changed our accountingprinciple to reflect our share of Keurig's historical and KDP's ongoing earnings on a one-quarter lag basis while we continue to record dividendswhen cash is received. We determined a lag was preferable as it enables us to continue to report our quarterly and annual results on a timely basisand to record our share of KDP’s ongoing results once KDP has publicly reported its results. This change in accounting principle was appliedretrospectively to all periods. While our operating income did not change, equity method investment net earnings, net earnings and earnings pershare have been adjusted to reflect the lag across all reported periods. Refer to Note 6, Equity Method Investments, for additional information.
U.S. Tax Reform
On December 22, 2017, the United States enacted tax reform legislation ("U.S. tax reform") that included a broad range of business tax provisions,including but not limited to a reduction in the U.S. federal tax rate from 35% to 21% as well as provisions that limit or eliminate various deductionsor credits. The legislation also causes U.S. allocated expenses (e.g. interest and general administrative expenses) to be taxed and imposes a newtax on U.S. cross-border payments. Furthermore, the legislation includes a one-time transition tax on accumulated foreign earnings and profits.While clarifying guidance was issued by the Internal Revenue Service (“IRS”) during 2018, further tax guidance is expected during 2019.
Certain impacts of the new legislation would have generally required accounting to be completed and incorporated into our 2017 year-end financialstatements, however in response to the complexities of this new legislation, the SEC issued guidance to provide companies with relief. The SECprovided up to a one-year window for companies to finalize the accounting for the impacts of this new legislation. We finalized our accounting forthe new provisions during the fourth quarter of 2018.
26
Table of Contents
The 2018 impact from finalizing the accounting for the new provisions was a discrete net tax expense of $19 million. The $19 million expense in2018 is primarily comprised of a $60 million expense related to finalizing the changes in our indefinite reinvestment assertion, partially offset by a$38 million decrease to the transition tax estimated as of December 31, 2017. Refer to Note 15, Income Taxes, for more information on the impactof U.S. tax reform.
Multiemployer Pension Plan Withdrawal
In the United States, we contribute to multiemployer pension plans based on obligations arising from our collective bargaining agreements. In 2017and 2016, the only individually significant multiemployer plan we contributed to was the Bakery and Confectionery Union and Industry InternationalPension Fund (the “Fund”). Our obligation to contribute to the Fund arose with respect to 8 collective bargaining agreements covering most of ouremployees represented by the Bakery, Confectionery, Tobacco and Grain Millers Union ("BCTGM"). All of those collective bargaining agreementsexpired in 2016.
In the fourth quarter of 2018, we executed a complete withdrawal from the Fund. We estimated a withdrawal liability of $573 million, whichrepresents our best estimate of the withdrawal liability absent an assessment from the Fund. We anticipate receiving an assessment in 2019, andthe ultimate withdrawal liability may change from the currently estimated amount. We will record any future adjustments in the period during whichthe liability is confirmed or as new information becomes available. We expect to pay the liability over a period of 20 years from the date of theassessment. During 2018, within our North America segment, we recorded a discounted liability and related charge of $423 million or $316 millionnet of tax. We determined the net present value of the liability using a risk-free interest rate. We recorded the pre-tax non-cash charges in selling,general and administrative expense (and in other non-cash items, net in the consolidated statement of cash flows) and the liability in long-termother liabilities. During 2018, we also recorded $6 million of accreted interest related to the long-term liability within interest and other expense, net.
Malware Incident
On June 27, 2017, a global malware incident impacted our business. The malware affected a significant portion of our global sales, distribution andfinancial networks. In the last four days of the second quarter and during the third quarter of 2017, we executed business continuity andcontingency plans to contain the impact, minimize damages and restore our systems environment. To date, we have not found, nor do we expectto find, any instances of Company or personal data released externally. We have also restored our main operating systems and processes andenhanced our system security.
For the second quarter of 2017, we estimated that the malware incident had a negative impact of 2.3% on our net revenue growth and 2.4% on ourOrganic Net Revenue growth and we also incurred incremental expenses of $7 million as a result of the incident. We recognized the majority ofdelayed second quarter shipments in our third quarter 2017 results, although we permanently lost some revenue. On a 2017 full-year basis, weestimated the loss of revenue had a negative impact of 0.4% on our net revenue and Organic Net Revenue growth. We also incurred totalincremental expenses of $84 million predominantly during the second half of 2017 as part of the recovery effort. The recovery from the incidentwas largely resolved by December 31, 2017 and we continued efforts to strengthen our security measures and enhance general informationtechnology, business process and disclosure controls.
27
Table of Contents
Summary of Results
• Net revenues were approximately $25.9 billion in both 2018 and 2017, an increase of 0.2% in 2018 and a decrease of 0.1% in 2017. In2018, net revenues grew due to higher net pricing and favorable volume/mix. Net revenues were also positively affected by the acquisitionof a U.S. premium biscuit company, Tate's Bake Shop, in 2018. Net revenue growth was negatively affected by the impact of unfavorablecurrency translation and the impact of several business divestitures that occurred in 2017 which reduced net revenues in 2018 ascompared to the prior year. In 2017, net revenues declined driven by several business divestitures that occurred during the year, partiallyoffset by favorable currency translation and the impact of a biscuit acquisition in 2016.
• Organic Net Revenue increased 2.4% to $26.2 billion in 2018 and increased 0.9% to $25.5 billion in 2017. In 2018, Organic Net Revenueincreased as a result of higher net pricing and favorable volume/mix. In 2017, Organic Net Revenue increased as a result of higher netpricing partially offset by unfavorable volume/mix. Organic Net Revenue is on a constant currency basis and excludes revenue fromdivestitures and acquisitions. We use Organic Net Revenue as it provides improved year-over-year comparability of our underlyingoperating results (see the definition of Organic Net Revenue and our reconciliation with net revenues within Non-GAAP Financial Measuresappearing later in this section).
• Diluted EPS attributable to Mondelēz International increased 23.2% to $2.28 in 2018 and increased 77.9% to $1.85 in 2017. Diluted EPSincreased in 2018 primarily driven by the after-tax gain on the KDP transaction, favorable year-over-year change in mark-to-market impactsfrom currency and commodity derivatives, operating gains, lower costs incurred for the Simplify to Grow Program, lower sharesoutstanding, increased equity method investment earnings and lower taxes, partially offset by the impact from pension participationchanges, lapping the benefit from the resolution of tax matters and lapping a prior-year net gain on divestitures. Diluted EPS increased in2017 as prior-year refinancing and higher restructuring activities drove lower interest and overhead costs in 2017. We also recordedbenefits from resolving two local indirect tax matters and gains from divesting non-core businesses during 2017. See our Discussion andAnalysis of Historical Results appearing later in this section for further details.
• Adjusted EPS increased 13.6% to $2.43 in 2018 and increased 16.3% to $2.14 in 2017. On a constant currency basis, Adjusted EPSincreased 15.0% to $2.46 in 2018 and increased 15.8% to $2.13 in 2017. For 2018, operating gains, lower shares outstanding, increasedequity method investment earnings, lower taxes and lower interest drove the Adjusted EPS growth. For 2017, operating gains, lowerinterest expense, increased equity method investment earnings and lower shares outstanding were the significant drivers of Adjusted EPSgrowth. Adjusted EPS and Adjusted EPS on a constant currency basis are non-GAAP financial measures. We use these measures asthey provide improved year-over-year comparability of our underlying results (see the definition of Adjusted EPS and our reconciliation withdiluted EPS within Non-GAAP Financial Measures appearing later in this section).
28
Table of Contents
Financial Outlook
We seek to achieve profitable, long-term growth and manage our business to attain this goal using our key operating metrics: Organic NetRevenue, Adjusted Operating Income and Adjusted EPS. We use these non-GAAP financial metrics and related computations, particularly growthin profit dollars, to evaluate and manage our business and to plan and make near-and long-term operating and strategic decisions. As such, webelieve these metrics are useful to investors as they provide supplemental information in addition to our U.S. Generally Accepted AccountingPrinciples (“U.S. GAAP”) financial results. We believe it is useful to provide investors with the same financial information that we use internally tomake comparisons of our historical operating results, identify trends in our underlying operating results and evaluate our business. We believe ournon-GAAP financial measures should always be considered in relation to our GAAP results. We have provided reconciliations between our GAAPand non-GAAP financial measures in Non-GAAP Financial Measures, which appears later in this section.
In addition to monitoring our key operating metrics, we monitor a number of developments and trends that could impact our revenue andprofitability objectives.
Long-Term Demographics and Consumer Trends – Snack food consumption is highly correlated to GDP growth, urbanization of populations andrising discretionary income levels associated with a growing middle class, particularly in emerging markets. Over the long term, we expect thesetrends to continue leading to growth in consumer behaviors such as more frequent, smaller meals, snacking and greater use of convenience foods.We also recognize changing consumer trends such as the increased emphasis on well-being, time compression and wide participation across anevolving retail and digital landscape. To position ourselves for long-term growth, we are investing in our well-being and other snack offerings,product and marketing innovation and new routes to market including e-commerce.
Demand – We monitor consumer spending and our market share within the food and beverage categories in which we sell our products. In recentyears, low GDP growth, economic recessionary pressures, weak consumer confidence, a historically strong U.S. dollar and changing consumertrends have slowed category growth. We have begun to see improvements in global economic growth and consumer confidence, however, thereare still geopolitical and economic uncertainties that may affect category growth, Growth in our global snacking categories improved this year toapproximately 2.7% in 2018, from 2.1% in 2017 and 2.3% in 2016. As part of our new strategic plan, we seek to drive category growth throughleveraging our local-first commercial approach, making additional investments in our brand and snacks portfolio, building strong routes to market inboth emerging and developed markets and improving our position across multiple channels. We believe these actions will help drive demand in ourcategories and strengthen our positions across markets.
Volatility of Global Markets – Our growth strategy depends in part on our ability to expand our operations, particularly in emerging markets. Someemerging markets have greater political, economic and currency volatility and greater vulnerability to infrastructure and labor disruptions. Volatilityin these markets affects demand for and the costs of our products and requires frequent changes in how we operate our business. See below for adiscussion of Brexit and Argentina, which was designated a highly inflationary economy in 2018. In addition, the imposition of increased or newtariffs, quotas, trade barriers or similar restrictions on our sales or key commodities and potential changes in U.S. trade programs, trade relations,regulations, taxes or fiscal policies might negatively affect our sales or profitability. To help mitigate adverse effects of ongoing volatility acrossmarkets, we aim to protect profitability through the management of costs (including hedging) and pricing as well as invest in our brands and newroutes to market.
Competition – We operate in highly competitive markets that include global, regional and local competitors. Our advantaged geographic footprint,operating scale and portfolio of brands have all significantly contributed to building our market-leading positions across most of the productcategories in which we sell. To grow and maintain our market positions, we focus on meeting consumer needs and preferences through a local-firstcommercial focus, new digital and other sales and marketing initiatives, agile product innovation and high standards of product quality. We alsocontinue to optimize our manufacturing and other operations and invest in our brands through ongoing research and development, advertising,marketing and consumer promotions.
Pricing – Our net revenue growth and profitability may be affected as we adjust prices to address new conditions. We adjust our product pricesbased on a number of variables including demand, the competitive environment and changes in our product input costs. We generally haveincreased prices in response to higher commodity costs, currency and other market factors. In 2019, we anticipate changing market conditions tocontinue to impact pricing.
29
Table of Contents
Price changes may affect net revenues or market share in the near term as the market adjusts to changes in input costs and other marketconditions.
Operating Costs – Our operating costs include raw materials, labor, selling, general and administrative expenses, taxes, currency impacts andfinancing costs. We manage these costs through cost saving and productivity initiatives, sourcing and hedging programs, pricing actions,refinancing and tax planning. To remain competitive on our operating structure, we continue to work on programs to expand our profitability, suchas our Simplify to Grow Program, which is designed to bring about significant reductions in our operating cost structure in both our supply chainand overhead costs.
Multiemployer pension plan – In 2018, we executed a complete withdrawal from the Fund. We estimated a withdrawal liability of $573 million, whichrepresents our best estimate of the withdrawal liability absent an assessment from the Fund. We anticipate receiving an assessment in 2019, andthe ultimate withdrawal liability may change from the currently estimated amount. We will record any future adjustments in the period during whichthe liability is confirmed or as new information becomes available. We expect to pay the liability over a period of 20 years from the date of theassessment. During 2018, within our North America segment, we recorded a discounted liability and related charge of $423 million or $316 millionnet of tax.
Taxes – In December 2017, the United States enacted U.S. tax reform. The legislation implements many new U.S. domestic and international taxprovisions. A year after enactment, some aspects of U.S. tax reform still remain unclear, and although additional clarifying guidance has beenissued (by the IRS, and the U.S. Treasury Department), there are still some areas that may not be clarified for some time. Also, a number of U.S.states have not yet updated their laws to take into account the new federal legislation. As a result, there may be further impact of the new laws onour future results of operations and financial condition. It is possible that U.S. tax reform, or interpretations under it, could change and could havean adverse effect on us, and such effect could be material.
Currency – As a global company with 75.3% of our net revenues generated outside the United States, we are continually exposed to changes inglobal economic conditions and currency movements. While we hedge significant forecasted currency exchange transactions as well as currencytranslation impacts from certain net assets of our non-U.S. operations, including the United Kingdom, we cannot fully predict or eliminate alladverse impacts arising from changes in currency exchange rates on our consolidated financial results. To partially offset currency translationimpacts arising from our overseas operations, we enter into net investment hedges primarily in the form of local currency-denominated debt andcross-currency swaps and other financial instruments. While we work to mitigate our exposure to currency risks, factors such as continued globaland local market volatility, actions by foreign governments, political uncertainty, limited hedging opportunities and other factors could lead tounfavorable currency impacts in the future and could adversely affect our results of operations or financial position. See additional discussion ofBrexit and Argentina below and refer also to Note 1, Summary of Significant Accounting Policies – Currency Translation and Highly InflationaryAccounting, and Note 9, Financial Instruments, for additional information on how we manage currency and related risks. As currency movementscan make comparison of year-over-year operating performance challenging, we isolate the impact of currency and also report growth on a constantcurrency basis, holding prior-year currency exchange rates constant, so that prior-year and current-year results can be compared on a consistentbasis.
Brexit – We continue to monitor Brexit and take protective measures in response to the potential impacts on our results of operations and financialcondition. Our exposure to disruptions to our supply chain, the imposition of tariffs and currency devaluation in the United Kingdom could result ina material impact to our consolidated revenue, earnings and cash flow. In 2018, we generated 8.6% of our net revenues in the United Kingdom andour supply chain in this market relies on imports of raw and packaging materials as well as finished goods. Following the Brexit vote in June 2016,there was significant volatility in the global stock markets and currency exchange rates. The value of the British pound sterling relative to the U.S.dollar declined significantly and negatively affected our translated results reported in U.S. dollars. The volatility in foreign currencies is expected tocontinue as the United Kingdom executes its exit from the European Union. If the U.K.'s membership in the European Union terminates in March2019 without an agreement (“hard Brexit”), there could be increased costs from re-imposition of tariffs on trade between the United Kingdom andEuropean Union, shipping delays because of the need for customs inspections and procedures and shortages of certain goods. The UnitedKingdom will also need to negotiate its own tax and trade treaties with countries all over the world, which could take years to complete. If theultimate terms of the U.K.’s separation from the European Union negatively impact the U.K. economy or result in disruptions to sales or our supplychain, the impact to our results of operations and financial condition could be material. We are taking measures to increase our resources incustomer service & logistics together with increasing our inventory levels of
30
Table of Contents
imported raw materials, packaging and finished goods in the United Kingdom to help us manage through the Brexit transition and the inherentrisks. Resulting impacts and market volatility can vary significantly depending on the final terms of the U.K.’s exit agreement from the EuropeanUnion.
Argentina – as further discussed in Note 1, Summary of Significant Accounting Policies – Currency Translation and Highly Inflationary Accounting,on July 1, 2018, we began to apply highly inflationary accounting for our Argentinean subsidiaries. During 2018, we recorded an $11 millionremeasurement loss in net earnings related to the devaluation of our Argentinean peso denominated net monetary assets from July 1, 2018through December 31, 2018. The mix of monetary assets and liabilities and the exchange rate to convert Argentinean pesos to U.S. dollars couldchange over time, so it is difficult to predict the overall impact of the Argentina highly inflationary accounting on future net earnings.
Accounting Standards – We adopted a new lease accounting standard on January 1, 2019. The most significant impact is the initial recognition ofoperating lease Right of Use assets and lease liabilities on our balance sheet, while our accounting for finance leases (i.e. capital leases) remainssubstantially unchanged. Refer to Note 1, Summary of Significant Accounting Policies, for more information on the estimated impact of the newlease accounting standard.
Financing Costs – We regularly evaluate our variable and fixed-rate debt. We continue to use low-cost, short- and long-term debt to finance ourongoing working capital, capital expenditures and other investments, dividends and share repurchases. Our weighted-average interest rate on ourtotal debt as of December 31, 2018 was 2.3%, up from 2.1% as of December 31, 2017 and up from 2.2% as of December 31, 2016, primarily dueto higher interest rates on commercial paper borrowings in 2018. We expect to use cash and proceeds from debt issuances to finance the $1.2billion of remaining U.S. tax reform transition tax installments, payable through 2026, and the estimated $573 million multiemployer pension planwithdrawal liability payable over 20 years from the date of the final assessment from the Fund. We continue to use interest rate swaps and otherfinancial instruments to manage our exposure to interest rate and cash flow variability, protect the value of our existing currency assets andliabilities and protect the value of our debt. We also enter into cross-currency interest rate swaps and forwards to hedge our non-U.S. netinvestments against adverse movements in exchange rates. In connection with the net investment hedge derivative contracts, we expect afavorable impact on our prospective financing costs as we reduce some of the financing costs and related currency impacts within our interestcosts. Refer to Note 8, Debt and Borrowing Arrangements, and Note 9, Financial Instruments, for additional information on our debt and derivativeactivity.
Cybersecurity Risks – In 2017, the malware incident impacted our operating systems and results. We continue to devote focused resources tonetwork security, backup and disaster recovery, enhanced training and other security measures to protect our systems and data. We also focuson enhancing the monitoring and detection of threats in our environment, including but not limited to the manufacturing environment and operationaltechnologies, as well as adjusting information security controls based on updated threats. While we have taken a number of security measures toprotect our systems and data, security measures cannot provide absolute certainty or guarantee that we will be successful in preventing orresponding to every breach or disruption on a timely basis.
31
Table of Contents
Discussion and Analysis of Historical Results
Items Affecting Comparability of Financial Results
The following table includes significant income or (expense) items that affected the comparability of our results of operations and our effective taxrates. Please refer to the notes to the consolidated financial statements indicated below for more information. Refer also to the ConsolidatedResults of Operations – Net Earnings and Earnings per Share Attributable to Mondelēz International table for the after-tax per share impacts ofthese items.
For the Years Ended December 31,
See Note 2018 2017 2016 (in millions, except percentages)Gain on equity method investment transactions (1) Note 6 $ 778 $ 40 $ 43Simplify to Grow Program Note 7
Restructuring Charges (316) (535) (714)Implementation Charges (315) (257) (372)
Gain/(loss) related to interest rate swaps Note 8 & 9 10 — (97)Loss on debt extinguishment Note 8 (140) (11) (427)Intangible asset impairment charges (2) (68) (109) (137)Remeasurement of net monetary position (11) — —CEO transition remuneration (3) (22) (14) —Acquisition and divestiture-related costs Note 2
Gain on sale of intangible assets — — 15Acquisition-related costs (13) — (1)Other acquisition integration costs (3) (3) (7)Net gain on divestitures — 186 9Divestiture-related costs 1 (34) (86)Gains on sales of property — — 46
Mark-to-market gains/(losses) from derivatives Note 9 142 (96) (94)Impact from resolution of tax matters Note 13 11 281 —Impact from pension participation changes Note 10 (429) — —Malware incident incremental expenses — (84) —U.S. tax reform discrete net tax (expense)/benefit Note 15 (19) 44 —Effective tax rate Note 15 27.2% 21.3% 7.8% (1) The gain on equity method investment transactions is recorded outside pre-tax operating results on the consolidated statement of earnings.(2) Refer to our Annual Report on Form 10-K for the year ended December 31, 2017 for more information on prior-year intangible asset impairment charges.(3) Please see the Non-GAAP Financial Measures section at the end of this item for additional information.
32
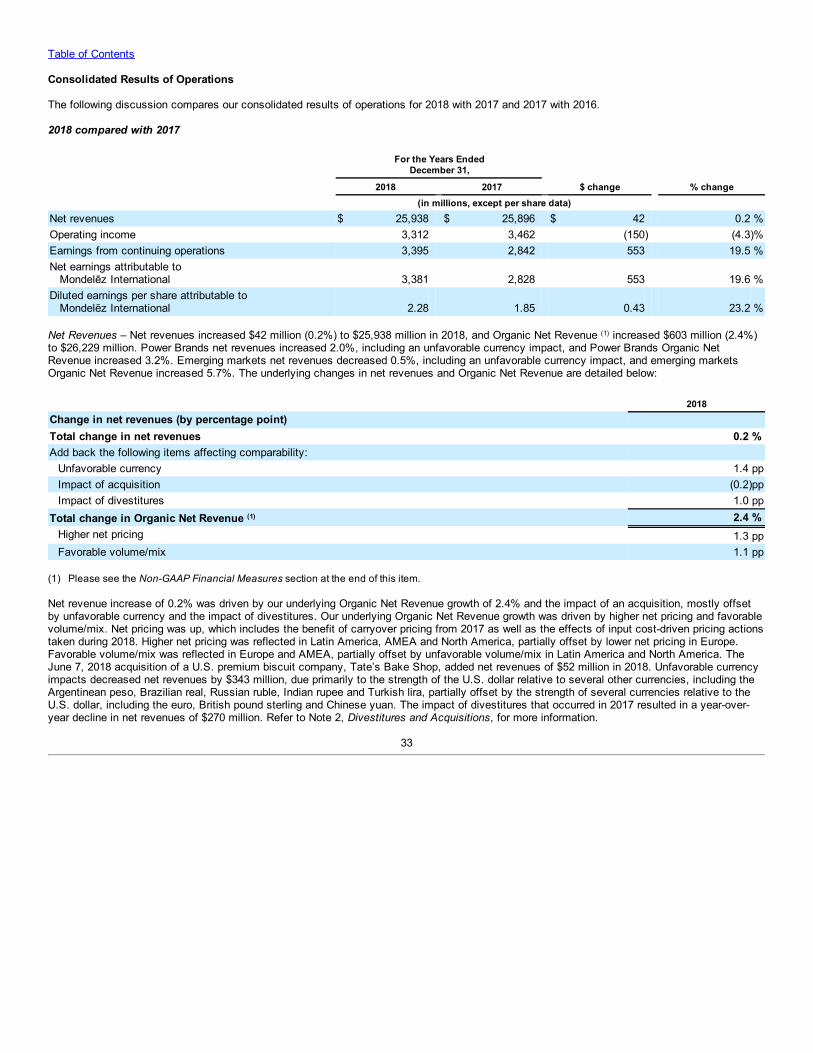
Table of Contents
Consolidated Results of Operations
The following discussion compares our consolidated results of operations for 2018 with 2017 and 2017 with 2016.
2018 compared with 2017
For the Years Ended
December 31,
2018 2017 $ change % change (in millions, except per share data)
Net revenues $ 25,938 $ 25,896 $ 42 0.2 %Operating income 3,312 3,462 (150) (4.3)%Earnings from continuing operations 3,395 2,842 553 19.5 %Net earnings attributable to Mondelēz International 3,381 2,828 553 19.6 %Diluted earnings per share attributable to Mondelēz International 2.28 1.85 0.43 23.2 %
Net Revenues – Net revenues increased $42 million (0.2%) to $25,938 million in 2018, and Organic Net Revenue (1) increased $603 million (2.4%)to $26,229 million. Power Brands net revenues increased 2.0%, including an unfavorable currency impact, and Power Brands Organic NetRevenue increased 3.2%. Emerging markets net revenues decreased 0.5%, including an unfavorable currency impact, and emerging marketsOrganic Net Revenue increased 5.7%. The underlying changes in net revenues and Organic Net Revenue are detailed below:
2018Change in net revenues (by percentage point) Total change in net revenues 0.2 %Add back the following items affecting comparability:
Unfavorable currency 1.4 ppImpact of acquisition (0.2)ppImpact of divestitures 1.0 pp
Total change in Organic Net Revenue (1) 2.4 %Higher net pricing 1.3 ppFavorable volume/mix 1.1 pp
(1) Please see the Non-GAAP Financial Measures section at the end of this item.
Net revenue increase of 0.2% was driven by our underlying Organic Net Revenue growth of 2.4% and the impact of an acquisition, mostly offsetby unfavorable currency and the impact of divestitures. Our underlying Organic Net Revenue growth was driven by higher net pricing and favorablevolume/mix. Net pricing was up, which includes the benefit of carryover pricing from 2017 as well as the effects of input cost-driven pricing actionstaken during 2018. Higher net pricing was reflected in Latin America, AMEA and North America, partially offset by lower net pricing in Europe.Favorable volume/mix was reflected in Europe and AMEA, partially offset by unfavorable volume/mix in Latin America and North America. TheJune 7, 2018 acquisition of a U.S. premium biscuit company, Tate’s Bake Shop, added net revenues of $52 million in 2018. Unfavorable currencyimpacts decreased net revenues by $343 million, due primarily to the strength of the U.S. dollar relative to several other currencies, including theArgentinean peso, Brazilian real, Russian ruble, Indian rupee and Turkish lira, partially offset by the strength of several currencies relative to theU.S. dollar, including the euro, British pound sterling and Chinese yuan. The impact of divestitures that occurred in 2017 resulted in a year-over-year decline in net revenues of $270 million. Refer to Note 2, Divestitures and Acquisitions, for more information.
33
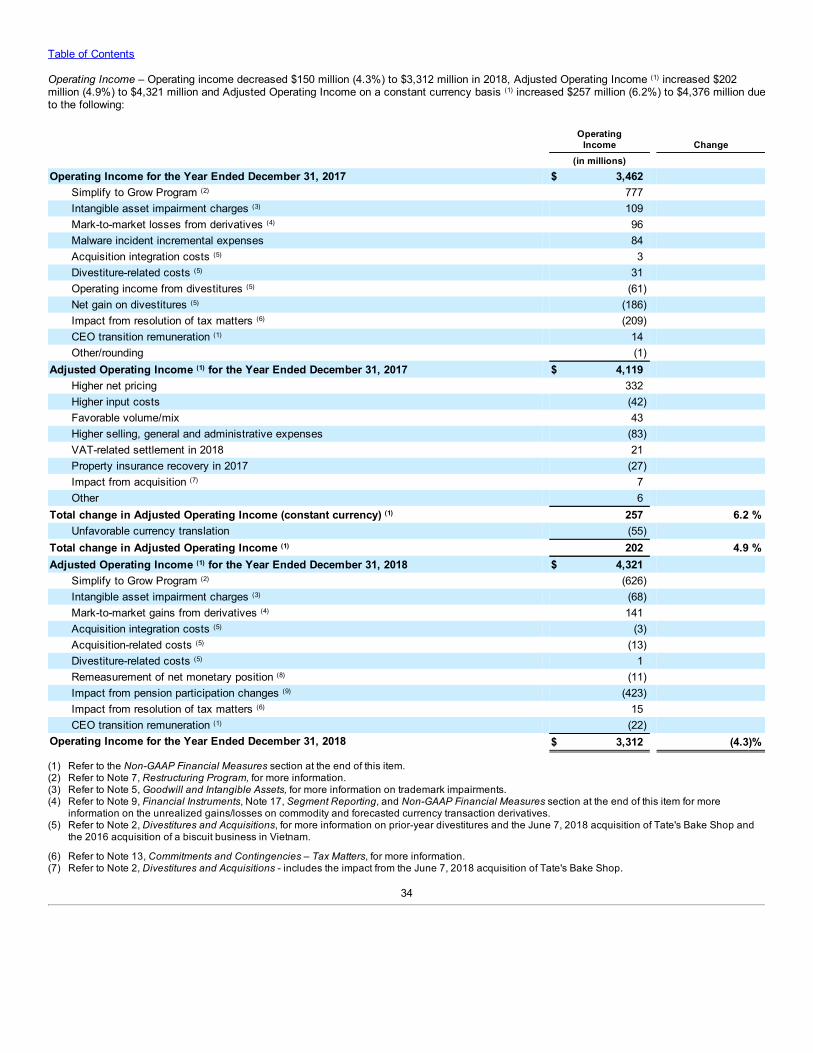
Table of Contents
Operating Income – Operating income decreased $150 million (4.3%) to $3,312 million in 2018, Adjusted Operating Income (1) increased $202million (4.9%) to $4,321 million and Adjusted Operating Income on a constant currency basis (1) increased $257 million (6.2%) to $4,376 million dueto the following:
Operating
Income Change (in millions)
Operating Income for the Year Ended December 31, 2017 $ 3,462 Simplify to Grow Program (2) 777 Intangible asset impairment charges (3) 109 Mark-to-market losses from derivatives (4) 96 Malware incident incremental expenses 84 Acquisition integration costs (5) 3 Divestiture-related costs (5) 31 Operating income from divestitures (5) (61) Net gain on divestitures (5) (186) Impact from resolution of tax matters (6) (209) CEO transition remuneration (1) 14 Other/rounding (1)
Adjusted Operating Income (1) for the Year Ended December 31, 2017 $ 4,119 Higher net pricing 332 Higher input costs (42) Favorable volume/mix 43 Higher selling, general and administrative expenses (83) VAT-related settlement in 2018 21 Property insurance recovery in 2017 (27) Impact from acquisition (7) 7 Other 6
Total change in Adjusted Operating Income (constant currency) (1) 257 6.2 %Unfavorable currency translation (55)
Total change in Adjusted Operating Income (1) 202 4.9 %Adjusted Operating Income (1) for the Year Ended December 31, 2018 $ 4,321
Simplify to Grow Program (2) (626) Intangible asset impairment charges (3) (68) Mark-to-market gains from derivatives (4) 141 Acquisition integration costs (5) (3) Acquisition-related costs (5) (13) Divestiture-related costs (5) 1 Remeasurement of net monetary position (8) (11) Impact from pension participation changes (9) (423) Impact from resolution of tax matters (6) 15 CEO transition remuneration (1) (22)
Operating Income for the Year Ended December 31, 2018 $ 3,312 (4.3)% (1) Refer to the Non-GAAP Financial Measures section at the end of this item.(2) Refer to Note 7, Restructuring Program, for more information.(3) Refer to Note 5, Goodwill and Intangible Assets, for more information on trademark impairments.(4) Refer to Note 9, Financial Instruments, Note 17, Segment Reporting, and Non-GAAP Financial Measures section at the end of this item for more
information on the unrealized gains/losses on commodity and forecasted currency transaction derivatives.(5) Refer to Note 2, Divestitures and Acquisitions, for more information on prior-year divestitures and the June 7, 2018 acquisition of Tate's Bake Shop and
the 2016 acquisition of a biscuit business in Vietnam.
(6) Refer to Note 13, Commitments and Contingencies – Tax Matters, for more information.(7) Refer to Note 2, Divestitures and Acquisitions - includes the impact from the June 7, 2018 acquisition of Tate's Bake Shop.
34
Table of Contents
(8) Refer to Note 1, Summary of Significant Accounting Policies – Currency Translation and Highly Inflationary Accounting, for information on our applicationof highly inflationary accounting for Argentina.
(9) Refer to Note 10, Benefit Plans, for more information.
During 2018, we realized higher net pricing, which was partially offset by increased input costs. Higher net pricing, which included the carryoverimpact of pricing actions taken in 2017 as well as the effects of input cost-driven pricing actions taken during 2018, was reflected across allregions except Europe. The increase in input costs was driven by higher raw material costs, mostly offset by lower manufacturing costs due toproductivity efforts. Higher raw material costs were primarily due to higher currency exchange transaction costs on imported materials, as well ashigher packaging, dairy and energy, partially offset primarily by lower cocoa costs. Favorable volume/mix was driven by Europe and AMEA, whichwas partially offset by unfavorable volume/mix in North America and Latin America.
Total selling, general and administrative expenses increased $537 million from 2017, due to a number of factors noted in the table above, includingin part, the impact from pension participation changes, lapping of prior-year benefits from the resolution of tax matters, lapping of a prior-yearproperty insurance recovery, acquisition-related costs, remeasurement of net monetary position in Argentina, the impact of an acquisition andhigher CEO transition remuneration. The increases were partially offset by favorable currency impact, lower implementation costs incurred for theSimplify to Grow Program, lower divestiture-related costs, the lapping of prior-year malware incident incremental costs, a value-added tax (“VAT”)related settlement in 2018, the impact of divestitures and the net benefit from the resolution of tax matters in 2018. Excluding these factors,selling, general and administrative expenses increased $83 million from 2017. The increase was driven by the year-over year net unfavorablechange in miscellaneous other income and expense items within selling, general and administrative expenses and higher overhead costs, whichmore than offset lower advertising and consumer promotion costs.
We recorded a benefit of $21 million from a VAT-related settlement in Latin America in 2018. We recorded a benefit of $27 million from aninsurance recovery in AMEA in 2017. Unfavorable currency changes decreased operating income by $55 million due primarily to the strength of theU.S. dollar relative to several currencies, including the Brazilian real, Argentinean peso, Russian ruble and Turkish lira, partially offset by thestrength of several currencies relative to the U.S. dollar, including the euro and British pound sterling.
Operating income margin decreased from 13.4% in 2017 to 12.8% in 2018. The decrease in operating income margin was driven by the impactfrom pension participation changes, the lapping of prior-year benefits from the resolution of tax matters, the lapping of a prior-year gain ondivestiture and higher CEO transition remuneration. These unfavorable items were partially offset by the year-over-year favorable change in mark-to-market gains/(losses) from currency and commodity hedging activities, lower Simplify to Grow Program costs, an increase in our AdjustedOperating Income margin, the lapping of prior-year malware incident incremental costs, lower divestiture-related costs and lower intangible assetimpairment charges. Adjusted Operating Income margin increased from 16.1% in 2017 to 16.7% in 2018. The increase in Adjusted OperatingIncome margin was driven primarily by higher net pricing, lower manufacturing costs due to continued cost reduction efforts and lower advertisingand consumer promotion costs, partially offset by higher raw material costs.
35
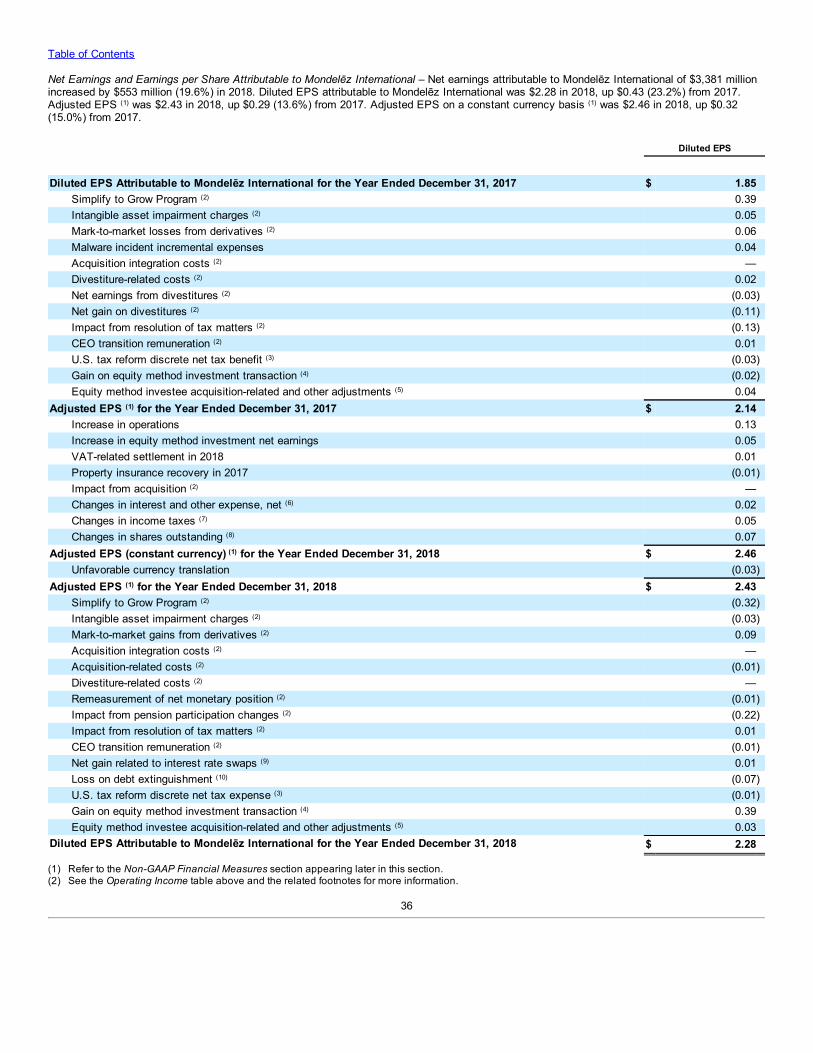
Table of Contents
Net Earnings and Earnings per Share Attributable to Mondelēz International – Net earnings attributable to Mondelēz International of $3,381 millionincreased by $553 million (19.6%) in 2018. Diluted EPS attributable to Mondelēz International was $2.28 in 2018, up $0.43 (23.2%) from 2017.Adjusted EPS (1) was $2.43 in 2018, up $0.29 (13.6%) from 2017. Adjusted EPS on a constant currency basis (1) was $2.46 in 2018, up $0.32(15.0%) from 2017.
Diluted EPS
Diluted EPS Attributable to Mondelēz International for the Year Ended December 31, 2017 $ 1.85Simplify to Grow Program (2) 0.39Intangible asset impairment charges (2) 0.05Mark-to-market losses from derivatives (2) 0.06Malware incident incremental expenses 0.04Acquisition integration costs (2) —Divestiture-related costs (2) 0.02Net earnings from divestitures (2) (0.03)Net gain on divestitures (2) (0.11)Impact from resolution of tax matters (2) (0.13)CEO transition remuneration (2) 0.01U.S. tax reform discrete net tax benefit (3) (0.03)Gain on equity method investment transaction (4) (0.02)Equity method investee acquisition-related and other adjustments (5) 0.04
Adjusted EPS (1) for the Year Ended December 31, 2017 $ 2.14Increase in operations 0.13Increase in equity method investment net earnings 0.05VAT-related settlement in 2018 0.01Property insurance recovery in 2017 (0.01)Impact from acquisition (2) —Changes in interest and other expense, net (6) 0.02Changes in income taxes (7) 0.05Changes in shares outstanding (8) 0.07
Adjusted EPS (constant currency) (1) for the Year Ended December 31, 2018 $ 2.46Unfavorable currency translation (0.03)
Adjusted EPS (1) for the Year Ended December 31, 2018 $ 2.43Simplify to Grow Program (2) (0.32)Intangible asset impairment charges (2) (0.03)Mark-to-market gains from derivatives (2) 0.09Acquisition integration costs (2) —Acquisition-related costs (2) (0.01)Divestiture-related costs (2) —Remeasurement of net monetary position (2) (0.01)Impact from pension participation changes (2) (0.22)Impact from resolution of tax matters (2) 0.01CEO transition remuneration (2) (0.01)Net gain related to interest rate swaps (9) 0.01Loss on debt extinguishment (10) (0.07)U.S. tax reform discrete net tax expense (3) (0.01)Gain on equity method investment transaction (4) 0.39Equity method investee acquisition-related and other adjustments (5) 0.03
Diluted EPS Attributable to Mondelēz International for the Year Ended December 31, 2018 $ 2.28 (1) Refer to the Non-GAAP Financial Measures section appearing later in this section.(2) See the Operating Income table above and the related footnotes for more information.
36

Table of Contents
(3) Refer to Note 15, Income Taxes, for more information on the impact of the U.S. tax reform.(4) Refer to Note 6, Equity Method Investments, for more information on the KDP transaction in 2018 and the 2017 sale of an interest in one of our equity
method investments.(5) Includes our proportionate share of unusual or infrequent items, such as acquisition and divestiture-related costs, restructuring program costs and
discrete U.S. tax reform impacts recorded by our JDE and Keurig equity method investees.(6) Excludes the currency impact on interest expense related to our non-U.S. dollar-denominated debt which is included in currency translation.(7) Refer to Note 15, Income Taxes, for more information on the items affecting income taxes.(8) Refer to Note 11, Stock Plans, for more information on our equity compensation programs and share repurchase program and Note 16, Earnings per
Share, for earnings per share weighted-average share information.(9) Refer to Note 9, Financial Instruments, for information on our interest rate swaps that we no longer designate as cash flow hedges.(10) Refer to Note 8, Debt and Borrowing Arrangements, for more information on losses on debt extinguishment.
37
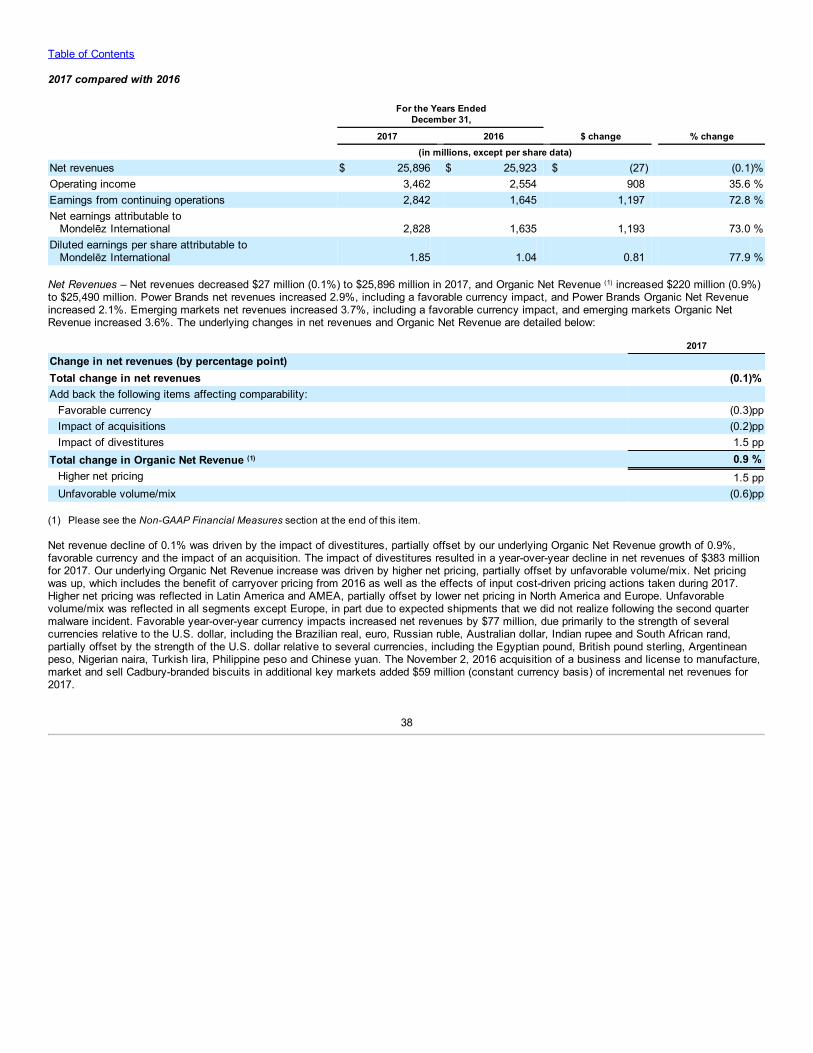
Table of Contents
2017 compared with 2016
For the Years Ended
December 31,
2017 2016 $ change % change (in millions, except per share data)
Net revenues $ 25,896 $ 25,923 $ (27) (0.1)%Operating income 3,462 2,554 908 35.6 %Earnings from continuing operations 2,842 1,645 1,197 72.8 %Net earnings attributable to Mondelēz International 2,828 1,635 1,193 73.0 %Diluted earnings per share attributable to Mondelēz International 1.85 1.04 0.81 77.9 %
Net Revenues – Net revenues decreased $27 million (0.1%) to $25,896 million in 2017, and Organic Net Revenue (1) increased $220 million (0.9%)to $25,490 million. Power Brands net revenues increased 2.9%, including a favorable currency impact, and Power Brands Organic Net Revenueincreased 2.1%. Emerging markets net revenues increased 3.7%, including a favorable currency impact, and emerging markets Organic NetRevenue increased 3.6%. The underlying changes in net revenues and Organic Net Revenue are detailed below:
2017Change in net revenues (by percentage point) Total change in net revenues (0.1)%Add back the following items affecting comparability:
Favorable currency (0.3)ppImpact of acquisitions (0.2)ppImpact of divestitures 1.5 pp
Total change in Organic Net Revenue (1) 0.9 %Higher net pricing 1.5 ppUnfavorable volume/mix (0.6)pp
(1) Please see the Non-GAAP Financial Measures section at the end of this item.
Net revenue decline of 0.1% was driven by the impact of divestitures, partially offset by our underlying Organic Net Revenue growth of 0.9%,favorable currency and the impact of an acquisition. The impact of divestitures resulted in a year-over-year decline in net revenues of $383 millionfor 2017. Our underlying Organic Net Revenue increase was driven by higher net pricing, partially offset by unfavorable volume/mix. Net pricingwas up, which includes the benefit of carryover pricing from 2016 as well as the effects of input cost-driven pricing actions taken during 2017.Higher net pricing was reflected in Latin America and AMEA, partially offset by lower net pricing in North America and Europe. Unfavorablevolume/mix was reflected in all segments except Europe, in part due to expected shipments that we did not realize following the second quartermalware incident. Favorable year-over-year currency impacts increased net revenues by $77 million, due primarily to the strength of severalcurrencies relative to the U.S. dollar, including the Brazilian real, euro, Russian ruble, Australian dollar, Indian rupee and South African rand,partially offset by the strength of the U.S. dollar relative to several currencies, including the Egyptian pound, British pound sterling, Argentineanpeso, Nigerian naira, Turkish lira, Philippine peso and Chinese yuan. The November 2, 2016 acquisition of a business and license to manufacture,market and sell Cadbury-branded biscuits in additional key markets added $59 million (constant currency basis) of incremental net revenues for2017.
38
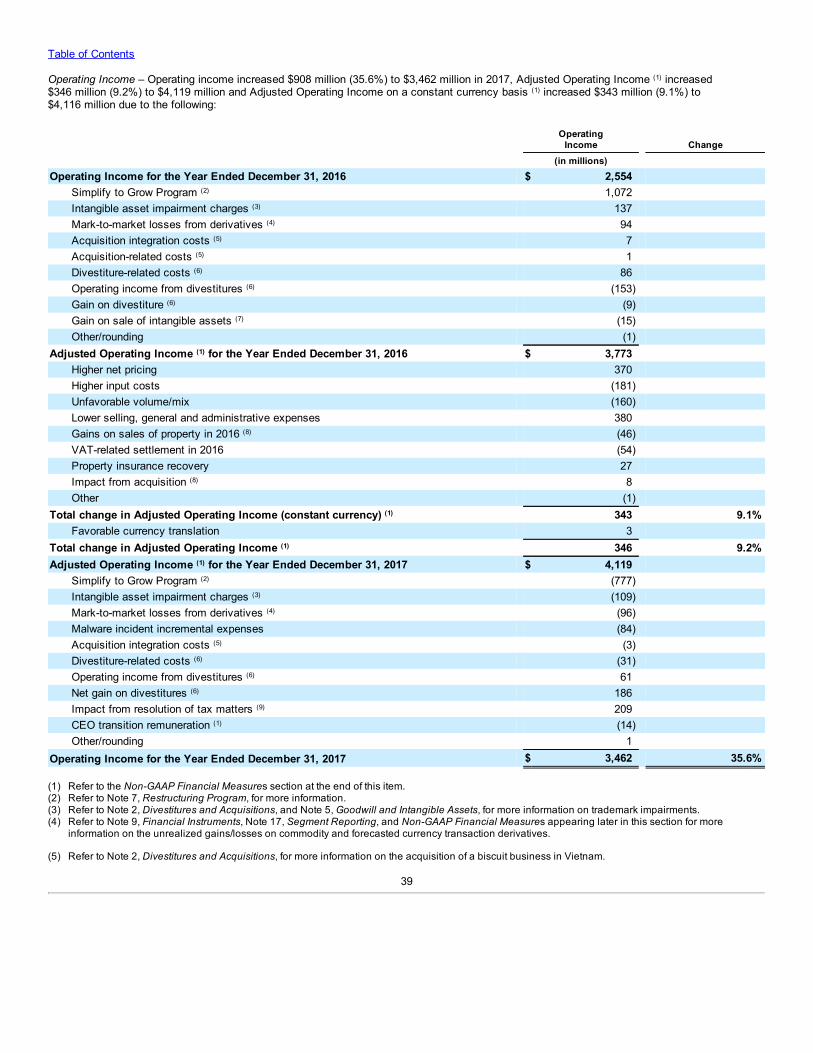
Table of Contents
Operating Income – Operating income increased $908 million (35.6%) to $3,462 million in 2017, Adjusted Operating Income (1) increased$346 million (9.2%) to $4,119 million and Adjusted Operating Income on a constant currency basis (1) increased $343 million (9.1%) to$4,116 million due to the following:
Operating
Income Change (in millions)
Operating Income for the Year Ended December 31, 2016 $ 2,554 Simplify to Grow Program (2) 1,072 Intangible asset impairment charges (3) 137 Mark-to-market losses from derivatives (4) 94 Acquisition integration costs (5) 7 Acquisition-related costs (5) 1 Divestiture-related costs (6) 86 Operating income from divestitures (6) (153) Gain on divestiture (6) (9) Gain on sale of intangible assets (7) (15) Other/rounding (1)
Adjusted Operating Income (1) for the Year Ended December 31, 2016 $ 3,773 Higher net pricing 370 Higher input costs (181) Unfavorable volume/mix (160) Lower selling, general and administrative expenses 380 Gains on sales of property in 2016 (8) (46) VAT-related settlement in 2016 (54) Property insurance recovery 27 Impact from acquisition (8) 8 Other (1)
Total change in Adjusted Operating Income (constant currency) (1) 343 9.1%Favorable currency translation 3
Total change in Adjusted Operating Income (1) 346 9.2%Adjusted Operating Income (1) for the Year Ended December 31, 2017 $ 4,119
Simplify to Grow Program (2) (777) Intangible asset impairment charges (3) (109) Mark-to-market losses from derivatives (4) (96) Malware incident incremental expenses (84) Acquisition integration costs (5) (3) Divestiture-related costs (6) (31) Operating income from divestitures (6) 61 Net gain on divestitures (6) 186 Impact from resolution of tax matters (9) 209 CEO transition remuneration (1) (14) Other/rounding 1
Operating Income for the Year Ended December 31, 2017 $ 3,462 35.6%
(1) Refer to the Non-GAAP Financial Measures section at the end of this item.(2) Refer to Note 7, Restructuring Program, for more information.(3) Refer to Note 2, Divestitures and Acquisitions, and Note 5, Goodwill and Intangible Assets, for more information on trademark impairments.(4) Refer to Note 9, Financial Instruments, Note 17, Segment Reporting, and Non-GAAP Financial Measures appearing later in this section for more
information on the unrealized gains/losses on commodity and forecasted currency transaction derivatives.
(5) Refer to Note 2, Divestitures and Acquisitions, for more information on the acquisition of a biscuit business in Vietnam.
39
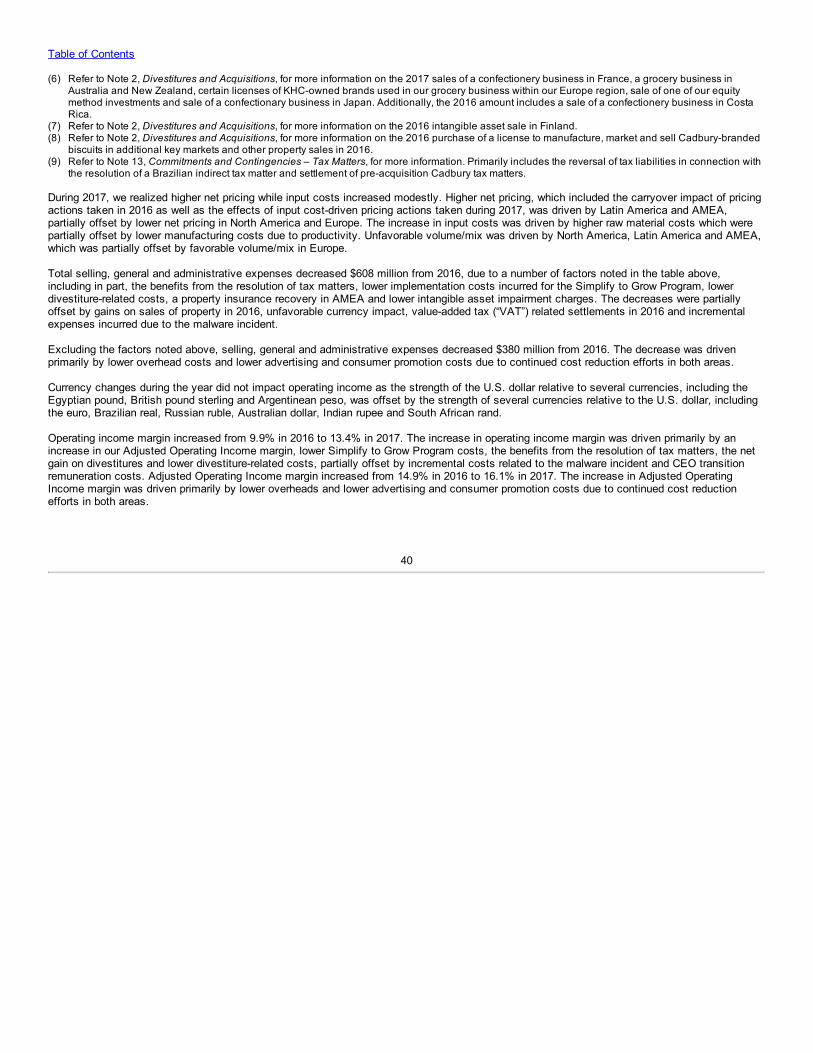
Table of Contents
(6) Refer to Note 2, Divestitures and Acquisitions, for more information on the 2017 sales of a confectionery business in France, a grocery business inAustralia and New Zealand, certain licenses of KHC-owned brands used in our grocery business within our Europe region, sale of one of our equitymethod investments and sale of a confectionary business in Japan. Additionally, the 2016 amount includes a sale of a confectionery business in CostaRica.
(7) Refer to Note 2, Divestitures and Acquisitions, for more information on the 2016 intangible asset sale in Finland.(8) Refer to Note 2, Divestitures and Acquisitions, for more information on the 2016 purchase of a license to manufacture, market and sell Cadbury-branded
biscuits in additional key markets and other property sales in 2016.(9) Refer to Note 13, Commitments and Contingencies – Tax Matters, for more information. Primarily includes the reversal of tax liabilities in connection with
the resolution of a Brazilian indirect tax matter and settlement of pre-acquisition Cadbury tax matters.
During 2017, we realized higher net pricing while input costs increased modestly. Higher net pricing, which included the carryover impact of pricingactions taken in 2016 as well as the effects of input cost-driven pricing actions taken during 2017, was driven by Latin America and AMEA,partially offset by lower net pricing in North America and Europe. The increase in input costs was driven by higher raw material costs which werepartially offset by lower manufacturing costs due to productivity. Unfavorable volume/mix was driven by North America, Latin America and AMEA,which was partially offset by favorable volume/mix in Europe.
Total selling, general and administrative expenses decreased $608 million from 2016, due to a number of factors noted in the table above,including in part, the benefits from the resolution of tax matters, lower implementation costs incurred for the Simplify to Grow Program, lowerdivestiture-related costs, a property insurance recovery in AMEA and lower intangible asset impairment charges. The decreases were partiallyoffset by gains on sales of property in 2016, unfavorable currency impact, value-added tax (“VAT”) related settlements in 2016 and incrementalexpenses incurred due to the malware incident.
Excluding the factors noted above, selling, general and administrative expenses decreased $380 million from 2016. The decrease was drivenprimarily by lower overhead costs and lower advertising and consumer promotion costs due to continued cost reduction efforts in both areas.
Currency changes during the year did not impact operating income as the strength of the U.S. dollar relative to several currencies, including theEgyptian pound, British pound sterling and Argentinean peso, was offset by the strength of several currencies relative to the U.S. dollar, includingthe euro, Brazilian real, Russian ruble, Australian dollar, Indian rupee and South African rand.
Operating income margin increased from 9.9% in 2016 to 13.4% in 2017. The increase in operating income margin was driven primarily by anincrease in our Adjusted Operating Income margin, lower Simplify to Grow Program costs, the benefits from the resolution of tax matters, the netgain on divestitures and lower divestiture-related costs, partially offset by incremental costs related to the malware incident and CEO transitionremuneration costs. Adjusted Operating Income margin increased from 14.9% in 2016 to 16.1% in 2017. The increase in Adjusted OperatingIncome margin was driven primarily by lower overheads and lower advertising and consumer promotion costs due to continued cost reductionefforts in both areas.
40
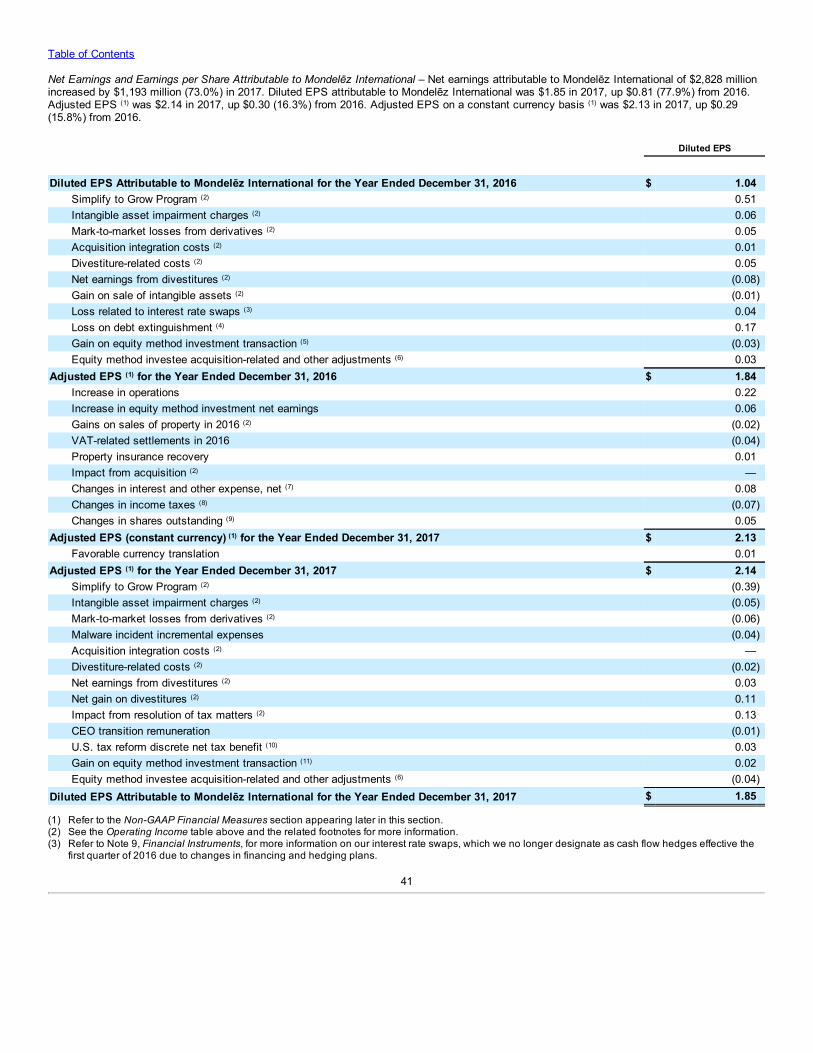
Table of Contents
Net Earnings and Earnings per Share Attributable to Mondelēz International – Net earnings attributable to Mondelēz International of $2,828 millionincreased by $1,193 million (73.0%) in 2017. Diluted EPS attributable to Mondelēz International was $1.85 in 2017, up $0.81 (77.9%) from 2016.Adjusted EPS (1) was $2.14 in 2017, up $0.30 (16.3%) from 2016. Adjusted EPS on a constant currency basis (1) was $2.13 in 2017, up $0.29(15.8%) from 2016.
Diluted EPS
Diluted EPS Attributable to Mondelēz International for the Year Ended December 31, 2016 $ 1.04Simplify to Grow Program (2) 0.51Intangible asset impairment charges (2) 0.06Mark-to-market losses from derivatives (2) 0.05Acquisition integration costs (2) 0.01Divestiture-related costs (2) 0.05Net earnings from divestitures (2) (0.08)Gain on sale of intangible assets (2) (0.01)Loss related to interest rate swaps (3) 0.04Loss on debt extinguishment (4) 0.17Gain on equity method investment transaction (5) (0.03)Equity method investee acquisition-related and other adjustments (6) 0.03
Adjusted EPS (1) for the Year Ended December 31, 2016 $ 1.84Increase in operations 0.22Increase in equity method investment net earnings 0.06Gains on sales of property in 2016 (2) (0.02)VAT-related settlements in 2016 (0.04)Property insurance recovery 0.01Impact from acquisition (2) —Changes in interest and other expense, net (7) 0.08Changes in income taxes (8) (0.07)Changes in shares outstanding (9) 0.05
Adjusted EPS (constant currency) (1) for the Year Ended December 31, 2017 $ 2.13Favorable currency translation 0.01
Adjusted EPS (1) for the Year Ended December 31, 2017 $ 2.14Simplify to Grow Program (2) (0.39)Intangible asset impairment charges (2) (0.05)Mark-to-market losses from derivatives (2) (0.06)Malware incident incremental expenses (0.04)Acquisition integration costs (2) —Divestiture-related costs (2) (0.02)Net earnings from divestitures (2) 0.03Net gain on divestitures (2) 0.11Impact from resolution of tax matters (2) 0.13CEO transition remuneration (0.01)U.S. tax reform discrete net tax benefit (10) 0.03Gain on equity method investment transaction (11) 0.02Equity method investee acquisition-related and other adjustments (6) (0.04)
Diluted EPS Attributable to Mondelēz International for the Year Ended December 31, 2017 $ 1.85 (1) Refer to the Non-GAAP Financial Measures section appearing later in this section.(2) See the Operating Income table above and the related footnotes for more information.(3) Refer to Note 9, Financial Instruments, for more information on our interest rate swaps, which we no longer designate as cash flow hedges effective the
first quarter of 2016 due to changes in financing and hedging plans.
41

Table of Contents
(4) Refer to Note 8, Debt and Borrowing Arrangements, for more information on our loss on debt extinguishment and related expenses in connection withour debt tender offers.
(5) Refer to Note 6, Equity Method Investments – Keurig, for more information on the 2016 acquisition of an interest in Keurig.(6) Includes our proportionate share of unusual or infrequent items, such as acquisition and divestiture-related costs, restructuring program costs and
discrete U.S. tax reform impacts recorded by our JDE and Keurig equity method investees.(7) Excludes the currency impact on interest expense related to our non-U.S. dollar-denominated debt which is included in currency translation.(8) Refer to Note 15, Income Taxes, for more information on the items affecting income taxes.(9) Refer to Note 11, Stock Plans, for more information on our equity compensation programs, Note 12, Capital Stock, for more information on our share
repurchase program and Note 16, Earnings per Share, for earnings per share weighted-average share information.(10) Refer to Note 15, Income Taxes, for more information on the impact of the U.S. tax reform.(11) Refer to Note 6, Equity Method Investments, for more information on the 2017 sale of an interest in one of our equity method investments.
42
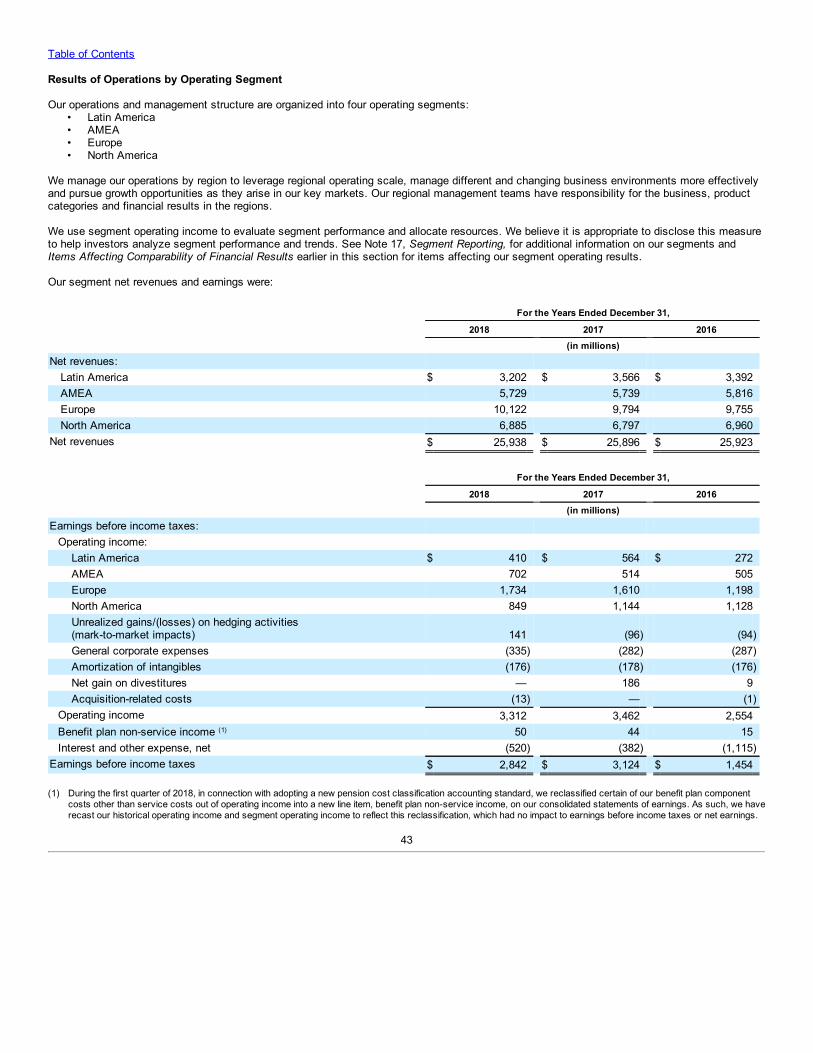
Table of Contents
Results of Operations by Operating Segment
Our operations and management structure are organized into four operating segments:• Latin America• AMEA• Europe• North America
We manage our operations by region to leverage regional operating scale, manage different and changing business environments more effectivelyand pursue growth opportunities as they arise in our key markets. Our regional management teams have responsibility for the business, productcategories and financial results in the regions.
We use segment operating income to evaluate segment performance and allocate resources. We believe it is appropriate to disclose this measureto help investors analyze segment performance and trends. See Note 17, Segment Reporting, for additional information on our segments andItems Affecting Comparability of Financial Results earlier in this section for items affecting our segment operating results.
Our segment net revenues and earnings were:
For the Years Ended December 31,
2018 2017 2016 (in millions)Net revenues:
Latin America $ 3,202 $ 3,566 $ 3,392AMEA 5,729 5,739 5,816Europe 10,122 9,794 9,755North America 6,885 6,797 6,960
Net revenues $ 25,938 $ 25,896 $ 25,923
For the Years Ended December 31,
2018 2017 2016 (in millions)Earnings before income taxes:
Operating income: Latin America $ 410 $ 564 $ 272AMEA 702 514 505Europe 1,734 1,610 1,198North America 849 1,144 1,128Unrealized gains/(losses) on hedging activities(mark-to-market impacts) 141 (96) (94)General corporate expenses (335) (282) (287)Amortization of intangibles (176) (178) (176)Net gain on divestitures — 186 9Acquisition-related costs (13) — (1)
Operating income 3,312 3,462 2,554Benefit plan non-service income (1) 50 44 15Interest and other expense, net (520) (382) (1,115)
Earnings before income taxes $ 2,842 $ 3,124 $ 1,454
(1) During the first quarter of 2018, in connection with adopting a new pension cost classification accounting standard, we reclassified certain of our benefit plan componentcosts other than service costs out of operating income into a new line item, benefit plan non-service income, on our consolidated statements of earnings. As such, we haverecast our historical operating income and segment operating income to reflect this reclassification, which had no impact to earnings before income taxes or net earnings.
43
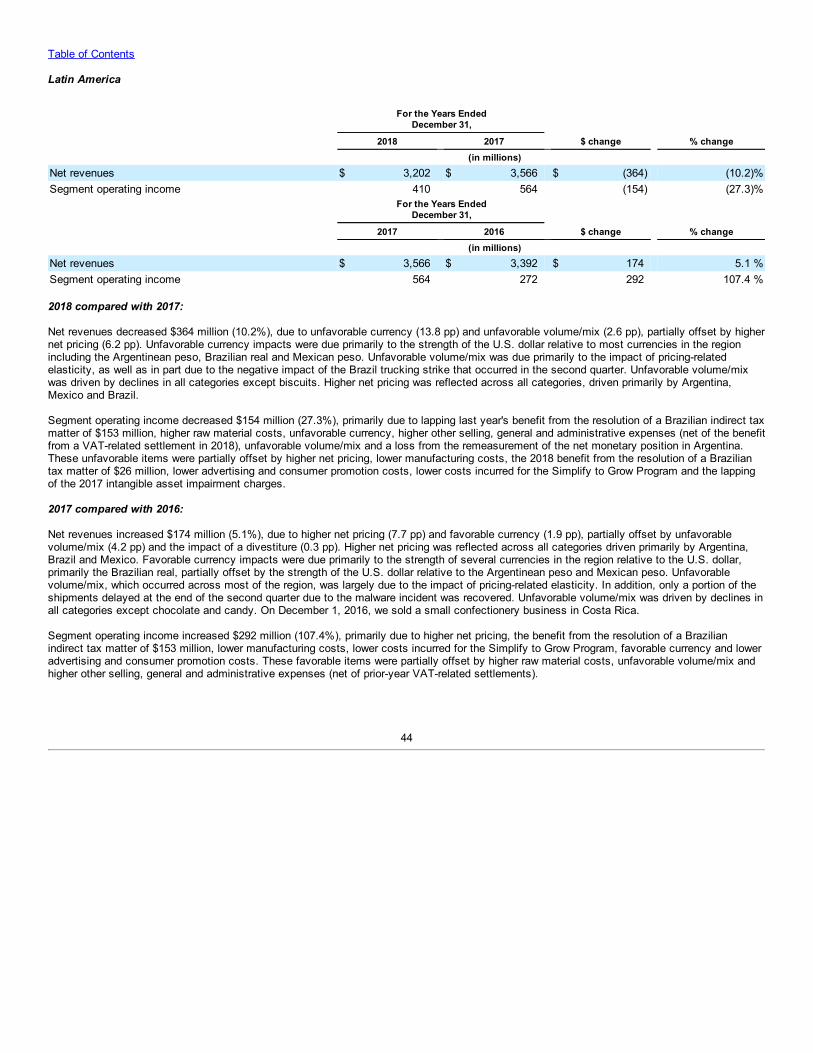
Table of Contents
Latin America
For the Years Ended
December 31,
2018 2017 $ change % change (in millions)
Net revenues $ 3,202 $ 3,566 $ (364) (10.2)%Segment operating income 410 564 (154) (27.3)%
For the Years Ended
December 31,
2017 2016 $ change % change (in millions)
Net revenues $ 3,566 $ 3,392 $ 174 5.1 %Segment operating income 564 272 292 107.4 %
2018 compared with 2017:
Net revenues decreased $364 million (10.2%), due to unfavorable currency (13.8 pp) and unfavorable volume/mix (2.6 pp), partially offset by highernet pricing (6.2 pp). Unfavorable currency impacts were due primarily to the strength of the U.S. dollar relative to most currencies in the regionincluding the Argentinean peso, Brazilian real and Mexican peso. Unfavorable volume/mix was due primarily to the impact of pricing-relatedelasticity, as well as in part due to the negative impact of the Brazil trucking strike that occurred in the second quarter. Unfavorable volume/mixwas driven by declines in all categories except biscuits. Higher net pricing was reflected across all categories, driven primarily by Argentina,Mexico and Brazil.
Segment operating income decreased $154 million (27.3%), primarily due to lapping last year's benefit from the resolution of a Brazilian indirect taxmatter of $153 million, higher raw material costs, unfavorable currency, higher other selling, general and administrative expenses (net of the benefitfrom a VAT-related settlement in 2018), unfavorable volume/mix and a loss from the remeasurement of the net monetary position in Argentina.These unfavorable items were partially offset by higher net pricing, lower manufacturing costs, the 2018 benefit from the resolution of a Braziliantax matter of $26 million, lower advertising and consumer promotion costs, lower costs incurred for the Simplify to Grow Program and the lappingof the 2017 intangible asset impairment charges.
2017 compared with 2016:
Net revenues increased $174 million (5.1%), due to higher net pricing (7.7 pp) and favorable currency (1.9 pp), partially offset by unfavorablevolume/mix (4.2 pp) and the impact of a divestiture (0.3 pp). Higher net pricing was reflected across all categories driven primarily by Argentina,Brazil and Mexico. Favorable currency impacts were due primarily to the strength of several currencies in the region relative to the U.S. dollar,primarily the Brazilian real, partially offset by the strength of the U.S. dollar relative to the Argentinean peso and Mexican peso. Unfavorablevolume/mix, which occurred across most of the region, was largely due to the impact of pricing-related elasticity. In addition, only a portion of theshipments delayed at the end of the second quarter due to the malware incident was recovered. Unfavorable volume/mix was driven by declines inall categories except chocolate and candy. On December 1, 2016, we sold a small confectionery business in Costa Rica.
Segment operating income increased $292 million (107.4%), primarily due to higher net pricing, the benefit from the resolution of a Brazilianindirect tax matter of $153 million, lower manufacturing costs, lower costs incurred for the Simplify to Grow Program, favorable currency and loweradvertising and consumer promotion costs. These favorable items were partially offset by higher raw material costs, unfavorable volume/mix andhigher other selling, general and administrative expenses (net of prior-year VAT-related settlements).
44
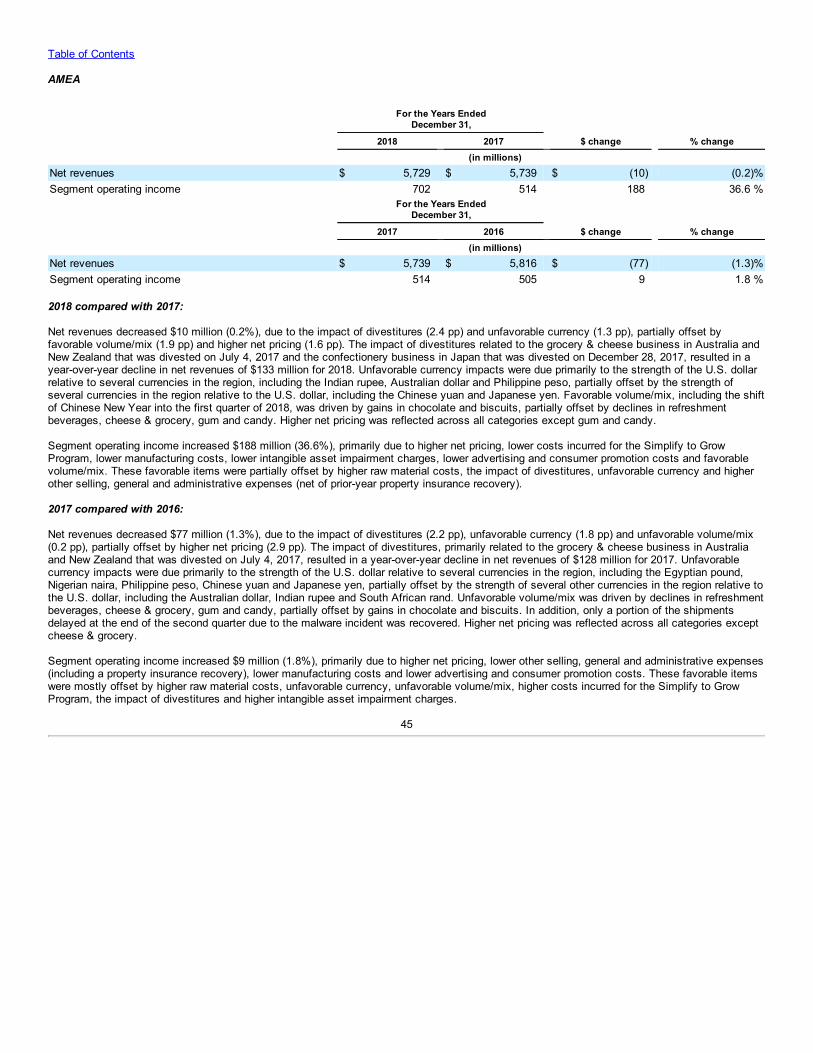
Table of Contents
AMEA
For the Years Ended
December 31,
2018 2017 $ change % change (in millions)
Net revenues $ 5,729 $ 5,739 $ (10) (0.2)%Segment operating income 702 514 188 36.6 %
For the Years Ended
December 31,
2017 2016 $ change % change (in millions)
Net revenues $ 5,739 $ 5,816 $ (77) (1.3)%Segment operating income 514 505 9 1.8 %
2018 compared with 2017:
Net revenues decreased $10 million (0.2%), due to the impact of divestitures (2.4 pp) and unfavorable currency (1.3 pp), partially offset byfavorable volume/mix (1.9 pp) and higher net pricing (1.6 pp). The impact of divestitures related to the grocery & cheese business in Australia andNew Zealand that was divested on July 4, 2017 and the confectionery business in Japan that was divested on December 28, 2017, resulted in ayear-over-year decline in net revenues of $133 million for 2018. Unfavorable currency impacts were due primarily to the strength of the U.S. dollarrelative to several currencies in the region, including the Indian rupee, Australian dollar and Philippine peso, partially offset by the strength ofseveral currencies in the region relative to the U.S. dollar, including the Chinese yuan and Japanese yen. Favorable volume/mix, including the shiftof Chinese New Year into the first quarter of 2018, was driven by gains in chocolate and biscuits, partially offset by declines in refreshmentbeverages, cheese & grocery, gum and candy. Higher net pricing was reflected across all categories except gum and candy.
Segment operating income increased $188 million (36.6%), primarily due to higher net pricing, lower costs incurred for the Simplify to GrowProgram, lower manufacturing costs, lower intangible asset impairment charges, lower advertising and consumer promotion costs and favorablevolume/mix. These favorable items were partially offset by higher raw material costs, the impact of divestitures, unfavorable currency and higherother selling, general and administrative expenses (net of prior-year property insurance recovery).
2017 compared with 2016:
Net revenues decreased $77 million (1.3%), due to the impact of divestitures (2.2 pp), unfavorable currency (1.8 pp) and unfavorable volume/mix(0.2 pp), partially offset by higher net pricing (2.9 pp). The impact of divestitures, primarily related to the grocery & cheese business in Australiaand New Zealand that was divested on July 4, 2017, resulted in a year-over-year decline in net revenues of $128 million for 2017. Unfavorablecurrency impacts were due primarily to the strength of the U.S. dollar relative to several currencies in the region, including the Egyptian pound,Nigerian naira, Philippine peso, Chinese yuan and Japanese yen, partially offset by the strength of several other currencies in the region relative tothe U.S. dollar, including the Australian dollar, Indian rupee and South African rand. Unfavorable volume/mix was driven by declines in refreshmentbeverages, cheese & grocery, gum and candy, partially offset by gains in chocolate and biscuits. In addition, only a portion of the shipmentsdelayed at the end of the second quarter due to the malware incident was recovered. Higher net pricing was reflected across all categories exceptcheese & grocery.
Segment operating income increased $9 million (1.8%), primarily due to higher net pricing, lower other selling, general and administrative expenses(including a property insurance recovery), lower manufacturing costs and lower advertising and consumer promotion costs. These favorable itemswere mostly offset by higher raw material costs, unfavorable currency, unfavorable volume/mix, higher costs incurred for the Simplify to GrowProgram, the impact of divestitures and higher intangible asset impairment charges.
45
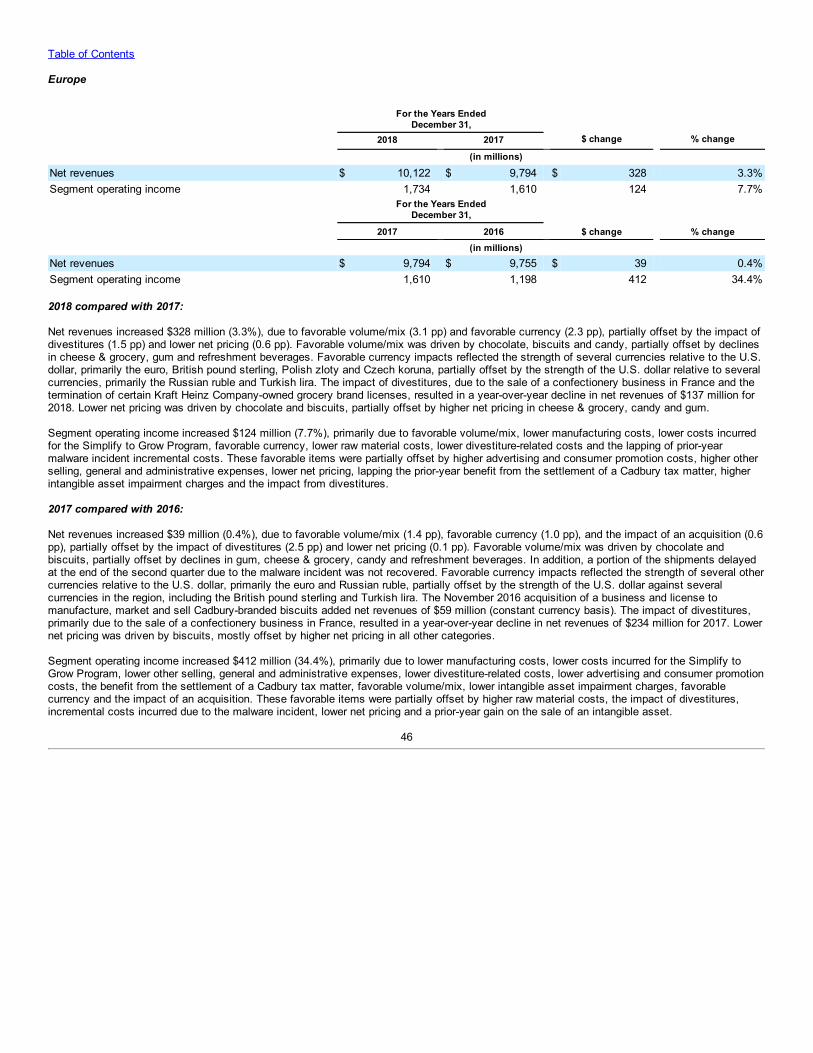
Table of Contents
Europe
For the Years Ended
December 31,
2018 2017 $ change % change
(in millions)
Net revenues $ 10,122 $ 9,794 $ 328 3.3%Segment operating income 1,734 1,610 124 7.7%
For the Years Ended
December 31,
2017 2016 $ change % change (in millions)
Net revenues $ 9,794 $ 9,755 $ 39 0.4%Segment operating income 1,610 1,198 412 34.4%
2018 compared with 2017:
Net revenues increased $328 million (3.3%), due to favorable volume/mix (3.1 pp) and favorable currency (2.3 pp), partially offset by the impact ofdivestitures (1.5 pp) and lower net pricing (0.6 pp). Favorable volume/mix was driven by chocolate, biscuits and candy, partially offset by declinesin cheese & grocery, gum and refreshment beverages. Favorable currency impacts reflected the strength of several currencies relative to the U.S.dollar, primarily the euro, British pound sterling, Polish zloty and Czech koruna, partially offset by the strength of the U.S. dollar relative to severalcurrencies, primarily the Russian ruble and Turkish lira. The impact of divestitures, due to the sale of a confectionery business in France and thetermination of certain Kraft Heinz Company-owned grocery brand licenses, resulted in a year-over-year decline in net revenues of $137 million for2018. Lower net pricing was driven by chocolate and biscuits, partially offset by higher net pricing in cheese & grocery, candy and gum.
Segment operating income increased $124 million (7.7%), primarily due to favorable volume/mix, lower manufacturing costs, lower costs incurredfor the Simplify to Grow Program, favorable currency, lower raw material costs, lower divestiture-related costs and the lapping of prior-yearmalware incident incremental costs. These favorable items were partially offset by higher advertising and consumer promotion costs, higher otherselling, general and administrative expenses, lower net pricing, lapping the prior-year benefit from the settlement of a Cadbury tax matter, higherintangible asset impairment charges and the impact from divestitures.
2017 compared with 2016:
Net revenues increased $39 million (0.4%), due to favorable volume/mix (1.4 pp), favorable currency (1.0 pp), and the impact of an acquisition (0.6pp), partially offset by the impact of divestitures (2.5 pp) and lower net pricing (0.1 pp). Favorable volume/mix was driven by chocolate andbiscuits, partially offset by declines in gum, cheese & grocery, candy and refreshment beverages. In addition, a portion of the shipments delayedat the end of the second quarter due to the malware incident was not recovered. Favorable currency impacts reflected the strength of several othercurrencies relative to the U.S. dollar, primarily the euro and Russian ruble, partially offset by the strength of the U.S. dollar against severalcurrencies in the region, including the British pound sterling and Turkish lira. The November 2016 acquisition of a business and license tomanufacture, market and sell Cadbury-branded biscuits added net revenues of $59 million (constant currency basis). The impact of divestitures,primarily due to the sale of a confectionery business in France, resulted in a year-over-year decline in net revenues of $234 million for 2017. Lowernet pricing was driven by biscuits, mostly offset by higher net pricing in all other categories.
Segment operating income increased $412 million (34.4%), primarily due to lower manufacturing costs, lower costs incurred for the Simplify toGrow Program, lower other selling, general and administrative expenses, lower divestiture-related costs, lower advertising and consumer promotioncosts, the benefit from the settlement of a Cadbury tax matter, favorable volume/mix, lower intangible asset impairment charges, favorablecurrency and the impact of an acquisition. These favorable items were partially offset by higher raw material costs, the impact of divestitures,incremental costs incurred due to the malware incident, lower net pricing and a prior-year gain on the sale of an intangible asset.
46
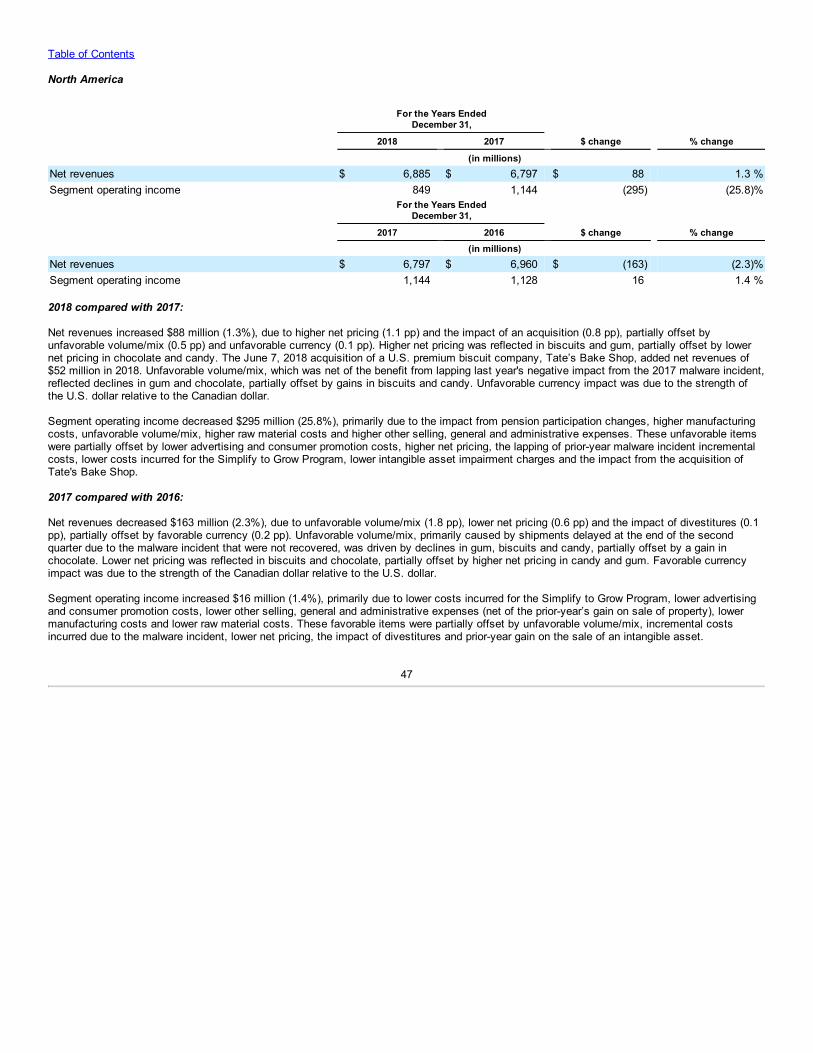
Table of Contents
North America
For the Years Ended
December 31, 2018 2017 $ change % change
(in millions) Net revenues $ 6,885 $ 6,797 $ 88 1.3 %Segment operating income 849 1,144 (295) (25.8)%
For the Years Ended
December 31,
2017 2016 $ change % change (in millions)
Net revenues $ 6,797 $ 6,960 $ (163) (2.3)%Segment operating income 1,144 1,128 16 1.4 %
2018 compared with 2017:
Net revenues increased $88 million (1.3%), due to higher net pricing (1.1 pp) and the impact of an acquisition (0.8 pp), partially offset byunfavorable volume/mix (0.5 pp) and unfavorable currency (0.1 pp). Higher net pricing was reflected in biscuits and gum, partially offset by lowernet pricing in chocolate and candy. The June 7, 2018 acquisition of a U.S. premium biscuit company, Tate’s Bake Shop, added net revenues of$52 million in 2018. Unfavorable volume/mix, which was net of the benefit from lapping last year's negative impact from the 2017 malware incident,reflected declines in gum and chocolate, partially offset by gains in biscuits and candy. Unfavorable currency impact was due to the strength ofthe U.S. dollar relative to the Canadian dollar.
Segment operating income decreased $295 million (25.8%), primarily due to the impact from pension participation changes, higher manufacturingcosts, unfavorable volume/mix, higher raw material costs and higher other selling, general and administrative expenses. These unfavorable itemswere partially offset by lower advertising and consumer promotion costs, higher net pricing, the lapping of prior-year malware incident incrementalcosts, lower costs incurred for the Simplify to Grow Program, lower intangible asset impairment charges and the impact from the acquisition ofTate's Bake Shop.
2017 compared with 2016:
Net revenues decreased $163 million (2.3%), due to unfavorable volume/mix (1.8 pp), lower net pricing (0.6 pp) and the impact of divestitures (0.1pp), partially offset by favorable currency (0.2 pp). Unfavorable volume/mix, primarily caused by shipments delayed at the end of the secondquarter due to the malware incident that were not recovered, was driven by declines in gum, biscuits and candy, partially offset by a gain inchocolate. Lower net pricing was reflected in biscuits and chocolate, partially offset by higher net pricing in candy and gum. Favorable currencyimpact was due to the strength of the Canadian dollar relative to the U.S. dollar.
Segment operating income increased $16 million (1.4%), primarily due to lower costs incurred for the Simplify to Grow Program, lower advertisingand consumer promotion costs, lower other selling, general and administrative expenses (net of the prior-year’s gain on sale of property), lowermanufacturing costs and lower raw material costs. These favorable items were partially offset by unfavorable volume/mix, incremental costsincurred due to the malware incident, lower net pricing, the impact of divestitures and prior-year gain on the sale of an intangible asset.
47
Table of Contents
Critical Accounting Estimates
We prepare our consolidated financial statements in conformity with U.S. GAAP. The preparation of these financial statements requires the use ofestimates, judgments and assumptions that affect the reported amounts of assets and liabilities at the date of the financial statements andreported amounts of revenues and expenses during the periods presented. Actual results could differ from those estimates and assumptions. Note1, Summary of Significant Accounting Policies, to the consolidated financial statements includes a summary of the significant accounting policieswe used to prepare our consolidated financial statements. We have discussed the selection and disclosure of our critical accounting policies andestimates with our Audit Committee. The following is a review of our most significant assumptions and estimates.
Goodwill and Non-Amortizable Intangible Assets:We test goodwill and non-amortizable intangible assets for impairment on an annual basis on July 1. We assess goodwill impairment riskthroughout the year by performing a qualitative review of entity-specific, industry, market and general economic factors affecting our goodwillreporting units. We review our operating segment and reporting unit structure for goodwill testing annually or as significant changes in theorganization occur. Annually, we may perform qualitative testing, or depending on factors such as prior-year test results, current yeardevelopments, current risk evaluations and other practical considerations, we may elect to do quantitative testing instead. In our quantitativetesting, we compare a reporting unit’s estimated fair value with its carrying value. We estimate a reporting unit’s fair value using a discounted cashflow method which incorporates planned growth rates, market-based discount rates and estimates of residual value. This year, for our Europe andNorth America reporting units, we used a market-based, weighted-average cost of capital of 7.3% to discount the projected cash flows of thoseoperations. For our Latin America and AMEA reporting units, we used a risk-rated discount rate of 10.3%. Estimating the fair value of individualreporting units requires us to make assumptions and estimates regarding our future plans and industry and economic conditions, and our actualresults and conditions may differ over time. If the carrying value of a reporting unit’s net assets exceeds its fair value, we would recognize animpairment charge for the amount by which the carrying value exceeds the reporting unit fair value.
In 2018, 2017 and 2016, there were no impairments of goodwill. In connection with our 2018 annual impairment testing, each of our reporting unitshad sufficient fair value in excess of carrying value. While all reporting units passed our annual impairment testing, if planned businessperformance expectations are not met or specific valuation factors outside of our control, such as discount rates, change significantly, then theestimated fair values of a reporting unit or reporting units might decline and lead to a goodwill impairment in the future.
Annually, we assess non-amortizable intangible assets for impairment by performing a qualitative review and assessing events and circumstancesthat could affect the fair value or carrying value of the indefinite-lived intangible assets. If significant potential impairment risk exists for a specificasset, we quantitatively test it for impairment by comparing its estimated fair value with its carrying value. We determine estimated fair value usingplanned growth rates, market-based discount rates and estimates of royalty rates. If the carrying value of the asset exceeds its estimated fairvalue, the asset is impaired and its carrying value is reduced to the estimated fair value.
During our 2018 annual testing of non-amortizable intangible assets, we recorded $68 million of impairment charges in the third quarter of 2018related to five trademarks. The impairments arose due to lower than expected product growth. We recorded charges related to gum, chocolate,biscuits and candy trademarks of $45 million in Europe, $14 million in North America and $9 million in AMEA. The impairment charges werecalculated as the excess of the carrying value over the estimated fair value of the intangible assets on a global basis and were recorded withinasset impairment and exit costs. We primarily use a relief of royalty valuation method, which utilizes estimates of future sales, growth rates,royalty rates and discount rates in determining a brand's global fair value. We also identified seven brands, including the five impaired trademarks,with $538 million of aggregate book value as of December 31, 2018 that each had a fair value in excess of book value of 10% or less. We believeour current plans for each of these brands will allow them to continue to not be impaired, but if the product line expectations are not met or specificvaluation factors outside of our control, such as discount rates, change significantly, then a brand or brands could become impaired in the future.In 2017, we recorded charges related to candy and gum trademarks of $52 million in AMEA, $11 million in Europe, $5 million in Latin America and$2 million in North America. In 2016, we recorded charges related to biscuits, candy and gum trademarks of $41 million in AMEA, $32 million inNorth America, $22 million in Europe, and $3 million in Latin America.
Refer to Note 5, Goodwill and Intangible Assets, for additional information.
48
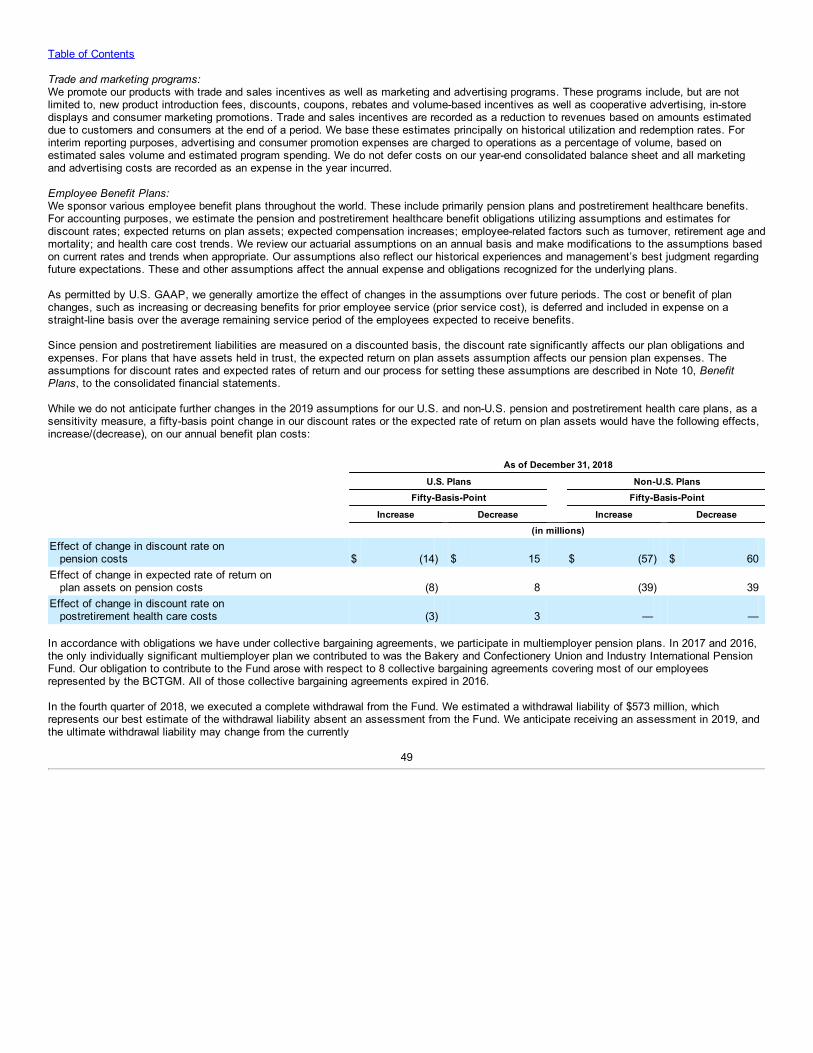
Table of Contents
Trade and marketing programs:We promote our products with trade and sales incentives as well as marketing and advertising programs. These programs include, but are notlimited to, new product introduction fees, discounts, coupons, rebates and volume-based incentives as well as cooperative advertising, in-storedisplays and consumer marketing promotions. Trade and sales incentives are recorded as a reduction to revenues based on amounts estimateddue to customers and consumers at the end of a period. We base these estimates principally on historical utilization and redemption rates. Forinterim reporting purposes, advertising and consumer promotion expenses are charged to operations as a percentage of volume, based onestimated sales volume and estimated program spending. We do not defer costs on our year-end consolidated balance sheet and all marketingand advertising costs are recorded as an expense in the year incurred.
Employee Benefit Plans:We sponsor various employee benefit plans throughout the world. These include primarily pension plans and postretirement healthcare benefits.For accounting purposes, we estimate the pension and postretirement healthcare benefit obligations utilizing assumptions and estimates fordiscount rates; expected returns on plan assets; expected compensation increases; employee-related factors such as turnover, retirement age andmortality; and health care cost trends. We review our actuarial assumptions on an annual basis and make modifications to the assumptions basedon current rates and trends when appropriate. Our assumptions also reflect our historical experiences and management’s best judgment regardingfuture expectations. These and other assumptions affect the annual expense and obligations recognized for the underlying plans.
As permitted by U.S. GAAP, we generally amortize the effect of changes in the assumptions over future periods. The cost or benefit of planchanges, such as increasing or decreasing benefits for prior employee service (prior service cost), is deferred and included in expense on astraight-line basis over the average remaining service period of the employees expected to receive benefits.
Since pension and postretirement liabilities are measured on a discounted basis, the discount rate significantly affects our plan obligations andexpenses. For plans that have assets held in trust, the expected return on plan assets assumption affects our pension plan expenses. Theassumptions for discount rates and expected rates of return and our process for setting these assumptions are described in Note 10, BenefitPlans, to the consolidated financial statements.
While we do not anticipate further changes in the 2019 assumptions for our U.S. and non-U.S. pension and postretirement health care plans, as asensitivity measure, a fifty-basis point change in our discount rates or the expected rate of return on plan assets would have the following effects,increase/(decrease), on our annual benefit plan costs:
As of December 31, 2018
U.S. Plans Non-U.S. Plans
Fifty-Basis-Point Fifty-Basis-Point
Increase Decrease Increase Decrease (in millions)Effect of change in discount rate on pension costs $ (14) $ 15 $ (57) $ 60Effect of change in expected rate of return on plan assets on pension costs (8) 8 (39) 39Effect of change in discount rate on postretirement health care costs (3) 3 — —
In accordance with obligations we have under collective bargaining agreements, we participate in multiemployer pension plans. In 2017 and 2016,the only individually significant multiemployer plan we contributed to was the Bakery and Confectionery Union and Industry International PensionFund. Our obligation to contribute to the Fund arose with respect to 8 collective bargaining agreements covering most of our employeesrepresented by the BCTGM. All of those collective bargaining agreements expired in 2016.
In the fourth quarter of 2018, we executed a complete withdrawal from the Fund. We estimated a withdrawal liability of $573 million, whichrepresents our best estimate of the withdrawal liability absent an assessment from the Fund. We anticipate receiving an assessment in 2019, andthe ultimate withdrawal liability may change from the currently
49
Table of Contents
estimated amount. We will record any future adjustments in the period during which the liability is confirmed or as new information becomesavailable. We expect to pay the liability over a period of 20 years from the date of the assessment. During 2018, within our North Americasegment, we recorded a discounted liability and related charge of $423 million or $316 million net of tax. We determined the net present value ofthe liability using a risk-free interest rate. We recorded the pre-tax non-cash charges in selling, general and administrative expense (and in othernon-cash items, net in the consolidated statement of cash flows) and the liability in long-term other liabilities. During 2018, we also recorded $6million of accreted interest related to the long-term liability within interest and other expense, net.
See additional information on our employee benefit plans in Note 10, Benefit Plans.
Income Taxes:As a global company, we calculate and provide for income taxes in each tax jurisdiction in which we operate. The provision for income taxesincludes the amounts payable or refundable for the current year, the effect of deferred taxes and impacts from uncertain tax positions. Ourprovision for income taxes is significantly affected by shifts in the geographic mix of our pre-tax earnings across tax jurisdictions, changes in taxlaws and regulations, tax planning opportunities available in each tax jurisdiction and the ultimate outcome of various tax audits.
Deferred tax assets and liabilities are recognized for the expected future tax consequences of temporary differences between the financialstatement and tax bases of our assets and liabilities and for operating losses and tax credit carryforwards. Deferred tax assets and liabilities aremeasured using enacted tax rates that will apply to taxable income in the years in which those differences are expected to be recovered or settled.Valuation allowances are established for deferred tax assets when it is more likely than not that a tax benefit will not be realized.
We believe our tax positions comply with applicable tax laws and that we have properly accounted for uncertain tax positions. We recognize taxbenefits in our financial statements from uncertain tax positions only if it is more likely than not that the tax position will be sustained by the taxingauthorities based on the technical merits of the position. The amount we recognize is measured as the largest amount of benefit that is greaterthan 50 percent likely of being realized upon resolution. We evaluate uncertain tax positions on an ongoing basis and adjust the amount recognizedin light of changing facts and circumstances, such as the progress of a tax audit or expiration of a statute of limitations. We believe the estimatesand assumptions used to support our evaluation of uncertain tax positions are reasonable. However, final determination of historical tax liabilities,whether by settlement with tax authorities, judicial or administrative ruling or due to expiration of statutes of limitations, could be materiallydifferent from estimates reflected on our consolidated balance sheet and historical income tax provisions. The outcome of these finaldeterminations could have a material effect on our provision for income taxes, net earnings or cash flows in the period in which the determinationis made.
As a result of U.S. tax reform and the related SEC guidance, we finalized our accounting for the legislation based on guidance that was issuedprior to 2018 year end and included updates to the prior provisional estimates in our 2018 consolidated financial statements. See Note 15, IncomeTaxes, for further discussion of the amounts recorded related to U.S. tax reform in our financial statements, as well as additional information onour effective tax rate, current and deferred taxes, valuation allowances and unrecognized tax benefits.
Contingencies:See Note 13, Commitments and Contingencies, to the consolidated financial statements.
New Accounting Guidance:See Note 1, Summary of Significant Accounting Policies, to the consolidated financial statements for a discussion of new accounting standards.
50
Table of Contents
Liquidity and Capital Resources
We believe that cash from operations, our revolving credit facilities, short-term borrowings and our authorized long-term financing will providesufficient liquidity for our working capital needs, planned capital expenditures and future payments of our U.S. tax reform transition tax liability,contractual and benefit plan obligations, share repurchases and quarterly dividends. We continue to utilize our commercial paper program,international credit lines and long-term debt issuances for our funding requirements. We also use intercompany loans with our internationalsubsidiaries to improve financial flexibility. Overall, we do not expect any negative effects to our funding sources that would have a material effecton our liquidity.
Net Cash Provided by Operating Activities:Operating activities provided net cash of $3,948 million in 2018, $2,593 million in 2017 and $2,838 million in 2016. The increase in net cashprovided by operating activities in 2018 relative to 2017 was due primarily to higher cash flow from working capital, higher net earnings as well aslower pension contributions. Cash flows from operating activities were lower in 2017 than 2016 primarily due to increases in working capitalincluding higher tax and VAT-related payments in 2017 and lower operating cash flows from divested businesses, partially offset by higher netearnings and lower pension contributions in 2017.
Net Cash Used in Investing Activities:Net cash used in investing activities was $1,224 million in 2018, $301 million in 2017 and $1,029 million in 2016. The increase in net cash used ininvesting activities in 2018 relative to 2017 was primarily due to cash received in 2017 from proceeds from divestitures, cash expenditures in 2018for an acquisition and higher capital expenditures in 2018, partially offset by cash received as a result of the settlement and replacement of severalnet investment hedge derivative contracts. The decrease in net cash used in investing activities in 2017 relative to 2016 was due to higher netproceeds received from divestitures in 2017, no acquisition-related payments in 2017 as in 2016 and lower capital expenditures in 2017.
Capital expenditures were $1,095 million in 2018, $1,014 million in 2017 and $1,224 million in 2016. We continue to make capital expendituresprimarily to modernize manufacturing facilities and support new product and productivity initiatives. We expect 2019 capital expenditures to be upto $1.0 billion, including capital expenditures in connection with our Simplify to Grow Program. We expect to continue to fund these expendituresfrom operations.
Net Cash Used in Financing Activities:Net cash used in financing activities was $2,329 million in 2018, $3,361 million in 2017 and $1,862 million in 2016. The decrease in net cash usedin financing activities in 2018 relative to 2017 was primarily due to higher net debt issuances and lower share repurchases partially offset by higherdividends paid. The increase in net cash used in financing activities in 2017 relative to 2016 was primarily due to lower net issuances of short-termand long-term debt as well as an increase in dividends paid, partly offset by lower share repurchases compared to 2016.
Debt:From time to time we refinance long-term and short-term debt. Refer to Note 8, Debt and Borrowing Arrangements, for details of our recent tenderoffers, debt issuances and maturities. The nature and amount of our long-term and short-term debt and the proportionate amount of each varies asa result of current and expected business requirements, market conditions and other factors. Due to seasonality, in the first and second quartersof the year, our working capital requirements grow, increasing the need for short-term financing. The second half of the year typically generateshigher cash flows. As such, we may issue commercial paper or secure other forms of financing throughout the year to meet short-term workingcapital or other financing needs.
During 2016, one of our subsidiaries, Mondelez International Holdings Netherlands B.V. (“MIHN”), issued debt totaling $4.5 billion. The operationsheld by MIHN generated approximately 74.1% (or $19.2 billion) of the $25.9 billion of consolidated net revenue during fiscal year 2018 andrepresented approximately 80.5% (or $20.7 billion) of the $25.7 billion of net assets as of December 31, 2018.
On February 7, 2019, our Board of Directors approved a new $5.0 billion long-term financing authority to replace the prior $5.0 billion authority. Asof December 31, 2018, we had $1.7 billion of long-term financing authority remaining.
51
Table of Contents
In the next 12 months, we expect approximately $2.7 billion of long-term debt will mature as follows: $400 million in February 2019 and $2.3 billionin October 2019. We expect to fund these repayments with a combination of cash from operations and the issuance of commercial paper or long-term debt.
Our total debt was $18.4 billion at December 31, 2018 and $17.7 billion at December 31, 2017. Our debt-to-capitalization ratio was 0.42 atDecember 31, 2018 and 0.40 at December 31, 2017. At December 31, 2018, the weighted-average term of our outstanding long-term debt was 5.8years. Our average daily commercial borrowings were $4.5 billion in 2018, $4.4 billion in 2017 and $2.2 billion in 2016. We had $3.1 billion ofcommercial paper borrowings outstanding at December 31, 2018 and $3.4 billion outstanding as of December 31, 2017. We expect to continue touse commercial paper to finance various short and long-term financing needs and to continue to comply with our long-term debt covenants. Referto Note 8, Debt and Borrowing Arrangements, for more information on our debt and debt covenants.
Commodity Trends
We regularly monitor worldwide supply, commodity cost and currency trends so we can cost-effectively secure ingredients, packaging and fuelrequired for production. During 2018, the primary drivers of the increase in our aggregate commodity costs were higher currency-related costs onour commodity purchases and increased costs for packaging, dairy, energy, grains, oils and other raw materials, partially offset by lower costs forcocoa, sugar and nuts.
A number of external factors such as weather conditions, commodity market conditions, currency fluctuations and the effects of governmentalagricultural or other programs affect the cost and availability of raw materials and agricultural materials used in our products. We address highercommodity costs and currency impacts primarily through hedging, higher pricing and manufacturing and overhead cost control. We use hedgingtechniques to limit the impact of fluctuations in the cost of our principal raw materials; however, we may not be able to fully hedge againstcommodity cost changes, such as dairy, where there is a limited ability to hedge, and our hedging strategies may not protect us from increases inspecific raw material costs. Due to competitive or market conditions, planned trade or promotional incentives, fluctuations in currency exchangerates or other factors, our pricing actions may also lag commodity cost changes temporarily.
We expect price volatility and a slightly higher aggregate cost environment to continue in 2019. While the costs of our principal raw materialsfluctuate, we believe there will continue to be an adequate supply of the raw materials we use and that they will generally remain available fromnumerous sources.
Off-Balance Sheet Arrangements and Aggregate Contractual Obligations
We have no significant off-balance sheet arrangements other than the contractual obligations discussed below.
Guarantees:As discussed in Note 13, Commitments and Contingencies, we enter into third-party guarantees primarily to cover the long-term obligations of ourvendors. As part of these transactions, we guarantee that third parties will make contractual payments or achieve performance measures. AtDecember 31, 2018, we had no material third-party guarantees recorded on our consolidated balance sheet.
Guarantees do not have, and we do not expect them to have, a material effect on our liquidity.
52
Table of Contents
Aggregate Contractual Obligations:The following table summarizes our contractual obligations at December 31, 2018.
Payments Due
Total 2019 2020-21 2022-23 2024 and Thereafter (in millions)Debt (1) $ 15,248 $ 2,647 $ 4,877 $ 2,548 $ 5,176Interest expense (2) 3,410 413 662 470 1,865Capital leases 2 1 1 — —Operating leases (3) 780 208 279 136 157Purchase obligations: (4)
Inventory and production costs 5,198 3,433 1,191 235 339Other 608 574 34 — —
25,246 7,276 7,044 3,389 7,537U.S. tax reform transition liability (5) 1,160 112 193 248 607Other long-term liabilities (6) 241 16 47 42 136Total $ 26,647 $ 7,404 $ 7,284 $ 3,679 $ 8,280 (1) Amounts include the expected cash payments of our debt excluding capital leases, which are presented separately in the table above. The amounts also
exclude $70 million of net unamortized non-cash bond premiums, discounts, bank fees and mark-to-market adjustments related to our interest rateswaps recorded in total debt.
(2) Amounts represent the expected cash payments of our interest expense on our long-term debt. Interest calculated on our euro, British pound sterling andSwiss franc notes was forecasted using currency exchange rates as of December 31, 2018. An insignificant amount of interest expense was excludedfrom the table for a portion of our other non-U.S. debt obligations due to the complexities involved in forecasting expected interest payments.
(3) Operating lease payments represent the minimum rental commitments under non-cancelable operating leases.(4) Purchase obligations for inventory and production costs (such as raw materials, indirect materials and supplies, packaging, co-manufacturing
arrangements, storage and distribution) are commitments for projected needs to be utilized in the normal course of business. Other purchase obligationsinclude commitments for marketing, advertising, capital expenditures, information technology and professional services. Arrangements are consideredpurchase obligations if a contract specifies all significant terms, including fixed or minimum quantities to be purchased, a pricing structure andapproximate timing of the transaction. Most arrangements are cancelable without a significant penalty and with short notice (usually 30 days). Anyamounts reflected on the consolidated balance sheet as accounts payable and accrued liabilities are excluded from the table above.
(5) In connection with U.S. tax reform, we currently estimate paying a total $1.3 billion transition tax liability through 2026. As of December 31, 2018, theamount outstanding was $1.2 billion. The amounts and timing of our tax payments are likely to change as a result of additional guidance issued. SeeNote 15, Income Taxes, for additional information on U.S. tax reform and its impact on our financial statements.
(6) Other long-term liabilities in the table above include both the current and long-term related liabilities. We have included the estimated future benefitpayments for our postretirement health care plans through December 31, 2028 of $198 million. We are unable to reliably estimate the timing of thepayments beyond 2028; as such, they are excluded from the above table. There are also another $15 million of various other long-term liabilities that areexpected to be paid over the next 5 years. In addition, the following long-term liabilities included on the consolidated balance sheet are excluded fromthe table above: accrued pension costs, estimated multiemployer pension plan withdrawal liabilities, unrecognized tax benefits, insurance accruals andother accruals. As of December 31, 2018, our unrecognized tax benefit, including associated interest and penalties, classified as a long-term payable is$550 million. We currently expect to make approximately $237 million in contributions to our pension plans in 2019. In 2018, we estimated amultiemployer pension plan withdrawal liability of $573 million. We anticipate receiving an assessment in 2019, and the ultimate withdrawal liability maychange from the currently estimated amount. We will record any future adjustments in the period during which the liability is confirmed or as newinformation becomes available. We expect to pay the liability over a period of 20 years from the date of the assessment.
53
Table of Contents
Equity and Dividends
Stock Plans:See Note 11, Stock Plans, to the consolidated financial statements for more information on our stock plans and grant activity during 2016-2018.
Share Repurchases:See Note 12, Capital Stock, to the consolidated financial statements for more information on our share repurchase program.
Between 2013 and 2017, our Board of Directors authorized the repurchase of a total of $13.7 billion of our Common Stock through December 31,2018. On January 31, 2018, our Finance Committee, with authorization delegated from our Board of Directors, approved an increase of $6.0 billionin the share repurchase program, raising the authorization to $19.7 billion of Common Stock repurchases, and extended the program throughDecember 31, 2020. We repurchased approximately $15.0 billion of shares ($2.0 billion in 2018, $2.2 billion in 2017, $2.6 billion in 2016, $3.6 billionin 2015, $1.9 billion in 2014 and $2.7 billion in 2013), at a weighted-average cost of $39.30 per share, through December 31, 2018. The number ofshares that we ultimately repurchase under our share repurchase program may vary depending on numerous factors, including share price andother market conditions, our ongoing capital allocation planning, levels of cash and debt balances, other demands for cash, such as acquisitionactivity, general economic or business conditions and board and management discretion. Additionally, our share repurchase activity during anyparticular period may fluctuate. We may accelerate, suspend, delay or discontinue our share repurchase program at any time, without notice.
Dividends:We paid dividends of $1,359 million in 2018, $1,198 million in 2017 and $1,094 million in 2016. On July 25, 2018, the Finance Committee, withauthorization delegated from our Board of Directors, declared a quarterly cash dividend of $0.26 per share of Class A Common Stock, an increaseof 18 percent, which would be $1.04 per common share on an annualized basis. On August 2, 2017, the Finance Committee, with authorizationdelegated from our Board of Directors, approved a 16% increase in the quarterly dividend to $0.22 per common share or $0.88 per common shareon an annualized basis. On July 19, 2016, our Board of Directors approved a 12% increase in the quarterly dividend to $0.19 per common share or$0.76 per common share on an annual basis. The declaration of dividends is subject to the discretion of our Board of Directors and depends onvarious factors, including our net earnings, financial condition, cash requirements, future prospects and other factors that our Board of Directorsdeems relevant to its analysis and decision making.
For U.S. income tax purposes only, the Company has determined that 100% of the distributions paid to its shareholders in 2018 are characterizedas a qualified dividend paid from U.S. earnings and profits. Shareholders should consult their tax advisors for a full understanding of the taxconsequences of the receipt of dividends.
54
Table of Contents
Non-GAAP Financial Measures
We use non-GAAP financial information and believe it is useful to investors as it provides additional information to facilitate comparisons ofhistorical operating results, identify trends in our underlying operating results and provide additional insight and transparency on how we evaluateour business. We use non-GAAP financial measures to budget, make operating and strategic decisions and evaluate our performance. We havedetailed the non-GAAP adjustments that we make in our non-GAAP definitions below. The adjustments generally fall within the followingcategories: acquisition & divestiture activities, gains and losses on intangible asset sales and non-cash impairments, major program restructuringactivities, constant currency and related adjustments, major program financing and hedging activities and other major items affecting comparabilityof operating results. We believe the non-GAAP measures should always be considered along with the related U.S. GAAP financial measures. Wehave provided the reconciliations between the GAAP and non-GAAP financial measures below, and we also discuss our underlying GAAP resultsthroughout our Management’s Discussion and Analysis of Financial Condition and Results of Operations in this Form 10-K.
Our primary non-GAAP financial measures are listed below and reflect how we evaluate our current and prior-year operating results. As new eventsor circumstances arise, these definitions could change. When our definitions change, we provide the updated definitions and present the relatednon-GAAP historical results on a comparable basis (1).
• “Organic Net Revenue” is defined as net revenues excluding the impacts of acquisitions, divestitures (2) and currency rate fluctuations (3).We also evaluate Organic Net Revenue growth from emerging markets and our Power Brands.• Our emerging markets include our Latin America region in its entirety; the AMEA region, excluding Australia, New Zealand and Japan;
and the following countries from the Europe region: Russia, Ukraine, Turkey, Kazakhstan, Belarus, Georgia, Poland, Czech Republic,Slovak Republic, Hungary, Bulgaria, Romania, the Baltics and the East Adriatic countries. (Our developed markets include the entireNorth America region, the Europe region excluding the countries included in the emerging markets definition, and Australia, NewZealand and Japan from the AMEA region.)
• Our Power Brands include some of our largest global and regional brands such as Oreo, Chips Ahoy!, Ritz, TUC/Club Social andbelVita biscuits; Cadbury Dairy Milk, Milka and Lacta chocolate; Trident gum; Halls candy and Tang powdered beverages. As we shiftour focus to invest in a wider group of global and local brands, after 2018, we will discontinue tracking Power Brands and haveincluded it here for a final full-year comparison of results on this basis.
• “Adjusted Operating Income” is defined as operating income excluding the impacts of the Simplify to Grow Program (4); gains or losses(including non-cash impairment charges) on goodwill and intangible assets; divestiture (2) or acquisition gains or losses and relateddivestiture (2), acquisition and integration costs (2); the operating results of divestitures (2); remeasurement of net monetary position (5); mark-to-market impacts from commodity and forecasted currency transaction derivative contracts (6); impact from resolution of tax matters (7);CEO transition remuneration (8); impact from pension participation changes (9); and incremental expenses related to the 2017 malwareincident. We also present “Adjusted Operating Income margin,” which is subject to the same adjustments as Adjusted Operating Income.We also evaluate growth in our Adjusted Operating Income on a constant currency basis (3).
• “Adjusted EPS” is defined as diluted EPS attributable to Mondelēz International from continuing operations excluding the impacts of theitems listed in the Adjusted Operating Income definition as well as losses on debt extinguishment and related expenses; gain on equitymethod investment transactions; net earnings from divestitures (2); gains or losses on interest rate swaps no longer designated asaccounting cash flow hedges due to changed financing and hedging plans and U.S. tax reform discrete impacts (10). Similarly, withinAdjusted EPS, our equity method investment net earnings exclude our proportionate share of our investees’ unusual or infrequent items(11). We also evaluate growth in our Adjusted EPS on a constant currency basis (3).
(1) When items no longer impact our current or future presentation of non-GAAP operating results, we remove these items from our non-GAAP definitions.During 2018, we added to the non-GAAP definitions the exclusion of: remeasurement gains or losses related to remeasuring net monetary assets orliabilities in Argentina (see footnote (5) below) and the impact from pension participation changes (see footnote (9) below).
(2) Divestitures include completed sales of businesses and exits of major product lines upon completion of a sale or licensing agreement. See Note 2,Divestitures and Acquisitions, for information on divestitures and acquisitions impacting the comparability of our results.
55
Table of Contents
(3) Constant currency operating results are calculated by dividing or multiplying, as appropriate, the current-period local currency operating results by thecurrency exchange rates used to translate the financial statements in the comparable prior-year period to determine what the current-period U.S. dollaroperating results would have been if the currency exchange rate had not changed from the comparable prior-year period.
(4) Non-GAAP adjustments related to the Simplify to Grow Program reflect costs incurred that relate to the objectives of our program to transform our supplychain network and organizational structure. Costs that do not meet the program objectives are not reflected in the non-GAAP adjustments.
(5) During the third quarter of 2018, as we began to apply highly inflationary accounting for Argentina, we excluded the remeasurement gains or lossesrelated to remeasuring net monetary assets or liabilities in Argentina to be consistent with our prior accounting for these remeasurement gains or lossesfor Venezuela when it was subject to highly inflationary accounting prior to 2016. See Note 1, Summary of Significant Accounting Policies, for moreinformation.
(6) During the third quarter of 2016, we began to exclude unrealized gains and losses (mark-to-market impacts) from outstanding commodity and forecastedcurrency transaction derivatives from our non-GAAP earnings measures until such time that the related exposures impact our operating results. Since wepurchase commodity and forecasted currency transaction contracts to mitigate price volatility primarily for inventory requirements in future periods, wemade this adjustment to remove the volatility of these future inventory purchases on current operating results to facilitate comparisons of our underlyingoperating performance across periods. We also discontinued designating commodity and forecasted currency transaction derivatives for hedgeaccounting treatment. To facilitate comparisons of our underlying operating results, we have recast all historical non-GAAP earnings measures toexclude the mark-to-market impacts.
(7) See Note 13, Commitments and Contingencies – Tax Matters, for additional information.(8) On November 20, 2017, Dirk Van de Put succeeded Irene Rosenfeld as CEO of Mondelēz International in advance of her retirement at the end of March
2018. In order to incent Mr. Van de Put to join us, we provided him compensation with a total combined target value of $42.5 million to make him wholefor incentive awards he forfeited or grants that were not made to him when he left his former employer. The compensation we granted took the form ofcash, deferred stock units, performance share units and stock options. In connection with Irene Rosenfeld’s retirement, we made her outstanding grantsof performance share units for the 2016-2018 and 2017-2019 performance cycles eligible for continued vesting and approved a $0.5 million salary forher service as Chairman from January through March 2018. We refer to these elements of Mr. Van de Put’s and Ms. Rosenfeld’s compensationarrangements together as “CEO transition remuneration.” We are excluding amounts we expense as CEO transition remuneration from our non-GAAPresults because those amounts are not part of our regular compensation program and are incremental to amounts we would have incurred as ongoingCEO compensation. As a result, in 2017, we excluded amounts expensed for the cash payment to Mr. Van de Put and partial vesting of his equity grants.In 2018, we excluded amounts paid for Ms. Rosenfeld’s service as Chairman and partial vesting of Mr. Van de Put’s and Ms. Rosenfeld’s equity grants.
(9) The impact from pension participation changes represents the charges incurred when employee groups are withdrawn from multiemployer pensionplans and other changes in employee group pension plan participation. We exclude these charges from our non–GAAP results because those amountsdo not reflect our ongoing pension obligations. See Note 10, Benefit Plans, for more information.
(10) On December 22, 2017, the United States enacted tax reform legislation that included a broad range of business tax provisions as further detailed inNote 15, Income Taxes. We exclude the discrete U.S. tax reform impacts from our Adjusted EPS as they do not reflect our ongoing tax obligations underU.S. tax reform.
(11) We have excluded our proportionate share of our equity method investees’ unusual or infrequent items such as acquisition and divestiture related costs,restructuring program costs and discrete U.S. tax reform impacts, in order to provide investors with a comparable view of our performance across periods.Although we have shareholder rights and board representation commensurate with our ownership interests in our equity method investees and reviewthe underlying operating results and unusual or infrequent items with them each reporting period, we do not have direct control over their operations orresulting revenue and expenses. Our use of equity method investment net earnings on an adjusted basis is not intended to imply that we have any suchcontrol. Our GAAP “diluted EPS attributable to Mondelēz International from continuing operations” includes all of the investees’ unusual and infrequentitems.
We believe that the presentation of these non-GAAP financial measures, when considered together with our U.S. GAAP financial measures andthe reconciliations to the corresponding U.S. GAAP financial measures, provides you with a more complete understanding of the factors andtrends affecting our business than could be obtained absent these disclosures. Because non-GAAP financial measures vary among companies,the non-GAAP financial measures presented in this report may not be comparable to similarly titled measures used by other companies. Our useof these non-GAAP financial measures is not meant to be considered in isolation or as a substitute for any U.S. GAAP financial measure. Alimitation of these non-GAAP financial measures is they exclude items detailed below that have an impact on our U.S. GAAP reported results. Thebest way this limitation can be addressed is by evaluating our non-GAAP financial measures in combination with our U.S. GAAP reported resultsand carefully evaluating the following tables that reconcile U.S. GAAP reported figures to the non-GAAP financial measures in this Form 10-K.
56
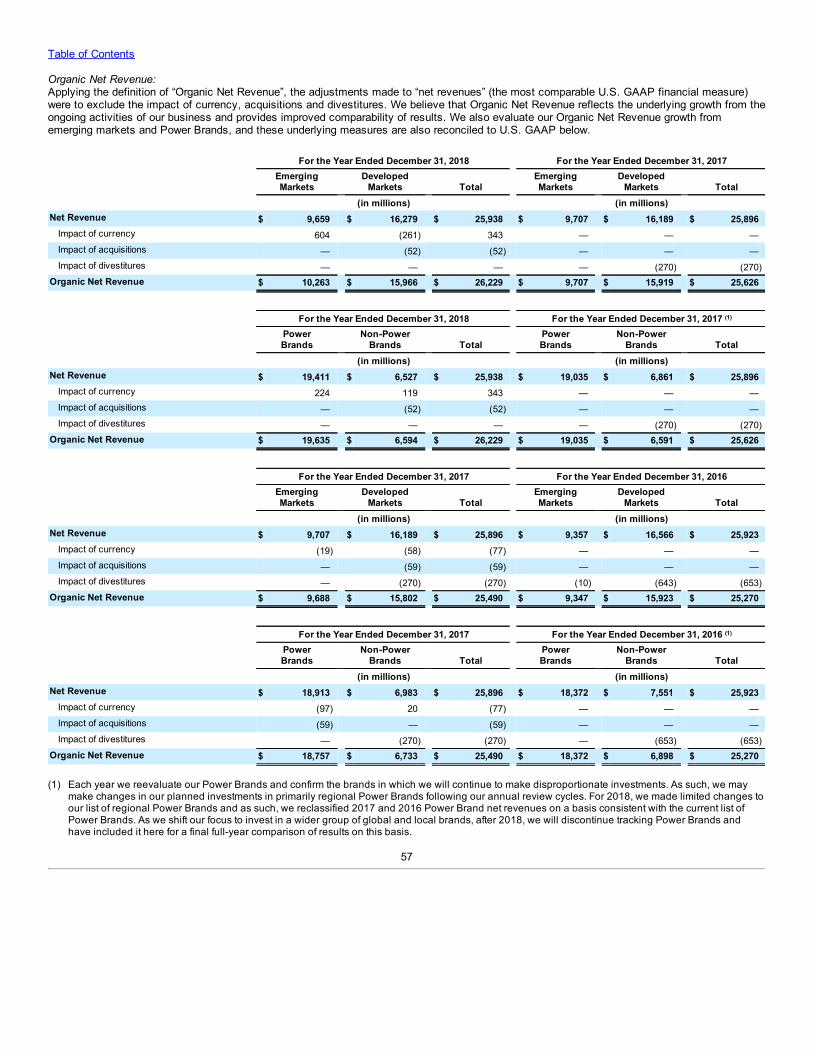
Table of Contents
Organic Net Revenue:Applying the definition of “Organic Net Revenue”, the adjustments made to “net revenues” (the most comparable U.S. GAAP financial measure)were to exclude the impact of currency, acquisitions and divestitures. We believe that Organic Net Revenue reflects the underlying growth from theongoing activities of our business and provides improved comparability of results. We also evaluate our Organic Net Revenue growth fromemerging markets and Power Brands, and these underlying measures are also reconciled to U.S. GAAP below.
For the Year Ended December 31, 2018 For the Year Ended December 31, 2017
EmergingMarkets
DevelopedMarkets Total
EmergingMarkets
DevelopedMarkets Total
(in millions) (in millions)Net Revenue $ 9,659 $ 16,279 $ 25,938 $ 9,707 $ 16,189 $ 25,896
Impact of currency 604 (261) 343 — — —Impact of acquisitions — (52) (52) — — —Impact of divestitures — — — — (270) (270)
Organic Net Revenue $ 10,263 $ 15,966 $ 26,229 $ 9,707 $ 15,919 $ 25,626
For the Year Ended December 31, 2018 For the Year Ended December 31, 2017 (1)
PowerBrands
Non-PowerBrands Total
PowerBrands
Non-PowerBrands Total
(in millions) (in millions)Net Revenue $ 19,411 $ 6,527 $ 25,938 $ 19,035 $ 6,861 $ 25,896
Impact of currency 224 119 343 — — —Impact of acquisitions — (52) (52) — — —Impact of divestitures — — — — (270) (270)
Organic Net Revenue $ 19,635 $ 6,594 $ 26,229 $ 19,035 $ 6,591 $ 25,626
For the Year Ended December 31, 2017 For the Year Ended December 31, 2016
EmergingMarkets
DevelopedMarkets Total
EmergingMarkets
DevelopedMarkets Total
(in millions) (in millions)Net Revenue $ 9,707 $ 16,189 $ 25,896 $ 9,357 $ 16,566 $ 25,923
Impact of currency (19) (58) (77) — — —Impact of acquisitions — (59) (59) — — —Impact of divestitures — (270) (270) (10) (643) (653)
Organic Net Revenue $ 9,688 $ 15,802 $ 25,490 $ 9,347 $ 15,923 $ 25,270
For the Year Ended December 31, 2017 For the Year Ended December 31, 2016 (1)
PowerBrands
Non-PowerBrands Total
PowerBrands
Non-PowerBrands Total
(in millions) (in millions)Net Revenue $ 18,913 $ 6,983 $ 25,896 $ 18,372 $ 7,551 $ 25,923
Impact of currency (97) 20 (77) — — —Impact of acquisitions (59) — (59) — — —Impact of divestitures — (270) (270) — (653) (653)
Organic Net Revenue $ 18,757 $ 6,733 $ 25,490 $ 18,372 $ 6,898 $ 25,270
(1) Each year we reevaluate our Power Brands and confirm the brands in which we will continue to make disproportionate investments. As such, we maymake changes in our planned investments in primarily regional Power Brands following our annual review cycles. For 2018, we made limited changes toour list of regional Power Brands and as such, we reclassified 2017 and 2016 Power Brand net revenues on a basis consistent with the current list ofPower Brands. As we shift our focus to invest in a wider group of global and local brands, after 2018, we will discontinue tracking Power Brands andhave included it here for a final full-year comparison of results on this basis.
57
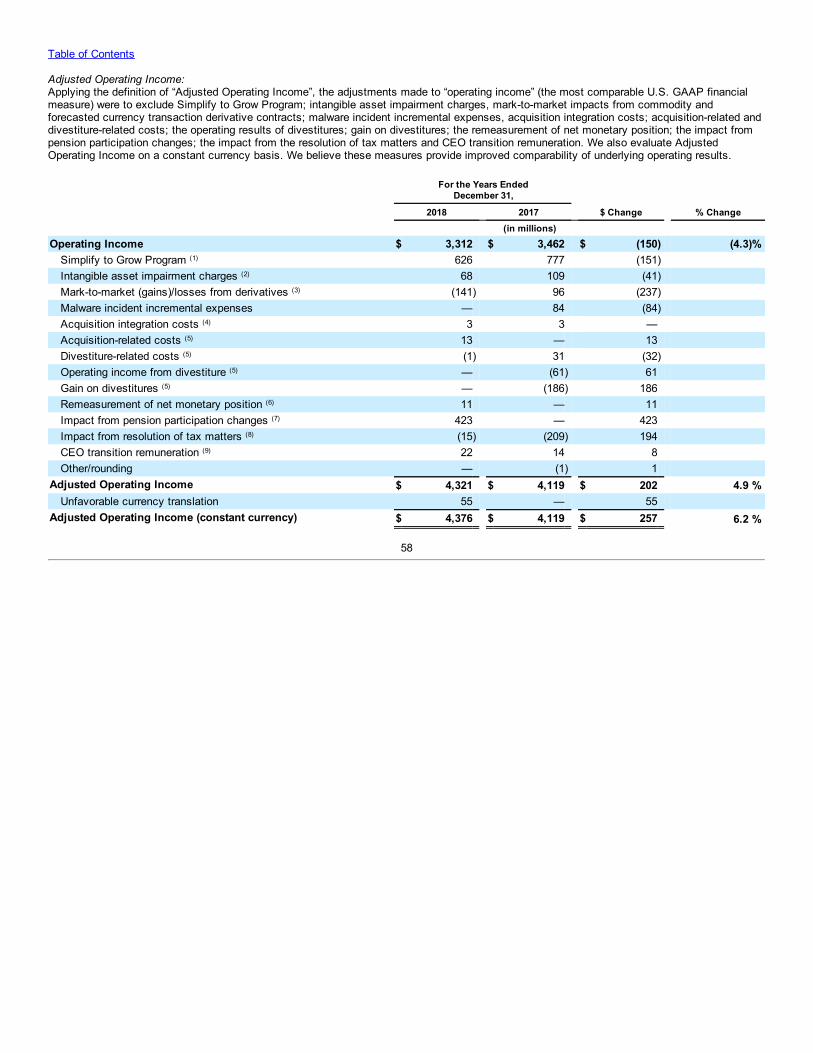
Table of Contents
Adjusted Operating Income:Applying the definition of “Adjusted Operating Income”, the adjustments made to “operating income” (the most comparable U.S. GAAP financialmeasure) were to exclude Simplify to Grow Program; intangible asset impairment charges, mark-to-market impacts from commodity andforecasted currency transaction derivative contracts; malware incident incremental expenses, acquisition integration costs; acquisition-related anddivestiture-related costs; the operating results of divestitures; gain on divestitures; the remeasurement of net monetary position; the impact frompension participation changes; the impact from the resolution of tax matters and CEO transition remuneration. We also evaluate AdjustedOperating Income on a constant currency basis. We believe these measures provide improved comparability of underlying operating results.
For the Years Ended
December 31, 2018 2017 $ Change % Change (in millions)
Operating Income $ 3,312 $ 3,462 $ (150) (4.3)%Simplify to Grow Program (1) 626 777 (151) Intangible asset impairment charges (2) 68 109 (41) Mark-to-market (gains)/losses from derivatives (3) (141) 96 (237) Malware incident incremental expenses — 84 (84) Acquisition integration costs (4) 3 3 — Acquisition-related costs (5) 13 — 13 Divestiture-related costs (5) (1) 31 (32) Operating income from divestiture (5) — (61) 61 Gain on divestitures (5) — (186) 186 Remeasurement of net monetary position (6) 11 — 11 Impact from pension participation changes (7) 423 — 423 Impact from resolution of tax matters (8) (15) (209) 194 CEO transition remuneration (9) 22 14 8 Other/rounding — (1) 1
Adjusted Operating Income $ 4,321 $ 4,119 $ 202 4.9 %Unfavorable currency translation 55 — 55
Adjusted Operating Income (constant currency) $ 4,376 $ 4,119 $ 257 6.2 %
58
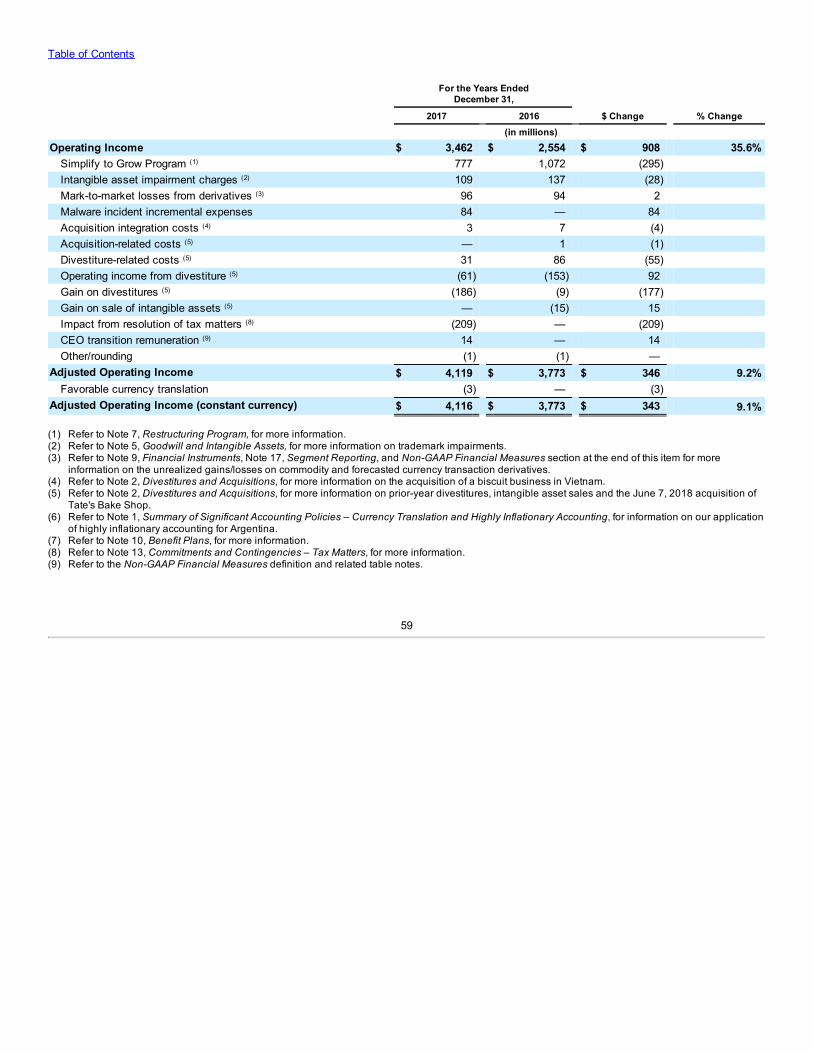
Table of Contents
For the Years Ended
December 31, 2017 2016 $ Change % Change (in millions)
Operating Income $ 3,462 $ 2,554 $ 908 35.6%Simplify to Grow Program (1) 777 1,072 (295) Intangible asset impairment charges (2) 109 137 (28) Mark-to-market losses from derivatives (3) 96 94 2 Malware incident incremental expenses 84 — 84 Acquisition integration costs (4) 3 7 (4) Acquisition-related costs (5) — 1 (1) Divestiture-related costs (5) 31 86 (55) Operating income from divestiture (5) (61) (153) 92 Gain on divestitures (5) (186) (9) (177) Gain on sale of intangible assets (5) — (15) 15 Impact from resolution of tax matters (8) (209) — (209) CEO transition remuneration (9) 14 — 14 Other/rounding (1) (1) —
Adjusted Operating Income $ 4,119 $ 3,773 $ 346 9.2%Favorable currency translation (3) — (3)
Adjusted Operating Income (constant currency) $ 4,116 $ 3,773 $ 343 9.1% (1) Refer to Note 7, Restructuring Program, for more information.(2) Refer to Note 5, Goodwill and Intangible Assets, for more information on trademark impairments.(3) Refer to Note 9, Financial Instruments, Note 17, Segment Reporting, and Non-GAAP Financial Measures section at the end of this item for more
information on the unrealized gains/losses on commodity and forecasted currency transaction derivatives.(4) Refer to Note 2, Divestitures and Acquisitions, for more information on the acquisition of a biscuit business in Vietnam.(5) Refer to Note 2, Divestitures and Acquisitions, for more information on prior-year divestitures, intangible asset sales and the June 7, 2018 acquisition of
Tate's Bake Shop.(6) Refer to Note 1, Summary of Significant Accounting Policies – Currency Translation and Highly Inflationary Accounting, for information on our application
of highly inflationary accounting for Argentina.(7) Refer to Note 10, Benefit Plans, for more information.(8) Refer to Note 13, Commitments and Contingencies – Tax Matters, for more information.(9) Refer to the Non-GAAP Financial Measures definition and related table notes.
59
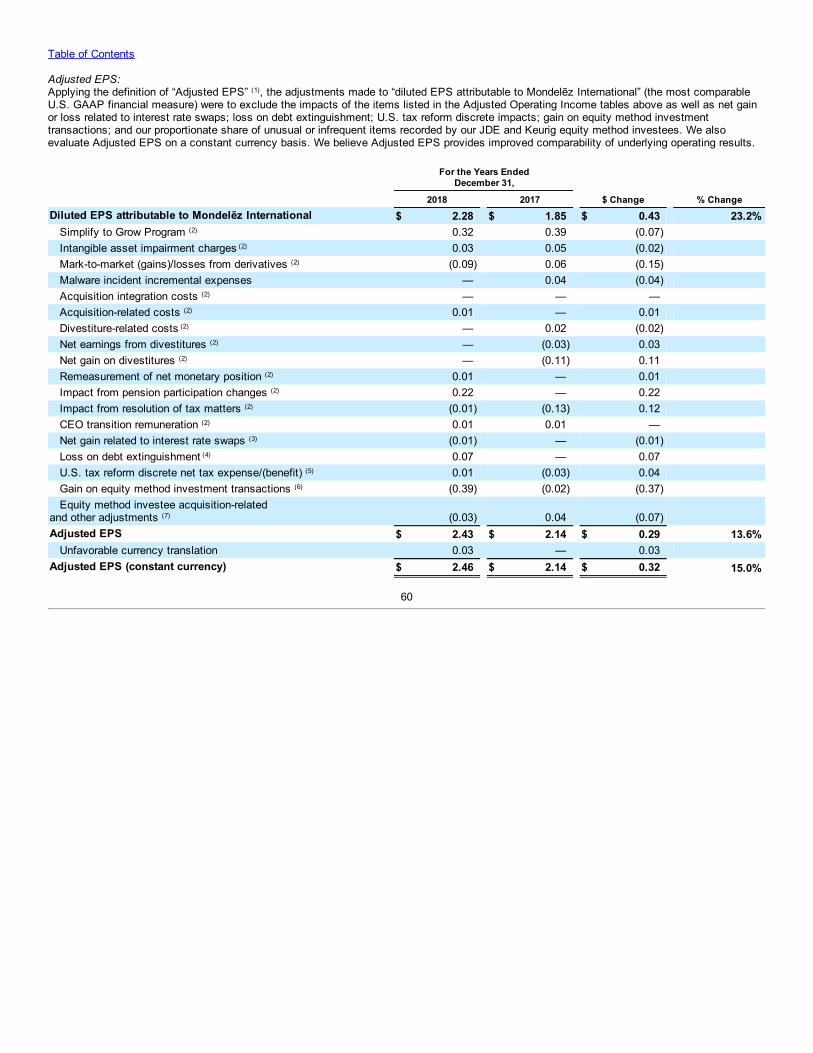
Table of Contents
Adjusted EPS:Applying the definition of “Adjusted EPS” (1), the adjustments made to “diluted EPS attributable to Mondelēz International” (the most comparableU.S. GAAP financial measure) were to exclude the impacts of the items listed in the Adjusted Operating Income tables above as well as net gainor loss related to interest rate swaps; loss on debt extinguishment; U.S. tax reform discrete impacts; gain on equity method investmenttransactions; and our proportionate share of unusual or infrequent items recorded by our JDE and Keurig equity method investees. We alsoevaluate Adjusted EPS on a constant currency basis. We believe Adjusted EPS provides improved comparability of underlying operating results.
For the Years Ended
December 31, 2018 2017 $ Change % ChangeDiluted EPS attributable to Mondelēz International $ 2.28 $ 1.85 $ 0.43 23.2% Simplify to Grow Program (2) 0.32 0.39 (0.07) Intangible asset impairment charges (2) 0.03 0.05 (0.02) Mark-to-market (gains)/losses from derivatives (2) (0.09) 0.06 (0.15) Malware incident incremental expenses — 0.04 (0.04) Acquisition integration costs (2) — — — Acquisition-related costs (2) 0.01 — 0.01 Divestiture-related costs (2) — 0.02 (0.02) Net earnings from divestitures (2) — (0.03) 0.03 Net gain on divestitures (2) — (0.11) 0.11 Remeasurement of net monetary position (2) 0.01 — 0.01 Impact from pension participation changes (2) 0.22 — 0.22 Impact from resolution of tax matters (2) (0.01) (0.13) 0.12 CEO transition remuneration (2) 0.01 0.01 — Net gain related to interest rate swaps (3) (0.01) — (0.01) Loss on debt extinguishment (4) 0.07 — 0.07 U.S. tax reform discrete net tax expense/(benefit) (5) 0.01 (0.03) 0.04 Gain on equity method investment transactions (6) (0.39) (0.02) (0.37) Equity method investee acquisition-related and other adjustments (7) (0.03) 0.04 (0.07) Adjusted EPS $ 2.43 $ 2.14 $ 0.29 13.6% Unfavorable currency translation 0.03 — 0.03 Adjusted EPS (constant currency) $ 2.46 $ 2.14 $ 0.32 15.0%
60
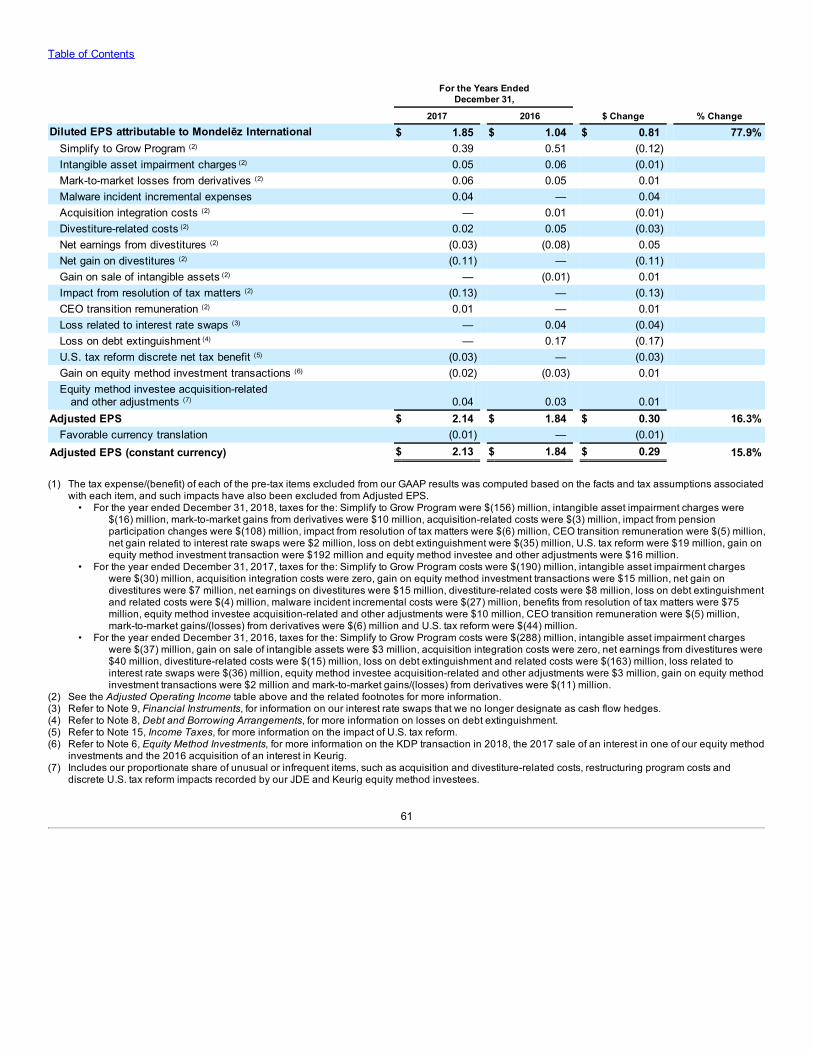
Table of Contents
For the Years Ended
December 31, 2017 2016 $ Change % ChangeDiluted EPS attributable to Mondelēz International $ 1.85 $ 1.04 $ 0.81 77.9% Simplify to Grow Program (2) 0.39 0.51 (0.12) Intangible asset impairment charges (2) 0.05 0.06 (0.01) Mark-to-market losses from derivatives (2) 0.06 0.05 0.01 Malware incident incremental expenses 0.04 — 0.04 Acquisition integration costs (2) — 0.01 (0.01) Divestiture-related costs (2) 0.02 0.05 (0.03) Net earnings from divestitures (2) (0.03) (0.08) 0.05 Net gain on divestitures (2) (0.11) — (0.11) Gain on sale of intangible assets (2) — (0.01) 0.01 Impact from resolution of tax matters (2) (0.13) — (0.13) CEO transition remuneration (2) 0.01 — 0.01 Loss related to interest rate swaps (3) — 0.04 (0.04) Loss on debt extinguishment (4) — 0.17 (0.17) U.S. tax reform discrete net tax benefit (5) (0.03) — (0.03) Gain on equity method investment transactions (6) (0.02) (0.03) 0.01 Equity method investee acquisition-related
and other adjustments (7) 0.04 0.03 0.01 Adjusted EPS $ 2.14 $ 1.84 $ 0.30 16.3% Favorable currency translation (0.01) — (0.01) Adjusted EPS (constant currency) $ 2.13 $ 1.84 $ 0.29 15.8% (1) The tax expense/(benefit) of each of the pre-tax items excluded from our GAAP results was computed based on the facts and tax assumptions associated
with each item, and such impacts have also been excluded from Adjusted EPS.• For the year ended December 31, 2018, taxes for the: Simplify to Grow Program were $(156) million, intangible asset impairment charges were
$(16) million, mark-to-market gains from derivatives were $10 million, acquisition-related costs were $(3) million, impact from pensionparticipation changes were $(108) million, impact from resolution of tax matters were $(6) million, CEO transition remuneration were $(5) million,net gain related to interest rate swaps were $2 million, loss on debt extinguishment were $(35) million, U.S. tax reform were $19 million, gain onequity method investment transaction were $192 million and equity method investee and other adjustments were $16 million.
• For the year ended December 31, 2017, taxes for the: Simplify to Grow Program costs were $(190) million, intangible asset impairment chargeswere $(30) million, acquisition integration costs were zero, gain on equity method investment transactions were $15 million, net gain ondivestitures were $7 million, net earnings on divestitures were $15 million, divestiture-related costs were $8 million, loss on debt extinguishmentand related costs were $(4) million, malware incident incremental costs were $(27) million, benefits from resolution of tax matters were $75million, equity method investee acquisition-related and other adjustments were $10 million, CEO transition remuneration were $(5) million,mark-to-market gains/(losses) from derivatives were $(6) million and U.S. tax reform were $(44) million.
• For the year ended December 31, 2016, taxes for the: Simplify to Grow Program costs were $(288) million, intangible asset impairment chargeswere $(37) million, gain on sale of intangible assets were $3 million, acquisition integration costs were zero, net earnings from divestitures were$40 million, divestiture-related costs were $(15) million, loss on debt extinguishment and related costs were $(163) million, loss related tointerest rate swaps were $(36) million, equity method investee acquisition-related and other adjustments were $3 million, gain on equity methodinvestment transactions were $2 million and mark-to-market gains/(losses) from derivatives were $(11) million.
(2) See the Adjusted Operating Income table above and the related footnotes for more information.(3) Refer to Note 9, Financial Instruments, for information on our interest rate swaps that we no longer designate as cash flow hedges.(4) Refer to Note 8, Debt and Borrowing Arrangements, for more information on losses on debt extinguishment.(5) Refer to Note 15, Income Taxes, for more information on the impact of U.S. tax reform.(6) Refer to Note 6, Equity Method Investments, for more information on the KDP transaction in 2018, the 2017 sale of an interest in one of our equity method
investments and the 2016 acquisition of an interest in Keurig.(7) Includes our proportionate share of unusual or infrequent items, such as acquisition and divestiture-related costs, restructuring program costs and
discrete U.S. tax reform impacts recorded by our JDE and Keurig equity method investees.
61
Table of Contents
Item 7A. Quantitative and Qualitative Disclosures about Market Risk.
As we operate globally, we are primarily exposed to currency exchange rate, commodity price and interest rate market risks. We monitor andmanage these exposures as part of our overall risk management program. Our risk management program focuses on the unpredictability offinancial markets and seeks to reduce the potentially adverse effects that the volatility of these markets may have on our operating results. Weprincipally utilize derivative instruments to reduce significant, unanticipated earnings fluctuations that may arise from volatility in currencyexchange rates, commodity prices and interest rates. For additional information on our derivative activity and the types of derivative instrumentswe use to hedge our currency exchange, commodity price and interest rate exposures, see Note 1, Summary of Significant Accounting Policies,and Note 9, Financial Instruments.
Many of our non-U.S. subsidiaries operate in functional currencies other than the U.S. dollar. Fluctuations in currency exchange rates createvolatility in our reported results as we translate the balance sheets, operating results and cash flows of these subsidiaries into the U.S. dollar forconsolidated reporting purposes. The translation of non-U.S. dollar denominated balance sheets and statements of earnings of our subsidiaries intothe U.S. dollar for consolidated reporting generally results in a cumulative translation adjustment to other comprehensive income within equity. Astronger U.S. dollar relative to other functional currencies adversely affects our consolidated earnings and net assets while a weaker U.S. dollarbenefits our consolidated earnings and net assets. While we hedge significant forecasted currency exchange transactions as well as certain netassets of non-U.S. operations and other currency impacts, we cannot fully predict or eliminate volatility arising from changes in currency exchangerates on our consolidated financial results. See Consolidated Results of Operations and Results of Operations by Reportable Segment underDiscussion and Analysis of Historical Results for currency exchange effects on our financial results. For additional information on the impact ofcurrency policies, recent currency devaluations and highly inflationary accounting on our financial condition and results of operations, also seeNote 1, Summary of Significant Accounting Policies—Currency Translation and Highly Inflationary Accounting.
We also continually monitor the market for commodities that we use in our products. Input costs may fluctuate widely due to international demand,weather conditions, government policy and regulation and unforeseen conditions. To manage input cost volatility, we enter into forward purchaseagreements and other derivative financial instruments. We also pursue productivity and cost saving measures and take pricing actions whennecessary to mitigate the impact of higher input costs on earnings.
We regularly evaluate our variable and fixed-rate debt as well as current and expected interest rates in the markets in which we raise capital. Ourprimary exposures include movements in U.S. Treasury rates, corporate credit spreads, commercial paper rates as well as limited debt tied toLondon Interbank Offered Rates (“LIBOR”). The Financial Conduct Authority in the United Kingdom plans to phase out LIBOR by the end of 2021.We do not anticipate a significant impact to our financial position from the planned phase out of LIBOR given our current mix of variable and fixed-rate debt. We periodically use interest rate swaps and forward interest rate contracts to achieve a desired proportion of variable versus fixed ratedebt based on current and projected market conditions. Our weighted-average interest rate on our total debt was 2.3% as of December 31, 2018,up from 2.1% as of December 31, 2017 primarily due to higher interest rates on commercial paper borrowings.
Beginning in the first quarter of 2018, we entered into new investment hedge derivative contracts, specifically, cross-currency interest rate swapsand forwards, to hedge certain investments in our non-U.S. operations against movements in exchange rates. See Note 9, Financial Instruments,for more information on our derivative activity. There were no other significant changes in the types of derivative instruments we use to hedge ourexposures between December 31, 2017 and December 31, 2018.
Value at Risk:
We use a value at risk (“VAR”) computation to estimate: 1) the potential one-day loss in the fair value of our interest rate-sensitive financialinstruments; and 2) the potential one-day loss in pre-tax earnings of our currency and commodity price-sensitive derivative financial instruments.The VAR analysis was done separately for our currency exchange, fixed income and commodity risk portfolios as of each quarter end during theperiods presented below. The instruments included in the VAR computation were currency exchange forwards and options for currency exchangerisk, debt and swaps for interest rate risk, and commodity forwards, futures and options for commodity risk. Excluded from the computation wereanticipated transactions, currency trade payables and receivables, and net investments in non-U.S. subsidiaries, which the above-mentionedinstruments are intended to hedge.
62
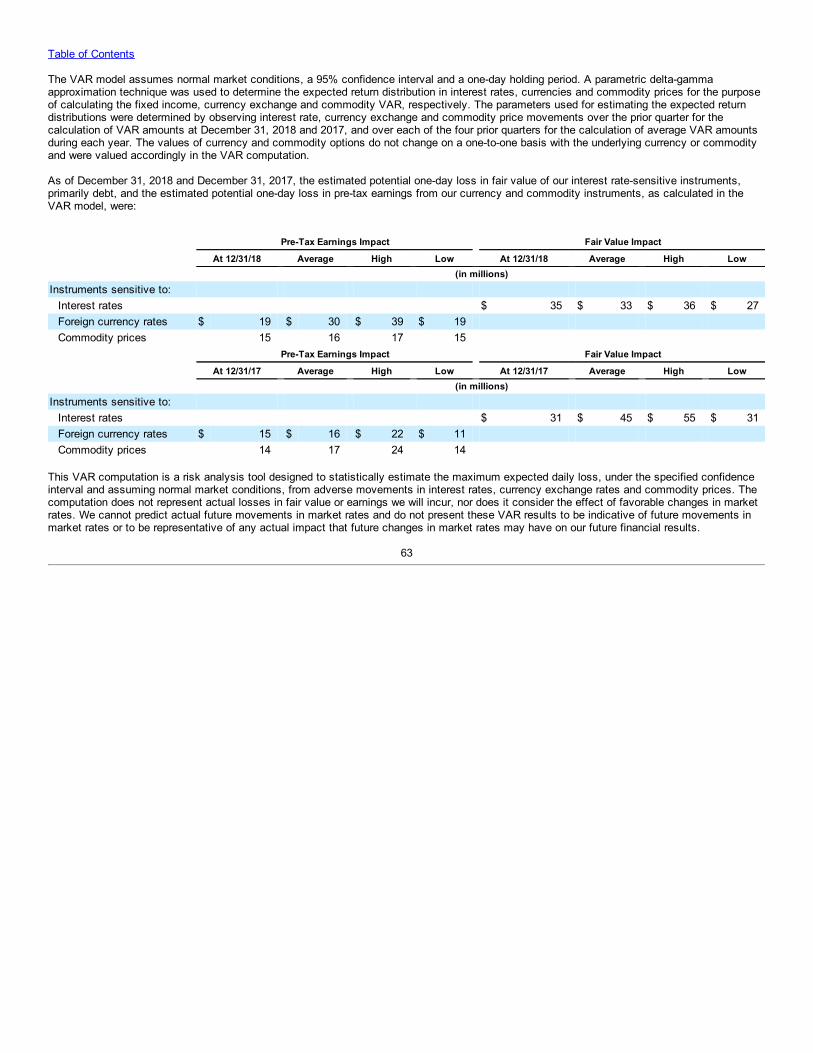
Table of Contents
The VAR model assumes normal market conditions, a 95% confidence interval and a one-day holding period. A parametric delta-gammaapproximation technique was used to determine the expected return distribution in interest rates, currencies and commodity prices for the purposeof calculating the fixed income, currency exchange and commodity VAR, respectively. The parameters used for estimating the expected returndistributions were determined by observing interest rate, currency exchange and commodity price movements over the prior quarter for thecalculation of VAR amounts at December 31, 2018 and 2017, and over each of the four prior quarters for the calculation of average VAR amountsduring each year. The values of currency and commodity options do not change on a one-to-one basis with the underlying currency or commodityand were valued accordingly in the VAR computation.
As of December 31, 2018 and December 31, 2017, the estimated potential one-day loss in fair value of our interest rate-sensitive instruments,primarily debt, and the estimated potential one-day loss in pre-tax earnings from our currency and commodity instruments, as calculated in theVAR model, were:
Pre-Tax Earnings Impact Fair Value Impact
At 12/31/18 Average High Low At 12/31/18 Average High Low (in millions)Instruments sensitive to:
Interest rates $ 35 $ 33 $ 36 $ 27Foreign currency rates $ 19 $ 30 $ 39 $ 19 Commodity prices 15 16 17 15
Pre-Tax Earnings Impact Fair Value Impact
At 12/31/17 Average High Low At 12/31/17 Average High Low (in millions)Instruments sensitive to:
Interest rates $ 31 $ 45 $ 55 $ 31Foreign currency rates $ 15 $ 16 $ 22 $ 11 Commodity prices 14 17 24 14
This VAR computation is a risk analysis tool designed to statistically estimate the maximum expected daily loss, under the specified confidenceinterval and assuming normal market conditions, from adverse movements in interest rates, currency exchange rates and commodity prices. Thecomputation does not represent actual losses in fair value or earnings we will incur, nor does it consider the effect of favorable changes in marketrates. We cannot predict actual future movements in market rates and do not present these VAR results to be indicative of future movements inmarket rates or to be representative of any actual impact that future changes in market rates may have on our future financial results.
63
Table of Contents
Item 8. Financial Statements and Supplementary Data.
Report of Independent Registered Public Accounting Firm
To the Board of Directors and Shareholders of Mondelēz International, Inc.
Opinions on the Financial Statements and Internal Control over Financial Reporting
We have audited the accompanying consolidated balance sheets of Mondelēz International, Inc. and its subsidiaries (the "Company") as ofDecember 31, 2018 and 2017, and the related consolidated statements of earnings, comprehensive earnings, equity and cash flows for each of thethree years in the period ended December 31, 2018, including the related notes and financial statement schedule listed in the index appearingunder Item 15(a) (collectively referred to as the “consolidated financial statements”). We also have audited the Company’s internal control overfinancial reporting as of December 31, 2018, based on criteria established in Internal Control—Integrated Framework (2013) issued by theCommittee of Sponsoring Organizations of the Treadway Commission (COSO).
In our opinion, the consolidated financial statements referred to above present fairly, in all material respects, the financial position of the Companyas of December 31, 2018 and 2017, and the results of its operations and its cash flows for each of the three years in the period endedDecember 31, 2018 in conformity with accounting principles generally accepted in the United States of America. Also in our opinion, the Companymaintained, in all material respects, effective internal control over financial reporting as of December 31, 2018, based on criteria established inInternal Control—Integrated Framework (2013) issued by the COSO.
Change in Accounting Principle
As discussed in Note 6 to the consolidated financial statements, the Company changed the manner in which it accounts for a certain equitymethod investment in 2018.
Basis for Opinions
The Company’s management is responsible for these consolidated financial statements, for maintaining effective internal control over financialreporting, and for its assessment of the effectiveness of internal control over financial reporting, included in the Report of Management on InternalControl Over Financial Reporting appearing under Item 9A. Our responsibility is to express opinions on the Company’s consolidated financialstatements and on the Company’s internal control over financial reporting based on our audits. We are a public accounting firm registered with thePublic Company Accounting Oversight Board (United States) (“PCAOB”) and are required to be independent with respect to the Company inaccordance with the U.S. federal securities laws and the applicable rules and regulations of the Securities and Exchange Commission and thePCAOB.
We conducted our audits in accordance with the standards of the PCAOB. Those standards require that we plan and perform the audits to obtainreasonable assurance about whether the consolidated financial statements are free of material misstatement, whether due to error or fraud, andwhether effective internal control over financial reporting was maintained in all material respects.
Our audits of the consolidated financial statements included performing procedures to assess the risks of material misstatement of theconsolidated financial statements, whether due to error or fraud, and performing procedures that respond to those risks. Such procedures includedexamining, on a test basis, evidence regarding the amounts and disclosures in the consolidated financial statements. Our audits also includedevaluating the accounting principles used and significant estimates made by management, as well as evaluating the overall presentation of theconsolidated financial statements. Our audit of internal control over financial reporting included obtaining an understanding of internal control overfinancial reporting, assessing the risk that a material weakness exists, and testing and evaluating the design and operating effectiveness ofinternal control based on the assessed risk. Our audits also included performing such other procedures as we considered necessary in thecircumstances. We believe that our audits provide a reasonable basis for our opinions.
64
Table of Contents
Definition and Limitations of Internal Control over Financial Reporting
A company’s internal control over financial reporting is a process designed to provide reasonable assurance regarding the reliability of financialreporting and the preparation of financial statements for external purposes in accordance with generally accepted accounting principles. Acompany’s internal control over financial reporting includes those policies and procedures that (i) pertain to the maintenance of records that, inreasonable detail, accurately and fairly reflect the transactions and dispositions of the assets of the company; (ii) provide reasonable assurancethat transactions are recorded as necessary to permit preparation of financial statements in accordance with generally accepted accountingprinciples, and that receipts and expenditures of the company are being made only in accordance with authorizations of management and directorsof the company; and (iii) provide reasonable assurance regarding prevention or timely detection of unauthorized acquisition, use, or disposition ofthe company’s assets that could have a material effect on the financial statements.
Because of its inherent limitations, internal control over financial reporting may not prevent or detect misstatements. Also, projections of anyevaluation of effectiveness to future periods are subject to the risk that controls may become inadequate because of changes in conditions, or thatthe degree of compliance with the policies or procedures may deteriorate.
/s/ PRICEWATERHOUSECOOPERS LLP
Chicago, IllinoisFebruary 8, 2019
We have served as the Company’s auditor since 2001.
65
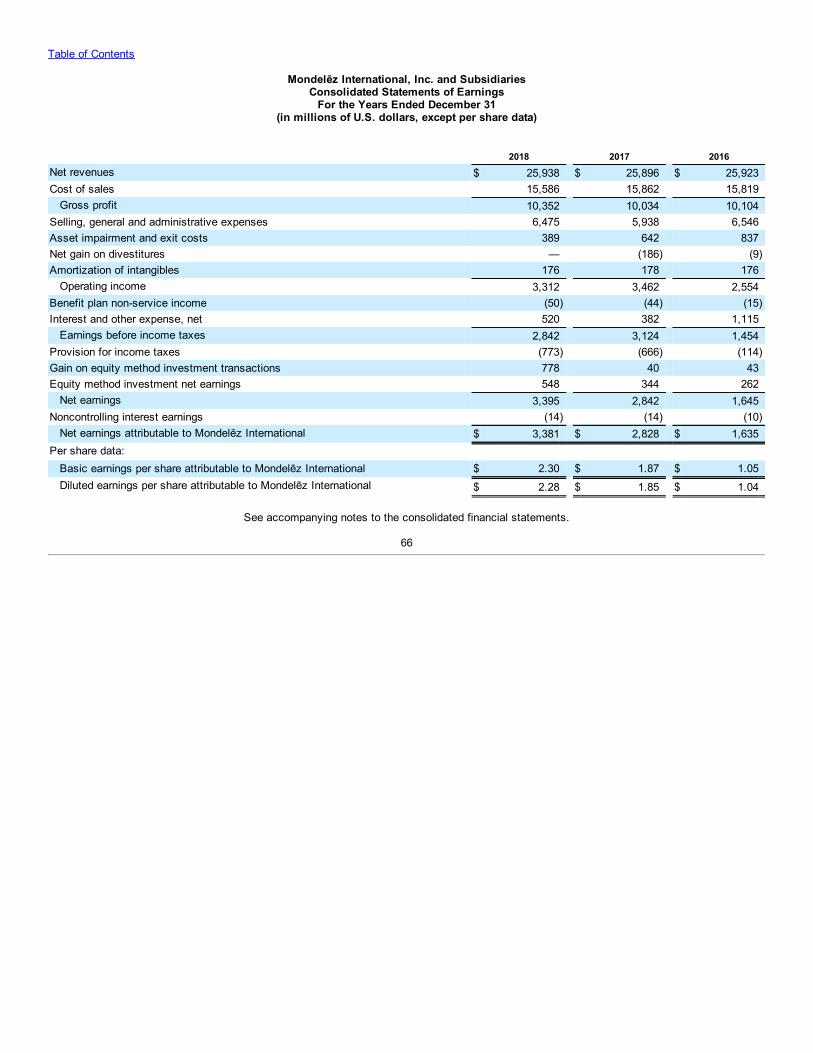
Table of Contents
Mondelēz International, Inc. and SubsidiariesConsolidated Statements of Earnings
For the Years Ended December 31(in millions of U.S. dollars, except per share data)
2018 2017 2016Net revenues $ 25,938 $ 25,896 $ 25,923Cost of sales 15,586 15,862 15,819 Gross profit 10,352 10,034 10,104Selling, general and administrative expenses 6,475 5,938 6,546Asset impairment and exit costs 389 642 837Net gain on divestitures — (186) (9)Amortization of intangibles 176 178 176 Operating income 3,312 3,462 2,554Benefit plan non-service income (50) (44) (15)Interest and other expense, net 520 382 1,115 Earnings before income taxes 2,842 3,124 1,454Provision for income taxes (773) (666) (114)Gain on equity method investment transactions 778 40 43Equity method investment net earnings 548 344 262 Net earnings 3,395 2,842 1,645Noncontrolling interest earnings (14) (14) (10) Net earnings attributable to Mondelēz International $ 3,381 $ 2,828 $ 1,635Per share data: Basic earnings per share attributable to Mondelēz International $ 2.30 $ 1.87 $ 1.05 Diluted earnings per share attributable to Mondelēz International $ 2.28 $ 1.85 $ 1.04
See accompanying notes to the consolidated financial statements.
66
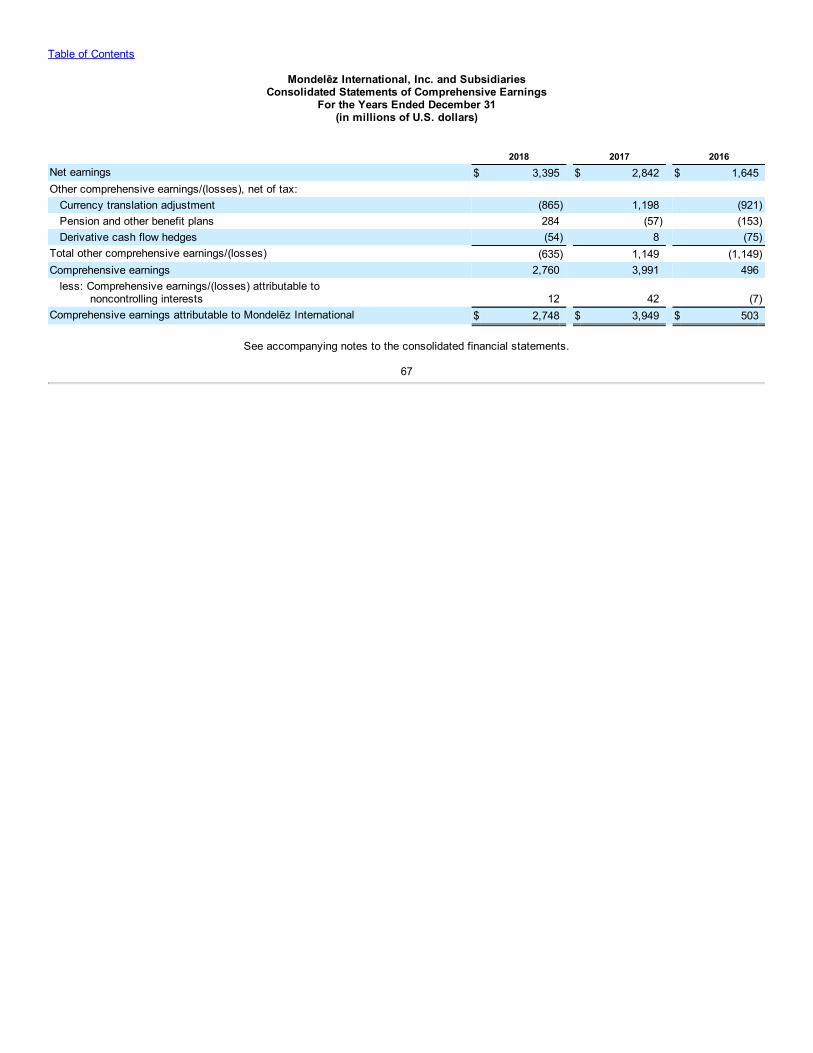
Table of Contents
Mondelēz International, Inc. and SubsidiariesConsolidated Statements of Comprehensive Earnings
For the Years Ended December 31(in millions of U.S. dollars)
2018 2017 2016Net earnings $ 3,395 $ 2,842 $ 1,645Other comprehensive earnings/(losses), net of tax: Currency translation adjustment (865) 1,198 (921) Pension and other benefit plans 284 (57) (153) Derivative cash flow hedges (54) 8 (75)Total other comprehensive earnings/(losses) (635) 1,149 (1,149)Comprehensive earnings 2,760 3,991 496 less: Comprehensive earnings/(losses) attributable to noncontrolling interests 12 42 (7)Comprehensive earnings attributable to Mondelēz International $ 2,748 $ 3,949 $ 503
See accompanying notes to the consolidated financial statements.
67
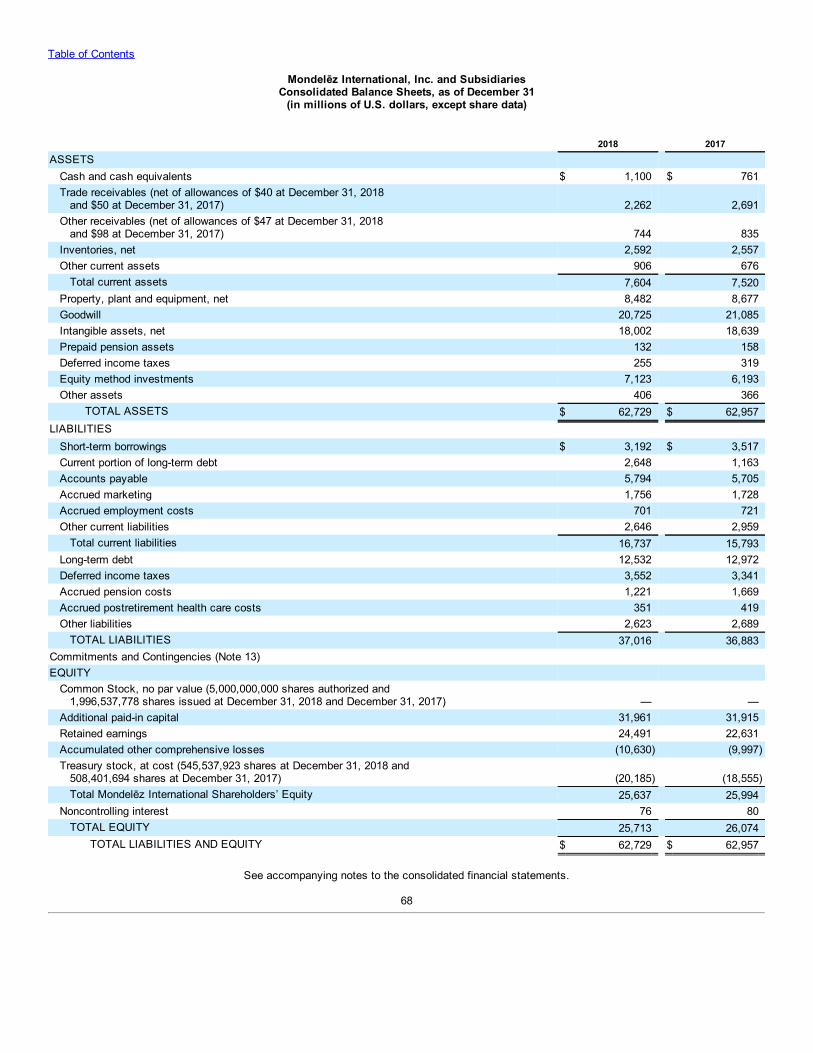
Table of Contents
Mondelēz International, Inc. and SubsidiariesConsolidated Balance Sheets, as of December 31
(in millions of U.S. dollars, except share data)
2018 2017ASSETS Cash and cash equivalents $ 1,100 $ 761 Trade receivables (net of allowances of $40 at December 31, 2018 and $50 at December 31, 2017) 2,262 2,691 Other receivables (net of allowances of $47 at December 31, 2018 and $98 at December 31, 2017) 744 835 Inventories, net 2,592 2,557 Other current assets 906 676 Total current assets 7,604 7,520 Property, plant and equipment, net 8,482 8,677 Goodwill 20,725 21,085 Intangible assets, net 18,002 18,639 Prepaid pension assets 132 158 Deferred income taxes 255 319 Equity method investments 7,123 6,193 Other assets 406 366
TOTAL ASSETS $ 62,729 $ 62,957LIABILITIES Short-term borrowings $ 3,192 $ 3,517 Current portion of long-term debt 2,648 1,163 Accounts payable 5,794 5,705 Accrued marketing 1,756 1,728 Accrued employment costs 701 721 Other current liabilities 2,646 2,959 Total current liabilities 16,737 15,793 Long-term debt 12,532 12,972 Deferred income taxes 3,552 3,341 Accrued pension costs 1,221 1,669 Accrued postretirement health care costs 351 419 Other liabilities 2,623 2,689 TOTAL LIABILITIES 37,016 36,883Commitments and Contingencies (Note 13) EQUITY Common Stock, no par value (5,000,000,000 shares authorized and 1,996,537,778 shares issued at December 31, 2018 and December 31, 2017) — — Additional paid-in capital 31,961 31,915 Retained earnings 24,491 22,631 Accumulated other comprehensive losses (10,630) (9,997) Treasury stock, at cost (545,537,923 shares at December 31, 2018 and 508,401,694 shares at December 31, 2017) (20,185) (18,555) Total Mondelēz International Shareholders’ Equity 25,637 25,994 Noncontrolling interest 76 80 TOTAL EQUITY 25,713 26,074 TOTAL LIABILITIES AND EQUITY $ 62,729 $ 62,957
See accompanying notes to the consolidated financial statements.
68
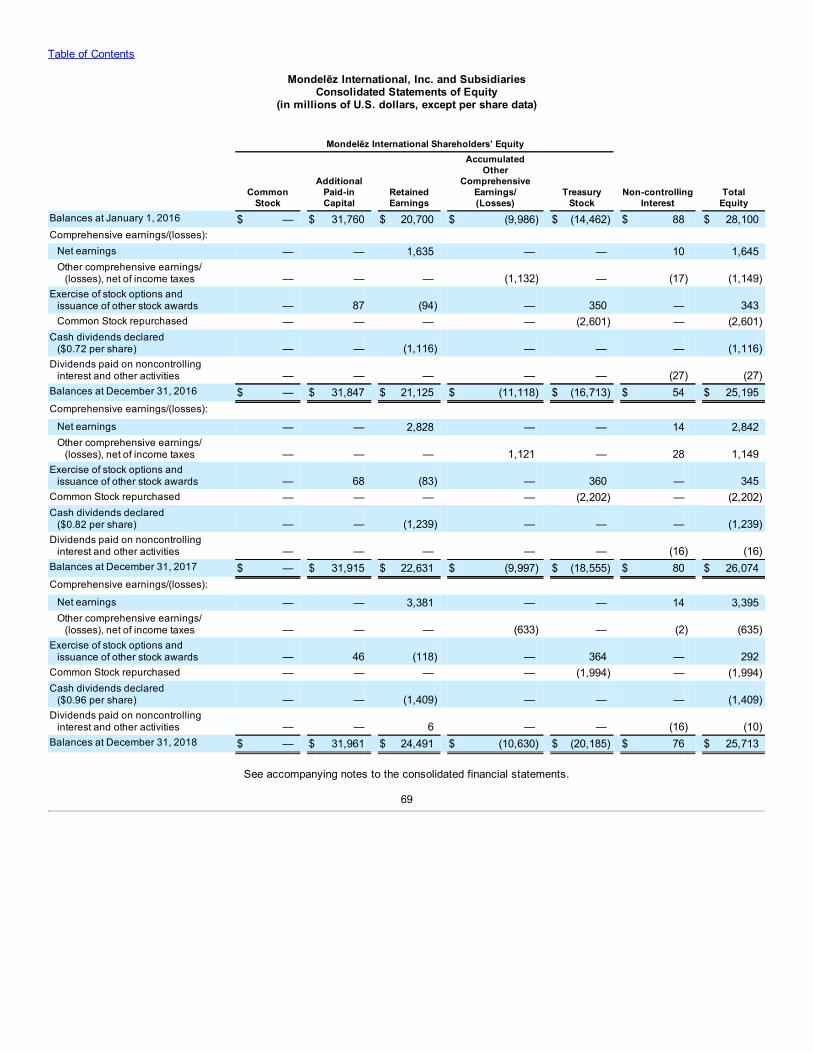
Table of Contents
Mondelēz International, Inc. and SubsidiariesConsolidated Statements of Equity
(in millions of U.S. dollars, except per share data)
Mondelēz International Shareholders’ Equity
Common
Stock
AdditionalPaid-inCapital
RetainedEarnings
AccumulatedOther
ComprehensiveEarnings/(Losses)
TreasuryStock
Non-controllingInterest
TotalEquity
Balances at January 1, 2016 $ — $ 31,760 $ 20,700 $ (9,986) $ (14,462) $ 88 $ 28,100Comprehensive earnings/(losses): Net earnings — — 1,635 — — 10 1,645 Other comprehensive earnings/ (losses), net of income taxes — — — (1,132) — (17) (1,149)Exercise of stock options and issuance of other stock awards — 87 (94) — 350 — 343 Common Stock repurchased — — — — (2,601) — (2,601)Cash dividends declared ($0.72 per share) — — (1,116) — — — (1,116)Dividends paid on noncontrolling interest and other activities — — — — — (27) (27)Balances at December 31, 2016 $ — $ 31,847 $ 21,125 $ (11,118) $ (16,713) $ 54 $ 25,195Comprehensive earnings/(losses): Net earnings — — 2,828 — — 14 2,842 Other comprehensive earnings/ (losses), net of income taxes — — — 1,121 — 28 1,149Exercise of stock options and issuance of other stock awards — 68 (83) — 360 — 345Common Stock repurchased — — — — (2,202) — (2,202)Cash dividends declared ($0.82 per share) — — (1,239) — — — (1,239)Dividends paid on noncontrolling interest and other activities — — — — — (16) (16)Balances at December 31, 2017 $ — $ 31,915 $ 22,631 $ (9,997) $ (18,555) $ 80 $ 26,074Comprehensive earnings/(losses): Net earnings — — 3,381 — — 14 3,395 Other comprehensive earnings/ (losses), net of income taxes — — — (633) — (2) (635)Exercise of stock options and issuance of other stock awards — 46 (118) — 364 — 292Common Stock repurchased — — — — (1,994) — (1,994)Cash dividends declared ($0.96 per share) — — (1,409) — — — (1,409)Dividends paid on noncontrolling interest and other activities — — 6 — — (16) (10)Balances at December 31, 2018 $ — $ 31,961 $ 24,491 $ (10,630) $ (20,185) $ 76 $ 25,713
See accompanying notes to the consolidated financial statements.
69
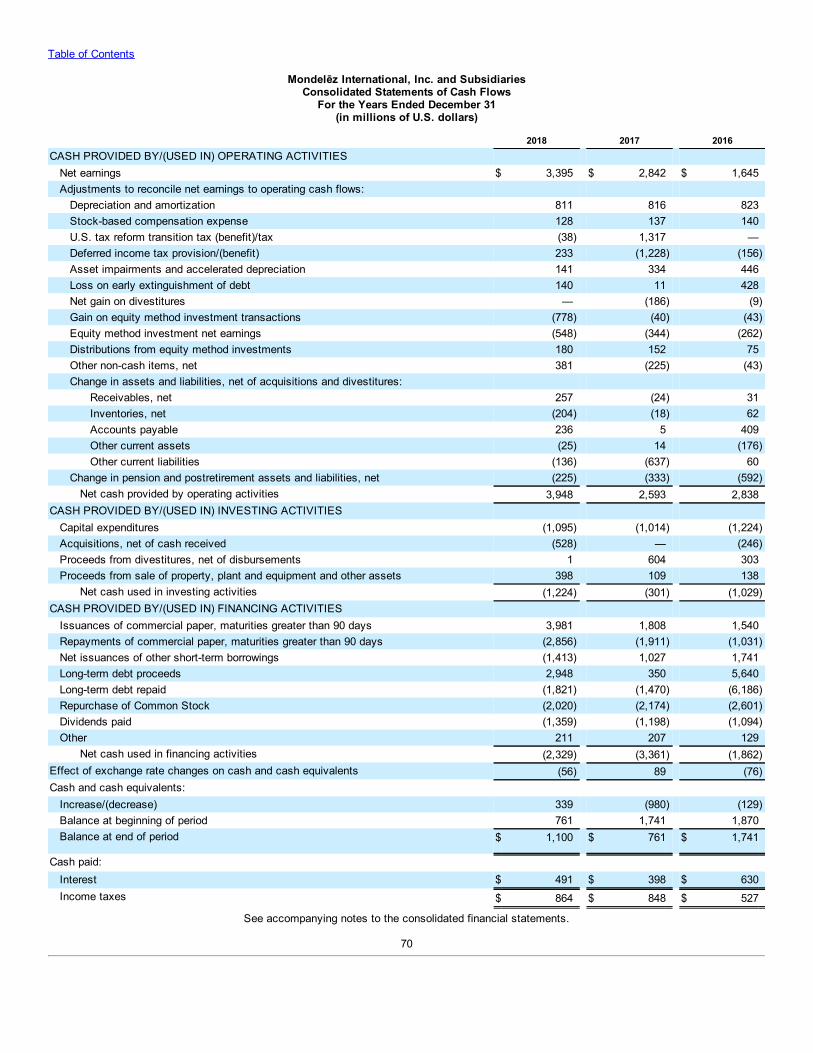
Table of Contents
Mondelēz International, Inc. and SubsidiariesConsolidated Statements of Cash Flows
For the Years Ended December 31(in millions of U.S. dollars)
2018 2017 2016CASH PROVIDED BY/(USED IN) OPERATING ACTIVITIES Net earnings $ 3,395 $ 2,842 $ 1,645 Adjustments to reconcile net earnings to operating cash flows: Depreciation and amortization 811 816 823 Stock-based compensation expense 128 137 140 U.S. tax reform transition tax (benefit)/tax (38) 1,317 — Deferred income tax provision/(benefit) 233 (1,228) (156) Asset impairments and accelerated depreciation 141 334 446 Loss on early extinguishment of debt 140 11 428 Net gain on divestitures — (186) (9) Gain on equity method investment transactions (778) (40) (43) Equity method investment net earnings (548) (344) (262) Distributions from equity method investments 180 152 75 Other non-cash items, net 381 (225) (43) Change in assets and liabilities, net of acquisitions and divestitures: Receivables, net 257 (24) 31 Inventories, net (204) (18) 62 Accounts payable 236 5 409 Other current assets (25) 14 (176) Other current liabilities (136) (637) 60 Change in pension and postretirement assets and liabilities, net (225) (333) (592) Net cash provided by operating activities 3,948 2,593 2,838CASH PROVIDED BY/(USED IN) INVESTING ACTIVITIES Capital expenditures (1,095) (1,014) (1,224) Acquisitions, net of cash received (528) — (246) Proceeds from divestitures, net of disbursements 1 604 303 Proceeds from sale of property, plant and equipment and other assets 398 109 138 Net cash used in investing activities (1,224) (301) (1,029)CASH PROVIDED BY/(USED IN) FINANCING ACTIVITIES Issuances of commercial paper, maturities greater than 90 days 3,981 1,808 1,540 Repayments of commercial paper, maturities greater than 90 days (2,856) (1,911) (1,031) Net issuances of other short-term borrowings (1,413) 1,027 1,741 Long-term debt proceeds 2,948 350 5,640 Long-term debt repaid (1,821) (1,470) (6,186) Repurchase of Common Stock (2,020) (2,174) (2,601) Dividends paid (1,359) (1,198) (1,094) Other 211 207 129 Net cash used in financing activities (2,329) (3,361) (1,862)Effect of exchange rate changes on cash and cash equivalents (56) 89 (76)Cash and cash equivalents: Increase/(decrease) 339 (980) (129) Balance at beginning of period 761 1,741 1,870 Balance at end of period $ 1,100 $ 761 $ 1,741
Cash paid: Interest $ 491 $ 398 $ 630 Income taxes $ 864 $ 848 $ 527
See accompanying notes to the consolidated financial statements.
70
Table of Contents
Mondelēz International, Inc. and SubsidiariesNotes to Consolidated Financial Statements
Note 1. Summary of Significant Accounting Policies
Description of Business:Mondelēz International, Inc. was incorporated in 2000 in the Commonwealth of Virginia. Mondelēz International, Inc., through its subsidiaries(collectively “Mondelēz International,” “we,” “us” and “our”), sells food and beverage products to consumers in over 150 countries.
Principles of Consolidation:The consolidated financial statements include Mondelēz International, Inc. as well as our wholly owned and majority owned subsidiaries, exceptour Venezuelan subsidiaries which were deconsolidated in 2015. All intercompany transactions are eliminated. The noncontrolling interestrepresents the noncontrolling investors’ interests in the results of subsidiaries that we control and consolidate. We account for investments overwhich we exercise significant influence under the equity method of accounting. Investments over which we do not have significant influence orcontrol are not material and are carried at cost as there is no readily determinable fair value for the equity interests. Under the cost method ofaccounting, earnings are recognized to the extent cash is received.
Use of Estimates:We prepare our consolidated financial statements in accordance with accounting principles generally accepted in the United States of America(“U.S. GAAP”), which require us to make estimates and assumptions that affect a number of amounts in our consolidated financial statements.Significant accounting policy elections, estimates and assumptions include, among others, pension and benefit plan assumptions, valuationassumptions of goodwill and intangible assets, useful lives of long-lived assets, restructuring program liabilities, marketing program accruals,insurance and self-insurance reserves and income taxes. We base our estimates on historical experience and other assumptions that we believeare reasonable. If actual amounts differ from estimates, we include the revisions in our consolidated results of operations in the period the actualamounts become known. Historically, the aggregate differences, if any, between our estimates and actual amounts in any year have not had amaterial effect on our consolidated financial statements.
Segment Change:On October 1, 2016, we integrated our Eastern Europe, Middle East, and Africa (“EEMEA”) operating segment into our Europe and Asia Pacificoperating segments to further leverage and optimize the operating scale built within the Europe and Asia Pacific regions. Russia, Ukraine, Turkey,Belarus, Georgia and Kazakhstan were combined within our Europe region, while the remaining Middle East and African countries were combinedwithin our Asia Pacific region to form a new Asia, Middle East and Africa (“AMEA”) operating segment. We have reflected the segment change asif it had occurred in all periods presented.
Our operations and management structure are organized into four operating segments:• Latin America• AMEA• Europe• North America
See Note 17, Segment Reporting, for additional information on our segments.
Currency Translation and Highly Inflationary Accounting:We translate the results of operations of our subsidiaries from multiple currencies using average exchange rates during each period and translatebalance sheet accounts using exchange rates at the end of each period. We record currency translation adjustments as a component of equity(except for highly inflationary currencies) and realized exchange gains and losses on transactions in earnings.
Highly inflationary accounting is triggered when a country’s three-year cumulative inflation rate exceeds 100%. It requires the remeasurement offinancial statements of subsidiaries in the country, from the functional currency of the subsidiary to our U.S. dollar reporting currency, withcurrency remeasurement gains or losses recorded in earnings. As discussed below, beginning on July 1, 2018, we began to apply highlyinflationary accounting for our operations in Argentina.
71
Table of Contents
Argentina. During the second quarter of 2018, primarily based on published estimates which indicated that Argentina's three-year cumulativeinflation rate exceeded 100%, we concluded that Argentina became a highly inflationary economy for accounting purposes. As of July 1, 2018, webegan to apply highly inflationary accounting for our Argentinean subsidiaries and changed their functional currency from the Argentinean peso tothe U.S. dollar. On July 1, 2018, both monetary and non-monetary assets and liabilities denominated in Argentinean pesos were remeasured intoU.S. dollars using the exchange rate as of the balance sheet date, with remeasurement and other transaction gains and losses recorded in netearnings. As of December 31, 2018, our Argentinean operations had less than $1 million of Argentinean peso denominated net monetary liabilities.Our Argentinean operations contributed $469 million, or 1.8% of consolidated net revenues in 2018. During 2018 we recorded an $11 millionremeasurement loss within selling, general and administrative expenses related to the devaluation of the Argentinean peso denominated netmonetary assets from July 1, 2018 through December 31, 2018.
Brexit. In 2018, we generated 8.6% of our net revenues in the United Kingdom. We continue to monitor the U.K. planned exit from the EuropeanUnion ("Brexit") and take protective measures in response to the potential impacts on our results of operations and financial condition. Followingthe Brexit vote in June 2016, there was significant volatility in the global stock markets and currency exchange rates. The value of the Britishpound sterling relative to the U.S. dollar declined significantly and negatively affected our translated results reported in U.S. dollars. If the ultimateterms of the United Kingdom’s separation from the European Union negatively impact the U.K. economy or result in disruptions to sales or oursupply chain, the impact to our results of operations and financial condition could be material. We are taking measures to increase our resourcesin customer service & logistics together with increasing our inventory levels of imported raw materials, packaging and finished goods in the UnitedKingdom to help us manage through the Brexit transition and the inherent risks.
Other Countries. Since we sell our products in over 150 countries and have operations in over 80 countries, we monitor economic and currency-related risks and seek to take protective measures in response to these exposures. Some of the countries in which we do business have recentlyexperienced periods of significant economic uncertainty and exchange rate volatility, including Brazil, China, Mexico, Russia, Ukraine, Turkey,Egypt, Nigeria, South Africa and Pakistan. We continue to monitor operations, currencies and net monetary exposures in these countries. At thistime, we do not anticipate that these countries are at risk of becoming highly inflationary economies.
Cash and Cash Equivalents:Cash and cash equivalents include demand deposits with banks and all highly liquid investments with original maturities of three months or less.
Transfers of Financial Assets:We account for transfers of financial assets, such as uncommitted revolving non-recourse accounts receivable factoring arrangements, when wehave surrendered control over the related assets. Determining whether control has transferred requires an evaluation of relevant legalconsiderations, an assessment of the nature and extent of our continuing involvement with the assets transferred and any other relevantconsiderations. We use receivable factoring arrangements periodically when circumstances are favorable to manage liquidity. We havenonrecourse factoring arrangements in which we sell eligible trade receivables primarily to banks in exchange for cash. We may then continue tocollect the receivables sold, acting solely as a collecting agent on behalf of the banks. The outstanding principal amount of receivables underthese arrangements amounted to $819 million as of December 31, 2018, $843 million as of December 31, 2017 and $677 million as ofDecember 31, 2016. The incremental costs of factoring receivables under this arrangement were $10 million or less in each of the years presented.The proceeds from the sales of receivables are included in cash from operating activities in the consolidated statements of cash flows.
Inventories:We value our inventory using the average cost method. We also record inventory allowances for overstock and obsolete inventories due toingredient and packaging changes.
72
Table of Contents
Long-Lived Assets:Property, plant and equipment are stated at historical cost and depreciated by the straight-line method over the estimated useful lives of theassets. Machinery and equipment are depreciated over periods ranging from 3 to 20 years and buildings and building improvements over periodsup to 40 years.
We review long-lived assets, including amortizable intangible assets, for realizability on an ongoing basis. Changes in depreciation, generallyaccelerated depreciation, are determined and recorded when estimates of the remaining useful lives or residual values of long-term assets change.We also review for impairment when conditions exist that indicate the carrying amount of the assets may not be fully recoverable. In thosecircumstances, we perform undiscounted operating cash flow analyses to determine if an impairment exists. When testing for asset impairment,we group assets and liabilities at the lowest level for which cash flows are separately identifiable. Any impairment loss is calculated as the excessof the asset’s carrying value over its estimated fair value. Fair value is estimated based on the discounted cash flows for the asset group over theremaining useful life or based on the expected cash proceeds for the asset less costs of disposal. Any significant impairment losses would berecorded within asset impairment and exit costs in the consolidated statements of earnings.
Software Costs:We capitalize certain computer software and software development costs incurred in connection with developing or obtaining computer software forinternal use. Capitalized software costs are included in property, plant and equipment and amortized on a straight-line basis over the estimateduseful lives of the software, which do not exceed seven years.
Goodwill and Non-Amortizable Intangible Assets:We test goodwill and non-amortizable intangible assets for impairment on an annual basis on July 1. We assess goodwill impairment riskthroughout the year by performing a qualitative review of entity-specific, industry, market and general economic factors affecting our goodwillreporting units. We review our operating segment and reporting unit structure for goodwill testing annually or as significant changes in theorganization occur. Annually, we may perform qualitative testing, or depending on factors such as prior-year test results, current yeardevelopments, current risk evaluations and other practical considerations, we may elect to do quantitative testing instead. In our quantitativetesting, we compare a reporting unit’s estimated fair value with its carrying value. We estimate a reporting unit’s fair value using a discounted cashflow method that incorporates planned growth rates, market-based discount rates and estimates of residual value. This year, for our Europe andNorth America reporting units, we used a market-based, weighted-average cost of capital of 7.3% to discount the projected cash flows of thoseoperations. For our Latin America and AMEA reporting units, we used a risk-rated discount rate of 10.3%. Estimating the fair value of individualreporting units requires us to make assumptions and estimates regarding our future plans, industry and economic conditions, and our actualresults and conditions may differ over time. If the carrying value of a reporting unit’s net assets exceeds its fair value, we would recognize animpairment charge for the amount by which the carrying value exceeds the reporting unit’s fair value.
Annually we assess non-amortizable intangible assets for impairment by performing a qualitative review and assessing events and circumstancesthat could affect the fair value or carrying value of the indefinite-lived intangible assets. If significant potential impairment risk exists for a specificasset, we quantitatively test it for impairment by comparing its estimated fair value with its carrying value. We determine estimated fair value usingplanned growth rates, market-based discount rates and estimates of royalty rates. If the carrying value of the asset exceeds its fair value, weconsider the asset impaired and reduce its carrying value to the estimated fair value. We amortize definite-lived intangible assets over theirestimated useful lives and evaluate them for impairment as we do other long-lived assets.
Insurance and Self-Insurance:We use a combination of insurance and self-insurance for a number of risks, including workers’ compensation, general liability, automobile liability,product liability and our obligation for employee healthcare benefits. We estimate the liabilities associated with these risks on an undiscountedbasis by evaluating and making judgments about historical claims experience and other actuarial assumptions and the estimated impact on futureresults.
73
Table of Contents
Revenue Recognition:We predominantly sell food and beverage products across several product categories and in all regions as disclosed in Note 17, SegmentReporting. We recognize revenue when control over the products transfers to our customers, which generally occurs upon delivery or shipment ofthe products. A small percentage of our net revenues relates to the licensing of our intellectual property, predominantly brand and trade names,and we record these revenues when earned within the period of the license term. We account for product shipping, handling and insurance asfulfillment activities with revenues for these activities recorded within net revenue and costs recorded within cost of sales. Any taxes collected onbehalf of government authorities are excluded from net revenues.
Revenues are recorded net of trade and sales incentives and estimated product returns. Known or expected pricing or revenue adjustments, suchas trade discounts, rebates or returns, are estimated at the time of sale. We base these estimates of expected amounts principally on historicalutilization and redemption rates. Estimates that affect revenue, such as trade incentives and product returns, are monitored and adjusted eachperiod until the incentives or product returns are realized.
Key sales terms, such as pricing and quantities ordered, are established on a frequent basis such that most customer arrangements and relatedincentives have a one year or shorter duration. As such, we do not capitalize contract inception costs and we capitalize product fulfillment costs inaccordance with U.S. GAAP and our inventory policies. We generally do not have any unbilled receivables at the end of a period. Deferredrevenues are not material and primarily include customer advance payments typically collected a few days before product delivery, at which timedeferred revenues are reclassified and recorded as net revenues. We generally do not receive noncash consideration for the sale of goods nor dowe grant payment financing terms greater than one year.
Marketing, Advertising and Research and Development:We promote our products with marketing and advertising programs. These programs include, but are not limited to, cooperative advertising, in-store displays and consumer marketing promotions. For interim reporting purposes, advertising and consumer promotion expenses are charged tooperations as a percentage of volume, based on estimated sales volume and estimated program spending. We do not defer costs on our year-endconsolidated balance sheet and all marketing and advertising costs are recorded as an expense in the year incurred. Advertising expense was$1,173 million in 2018, $1,248 million in 2017 and $1,396 million in 2016. We expense product research and development costs as incurred.Research and development expense was $362 million in 2018, $366 million in 2017 and $376 million in 2016. We record marketing and advertisingas well as research and development expenses within selling, general and administrative expenses.
Stock-based Compensation:Stock-based compensation awarded to employees and non-employee directors is valued at fair value on the grant date. We record stock-basedcompensation expense over the vesting period, generally three years. Forfeitures are estimated on the grant date for all of our stock-basedcompensation awards.
Employee Benefit Plans:We provide a range of benefits to our current and retired employees. These include pension benefits, postretirement health care benefits andpostemployment benefits depending upon jurisdiction, tenure, job level and other factors. Local statutory requirements govern many of the benefitplans we provide around the world. Local government plans generally cover health care benefits for retirees outside the United States, Canada andUnited Kingdom. As such, our U.S., Canadian and U.K. subsidiaries provide health care and other benefits to most retired employees. Ourpostemployment benefit plans provide primarily severance benefits for eligible salaried and certain hourly employees. The cost for these plans isrecognized in earnings primarily over the working life of the covered employee.
Financial Instruments:We use financial instruments to manage our currency exchange rate, commodity price and interest rate risks. We monitor and manage theseexposures as part of our overall risk management program, which focuses on the unpredictability of financial markets and seeks to reduce thepotentially adverse effects that the volatility of these markets may have on our operating results. A principal objective of our risk managementstrategies is to reduce significant, unanticipated earnings fluctuations that may arise from volatility in currency exchange rates, commodity pricesand interest rates, principally through the use of derivative instruments.
74
Table of Contents
We use a combination of primarily currency forward contracts, futures, options and swaps; commodity forward contracts, futures and options; andinterest rate swaps to manage our exposure to cash flow variability, protect the value of our existing currency assets and liabilities and protect thevalue of our debt. See Note 9, Financial Instruments, for more information on the types of derivative instruments we use.
We record derivative financial instruments on a gross basis and at fair value in our consolidated balance sheets within other current assets or othercurrent liabilities due to their relatively short-term duration. Cash flows from derivative instruments are classified in the consolidated statements ofcash flows based on the nature of the derivative instrument. Changes in the fair value of a derivative that is designated as a cash flow hedge, tothe extent that the hedge is effective, are recorded in accumulated other comprehensive earnings/(losses) and reclassified to earnings when thehedged item affects earnings. Changes in fair value of economic hedges and the ineffective portion of all hedges are recognized in current periodearnings. Changes in the fair value of a derivative that is designated as a fair value hedge, along with the changes in the fair value of the relatedhedged asset or liability, are recorded in earnings in the same period. We use non-U.S. dollar denominated debt to hedge a portion of our netinvestment in non-U.S. operations against adverse movements in exchange rates. Currency movements related to our non-U.S. debt and our netinvestments in non-U.S. operations, as well as the related deferred taxes, are recorded within currency translation adjustment in accumulated othercomprehensive earnings/(losses).
In order to qualify for hedge accounting, a specified level of hedging effectiveness between the derivative instrument and the item being hedgedmust exist at inception and throughout the hedged period. We must also formally document the nature of and relationship between the derivativeand the hedged item, as well as our risk management objectives, strategies for undertaking the hedge transaction and method of assessing hedgeeffectiveness. Additionally, for a hedge of a forecasted transaction, the significant characteristics and expected term of the forecasted transactionmust be specifically identified, and it must be probable that the forecasted transaction will occur. If it is no longer probable that the hedgedforecasted transaction will occur, we would recognize the gain or loss related to the derivative in earnings.
When we use derivatives, we are exposed to credit and market risks. Credit risk exists when a counterparty to a derivative contract might fail tofulfill its performance obligations under the contract. We reduce our credit risk by entering into transactions with counterparties with high quality,investment grade credit ratings, limiting the amount of exposure with each counterparty and monitoring the financial condition of our counterparties.We also maintain a policy of requiring that all significant, non-exchange traded derivative contracts with a duration of one year or longer aregoverned by an International Swaps and Derivatives Association master agreement. Market risk exists when the value of a derivative or otherfinancial instrument might be adversely affected by changes in market conditions and commodity prices, currency exchange rates or interestrates. We manage derivative market risk by limiting the types of derivative instruments and derivative strategies we use and the degree of marketrisk that we plan to hedge through the use of derivative instruments.
Commodity derivatives. We are exposed to price risk related to forecasted purchases of certain commodities that we primarily use as rawmaterials. We enter into commodity forward contracts primarily for wheat, sugar and other sweeteners, soybean and vegetable oils and cocoa.Commodity forward contracts generally are not subject to the accounting requirements for derivative instruments and hedging activities under thenormal purchases exception. We also use commodity futures and options to hedge the price of certain input costs, including cocoa, energy costs,sugar and other sweeteners, wheat, packaging, dairy, corn, and soybean and vegetable oils. We also sell commodity futures to unprice futurepurchase commitments, and we occasionally use related futures to cross-hedge a commodity exposure. We are not a party to leveragedderivatives and, by policy, do not use financial instruments for speculative purposes. During the third quarter of 2016, we discontinued designatingcommodity derivatives for hedge accounting treatment. Any unrealized gains or losses (mark-to-market impacts) and realized gains or losses arerecorded in earnings.
Currency exchange derivatives. We use various financial instruments to mitigate our exposure to changes in exchange rates from third-party andintercompany current and forecasted transactions. These instruments may include currency exchange forward contracts, futures, options andswaps. Based on the size and location of our businesses, we use these instruments to hedge our exposure to certain currencies, including theeuro, pound sterling, Swiss franc, Canadian dollar and Mexican peso. During the third quarter of 2016, we discontinued designating currencyexchange derivatives for hedge accounting treatment. Any unrealized gains or losses (mark-to-market impacts) and realized gains or losses arerecorded in earnings (see Note 9, Financial Instruments, for additional information).
75
Table of Contents
Interest rate cash flow and fair value hedges. We manage interest rate volatility by modifying the pricing or maturity characteristics of certainliabilities so that the net impact on expense is not, on a material basis, adversely affected by movements in interest rates. As a result of interestrate fluctuations, hedged fixed-rate liabilities appreciate or depreciate in market value. We expect the effect of this unrealized appreciation ordepreciation to be substantially offset by our gains or losses on the derivative instruments that are linked to these hedged liabilities. We usederivative instruments, including interest rate swaps that have indices related to the pricing of specific liabilities as part of our interest rate riskmanagement strategy. As a matter of policy, we do not use highly leveraged derivative instruments for interest rate risk management. We useinterest rate swaps to economically convert a portion of our fixed-rate debt into variable-rate debt. Under the interest rate swap contracts, we agreewith other parties to exchange, at specified intervals, the difference between fixed-rate and floating-rate interest amounts, which is calculatedbased on an agreed-upon notional amount. We use interest rate swaps to hedge the variability of interest payment cash flows on a portion of ourfuture debt obligations. We also execute cross-currency interest rate swaps to hedge interest payments on newly issued debt denominated in adifferent currency than the functional currency of the borrowing entity. Substantially all of these derivative instruments are highly effective andqualify for hedge accounting treatment.
Hedges of net investments in non-U.S. operations. We have numerous investments outside the United States. The net assets of thesesubsidiaries are exposed to changes and volatility in currency exchange rates. We use local currency denominated debt to hedge our non-U.S. netinvestments against adverse movements in exchange rates. We designated our euro, pound sterling, Swiss franc and Canadian dollar-denominated borrowings as a net investment hedge of a portion of our overall international operations. The gains and losses on our net investmentin these designated international operations are economically offset by losses and gains on our euro, pound sterling, Swiss franc and Canadiandollar-denominated borrowings. The change in the debt’s value, net of deferred taxes, is recorded in the currency translation adjustmentcomponent of accumulated other comprehensive earnings/(losses).
Additionally, beginning in the first quarter of 2018, we entered into cross-currency interest rate swaps and forwards to hedge certain investments inour non-U.S. operations against movements in exchange rates. The after-tax gain/(loss) on these net investment hedge contracts is recorded inthe cumulative translation adjustment section of other comprehensive income and the pre-tax impacts of the cash flows from these contracts arereported as other investing activities in the consolidated statement of cash flows.
Income Taxes:Our provision for income taxes includes amounts payable or refundable for the current year, the effects of deferred taxes and impacts fromuncertain tax positions. We recognize deferred tax assets and liabilities for the expected future tax consequences of temporary differencesbetween the financial statement and tax basis of our assets and liabilities, operating loss carryforwards and tax credit carryforwards. Deferred taxassets and liabilities are measured using enacted tax rates expected to apply in the years in which those differences are expected to reverse.
The realization of certain deferred tax assets is dependent on generating sufficient taxable income in the appropriate jurisdiction prior to theexpiration of the carryforward periods. Deferred tax assets are reduced by a valuation allowance if it is more likely than not that some portion, orall, of the deferred tax assets will not be realized. When assessing the need for a valuation allowance, we consider any carryback potential, futurereversals of existing taxable temporary differences (including liabilities for unrecognized tax benefits), future taxable income and tax planningstrategies.
We recognize tax benefits in our financial statements from uncertain tax positions only if it is more likely than not that the tax position will besustained based on the technical merits of the position. The amount we recognize is measured as the largest amount of benefit that is greater than50 percent likely of being realized upon resolution. Future changes related to the expected resolution of uncertain tax positions could affect taxexpense in the period when the change occurs.
We monitor for changes in tax laws and reflect the impacts of tax law changes in the period of enactment. In response to the United States taxreform legislation enacted on December 22, 2017 (“U.S. tax reform”), the U.S. Securities and Exchange Commission (“SEC”) issued guidance thatallowed us to record provisional amounts for the impacts of U.S. tax reform if the full accounting could not be completed before we filed our 2017financial statements. For provisions of the tax law where we were unable to make a reasonable estimate of the impact, the guidance allowed us tocontinue to apply the historical tax provisions in computing our income tax liability and deferred tax assets and liabilities as of December 31, 2017.The guidance allowed us to finalize accounting for the U.S. tax reform changes within one year of the December 22, 2017 enactment date. Wehave finalized our
76
Table of Contents
accounting for the new provisions based on the guidance that has been issued and included the impacts in our 2018 consolidated financialstatements. See Note 15, Income Taxes, for additional information on the impacts of U.S. tax reform.
New Accounting Pronouncements:In August 2018, the Financial Accounting Standards Board ("FASB") issued an Accounting Standards Update ("ASU") that aligns the requirementsfor capitalizing implementation costs incurred in a hosting arrangement that is a service contract with the requirements for capitalizingimplementation costs for internal-use software. This ASU is effective for fiscal years beginning after December 15, 2019, with early adoptionpermitted. We are currently assessing the impact on our consolidated financial statements.
In August 2018, the FASB issued an ASU that modifies the disclosure requirements for employers that sponsor defined benefit pension or otherpostretirement plans. The ASU is effective for fiscal years beginning after December 15, 2019, with early adoption permitted. The new standardmay impact our disclosures and is not expected to have an impact on our consolidated financial statements.
In August 2018, the FASB issued an ASU that modifies the disclosure requirements on fair value measurements. The ASU is effective for fiscalyears beginning after December 15, 2019, with early adoption permitted. The new standard may impact our disclosures and is not expected tohave an impact on our consolidated financial statements.
In June 2018, the FASB issued an ASU that requires entities to record share-based payment transactions for acquiring goods and services fromnon-employees at fair value as of adoption date. The ASU is effective for fiscal years beginning after December 15, 2018, with early adoptionpermitted. This ASU is not expected to have a material impact on our consolidated financial statements.
In February 2018, the FASB issued an ASU that permits entities to elect a reclassification from accumulated other comprehensive income toretained earnings for stranded tax effects resulting from the 2017 enactment of U.S. tax reform legislation. The ASU is effective for fiscal yearsbeginning after December 15, 2018, with early adoption permitted. We do not expect to elect to reclassify these stranded tax effects from U.S. taxreform when we adopt this ASU in the first quarter of 2019. As such, this ASU is not expected to have a material impact on our consolidatedfinancial statements.
In August 2017, the FASB issued an ASU to better align hedge accounting with an entity's risk management activities and improve disclosuressurrounding hedging. For cash flow and net investment hedges as of the adoption date, the ASU requires a modified retrospective transitionapproach. Presentation and disclosure requirements related to this ASU are required prospectively. The ASU is effective for fiscal years beginningafter December 15, 2018, with early adoption permitted. We early adopted this standard as of January 1, 2018 and there was no material impact toour consolidated financial statements upon adoption. Refer to Note 9, Financial Instruments, for additional information.
In June 2016, the FASB issued an ASU on the measurement of credit losses on financial instruments. This ASU requires entities to measure theimpairment of certain financial instruments, including trade receivables, based on expected losses rather than incurred losses. This ASU iseffective for fiscal years beginning after December 15, 2019, with early adoption permitted for financial statement periods beginning afterDecember 15, 2018. We are currently assessing the guidance. This ASU is not expected to have a material impact on our consolidated financialstatements.
In February 2016, the FASB issued an ASU on lease accounting to increase transparency and comparability among organizations by requiring therecognition of Right of Use ("ROU") assets and lease liabilities on the balance sheet and disclosing key information about leasing arrangements.The ASU revises existing U.S. GAAP and outlines a new model for lessors and lessees to use in accounting for lease contracts. The guidancerequires lessees to recognize a right-of-use asset and a lease liability on the balance sheet for all leases, with the exception of short-term leases.In the statement of earnings, lessees will classify leases as either operating (resulting in straight-line expense) or financing (resulting in a front-loaded expense pattern). In July 2018, the FASB issued an ASU which allows for an alternative transition approach, which will not requireadjustments to comparative prior-period amounts. The ASU is effective for fiscal years beginning after December 15, 2018, with early adoptionpermitted. We adopted the new standard on January 1, 2019. We elected to apply the package of practical expedients, including not reassessingwhether expired or existing contracts contained leases, the classification of those leases
77
Table of Contents
and not reassessing initial direct costs for any existing leases. We elected not to separate non-lease components from lease components and toaccount for both as a single lease component by class of the underlying asset. The most significant impact from adopting the standard is theinitial recognition of operating lease ROU assets and lease liabilities on our balance sheet, while our accounting for finance leases (i.e. capitalleases) remains substantially unchanged. We continue to finalize our implementation efforts and currently estimate recording during the firstquarter of 2019 an amount between approximately $650 to $800 million for long-term operating lease ROU assets and from approximately $650 to$800 million for operating lease liabilities, of which approximately $240 to $290 million will be recorded in other current liabilities and $410 to $510million will be recorded in long-term operating lease liabilities. The transition method we elected for adoption of the standard requires us to make acumulative effect adjustment as of January 1, 2019 and we do not believe that this amount will be material.
In May 2014, the FASB issued an ASU on revenue recognition from contracts with customers. The ASU outlines a new, single comprehensivemodel for companies to use in accounting for revenue. The core principle is that an entity should recognize revenue to depict the transfer of controlover promised goods or services to a customer in an amount that reflects the consideration the entity expects to be entitled to receive in exchangefor the goods or services. The ASU also requires additional disclosure about the nature, amount, timing and uncertainty of revenue and cash flowsfrom customer contracts, including significant judgments made in recognizing revenue. In 2016 and 2017, the FASB issued several ASUs thatclarified principal versus agent (gross versus net) revenue presentation considerations, confirmed the accounting for certain prepaid stored-valueproducts and clarified the guidance for identifying performance obligations within a contract, the accounting for licenses and partial sales ofnonfinancial assets. The FASB also issued two ASUs providing technical corrections, narrow scope exceptions and practical expedients to clarifyand improve the implementation of the new revenue recognition guidance. The revenue guidance is effective for annual reporting periods beginningafter December 15, 2017. We adopted the new standard on January 1, 2018 on a full retrospective basis. There was no material financial impactfrom adopting the new revenue standards in any of the historical periods presented. Also refer to the Revenue Recognition section above and Note17, Segment Reporting, for disaggregated revenue information.
Reclassifications:Certain amounts previously reported have been reclassified to conform to current-year presentation. During the third quarter of 2018, in connectionwith the Keurig Dr Pepper Inc. transaction, we changed our accounting principle to reflect our share of Keurig Green Mountain Inc.’s historicalresults and Keurig Dr Pepper Inc.'s ongoing results on a one-quarter lag basis while we continue to record cash receipts, such as dividends, whencash was received. This change was applied retrospectively to all periods presented. Refer to Note 6, Equity Method Investments, for moreinformation. Additionally, on January 1, 2018, we adopted an ASU that changed the presentation of net periodic pension and postretirement costson the consolidated statements of earnings. As a result of this adoption, we disaggregated the components of our net periodic pension andpostretirement benefit costs and moved components other than service costs to a new line item, benefit plan non-service income, located belowoperating income. Prior-period cost of sales, selling, general and administrative expenses and asset impairment and exit costs as well as segmentoperating income results were updated to reflect the reclassification. All components of net periodic pension and postretirement benefit costs aresummarized in Note 10, Benefit Plans.
Note 2. Divestitures and Acquisitions
On June 7, 2018, we acquired a U.S. premium biscuit company, Tate’s Bake Shop, within our North America segment for $528 million cash paid,net of cash received, and extended our premium biscuit offerings. We expect to finalize the purchase price paid and related purchase priceallocation once working capital and other adjustments are finalized. We accounted for the transaction as a business combination. As of December31, 2018, we recorded a preliminary purchase price allocation of $45 million to definite-lived intangible assets, $205 million to indefinite-livedintangible assets, $298 million to goodwill, $16 million to property, plant and equipment, $5 million to inventory, $9 million to accounts receivable,$6 million to current liabilities and $44 million to deferred tax liabilities. The acquisition added incremental net revenues of $52 million andincremental operating income of $7 million in 2018. We also recorded $13 million of acquisition-related costs in 2018.
On December 28, 2017, we completed the sale of a confectionery business in Japan. We received cash proceeds of ¥2.8 billion ($24 million as ofDecember 28, 2017) and recorded an immaterial pre-tax loss on the divestiture within our AMEA segment.
In connection with the 2012 spin-off of Kraft Foods Group, Inc. (now a part of The Kraft Heinz Company (“KHC”)), Kraft Foods Group and we eachgranted the other various licenses to use certain trademarks in connection with
78
Table of Contents
particular product categories in specified jurisdictions. On August 17, 2017, we entered into two agreements with KHC to terminate the licenses ofcertain KHC-owned brands used in our grocery business within our Europe region and to transfer to KHC inventory and certain other assets. OnAugust 17, 2017, the first transaction closed and we received cash proceeds of €9 million ($11 million as of August 17, 2017) and on October 23,2017, the second transaction closed and we received cash proceeds of €2 million ($3 million as of October 23, 2017). The gain on bothtransactions combined was immaterial.
On July 4, 2017, we completed the sale of most of our grocery business in Australia and New Zealand to Bega Cheese Limited for $456 millionAustralian dollars ($347 million as of July 4, 2017). We divested $27 million of current assets, $135 million of non-current assets and $4 million ofcurrent liabilities based on the July 4, 2017 exchange rate. We recorded a pre-tax gain of $247 million Australian dollars ($187 million as of July 4,2017) on the sale. We also recorded divestiture-related costs of $2 million and a foreign currency hedge loss of $3 million during 2017. In the fourthquarter of 2017, we recorded a $3 million inventory-related working capital adjustment, increasing the pre-tax gain to $190 million in 2017.
On April 28, 2017, we completed the sale of several manufacturing facilities in France and the sale or license of several local confectionerybrands. We received cash of approximately €157 million ($169 million as of April 28, 2017), net of cash divested with the businesses. On April 28,2017, we divested $44 million of current assets, $155 million of non-current assets, $8 million of current liabilities and $22 million of non-currentliabilities based on the April 28, 2017 exchange rate. We recorded a $3 million loss on the sale and divestiture-related costs of $27 million in 2017and $84 million in 2016. These divestiture-related costs were recorded within cost of sales and selling, general and administrative expensesprimarily within our Europe segment. In prior periods, we recorded a $5 million impairment charge in May 2016 for a candy trademark to reduce theoverall net assets to the estimated net sales proceeds after transaction costs. On March 31, 2016, we recorded a $14 million impairment chargefor another gum & candy trademark as a portion of its carrying value would not be recoverable based on future cash flows expected under aplanned license agreement with the buyer.
During the year ended December 31, 2016, we also completed the following sale transactions:• On December 31, 2016, we completed the sale of a chocolate factory in Belgium. In connection with this transaction, we recorded a pre-
tax loss of €65 million ($68 million as of December 31, 2016), within asset impairment and exit costs in our Europe segment. The lossincludes a fixed asset impairment charge of €30 million ($31 million as of December 31, 2016), a loss on disposal of €22 million (23 millionas of December 31, 2016) and incremental expenses we incurred and accrued of €13 million ($14 million as of December 31, 2016) relatedto selling the factory.
• On December 1, 2016, we completed the sale of a confectionery business in Costa Rica represented by a local brand. The sales price was$28 million and we recorded a pre-tax gain of $9 million within gains on divestiture within our Latin America segment. We divestedapproximately $11 million of property, plant and equipment, $4 million of goodwill and $2 million of inventory. In connection with thistransaction, we incurred $2 million of transaction costs and accrued expenses.
• On August 26, 2016, we recorded a $7 million gain for the sale of a U.S.-owned biscuit trademark. The gain was recorded within selling,general and administrative expenses in 2016.
• On May 2, 2016, we completed the sale of certain local biscuit brands in Finland. The sales price was €14 million ($16 million as of May 2,2016) and we recorded a pre-tax gain of $6 million ($5 million after tax) within selling, general and administrative expenses of our Europesegment in the year ended December 31, 2016. We divested $8 million of indefinite-lived intangible assets and less than $1 million of otherassets. We received cash proceeds of €12 million ($14 million as of May 2, 2016) upon closing and another €2 million ($2 million as ofOctober 31, 2016) of consideration following the completion of post-closing requirements. The additional $2 million of considerationincreased the pre-tax gain to $8 million ($6 million after tax) through December 31, 2016.
On November 2, 2016, we purchased from Burton’s Biscuit Company certain intangibles, which included the license to manufacture, market andsell Cadbury-branded biscuits in additional key markets around the world, including in the United Kingdom, France, Ireland, North America andSaudi Arabia. The transaction was accounted for as a business combination. Total cash paid for the acquired assets was €199 million ($245million as of November 2, 2016). During the third quarter of 2017, we completed the valuation work and finalized the purchase price allocation of$66 million to definite-lived intangible assets, $173 million to goodwill, $2 million to property, plant and equipment and $4 million to inventory,reflecting a November 2, 2016 exchange rate. The acquisition added incremental net revenues of $59 million in 2017 and $16 million in 2016 andadded incremental operating income of $8 million in 2017 and $1 million in 2016.
79
Table of Contents
During the third quarter of 2016, we completed the acquisition of a Vietnamese biscuit operation within our AMEA segment. On July 15, 2015, weacquired an 80% interest in the biscuit operation and on August 22, 2016, we acquired the remaining 20% interest. Total cash paid for the biscuitoperation, intellectual property, non-compete and consulting agreements less purchase price adjustments was 12,404 billion Vietnamese dong($569 million using applicable exchange rates on July 15, 2015, November 27, 2015 and August 22, 2016). On August 22, 2016, in connection withacquiring the remaining 20% interest in the biscuit operation, escrowed funds of $70 million were released and we retained an agreed $20 millionrelated to two outstanding acquisition-related matters. We subsequently released $5 million in 2016 and $9 million in 2017 to the sellers and expectto pay $4 million within five years as remaining indemnified obligations are resolved. On August 22, 2016, we also made a final payment of 759billion Vietnamese dong ($35 million as of August 22, 2016) for the non-compete and consulting agreements. The non-compete and consultingagreements were recorded as prepaid contracts within other current and non-current assets and will be amortized into net earnings over the term ofthe agreements. During the third quarter of 2016, we also finalized the valuation and purchase price allocation of the acquired net assets of thebusiness, which included $10 million of inventory, $49 million of property, plant and equipment, $86 million of intangible assets, $385 million ofgoodwill and $31 million of other net liabilities. In periods following the initial July 15, 2015 first closing date, the allocation of the net asset fairvalues had an immaterial impact on our operating results. The acquisition added incremental net revenues of $71 million in 2016 and addedincremental operating income of $5 million in 2016. Within selling, general and administrative expenses, we recorded integration costs of $7 millionin 2016. We also recorded acquisition integration costs of $4 million in 2018 and $3 million in 2017.
Sales of Property:On November 9, 2016, we completed the sale of a manufacturing plant in Russia and recorded total expenses of $12 million, including a relatedfixed asset impairment charge of $4 million within asset impairments and exit costs. The sale of the land, buildings and equipment generated cashproceeds of $6 million.
In 2016, we also sold property within our North America segment and from our centrally held corporate assets. In the third quarter of 2016, we soldproperty in North America that generated cash proceeds of $10 million and a pre-tax gain of $6 million and we sold a corporate aircraft hangar thatgenerated cash proceeds of $3 million and a pre-tax gain of $1 million. In the second quarter of 2016, we also sold property within our NorthAmerica segment and from our centrally held corporate assets. The North America sale generated cash proceeds of $40 million and a pre-tax gainof $33 million. The corporate aircraft sale generated cash proceeds of $20 million and a pre-tax gain of $6 million. The gains were recorded withinselling, general and administrative expenses and cash proceeds were recorded in cash flows from other investing activities in the year endedDecember 31, 2016.
Note 3. Inventories
Inventories consisted of the following:
As of December 31,
2018 2017 (in millions)Raw materials $ 726 $ 711Finished product 1,987 1,975 2,713 2,686Inventory reserves (121) (129)Inventories, net $ 2,592 $ 2,557
80
Table of Contents
Note 4. Property, Plant and Equipment
Property, plant and equipment consisted of the following:
As of December 31,
2018 2017 (in millions)Land and land improvements $ 424 $ 458Buildings and building improvements 2,984 2,979Machinery and equipment 10,943 11,195Construction in progress 894 1,048 15,245 15,680Accumulated depreciation (6,763) (7,003)Property, plant and equipment, net $ 8,482 $ 8,677
Capital expenditures as presented on the statement of cash flow were $1.1 billion, $1.0 billion and $1.2 billion for the years ending December 31,2018, 2017 and 2016 and excluded $331 million, $357 million and $343 million for accrued capital expenditures not yet paid.
In connection with our restructuring program, we recorded non-cash property, plant and equipment write-downs (including accelerated depreciationand asset impairments) of $59 million in 2018, $206 million in 2017 and $301 million in 2016 (see Note 7, Restructuring Program). These chargesrelated to property, plant and equipment were recorded in the consolidated statements of earnings within asset impairment and exit costs and inthe segment results as follows:
For the Years Ended December 31,
2018 2017 2016 (in millions)Latin America $ 25 $ 36 $ 22AMEA 5 81 44Europe 15 58 122North America 13 30 111Corporate 1 1 2Non-cash property, plant and equipment write-downs $ 59 $ 206 $ 301
Note 5. Goodwill and Intangible Assets
Goodwill by operating segment was:
As of December 31,
2018 2017 (in millions)Latin America $ 823 $ 901AMEA 3,210 3,371Europe 7,519 7,880North America 9,173 8,933Goodwill $ 20,725 $ 21,085
81
Table of Contents
Intangible assets consisted of the following:
As of December 31,
2018 2017 (in millions)Non-amortizable intangible assets $ 17,201 $ 17,671Amortizable intangible assets 2,328 2,386 19,529 20,057Accumulated amortization (1,527) (1,418)Intangible assets, net $ 18,002 $ 18,639
Non-amortizable intangible assets consist principally of brand names purchased through our acquisitions of Nabisco Holdings Corp., the Spanishand Portuguese operations of United Biscuits, the global LU biscuit business of Groupe Danone S.A. and Cadbury Limited. Amortizable intangibleassets consist primarily of trademarks, customer-related intangibles, process technology, licenses and non-compete agreements.
Amortization expense for intangible assets was $176 million in 2018, $178 million in 2017 and $176 million in 2016. For the next five years, weestimate annual amortization expense of approximately $170 million for the next two years and approximately $85 million in years three to five,reflecting December 31, 2018 exchange rates.
Changes in goodwill and intangible assets consisted of:
2018 2017
Goodwill Intangible
Assets, at cost Goodwill Intangible
Assets, at cost (in millions)Balance at January 1 $ 21,085 $ 20,057 $ 20,276 $ 19,319Changes due to:
Currency (658) (710) 909 954Divestitures — — (114) (100)Acquisitions 298 250 15 (7)Asset impairments — (68) — (109)Other — — (1) —
Balance at December 31 $ 20,725 $ 19,529 $ 21,085 $ 20,057
Changes to goodwill and intangibles were:• Divestitures – During 2017, in connection with the divestiture of several manufacturing facilities, primarily in France, we divested $23
million of goodwill and $62 million of amortizable and non-amortizable intangible assets. In 2017, we also completed a sale of most of ourgrocery business in Australia and New Zealand and divested $86 million of related goodwill. Furthermore, we completed a sale of aconfectionery business in Japan and divested $5 million of goodwill and $24 million of definite lived intangible assets. Finally, we divested$14 million of definite lived intangible asset as part of our sale of one of our equity method investments. See Note 2, Divestitures andAcquisitions, for additional information.
• Acquisitions – In connection with the acquisition of Tate's Bake Shop in the second quarter of 2018, we recorded a preliminary purchaseprice allocation of $298 million to goodwill and $250 million to intangible assets. During 2017, we recorded a $15 million adjustment togoodwill and a $7 million adjustment to indefinite lived assets in connection with finalizing the valuation and purchase price allocation forthe Burton’s Biscuit Company purchase completed in the fourth quarter of 2016. See Note 2, Divestitures and Acquisitions, for additionalinformation.
• Asset impairments – As further discussed below, we recorded $68 million of intangible asset impairments in 2018 and $109 million in2017.
82
Table of Contents
In 2018, 2017 and 2016, there were no goodwill impairments and each of our reporting units had sufficient fair value in excess of its carrying value.While all reporting units passed our annual impairment testing, if planned business performance expectations are not met or specific valuationfactors outside of our control, such as discount rates, change significantly, then the estimated fair values of a reporting unit or reporting unitsmight decline and lead to a goodwill impairment in the future.
During our 2018 annual testing of non-amortizable intangible assets, we recorded $68 million of impairment charges in the third quarter related tofive trademarks. We recorded charges related to gum, chocolate, biscuits and candy trademarks of $45 million in Europe, $14 million in NorthAmerica and $9 million in AMEA. We also identified seven brands, including the five impaired trademarks, with $538 million of aggregate bookvalue as of December 31, 2018 that each had a fair value in excess of book value of 10% or less. We believe our current plans for each of thesebrands will allow them to continue to not be impaired, but if the product line expectations are not met or specific valuation factors outside of ourcontrol, such as discount rates, change significantly, then a brand or brands could become impaired in the future. In 2017, we recorded $109million of impairment charges, of which $70 million related to annual testing impairment charges for candy and gum trademarks of $52 million inAMEA, $11 million in Europe, $5 million in Latin America and $2 million in North America. During 2017, we also recorded a $38 million intangibleasset impairment charge resulting from a category decline and lower than expected product growth related to a gum trademark in our NorthAmerica segment and a $1 million intangible asset impairment charge related to a transaction. In 2016, we recorded $137 million of impairmentcharges, of which $98 million related to annual testing impairment charges related to biscuits, candy and gum trademarks of $41 million in AMEA,$32 million in North America, $22 million in Europe, and $3 million in Latin America. During 2016, we also recorded $20 million of impairmentsrelated to the planned sale of a confectionery business in France and we also recorded $19 million of charges in our Europe, North America andAMEA segments resulting from the discontinuation of four biscuit products and one candy product.
Note 6. Equity Method Investments
Our investments accounted for under the equity method of accounting totaled $7,123 million as of December 31, 2018 and $6,193 million as ofDecember 31, 2017. In both years, our largest equity method investments were in Jacobs Douwe Egberts (“JDE”) and Keurig Green Mountain, Inc.("Keurig") prior to July 9, 2018 and Keurig Dr Pepper Inc. (NYSE: "KDP”) subsequent to July 9, 2018.
JDE:On July 2, 2015, we completed transactions to combine our wholly owned coffee businesses with those of D.E Master Blenders 1753 B.V.(“DEMB”) to create a new company, JDE. Through March 7, 2016, we held a 43.5% interest in JDE. Following the March 7, 2016 exchange of aportion of our investment in JDE for an interest in Keurig, we held a 26.5% equity interest in JDE. (See Keurig below.) The remaining 73.5% equityinterest in JDE was held by a subsidiary of Acorn Holdings B.V. (“AHBV,” owner of DEMB prior to July 2, 2015). As of December 31, 2018, weheld a 26.5% voting interest, a 26.4% ownership interest and a 26.3% profit and dividend sharing interest in JDE. We recorded JDE equityearnings of $230 million (which includes a deferred tax benefit from a Dutch tax rate reduction) in 2018, $129 million in 2017 and $100 million in2016. We also recorded $73 million of cash dividends received in 2018 and $49 million of cash dividends received in 2017.
On June 30, 2016, we entered into agreements with AHBV and its affiliates to establish a new stock-based compensation arrangement tied to theissuance of JDE equity compensation awards to JDE employees. This arrangement replaced a temporary equity compensation program tied to theissuance of AHBV equity compensation to JDE employees. New Class C, D and E JDE shares were authorized and issued for investments madeby, and vested stock-based compensation awards granted to, JDE employees. Under these arrangements, share ownership dilution from the JDEClass C, D and E shareholders was limited to 2%.
On July 5, 2016, we received an expected cash payment of $275 million from JDE to settle an outstanding receivable related to tax formationcosts related to the formation of JDE.
On July 19, 2016, the Supreme Court of Spain reached a final resolution on a challenged JDE tax position held by a predecessor DEMB companythat resulted in an unfavorable tax expense of €114 million. As a result, our share of JDE’s equity earnings during the third quarter of 2016 wasnegatively affected by €30 million ($34 million).
83
Table of Contents
Keurig:On March 3, 2016, a subsidiary of AHBV completed a $13.9 billion acquisition of all of the outstanding common stock of Keurig through a mergertransaction. On March 7, 2016, we exchanged with a subsidiary of AHBV a portion of our equity interest in JDE with a carrying value of €1.70billion (approximately $2.0 billion as of March 7, 2016) for an interest in Keurig with a fair value of $2.0 billion based on the merger considerationper share for Keurig. We recorded the difference between the fair value of Keurig and our basis in JDE shares as a $43 million gain on the equitymethod investment exchange in March 2016. Immediately following the exchange, our ownership interest in JDE was 26.5% and our interest inKeurig was 24.2%.
Our initial $2.0 billion investment in Keurig included a $1.6 billion Keurig equity interest and a $0.4 billion shareholder loan receivable, which werereported on a combined basis within equity method investments prior to the Keurig Dr. Pepper transaction described below. The shareholder loanhad a 5.5% interest rate and was payable at the end of a seven-year term on February 27, 2023.
Within equity method investment net earnings, we recorded shareholder loan interest income of $12 million in 2018, $24 million in 2017 and $20million in 2016. We received shareholder loan interest payments of $12 million in 2018, $30 million in 2017 and $14 million in 2016 and dividends of$34 million in 2018, $14 million in 2017 and $4 million in 2016.
Keurig Dr Pepper:On July 9, 2018, Keurig closed on its definitive merger agreement with Dr Pepper Snapple Group, Inc., and formed KDP, a publicly tradedcompany. Following the close of the transaction, our 24.2% investment in Keurig together with our shareholder loan receivable became a 13.8%investment in KDP. During the third quarter of 2018, we recorded a preliminary pre-tax gain of $757 million reported as a gain on equity methodtransaction and $184 million of deferred tax expense reported in the provision for income taxes (or $573 million after-tax gain) related to the changein our ownership interest while KDP finalized the valuation for the transaction. During our fourth quarter of 2018, KDP finalized its opening balancesheet and we increased our pre-tax gain by $21 million (or $13 million after-tax) to $778 million (or $586 million after-tax) while recording $8 millionof deferred tax expense related to the increase for a total deferred tax expense of $192 million for 2018.
We hold two director positions on the KDP board as well as additional governance rights. As we continue to have significant influence, we continueto account for our investment in KDP under the equity method, resulting in recognizing our share of their earnings within our earnings and our shareof their dividends within our cash flows.
In connection with this transaction, we changed our accounting principle during the third quarter of 2018 to reflect our share of Keurig's historicaland KDP's ongoing earnings on a one-quarter lag basis while we continue to record dividends when cash is received. We determined a lag waspreferable as it enables us to continue to report our quarterly and annual results on a timely basis and to record our share of KDP’s ongoing resultsonce KDP has publicly reported its results. This change in accounting principle was applied retrospectively to all periods. While our operatingincome did not change, equity method investment net earnings, net earnings and earnings per share have been adjusted to reflect the lag acrossall reported periods.
84
Table of Contents
The following tables show the primary line items on the consolidated statements of earnings and comprehensive earnings and the consolidatedbalance sheet that changed as a result of the lag. The consolidated statements of cash flow and equity were also updated to reflect thesechanges.
For the Years Ended
December 31, 2017 December 31, 2016
As Reported As Adjusted As Reported As Adjusted (in millions, except per share data)Statements of Earnings
Provision for income taxes $ (688) $ (666) $ (129) $ (114)Equity method investment net earnings 460 344 301 262Net earnings 2,936 2,842 1,669 1,645Net earnings attributable to Mondelēz International 2,922 2,828 1,659 1,635Earnings per share attributable to Mondelēz International:
Basic EPS $ 1.93 $ 1.87 $ 1.07 $ 1.05Diluted EPS $ 1.91 $ 1.85 $ 1.05 $ 1.04
Statements of Other Comprehensive Earnings Currency translation adjustment $ 1,201 $ 1,198 $ (925) $ (921)Total other comprehensive earnings/(losses) 1,152 1,149 (1,153) (1,149)Comprehensive earnings attributable to Mondelēz International 4,046 3,949 523 503
As of December 31, 2017
As Reported As Adjusted (in millions)Balance Sheet
Equity method investments $ 6,345 $ 6,193Deferred income taxes 3,376 3,341Retained earnings 22,749 22,631Accumulated other comprehensive losses (9,998) (9,997)Total Mondelēz International shareholders' equity 26,111 25,994Total equity 26,191 26,074
As of December 31, 2018, we held a 13.8% ownership interest in KDP. Our ownership interest in KDP may change over time due to stock-basedcompensation arrangements and other transactions by KDP. As of December 31, 2018, the fair value of our ownership interest in KDP wasapproximately $4.9 billion based on KDP's closing stock price.
Keurig and KDP equity earnings, as adjusted for the one-quarter lag basis, totaled $213 million in 2018 (which includes a deferred tax benefitKeurig recorded as a result of U.S. tax reform), $92 million in 2017 and $38 million in 2016.
Other Equity Method Investment transactions:On October 2, 2017, we completed the sale of one of our equity method investments and received cash proceeds of $65 million. We recorded apre-tax gain of $40 million within the gain on equity method investment transactions and $15 million of tax expense.
85
Table of Contents
Summary Financial Information for Equity Method Investments:Summarized financial information related to our equity method investments is reflected below. The tables below reflect the adjustments notedabove for the Keurig and KDP one-quarter lag.
As of December 31,
2018 2017 (in millions)Current assets $ 5,695 $ 5,033Noncurrent assets 69,445 38,320
Total assets $ 75,140 $ 43,353Current liabilities $ 9,434 $ 5,709Noncurrent liabilities 29,296 16,510
Total liabilities $ 38,730 $ 22,219Equity attributable to shareowners of investees $ 36,365 $ 21,064Equity attributable to noncontrolling interests 46 71Total net equity of investees $ 36,411 $ 21,135
Mondelēz International ownership interests 13-50% 24-50%Mondelēz International share of investee net equity (1) $ 7,123 $ 5,753
Keurig shareholder loan — 440Equity method investments $ 7,123 $ 6,193
For the Years Ended December 31,
2018 2017 2016 (in millions)Net revenues $ 14,185 $ 12,824 $ 9,709Gross profit 6,076 4,913 3,748Income from continuing operations 1,980 1,118 680Net income 1,980 1,118 680Net income attributable to investees $ 1,970 $ 1,115 $ 679
Mondelēz International ownership interests 13-50% 24-50% 24-50%Mondelēz International share of investee net income $ 536 $ 320 $ 242
Keurig shareholder loan interest income 12 24 20Equity method investment net earnings $ 548 $ 344 $ 262 (1) Includes a basis difference of approximately $340 million as of December 31, 2018 and $360 million as of December 31, 2017 between the U.S. GAAP accounting basis for
our equity method investments and the U.S. GAAP accounting basis of our investees’ equity.
Note 7. Restructuring Program
On May 6, 2014, our Board of Directors approved a $3.5 billion 2014-2018 restructuring program and up to $2.2 billion of capital expenditures. OnAugust 31, 2016, our Board of Directors approved a $600 million reallocation between restructuring program cash costs and capital expendituresso the $5.7 billion program consisted of approximately $4.1 billion of restructuring program costs ($3.1 billion cash costs and $1.0 billion non-cashcosts) and up to $1.6 billion of capital expenditures. On September 6, 2018, our Board of Directors approved an extension of the restructuringprogram through 2022, an increase of $1.3 billion in the program charges and an increase of $700 million in capital expenditures. The total $7.7billion program now consists of $5.4 billion of program charges ($4.1 billion of cash costs and $1.3 billion of non-cash costs) and total capitalexpenditures of $2.3 billion to be incurred over the life of the program. The restructuring program, as increased and extended by these actions, isnow called the Simplify to Grow Program.
86
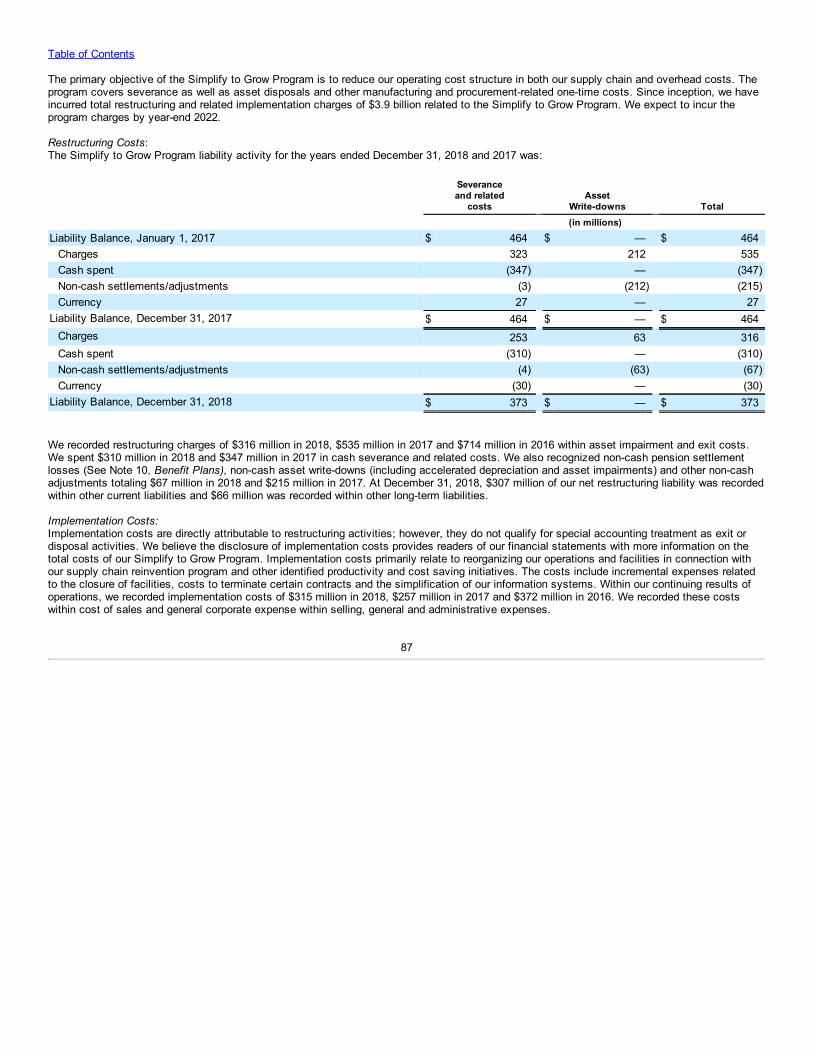
Table of Contents
The primary objective of the Simplify to Grow Program is to reduce our operating cost structure in both our supply chain and overhead costs. Theprogram covers severance as well as asset disposals and other manufacturing and procurement-related one-time costs. Since inception, we haveincurred total restructuring and related implementation charges of $3.9 billion related to the Simplify to Grow Program. We expect to incur theprogram charges by year-end 2022.
Restructuring Costs:The Simplify to Grow Program liability activity for the years ended December 31, 2018 and 2017 was:
Severanceand related
costs Asset
Write-downs Total (in millions)Liability Balance, January 1, 2017 $ 464 $ — $ 464
Charges 323 212 535Cash spent (347) — (347)Non-cash settlements/adjustments (3) (212) (215)Currency 27 — 27
Liability Balance, December 31, 2017 $ 464 $ — $ 464Charges 253 63 316Cash spent (310) — (310)Non-cash settlements/adjustments (4) (63) (67)Currency (30) — (30)
Liability Balance, December 31, 2018 $ 373 $ — $ 373
We recorded restructuring charges of $316 million in 2018, $535 million in 2017 and $714 million in 2016 within asset impairment and exit costs.We spent $310 million in 2018 and $347 million in 2017 in cash severance and related costs. We also recognized non-cash pension settlementlosses (See Note 10, Benefit Plans), non-cash asset write-downs (including accelerated depreciation and asset impairments) and other non-cashadjustments totaling $67 million in 2018 and $215 million in 2017. At December 31, 2018, $307 million of our net restructuring liability was recordedwithin other current liabilities and $66 million was recorded within other long-term liabilities.
Implementation Costs:Implementation costs are directly attributable to restructuring activities; however, they do not qualify for special accounting treatment as exit ordisposal activities. We believe the disclosure of implementation costs provides readers of our financial statements with more information on thetotal costs of our Simplify to Grow Program. Implementation costs primarily relate to reorganizing our operations and facilities in connection withour supply chain reinvention program and other identified productivity and cost saving initiatives. The costs include incremental expenses relatedto the closure of facilities, costs to terminate certain contracts and the simplification of our information systems. Within our continuing results ofoperations, we recorded implementation costs of $315 million in 2018, $257 million in 2017 and $372 million in 2016. We recorded these costswithin cost of sales and general corporate expense within selling, general and administrative expenses.
87
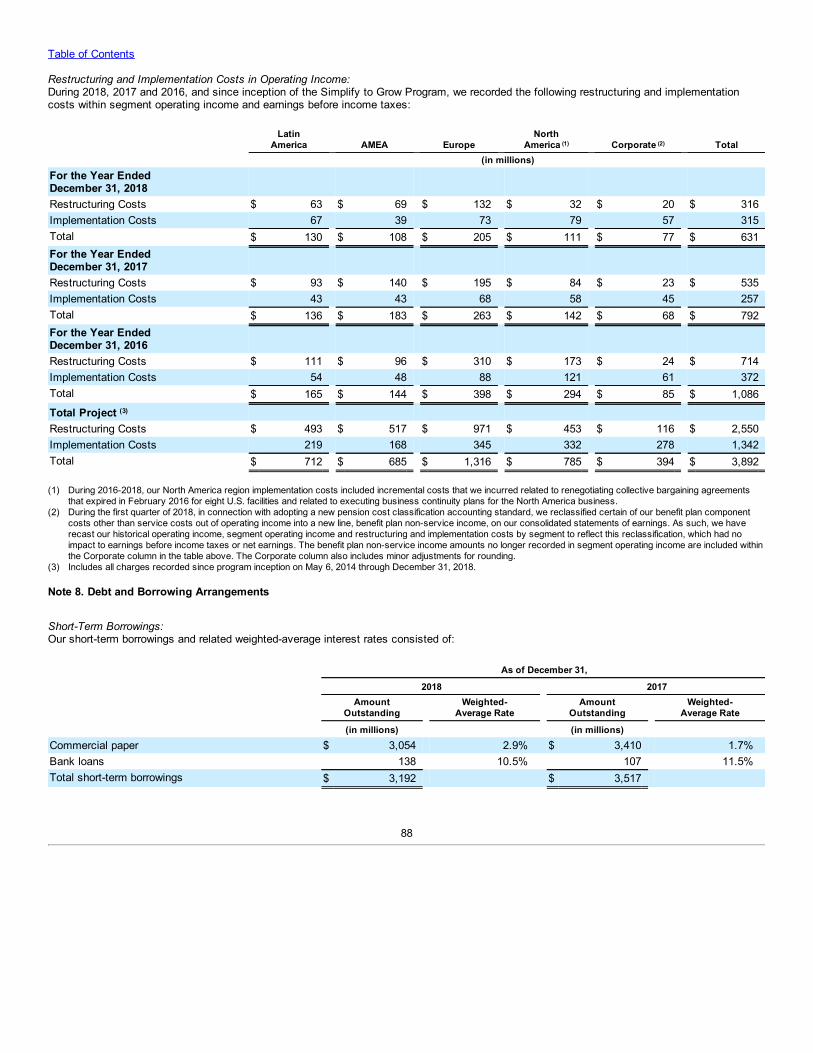
Table of Contents
Restructuring and Implementation Costs in Operating Income:During 2018, 2017 and 2016, and since inception of the Simplify to Grow Program, we recorded the following restructuring and implementationcosts within segment operating income and earnings before income taxes:
Latin
America AMEA Europe North
America (1) Corporate (2) Total (in millions)For the Year EndedDecember 31, 2018 Restructuring Costs $ 63 $ 69 $ 132 $ 32 $ 20 $ 316Implementation Costs 67 39 73 79 57 315Total $ 130 $ 108 $ 205 $ 111 $ 77 $ 631For the Year EndedDecember 31, 2017 Restructuring Costs $ 93 $ 140 $ 195 $ 84 $ 23 $ 535Implementation Costs 43 43 68 58 45 257Total $ 136 $ 183 $ 263 $ 142 $ 68 $ 792For the Year EndedDecember 31, 2016 Restructuring Costs $ 111 $ 96 $ 310 $ 173 $ 24 $ 714Implementation Costs 54 48 88 121 61 372Total $ 165 $ 144 $ 398 $ 294 $ 85 $ 1,086
Total Project (3) Restructuring Costs $ 493 $ 517 $ 971 $ 453 $ 116 $ 2,550Implementation Costs 219 168 345 332 278 1,342Total $ 712 $ 685 $ 1,316 $ 785 $ 394 $ 3,892 (1) During 2016-2018, our North America region implementation costs included incremental costs that we incurred related to renegotiating collective bargaining agreements
that expired in February 2016 for eight U.S. facilities and related to executing business continuity plans for the North America business.(2) During the first quarter of 2018, in connection with adopting a new pension cost classification accounting standard, we reclassified certain of our benefit plan component
costs other than service costs out of operating income into a new line, benefit plan non-service income, on our consolidated statements of earnings. As such, we haverecast our historical operating income, segment operating income and restructuring and implementation costs by segment to reflect this reclassification, which had noimpact to earnings before income taxes or net earnings. The benefit plan non-service income amounts no longer recorded in segment operating income are included withinthe Corporate column in the table above. The Corporate column also includes minor adjustments for rounding.
(3) Includes all charges recorded since program inception on May 6, 2014 through December 31, 2018.
Note 8. Debt and Borrowing Arrangements
Short-Term Borrowings:Our short-term borrowings and related weighted-average interest rates consisted of:
As of December 31,
2018 2017
Amount
Outstanding Weighted-
Average Rate Amount
Outstanding Weighted-
Average Rate
(in millions) (in millions) Commercial paper $ 3,054 2.9% $ 3,410 1.7%Bank loans 138 10.5% 107 11.5%Total short-term borrowings $ 3,192 $ 3,517
88
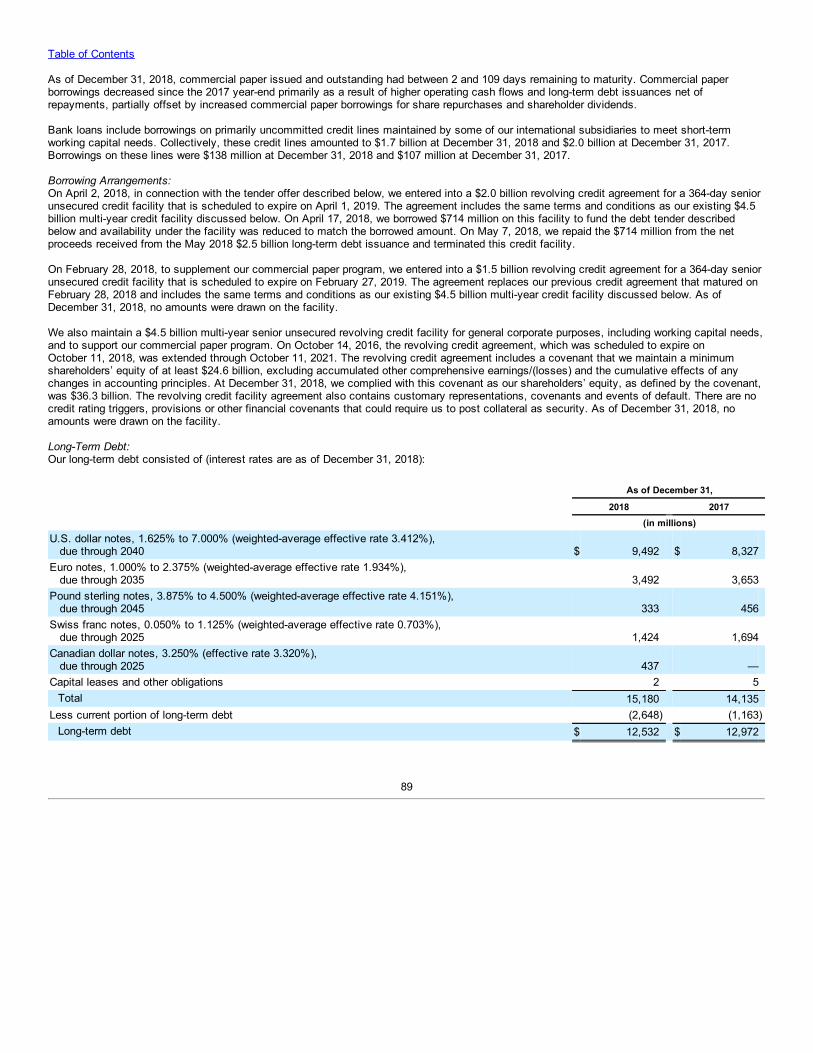
Table of Contents
As of December 31, 2018, commercial paper issued and outstanding had between 2 and 109 days remaining to maturity. Commercial paperborrowings decreased since the 2017 year-end primarily as a result of higher operating cash flows and long-term debt issuances net ofrepayments, partially offset by increased commercial paper borrowings for share repurchases and shareholder dividends.
Bank loans include borrowings on primarily uncommitted credit lines maintained by some of our international subsidiaries to meet short-termworking capital needs. Collectively, these credit lines amounted to $1.7 billion at December 31, 2018 and $2.0 billion at December 31, 2017.Borrowings on these lines were $138 million at December 31, 2018 and $107 million at December 31, 2017.
Borrowing Arrangements:On April 2, 2018, in connection with the tender offer described below, we entered into a $2.0 billion revolving credit agreement for a 364-day seniorunsecured credit facility that is scheduled to expire on April 1, 2019. The agreement includes the same terms and conditions as our existing $4.5billion multi-year credit facility discussed below. On April 17, 2018, we borrowed $714 million on this facility to fund the debt tender describedbelow and availability under the facility was reduced to match the borrowed amount. On May 7, 2018, we repaid the $714 million from the netproceeds received from the May 2018 $2.5 billion long-term debt issuance and terminated this credit facility.
On February 28, 2018, to supplement our commercial paper program, we entered into a $1.5 billion revolving credit agreement for a 364-day seniorunsecured credit facility that is scheduled to expire on February 27, 2019. The agreement replaces our previous credit agreement that matured onFebruary 28, 2018 and includes the same terms and conditions as our existing $4.5 billion multi-year credit facility discussed below. As ofDecember 31, 2018, no amounts were drawn on the facility.
We also maintain a $4.5 billion multi-year senior unsecured revolving credit facility for general corporate purposes, including working capital needs,and to support our commercial paper program. On October 14, 2016, the revolving credit agreement, which was scheduled to expire onOctober 11, 2018, was extended through October 11, 2021. The revolving credit agreement includes a covenant that we maintain a minimumshareholders’ equity of at least $24.6 billion, excluding accumulated other comprehensive earnings/(losses) and the cumulative effects of anychanges in accounting principles. At December 31, 2018, we complied with this covenant as our shareholders’ equity, as defined by the covenant,was $36.3 billion. The revolving credit facility agreement also contains customary representations, covenants and events of default. There are nocredit rating triggers, provisions or other financial covenants that could require us to post collateral as security. As of December 31, 2018, noamounts were drawn on the facility.
Long-Term Debt:Our long-term debt consisted of (interest rates are as of December 31, 2018):
As of December 31,
2018 2017 (in millions)U.S. dollar notes, 1.625% to 7.000% (weighted-average effective rate 3.412%), due through 2040 $ 9,492 $ 8,327Euro notes, 1.000% to 2.375% (weighted-average effective rate 1.934%), due through 2035 3,492 3,653Pound sterling notes, 3.875% to 4.500% (weighted-average effective rate 4.151%), due through 2045 333 456Swiss franc notes, 0.050% to 1.125% (weighted-average effective rate 0.703%), due through 2025 1,424 1,694Canadian dollar notes, 3.250% (effective rate 3.320%), due through 2025 437 —Capital leases and other obligations 2 5
Total 15,180 14,135Less current portion of long-term debt (2,648) (1,163)
Long-term debt $ 12,532 $ 12,972
89
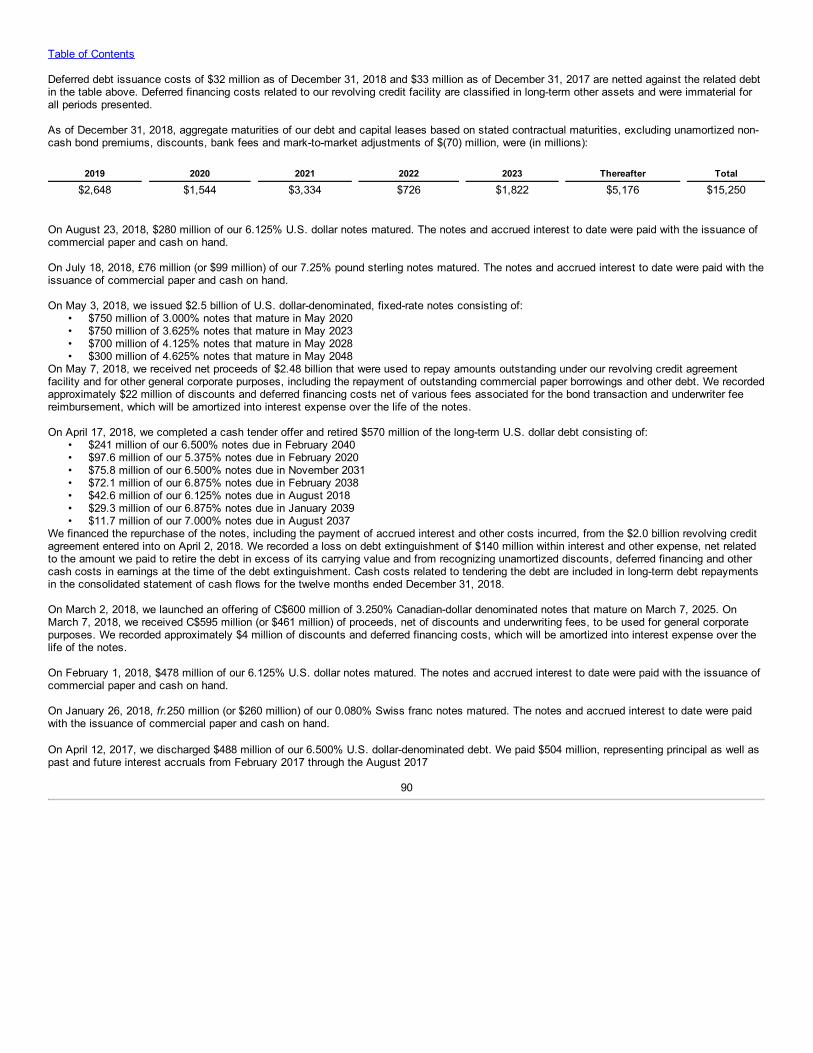
Table of Contents
Deferred debt issuance costs of $32 million as of December 31, 2018 and $33 million as of December 31, 2017 are netted against the related debtin the table above. Deferred financing costs related to our revolving credit facility are classified in long-term other assets and were immaterial forall periods presented.
As of December 31, 2018, aggregate maturities of our debt and capital leases based on stated contractual maturities, excluding unamortized non-cash bond premiums, discounts, bank fees and mark-to-market adjustments of $(70) million, were (in millions):
2019 2020 2021 2022 2023 Thereafter Total
$2,648 $1,544 $3,334 $726 $1,822 $5,176 $15,250
On August 23, 2018, $280 million of our 6.125% U.S. dollar notes matured. The notes and accrued interest to date were paid with the issuance ofcommercial paper and cash on hand.
On July 18, 2018, £76 million (or $99 million) of our 7.25% pound sterling notes matured. The notes and accrued interest to date were paid with theissuance of commercial paper and cash on hand.
On May 3, 2018, we issued $2.5 billion of U.S. dollar-denominated, fixed-rate notes consisting of:• $750 million of 3.000% notes that mature in May 2020• $750 million of 3.625% notes that mature in May 2023• $700 million of 4.125% notes that mature in May 2028• $300 million of 4.625% notes that mature in May 2048
On May 7, 2018, we received net proceeds of $2.48 billion that were used to repay amounts outstanding under our revolving credit agreementfacility and for other general corporate purposes, including the repayment of outstanding commercial paper borrowings and other debt. We recordedapproximately $22 million of discounts and deferred financing costs net of various fees associated for the bond transaction and underwriter feereimbursement, which will be amortized into interest expense over the life of the notes.
On April 17, 2018, we completed a cash tender offer and retired $570 million of the long-term U.S. dollar debt consisting of:• $241 million of our 6.500% notes due in February 2040• $97.6 million of our 5.375% notes due in February 2020• $75.8 million of our 6.500% notes due in November 2031• $72.1 million of our 6.875% notes due in February 2038• $42.6 million of our 6.125% notes due in August 2018• $29.3 million of our 6.875% notes due in January 2039• $11.7 million of our 7.000% notes due in August 2037
We financed the repurchase of the notes, including the payment of accrued interest and other costs incurred, from the $2.0 billion revolving creditagreement entered into on April 2, 2018. We recorded a loss on debt extinguishment of $140 million within interest and other expense, net relatedto the amount we paid to retire the debt in excess of its carrying value and from recognizing unamortized discounts, deferred financing and othercash costs in earnings at the time of the debt extinguishment. Cash costs related to tendering the debt are included in long-term debt repaymentsin the consolidated statement of cash flows for the twelve months ended December 31, 2018.
On March 2, 2018, we launched an offering of C$600 million of 3.250% Canadian-dollar denominated notes that mature on March 7, 2025. OnMarch 7, 2018, we received C$595 million (or $461 million) of proceeds, net of discounts and underwriting fees, to be used for general corporatepurposes. We recorded approximately $4 million of discounts and deferred financing costs, which will be amortized into interest expense over thelife of the notes.
On February 1, 2018, $478 million of our 6.125% U.S. dollar notes matured. The notes and accrued interest to date were paid with the issuance ofcommercial paper and cash on hand.
On January 26, 2018, fr.250 million (or $260 million) of our 0.080% Swiss franc notes matured. The notes and accrued interest to date were paidwith the issuance of commercial paper and cash on hand.
On April 12, 2017, we discharged $488 million of our 6.500% U.S. dollar-denominated debt. We paid $504 million, representing principal as well aspast and future interest accruals from February 2017 through the August 2017
90
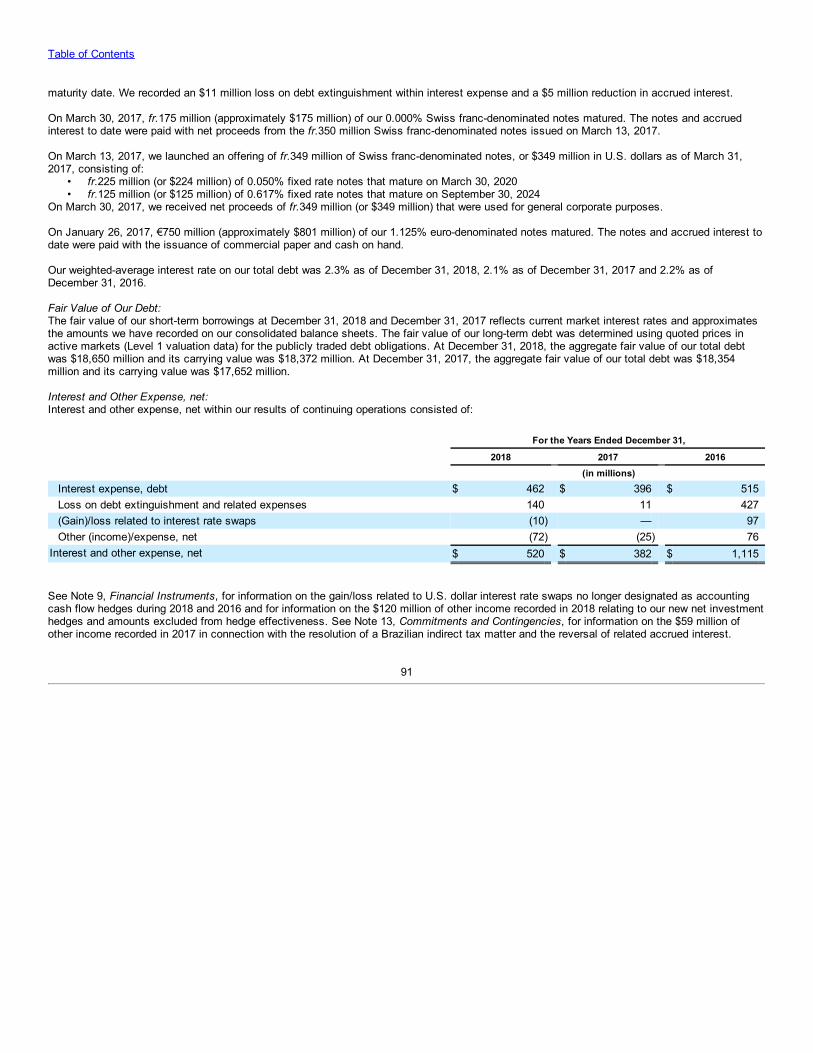
Table of Contents
maturity date. We recorded an $11 million loss on debt extinguishment within interest expense and a $5 million reduction in accrued interest.
On March 30, 2017, fr.175 million (approximately $175 million) of our 0.000% Swiss franc-denominated notes matured. The notes and accruedinterest to date were paid with net proceeds from the fr.350 million Swiss franc-denominated notes issued on March 13, 2017.
On March 13, 2017, we launched an offering of fr.349 million of Swiss franc-denominated notes, or $349 million in U.S. dollars as of March 31,2017, consisting of:
• fr.225 million (or $224 million) of 0.050% fixed rate notes that mature on March 30, 2020• fr.125 million (or $125 million) of 0.617% fixed rate notes that mature on September 30, 2024
On March 30, 2017, we received net proceeds of fr.349 million (or $349 million) that were used for general corporate purposes.
On January 26, 2017, €750 million (approximately $801 million) of our 1.125% euro-denominated notes matured. The notes and accrued interest todate were paid with the issuance of commercial paper and cash on hand.
Our weighted-average interest rate on our total debt was 2.3% as of December 31, 2018, 2.1% as of December 31, 2017 and 2.2% as ofDecember 31, 2016.
Fair Value of Our Debt:The fair value of our short-term borrowings at December 31, 2018 and December 31, 2017 reflects current market interest rates and approximatesthe amounts we have recorded on our consolidated balance sheets. The fair value of our long-term debt was determined using quoted prices inactive markets (Level 1 valuation data) for the publicly traded debt obligations. At December 31, 2018, the aggregate fair value of our total debtwas $18,650 million and its carrying value was $18,372 million. At December 31, 2017, the aggregate fair value of our total debt was $18,354million and its carrying value was $17,652 million.
Interest and Other Expense, net:Interest and other expense, net within our results of continuing operations consisted of:
For the Years Ended December 31,
2018 2017 2016 (in millions)
Interest expense, debt $ 462 $ 396 $ 515Loss on debt extinguishment and related expenses 140 11 427(Gain)/loss related to interest rate swaps (10) — 97Other (income)/expense, net (72) (25) 76
Interest and other expense, net $ 520 $ 382 $ 1,115
See Note 9, Financial Instruments, for information on the gain/loss related to U.S. dollar interest rate swaps no longer designated as accountingcash flow hedges during 2018 and 2016 and for information on the $120 million of other income recorded in 2018 relating to our new net investmenthedges and amounts excluded from hedge effectiveness. See Note 13, Commitments and Contingencies, for information on the $59 million ofother income recorded in 2017 in connection with the resolution of a Brazilian indirect tax matter and the reversal of related accrued interest.
91
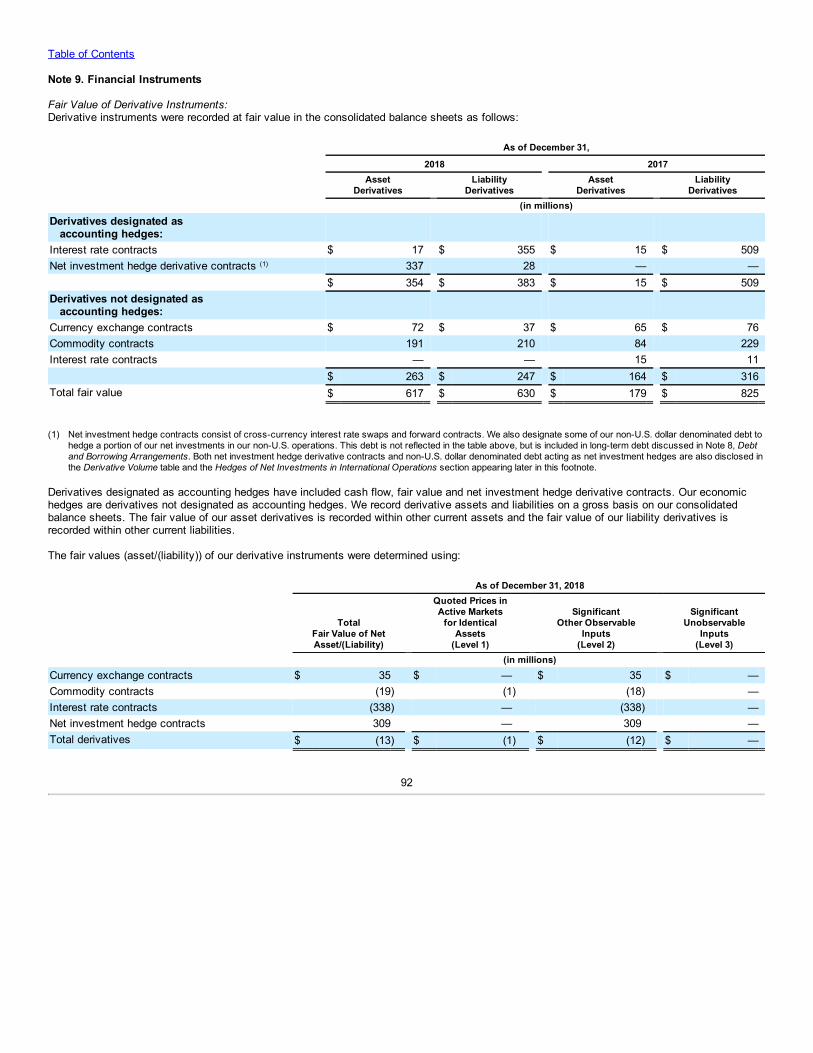
Table of Contents
Note 9. Financial Instruments
Fair Value of Derivative Instruments:Derivative instruments were recorded at fair value in the consolidated balance sheets as follows:
As of December 31,
2018 2017
Asset
Derivatives Liability
Derivatives Asset
Derivatives Liability
Derivatives (in millions)Derivatives designated as
accounting hedges: Interest rate contracts $ 17 $ 355 $ 15 $ 509Net investment hedge derivative contracts (1) 337 28 — — $ 354 $ 383 $ 15 $ 509Derivatives not designated as accounting hedges: Currency exchange contracts $ 72 $ 37 $ 65 $ 76Commodity contracts 191 210 84 229Interest rate contracts — — 15 11 $ 263 $ 247 $ 164 $ 316Total fair value $ 617 $ 630 $ 179 $ 825
(1) Net investment hedge contracts consist of cross-currency interest rate swaps and forward contracts. We also designate some of our non-U.S. dollar denominated debt tohedge a portion of our net investments in our non-U.S. operations. This debt is not reflected in the table above, but is included in long-term debt discussed in Note 8, Debtand Borrowing Arrangements. Both net investment hedge derivative contracts and non-U.S. dollar denominated debt acting as net investment hedges are also disclosed inthe Derivative Volume table and the Hedges of Net Investments in International Operations section appearing later in this footnote.
Derivatives designated as accounting hedges have included cash flow, fair value and net investment hedge derivative contracts. Our economichedges are derivatives not designated as accounting hedges. We record derivative assets and liabilities on a gross basis on our consolidatedbalance sheets. The fair value of our asset derivatives is recorded within other current assets and the fair value of our liability derivatives isrecorded within other current liabilities.
The fair values (asset/(liability)) of our derivative instruments were determined using:
As of December 31, 2018
TotalFair Value of NetAsset/(Liability)
Quoted Prices inActive Markets
for IdenticalAssets
(Level 1)
SignificantOther Observable
Inputs(Level 2)
SignificantUnobservable
Inputs(Level 3)
(in millions)Currency exchange contracts $ 35 $ — $ 35 $ —Commodity contracts (19) (1) (18) —Interest rate contracts (338) — (338) —Net investment hedge contracts 309 — 309 —Total derivatives $ (13) $ (1) $ (12) $ —
92
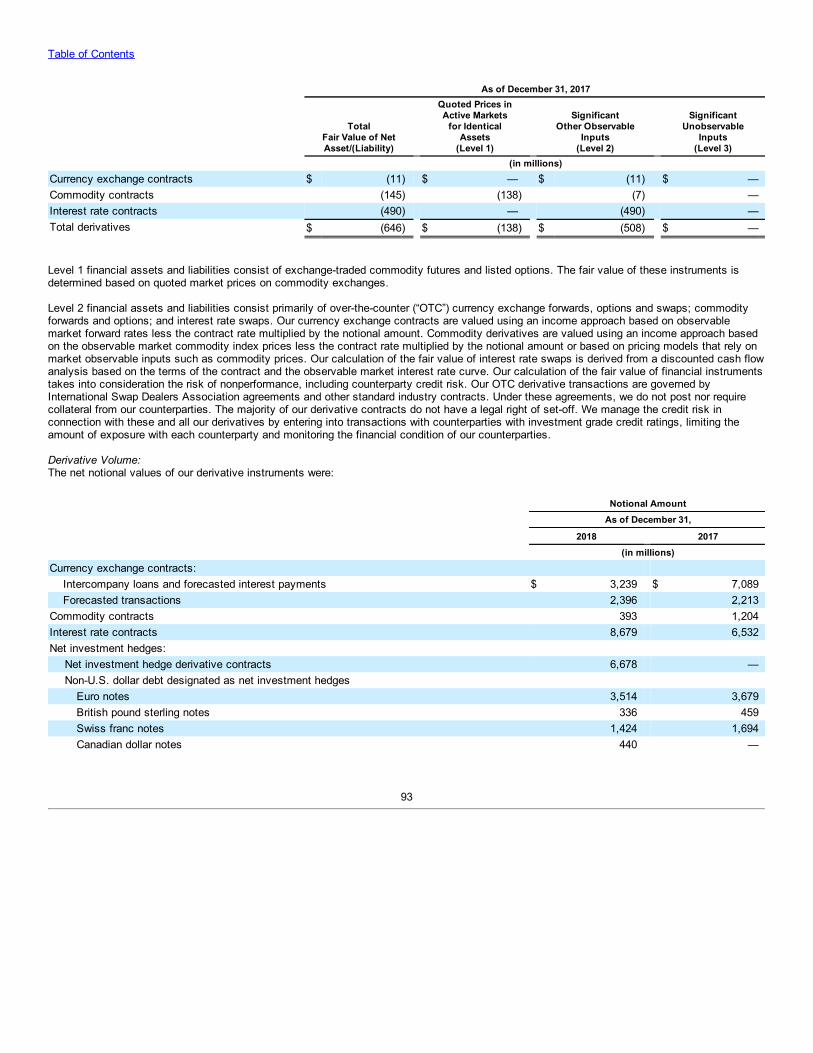
Table of Contents
As of December 31, 2017
TotalFair Value of NetAsset/(Liability)
Quoted Prices inActive Markets
for IdenticalAssets
(Level 1)
SignificantOther Observable
Inputs(Level 2)
SignificantUnobservable
Inputs(Level 3)
(in millions)Currency exchange contracts $ (11) $ — $ (11) $ —Commodity contracts (145) (138) (7) —Interest rate contracts (490) — (490) —Total derivatives $ (646) $ (138) $ (508) $ —
Level 1 financial assets and liabilities consist of exchange-traded commodity futures and listed options. The fair value of these instruments isdetermined based on quoted market prices on commodity exchanges.
Level 2 financial assets and liabilities consist primarily of over-the-counter (“OTC”) currency exchange forwards, options and swaps; commodityforwards and options; and interest rate swaps. Our currency exchange contracts are valued using an income approach based on observablemarket forward rates less the contract rate multiplied by the notional amount. Commodity derivatives are valued using an income approach basedon the observable market commodity index prices less the contract rate multiplied by the notional amount or based on pricing models that rely onmarket observable inputs such as commodity prices. Our calculation of the fair value of interest rate swaps is derived from a discounted cash flowanalysis based on the terms of the contract and the observable market interest rate curve. Our calculation of the fair value of financial instrumentstakes into consideration the risk of nonperformance, including counterparty credit risk. Our OTC derivative transactions are governed byInternational Swap Dealers Association agreements and other standard industry contracts. Under these agreements, we do not post nor requirecollateral from our counterparties. The majority of our derivative contracts do not have a legal right of set-off. We manage the credit risk inconnection with these and all our derivatives by entering into transactions with counterparties with investment grade credit ratings, limiting theamount of exposure with each counterparty and monitoring the financial condition of our counterparties.
Derivative Volume:The net notional values of our derivative instruments were:
Notional Amount As of December 31,
2018 2017 (in millions)Currency exchange contracts:
Intercompany loans and forecasted interest payments $ 3,239 $ 7,089Forecasted transactions 2,396 2,213
Commodity contracts 393 1,204Interest rate contracts 8,679 6,532Net investment hedges:
Net investment hedge derivative contracts 6,678 —Non-U.S. dollar debt designated as net investment hedges
Euro notes 3,514 3,679British pound sterling notes 336 459Swiss franc notes 1,424 1,694Canadian dollar notes 440 —
93
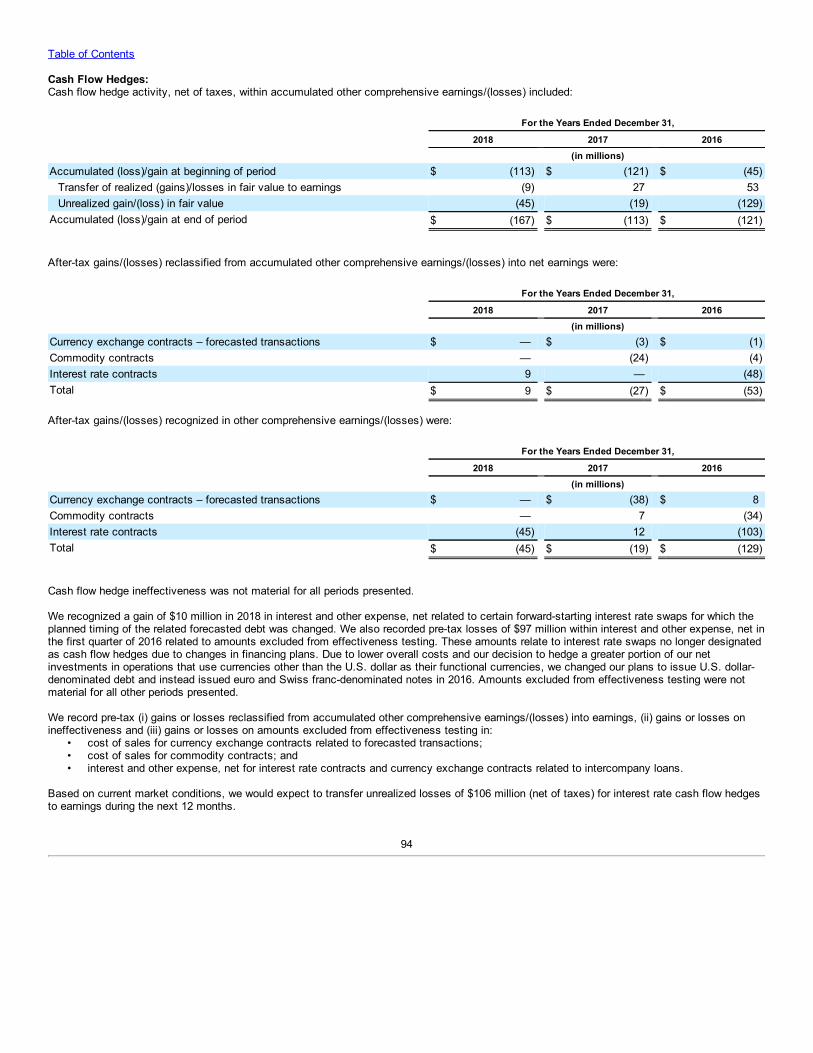
Table of Contents
Cash Flow Hedges:Cash flow hedge activity, net of taxes, within accumulated other comprehensive earnings/(losses) included:
For the Years Ended December 31,
2018 2017 2016 (in millions)Accumulated (loss)/gain at beginning of period $ (113) $ (121) $ (45)
Transfer of realized (gains)/losses in fair value to earnings (9) 27 53Unrealized gain/(loss) in fair value (45) (19) (129)
Accumulated (loss)/gain at end of period $ (167) $ (113) $ (121)
After-tax gains/(losses) reclassified from accumulated other comprehensive earnings/(losses) into net earnings were:
For the Years Ended December 31,
2018 2017 2016 (in millions)Currency exchange contracts – forecasted transactions $ — $ (3) $ (1)Commodity contracts — (24) (4)Interest rate contracts 9 — (48)Total $ 9 $ (27) $ (53)
After-tax gains/(losses) recognized in other comprehensive earnings/(losses) were:
For the Years Ended December 31,
2018 2017 2016 (in millions)Currency exchange contracts – forecasted transactions $ — $ (38) $ 8Commodity contracts — 7 (34)Interest rate contracts (45) 12 (103)Total $ (45) $ (19) $ (129)
Cash flow hedge ineffectiveness was not material for all periods presented.
We recognized a gain of $10 million in 2018 in interest and other expense, net related to certain forward-starting interest rate swaps for which theplanned timing of the related forecasted debt was changed. We also recorded pre-tax losses of $97 million within interest and other expense, net inthe first quarter of 2016 related to amounts excluded from effectiveness testing. These amounts relate to interest rate swaps no longer designatedas cash flow hedges due to changes in financing plans. Due to lower overall costs and our decision to hedge a greater portion of our netinvestments in operations that use currencies other than the U.S. dollar as their functional currencies, we changed our plans to issue U.S. dollar-denominated debt and instead issued euro and Swiss franc-denominated notes in 2016. Amounts excluded from effectiveness testing were notmaterial for all other periods presented.
We record pre-tax (i) gains or losses reclassified from accumulated other comprehensive earnings/(losses) into earnings, (ii) gains or losses onineffectiveness and (iii) gains or losses on amounts excluded from effectiveness testing in:
• cost of sales for currency exchange contracts related to forecasted transactions;• cost of sales for commodity contracts; and• interest and other expense, net for interest rate contracts and currency exchange contracts related to intercompany loans.
Based on current market conditions, we would expect to transfer unrealized losses of $106 million (net of taxes) for interest rate cash flow hedgesto earnings during the next 12 months.
94
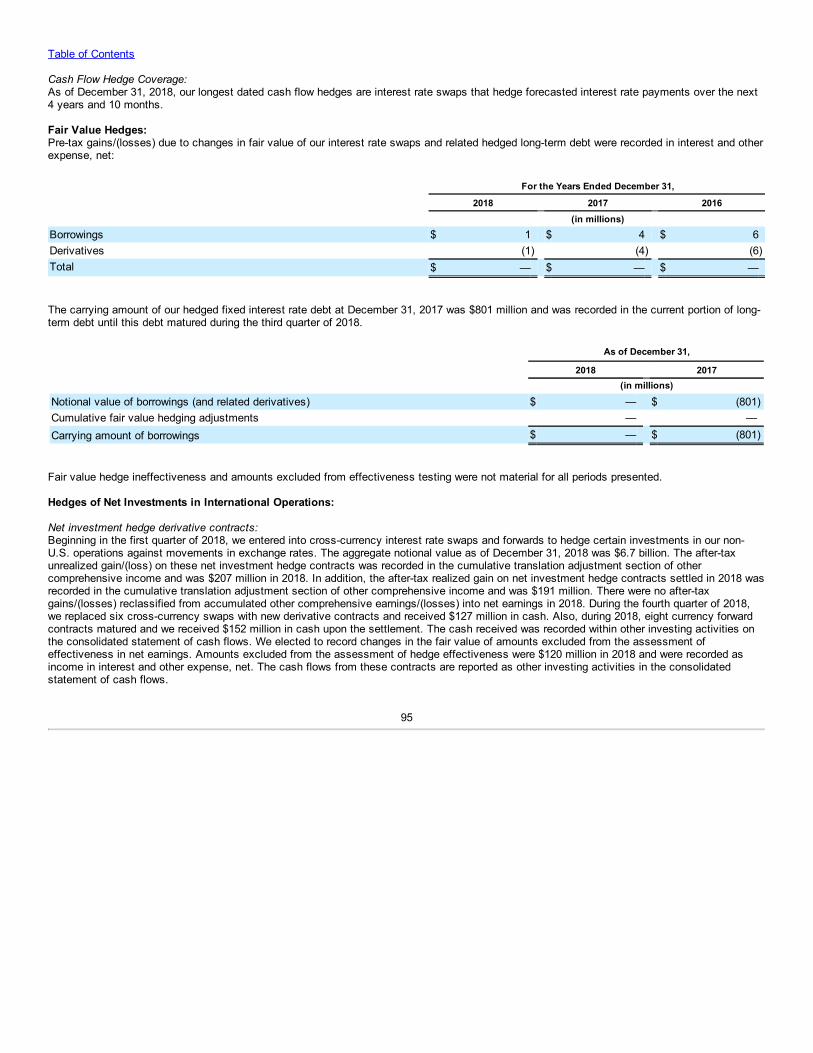
Table of Contents
Cash Flow Hedge Coverage:As of December 31, 2018, our longest dated cash flow hedges are interest rate swaps that hedge forecasted interest rate payments over the next4 years and 10 months.
Fair Value Hedges:Pre-tax gains/(losses) due to changes in fair value of our interest rate swaps and related hedged long-term debt were recorded in interest and otherexpense, net:
For the Years Ended December 31,
2018 2017 2016 (in millions)Borrowings $ 1 $ 4 $ 6Derivatives (1) (4) (6)Total $ — $ — $ —
The carrying amount of our hedged fixed interest rate debt at December 31, 2017 was $801 million and was recorded in the current portion of long-term debt until this debt matured during the third quarter of 2018.
As of December 31,
2018 2017 (in millions)
Notional value of borrowings (and related derivatives) $ — $ (801)Cumulative fair value hedging adjustments — —Carrying amount of borrowings $ — $ (801)
Fair value hedge ineffectiveness and amounts excluded from effectiveness testing were not material for all periods presented.
Hedges of Net Investments in International Operations:
Net investment hedge derivative contracts:Beginning in the first quarter of 2018, we entered into cross-currency interest rate swaps and forwards to hedge certain investments in our non-U.S. operations against movements in exchange rates. The aggregate notional value as of December 31, 2018 was $6.7 billion. The after-taxunrealized gain/(loss) on these net investment hedge contracts was recorded in the cumulative translation adjustment section of othercomprehensive income and was $207 million in 2018. In addition, the after-tax realized gain on net investment hedge contracts settled in 2018 wasrecorded in the cumulative translation adjustment section of other comprehensive income and was $191 million. There were no after-taxgains/(losses) reclassified from accumulated other comprehensive earnings/(losses) into net earnings in 2018. During the fourth quarter of 2018,we replaced six cross-currency swaps with new derivative contracts and received $127 million in cash. Also, during 2018, eight currency forwardcontracts matured and we received $152 million in cash upon the settlement. The cash received was recorded within other investing activities onthe consolidated statement of cash flows. We elected to record changes in the fair value of amounts excluded from the assessment ofeffectiveness in net earnings. Amounts excluded from the assessment of hedge effectiveness were $120 million in 2018 and were recorded asincome in interest and other expense, net. The cash flows from these contracts are reported as other investing activities in the consolidatedstatement of cash flows.
95
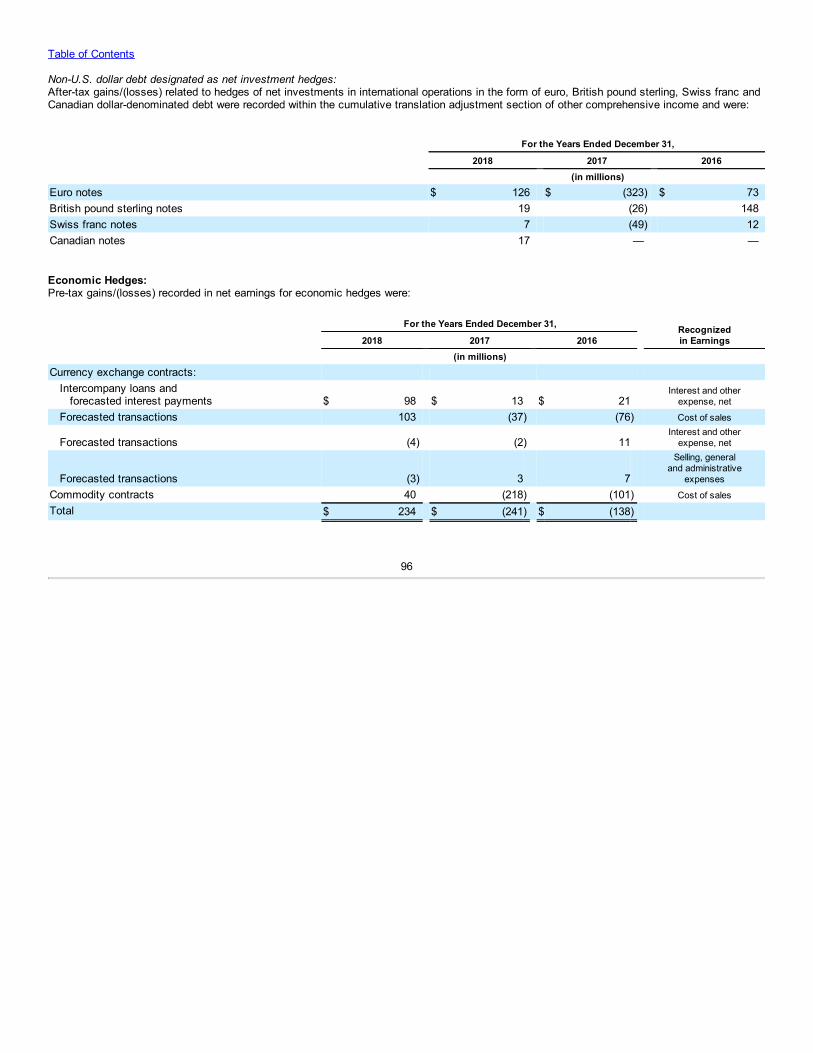
Table of Contents
Non-U.S. dollar debt designated as net investment hedges:After-tax gains/(losses) related to hedges of net investments in international operations in the form of euro, British pound sterling, Swiss franc andCanadian dollar-denominated debt were recorded within the cumulative translation adjustment section of other comprehensive income and were:
For the Years Ended December 31,
2018 2017 2016 (in millions)Euro notes $ 126 $ (323) $ 73British pound sterling notes 19 (26) 148Swiss franc notes 7 (49) 12Canadian notes 17 — —
Economic Hedges:Pre-tax gains/(losses) recorded in net earnings for economic hedges were:
For the Years Ended December 31, Recognizedin Earnings 2018 2017 2016
(in millions)
Currency exchange contracts: Intercompany loans and forecasted interest payments $ 98 $ 13 $ 21
Interest and otherexpense, net
Forecasted transactions 103 (37) (76) Cost of sales
Forecasted transactions (4) (2) 11 Interest and other
expense, net
Forecasted transactions (3) 3 7
Selling, generaland administrative
expenses
Commodity contracts 40 (218) (101) Cost of sales
Total $ 234 $ (241) $ (138)
96
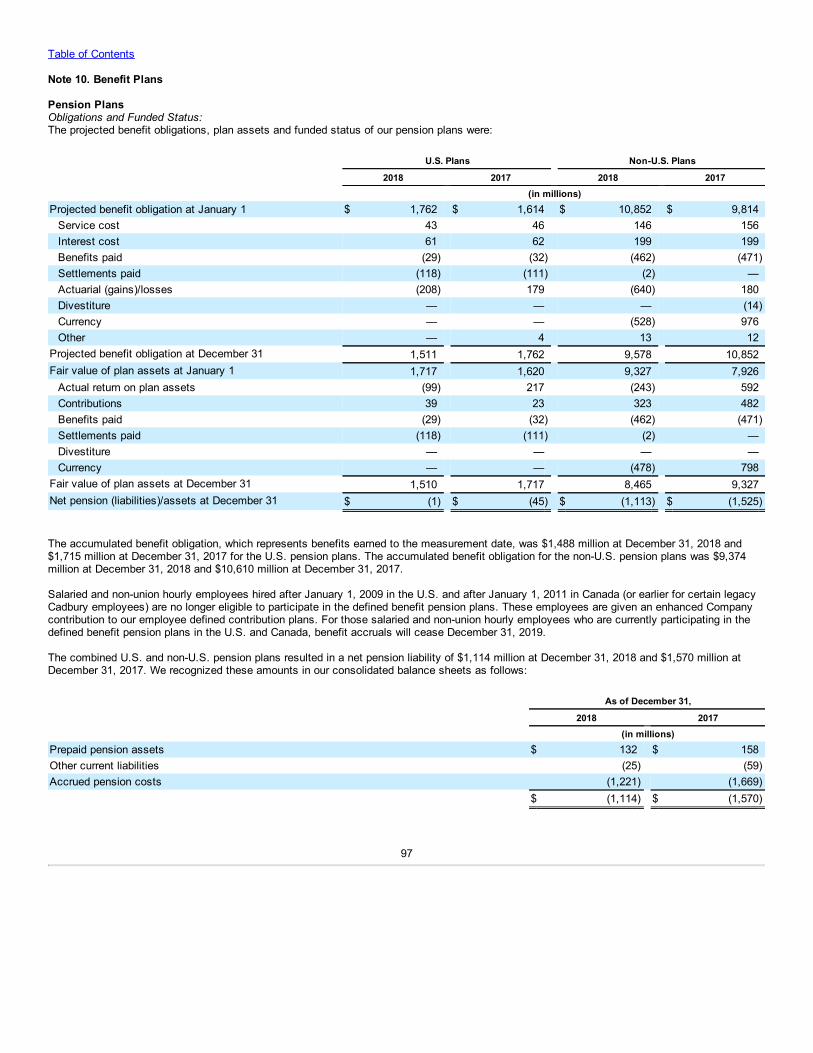
Table of Contents
Note 10. Benefit Plans
Pension PlansObligations and Funded Status:The projected benefit obligations, plan assets and funded status of our pension plans were:
U.S. Plans Non-U.S. Plans
2018 2017 2018 2017 (in millions)Projected benefit obligation at January 1 $ 1,762 $ 1,614 $ 10,852 $ 9,814
Service cost 43 46 146 156Interest cost 61 62 199 199Benefits paid (29) (32) (462) (471)Settlements paid (118) (111) (2) —Actuarial (gains)/losses (208) 179 (640) 180Divestiture — — — (14)Currency — — (528) 976Other — 4 13 12
Projected benefit obligation at December 31 1,511 1,762 9,578 10,852Fair value of plan assets at January 1 1,717 1,620 9,327 7,926
Actual return on plan assets (99) 217 (243) 592Contributions 39 23 323 482Benefits paid (29) (32) (462) (471)Settlements paid (118) (111) (2) —Divestiture — — — —Currency — — (478) 798
Fair value of plan assets at December 31 1,510 1,717 8,465 9,327Net pension (liabilities)/assets at December 31 $ (1) $ (45) $ (1,113) $ (1,525)
The accumulated benefit obligation, which represents benefits earned to the measurement date, was $1,488 million at December 31, 2018 and$1,715 million at December 31, 2017 for the U.S. pension plans. The accumulated benefit obligation for the non-U.S. pension plans was $9,374million at December 31, 2018 and $10,610 million at December 31, 2017.
Salaried and non-union hourly employees hired after January 1, 2009 in the U.S. and after January 1, 2011 in Canada (or earlier for certain legacyCadbury employees) are no longer eligible to participate in the defined benefit pension plans. These employees are given an enhanced Companycontribution to our employee defined contribution plans. For those salaried and non-union hourly employees who are currently participating in thedefined benefit pension plans in the U.S. and Canada, benefit accruals will cease December 31, 2019.
The combined U.S. and non-U.S. pension plans resulted in a net pension liability of $1,114 million at December 31, 2018 and $1,570 million atDecember 31, 2017. We recognized these amounts in our consolidated balance sheets as follows:
As of December 31,
2018 2017 (in millions)Prepaid pension assets $ 132 $ 158Other current liabilities (25) (59)Accrued pension costs (1,221) (1,669) $ (1,114) $ (1,570)
97
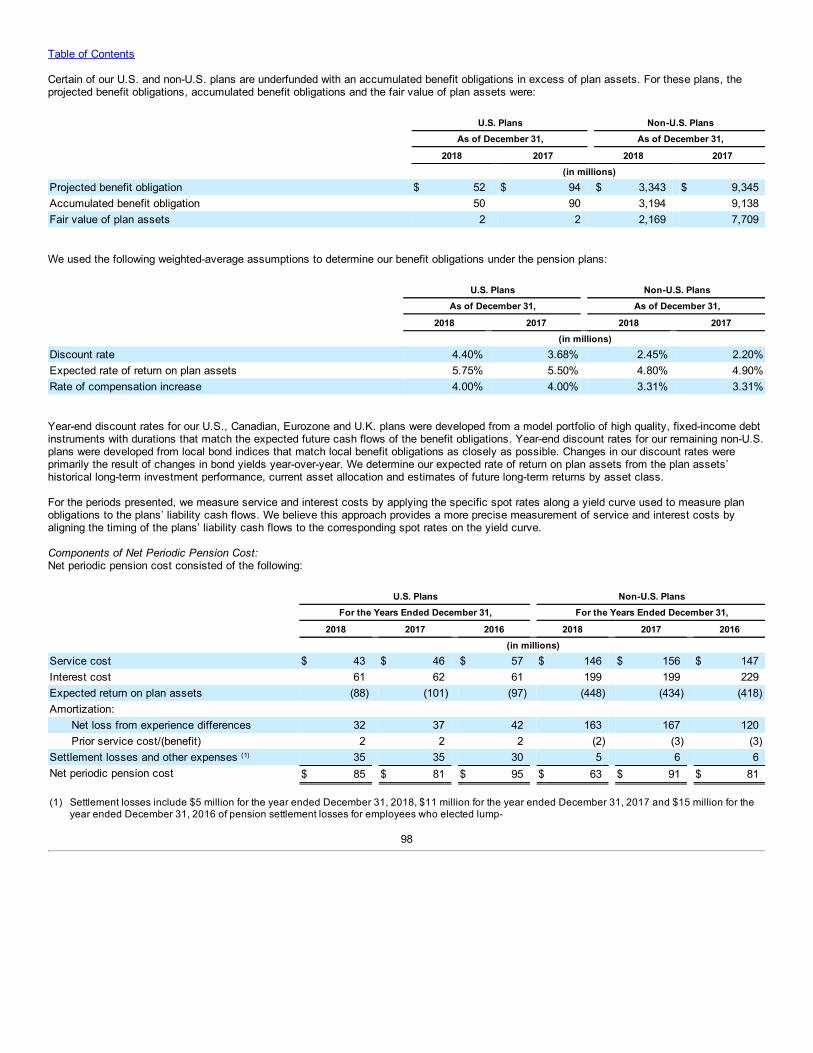
Table of Contents
Certain of our U.S. and non-U.S. plans are underfunded with an accumulated benefit obligations in excess of plan assets. For these plans, theprojected benefit obligations, accumulated benefit obligations and the fair value of plan assets were:
U.S. Plans Non-U.S. Plans As of December 31, As of December 31,
2018 2017 2018 2017 (in millions)Projected benefit obligation $ 52 $ 94 $ 3,343 $ 9,345Accumulated benefit obligation 50 90 3,194 9,138Fair value of plan assets 2 2 2,169 7,709
We used the following weighted-average assumptions to determine our benefit obligations under the pension plans:
U.S. Plans Non-U.S. Plans As of December 31, As of December 31,
2018 2017 2018 2017 (in millions)Discount rate 4.40% 3.68% 2.45% 2.20%Expected rate of return on plan assets 5.75% 5.50% 4.80% 4.90%Rate of compensation increase 4.00% 4.00% 3.31% 3.31%
Year-end discount rates for our U.S., Canadian, Eurozone and U.K. plans were developed from a model portfolio of high quality, fixed-income debtinstruments with durations that match the expected future cash flows of the benefit obligations. Year-end discount rates for our remaining non-U.S.plans were developed from local bond indices that match local benefit obligations as closely as possible. Changes in our discount rates wereprimarily the result of changes in bond yields year-over-year. We determine our expected rate of return on plan assets from the plan assets’historical long-term investment performance, current asset allocation and estimates of future long-term returns by asset class.
For the periods presented, we measure service and interest costs by applying the specific spot rates along a yield curve used to measure planobligations to the plans’ liability cash flows. We believe this approach provides a more precise measurement of service and interest costs byaligning the timing of the plans’ liability cash flows to the corresponding spot rates on the yield curve.
Components of Net Periodic Pension Cost:Net periodic pension cost consisted of the following:
U.S. Plans Non-U.S. Plans For the Years Ended December 31, For the Years Ended December 31,
2018 2017 2016 2018 2017 2016 (in millions)Service cost $ 43 $ 46 $ 57 $ 146 $ 156 $ 147Interest cost 61 62 61 199 199 229Expected return on plan assets (88) (101) (97) (448) (434) (418)Amortization:
Net loss from experience differences 32 37 42 163 167 120Prior service cost/(benefit) 2 2 2 (2) (3) (3)
Settlement losses and other expenses (1) 35 35 30 5 6 6Net periodic pension cost $ 85 $ 81 $ 95 $ 63 $ 91 $ 81 (1) Settlement losses include $5 million for the year ended December 31, 2018, $11 million for the year ended December 31, 2017 and $15 million for the
year ended December 31, 2016 of pension settlement losses for employees who elected lump-
98
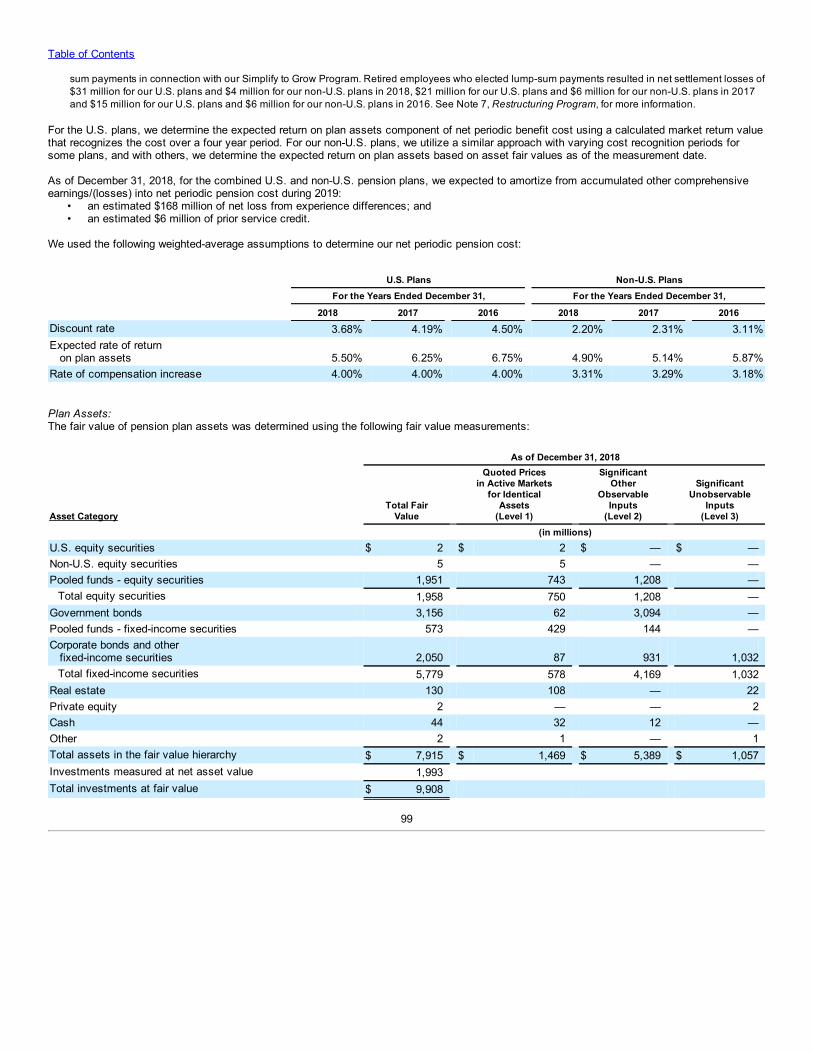
Table of Contents
sum payments in connection with our Simplify to Grow Program. Retired employees who elected lump-sum payments resulted in net settlement losses of$31 million for our U.S. plans and $4 million for our non-U.S. plans in 2018, $21 million for our U.S. plans and $6 million for our non-U.S. plans in 2017and $15 million for our U.S. plans and $6 million for our non-U.S. plans in 2016. See Note 7, Restructuring Program, for more information.
For the U.S. plans, we determine the expected return on plan assets component of net periodic benefit cost using a calculated market return valuethat recognizes the cost over a four year period. For our non-U.S. plans, we utilize a similar approach with varying cost recognition periods forsome plans, and with others, we determine the expected return on plan assets based on asset fair values as of the measurement date.
As of December 31, 2018, for the combined U.S. and non-U.S. pension plans, we expected to amortize from accumulated other comprehensiveearnings/(losses) into net periodic pension cost during 2019:
• an estimated $168 million of net loss from experience differences; and• an estimated $6 million of prior service credit.
We used the following weighted-average assumptions to determine our net periodic pension cost:
U.S. Plans Non-U.S. Plans For the Years Ended December 31, For the Years Ended December 31,
2018 2017 2016 2018 2017 2016Discount rate 3.68% 4.19% 4.50% 2.20% 2.31% 3.11%Expected rate of return
on plan assets 5.50% 6.25% 6.75% 4.90% 5.14% 5.87%Rate of compensation increase 4.00% 4.00% 4.00% 3.31% 3.29% 3.18%
Plan Assets:The fair value of pension plan assets was determined using the following fair value measurements:
As of December 31, 2018
Asset Category Total Fair
Value
Quoted Pricesin Active Markets
for IdenticalAssets
(Level 1)
SignificantOther
ObservableInputs
(Level 2)
SignificantUnobservable
Inputs(Level 3)
(in millions)U.S. equity securities $ 2 $ 2 $ — $ —Non-U.S. equity securities 5 5 — —Pooled funds - equity securities 1,951 743 1,208 —
Total equity securities 1,958 750 1,208 —Government bonds 3,156 62 3,094 —Pooled funds - fixed-income securities 573 429 144 —Corporate bonds and other fixed-income securities 2,050 87 931 1,032
Total fixed-income securities 5,779 578 4,169 1,032Real estate 130 108 — 22Private equity 2 — — 2Cash 44 32 12 —Other 2 1 — 1Total assets in the fair value hierarchy $ 7,915 $ 1,469 $ 5,389 $ 1,057Investments measured at net asset value 1,993 Total investments at fair value $ 9,908
99
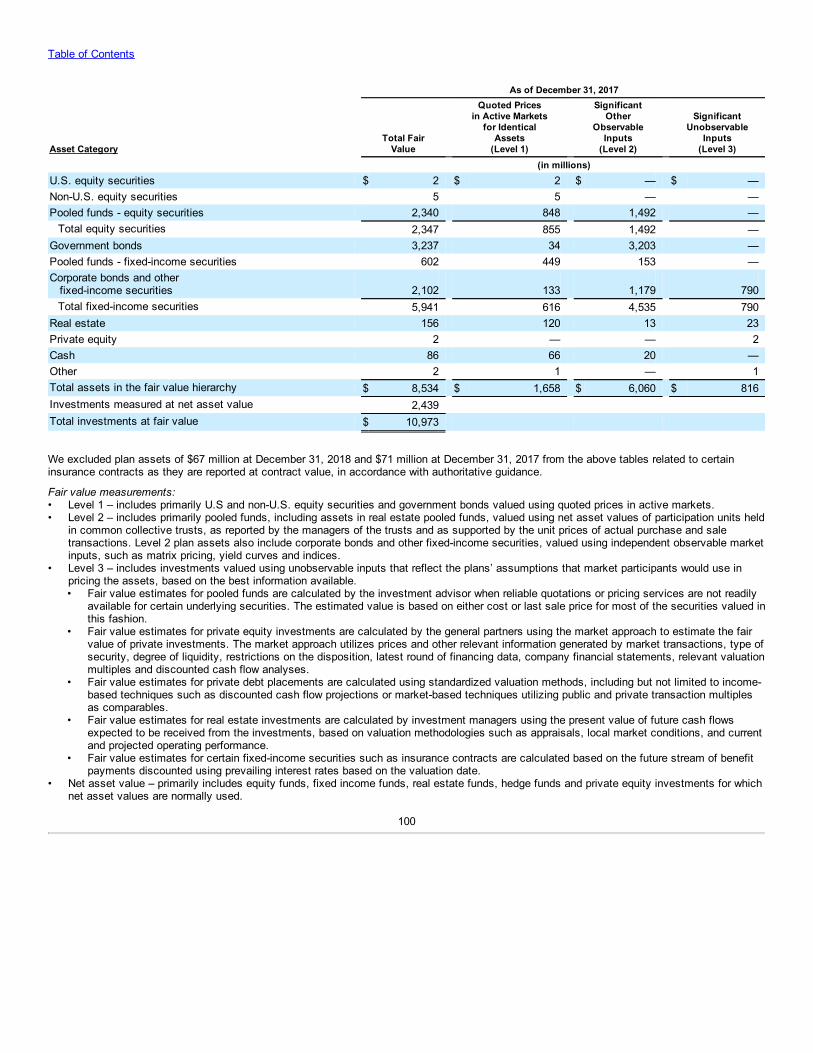
Table of Contents
As of December 31, 2017
Asset Category Total Fair
Value
Quoted Pricesin Active Markets
for IdenticalAssets
(Level 1)
SignificantOther
ObservableInputs
(Level 2)
SignificantUnobservable
Inputs(Level 3)
(in millions)U.S. equity securities $ 2 $ 2 $ — $ —Non-U.S. equity securities 5 5 — —Pooled funds - equity securities 2,340 848 1,492 —
Total equity securities 2,347 855 1,492 —Government bonds 3,237 34 3,203 —Pooled funds - fixed-income securities 602 449 153 —Corporate bonds and other fixed-income securities 2,102 133 1,179 790
Total fixed-income securities 5,941 616 4,535 790Real estate 156 120 13 23Private equity 2 — — 2Cash 86 66 20 —Other 2 1 — 1Total assets in the fair value hierarchy $ 8,534 $ 1,658 $ 6,060 $ 816Investments measured at net asset value 2,439 Total investments at fair value $ 10,973
We excluded plan assets of $67 million at December 31, 2018 and $71 million at December 31, 2017 from the above tables related to certaininsurance contracts as they are reported at contract value, in accordance with authoritative guidance.
Fair value measurements:• Level 1 – includes primarily U.S and non-U.S. equity securities and government bonds valued using quoted prices in active markets.• Level 2 – includes primarily pooled funds, including assets in real estate pooled funds, valued using net asset values of participation units held
in common collective trusts, as reported by the managers of the trusts and as supported by the unit prices of actual purchase and saletransactions. Level 2 plan assets also include corporate bonds and other fixed-income securities, valued using independent observable marketinputs, such as matrix pricing, yield curves and indices.
• Level 3 – includes investments valued using unobservable inputs that reflect the plans’ assumptions that market participants would use inpricing the assets, based on the best information available.• Fair value estimates for pooled funds are calculated by the investment advisor when reliable quotations or pricing services are not readily
available for certain underlying securities. The estimated value is based on either cost or last sale price for most of the securities valued inthis fashion.
• Fair value estimates for private equity investments are calculated by the general partners using the market approach to estimate the fairvalue of private investments. The market approach utilizes prices and other relevant information generated by market transactions, type ofsecurity, degree of liquidity, restrictions on the disposition, latest round of financing data, company financial statements, relevant valuationmultiples and discounted cash flow analyses.
• Fair value estimates for private debt placements are calculated using standardized valuation methods, including but not limited to income-based techniques such as discounted cash flow projections or market-based techniques utilizing public and private transaction multiplesas comparables.
• Fair value estimates for real estate investments are calculated by investment managers using the present value of future cash flowsexpected to be received from the investments, based on valuation methodologies such as appraisals, local market conditions, and currentand projected operating performance.
• Fair value estimates for certain fixed-income securities such as insurance contracts are calculated based on the future stream of benefitpayments discounted using prevailing interest rates based on the valuation date.
• Net asset value – primarily includes equity funds, fixed income funds, real estate funds, hedge funds and private equity investments for whichnet asset values are normally used.
100
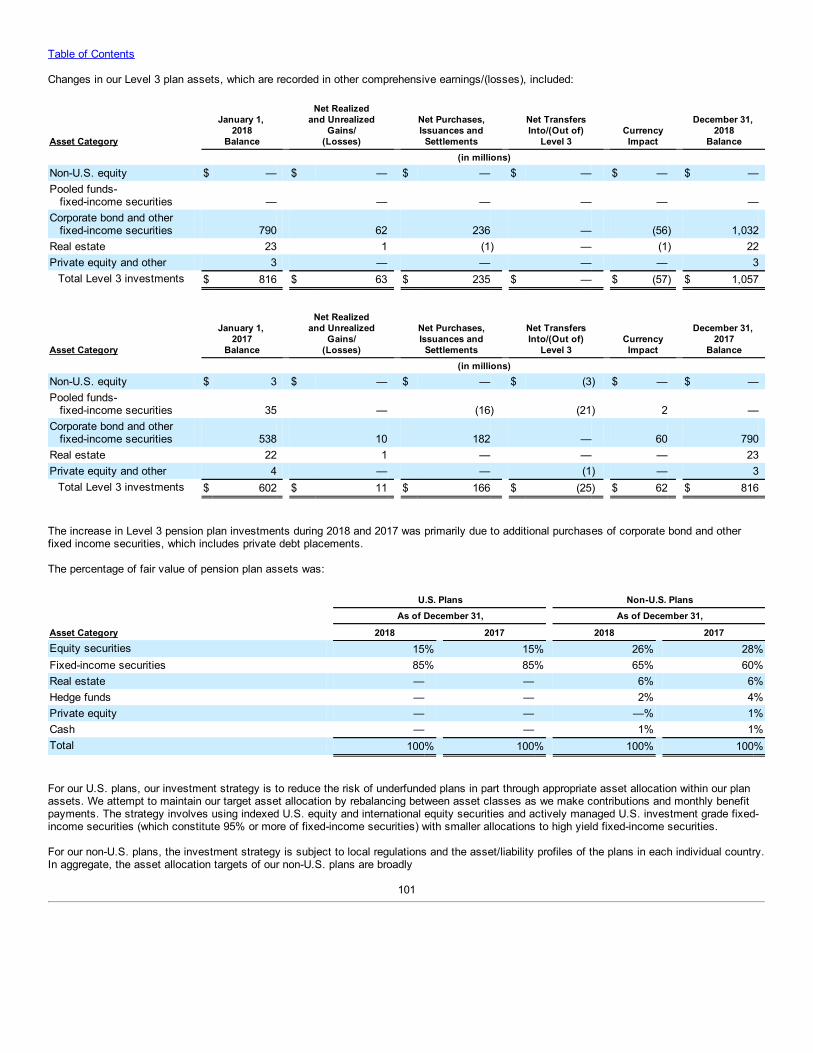
Table of Contents
Changes in our Level 3 plan assets, which are recorded in other comprehensive earnings/(losses), included:
Asset Category
January 1, 2018
Balance
Net Realizedand Unrealized
Gains/(Losses)
Net Purchases,Issuances and
Settlements
Net TransfersInto/(Out of)
Level 3 CurrencyImpact
December 31, 2018
Balance (in millions)Non-U.S. equity $ — $ — $ — $ — $ — $ —Pooled funds- fixed-income securities — — — — — —Corporate bond and other fixed-income securities 790 62 236 — (56) 1,032Real estate 23 1 (1) — (1) 22Private equity and other 3 — — — — 3
Total Level 3 investments $ 816 $ 63 $ 235 $ — $ (57) $ 1,057
Asset Category
January 1, 2017
Balance
Net Realizedand Unrealized
Gains/(Losses)
Net Purchases,Issuances and
Settlements
Net TransfersInto/(Out of)
Level 3 CurrencyImpact
December 31, 2017
Balance (in millions)Non-U.S. equity $ 3 $ — $ — $ (3) $ — $ —Pooled funds- fixed-income securities 35 — (16) (21) 2 —Corporate bond and other fixed-income securities 538 10 182 — 60 790Real estate 22 1 — — — 23Private equity and other 4 — — (1) — 3
Total Level 3 investments $ 602 $ 11 $ 166 $ (25) $ 62 $ 816
The increase in Level 3 pension plan investments during 2018 and 2017 was primarily due to additional purchases of corporate bond and otherfixed income securities, which includes private debt placements.
The percentage of fair value of pension plan assets was:
U.S. Plans Non-U.S. Plans As of December 31, As of December 31,
Asset Category 2018 2017 2018 2017Equity securities 15% 15% 26% 28%Fixed-income securities 85% 85% 65% 60%Real estate — — 6% 6%Hedge funds — — 2% 4%Private equity — — —% 1%Cash — — 1% 1%Total 100% 100% 100% 100%
For our U.S. plans, our investment strategy is to reduce the risk of underfunded plans in part through appropriate asset allocation within our planassets. We attempt to maintain our target asset allocation by rebalancing between asset classes as we make contributions and monthly benefitpayments. The strategy involves using indexed U.S. equity and international equity securities and actively managed U.S. investment grade fixed-income securities (which constitute 95% or more of fixed-income securities) with smaller allocations to high yield fixed-income securities.
For our non-U.S. plans, the investment strategy is subject to local regulations and the asset/liability profiles of the plans in each individual country.In aggregate, the asset allocation targets of our non-U.S. plans are broadly
101
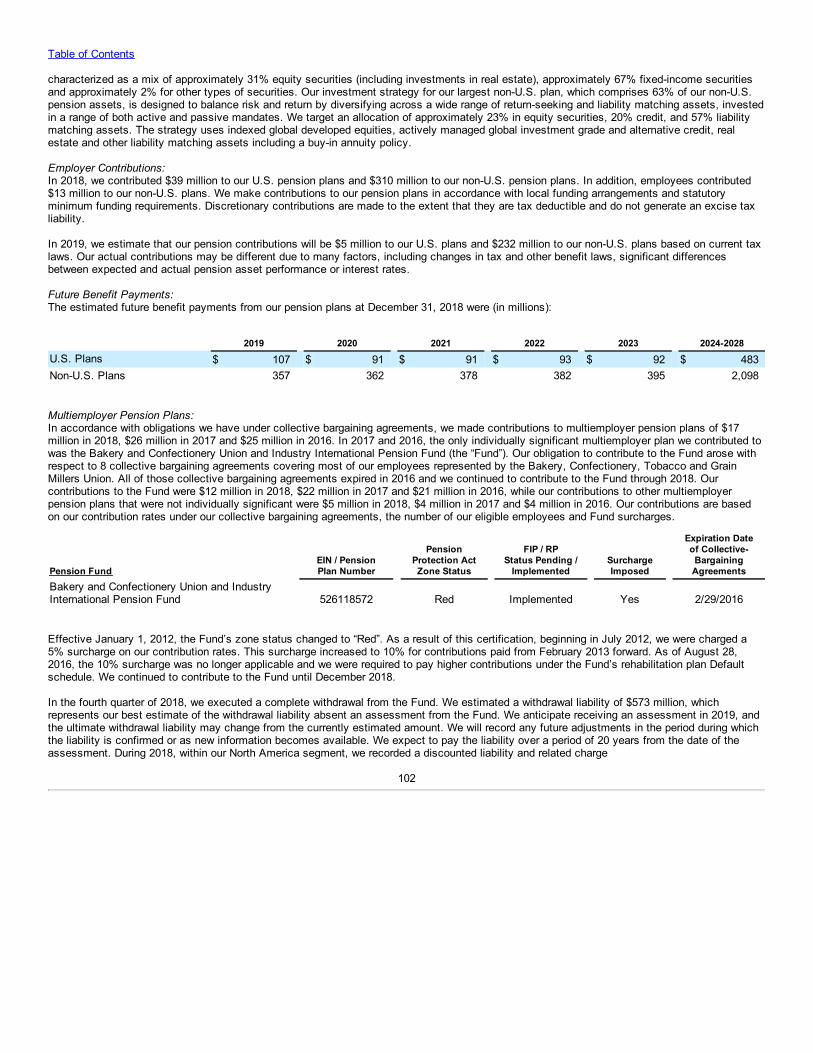
Table of Contents
characterized as a mix of approximately 31% equity securities (including investments in real estate), approximately 67% fixed-income securitiesand approximately 2% for other types of securities. Our investment strategy for our largest non-U.S. plan, which comprises 63% of our non-U.S.pension assets, is designed to balance risk and return by diversifying across a wide range of return-seeking and liability matching assets, investedin a range of both active and passive mandates. We target an allocation of approximately 23% in equity securities, 20% credit, and 57% liabilitymatching assets. The strategy uses indexed global developed equities, actively managed global investment grade and alternative credit, realestate and other liability matching assets including a buy-in annuity policy.
Employer Contributions:In 2018, we contributed $39 million to our U.S. pension plans and $310 million to our non-U.S. pension plans. In addition, employees contributed$13 million to our non-U.S. plans. We make contributions to our pension plans in accordance with local funding arrangements and statutoryminimum funding requirements. Discretionary contributions are made to the extent that they are tax deductible and do not generate an excise taxliability.
In 2019, we estimate that our pension contributions will be $5 million to our U.S. plans and $232 million to our non-U.S. plans based on current taxlaws. Our actual contributions may be different due to many factors, including changes in tax and other benefit laws, significant differencesbetween expected and actual pension asset performance or interest rates.
Future Benefit Payments:The estimated future benefit payments from our pension plans at December 31, 2018 were (in millions):
2019 2020 2021 2022 2023 2024-2028U.S. Plans $ 107 $ 91 $ 91 $ 93 $ 92 $ 483Non-U.S. Plans 357 362 378 382 395 2,098
Multiemployer Pension Plans:In accordance with obligations we have under collective bargaining agreements, we made contributions to multiemployer pension plans of $17million in 2018, $26 million in 2017 and $25 million in 2016. In 2017 and 2016, the only individually significant multiemployer plan we contributed towas the Bakery and Confectionery Union and Industry International Pension Fund (the “Fund”). Our obligation to contribute to the Fund arose withrespect to 8 collective bargaining agreements covering most of our employees represented by the Bakery, Confectionery, Tobacco and GrainMillers Union. All of those collective bargaining agreements expired in 2016 and we continued to contribute to the Fund through 2018. Ourcontributions to the Fund were $12 million in 2018, $22 million in 2017 and $21 million in 2016, while our contributions to other multiemployerpension plans that were not individually significant were $5 million in 2018, $4 million in 2017 and $4 million in 2016. Our contributions are basedon our contribution rates under our collective bargaining agreements, the number of our eligible employees and Fund surcharges.
Pension FundEIN / PensionPlan Number
PensionProtection ActZone Status
FIP / RPStatus Pending /
Implemented SurchargeImposed
Expiration Dateof Collective-BargainingAgreements
Bakery and Confectionery Union and IndustryInternational Pension Fund 526118572 Red Implemented Yes 2/29/2016
Effective January 1, 2012, the Fund’s zone status changed to “Red”. As a result of this certification, beginning in July 2012, we were charged a5% surcharge on our contribution rates. This surcharge increased to 10% for contributions paid from February 2013 forward. As of August 28,2016, the 10% surcharge was no longer applicable and we were required to pay higher contributions under the Fund’s rehabilitation plan Defaultschedule. We continued to contribute to the Fund until December 2018.
In the fourth quarter of 2018, we executed a complete withdrawal from the Fund. We estimated a withdrawal liability of $573 million, whichrepresents our best estimate of the withdrawal liability absent an assessment from the Fund. We anticipate receiving an assessment in 2019, andthe ultimate withdrawal liability may change from the currently estimated amount. We will record any future adjustments in the period during whichthe liability is confirmed or as new information becomes available. We expect to pay the liability over a period of 20 years from the date of theassessment. During 2018, within our North America segment, we recorded a discounted liability and related charge
102
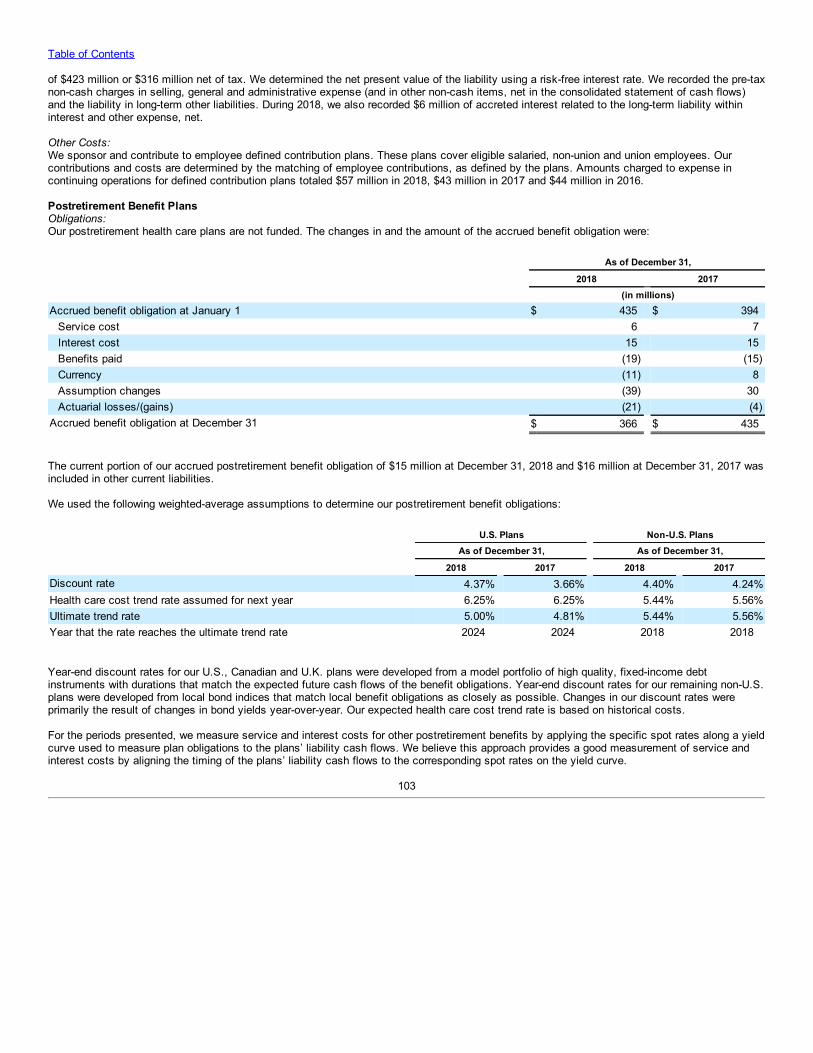
Table of Contents
of $423 million or $316 million net of tax. We determined the net present value of the liability using a risk-free interest rate. We recorded the pre-taxnon-cash charges in selling, general and administrative expense (and in other non-cash items, net in the consolidated statement of cash flows)and the liability in long-term other liabilities. During 2018, we also recorded $6 million of accreted interest related to the long-term liability withininterest and other expense, net.
Other Costs:We sponsor and contribute to employee defined contribution plans. These plans cover eligible salaried, non-union and union employees. Ourcontributions and costs are determined by the matching of employee contributions, as defined by the plans. Amounts charged to expense incontinuing operations for defined contribution plans totaled $57 million in 2018, $43 million in 2017 and $44 million in 2016.
Postretirement Benefit PlansObligations:Our postretirement health care plans are not funded. The changes in and the amount of the accrued benefit obligation were:
As of December 31,
2018 2017 (in millions)Accrued benefit obligation at January 1 $ 435 $ 394
Service cost 6 7Interest cost 15 15Benefits paid (19) (15)Currency (11) 8Assumption changes (39) 30Actuarial losses/(gains) (21) (4)
Accrued benefit obligation at December 31 $ 366 $ 435
The current portion of our accrued postretirement benefit obligation of $15 million at December 31, 2018 and $16 million at December 31, 2017 wasincluded in other current liabilities.
We used the following weighted-average assumptions to determine our postretirement benefit obligations:
U.S. Plans Non-U.S. Plans As of December 31, As of December 31,
2018 2017 2018 2017Discount rate 4.37% 3.66% 4.40% 4.24%Health care cost trend rate assumed for next year 6.25% 6.25% 5.44% 5.56%Ultimate trend rate 5.00% 4.81% 5.44% 5.56%Year that the rate reaches the ultimate trend rate 2024 2024 2018 2018
Year-end discount rates for our U.S., Canadian and U.K. plans were developed from a model portfolio of high quality, fixed-income debtinstruments with durations that match the expected future cash flows of the benefit obligations. Year-end discount rates for our remaining non-U.S.plans were developed from local bond indices that match local benefit obligations as closely as possible. Changes in our discount rates wereprimarily the result of changes in bond yields year-over-year. Our expected health care cost trend rate is based on historical costs.
For the periods presented, we measure service and interest costs for other postretirement benefits by applying the specific spot rates along a yieldcurve used to measure plan obligations to the plans’ liability cash flows. We believe this approach provides a good measurement of service andinterest costs by aligning the timing of the plans’ liability cash flows to the corresponding spot rates on the yield curve.
103
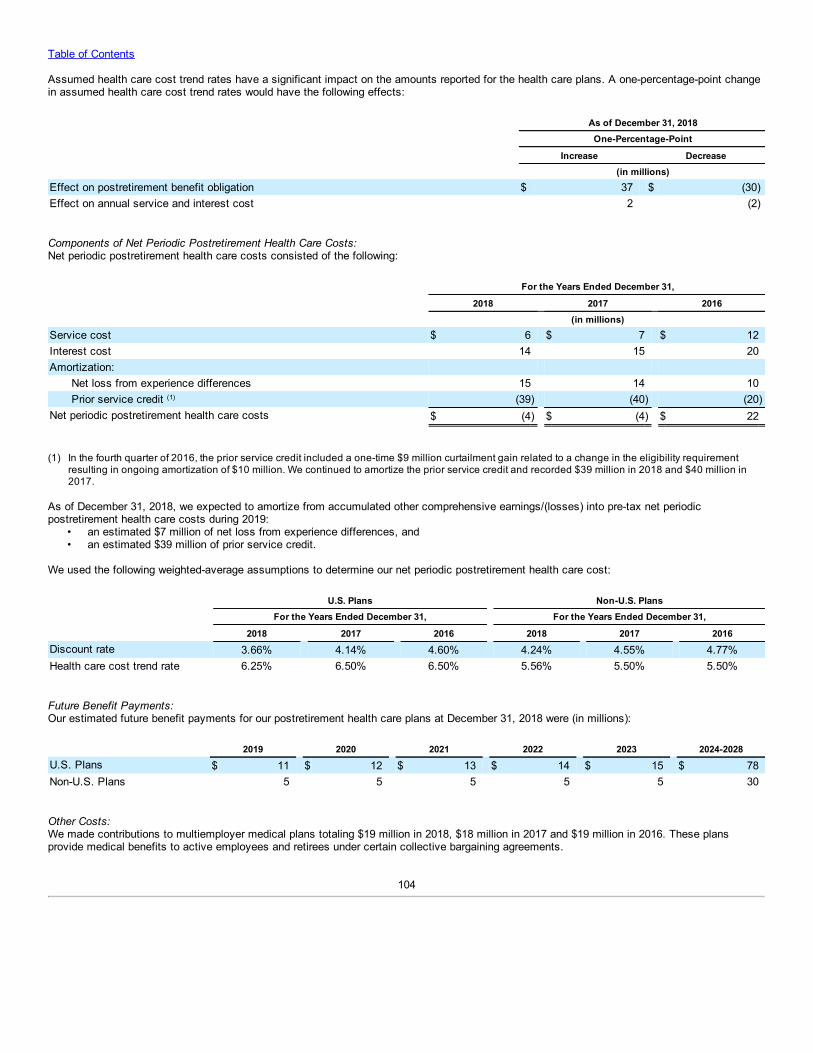
Table of Contents
Assumed health care cost trend rates have a significant impact on the amounts reported for the health care plans. A one-percentage-point changein assumed health care cost trend rates would have the following effects:
As of December 31, 2018 One-Percentage-Point
Increase Decrease (in millions)Effect on postretirement benefit obligation $ 37 $ (30)Effect on annual service and interest cost 2 (2)
Components of Net Periodic Postretirement Health Care Costs:Net periodic postretirement health care costs consisted of the following:
For the Years Ended December 31,
2018 2017 2016 (in millions)Service cost $ 6 $ 7 $ 12Interest cost 14 15 20Amortization:
Net loss from experience differences 15 14 10Prior service credit (1) (39) (40) (20)
Net periodic postretirement health care costs $ (4) $ (4) $ 22
(1) In the fourth quarter of 2016, the prior service credit included a one-time $9 million curtailment gain related to a change in the eligibility requirement
resulting in ongoing amortization of $10 million. We continued to amortize the prior service credit and recorded $39 million in 2018 and $40 million in2017.
As of December 31, 2018, we expected to amortize from accumulated other comprehensive earnings/(losses) into pre-tax net periodicpostretirement health care costs during 2019:
• an estimated $7 million of net loss from experience differences, and• an estimated $39 million of prior service credit.
We used the following weighted-average assumptions to determine our net periodic postretirement health care cost:
U.S. Plans Non-U.S. Plans For the Years Ended December 31, For the Years Ended December 31,
2018 2017 2016 2018 2017 2016Discount rate 3.66% 4.14% 4.60% 4.24% 4.55% 4.77%Health care cost trend rate 6.25% 6.50% 6.50% 5.56% 5.50% 5.50%
Future Benefit Payments:Our estimated future benefit payments for our postretirement health care plans at December 31, 2018 were (in millions):
2019 2020 2021 2022 2023 2024-2028U.S. Plans $ 11 $ 12 $ 13 $ 14 $ 15 $ 78Non-U.S. Plans 5 5 5 5 5 30
Other Costs:We made contributions to multiemployer medical plans totaling $19 million in 2018, $18 million in 2017 and $19 million in 2016. These plansprovide medical benefits to active employees and retirees under certain collective bargaining agreements.
104
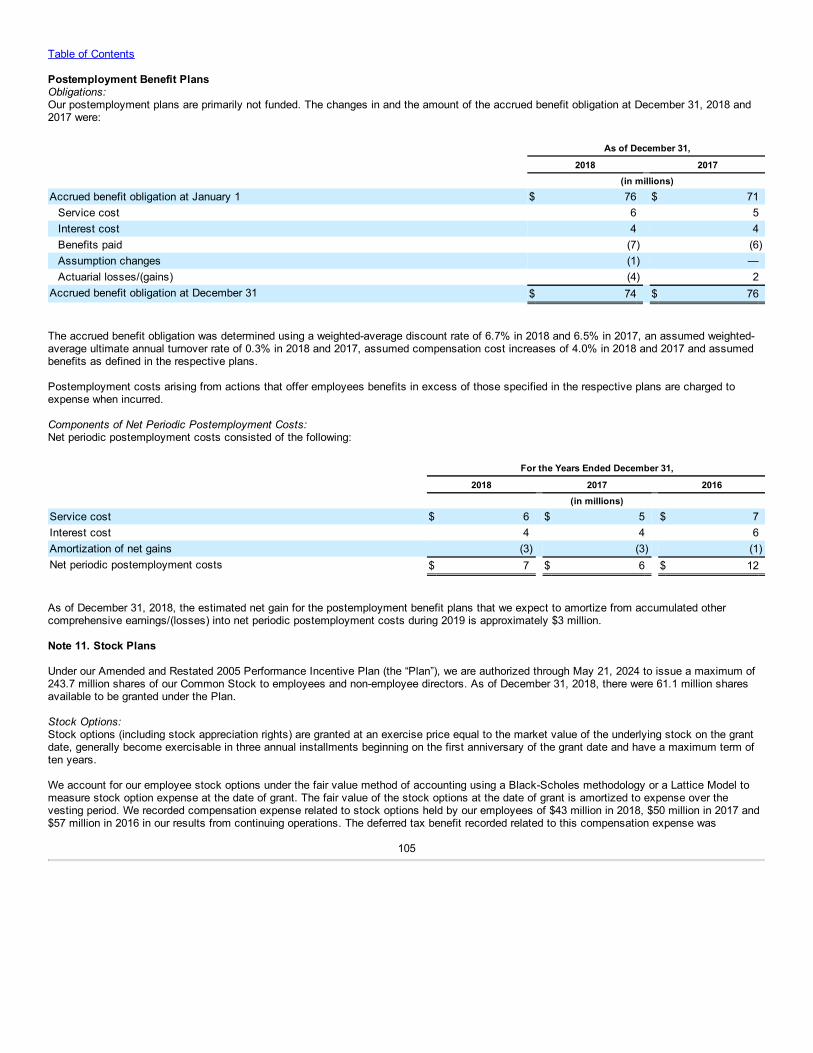
Table of Contents
Postemployment Benefit PlansObligations:Our postemployment plans are primarily not funded. The changes in and the amount of the accrued benefit obligation at December 31, 2018 and2017 were:
As of December 31,
2018 2017 (in millions)Accrued benefit obligation at January 1 $ 76 $ 71
Service cost 6 5Interest cost 4 4Benefits paid (7) (6)Assumption changes (1) —Actuarial losses/(gains) (4) 2
Accrued benefit obligation at December 31 $ 74 $ 76
The accrued benefit obligation was determined using a weighted-average discount rate of 6.7% in 2018 and 6.5% in 2017, an assumed weighted-average ultimate annual turnover rate of 0.3% in 2018 and 2017, assumed compensation cost increases of 4.0% in 2018 and 2017 and assumedbenefits as defined in the respective plans.
Postemployment costs arising from actions that offer employees benefits in excess of those specified in the respective plans are charged toexpense when incurred.
Components of Net Periodic Postemployment Costs:Net periodic postemployment costs consisted of the following:
For the Years Ended December 31,
2018 2017 2016 (in millions)Service cost $ 6 $ 5 $ 7Interest cost 4 4 6Amortization of net gains (3) (3) (1)Net periodic postemployment costs $ 7 $ 6 $ 12
As of December 31, 2018, the estimated net gain for the postemployment benefit plans that we expect to amortize from accumulated othercomprehensive earnings/(losses) into net periodic postemployment costs during 2019 is approximately $3 million.
Note 11. Stock Plans
Under our Amended and Restated 2005 Performance Incentive Plan (the “Plan”), we are authorized through May 21, 2024 to issue a maximum of243.7 million shares of our Common Stock to employees and non-employee directors. As of December 31, 2018, there were 61.1 million sharesavailable to be granted under the Plan.
Stock Options:Stock options (including stock appreciation rights) are granted at an exercise price equal to the market value of the underlying stock on the grantdate, generally become exercisable in three annual installments beginning on the first anniversary of the grant date and have a maximum term often years.
We account for our employee stock options under the fair value method of accounting using a Black-Scholes methodology or a Lattice Model tomeasure stock option expense at the date of grant. The fair value of the stock options at the date of grant is amortized to expense over thevesting period. We recorded compensation expense related to stock options held by our employees of $43 million in 2018, $50 million in 2017 and$57 million in 2016 in our results from continuing operations. The deferred tax benefit recorded related to this compensation expense was
105
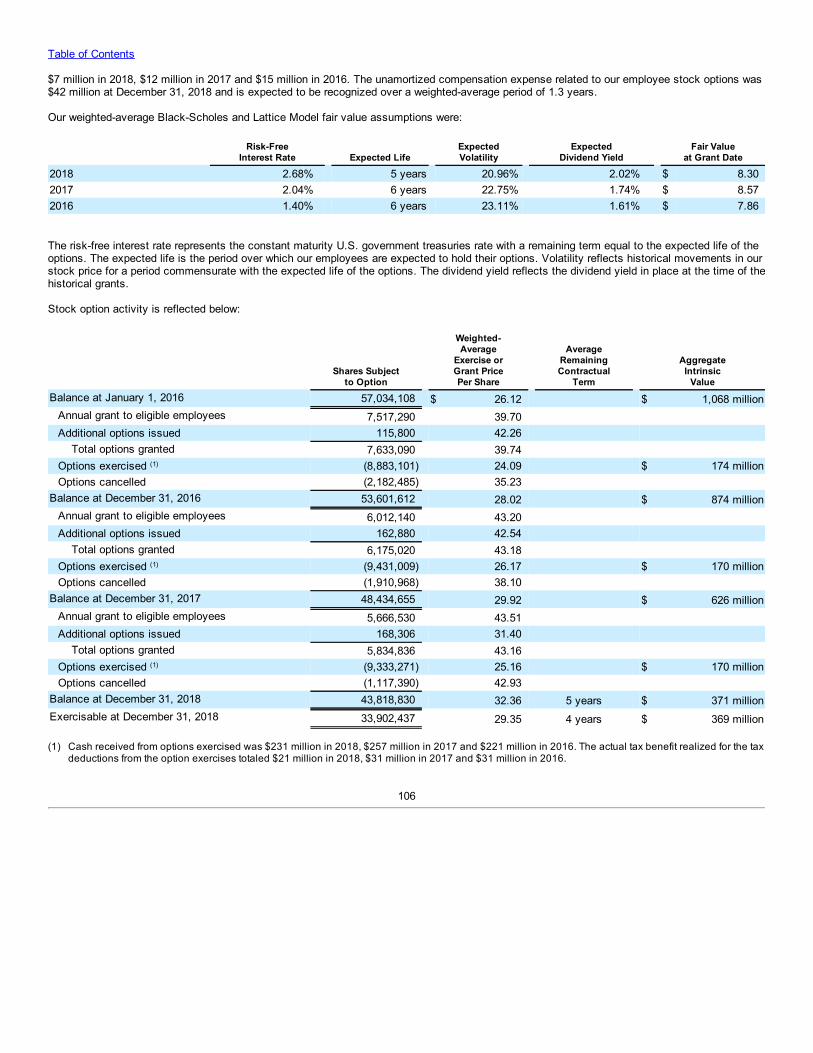
Table of Contents
$7 million in 2018, $12 million in 2017 and $15 million in 2016. The unamortized compensation expense related to our employee stock options was$42 million at December 31, 2018 and is expected to be recognized over a weighted-average period of 1.3 years.
Our weighted-average Black-Scholes and Lattice Model fair value assumptions were:
Risk-Free
Interest Rate Expected Life ExpectedVolatility
ExpectedDividend Yield
Fair Valueat Grant Date
2018 2.68% 5 years 20.96% 2.02% $ 8.302017 2.04% 6 years 22.75% 1.74% $ 8.572016 1.40% 6 years 23.11% 1.61% $ 7.86
The risk-free interest rate represents the constant maturity U.S. government treasuries rate with a remaining term equal to the expected life of theoptions. The expected life is the period over which our employees are expected to hold their options. Volatility reflects historical movements in ourstock price for a period commensurate with the expected life of the options. The dividend yield reflects the dividend yield in place at the time of thehistorical grants.
Stock option activity is reflected below:
Shares Subject
to Option
Weighted-Average
Exercise orGrant PricePer Share
AverageRemainingContractual
Term
AggregateIntrinsic
ValueBalance at January 1, 2016 57,034,108 $ 26.12 $ 1,068 million
Annual grant to eligible employees 7,517,290 39.70 Additional options issued 115,800 42.26
Total options granted 7,633,090 39.74 Options exercised (1) (8,883,101) 24.09 $ 174 millionOptions cancelled (2,182,485) 35.23
Balance at December 31, 2016 53,601,612 28.02 $ 874 millionAnnual grant to eligible employees 6,012,140 43.20 Additional options issued 162,880 42.54
Total options granted 6,175,020 43.18 Options exercised (1) (9,431,009) 26.17 $ 170 millionOptions cancelled (1,910,968) 38.10
Balance at December 31, 2017 48,434,655 29.92 $ 626 millionAnnual grant to eligible employees 5,666,530 43.51 Additional options issued 168,306 31.40
Total options granted 5,834,836 43.16 Options exercised (1) (9,333,271) 25.16 $ 170 millionOptions cancelled (1,117,390) 42.93
Balance at December 31, 2018 43,818,830 32.36 5 years $ 371 millionExercisable at December 31, 2018 33,902,437 29.35 4 years $ 369 million (1) Cash received from options exercised was $231 million in 2018, $257 million in 2017 and $221 million in 2016. The actual tax benefit realized for the tax
deductions from the option exercises totaled $21 million in 2018, $31 million in 2017 and $31 million in 2016.
106
Table of Contents
Deferred Stock Units, Performance Share Units and Restricted Stock:Historically we have made grants of deferred stock units, performance share units and restricted stock. Beginning in 2016, we only grant deferredstock units and performance share units and no longer grant restricted stock. We may grant shares of deferred stock units to eligible employees,giving them, in most instances, all of the rights of shareholders, except that they may not sell, assign, pledge or otherwise encumber the sharesand our deferred stock units do not have voting rights until vested. Shares of deferred stock units are subject to forfeiture if certain employmentconditions are not met. Deferred stock units generally vest on the third anniversary of the grant date. Performance share units granted under our2005 Plan vest based on varying performance, market and service conditions. The unvested performance share units have no voting rights and donot pay dividends. Dividend equivalents accumulated over the vesting period are paid only after the performance share units vest.
The fair value of the deferred stock units, performance share units and restricted stock at the date of grant is amortized to earnings over thevesting period. The fair value of our deferred stock units and restricted stock is measured at the market price of our Common Stock on the grantdate. Performance share unit awards generally have targets tied to both performance and market-based conditions. For market conditioncomponents, market volatility and other factors are taken into consideration in determining the grant date fair value and the related compensationexpense is recognized regardless of whether the market condition is satisfied, provided that the requisite service has been provided. Forperformance condition components, we estimate the probability that the performance conditions will be achieved each quarter and adjustcompensation expenses accordingly. The grant date fair value of performance share units is determined based on the Monte Carlo simulationmodel for the market-based total shareholder return component and the market price of our Common Stock on the grant date for performance-based components. The number of performance share units that ultimately vest ranges from 0-200 percent of the number granted, based on theachievement of the performance and market-based components. We recorded compensation expense related to deferred stock units, performanceshare units and restricted stock of $85 million in 2018, $87 million in 2017 and $83 million in 2016 in our results from continuing operations. Thedeferred tax benefit recorded related to this compensation expense was $12 million in 2018, $23 million in 2017 and $22 million in 2016. Theunamortized compensation expense related to our deferred stock units, performance share units and restricted stock was $113 million atDecember 31, 2018 and is expected to be recognized over a weighted-average period of 1.5 years.
107
Table of Contents
Our performance share unit, deferred stock unit and restricted stock activity is reflected below:
Number
of Shares Grant Date
Weighted-AverageFair Value
Per Share (3)
Weighted-AverageAggregate
Fair Value (3)Balance at January 1, 2016 9,418,216 $ 33.71
Annual grant to eligible employees: Feb. 22, 2016 Performance share units 1,406,500 34.35 Deferred stock units 1,040,790 39.70
Additional shares granted (1) 864,851 Various 32.90 Total shares granted 3,312,141 35.65 $ 118 million
Vested (2) (3,992,902) 28.15 $ 112 millionForfeited (2) (1,143,828) 37.58
Balance at December 31, 2016 7,593,627 36.90 Annual grant to eligible employees: Feb. 16, 2017
Performance share units 1,087,010 43.14 Deferred stock units 845,550 43.20
Additional shares granted (1) 1,537,763 Various 42.22 Total shares granted 3,470,323 42.75 $ 148 million
Vested (2) (2,622,807) 35.78 $ 94 millionForfeited (2) (771,438) 38.69
Balance at December 31, 2017 7,669,705 39.74 Annual grant to eligible employees: Feb. 22, 2018
Performance share units 1,048,770 51.23 Deferred stock units 788,310 43.51
Additional shares granted (1) 446,752 Various 41.78 Total shares granted 2,283,832 46.72 $ 107 million
Vested (2) (2,511,992) 38.91 $ 98 millionForfeited (2) (882,535) 42.00
Balance at December 31, 2018 6,559,010 42.19
(1) Includes performance share units and deferred stock units.(2) Includes performance share units, deferred stock units and restricted stock. The actual tax benefit realized for the tax deductions from the shares vested
totaled $3 million in 2018, $7 million in 2017 and $18 million in 2016.(3) The grant date fair value of performance share units is determined based on the Monte Carlo simulation model for the market-based total shareholder
return component and the closing market price of the Company’s stock on the grant date for performance-based components. The Monte Carlosimulation model incorporates the probability of achieving the total shareholder return market condition. Compensation expense is recognized using thegrant date fair values regardless of whether the market condition is achieved, so long as the requisite service has been provided.
108
Table of Contents
Note 12. Capital Stock
Our amended and restated articles of incorporation authorize 5.0 billion shares of Class A common stock (“Common Stock”) and 500 millionshares of preferred stock. There were no preferred shares issued and outstanding at December 31, 2018, 2017 and 2016. Shares of CommonStock issued, in treasury and outstanding were:
Shares Issued Treasury Shares Shares
OutstandingBalance at January 1, 2016 1,996,537,778 (416,504,624) 1,580,033,154Shares repurchased — (61,972,713) (61,972,713)Exercise of stock options and issuance of other stock awards — 10,305,100 10,305,100Balance at December 31, 2016 1,996,537,778 (468,172,237) 1,528,365,541Shares repurchased — (50,598,902) (50,598,902)Exercise of stock options and issuance of other stock awards — 10,369,445 10,369,445Balance at December 31, 2017 1,996,537,778 (508,401,694) 1,488,136,084Shares repurchased — (47,258,884) (47,258,884)Exercise of stock options and issuance of other stock awards — 10,122,655 10,122,655Balance at December 31, 2018 1,996,537,778 (545,537,923) 1,450,999,855
Stock plan awards to employees and non-employee directors are issued from treasury shares. At December 31, 2018, 111 million shares ofCommon Stock held in treasury were reserved for stock options and other stock awards.
Share Repurchase Program:Between 2013 and 2017, our Board of Directors authorized the repurchase of a total of $13.7 billion of our Common Stock through December 31,2018. On January 31, 2018, our Finance Committee, with authorization delegated from our Board of Directors, approved an increase of $6.0 billionin the share repurchase program, raising the authorization to $19.7 billion of Common Stock repurchases, and extended the program throughDecember 31, 2020. Repurchases under the program are determined by management and are wholly discretionary. Prior to January 1, 2018, wehad repurchased approximately $13.0 billion of Common Stock pursuant to this authorization. During 2018, we repurchased approximately 47.3million shares of Common Stock at an average cost of $42.18 per share, or an aggregate cost of approximately $2.0 billion, all of which was paidduring the period. All share repurchases were funded through available cash and commercial paper issuances. As of December 31, 2018, we haveapproximately $4.7 billion in remaining share repurchase capacity.
Note 13. Commitments and Contingencies
Legal Proceedings:We routinely are involved in legal proceedings, claims and governmental inspections or investigations ("Legal Matters") arising in the ordinarycourse of our business.
In February 2013 and March 2014, Cadbury India Limited (now known as Mondelez India Foods Private Limited), a subsidiary of MondelēzInternational, and other parties received show cause notices from the Indian Central Excise Authority (the “Excise Authority”) calling upon theparties to demonstrate why the Excise Authority should not collect a total of 3.7 billion Indian rupees ($54 million as of December 31, 2018) ofunpaid excise tax and an equivalent amount of penalties, as well as interest, related to production at the same Indian facility. We contested thesedemands for unpaid excise taxes, penalties and interest. On March 27, 2015, after several hearings, the Commissioner of the Excise Authorityissued an order denying the excise exemption that we claimed for the Indian facility and confirming the Excise Authority’s demands for total taxesand penalties in the amount of 5.8 billion Indian rupees ($84 million as of December 31, 2018) plus accrued interest. We have appealed this order.In addition, the Excise Authority issued additional show cause notices in February 2015, December 2015 and October 2017 on the same issue butcovering the periods January to October 2014, November 2014 to September 2015 and October 2015 to June 2017, respectively. These noticesadded a total of 4.9 billion Indian rupees ($70 million as of December 31, 2018) of allegedly unpaid excise taxes subject to penalties up to anequivalent amount plus accrued interest. Interest will continue to accrue until the matters are resolved. With the implementation of the new
109
Table of Contents
Goods and Services Tax in India in July 2017, we will not receive any further show cause notices for additional amounts on this issue. We believethat the decision to claim the excise tax benefit is valid and we are continuing to contest the show cause notices through the administrative andjudicial process. As part of a continuing appeals process, we may be required to deposit an amount up to the equivalent of the total demand forunpaid excise taxes under the five show cause notices, which will be repaid if the proceedings conclude in our favor. We do not expect to berequired to make any such deposit before 2020.
On April 1, 2015, the U.S. Commodity Futures Trading Commission ("CFTC") filed a complaint against Kraft Foods Group and Mondelēz GlobalLLC (“Mondelēz Global”) in the U.S. District Court for the Northern District of Illinois, Eastern Division (the “CFTC action”) following its investigationof activities related to the trading of December 2011 wheat futures contracts that occurred prior to the spin-off of Kraft Foods Group. The complaintalleges that Kraft Foods Group and Mondelēz Global (1) manipulated or attempted to manipulate the wheat markets during the fall of 2011; (2)violated position limit levels for wheat futures and (3) engaged in non-competitive trades by trading both sides of exchange-for-physical ChicagoBoard of Trade wheat contracts. The CFTC seeks civil monetary penalties of either triple the monetary gain for each violation of the CommodityExchange Act (the “Act”) or $1 million for each violation of Section 6(c)(1), 6(c)(3) or 9(a)(2) of the Act and $140,000 for each additional violation ofthe Act, plus post-judgment interest; an order of permanent injunction prohibiting Kraft Foods Group and Mondelēz Global from violating specifiedprovisions of the Act; disgorgement of profits; and costs and fees. We are awaiting the outcome of our motion for summary judgment. If ourmotion is denied, the case could proceed to trial in 2019. Additionally, several class action complaints were filed against Kraft Foods Group andMondelēz Global in the U.S. District Court for the Northern District of Illinois by investors in wheat futures and options on behalf of themselves andothers similarly situated. The complaints make similar allegations as those made in the CFTC action and seek class action certification; anunspecified amount for damages, interest and unjust enrichment; costs and fees; and injunctive, declaratory and other unspecified relief. In June2015, these suits were consolidated in the Northern District of Illinois. We are contesting the plaintiffs’ request for class certification. It is notpossible to predict the outcome of these matters; however, based on our Separation and Distribution Agreement with Kraft Foods Group dated asof September 27, 2012, we expect to bear any monetary penalties or other payments in connection with the CFTC action. Although the CFTCaction and the class action complaints involve the same alleged conduct, a resolution or decision with respect to one of the matters may not bedispositive as to the outcome of the other matter.
On August 21, 2018, the Virginia Department of Environmental Quality (“VDEQ”) issued a Notice of Violation (“NOV”) to Mondelēz Global. In theNOV, the VDEQ alleges that in our Richmond bakery, one operating line did not have the proper minimum temperature on its pollution controlequipment and that the bakery failed to provide certain observation and training records. The VDEQ indicated that the alleged violations may leadto a fine and/or injunctive relief. We are working with the VDEQ to reach a resolution of this matter, and we do not expect this matter to have amaterial effect on our financial results.
We are a party to various legal proceedings incidental to our business, including those noted above in this section. At present we believe that theultimate outcome of these proceedings, individually and in the aggregate, will not materially harm our financial position, results of operations orcash flows. However, legal proceedings and government investigations are subject to inherent uncertainties, and unfavorable rulings or otherevents could occur. Unfavorable resolutions could involve substantial monetary damages. In addition, in matters for which conduct remedies aresought, unfavorable resolutions could include an injunction or other order prohibiting us from selling one or more products at all or in particularways, precluding particular business practices or requiring other remedies. An unfavorable outcome might result in a material adverse impact onour business, results of operations or financial position.
Third-Party Guarantees:We enter into third-party guarantees primarily to cover long-term obligations of our vendors. As part of these transactions, we guarantee that thirdparties will make contractual payments or achieve performance measures. At December 31, 2018, we had no material third-party guaranteesrecorded on our consolidated balance sheet.
Tax Matters:We are a party to various tax matter proceedings incidental to our business. These proceedings are subject to inherent uncertainties, andunfavorable outcomes could subject us to additional tax liabilities and could materially adversely impact our business, results of operations orfinancial position.
110
Table of Contents
A tax indemnification matter related to our 2007 acquisition of the LU biscuit business was closed during the quarter ended June 30, 2018. Theclosure had no impact on net earnings, however, it did result in a $15 million tax benefit that was fully offset by an $11 million expense in selling,general and administrative expenses and a $4 million expense in interest and other expense, net.
During the first quarter of 2017, the Brazilian Supreme Court (the “Court”) ruled against the Brazilian tax authorities in a leading case related to thecomputation of certain indirect taxes. The Court ruled that the indirect tax base should not include a value-added tax known as “ICMS”. Byremoving the ICMS from the tax base, the Court effectively eliminated a “tax on a tax.” In lower courts, our Brazilian subsidiaries filed lawsuits torecover amounts paid and to discontinue subsequent payments related to the “tax on a tax.” Our Brazilian subsidiaries received injunctions againstmaking payments for the “tax on a tax” in 2008 and since that time until December 2016, had accrued this portion of the tax each quarter in theevent that the tax was reaffirmed by the Brazilian courts. On September 30, 2017, based on legal advice and the publication of the Court’sdecision related to this case, we determined that the likelihood that the increased tax base would be reinstated and assessed against us wasremote. Accordingly, we reversed our accrual of 667 million Brazilian reais, or $212 million as of September 30, 2017, of which $153 million wasrecorded within selling, general and administrative expenses and $59 million was recorded within interest and other expense, net. In connectionwith the Court's 2017 decision, the Brazilian tax authority filed a motion seeking clarification and adjustment of the terms of enforcement and thatmotion is still to be decided. We continue to monitor developments in this matter and currently do not expect a material future impact on ourfinancial statements. During the fourth quarter of 2018, in one of our lower court cases, the Brazilian Federal Court of Appeals ruled in our favoragainst the Brazilian tax authority, allowing one of our Brazil subsidiaries to recover amounts previously paid. As a result, we recorded a netbenefit in selling, general and administrative expenses of $26 million.
As part of our 2010 Cadbury acquisition, we became the responsible party for tax matters under a February 2, 2006 dated Deed of Tax Covenantbetween the Cadbury Schweppes PLC and related entities (“Schweppes”) and Black Lion Beverages and related entities. The tax matters includedan ongoing transfer pricing case with the Spanish tax authorities related to the Schweppes businesses Cadbury divested prior to our acquisition ofCadbury. During the first quarter of 2017, the Spanish Supreme Court decided the case in our favor. As a result of the final ruling, during the firstquarter of 2017, we recorded a favorable earnings impact of $46 million in selling, general and administrative expenses and $12 million in interestand other expense, net, for a total pre-tax impact of $58 million due to the non-cash reversal of Cadbury-related accrued liabilities related to thismatter. We recorded a total of $4 million of income over the third and fourth quarters of 2017 in connection with the related bank guaranteereleases.
Leases:Rental expenses recorded in continuing operations were $260 million in 2018, $284 million in 2017 and $317 million in 2016. As of December 31,2018, minimum rental commitments under non-cancelable operating leases in effect at year-end were (in millions):
2019 2020 2021 2022 2023 Thereafter Total
$ 208 $ 165 $ 114 $ 79 $ 57 $ 157 $ 780
Note 14. Reclassifications from Accumulated Other Comprehensive Income
The following table summarizes the changes in the accumulated balances of each component of accumulated other comprehensiveearnings/(losses) attributable to Mondelēz International. Amounts reclassified from accumulated other comprehensive earnings/(losses) to netearnings (net of tax) were net losses of $169 million in 2018, $174 million in 2017 and $250 million in 2016.
111
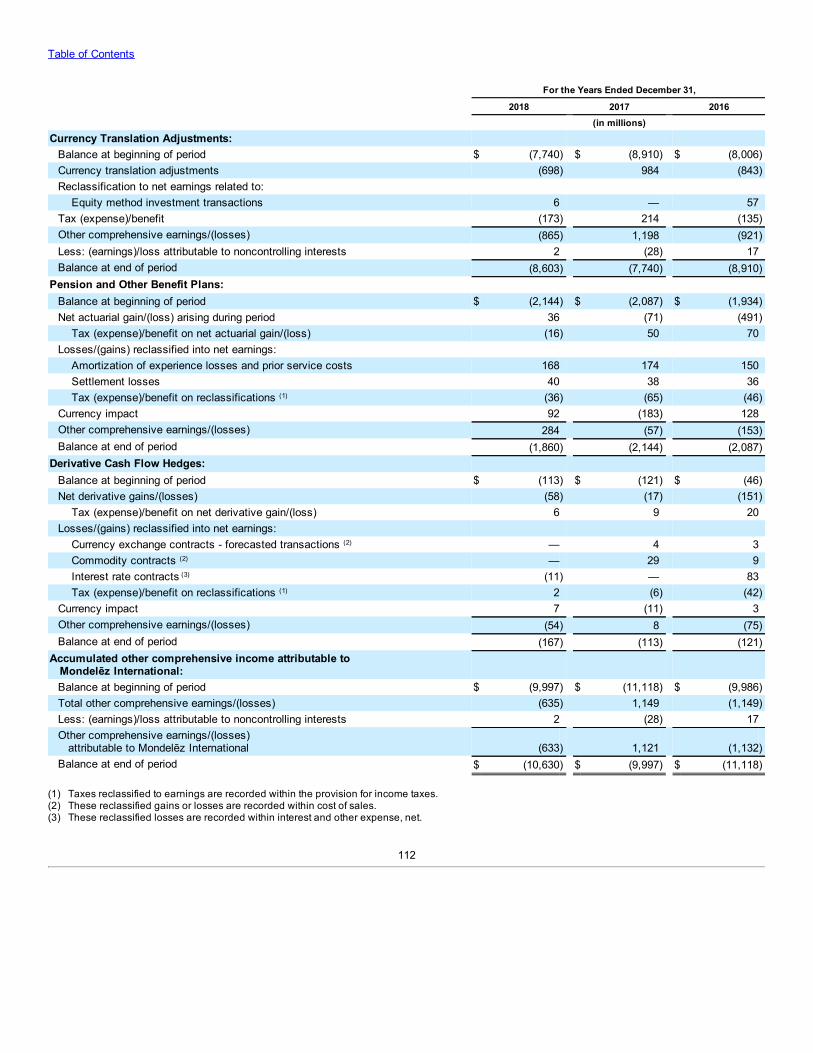
Table of Contents
For the Years Ended December 31,
2018 2017 2016 (in millions)Currency Translation Adjustments:
Balance at beginning of period $ (7,740) $ (8,910) $ (8,006)Currency translation adjustments (698) 984 (843)Reclassification to net earnings related to:
Equity method investment transactions 6 — 57Tax (expense)/benefit (173) 214 (135)Other comprehensive earnings/(losses) (865) 1,198 (921)Less: (earnings)/loss attributable to noncontrolling interests 2 (28) 17Balance at end of period (8,603) (7,740) (8,910)
Pension and Other Benefit Plans: Balance at beginning of period $ (2,144) $ (2,087) $ (1,934)Net actuarial gain/(loss) arising during period 36 (71) (491)
Tax (expense)/benefit on net actuarial gain/(loss) (16) 50 70Losses/(gains) reclassified into net earnings:
Amortization of experience losses and prior service costs 168 174 150Settlement losses 40 38 36Tax (expense)/benefit on reclassifications (1) (36) (65) (46)
Currency impact 92 (183) 128Other comprehensive earnings/(losses) 284 (57) (153)Balance at end of period (1,860) (2,144) (2,087)
Derivative Cash Flow Hedges: Balance at beginning of period $ (113) $ (121) $ (46)Net derivative gains/(losses) (58) (17) (151)
Tax (expense)/benefit on net derivative gain/(loss) 6 9 20Losses/(gains) reclassified into net earnings:
Currency exchange contracts - forecasted transactions (2) — 4 3Commodity contracts (2) — 29 9Interest rate contracts (3) (11) — 83Tax (expense)/benefit on reclassifications (1) 2 (6) (42)
Currency impact 7 (11) 3Other comprehensive earnings/(losses) (54) 8 (75)Balance at end of period (167) (113) (121)
Accumulated other comprehensive income attributable to Mondelēz International:
Balance at beginning of period $ (9,997) $ (11,118) $ (9,986)Total other comprehensive earnings/(losses) (635) 1,149 (1,149)Less: (earnings)/loss attributable to noncontrolling interests 2 (28) 17Other comprehensive earnings/(losses) attributable to Mondelēz International (633) 1,121 (1,132)Balance at end of period $ (10,630) $ (9,997) $ (11,118)
(1) Taxes reclassified to earnings are recorded within the provision for income taxes.(2) These reclassified gains or losses are recorded within cost of sales.(3) These reclassified losses are recorded within interest and other expense, net.
112
Table of Contents
Note 15. Income Taxes
On December 22, 2017, new U.S. tax reform legislation was enacted that included a broad range of complex provisions impacting the taxation ofbusinesses. Certain impacts of the new legislation would have generally required accounting to be completed and incorporated into our 2017 year-end financial statements, however in response to the complexities of this new legislation, the SEC issued guidance to provide companies withrelief. The SEC provided up to a one-year window for companies to finalize the accounting for the impacts of this new legislation. We finalized ouraccounting for the new provisions during the fourth quarter of 2018.
The impact on our 2018 results from finalizing the accounting for the new provisions was a discrete net tax expense of $19 million. The $19 millionexpense in 2018 is primarily comprised of a $60 million expense related to finalizing the changes in our indefinite reinvestment assertion, partiallyoffset by a $38 million decrease to the provisional transition tax recorded as of December 31, 2017.
In general, the transition tax is a result of the deemed repatriation imposed by the new legislation that results in the taxation of our accumulatedforeign earnings and profits (“E&P”) at a 15.5% rate on liquid assets (i.e. cash and other specified assets) and 8% on the remaining unremittedforeign E&P, both net of foreign tax credits. We finalized the accounting for this provision during the fourth quarter of 2018. During 2018 werecognized a $38 million decrease to the $1,317 million provisional transition tax recorded as December 31, 2017 for a total transition net taxexpense and gross U.S. tax reform transition tax liability (before payments) of $1,279 million which will be paid in installments through 2026.
During the fourth quarter of 2018, we also finalized our accounting for the deferred tax benefit resulting from the revaluation of our net U.S. deferredtax liabilities. The $1,311 million deferred tax benefit recorded as of 2017 year-end was reduced to $1,295 million as a result of the change to lagaccounting for Keurig.
As a result of U.S. tax reform, we changed our indefinite reinvestment assertion for most companies owned directly by our U.S. subsidiaries. As of2017 year end, we accrued deferred tax assets related to two entities where the deferred tax benefits were expected to be realized. As of 2018year end, we finalized our analysis related to the change in our indefinite reinvestment assertion and recognized $60 million in deferred taxexpense to capture the foreign and state tax impacts of the US GAAP over tax basis difference in those subsidiaries where we are no longerindefinitely reinvested.
The legislation established various new provisions, including a new provision that taxes U.S. allocated expenses (e.g. interest and generaladministrative expenses) as well as currently taxes certain income from foreign operations (Global Intangible Low-Tax Income, or “GILTI”). As ofDecember 31, 2018, we have made a policy decision and elected to treat taxes due from GILTI as a current period expense.
113
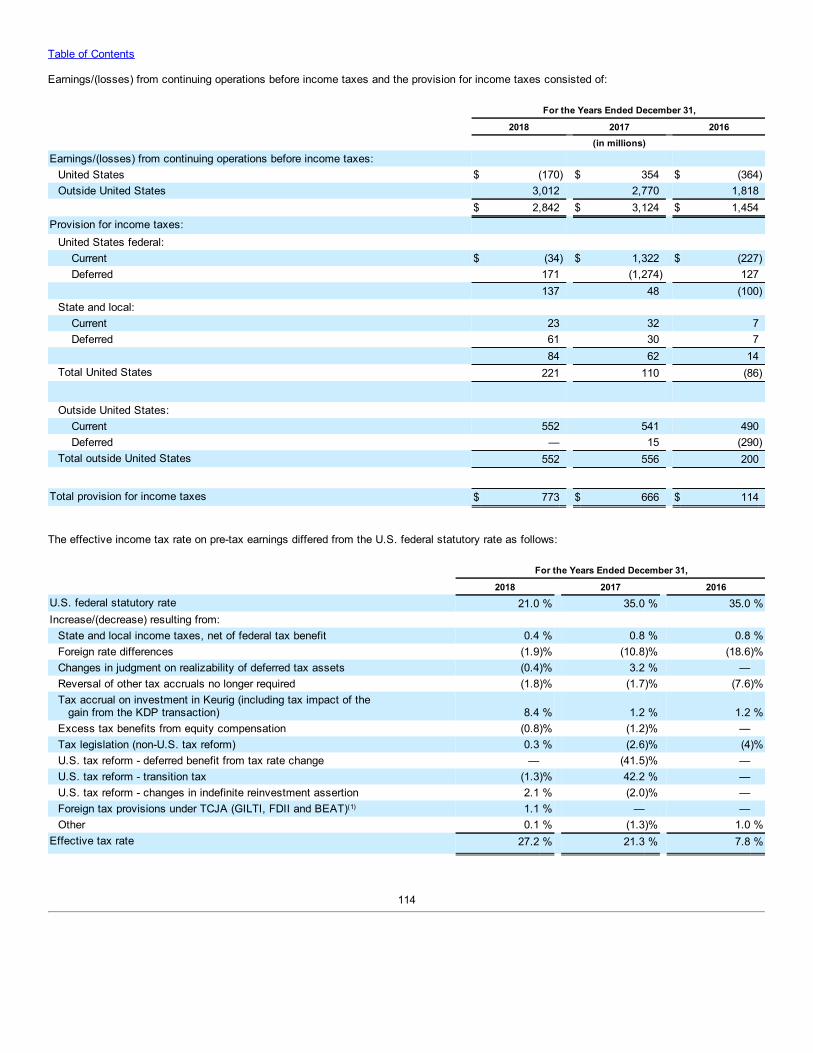
Table of Contents
Earnings/(losses) from continuing operations before income taxes and the provision for income taxes consisted of:
For the Years Ended December 31,
2018 2017 2016 (in millions)Earnings/(losses) from continuing operations before income taxes:
United States $ (170) $ 354 $ (364)Outside United States 3,012 2,770 1,818
$ 2,842 $ 3,124 $ 1,454Provision for income taxes:
United States federal: Current $ (34) $ 1,322 $ (227)Deferred 171 (1,274) 127
137 48 (100)State and local:
Current 23 32 7Deferred 61 30 7
84 62 14Total United States 221 110 (86)
Outside United States: Current 552 541 490Deferred — 15 (290)
Total outside United States 552 556 200
Total provision for income taxes $ 773 $ 666 $ 114
The effective income tax rate on pre-tax earnings differed from the U.S. federal statutory rate as follows:
For the Years Ended December 31,
2018 2017 2016U.S. federal statutory rate 21.0 % 35.0 % 35.0 %Increase/(decrease) resulting from:
State and local income taxes, net of federal tax benefit 0.4 % 0.8 % 0.8 %Foreign rate differences (1.9)% (10.8)% (18.6)%Changes in judgment on realizability of deferred tax assets (0.4)% 3.2 % —Reversal of other tax accruals no longer required (1.8)% (1.7)% (7.6)%Tax accrual on investment in Keurig (including tax impact of the gain from the KDP transaction) 8.4 % 1.2 % 1.2 %Excess tax benefits from equity compensation (0.8)% (1.2)% —Tax legislation (non-U.S. tax reform) 0.3 % (2.6)% (4)%U.S. tax reform - deferred benefit from tax rate change — (41.5)% —U.S. tax reform - transition tax (1.3)% 42.2 % —U.S. tax reform - changes in indefinite reinvestment assertion 2.1 % (2.0)% —Foreign tax provisions under TCJA (GILTI, FDII and BEAT)(1) 1.1 % — —Other 0.1 % (1.3)% 1.0 %
Effective tax rate 27.2 % 21.3 % 7.8 %
114
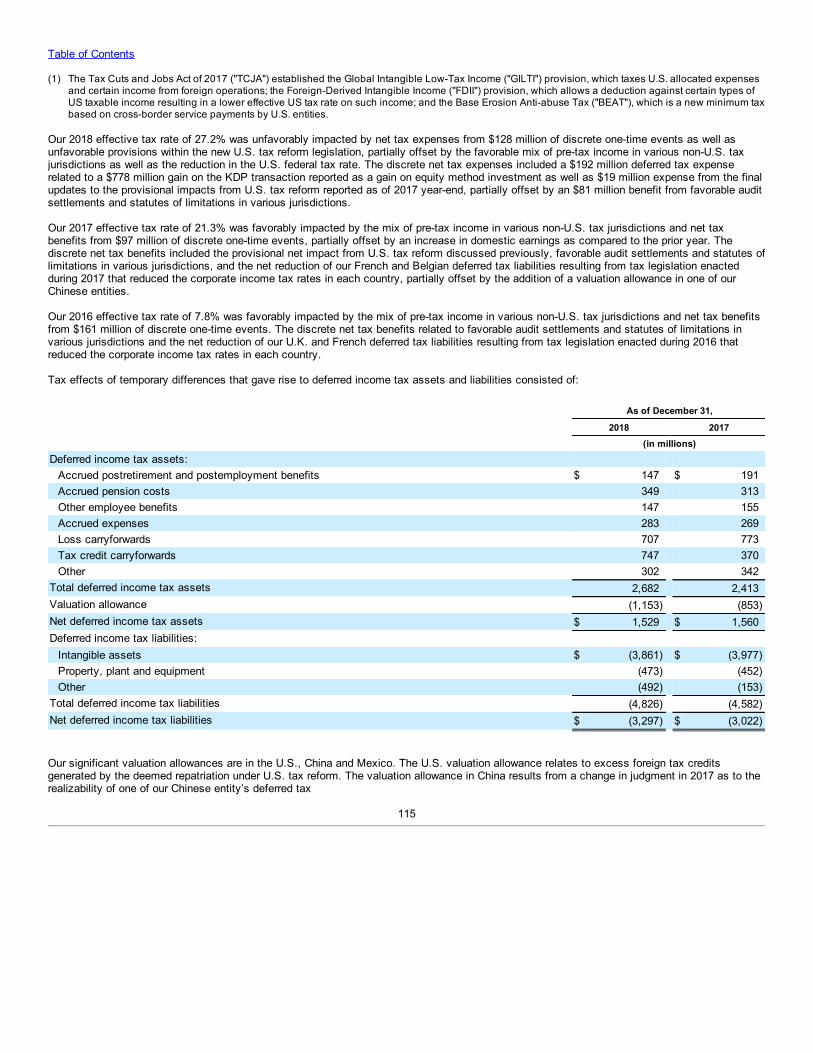
Table of Contents
(1) The Tax Cuts and Jobs Act of 2017 ("TCJA") established the Global Intangible Low-Tax Income ("GILTI") provision, which taxes U.S. allocated expensesand certain income from foreign operations; the Foreign-Derived Intangible Income ("FDII") provision, which allows a deduction against certain types ofUS taxable income resulting in a lower effective US tax rate on such income; and the Base Erosion Anti-abuse Tax ("BEAT"), which is a new minimum taxbased on cross-border service payments by U.S. entities.
Our 2018 effective tax rate of 27.2% was unfavorably impacted by net tax expenses from $128 million of discrete one-time events as well asunfavorable provisions within the new U.S. tax reform legislation, partially offset by the favorable mix of pre-tax income in various non-U.S. taxjurisdictions as well as the reduction in the U.S. federal tax rate. The discrete net tax expenses included a $192 million deferred tax expenserelated to a $778 million gain on the KDP transaction reported as a gain on equity method investment as well as $19 million expense from the finalupdates to the provisional impacts from U.S. tax reform reported as of 2017 year-end, partially offset by an $81 million benefit from favorable auditsettlements and statutes of limitations in various jurisdictions.
Our 2017 effective tax rate of 21.3% was favorably impacted by the mix of pre-tax income in various non-U.S. tax jurisdictions and net taxbenefits from $97 million of discrete one-time events, partially offset by an increase in domestic earnings as compared to the prior year. Thediscrete net tax benefits included the provisional net impact from U.S. tax reform discussed previously, favorable audit settlements and statutes oflimitations in various jurisdictions, and the net reduction of our French and Belgian deferred tax liabilities resulting from tax legislation enactedduring 2017 that reduced the corporate income tax rates in each country, partially offset by the addition of a valuation allowance in one of ourChinese entities.
Our 2016 effective tax rate of 7.8% was favorably impacted by the mix of pre-tax income in various non-U.S. tax jurisdictions and net tax benefitsfrom $161 million of discrete one-time events. The discrete net tax benefits related to favorable audit settlements and statutes of limitations invarious jurisdictions and the net reduction of our U.K. and French deferred tax liabilities resulting from tax legislation enacted during 2016 thatreduced the corporate income tax rates in each country.
Tax effects of temporary differences that gave rise to deferred income tax assets and liabilities consisted of:
As of December 31,
2018 2017 (in millions)Deferred income tax assets:
Accrued postretirement and postemployment benefits $ 147 $ 191Accrued pension costs 349 313Other employee benefits 147 155Accrued expenses 283 269Loss carryforwards 707 773Tax credit carryforwards 747 370Other 302 342
Total deferred income tax assets 2,682 2,413Valuation allowance (1,153) (853)Net deferred income tax assets $ 1,529 $ 1,560Deferred income tax liabilities:
Intangible assets $ (3,861) $ (3,977)Property, plant and equipment (473) (452)Other (492) (153)
Total deferred income tax liabilities (4,826) (4,582)Net deferred income tax liabilities $ (3,297) $ (3,022)
Our significant valuation allowances are in the U.S., China and Mexico. The U.S. valuation allowance relates to excess foreign tax creditsgenerated by the deemed repatriation under U.S. tax reform. The valuation allowance in China results from a change in judgment in 2017 as to therealizability of one of our Chinese entity’s deferred tax
115
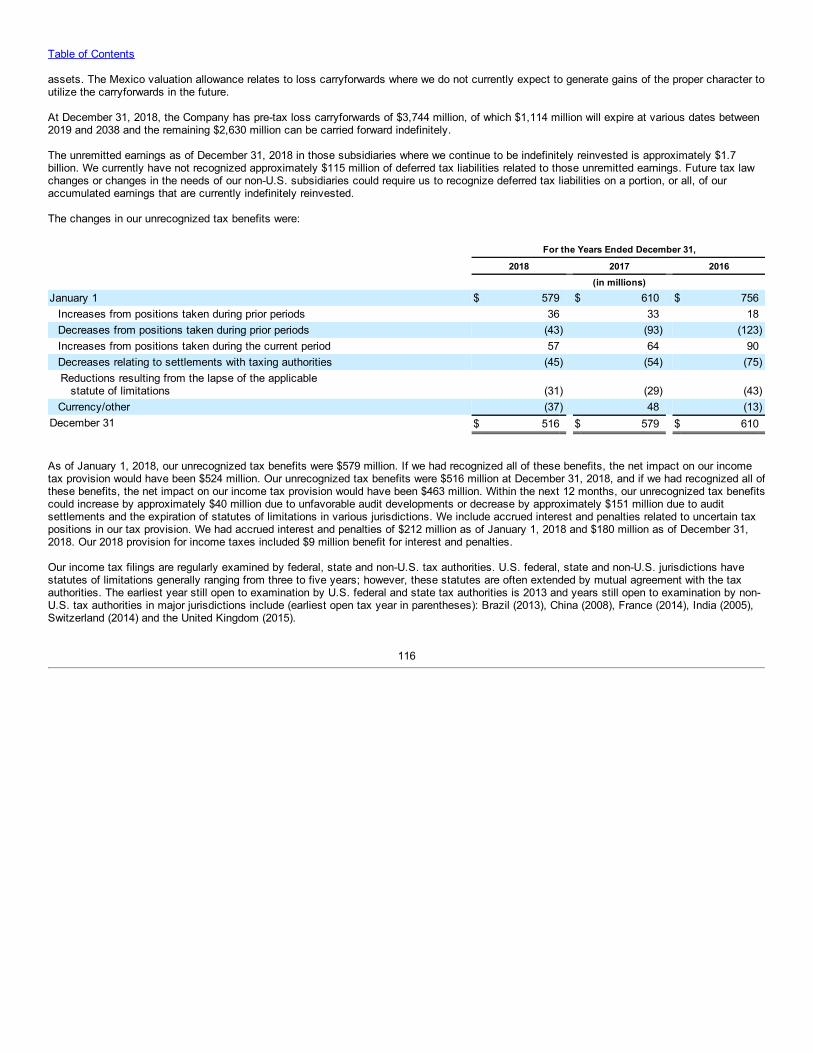
Table of Contents
assets. The Mexico valuation allowance relates to loss carryforwards where we do not currently expect to generate gains of the proper character toutilize the carryforwards in the future.
At December 31, 2018, the Company has pre-tax loss carryforwards of $3,744 million, of which $1,114 million will expire at various dates between2019 and 2038 and the remaining $2,630 million can be carried forward indefinitely.
The unremitted earnings as of December 31, 2018 in those subsidiaries where we continue to be indefinitely reinvested is approximately $1.7billion. We currently have not recognized approximately $115 million of deferred tax liabilities related to those unremitted earnings. Future tax lawchanges or changes in the needs of our non-U.S. subsidiaries could require us to recognize deferred tax liabilities on a portion, or all, of ouraccumulated earnings that are currently indefinitely reinvested.
The changes in our unrecognized tax benefits were:
For the Years Ended December 31,
2018 2017 2016 (in millions)January 1 $ 579 $ 610 $ 756
Increases from positions taken during prior periods 36 33 18Decreases from positions taken during prior periods (43) (93) (123)Increases from positions taken during the current period 57 64 90Decreases relating to settlements with taxing authorities (45) (54) (75)Reductions resulting from the lapse of the applicable statute of limitations (31) (29) (43)Currency/other (37) 48 (13)
December 31 $ 516 $ 579 $ 610
As of January 1, 2018, our unrecognized tax benefits were $579 million. If we had recognized all of these benefits, the net impact on our incometax provision would have been $524 million. Our unrecognized tax benefits were $516 million at December 31, 2018, and if we had recognized all ofthese benefits, the net impact on our income tax provision would have been $463 million. Within the next 12 months, our unrecognized tax benefitscould increase by approximately $40 million due to unfavorable audit developments or decrease by approximately $151 million due to auditsettlements and the expiration of statutes of limitations in various jurisdictions. We include accrued interest and penalties related to uncertain taxpositions in our tax provision. We had accrued interest and penalties of $212 million as of January 1, 2018 and $180 million as of December 31,2018. Our 2018 provision for income taxes included $9 million benefit for interest and penalties.
Our income tax filings are regularly examined by federal, state and non-U.S. tax authorities. U.S. federal, state and non-U.S. jurisdictions havestatutes of limitations generally ranging from three to five years; however, these statutes are often extended by mutual agreement with the taxauthorities. The earliest year still open to examination by U.S. federal and state tax authorities is 2013 and years still open to examination by non-U.S. tax authorities in major jurisdictions include (earliest open tax year in parentheses): Brazil (2013), China (2008), France (2014), India (2005),Switzerland (2014) and the United Kingdom (2015).
116
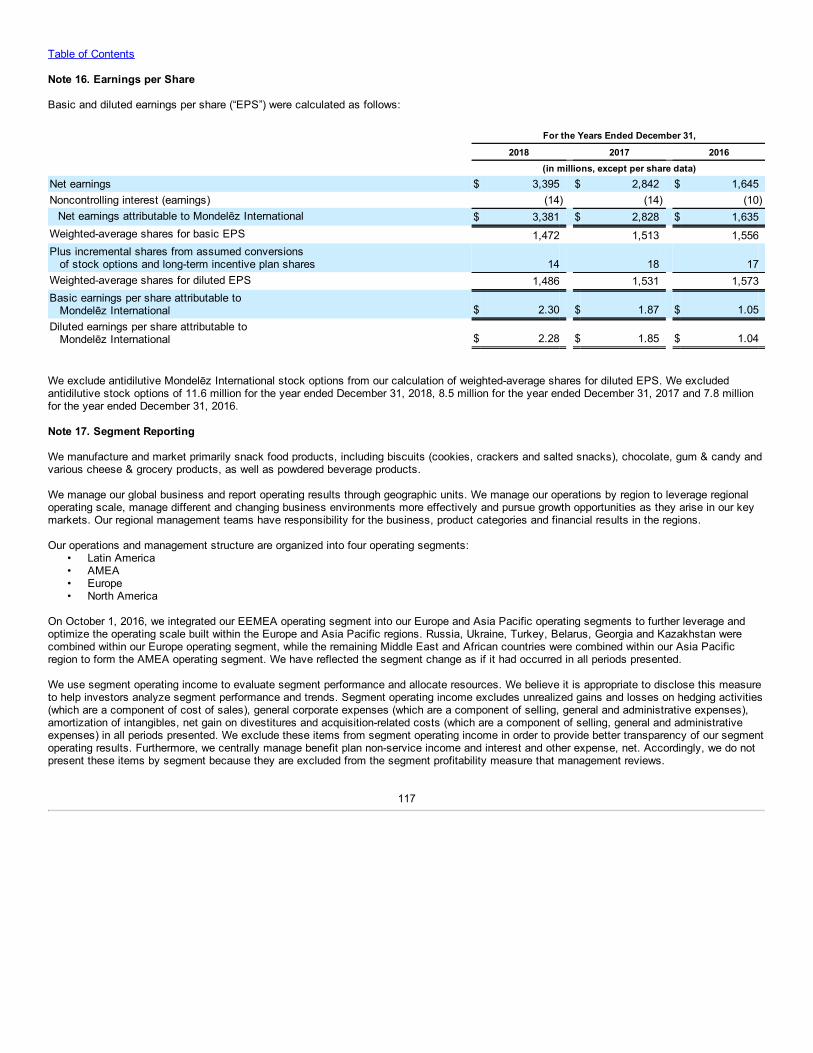
Table of Contents
Note 16. Earnings per Share
Basic and diluted earnings per share (“EPS”) were calculated as follows:
For the Years Ended December 31,
2018 2017 2016 (in millions, except per share data)Net earnings $ 3,395 $ 2,842 $ 1,645Noncontrolling interest (earnings) (14) (14) (10)
Net earnings attributable to Mondelēz International $ 3,381 $ 2,828 $ 1,635Weighted-average shares for basic EPS 1,472 1,513 1,556Plus incremental shares from assumed conversions of stock options and long-term incentive plan shares 14 18 17Weighted-average shares for diluted EPS 1,486 1,531 1,573Basic earnings per share attributable to Mondelēz International $ 2.30 $ 1.87 $ 1.05Diluted earnings per share attributable to Mondelēz International $ 2.28 $ 1.85 $ 1.04
We exclude antidilutive Mondelēz International stock options from our calculation of weighted-average shares for diluted EPS. We excludedantidilutive stock options of 11.6 million for the year ended December 31, 2018, 8.5 million for the year ended December 31, 2017 and 7.8 millionfor the year ended December 31, 2016.
Note 17. Segment Reporting
We manufacture and market primarily snack food products, including biscuits (cookies, crackers and salted snacks), chocolate, gum & candy andvarious cheese & grocery products, as well as powdered beverage products.
We manage our global business and report operating results through geographic units. We manage our operations by region to leverage regionaloperating scale, manage different and changing business environments more effectively and pursue growth opportunities as they arise in our keymarkets. Our regional management teams have responsibility for the business, product categories and financial results in the regions.
Our operations and management structure are organized into four operating segments:• Latin America• AMEA• Europe• North America
On October 1, 2016, we integrated our EEMEA operating segment into our Europe and Asia Pacific operating segments to further leverage andoptimize the operating scale built within the Europe and Asia Pacific regions. Russia, Ukraine, Turkey, Belarus, Georgia and Kazakhstan werecombined within our Europe operating segment, while the remaining Middle East and African countries were combined within our Asia Pacificregion to form the AMEA operating segment. We have reflected the segment change as if it had occurred in all periods presented.
We use segment operating income to evaluate segment performance and allocate resources. We believe it is appropriate to disclose this measureto help investors analyze segment performance and trends. Segment operating income excludes unrealized gains and losses on hedging activities(which are a component of cost of sales), general corporate expenses (which are a component of selling, general and administrative expenses),amortization of intangibles, net gain on divestitures and acquisition-related costs (which are a component of selling, general and administrativeexpenses) in all periods presented. We exclude these items from segment operating income in order to provide better transparency of our segmentoperating results. Furthermore, we centrally manage benefit plan non-service income and interest and other expense, net. Accordingly, we do notpresent these items by segment because they are excluded from the segment profitability measure that management reviews.
117
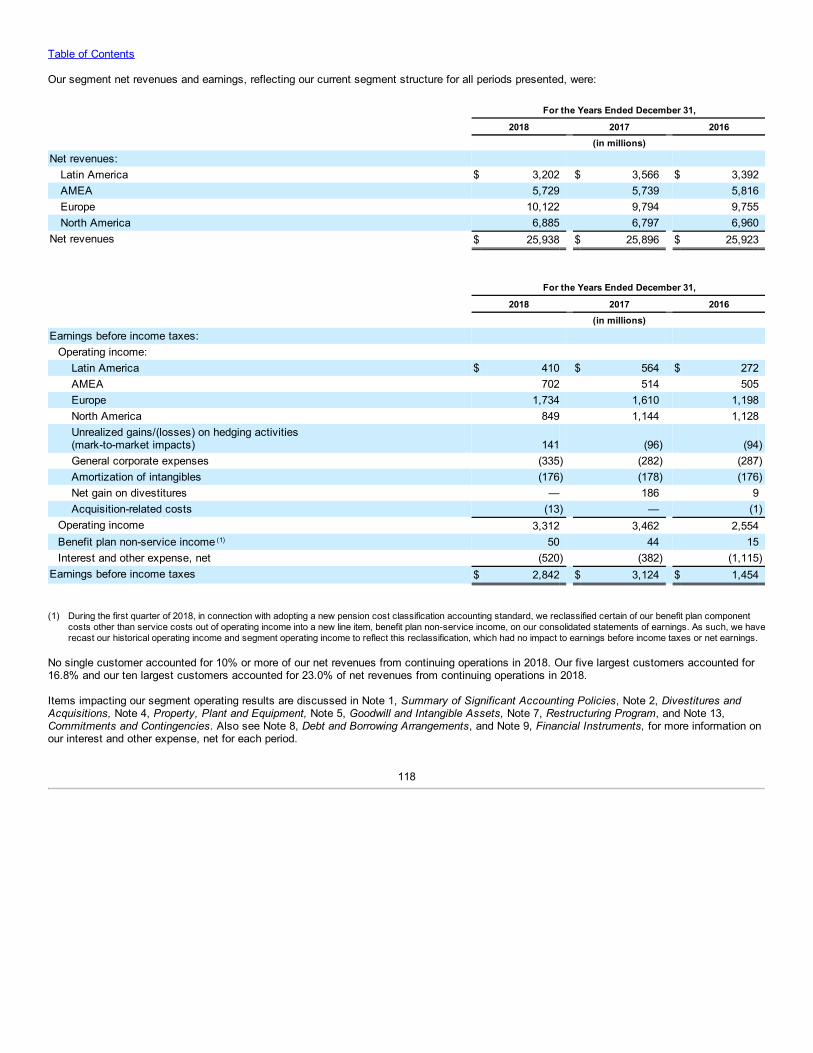
Table of Contents
Our segment net revenues and earnings, reflecting our current segment structure for all periods presented, were:
For the Years Ended December 31,
2018 2017 2016 (in millions)Net revenues:
Latin America $ 3,202 $ 3,566 $ 3,392AMEA 5,729 5,739 5,816Europe 10,122 9,794 9,755North America 6,885 6,797 6,960
Net revenues $ 25,938 $ 25,896 $ 25,923
For the Years Ended December 31,
2018 2017 2016 (in millions)Earnings before income taxes:
Operating income: Latin America $ 410 $ 564 $ 272AMEA 702 514 505Europe 1,734 1,610 1,198North America 849 1,144 1,128Unrealized gains/(losses) on hedging activities(mark-to-market impacts) 141 (96) (94)General corporate expenses (335) (282) (287)Amortization of intangibles (176) (178) (176)Net gain on divestitures — 186 9Acquisition-related costs (13) — (1)
Operating income 3,312 3,462 2,554Benefit plan non-service income (1) 50 44 15Interest and other expense, net (520) (382) (1,115)
Earnings before income taxes $ 2,842 $ 3,124 $ 1,454
(1) During the first quarter of 2018, in connection with adopting a new pension cost classification accounting standard, we reclassified certain of our benefit plan componentcosts other than service costs out of operating income into a new line item, benefit plan non-service income, on our consolidated statements of earnings. As such, we haverecast our historical operating income and segment operating income to reflect this reclassification, which had no impact to earnings before income taxes or net earnings.
No single customer accounted for 10% or more of our net revenues from continuing operations in 2018. Our five largest customers accounted for16.8% and our ten largest customers accounted for 23.0% of net revenues from continuing operations in 2018.
Items impacting our segment operating results are discussed in Note 1, Summary of Significant Accounting Policies, Note 2, Divestitures andAcquisitions, Note 4, Property, Plant and Equipment, Note 5, Goodwill and Intangible Assets, Note 7, Restructuring Program, and Note 13,Commitments and Contingencies. Also see Note 8, Debt and Borrowing Arrangements, and Note 9, Financial Instruments, for more information onour interest and other expense, net for each period.
118
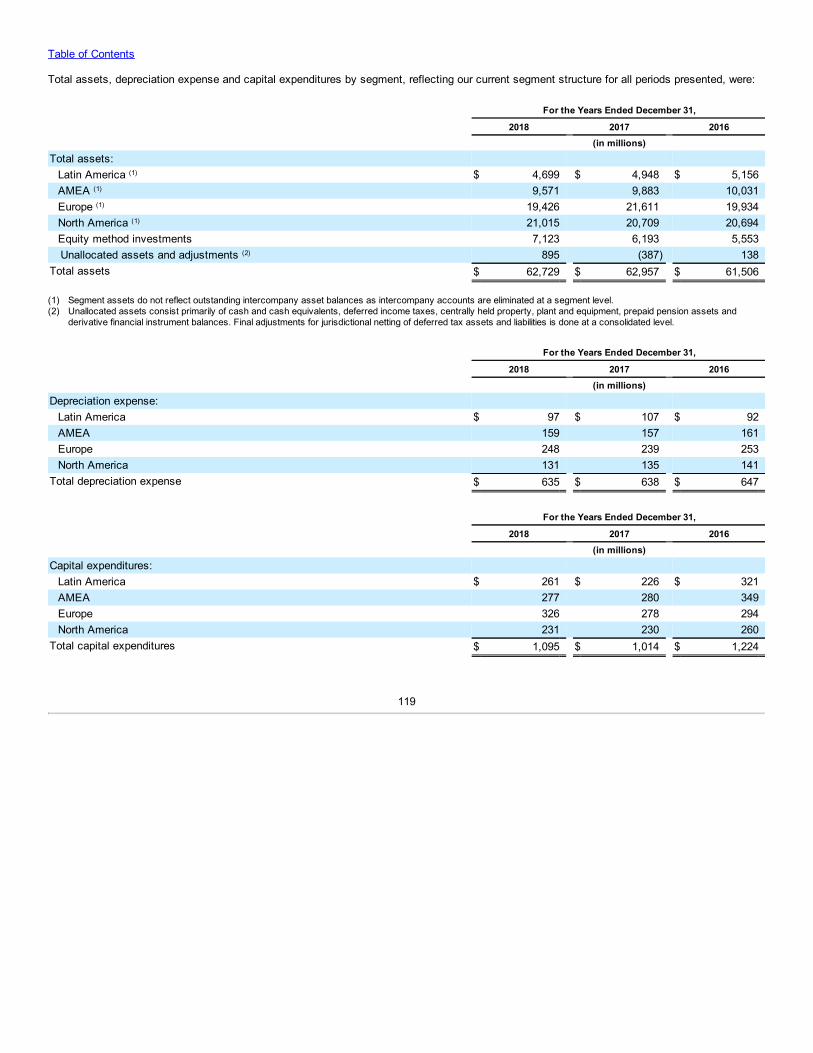
Table of Contents
Total assets, depreciation expense and capital expenditures by segment, reflecting our current segment structure for all periods presented, were:
For the Years Ended December 31,
2018 2017 2016 (in millions)Total assets:
Latin America (1) $ 4,699 $ 4,948 $ 5,156AMEA (1) 9,571 9,883 10,031Europe (1) 19,426 21,611 19,934North America (1) 21,015 20,709 20,694Equity method investments 7,123 6,193 5,553Unallocated assets and adjustments (2) 895 (387) 138
Total assets $ 62,729 $ 62,957 $ 61,506
(1) Segment assets do not reflect outstanding intercompany asset balances as intercompany accounts are eliminated at a segment level.(2) Unallocated assets consist primarily of cash and cash equivalents, deferred income taxes, centrally held property, plant and equipment, prepaid pension assets and
derivative financial instrument balances. Final adjustments for jurisdictional netting of deferred tax assets and liabilities is done at a consolidated level.
For the Years Ended December 31,
2018 2017 2016 (in millions)Depreciation expense:
Latin America $ 97 $ 107 $ 92AMEA 159 157 161Europe 248 239 253North America 131 135 141
Total depreciation expense $ 635 $ 638 $ 647
For the Years Ended December 31,
2018 2017 2016 (in millions)Capital expenditures:
Latin America $ 261 $ 226 $ 321AMEA 277 280 349Europe 326 278 294North America 231 230 260
Total capital expenditures $ 1,095 $ 1,014 $ 1,224
119
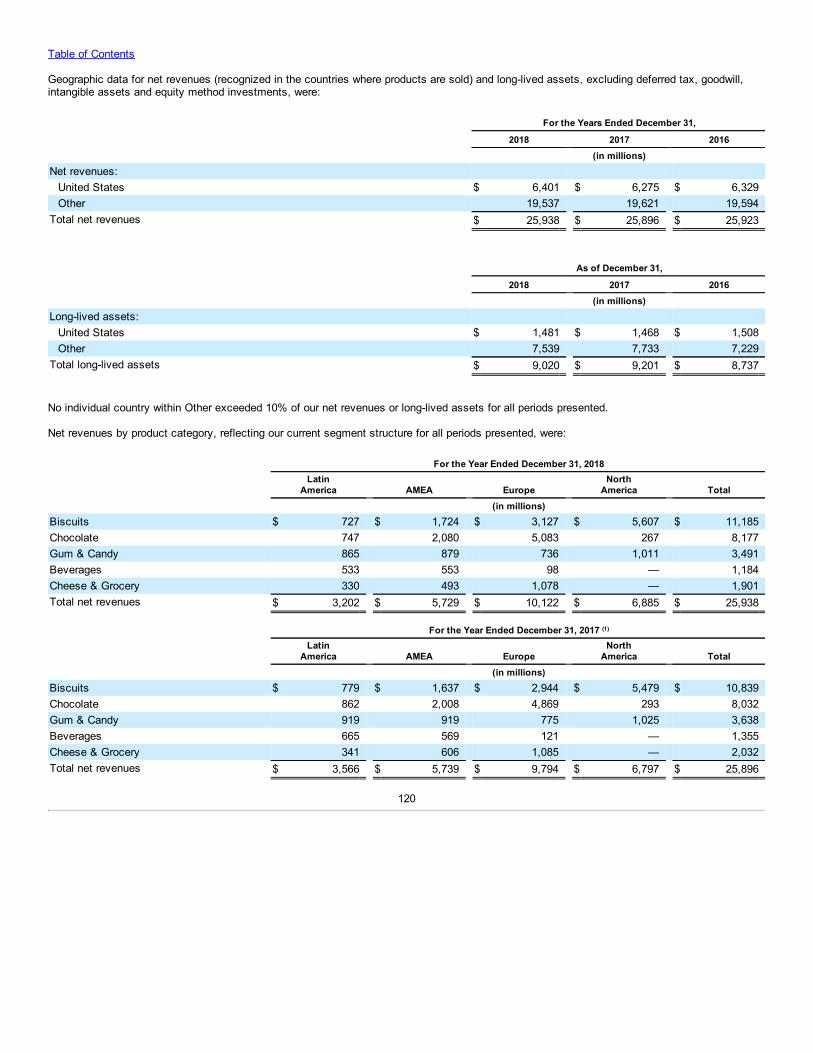
Table of Contents
Geographic data for net revenues (recognized in the countries where products are sold) and long-lived assets, excluding deferred tax, goodwill,intangible assets and equity method investments, were:
For the Years Ended December 31,
2018 2017 2016 (in millions)Net revenues:
United States $ 6,401 $ 6,275 $ 6,329Other 19,537 19,621 19,594
Total net revenues $ 25,938 $ 25,896 $ 25,923
As of December 31,
2018 2017 2016 (in millions)Long-lived assets:
United States $ 1,481 $ 1,468 $ 1,508Other 7,539 7,733 7,229
Total long-lived assets $ 9,020 $ 9,201 $ 8,737
No individual country within Other exceeded 10% of our net revenues or long-lived assets for all periods presented.
Net revenues by product category, reflecting our current segment structure for all periods presented, were:
For the Year Ended December 31, 2018
Latin
America AMEA Europe North
America Total (in millions)Biscuits $ 727 $ 1,724 $ 3,127 $ 5,607 $ 11,185Chocolate 747 2,080 5,083 267 8,177Gum & Candy 865 879 736 1,011 3,491Beverages 533 553 98 — 1,184Cheese & Grocery 330 493 1,078 — 1,901Total net revenues $ 3,202 $ 5,729 $ 10,122 $ 6,885 $ 25,938
For the Year Ended December 31, 2017 (1)
Latin
America AMEA Europe North
America Total (in millions)Biscuits $ 779 $ 1,637 $ 2,944 $ 5,479 $ 10,839Chocolate 862 2,008 4,869 293 8,032Gum & Candy 919 919 775 1,025 3,638Beverages 665 569 121 — 1,355Cheese & Grocery 341 606 1,085 — 2,032Total net revenues $ 3,566 $ 5,739 $ 9,794 $ 6,797 $ 25,896
120
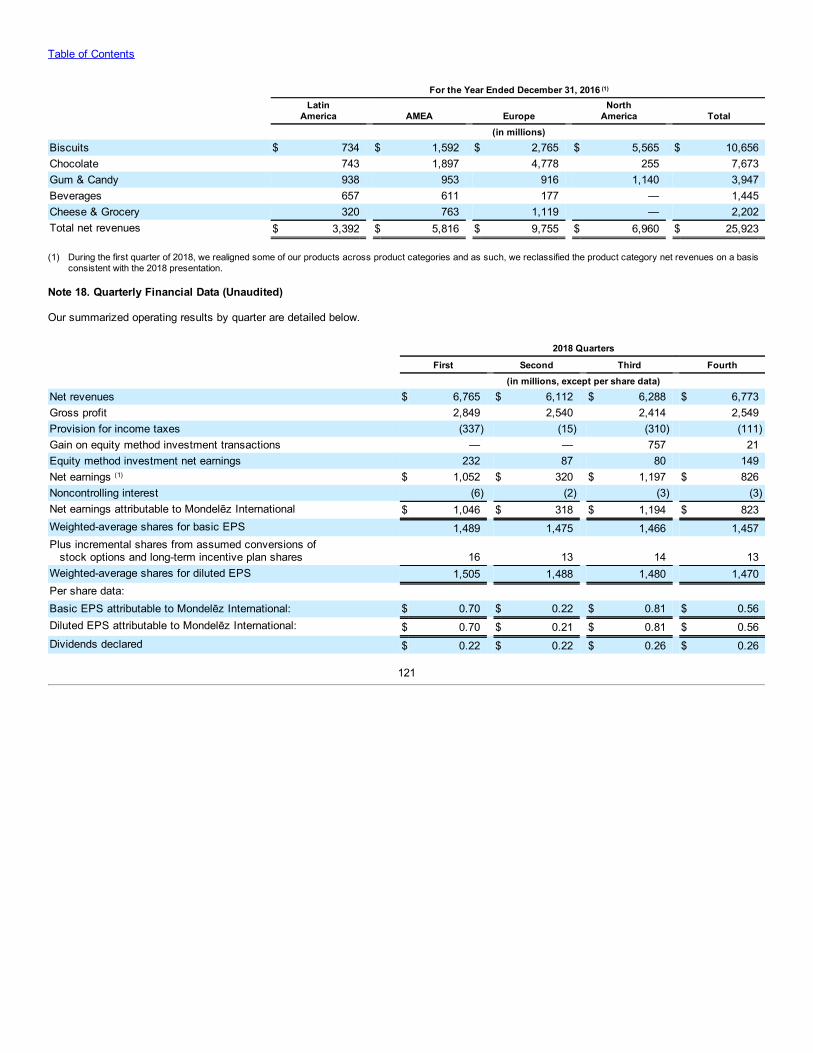
Table of Contents
For the Year Ended December 31, 2016 (1)
Latin
America AMEA Europe North
America Total (in millions)Biscuits $ 734 $ 1,592 $ 2,765 $ 5,565 $ 10,656Chocolate 743 1,897 4,778 255 7,673Gum & Candy 938 953 916 1,140 3,947Beverages 657 611 177 — 1,445Cheese & Grocery 320 763 1,119 — 2,202Total net revenues $ 3,392 $ 5,816 $ 9,755 $ 6,960 $ 25,923 (1) During the first quarter of 2018, we realigned some of our products across product categories and as such, we reclassified the product category net revenues on a basis
consistent with the 2018 presentation.
Note 18. Quarterly Financial Data (Unaudited)
Our summarized operating results by quarter are detailed below.
2018 Quarters
First Second Third Fourth (in millions, except per share data)Net revenues $ 6,765 $ 6,112 $ 6,288 $ 6,773Gross profit 2,849 2,540 2,414 2,549Provision for income taxes (337) (15) (310) (111)Gain on equity method investment transactions — — 757 21Equity method investment net earnings 232 87 80 149Net earnings (1) $ 1,052 $ 320 $ 1,197 $ 826Noncontrolling interest (6) (2) (3) (3)Net earnings attributable to Mondelēz International $ 1,046 $ 318 $ 1,194 $ 823Weighted-average shares for basic EPS 1,489 1,475 1,466 1,457Plus incremental shares from assumed conversions of stock options and long-term incentive plan shares 16 13 14 13Weighted-average shares for diluted EPS 1,505 1,488 1,480 1,470Per share data: Basic EPS attributable to Mondelēz International: $ 0.70 $ 0.22 $ 0.81 $ 0.56Diluted EPS attributable to Mondelēz International: $ 0.70 $ 0.21 $ 0.81 $ 0.56Dividends declared $ 0.22 $ 0.22 $ 0.26 $ 0.26
121
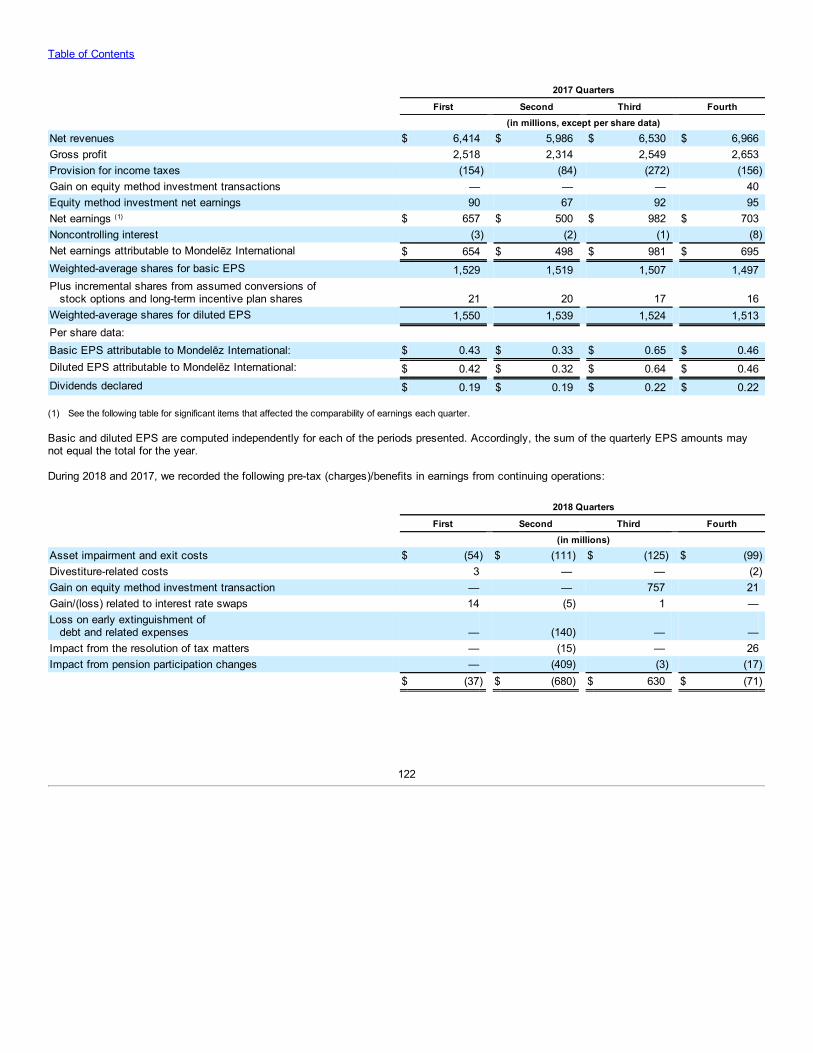
Table of Contents
2017 Quarters
First Second Third Fourth (in millions, except per share data)Net revenues $ 6,414 $ 5,986 $ 6,530 $ 6,966Gross profit 2,518 2,314 2,549 2,653Provision for income taxes (154) (84) (272) (156)Gain on equity method investment transactions — — — 40Equity method investment net earnings 90 67 92 95Net earnings (1) $ 657 $ 500 $ 982 $ 703Noncontrolling interest (3) (2) (1) (8)Net earnings attributable to Mondelēz International $ 654 $ 498 $ 981 $ 695Weighted-average shares for basic EPS 1,529 1,519 1,507 1,497Plus incremental shares from assumed conversions of stock options and long-term incentive plan shares 21 20 17 16Weighted-average shares for diluted EPS 1,550 1,539 1,524 1,513Per share data: Basic EPS attributable to Mondelēz International: $ 0.43 $ 0.33 $ 0.65 $ 0.46Diluted EPS attributable to Mondelēz International: $ 0.42 $ 0.32 $ 0.64 $ 0.46Dividends declared $ 0.19 $ 0.19 $ 0.22 $ 0.22
(1) See the following table for significant items that affected the comparability of earnings each quarter.
Basic and diluted EPS are computed independently for each of the periods presented. Accordingly, the sum of the quarterly EPS amounts maynot equal the total for the year.
During 2018 and 2017, we recorded the following pre-tax (charges)/benefits in earnings from continuing operations:
2018 Quarters
First Second Third Fourth (in millions)Asset impairment and exit costs $ (54) $ (111) $ (125) $ (99)Divestiture-related costs 3 — — (2)Gain on equity method investment transaction — — 757 21Gain/(loss) related to interest rate swaps 14 (5) 1 —Loss on early extinguishment of debt and related expenses — (140) — —Impact from the resolution of tax matters — (15) — 26Impact from pension participation changes — (409) (3) (17) $ (37) $ (680) $ 630 $ (71)
122
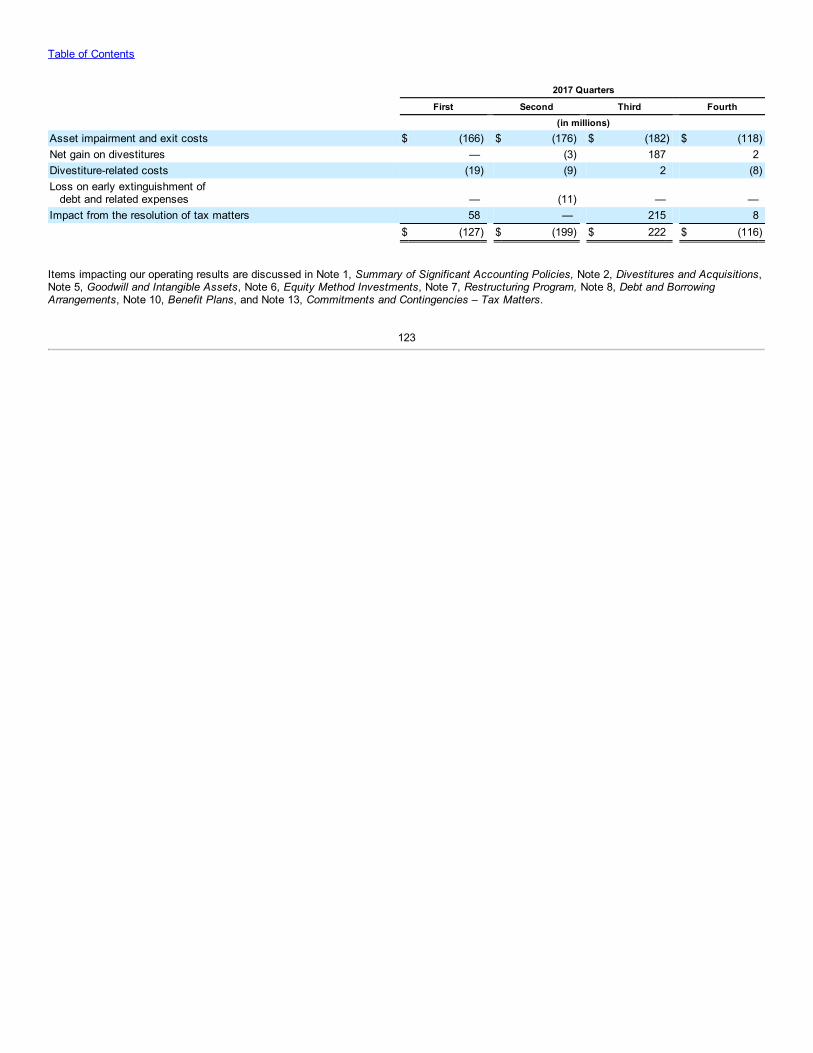
Table of Contents
2017 Quarters
First Second Third Fourth (in millions)Asset impairment and exit costs $ (166) $ (176) $ (182) $ (118)Net gain on divestitures — (3) 187 2Divestiture-related costs (19) (9) 2 (8)Loss on early extinguishment of debt and related expenses — (11) — —Impact from the resolution of tax matters 58 — 215 8 $ (127) $ (199) $ 222 $ (116)
Items impacting our operating results are discussed in Note 1, Summary of Significant Accounting Policies, Note 2, Divestitures and Acquisitions,Note 5, Goodwill and Intangible Assets, Note 6, Equity Method Investments, Note 7, Restructuring Program, Note 8, Debt and BorrowingArrangements, Note 10, Benefit Plans, and Note 13, Commitments and Contingencies – Tax Matters.
123
Table of Contents
Item 9. Changes in and Disagreements with Accountants on Accounting and Financial Disclosure.
None.
Item 9A. Controls and Procedures.
Evaluation of Disclosure Controls and Procedures
We have established disclosure controls and procedures that are designed to ensure that information required to be disclosed in our reports filed orsubmitted under the Exchange Act is recorded, processed, summarized and reported within the time periods specified in the rules and forms of theSEC, and such information is accumulated and communicated to our management, including our Chief Executive Officer (“CEO”) and ChiefFinancial Officer (“CFO”), as appropriate to allow timely decisions regarding required disclosure. Management, together with our CEO and CFO,evaluated the effectiveness of the Company’s disclosure controls and procedures as of December 31, 2018. Based on this evaluation, the CEOand CFO concluded that our disclosure controls and procedures were effective as of December 31, 2018.
Report of Management on Internal Control Over Financial Reporting
Management is responsible for establishing and maintaining adequate internal control over financial reporting as defined in Rules 13a-15(f) and15d-15(f) under the Exchange Act. Our internal control over financial reporting is a process designed by, or under the supervision of, our CEO andCFO, or persons performing similar functions, and effected by the Company’s Board of Directors, management and other personnel to providereasonable assurance regarding the reliability of financial reporting and the preparation of financial statements for external purposes in accordancewith generally accepted accounting principles. Our internal control over financial reporting includes those written policies and procedures that:
• pertain to the maintenance of records that, in reasonable detail, accurately and fairly reflect the transactions and dispositions of assets;• provide reasonable assurance that transactions are recorded as necessary to permit preparation of financial statements in accordance with
generally accepted accounting principles;• provide reasonable assurance that receipts and expenditures are being made only in accordance with management and director
authorization; and• provide reasonable assurance regarding prevention or timely detection of unauthorized acquisition, use or disposition of assets that could
have a material effect on the consolidated financial statements.
Because of its inherent limitations, internal control over financial reporting may not prevent or detect misstatements. Also, projections of anyevaluation of effectiveness to future periods are subject to the risk that controls may become inadequate because of changes in conditions, or thatthe degree of compliance with the policies or procedures may deteriorate.
Management assessed the effectiveness of our internal control over financial reporting as of December 31, 2018. Management based thisassessment on criteria for effective internal control over financial reporting described in Internal Control Integrated Framework (2013) issued by theCommittee of Sponsoring Organizations of the Treadway Commission (“COSO”).
Based on this assessment, management concluded that the Company’s internal control over financial reporting is effective as of December 31,2018, based on the criteria in Internal Control Integrated Framework issued by the COSO.
PricewaterhouseCoopers LLP, an independent registered public accounting firm, has audited the effectiveness of our internal control over financialreporting as of December 31, 2018, as stated in their report that appears under Item 8.
February 8, 2019
124
Table of Contents
Changes in Internal Control Over Financial Reporting
Management, together with our CEO and CFO, evaluated the changes in our internal control over financial reporting during the quarter endedDecember 31, 2018. We continued to transition some of our transactional data processing as well as financial and contract management servicesfor a number of countries across all regions to outsourced partners. Pursuant to our service agreements, the controls previously establishedaround these accounting functions will be maintained by our outsourced partners or by us, and they are subject to management’s internal controltesting. We also continued to refine information technology security measures and business process controls. There were no other changes in ourinternal control over financial reporting during the quarter ended December 31, 2018, that have materially affected, or are reasonably likely tomaterially affect, our internal control over financial reporting.
Item 9B. Other Information.
None.
125
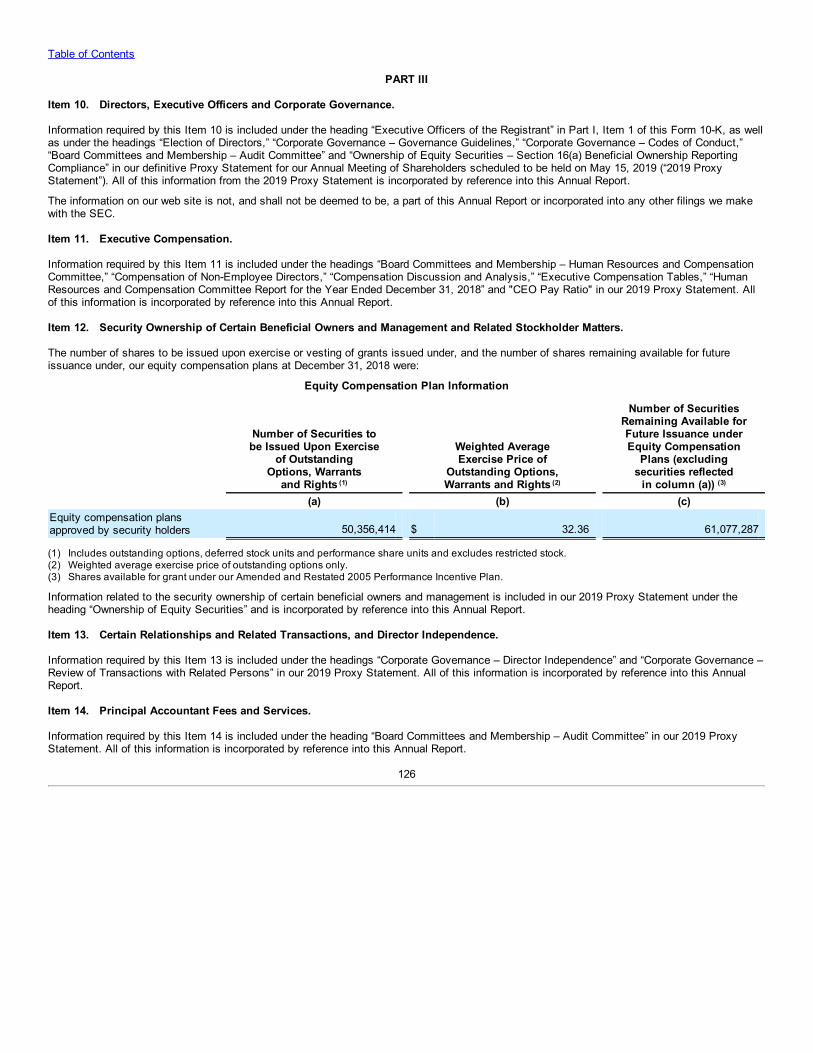
Table of Contents
PART III
Item 10. Directors, Executive Officers and Corporate Governance.
Information required by this Item 10 is included under the heading “Executive Officers of the Registrant” in Part I, Item 1 of this Form 10-K, as wellas under the headings “Election of Directors,” “Corporate Governance – Governance Guidelines,” “Corporate Governance – Codes of Conduct,”“Board Committees and Membership – Audit Committee” and “Ownership of Equity Securities – Section 16(a) Beneficial Ownership ReportingCompliance” in our definitive Proxy Statement for our Annual Meeting of Shareholders scheduled to be held on May 15, 2019 (“2019 ProxyStatement”). All of this information from the 2019 Proxy Statement is incorporated by reference into this Annual Report.
The information on our web site is not, and shall not be deemed to be, a part of this Annual Report or incorporated into any other filings we makewith the SEC.
Item 11. Executive Compensation.
Information required by this Item 11 is included under the headings “Board Committees and Membership – Human Resources and CompensationCommittee,” “Compensation of Non-Employee Directors,” “Compensation Discussion and Analysis,” “Executive Compensation Tables,” “HumanResources and Compensation Committee Report for the Year Ended December 31, 2018” and "CEO Pay Ratio" in our 2019 Proxy Statement. Allof this information is incorporated by reference into this Annual Report.
Item 12. Security Ownership of Certain Beneficial Owners and Management and Related Stockholder Matters.
The number of shares to be issued upon exercise or vesting of grants issued under, and the number of shares remaining available for futureissuance under, our equity compensation plans at December 31, 2018 were:
Equity Compensation Plan Information
Number of Securities tobe Issued Upon Exercise
of OutstandingOptions, Warrants
and Rights (1)
Weighted AverageExercise Price of
Outstanding Options,Warrants and Rights (2)
Number of SecuritiesRemaining Available forFuture Issuance underEquity Compensation
Plans (excludingsecurities reflected
in column (a)) (3)
(a) (b) (c)Equity compensation plansapproved by security holders 50,356,414 $ 32.36 61,077,287 (1) Includes outstanding options, deferred stock units and performance share units and excludes restricted stock.(2) Weighted average exercise price of outstanding options only.(3) Shares available for grant under our Amended and Restated 2005 Performance Incentive Plan.
Information related to the security ownership of certain beneficial owners and management is included in our 2019 Proxy Statement under theheading “Ownership of Equity Securities” and is incorporated by reference into this Annual Report.
Item 13. Certain Relationships and Related Transactions, and Director Independence.
Information required by this Item 13 is included under the headings “Corporate Governance – Director Independence” and “Corporate Governance –Review of Transactions with Related Persons” in our 2019 Proxy Statement. All of this information is incorporated by reference into this AnnualReport.
Item 14. Principal Accountant Fees and Services.
Information required by this Item 14 is included under the heading “Board Committees and Membership – Audit Committee” in our 2019 ProxyStatement. All of this information is incorporated by reference into this Annual Report.
126
Table of Contents
PART IV
Item 15. Exhibits and Financial Statement Schedules. (a) Index to Consolidated Financial Statements and Schedules
PageReport of Independent Registered Public Accounting Firm 64Consolidated Statements of Earnings for the Years Ended December 31, 2018, 2017 and 2016 66Consolidated Statements of Comprehensive Earnings for the Years Ended December 31, 2018, 2017 and 2016 67Consolidated Balance Sheets as of December 31, 2018 and 2017 68Consolidated Statements of Equity for the Years Ended December 31, 2018, 2017 and 2016 69Consolidated Statements of Cash Flows for the Years Ended December 31, 2018, 2017 and 2016 70Notes to Consolidated Financial Statements 71Financial Statement Schedule-Valuation and Qualifying Accounts S-1
Schedules other than those listed above have been omitted either because such schedules are not required or are not applicable. (b) The following exhibits are filed as part of, or incorporated by reference into, this Annual Report:
2.1 Separation and Distribution Agreement between the Registrant and Kraft Foods Group, Inc., dated as of September 27, 2012(incorporated by reference to Exhibit 2.1 to the Registrant’s Current Report on Form 8-K filed with the SEC on October 1, 2012).*
2.2 Canadian Asset Transfer Agreement, by and between Mondelez Canada Inc. and Kraft Canada Inc., dated as of September 29,2012 (incorporated by reference to Exhibit 2.3 to the Registrant’s Annual Report on Form 10-K filed with the SEC onFebruary 25, 2013).*
2.3 Master Ownership and License Agreement Regarding Patents, Trade Secrets and Related Intellectual Property, among KraftFoods Global Brands LLC, Kraft Foods Group Brands LLC, Kraft Foods UK Ltd. and Kraft Foods R&D Inc., dated as ofOctober 1, 2012 (incorporated by reference to Exhibit 10.3 to the Registrant’s Current Report on Form 8-K filed with the SEC onOctober 1, 2012).*
2.4 Master Ownership and License Agreement Regarding Trademarks and Related Intellectual Property, by and between KraftFoods Global Brands LLC and Kraft Foods Group Brands LLC., dated as of September 27, 2012 (incorporated by reference toExhibit 10.4 to the Registrant’s Current Report on Form 8-K filed with the SEC on October 1, 2012).*
2.5 First Amendment to the Master Ownership and License Agreement Regarding Trademarks and Related Intellectual Property,among Intercontinental Great Brands LLC and Kraft Foods Group Brands LLC, dated as of July 15, 2013 (incorporated byreference to Exhibit 2.1 to the Registrant’s Quarterly Report on Form 10-Q filed with the SEC on April 30, 2015).*
2.6 Second Amendment to the Master Ownership and License Agreement Regarding Trademarks and Related Intellectual Property,among Intercontinental Great Brands LLC and Kraft Foods Group Brands LLC, dated as of October 1, 2014 (incorporated byreference to Exhibit 2.2 to the Registrant’s Quarterly Report on Form 10-Q filed with the SEC on April 30, 2015).*
2.7 Amendment to the Master Ownership and License Agreement Regarding Trademarks and Related Intellectual Property, amongIntercontinental Great Brands LLC and Kraft Foods Group Brands LLC, effective as of September 28, 2016 (incorporated byreference to Exhibit 2.1 to the Registrant’s Quarterly Report on Form 10-Q filed with the SEC on August 2, 2017).
3.1 Amended and Restated Articles of Incorporation of the Registrant, effective March 14, 2013 (incorporated by reference to Exhibit3.1 to the Registrant’s Quarterly Report on Form 10-Q filed with the SEC on May 8, 2013).
3.2 Amended and Restated By-Laws of the Registrant, effective as of October 9, 2015 (incorporated by reference to Exhibit 3.1 tothe Registrant’s Current Report on Form 8-K filed with the SEC on October 7, 2015).
4.1 The Registrant agrees to furnish to the SEC upon request copies of any instruments defining the rights of holders of long-termdebt of the Registrant and its consolidated subsidiaries that does not exceed 10 percent of the total assets of the Registrant andits consolidated subsidiaries.
127
Table of Contents
4.2 Indenture, by and between the Registrant and Deutsche Bank Trust Company Americas (as successor trustee to The Bank ofNew York and The Chase Manhattan Bank), dated as of October 17, 2001 (incorporated by reference to Exhibit 4.1 to theRegistrant’s Registration Statement on Form S-3 (Reg. No. 333-86478) filed with the SEC on April 18, 2002).
4.3 Supplemental Indenture, by and between the Registrant and Deutsche Bank Trust Company Americas, Deutsche Bank AG,London Branch and Deutsche Bank Luxembourg S.A., dated as of December 11, 2013 (incorporated by reference to Exhibit 4.2to the Registrant’s Current Report on Form 8-K filed with the SEC on December 11, 2013).
4.4 Indenture between the Registrant and Deutsche Bank Trust Company Americas, as trustee, dated as of March 6, 2015(incorporated by reference to Exhibit 4.4 to the Registrant’s Annual Report on Form 10-K filed with the SEC on February 24,2017).
4.5 Indenture, by and between Mondelez International Holdings Netherlands B.V, the Registrant and Deutsche Bank Trust CompanyAmericas, dated as of October 28, 2016 (incorporated by reference to Exhibit 4.1 to the Registrant’s Current Report on Form 8-K filed with the SEC on October 28, 2016).
10.1 $4.5 Billion Amended and Restated Five-Year Revolving Credit Agreement, by and among the Registrant, the initial lendersnamed therein, and JPMorgan Chase Bank, N.A. as administrative agent, dated October 14, 2016 (incorporated by reference toExhibit 10.1 to the Registrant’s Annual Report on Form 10-K filed with the SEC on February 24, 2017).
10.2 $1.5 Billion Term Loan Agreement, by and among Mondelēz International Holdings Netherlands B.V., the Registrant, the lendersnamed therein and JPMorgan Chase Bank, N.A., as administrative agent, dated October 14, 2016 (incorporated by reference toExhibit 10.2 to the Registrant’s Annual Report on Form 10-K filed with the SEC on February 24, 2017).
10.3 $1.5 Billion Revolving Credit Agreement, dated March 1, 2017, by and among the Registrant, the lenders, arrangers and agentsnamed therein and JPMorgan Chase Bank, N.A., as Administrative Agent (incorporated by reference to Exhibit 10.1 to theRegistrant’s Current Report on Form 8-K filed with the SEC on March 1, 2017).
10.4
$1.5 Billion Revolving Credit Agreement, dated February 28, 2018, by and among Mondelēz International, Inc., the lenders,arrangers and agents named therein and JPMorgan Chase Bank, N.A., as Administrative Agent (incorporated by reference toExhibit 10.1 to the Registrant’s Current Report on Form 8-K filed with the SEC on March 1, 2018).
10.5
Revolving Credit Agreement, dated April 2, 2018, by and among Mondelēz International, Inc., the lenders, arrangers and agentsnamed therein and Citibank, N.A., as Administrative Agent (incorporated by reference to Exhibit 10.1 to the Registrant’s CurrentReport on Form 8-K filed with the SEC on April 2, 2018).
10.6 Tax Sharing and Indemnity Agreement, by and between the Registrant and Kraft Foods Group, Inc., dated as of September 27,2012 (incorporated by reference to Exhibit 10.1 to the Registrant’s Current Report on Form 8-K filed with the SEC on October 1,2012).
10.7 Global Contribution Agreement by and among Mondelēz International Holdings, LLC, Acorn Holdings B.V., Charger Top HoldCoB.V. and Charger OpCo B.V., dated May 7, 2014 (incorporated by reference to Exhibit 10.1 to the Registrant’s Quarterly Reporton Form 10-Q filed with the SEC on August 8, 2014).**
10.8 Amendment Agreement to Global Contribution Agreement by and among Mondelēz International Holdings LLC, Acorn HoldingsB.V., Jacobs Douwe Egberts B.V. (formerly Charger Top HoldCo B.V.) and Jacobs Douwe Egberts International B.V. (formerlyCharger OpCo B.V.), dated July 28, 2015 (incorporated by reference to Exhibit 10.3 to the Registrant’s Quarterly Report onForm 10-Q filed with the SEC on July 31, 2015).**
10.9 Amended and Restated Shareholders’ Agreement Relating to Charger Top Holdco B.V. by and among Delta Charger HoldcoB.V., JDE Minority Holdings B.V., Mondelēz Coffee Holdco B.V. and Jacobs Douwe Egberts B.V., dated March 7, 2016(incorporated by reference to Exhibit 10.1 to the Registrant’s Quarterly Report on Form 10-Q filed with the SEC on April 28,2016).**
10.10 Shareholders’ Agreement Relating to Maple Parent Holdings Corp. by and among Maple Holdings II B.V., MondelēzInternational Holdings LLC and Maple Parent Holdings Corp., dated March 7, 2016 (incorporated by reference to Exhibit 10.2 tothe Registrant’s Quarterly Report on Form 10-Q filed with the SEC on April 28, 2016).**
10.11
Investor Rights Agreement by and among Keurig Dr Pepper Inc., Maple Holdings B.V. and Mondelēz International HoldingsLLC, dated July 9, 2018 (incorporated by reference to Exhibit 10.1 to the Registrant’s Current Report on Form 8-K filed with theSEC on July 10, 2018).
10.12
Second Amended and Restated Shareholders’ Agreement Relating to Jacobs Douwe Egberts B.V. by and among Delta ChargerHoldco B.V., JDE Minority Holdings B.V., Mondelēz Coffee Holdco B.V. and Jacobs Douwe Egberts B.V., dated July 9, 2018(incorporated by reference to Exhibit 10.2 to the Registrant’s Current Report on Form 8-K filed with the SEC on July 10, 2018).**
128
Table of Contents
10.13
Amendment and Termination Agreement of the Shareholders’ Agreement Relating to Maple Parent Holdings Corp. by andamong Maple Holdings B.V., Mondelēz International Holdings LLC and Maple Parent Holdings Corp., dated July 9, 2018(incorporated by reference to Exhibit 10.3 to the Registrant’s Current Report on Form 8-K filed with the SEC on July 10, 2018).
10.14 Settlement Agreement, between the Registrant and Kraft Foods Group, Inc., dated June 22, 2015 (incorporated by reference toExhibit 10.2 to the Registrant’s Quarterly Report on Form 10-Q filed with the SEC on July 31, 2015).
10.15 Mondelēz International, Inc. Amended and Restated 2005 Performance Incentive Plan, amended and restated as of February 3,2017 (incorporated by reference to Exhibit 10.2 to the Registrant’s Quarterly Report on Form 10-Q filed with the SEC on May 3,2017).+
10.16
Form of Mondelēz International, Inc. Amended and Restated 2005 Performance Incentive Plan Non- Qualified Global StockOption Agreement (incorporated by reference to Exhibit 10.6 to the Registrant’s Quarterly Report on Form 10-Q filed with theSEC on April 28, 2016).+
10.17 Form of Mondelēz International, Inc. Amended and Restated 2005 Performance Incentive Plan Non-Qualified Global StockOption Agreement (incorporated by reference to Exhibit 10.3 to the Registrant’s Quarterly Report on Form 10-Q filed with theSEC on May 3, 2017).+
10.18
Form of Mondelēz International, Inc. Amended and Restated 2005 Performance Incentive Plan Non-Qualified Global StockOption Agreement (incorporated by reference to Exhibit 10.2 to the Registrant’s Quarterly Report on Form 10-Q filed with theSEC on May 2, 2018).+
10.19
Form of Mondelēz International, Inc. Amended and Restated 2005 Performance Incentive Plan Global Long-Term IncentiveGrant Agreement (incorporated by reference to Exhibit 10.7 to the Registrant’s Quarterly Report on Form 10-Q filed with theSEC on April 28, 2016).+
10.20 Form of Mondelēz International, Inc. Amended and Restated 2005 Performance Incentive Plan Global Long-Term IncentiveGrant Agreement (incorporated by reference to Exhibit 10.4 to the Registrant’s Quarterly Report on Form 10-Q filed with theSEC on May 3, 2017).+
10.21
Form of Mondelēz International, Inc. Amended and Restated 2005 Performance Incentive Plan Global Long-Term IncentiveGrant Agreement (incorporated by reference to Exhibit 10.3 to the Registrant’s Quarterly Report on Form 10-Q filed with theSEC on May 2, 2018).+
10.22
Form of Mondelēz International, Inc. Amended and Restated 2005 Performance Incentive Plan Global Deferred Stock UnitAgreement (incorporated by reference to Exhibit 10.5 to the Registrant’s Quarterly Report on Form 10-Q filed with the SEC onApril 28, 2016).+
10.23 Form of Mondelēz International, Inc. Amended and Restated 2005 Performance Incentive Plan Global Deferred Stock UnitAgreement (incorporated by reference to Exhibit 10.13 to the Registrant’s Annual Report on Form 10-K filed with the SEC onFebruary 9, 2018).+
10.24
Form of Mondelēz International, Inc. Amended and Restated 2005 Performance Incentive Plan Global Deferred Stock UnitAgreement (incorporated by reference to Exhibit 10.4 to the Registrant’s Quarterly Report on Form 10-Q filed with the SEC onMay 2, 2018).+
10.25 Mondelēz Global LLC Supplemental Benefits Plan I, effective as of September 1, 2012 (incorporated by reference to Exhibit10.10 to the Registrant’s Annual Report on Form 10-K filed with the SEC on February 25, 2013).+
10.26 First Amendment to the Mondelēz Global LLC Supplemental Benefits Plan I, dated December 20, 2016.+10.27 Mondelēz Global LLC Supplemental Benefits Plan II, effective as of September 1, 2012 (incorporated by reference to Exhibit
10.11 to the Registrant’s Annual Report on Form 10-K filed with the SEC on February 25, 2013).+10.28 First Amendment to the Mondelēz Global LLC Supplemental Benefits Plan II, dated December 20, 2016.+10.29 Form of Mondelēz Global LLC Amended and Restated Cash Enrollment Agreement (incorporated by reference to Exhibit 10.12
to the Registrant’s Annual Report on Form 10-K filed with the SEC on February 25, 2013).+10.30 Form of Mondelēz Global LLC Amended and Restated Employee Grantor Trust Enrollment Agreement (incorporated by
reference to Exhibit 10.13 to the Registrant’s Annual Report on Form 10-K filed with the SEC on February 25, 2013).+10.31 Mondelēz International, Inc. Amended and Restated 2006 Stock Compensation Plan for Non-Employee Directors, amended and
restated as of October 1, 2012 (incorporated by reference to Exhibit 10.14 to the Registrant’s Annual Report on Form 10-K filedwith the SEC on February 25, 2013).+
10.32 Mondelēz International, Inc. 2001 Compensation Plan for Non-Employee Directors, amended as of December 31, 2008 andrestated as of January 1, 2013 (incorporated by reference to Exhibit 10.15 to the Registrant’s Annual Report on Form 10-K filedwith the SEC on February 25, 2013).+
129
Table of Contents
10.33 Mondelēz International, Inc. Change in Control Plan for Key Executives, amended February 2, 2017 (incorporated by referenceto Exhibit 10.5 to the Registrant’s Quarterly Report on Form 10-Q filed with the SEC on May 3, 2017).+
10.34 Mondelēz Global LLC Executive Deferred Compensation Plan, effective as of October 1, 2012 (incorporated by reference toExhibit 10.17 to the Registrant’s Annual Report on Form 10-K filed with the SEC on February 25, 2013).+
10.35 Mondelēz Global LLC Executive Deferred Compensation Plan Adoption Agreement, effective as of October 1, 2012(incorporated by reference to Exhibit 10.18 to the Registrant’s Annual Report on Form 10-K filed with the SEC on February 25,2013).+
10.36 Deferred Compensation Plan Trust Document, by and between Mondelēz Global LLC and Wilmington Trust Retirement andInstitutional Services Company, dated as of September 18, 2012 (incorporated by reference to Exhibit 10.19 to the Registrant’sAnnual Report on Form 10-K filed with the SEC on February 25, 2013).+
10.37
Kraft Foods Deutschland Pension Scheme Supplementary Benefits 2005/ Deferral (Non-Qualified Deferred Compensation Plan)(English translation), effective as of September 1, 2005 (incorporated by reference to Exhibit 10.2 to the Registrant’s QuarterlyReport on Form 10-Q filed with the SEC on July 26, 2018).+
10.38
Annex to Kraft Foods Deutschland Pension Scheme Supplementary Benefits 2005/ Deferral (Non-Qualified DeferredCompensation Plan), effective as of January 1, 2013 (incorporated by reference to Exhibit 10.3 to the Registrant’s QuarterlyReport on Form 10-Q filed with the SEC on July 26, 2018).+
10.39 Offer of Employment Letter, between the Registrant and Dirk Van de Put, dated July 27, 2017 (incorporated by reference toExhibit 10.1 to the Registrant’s Current Report on Form 8-K filed with the SEC on August 2, 2017).+
10.40 Offer of Employment Letter, between the Registrant and Irene B. Rosenfeld, dated June 22, 2006 (incorporated by reference toExhibit 10.29 to the Registrant’s Quarterly Report on Form 10-Q filed with the SEC on August 8, 2006).+
10.41 Amendment to Offer of Employment Letter, between the Registrant and Irene B. Rosenfeld, amended as of December 31, 2008(incorporated by reference to Exhibit 10.20 to the Registrant’s Annual Report on Form 10-K filed with the SEC on February 27,2009).+
10.42 Offer of Employment Letter, between the Registrant and Daniel P. Myers, dated June 20, 2011 (incorporated by reference toExhibit 10.1 to the Registrant’s Quarterly Report on Form 10-Q filed with the SEC on November 4, 2011).+
10.43 Offer of Employment Letter, between Mondelēz Global LLC and Brian T. Gladden, dated September 26, 2014 (incorporated byreference to Exhibit 10.1 to the Registrant’s Current Report on Form 8-K filed with the SEC on October 9, 2014).+
10.44 Offer of Employment Letter, between Mondelēz Global LLC and Glen Walter, dated October 15, 2017 (incorporated by referenceto Exhibit 10.31 to the Registrant’s Annual Report on Form 10-K filed with the SEC on February 9, 2018).+
10.45
Employment Letter (English Translation), between Kraft Foods Europe and Hubert Weber, dated August 11, 2010 (incorporatedby reference to Exhibit 10.4 to the Registrant’s Quarterly Report on Form 10-Q filed with the SEC on July 26, 2018).+
10.46
Employment Letter, between Mondelēz Global LLC and Gerhard Pleuhs, dated August 23, 2016 (incorporated by reference toExhibit 10.5 to the Registrant’s Quarterly Report on Form 10-Q filed with the SEC on July 26, 2018).+
10.47
Offer of Employment Letter, between Mondelēz Global LLC and Paulette Alviti, dated April 12, 2018 (incorporated by referenceto Exhibit 10.6 to the Registrant’s Quarterly Report on Form 10-Q filed with the SEC on July 26, 2018).+
10.48
International Permanent Transfer Letter, between Mondelēz Global LLC and Luca Zaramella, effective August 1, 2018(incorporated by reference to Exhibit 10.1 to the Registrant’s Current Report on Form 8-K filed with the SEC on August 7,2018).+
10.49 Retirement Agreement and General Release, between Mondelēz International Holdings LLC and Gustavo H. Abelenda, dated asof December 31, 2016 (incorporated by reference to Exhibit 10.30 to the Registrant’s Annual Report on Form 10-K filed with theSEC on February 24, 2017).+
10.50 Separation Agreement and General Release, between Mondelēz Global LLC and Roberto de Oliveira Marques, dated May 24,2017 (incorporated by reference to Exhibit 10.1 to the Registrant’s Current Report on Form 8-K filed with the SEC on May 26,2017).+
10.51
Retirement Letter, between Mondelēz International, Inc. and Irene B. Rosenfeld, effective April 30, 2018 (incorporated byreference to Exhibit 10.1 to the Registrant’s Current Report on Form 8-K filed with the SEC on May 4, 2018).+
130
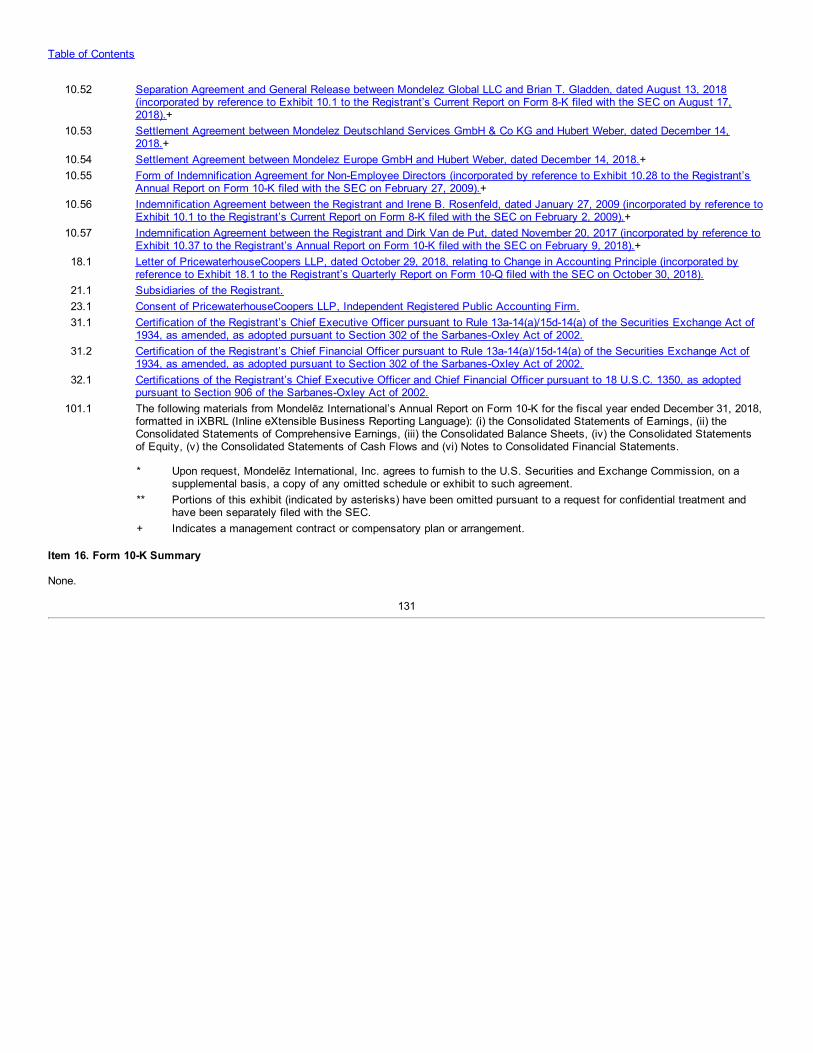
Table of Contents
10.52
Separation Agreement and General Release between Mondelez Global LLC and Brian T. Gladden, dated August 13, 2018(incorporated by reference to Exhibit 10.1 to the Registrant’s Current Report on Form 8-K filed with the SEC on August 17,2018).+
10.53
Settlement Agreement between Mondelez Deutschland Services GmbH & Co KG and Hubert Weber, dated December 14,2018.+
10.54 Settlement Agreement between Mondelez Europe GmbH and Hubert Weber, dated December 14, 2018.+10.55 Form of Indemnification Agreement for Non-Employee Directors (incorporated by reference to Exhibit 10.28 to the Registrant’s
Annual Report on Form 10-K filed with the SEC on February 27, 2009).+10.56 Indemnification Agreement between the Registrant and Irene B. Rosenfeld, dated January 27, 2009 (incorporated by reference to
Exhibit 10.1 to the Registrant’s Current Report on Form 8-K filed with the SEC on February 2, 2009).+10.57 Indemnification Agreement between the Registrant and Dirk Van de Put, dated November 20, 2017 (incorporated by reference to
Exhibit 10.37 to the Registrant’s Annual Report on Form 10-K filed with the SEC on February 9, 2018).+18.1
Letter of PricewaterhouseCoopers LLP, dated October 29, 2018, relating to Change in Accounting Principle (incorporated byreference to Exhibit 18.1 to the Registrant’s Quarterly Report on Form 10-Q filed with the SEC on October 30, 2018).
21.1 Subsidiaries of the Registrant.23.1 Consent of PricewaterhouseCoopers LLP, Independent Registered Public Accounting Firm.31.1
Certification of the Registrant’s Chief Executive Officer pursuant to Rule 13a-14(a)/15d-14(a) of the Securities Exchange Act of1934, as amended, as adopted pursuant to Section 302 of the Sarbanes-Oxley Act of 2002.
31.2
Certification of the Registrant’s Chief Financial Officer pursuant to Rule 13a-14(a)/15d-14(a) of the Securities Exchange Act of1934, as amended, as adopted pursuant to Section 302 of the Sarbanes-Oxley Act of 2002.
32.1
Certifications of the Registrant’s Chief Executive Officer and Chief Financial Officer pursuant to 18 U.S.C. 1350, as adoptedpursuant to Section 906 of the Sarbanes-Oxley Act of 2002.
101.1
The following materials from Mondelēz International’s Annual Report on Form 10-K for the fiscal year ended December 31, 2018,formatted in iXBRL (Inline eXtensible Business Reporting Language): (i) the Consolidated Statements of Earnings, (ii) theConsolidated Statements of Comprehensive Earnings, (iii) the Consolidated Balance Sheets, (iv) the Consolidated Statementsof Equity, (v) the Consolidated Statements of Cash Flows and (vi) Notes to Consolidated Financial Statements.
* Upon request, Mondelēz International, Inc. agrees to furnish to the U.S. Securities and Exchange Commission, on a
supplemental basis, a copy of any omitted schedule or exhibit to such agreement.
** Portions of this exhibit (indicated by asterisks) have been omitted pursuant to a request for confidential treatment and
have been separately filed with the SEC. + Indicates a management contract or compensatory plan or arrangement.
Item 16. Form 10-K Summary
None.
131
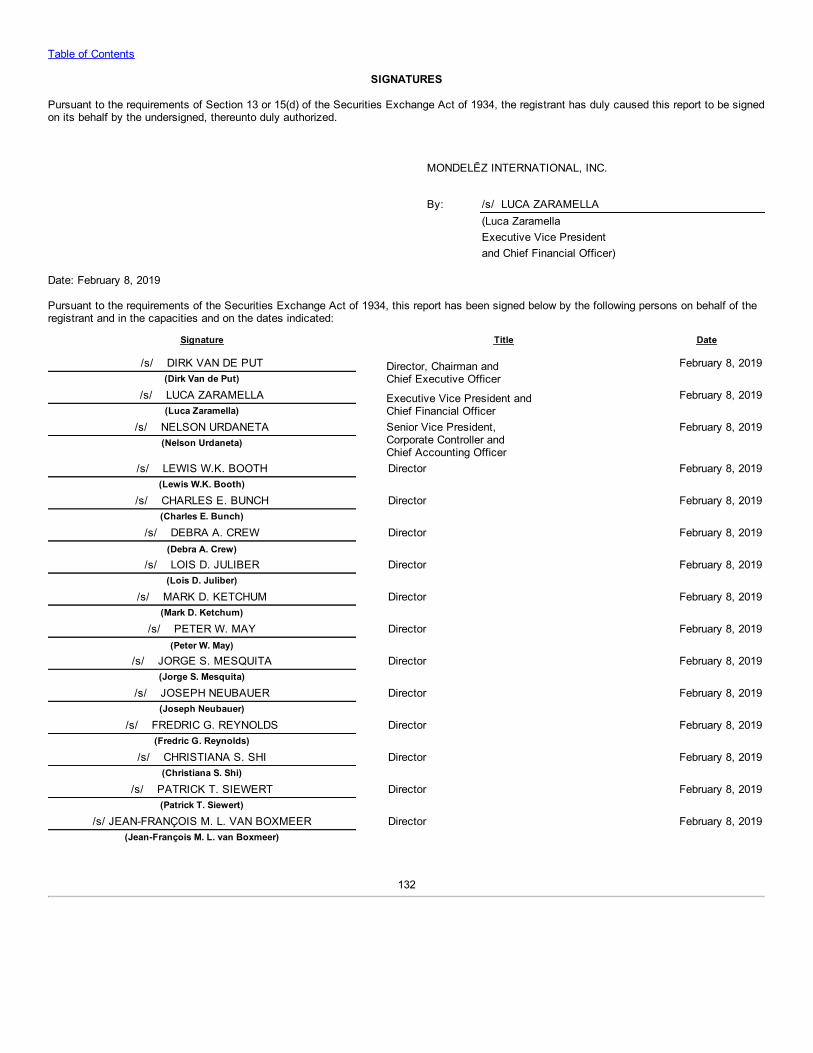
Table of Contents
SIGNATURES
Pursuant to the requirements of Section 13 or 15(d) of the Securities Exchange Act of 1934, the registrant has duly caused this report to be signedon its behalf by the undersigned, thereunto duly authorized.
MONDELĒZ INTERNATIONAL, INC.
By: /s/ LUCA ZARAMELLA (Luca Zaramella Executive Vice President and Chief Financial Officer)
Date: February 8, 2019
Pursuant to the requirements of the Securities Exchange Act of 1934, this report has been signed below by the following persons on behalf of theregistrant and in the capacities and on the dates indicated:
Signature Title Date
/s/ DIRK VAN DE PUT Director, Chairman andChief Executive Officer
February 8, 2019(Dirk Van de Put)
/s/ LUCA ZARAMELLA Executive Vice President andChief Financial Officer
February 8, 2019(Luca Zaramella)
/s/ NELSON URDANETA Senior Vice President,Corporate Controller andChief Accounting Officer
February 8, 2019(Nelson Urdaneta)
/s/ LEWIS W.K. BOOTH Director February 8, 2019
(Lewis W.K. Booth) /s/ CHARLES E. BUNCH Director February 8, 2019
(Charles E. Bunch) /s/ DEBRA A. CREW Director February 8, 2019
(Debra A. Crew) /s/ LOIS D. JULIBER Director February 8, 2019
(Lois D. Juliber) /s/ MARK D. KETCHUM Director February 8, 2019
(Mark D. Ketchum) /s/ PETER W. MAY Director February 8, 2019
(Peter W. May) /s/ JORGE S. MESQUITA Director February 8, 2019
(Jorge S. Mesquita) /s/ JOSEPH NEUBAUER Director February 8, 2019
(Joseph Neubauer) /s/ FREDRIC G. REYNOLDS Director February 8, 2019
(Fredric G. Reynolds) /s/ CHRISTIANA S. SHI Director February 8, 2019
(Christiana S. Shi) /s/ PATRICK T. SIEWERT Director February 8, 2019
(Patrick T. Siewert) /s/ JEAN-FRANÇOIS M. L. VAN BOXMEER Director February 8, 2019
(Jean-François M. L. van Boxmeer)
132
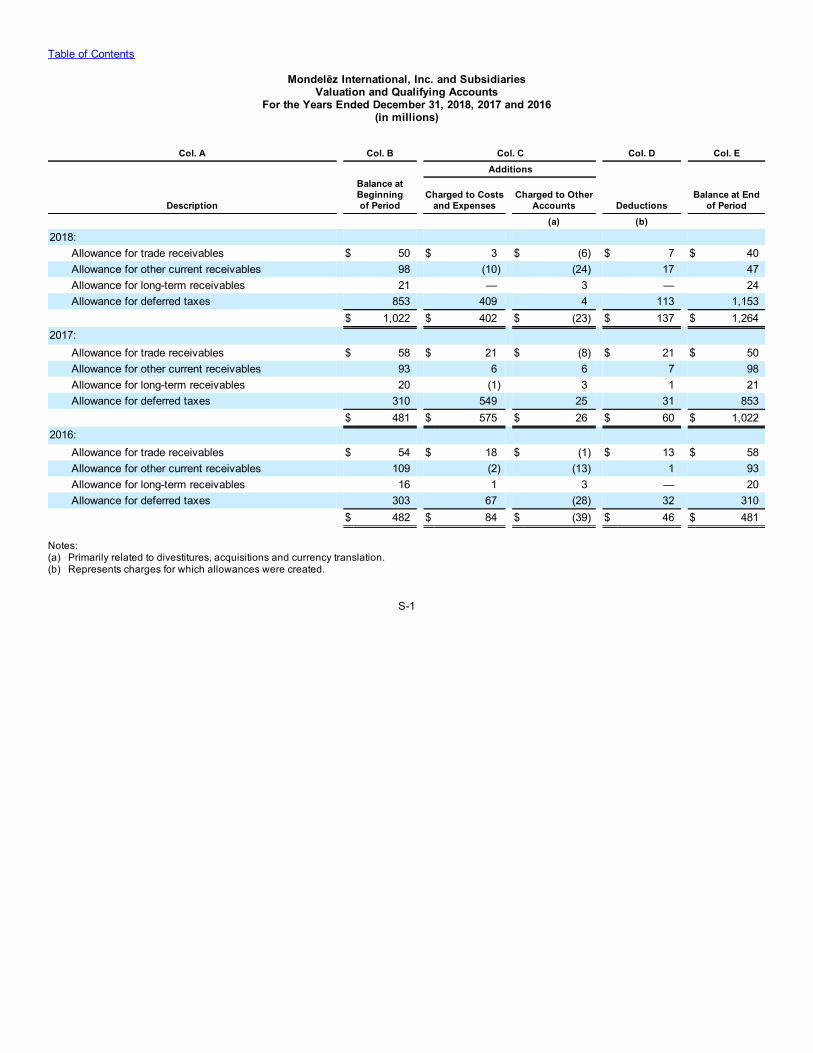
Table of Contents
Mondelēz International, Inc. and SubsidiariesValuation and Qualifying Accounts
For the Years Ended December 31, 2018, 2017 and 2016(in millions)
Col. A Col. B Col. C Col. D Col. E Additions
Description
Balance atBeginningof Period
Charged to Costsand Expenses
Charged to OtherAccounts Deductions
Balance at Endof Period
(a) (b)
2018: Allowance for trade receivables $ 50 $ 3 $ (6) $ 7 $ 40Allowance for other current receivables 98 (10) (24) 17 47Allowance for long-term receivables 21 — 3 — 24Allowance for deferred taxes 853 409 4 113 1,153
$ 1,022 $ 402 $ (23) $ 137 $ 1,2642017:
Allowance for trade receivables $ 58 $ 21 $ (8) $ 21 $ 50Allowance for other current receivables 93 6 6 7 98Allowance for long-term receivables 20 (1) 3 1 21Allowance for deferred taxes 310 549 25 31 853
$ 481 $ 575 $ 26 $ 60 $ 1,0222016:
Allowance for trade receivables $ 54 $ 18 $ (1) $ 13 $ 58Allowance for other current receivables 109 (2) (13) 1 93Allowance for long-term receivables 16 1 3 — 20Allowance for deferred taxes 303 67 (28) 32 310
$ 482 $ 84 $ (39) $ 46 $ 481
Notes:(a) Primarily related to divestitures, acquisitions and currency translation.(b) Represents charges for which allowances were created.
S-1
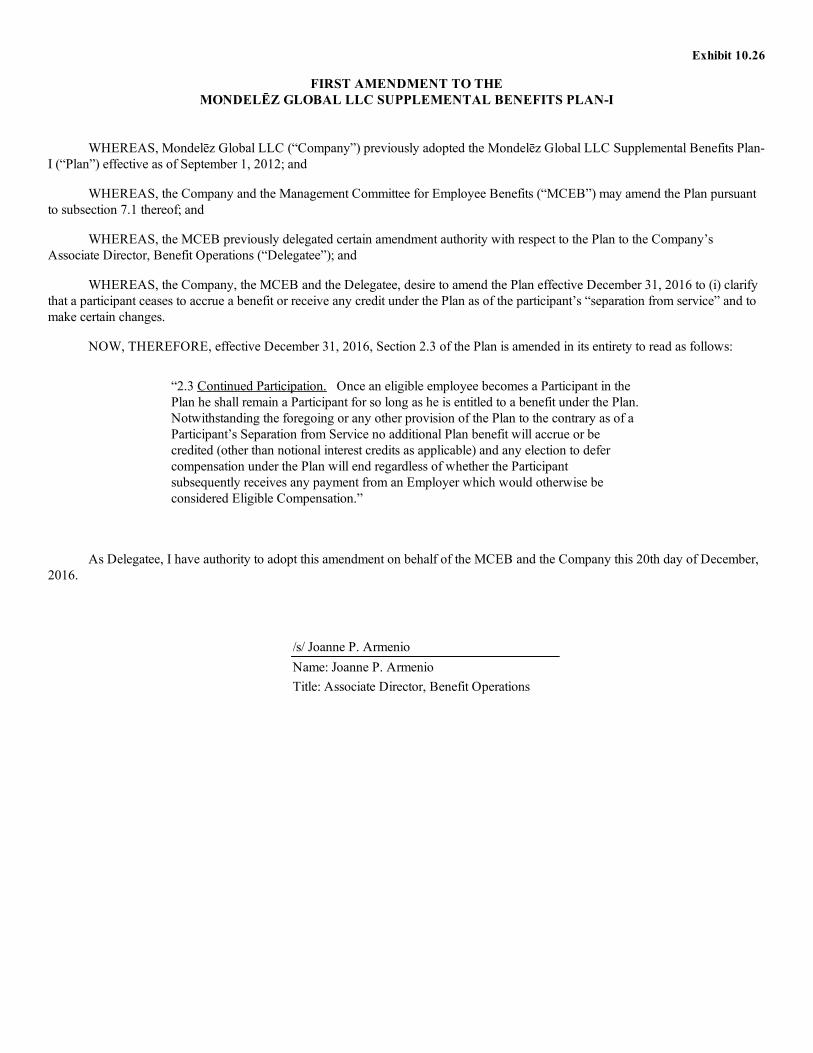
Exhibit 10.26
FIRST AMENDMENT TO THEMONDELĒZ GLOBAL LLC SUPPLEMENTAL BENEFITS PLAN-I
WHEREAS, Mondelēz Global LLC (“Company”) previously adopted the Mondelēz Global LLC Supplemental Benefits Plan-I (“Plan”) effective as of September 1, 2012; and
WHEREAS, the Company and the Management Committee for Employee Benefits (“MCEB”) may amend the Plan pursuantto subsection 7.1 thereof; and
WHEREAS, the MCEB previously delegated certain amendment authority with respect to the Plan to the Company’sAssociate Director, Benefit Operations (“Delegatee”); and
WHEREAS, the Company, the MCEB and the Delegatee, desire to amend the Plan effective December 31, 2016 to (i) clarifythat a participant ceases to accrue a benefit or receive any credit under the Plan as of the participant’s “separation from service” and tomake certain changes.
NOW, THEREFORE, effective December 31, 2016, Section 2.3 of the Plan is amended in its entirety to read as follows:
“2.3 Continued Participation. Once an eligible employee becomes a Participant in thePlan he shall remain a Participant for so long as he is entitled to a benefit under the Plan.Notwithstanding the foregoing or any other provision of the Plan to the contrary as of aParticipant’s Separation from Service no additional Plan benefit will accrue or becredited (other than notional interest credits as applicable) and any election to defercompensation under the Plan will end regardless of whether the Participantsubsequently receives any payment from an Employer which would otherwise beconsidered Eligible Compensation.”
As Delegatee, I have authority to adopt this amendment on behalf of the MCEB and the Company this 20th day of December,2016.
/s/ Joanne P. ArmenioName: Joanne P. ArmenioTitle: Associate Director, Benefit Operations
Exhibit 10.28
FIRST AMENDMENT TO THEMONDELĒZ GLOBAL LLC SUPPLEMENTAL BENEFITS PLAN-II
WHEREAS, Mondelēz Global LLC (“Company”) previously adopted the Mondelēz Global LLC Supplemental Benefits Plan-II (“Plan”) effective as of September 1, 2012; and
WHEREAS, the Company and the Management Committee for Employee Benefits (“MCEB”) may amend the Plan pursuantto subsection 7.1 thereof; and
WHEREAS, the MCEB previously delegated certain amendment authority with respect to the Plan to the Company’sAssociate Director, Benefit Operations (“Delegatee”); and
WHEREAS, the Company, the MCEB and the Delegatee, desire to amend the Plan effective December 31, 2016 to (i) clarifythat a participant ceases to accrue a benefit or receive any credit under the Plan as of the participant’s “separation from service” and tomake certain changes
NOW, THEREFORE, effective December 31, 2016, Section 2.3 of the Plan is amended in its entirety to read as follows:
“2.3 Continued Participation. Once an eligible employee becomes a Participant in thePlan, he shall remain a Participant for so long as he is entitled to a benefit under thePlan. Notwithstanding the foregoing or any other provision of the Plan to the contrary,as of a Participant’s Separation from Service, no additional Plan benefit will accrue orbe credited (other than notional interest credits as applicable) and any election to defercompensation under the Plan will end regardless of whether the Participantsubsequently receives any payment from an Employer which would otherwise beconsidered Eligible Compensation.”
.
As Delegatee, I have authority to adopt this amendment on behalf of the MCEB and the Company this 20th day of December,2016.
/s/ Joanne P. ArmenioName: Joanne P. ArmenioTitle: Associate Director, Benefit Operations
Exhibit 10.53
SETTLEMENT AGREEMENT
Between
Mondelez Deutschland Services GmbH & Co KG
Konsul Smidt Strasse 21
28217 Bremen
- “Company” –
and
Hubert Weber
Bleierweg 5
8942 Oberrieden
Switzerland
-“Employee”-
The following Agreement is entered into:
1. TerminationThe parties mutually agree that their employment relationship shall end effective as of 31 January 2019 (hereinafter the“Termination Date”). The Employee will resign from all positions and functions he assumed in affiliated companies with effectas of the expiry of 31 January 2019 or any earlier date as requested by the Company.
2. RemunerationUntil the Termination Date, the Employee shall receive his monthly base salary.
The annual incentive bonus for 2018 will be paid on a full year basis based on the actual business and individual performance.As regards individual performance the parties agree on a performance rating as being determined in the individual performanceconversation process for 2018. Payout date will be in March 2019 and will be hypotaxed as per your international assignmentsetup.
A prorated incentive bonus for 31 days in 2019 will be paid based on the actual business results applicable for the MEU RegionPresident and actual individual performance. Payout date will be in March 2020. As deferred compensation this payment will behypotaxed similar to other compensation elements.
3. Garden Leave/ Vacation
1
The Company may decide at any time to place the Employee on garden leave prior to Termination Date in which case he wouldmake himself available during business hours upon reasonable request. All such services shall be compensated by theremuneration paid as set out in section 2 of the Agreement.
Any remaining vacation has been fully granted and taken by the Employee by Termination Date.
4. Non - solicitationThe Employee agrees that for a period of 12 months after the Termination Date he shall neither directly nor indirectly enticeaway employees of the Company, its subsidiaries or parent company or cause them in any other way to leave the Company, itssubsidiaries or parent company, if for that purpose he induces them to break the contract or uses information which is subject tohis post-contractual duty of secrecy.
5. ReferenceUpon request, the Company shall provide the Employee with a favourable, qualified reference. The Employee shall provide theCompany with a respective draft.
6. Private CommunicationThe Employee shall have deleted by Termination Date all private email communication and private documents on the systems ofthe Company and its affiliates allowing the latter to access the Employee's accounts and archives.
7. SecrecyThe Employee is obliged, even after the Termination Date, not to disclose to any third party any confidential business, company,technical or other information relating to the Company or its affiliates which has become known to him or with which he wasentrusted during the term of his employment. The Employee shall keep confidential the contents of this Agreement unless he isobliged by statutory laws to divulge such information or the information is required for tax or social security purposes.
8. AnnouncementsThe Company and the Employee hereby undertake that they will not make any negative announcements about each otherwhether internally, to customers or to partners. Moreover, any announcement in connection with the Employee leavingMondelez and/or this Agreement and will only be made if such announcement has been agreed upon by both partiesbeforehand.
9. PensionThe Employee had acquired a vested pension claim under the scheme "Plan 1996". As soon as possible after Termination Datethe Company shall inform the Employee about the amount of the acquired pension claim.
10. Social and tax informationThe Employee is aware that the Company is not competent to give binding information about the legal consequences of thisAgreement under social or tax law, but that the appropriate authorities are competent and obliged to give such information.
11. ReleaseWith this Agreement, the parties intend to regulate their entire legal relationship. The parties agree that, with the exception of theabove-mentioned claims, neither party hereto shall have any further rights or claims against the other party resulting from and inconnection with the employment relationship and its termination, be they known or unknown, of whatever kind and irrespectiveof the date on which they originate. Not included hereunder are non-forfeitable rights such as the claims from the Company's
2
pension scheme and claims resulting from tort. The Employee agrees that he has no unsettled claims of whatever kind against anundertaking affiliated with the Company with the exception of the settlement agreement with Mondelez Europe GmbH.
The Employee herewith terminates any employment or service relationships with any other affiliated company within theMondelez group of companies with immediate effect.
12. Final ProvisionsChanges or additions to the Agreement must be in writing in order to be legally valid. This also applies with regard to anychange in this written form clause.
The Agreement and all legal disputes arising out of it are governed by the laws of the Federal Republic of Germany.
Should a provision of the Agreement or a provision later on included in the Agreement be or become null and void as a wholeor in part, or should a gap in the Agreement become evident, this does not affect the validity of the remaining provisions.However, it is the express intention of the Parties to maintain the validity of the remaining provisions at all events and thus toexclude the applicability of section 139 German Civil Code (Bürgerliches Gesetzbuch) as a whole. Instead of the null and voidprovision, or in order to fill the gap, such valid and practicable regulation is deemed to be agreed with effect ex tunc that in legaland economic terms comes closest to what the Parties intended or would have intended in accordance with the purpose of theAgreement if they had considered the point at the time of conclusion of the Agreement. If the nullity of a provision is due to adegree of performance or time (period or deadline) laid down in this provision, then the provision is deemed to be agreed with alegally permissible degree that comes closest to the original degree.
Bremen, 27 November 2018 Zurich, 14 December 2018Place, Date Place, Date
/s/ Susanne Richter /s/ Hubert WeberCompany
Hubert Weber
Place, Date
/s/ Peter Biesterfeld
Company
3
Exhibit 10.54[Mondelēz International Logo]
Mondelez Europe GmbHLindbergh-Allee 1, CH-8152 Glattpark,
Tel. +41 58 440 40 40,Fax +41 58 440 40 01
MwSt-Nr. CHE-116.275.017www.mondelezinternational.com
SETTLEMENT AGREEMENT
Between
Mondelez Europe GmbH
Lindbergh-Allee 1
8152 Glattpark (Opfikon)
- “Company” –
and
Hubert Weber
Bleierweg 5
8942 Oberrieden
Switzerland
-“Secondee”-
WHEREAS the Secondee is assigned by his employer, Mondelez Deutschland Services GmbH & Co KG (“Employer”) to theCompany;
WHEREAS the Secondee and the Employer agreed that their employment relationship will end effective as of 31 January 2019(hereinafter the “Termination Date”).
NOW; THEREFORE; the parties agree as follows:
1. Termination of AssignmentThe assignment of the Secondee to the Company shall end as of the Termination Date.
2. PSUThe Secondee has been granted Performance Share Units (PSUs) of Mondelez International Inc. Some of those have not vestedyet. The parties agree that any unvested PSU will vest on a be prorated basis depending on the number of months the Secondeewas employed up until Termination Date in the respective performance cycles (i.e., PSUs granted in 2016 will fully vest; PSUsgranted in 2017 will vest 24/36ths and PSUs granted in 2018 will vest 12/36ths).
Ultimate payout of PSUs will be based on the actual business performance during the respective performance cycles and bevested on the original vesting dates.
For the rest, the terms and conditions of the applicable plan documents in force from time to time shall apply.
3. Stock OptionsThe Secondee has been granted stock options of Mondelez International Inc. Vested stock options will remain exercisable forthe applicable 10-year original expiration period.All unvested stock options will continue to vest on the original vesting dates and will be exercisable for the applicable 10-yearoriginal expiration period.
For the rest, the terms and conditions of the applicable plan documents in force from time to time shall apply.
4. ExPat Allowances and BenefitsEx Pat Allowances and benefits are continued to be paid to the Secondee until Termination Date as set out in detail in theattachment to this agreement "End of your International Assignment / Repatriation to Germany from Switzerland".
5. Non - competeThe Secondee agrees, for a period of 12 months after the Termination Date not to engage in a business which is in competitionwith the Company’s or any of its affiliated companies’ business activities. This Non-Compete Covenant refers in particular to thefollowing group of companies: PepsiCo, Inc., Campbell Soup Company, The Coca-Cola Company, Kellogg Company, Mars,Inc., Nestle S.A., Ferrero Rocher, General Mills, Inc., The Hershey Company, Groupe Danone, Perfetti Van Melle, Arcor,Unilever Group, Lindt & Sprungli AG, and Yildiz Holding A.S., KEX Confectionery SA and Olayan Group or any subsidiaries,affiliates or subsequent parent or merger partner, if any of these companies are acquired or become part of a merger.
Similarly, the Secondee is not permitted, during 12 months period to set up or to participate in any competing enterprise as amajority shareholder or as the holder of a blocking minority within such enterprise.
Within 12 months after Termination Date, the Secondee is obliged not to carry out work for such customers who belonged to thecustomer list of the Company or any of its affiliated companies during the past three years before Termination Date.
This Non-Compete Covenant applies worldwide.
This Non-Compete Covenant also applies to the benefit of any businesses connected with the Company with which theSecondee dealt either directly or indirectly.
6. Return of items / Company CarThe Secondee shall return all items belonging to the Company or any of its affiliates by no later than Termination Date inZurich.
No later than 31 January 2019 the Employee shall return the company car provided to him, to the attention of a persondesignated by the Company in proper condition, including all documents, keys, equipment and fuel cards in Zuerich.
The Secondee shall have no right of retention to the above-mentioned items.
7. ReleaseThe parties agree that, with the exception of the above-mentioned claims, neither party hereto shall have any further rights orclaims against the other party resulting from and in connection with the assignment and its termination, be they known orunknown, of whatever kind and irrespective of the date on which
2
they originate. The Secondee herewith also waives any and all claims against the Company that he has or may have, includingwithout limiting the generality of the foregoing, any claims under any equity plan, any allowances and benefits other than thoseset forth under sections 2, 3, or 4 above.
8. Final ProvisionsChanges or additions to the Agreement must be in writing in order to be legally valid. This also applies with regard to anychange in this written form clause.
The Agreement and all legal disputes arising out of it are governed by the substantive laws of Switzerland.
Glattpark, 6 December 2018 Zurich, 14 December 2018Place, Date Place, Date
/s/ Andrew C. Gibson /s/ Hubert WeberCompany
Hubert Weber
Glattpark, 6 December 2018
Place, Date
/s/ Rupert Slezak
Company
3
Exhibit 21.1
Mondelēz International, Inc.Subsidiaries - December 31, 2018
Entity Name CountryLU Algerie S.p.A. AlgeriaMondelez Argentina S.A. ArgentinaNabisco Inversiones S.R.L. ArgentinaVan Mar SA ArgentinaCadbury Marketing Services Pty Limited AustraliaKF (Australia) Pty. Ltd. AustraliaLanes Biscuits Pty. Ltd. AustraliaLanes Food (Australia) Pty. Ltd. AustraliaMondelez Australia (Foods) Ltd AustraliaMondelez Australia Group Co Pty Ltd AustraliaMondelez Australia Group Investments LP AustraliaMondelez Australia Holdings Pty. Ltd. AustraliaMondelez Australia Investments Pty Ltd AustraliaMondelez Australia Pty. Ltd. AustraliaMondelez Australia Services Pty. Ltd. AustraliaMondelez New Zealand Holdings (Australia) Pty. Ltd. AustraliaMirabell Salzburger Confiserie-und Bisquit GmbH AustriaMondelez Austria Services GmbH AustriaMondelez Oesterreich GmbH AustriaMondelez Oesterreich Production GmbH AustriaSalzburger Suesswarenfabrik K.G. AustriaMondelez Bahrain Biscuits WLL BahrainMondelez Bahrain W.L.L. BahrainMondelez Bangladesh Private Limited BangladeshOOO Mondelez International Bel BelarusConfibel SPRL BelgiumKraft Foods Belgium Intellectual Property BelgiumMondelez Belgium Biscuits Production NV BelgiumMondelez Belgium BVBA BelgiumMondelez Belgium Chocolate Production BVBA BelgiumMondelez Belgium Manufacturing Services BVBA BelgiumMondelez Belgium Services BVBA BelgiumMondelez Namur Production SPRL BelgiumMondelez de Alimentos Bolivia S.R.L. BoliviaCadbury Botswana (Proprietary) Limited BotswanaMondelez Brasil Ltda. BrazilMondelez Brasil Norte Nordeste Ltda. BrazilMondelez Bulgaria EOOD BulgariaMondelez Bulgaria Holding AD BulgariaMondelez Bulgaria Production EOOD Bulgaria152999 Canada Inc. Canada
MCI Finance Inc. CanadaMondelez Asia Pacific (Alberta) GP ULC CanadaMondelez Canada Holdings ULC Canada
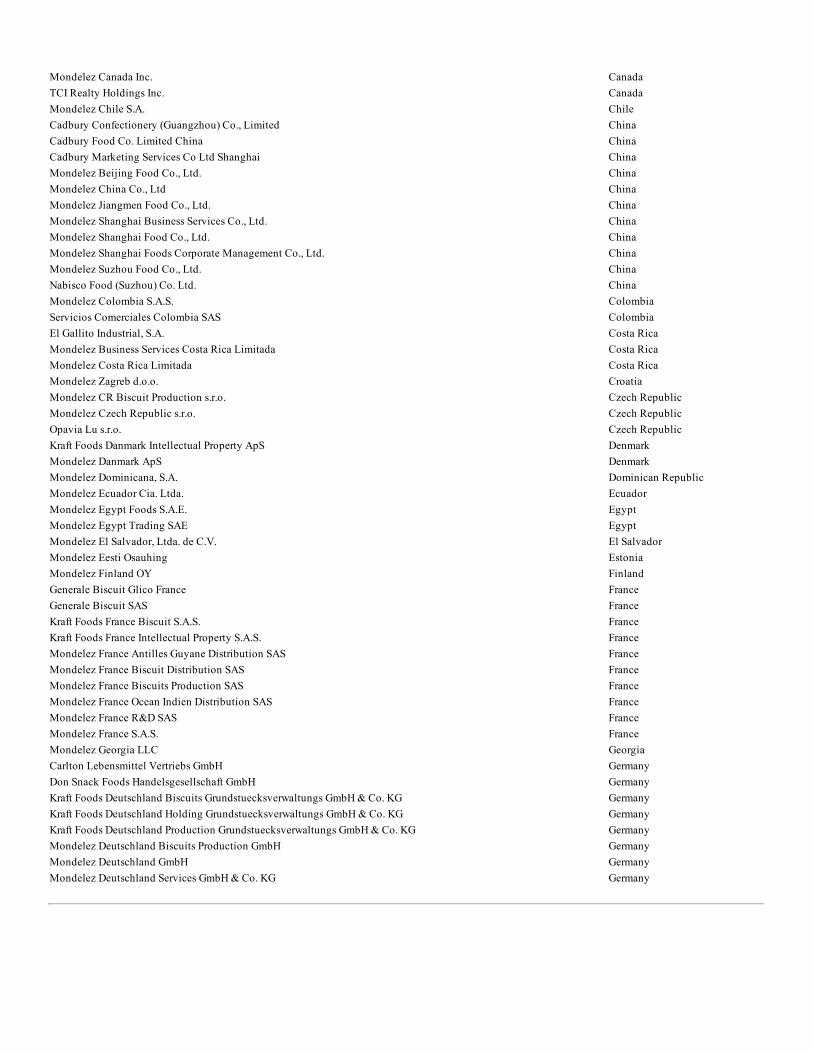
Mondelez Canada Inc. CanadaTCI Realty Holdings Inc. CanadaMondelez Chile S.A. ChileCadbury Confectionery (Guangzhou) Co., Limited ChinaCadbury Food Co. Limited China ChinaCadbury Marketing Services Co Ltd Shanghai ChinaMondelez Beijing Food Co., Ltd. ChinaMondelez China Co., Ltd ChinaMondelez Jiangmen Food Co., Ltd. ChinaMondelez Shanghai Business Services Co., Ltd. ChinaMondelez Shanghai Food Co., Ltd. ChinaMondelez Shanghai Foods Corporate Management Co., Ltd. ChinaMondelez Suzhou Food Co., Ltd. ChinaNabisco Food (Suzhou) Co. Ltd. ChinaMondelez Colombia S.A.S. ColombiaServicios Comerciales Colombia SAS ColombiaEl Gallito Industrial, S.A. Costa RicaMondelez Business Services Costa Rica Limitada Costa RicaMondelez Costa Rica Limitada Costa RicaMondelez Zagreb d.o.o. CroatiaMondelez CR Biscuit Production s.r.o. Czech RepublicMondelez Czech Republic s.r.o. Czech RepublicOpavia Lu s.r.o. Czech RepublicKraft Foods Danmark Intellectual Property ApS DenmarkMondelez Danmark ApS DenmarkMondelez Dominicana, S.A. Dominican RepublicMondelez Ecuador Cia. Ltda. EcuadorMondelez Egypt Foods S.A.E. EgyptMondelez Egypt Trading SAE EgyptMondelez El Salvador, Ltda. de C.V. El SalvadorMondelez Eesti Osauhing EstoniaMondelez Finland OY FinlandGenerale Biscuit Glico France FranceGenerale Biscuit SAS FranceKraft Foods France Biscuit S.A.S. FranceKraft Foods France Intellectual Property S.A.S. FranceMondelez France Antilles Guyane Distribution SAS FranceMondelez France Biscuit Distribution SAS FranceMondelez France Biscuits Production SAS FranceMondelez France Ocean Indien Distribution SAS FranceMondelez France R&D SAS FranceMondelez France S.A.S. FranceMondelez Georgia LLC GeorgiaCarlton Lebensmittel Vertriebs GmbH GermanyDon Snack Foods Handelsgesellschaft GmbH GermanyKraft Foods Deutschland Biscuits Grundstuecksverwaltungs GmbH & Co. KG GermanyKraft Foods Deutschland Holding Grundstuecksverwaltungs GmbH & Co. KG GermanyKraft Foods Deutschland Production Grundstuecksverwaltungs GmbH & Co. KG GermanyMondelez Deutschland Biscuits Production GmbH GermanyMondelez Deutschland GmbH GermanyMondelez Deutschland Services GmbH & Co. KG Germany
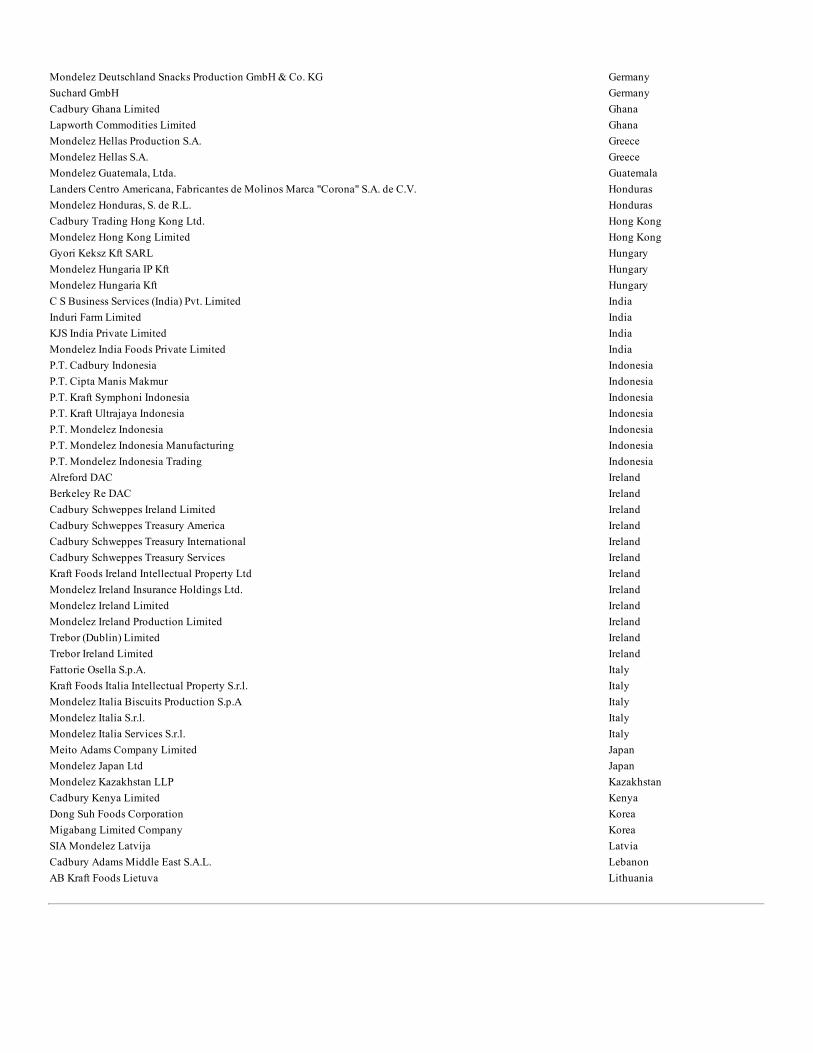
Mondelez Deutschland Snacks Production GmbH & Co. KG GermanySuchard GmbH GermanyCadbury Ghana Limited GhanaLapworth Commodities Limited GhanaMondelez Hellas Production S.A. GreeceMondelez Hellas S.A. GreeceMondelez Guatemala, Ltda. GuatemalaLanders Centro Americana, Fabricantes de Molinos Marca "Corona" S.A. de C.V. HondurasMondelez Honduras, S. de R.L. HondurasCadbury Trading Hong Kong Ltd. Hong KongMondelez Hong Kong Limited Hong KongGyori Keksz Kft SARL HungaryMondelez Hungaria IP Kft HungaryMondelez Hungaria Kft HungaryC S Business Services (India) Pvt. Limited IndiaInduri Farm Limited IndiaKJS India Private Limited IndiaMondelez India Foods Private Limited IndiaP.T. Cadbury Indonesia IndonesiaP.T. Cipta Manis Makmur IndonesiaP.T. Kraft Symphoni Indonesia IndonesiaP.T. Kraft Ultrajaya Indonesia IndonesiaP.T. Mondelez Indonesia IndonesiaP.T. Mondelez Indonesia Manufacturing IndonesiaP.T. Mondelez Indonesia Trading IndonesiaAlreford DAC IrelandBerkeley Re DAC IrelandCadbury Schweppes Ireland Limited IrelandCadbury Schweppes Treasury America IrelandCadbury Schweppes Treasury International IrelandCadbury Schweppes Treasury Services IrelandKraft Foods Ireland Intellectual Property Ltd IrelandMondelez Ireland Insurance Holdings Ltd. IrelandMondelez Ireland Limited IrelandMondelez Ireland Production Limited IrelandTrebor (Dublin) Limited IrelandTrebor Ireland Limited IrelandFattorie Osella S.p.A. ItalyKraft Foods Italia Intellectual Property S.r.l. ItalyMondelez Italia Biscuits Production S.p.A ItalyMondelez Italia S.r.l. ItalyMondelez Italia Services S.r.l. ItalyMeito Adams Company Limited JapanMondelez Japan Ltd JapanMondelez Kazakhstan LLP KazakhstanCadbury Kenya Limited KenyaDong Suh Foods Corporation KoreaMigabang Limited Company KoreaSIA Mondelez Latvija LatviaCadbury Adams Middle East S.A.L. LebanonAB Kraft Foods Lietuva Lithuania
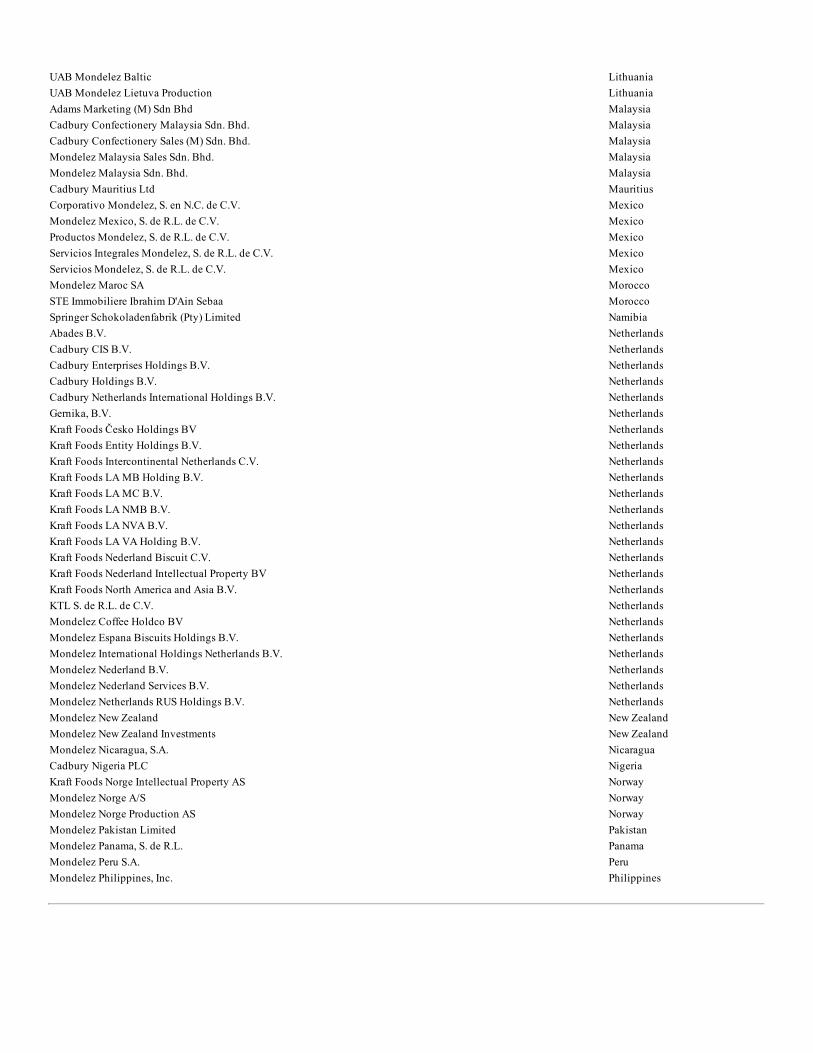
UAB Mondelez Baltic LithuaniaUAB Mondelez Lietuva Production LithuaniaAdams Marketing (M) Sdn Bhd MalaysiaCadbury Confectionery Malaysia Sdn. Bhd. MalaysiaCadbury Confectionery Sales (M) Sdn. Bhd. MalaysiaMondelez Malaysia Sales Sdn. Bhd. MalaysiaMondelez Malaysia Sdn. Bhd. MalaysiaCadbury Mauritius Ltd MauritiusCorporativo Mondelez, S. en N.C. de C.V. MexicoMondelez Mexico, S. de R.L. de C.V. MexicoProductos Mondelez, S. de R.L. de C.V. MexicoServicios Integrales Mondelez, S. de R.L. de C.V. MexicoServicios Mondelez, S. de R.L. de C.V. MexicoMondelez Maroc SA MoroccoSTE Immobiliere Ibrahim D'Ain Sebaa MoroccoSpringer Schokoladenfabrik (Pty) Limited NamibiaAbades B.V. NetherlandsCadbury CIS B.V. NetherlandsCadbury Enterprises Holdings B.V. NetherlandsCadbury Holdings B.V. NetherlandsCadbury Netherlands International Holdings B.V. NetherlandsGernika, B.V. NetherlandsKraft Foods Česko Holdings BV NetherlandsKraft Foods Entity Holdings B.V. NetherlandsKraft Foods Intercontinental Netherlands C.V. NetherlandsKraft Foods LA MB Holding B.V. NetherlandsKraft Foods LA MC B.V. NetherlandsKraft Foods LA NMB B.V. NetherlandsKraft Foods LA NVA B.V. NetherlandsKraft Foods LA VA Holding B.V. NetherlandsKraft Foods Nederland Biscuit C.V. NetherlandsKraft Foods Nederland Intellectual Property BV NetherlandsKraft Foods North America and Asia B.V. NetherlandsKTL S. de R.L. de C.V. NetherlandsMondelez Coffee Holdco BV NetherlandsMondelez Espana Biscuits Holdings B.V. NetherlandsMondelez International Holdings Netherlands B.V. NetherlandsMondelez Nederland B.V. NetherlandsMondelez Nederland Services B.V. NetherlandsMondelez Netherlands RUS Holdings B.V. NetherlandsMondelez New Zealand New ZealandMondelez New Zealand Investments New ZealandMondelez Nicaragua, S.A. NicaraguaCadbury Nigeria PLC NigeriaKraft Foods Norge Intellectual Property AS NorwayMondelez Norge A/S NorwayMondelez Norge Production AS NorwayMondelez Pakistan Limited PakistanMondelez Panama, S. de R.L. PanamaMondelez Peru S.A. PeruMondelez Philippines, Inc. Philippines
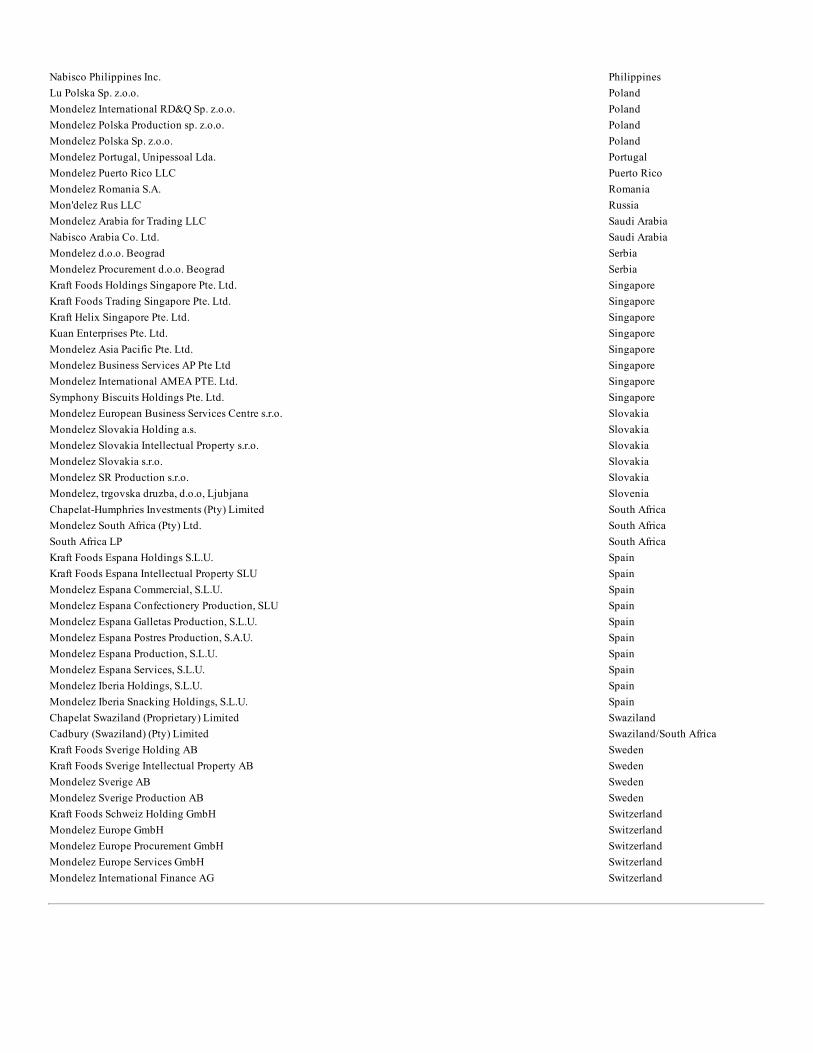
Nabisco Philippines Inc. PhilippinesLu Polska Sp. z.o.o. PolandMondelez International RD&Q Sp. z.o.o. PolandMondelez Polska Production sp. z.o.o. PolandMondelez Polska Sp. z.o.o. PolandMondelez Portugal, Unipessoal Lda. PortugalMondelez Puerto Rico LLC Puerto RicoMondelez Romania S.A. RomaniaMon'delez Rus LLC RussiaMondelez Arabia for Trading LLC Saudi ArabiaNabisco Arabia Co. Ltd. Saudi ArabiaMondelez d.o.o. Beograd SerbiaMondelez Procurement d.o.o. Beograd SerbiaKraft Foods Holdings Singapore Pte. Ltd. SingaporeKraft Foods Trading Singapore Pte. Ltd. SingaporeKraft Helix Singapore Pte. Ltd. SingaporeKuan Enterprises Pte. Ltd. SingaporeMondelez Asia Pacific Pte. Ltd. SingaporeMondelez Business Services AP Pte Ltd SingaporeMondelez International AMEA PTE. Ltd. SingaporeSymphony Biscuits Holdings Pte. Ltd. SingaporeMondelez European Business Services Centre s.r.o. SlovakiaMondelez Slovakia Holding a.s. SlovakiaMondelez Slovakia Intellectual Property s.r.o. SlovakiaMondelez Slovakia s.r.o. SlovakiaMondelez SR Production s.r.o. SlovakiaMondelez, trgovska druzba, d.o.o, Ljubjana SloveniaChapelat-Humphries Investments (Pty) Limited South AfricaMondelez South Africa (Pty) Ltd. South AfricaSouth Africa LP South AfricaKraft Foods Espana Holdings S.L.U. SpainKraft Foods Espana Intellectual Property SLU SpainMondelez Espana Commercial, S.L.U. SpainMondelez Espana Confectionery Production, SLU SpainMondelez Espana Galletas Production, S.L.U. SpainMondelez Espana Postres Production, S.A.U. SpainMondelez Espana Production, S.L.U. SpainMondelez Espana Services, S.L.U. SpainMondelez Iberia Holdings, S.L.U. SpainMondelez Iberia Snacking Holdings, S.L.U. SpainChapelat Swaziland (Proprietary) Limited SwazilandCadbury (Swaziland) (Pty) Limited Swaziland/South AfricaKraft Foods Sverige Holding AB SwedenKraft Foods Sverige Intellectual Property AB SwedenMondelez Sverige AB SwedenMondelez Sverige Production AB SwedenKraft Foods Schweiz Holding GmbH SwitzerlandMondelez Europe GmbH SwitzerlandMondelez Europe Procurement GmbH SwitzerlandMondelez Europe Services GmbH SwitzerlandMondelez International Finance AG Switzerland
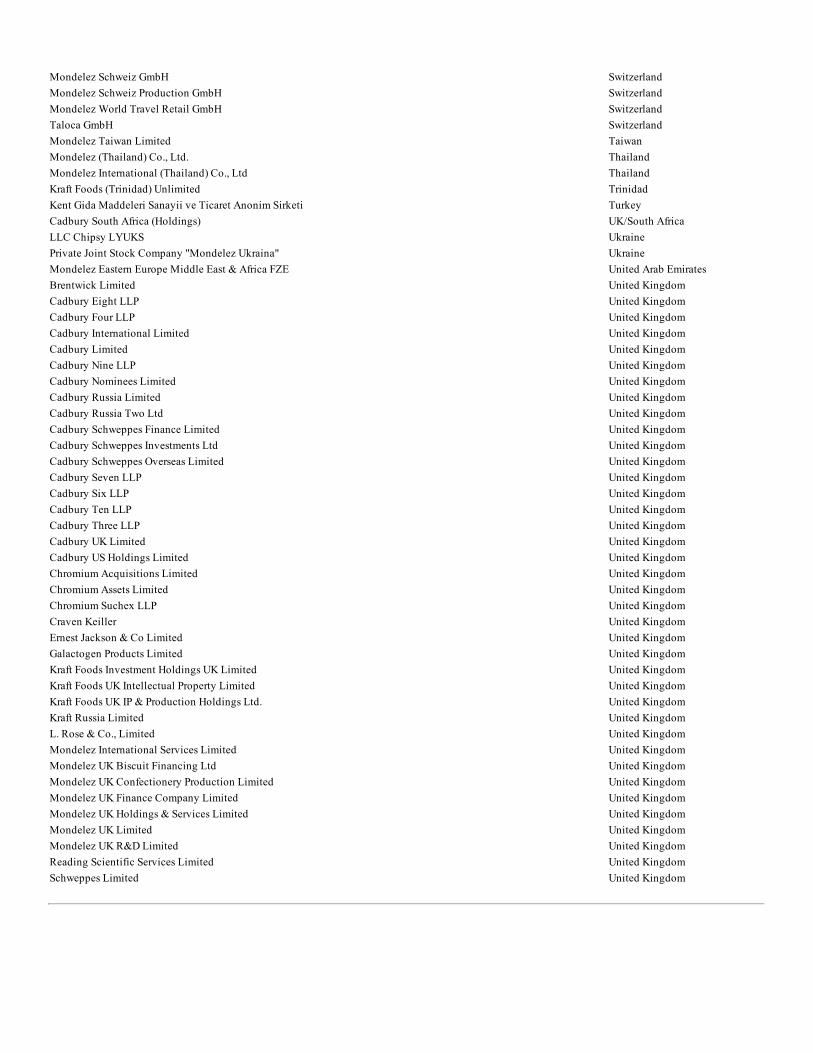
Mondelez Schweiz GmbH SwitzerlandMondelez Schweiz Production GmbH SwitzerlandMondelez World Travel Retail GmbH SwitzerlandTaloca GmbH SwitzerlandMondelez Taiwan Limited TaiwanMondelez (Thailand) Co., Ltd. ThailandMondelez International (Thailand) Co., Ltd ThailandKraft Foods (Trinidad) Unlimited TrinidadKent Gida Maddeleri Sanayii ve Ticaret Anonim Sirketi TurkeyCadbury South Africa (Holdings) UK/South AfricaLLC Chipsy LYUKS UkrainePrivate Joint Stock Company "Mondelez Ukraina" UkraineMondelez Eastern Europe Middle East & Africa FZE United Arab EmiratesBrentwick Limited United KingdomCadbury Eight LLP United KingdomCadbury Four LLP United KingdomCadbury International Limited United KingdomCadbury Limited United KingdomCadbury Nine LLP United KingdomCadbury Nominees Limited United KingdomCadbury Russia Limited United KingdomCadbury Russia Two Ltd United KingdomCadbury Schweppes Finance Limited United KingdomCadbury Schweppes Investments Ltd United KingdomCadbury Schweppes Overseas Limited United KingdomCadbury Seven LLP United KingdomCadbury Six LLP United KingdomCadbury Ten LLP United KingdomCadbury Three LLP United KingdomCadbury UK Limited United KingdomCadbury US Holdings Limited United KingdomChromium Acquisitions Limited United KingdomChromium Assets Limited United KingdomChromium Suchex LLP United KingdomCraven Keiller United KingdomErnest Jackson & Co Limited United KingdomGalactogen Products Limited United KingdomKraft Foods Investment Holdings UK Limited United KingdomKraft Foods UK Intellectual Property Limited United KingdomKraft Foods UK IP & Production Holdings Ltd. United KingdomKraft Russia Limited United KingdomL. Rose & Co., Limited United KingdomMondelez International Services Limited United KingdomMondelez UK Biscuit Financing Ltd United KingdomMondelez UK Confectionery Production Limited United KingdomMondelez UK Finance Company Limited United KingdomMondelez UK Holdings & Services Limited United KingdomMondelez UK Limited United KingdomMondelez UK R&D Limited United KingdomReading Scientific Services Limited United KingdomSchweppes Limited United Kingdom
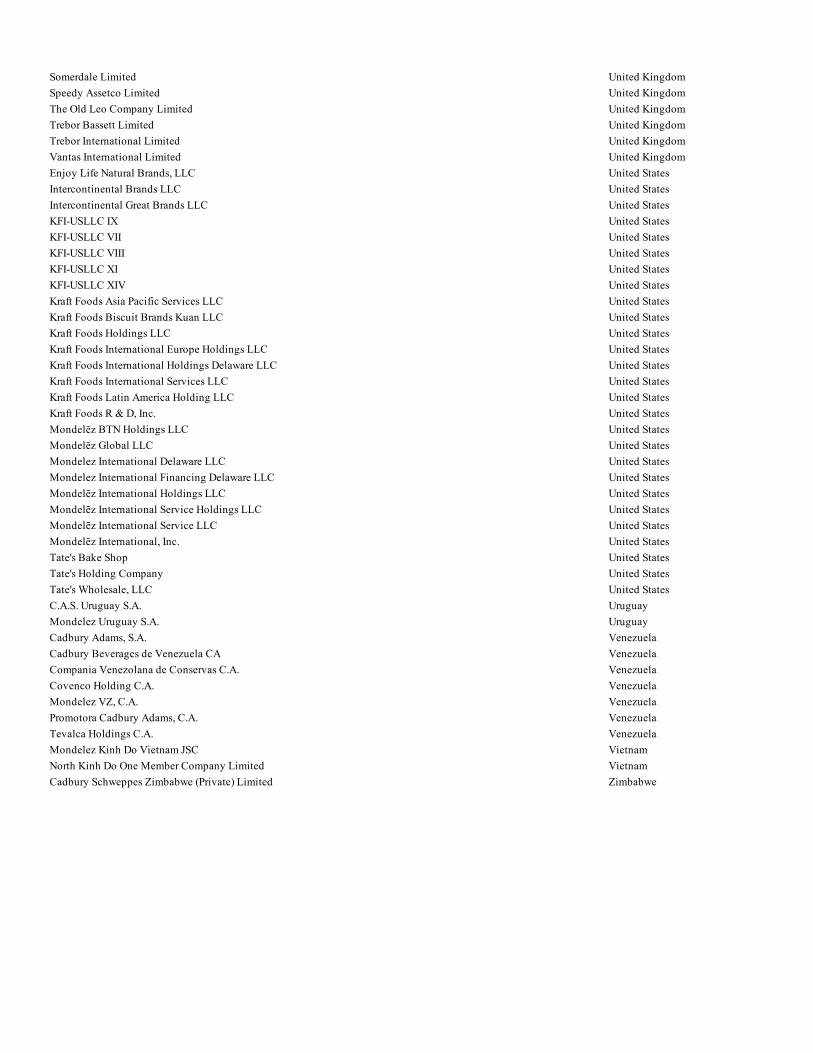
Somerdale Limited United KingdomSpeedy Assetco Limited United KingdomThe Old Leo Company Limited United KingdomTrebor Bassett Limited United KingdomTrebor International Limited United KingdomVantas International Limited United KingdomEnjoy Life Natural Brands, LLC United StatesIntercontinental Brands LLC United StatesIntercontinental Great Brands LLC United StatesKFI-USLLC IX United StatesKFI-USLLC VII United StatesKFI-USLLC VIII United StatesKFI-USLLC XI United StatesKFI-USLLC XIV United StatesKraft Foods Asia Pacific Services LLC United StatesKraft Foods Biscuit Brands Kuan LLC United StatesKraft Foods Holdings LLC United StatesKraft Foods International Europe Holdings LLC United StatesKraft Foods International Holdings Delaware LLC United StatesKraft Foods International Services LLC United StatesKraft Foods Latin America Holding LLC United StatesKraft Foods R & D, Inc. United StatesMondelēz BTN Holdings LLC United StatesMondelēz Global LLC United StatesMondelez International Delaware LLC United StatesMondelez International Financing Delaware LLC United StatesMondelēz International Holdings LLC United StatesMondelēz International Service Holdings LLC United StatesMondelēz International Service LLC United StatesMondelēz International, Inc. United StatesTate's Bake Shop United StatesTate's Holding Company United StatesTate's Wholesale, LLC United StatesC.A.S. Uruguay S.A. UruguayMondelez Uruguay S.A. UruguayCadbury Adams, S.A. VenezuelaCadbury Beverages de Venezuela CA VenezuelaCompania Venezolana de Conservas C.A. VenezuelaCovenco Holding C.A. VenezuelaMondelez VZ, C.A. VenezuelaPromotora Cadbury Adams, C.A. VenezuelaTevalca Holdings C.A. VenezuelaMondelez Kinh Do Vietnam JSC VietnamNorth Kinh Do One Member Company Limited VietnamCadbury Schweppes Zimbabwe (Private) Limited Zimbabwe
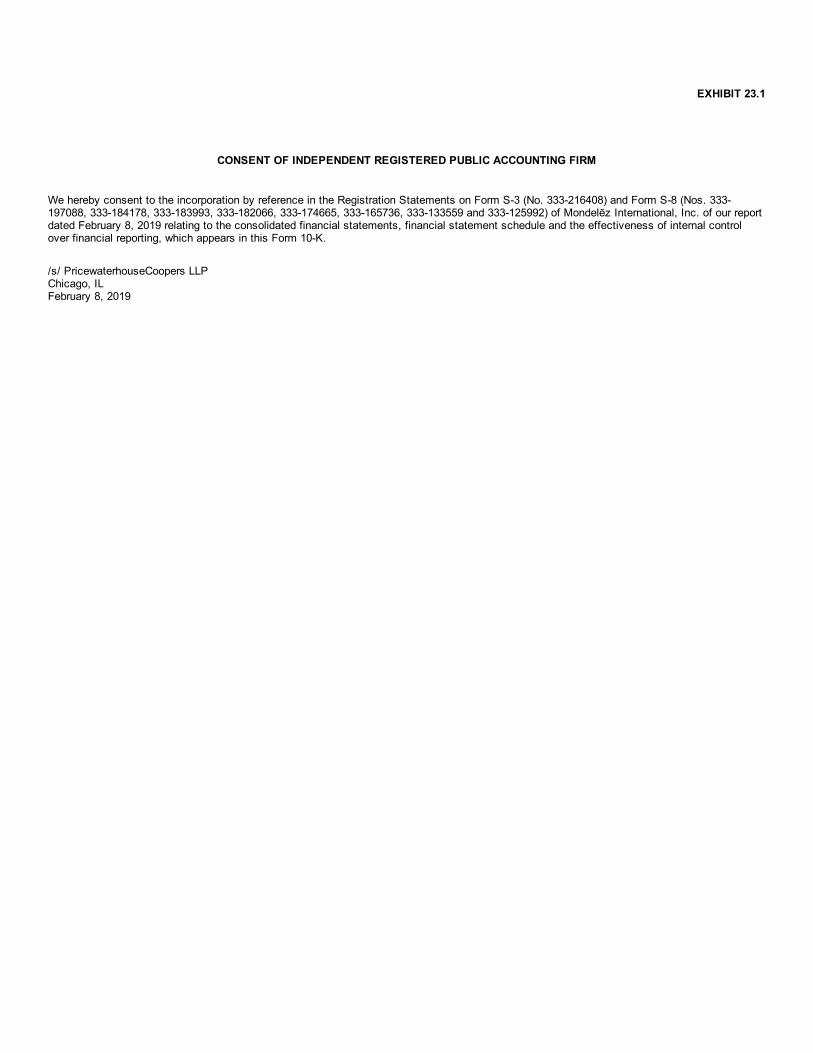
EXHIBIT 23.1
CONSENT OF INDEPENDENT REGISTERED PUBLIC ACCOUNTING FIRM
We hereby consent to the incorporation by reference in the Registration Statements on Form S-3 (No. 333-216408) and Form S-8 (Nos. 333-197088, 333-184178, 333-183993, 333-182066, 333-174665, 333-165736, 333-133559 and 333-125992) of Mondelēz International, Inc. of our reportdated February 8, 2019 relating to the consolidated financial statements, financial statement schedule and the effectiveness of internal controlover financial reporting, which appears in this Form 10-K.
/s/ PricewaterhouseCoopers LLP Chicago, IL February 8, 2019
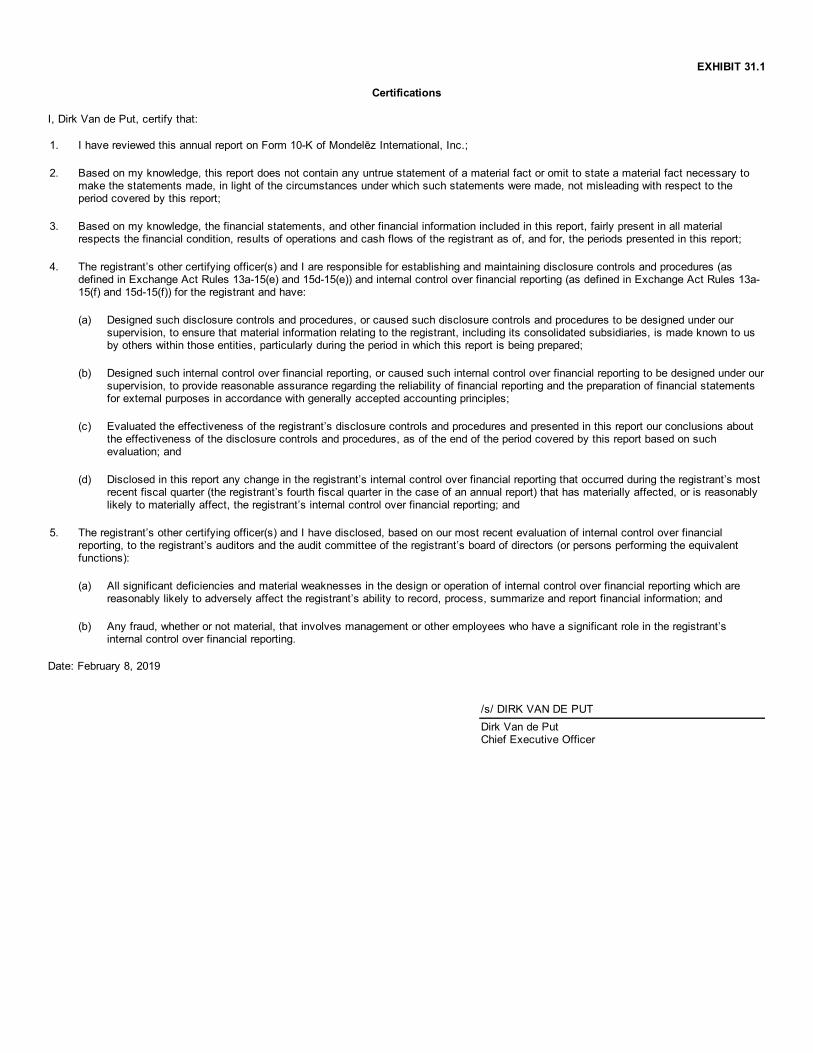
EXHIBIT 31.1
Certifications
I, Dirk Van de Put, certify that:
1. I have reviewed this annual report on Form 10-K of Mondelēz International, Inc.;
2. Based on my knowledge, this report does not contain any untrue statement of a material fact or omit to state a material fact necessary tomake the statements made, in light of the circumstances under which such statements were made, not misleading with respect to theperiod covered by this report;
3. Based on my knowledge, the financial statements, and other financial information included in this report, fairly present in all materialrespects the financial condition, results of operations and cash flows of the registrant as of, and for, the periods presented in this report;
4. The registrant’s other certifying officer(s) and I are responsible for establishing and maintaining disclosure controls and procedures (asdefined in Exchange Act Rules 13a-15(e) and 15d-15(e)) and internal control over financial reporting (as defined in Exchange Act Rules 13a-15(f) and 15d-15(f)) for the registrant and have:
(a) Designed such disclosure controls and procedures, or caused such disclosure controls and procedures to be designed under oursupervision, to ensure that material information relating to the registrant, including its consolidated subsidiaries, is made known to usby others within those entities, particularly during the period in which this report is being prepared;
(b) Designed such internal control over financial reporting, or caused such internal control over financial reporting to be designed under oursupervision, to provide reasonable assurance regarding the reliability of financial reporting and the preparation of financial statementsfor external purposes in accordance with generally accepted accounting principles;
(c) Evaluated the effectiveness of the registrant’s disclosure controls and procedures and presented in this report our conclusions aboutthe effectiveness of the disclosure controls and procedures, as of the end of the period covered by this report based on suchevaluation; and
(d) Disclosed in this report any change in the registrant’s internal control over financial reporting that occurred during the registrant’s mostrecent fiscal quarter (the registrant’s fourth fiscal quarter in the case of an annual report) that has materially affected, or is reasonablylikely to materially affect, the registrant’s internal control over financial reporting; and
5. The registrant’s other certifying officer(s) and I have disclosed, based on our most recent evaluation of internal control over financialreporting, to the registrant’s auditors and the audit committee of the registrant’s board of directors (or persons performing the equivalentfunctions):
(a) All significant deficiencies and material weaknesses in the design or operation of internal control over financial reporting which are
reasonably likely to adversely affect the registrant’s ability to record, process, summarize and report financial information; and
(b) Any fraud, whether or not material, that involves management or other employees who have a significant role in the registrant’s
internal control over financial reporting.
Date: February 8, 2019
/s/ DIRK VAN DE PUTDirk Van de PutChief Executive Officer
EXHIBIT 31.2
Certifications
I, Luca Zaramella, certify that:
1. I have reviewed this annual report on Form 10-K of Mondelēz International, Inc.;
2. Based on my knowledge, this report does not contain any untrue statement of a material fact or omit to state a material fact necessary tomake the statements made, in light of the circumstances under which such statements were made, not misleading with respect to theperiod covered by this report;
3. Based on my knowledge, the financial statements, and other financial information included in this report, fairly present in all materialrespects the financial condition, results of operations and cash flows of the registrant as of, and for, the periods presented in this report;
4. The registrant’s other certifying officer(s) and I are responsible for establishing and maintaining disclosure controls and procedures (asdefined in Exchange Act Rules 13a-15(e) and 15d-15(e)) and internal control over financial reporting (as defined in Exchange Act Rules 13a-15(f) and 15d-15(f)) for the registrant and have:
(a) Designed such disclosure controls and procedures, or caused such disclosure controls and procedures to be designed under oursupervision, to ensure that material information relating to the registrant, including its consolidated subsidiaries, is made known to usby others within those entities, particularly during the period in which this report is being prepared;
(b) Designed such internal control over financial reporting, or caused such internal control over financial reporting to be designed under oursupervision, to provide reasonable assurance regarding the reliability of financial reporting and the preparation of financial statementsfor external purposes in accordance with generally accepted accounting principles;
(c) Evaluated the effectiveness of the registrant’s disclosure controls and procedures and presented in this report our conclusions aboutthe effectiveness of the disclosure controls and procedures, as of the end of the period covered by this report based on suchevaluation; and
(d) Disclosed in this report any change in the registrant’s internal control over financial reporting that occurred during the registrant’s mostrecent fiscal quarter (the registrant’s fourth fiscal quarter in the case of an annual report) that has materially affected, or is reasonablylikely to materially affect, the registrant’s internal control over financial reporting; and
5. The registrant’s other certifying officer(s) and I have disclosed, based on our most recent evaluation of internal control over financialreporting, to the registrant’s auditors and the audit committee of the registrant’s board of directors (or persons performing the equivalentfunctions):
(a) All significant deficiencies and material weaknesses in the design or operation of internal control over financial reporting which are
reasonably likely to adversely affect the registrant’s ability to record, process, summarize and report financial information; and
(b) Any fraud, whether or not material, that involves management or other employees who have a significant role in the registrant’s
internal control over financial reporting.
Date: February 8, 2019
/s/ LUCA ZARAMELLALuca ZaramellaExecutive Vice President andChief Financial Officer
EXHIBIT 32.1
CERTIFICATIONS OFCHIEF EXECUTIVE OFFICER AND CHIEF FINANCIAL OFFICER
PURSUANT TO 18 U.S.C. SECTION 1350, AS ADOPTED PURSUANT TO SECTION 906 OF THESARBANES-OXLEY ACT OF 2002
I, Dirk Van de Put, Chief Executive Officer of Mondelēz International, Inc. (“Mondelēz International”), certify, pursuant to 18 U.S.C. Section 1350,as adopted pursuant to Section 906 of the Sarbanes-Oxley Act of 2002, that Mondelēz International’s Annual Report on Form 10-K for the yearended December 31, 2018, fully complies with the requirements of Section 13(a) or 15(d) of the Securities Exchange Act of 1934 and that theinformation contained in Mondelēz International’s Annual Report on Form 10-K fairly presents in all material respects Mondelēz International’sfinancial condition and results of operations.
/s/ DIRK VAN DE PUTDirk Van de PutChief Executive OfficerFebruary 8, 2019
I, Luca Zaramella, Executive Vice President and Chief Financial Officer of Mondelēz International, Inc. (“Mondelēz International”), certify, pursuantto 18 U.S.C. Section 1350, as adopted pursuant to Section 906 of the Sarbanes-Oxley Act of 2002, that Mondelēz International’s Annual Report onForm 10-K for the year ended December 31, 2018, fully complies with the requirements of Section 13(a) or 15(d) of the Securities Exchange Act of1934 and that the information contained in Mondelēz International’s Annual Report on Form 10-K fairly presents in all material respects MondelēzInternational’s financial condition and results of operations.
/s/ LUCA ZARAMELLALuca ZaramellaExecutive Vice President andChief Financial OfficerFebruary 8, 2019
A signed original of these written statements required by Section 906, or other document authenticating, acknowledging, or otherwise adopting thesignature that appears in typed form within the electronic version of this written statement required by Section 906, has been provided to MondelēzInternational, Inc. and will be retained by Mondelēz International, Inc. and furnished to the Securities and Exchange Commission or its staff uponrequest.


![[1059] 5.5 % & b s Y- — 11-1 1989 b: 1 2. 89 2. 89 2. …data.jci-net.or.jp/data_pdf/11/011-01-1059.pdf[1059] 5.5 % & b s Y- — 11-1 1989 b: 1 2. 89 2. 89 2. 89 2. 90 cm 2/ 3290](https://img.pdfslide.us/doc/110x75/5f7b57e0e1683b73d5699b9f/1059-55-b-s-y-a-11-1-1989-b-1-2-89-2-89-2-datajci-netorjpdatapdf11011-01-1059pdf.jpg)