Embed Size (px)
Citation preview
LATIN AMERICA
Alejandro LorenzoPresident, Latin America
INVESTOR DAY 2018
Agenda
2
LA – Our business today
Consumer and market trends
Our growth plans
INVESTOR DAY 2018
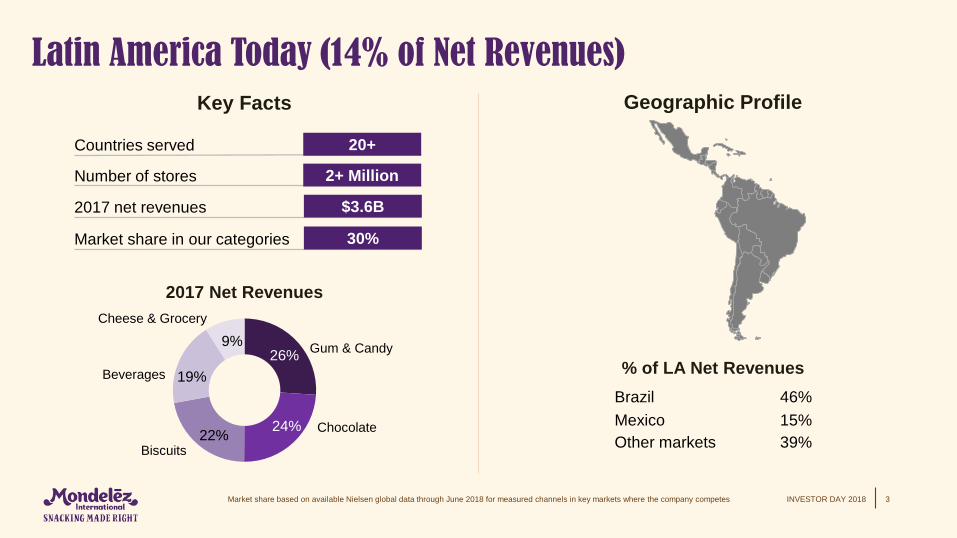
Latin America Today (14% of Net Revenues)
Market share based on available Nielsen global data through June 2018 for measured channels in key markets where the company competes 3
Key Facts
Chocolate
Beverages
Cheese & Grocery
Biscuits
Gum & Candy
2017 Net Revenues
Geographic Profile
% of LA Net RevenuesBrazil 46%Mexico 15%Other markets 39%
Countries served
Number of stores
2017 net revenues
Market share in our categories
$3.6B
30%
2+ Million
20+
26%
22%
19%
9%
24%
INVESTOR DAY 2018
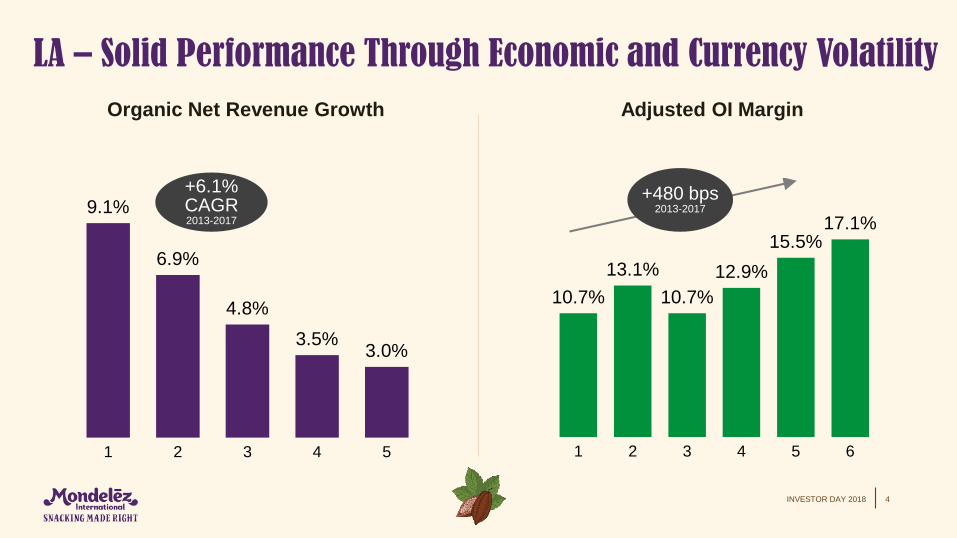
10.7%13.1%
10.7%12.9%
15.5%17.1%
1 2 3 4 5 6
9.1%
6.9%
4.8%3.5% 3.0%
1 2 3 4 5
LA – Solid Performance Through Economic and Currency Volatility
4
Organic Net Revenue Growth Adjusted OI Margin
+6.1%CAGR2013-2017
+480 bps2013-2017
INVESTOR DAY 2018
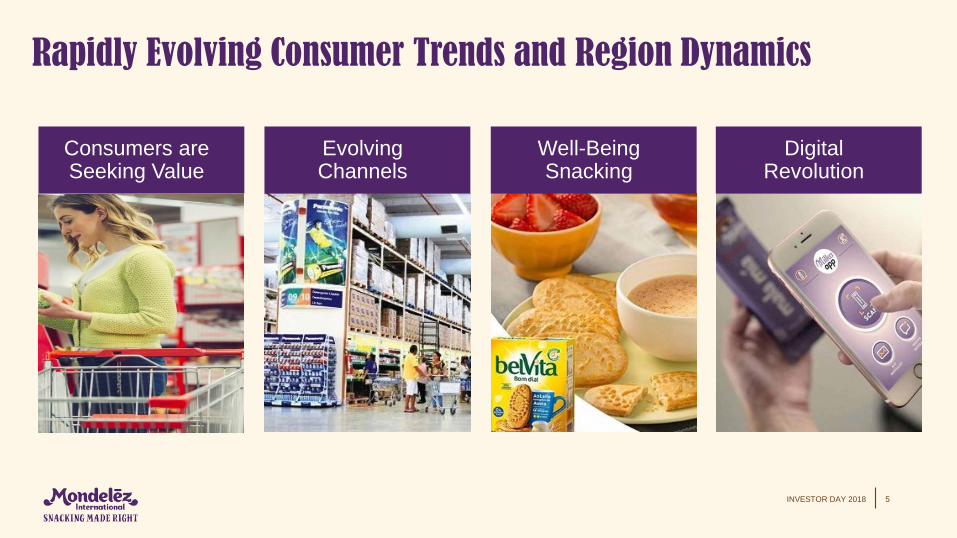
Rapidly Evolving Consumer Trends and Region Dynamics
5
Consumers are Seeking Value
Well-BeingSnacking
EvolvingChannels
DigitalRevolution
INVESTOR DAY 2018
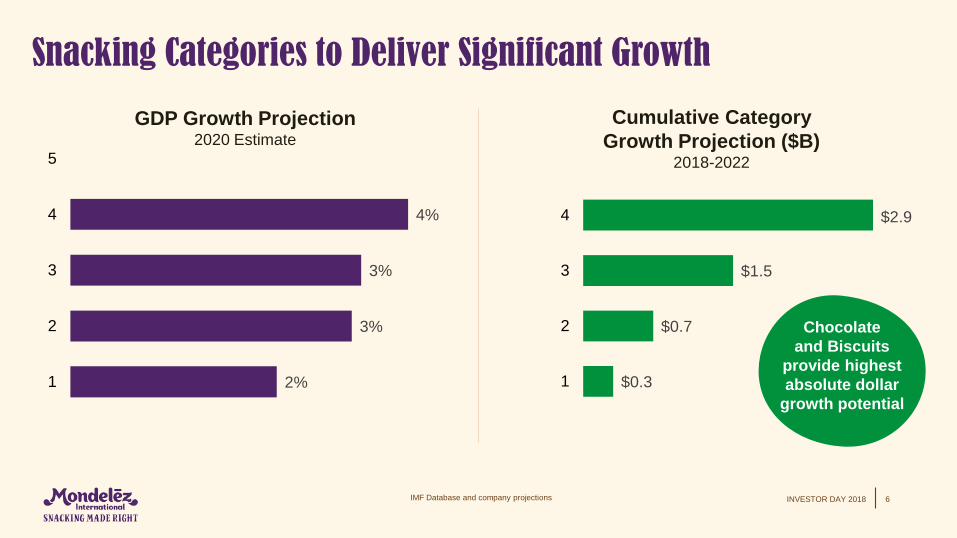
$0.3
$0.7
$1.5
$2.9
1
2
3
4
Snacking Categories to Deliver Significant Growth
IMF Database and company projections 6
Cumulative Category Growth Projection ($B)
2018-2022
Chocolateand Biscuits
provide highest absolute dollar
growth potential
GDP Growth Projection2020 Estimate
2%
3%
3%
4%
1
2
3
4
5
INVESTOR DAY 2018
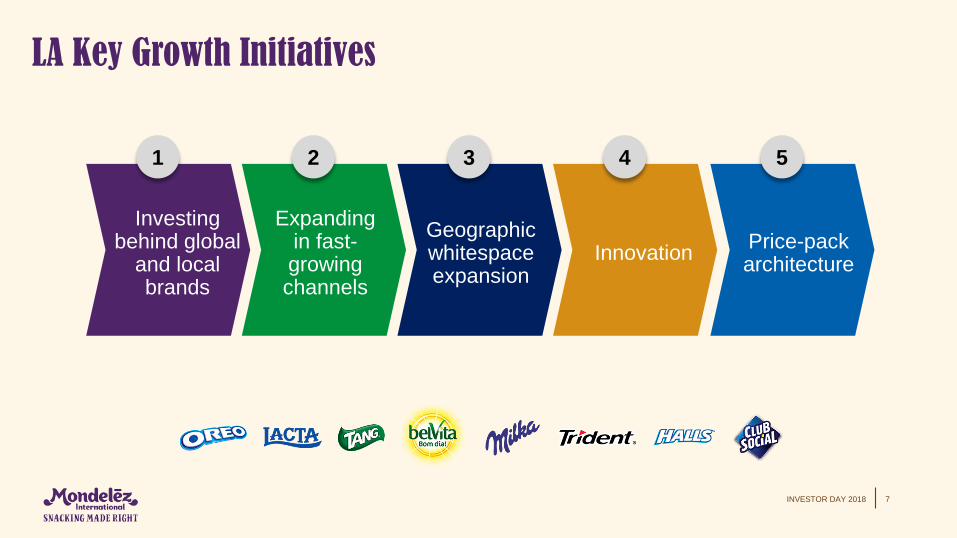
LA Key Growth Initiatives
7
1 2 3 4 5
Expanding in fast-growing channels
Geographic whitespace expansion
Innovation Price-pack architecture
Investing behind global
and local brands
INVESTOR DAY 2018
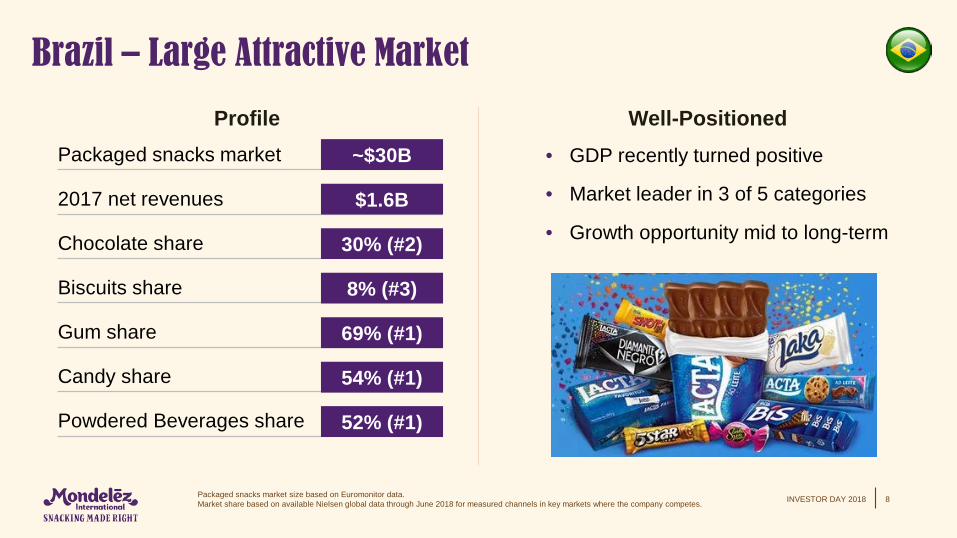
Brazil – Large Attractive Market
8
• GDP recently turned positive
• Market leader in 3 of 5 categories
• Growth opportunity mid to long-term2017 net revenues
Packaged snacks market
Chocolate share
Gum share
Biscuits share
Candy share
Powdered Beverages share
$1.6B
30% (#2)
~$30B
69% (#1)
54% (#1)
8% (#3)
52% (#1)
Packaged snacks market size based on Euromonitor data. Market share based on available Nielsen global data through June 2018 for measured channels in key markets where the company competes.
Profile Well-Positioned
INVESTOR DAY 2018
` ` ` `
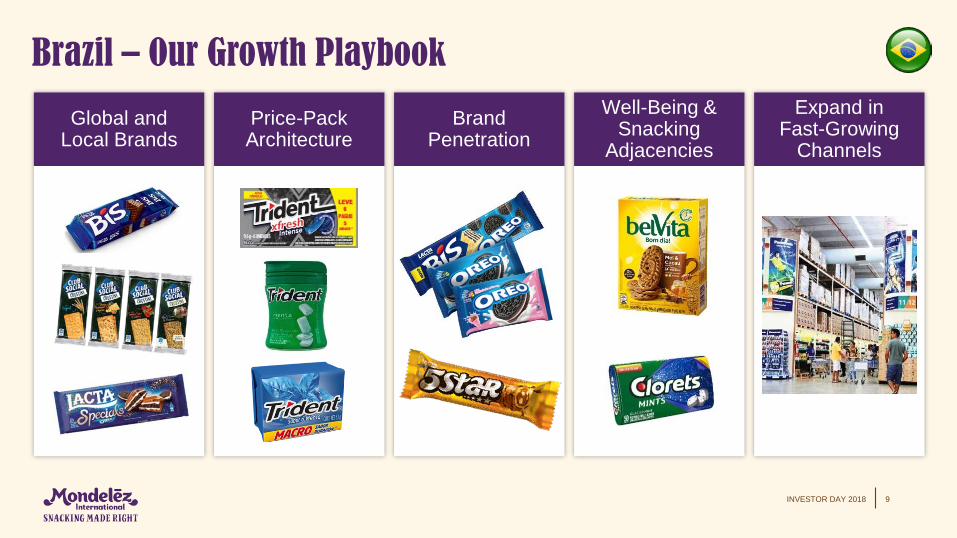
Brazil – Our Growth Playbook
9
`
Global andLocal Brands
Price-Pack Architecture
BrandPenetration
Well-Being & Snacking
Adjacencies
Expand inFast-Growing
Channels
INVESTOR DAY 2018
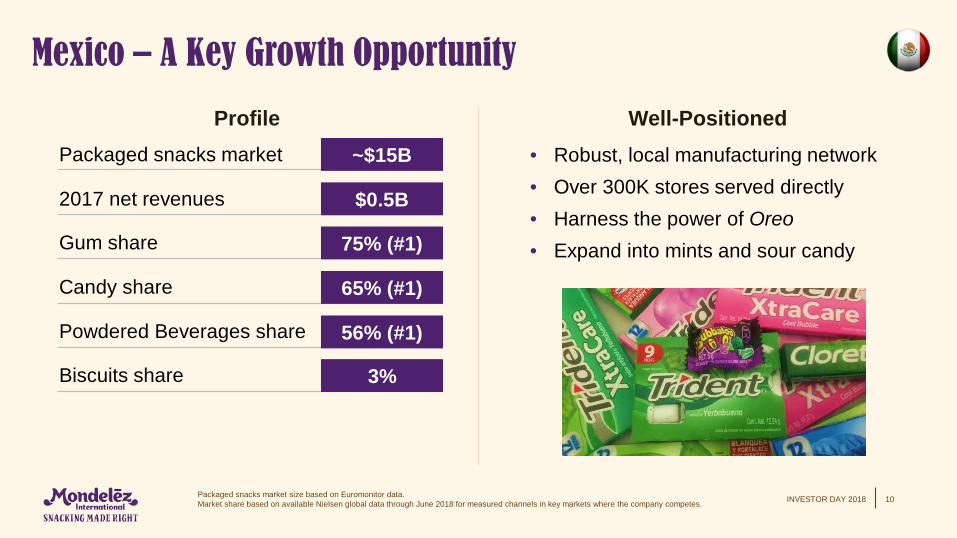
Mexico – A Key Growth Opportunity
10
• Robust, local manufacturing network• Over 300K stores served directly• Harness the power of Oreo• Expand into mints and sour candy
2017 net revenues
Packaged snacks market
Biscuits share
Candy share
Gum share
Powdered Beverages share
$0.5B
3%
~$15B
65% (#1)
56% (#1)
75% (#1)
Packaged snacks market size based on Euromonitor data. Market share based on available Nielsen global data through June 2018 for measured channels in key markets where the company competes.
Profile Well-Positioned
INVESTOR DAY 2018
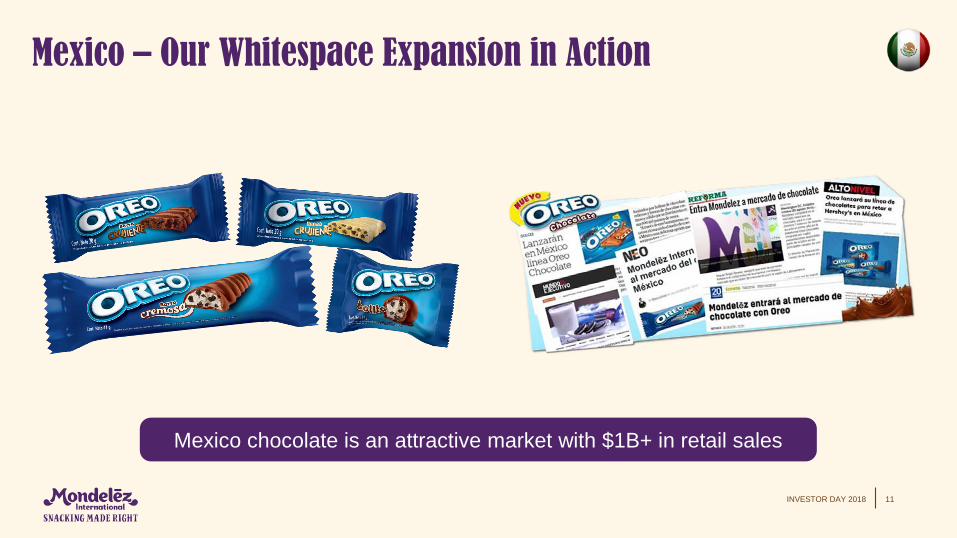
Mexico – Our Whitespace Expansion in Action
11
Mexico chocolate is an attractive market with $1B+ in retail sales
INVESTOR DAY 2018
In Summary… LA Well-Positioned to Drive Growth
12
• Gain market share in snacks as top priority
• Leverage strong foundation to enable future growth
• Unleash portfolio via agile, local-first culture
• Pursue white spaces in markets, categories and channels