Embed Size (px)
Citation preview

~
29A 2?,89
CIVIL ENGINEER!NG STUDIES ;()_ 2.., STRUCTURAL RESEARCH SERIES NO. 89
A STUDY OF BLAST LOADING
TRANSMITTED TO BUILDING FRAMES
? :; f ::: :: (' ~.~ .:-:-: <. -~-,
~~.. ~; ~~_ ~ =:. -.~ ~::: G 2:"i' ;.;
- .
~.' .... '- .... --,.. .... ' .-. - : .. --;
~ ~.~ .~ __ .~ _w< • __ ",' .'-:::;
613C?l
By W. J. FRANCY
and
N. M. NEWMARK
Technical Report
to
OFFICE OF NAVAL RESEARCH
Contract N6ori-071 (06), Task Order VI
Project NR-064-18 3
UNIVERSITY OF ILLINOIS
URBANA, ILLINOIS
A STUDY OF~- 'RT.AST l.JJADING -TRANSMITTED -- -- ----------TO BUILDING 'FRAMES
by
w. J. Francy and N. M. Newmark
A Technical Report of a Research Program
Sponsored by
THE OFFICE OF NAVPL RESEARCH DEPARTMENT OF THE NAVY
In Cooperation With
THE DEPARTMENT OF CIVIL ENGINEERING UNIVERSITY· OF· ILLINOIS
Contract N6ori-07l(06), Task Order VI Prog~am NR-064-183
'Urbana, Illinois December 1954

CONTENTS"
ACKNOWLEOOMENT
I. INTRODUCTION
Introductory statement 0 •
Notation 0 0
II. INITIAL ELA.SrIC BEHAVIOR OF WALL PANELS
A. Statement of the Problem • • • • •
B. Reaction and Moment Expressions
III. PLASTIC BEHAVIOR OF WALL PANELS
A. statement of the Problem ••
B. Reaction Expression
C. Duration of Plastic Behavior
TV. ELASTIC RECOVERY PHASE OF WALL P.ANEL BEHAVIOR
A. Statement of the Problem
Bo Reaction Expression
V," RESULTS.AND DISCUSSION
• .. • .a •
. ,.
. . . .
A. Frame Load Charts o • • •
B. Tables and Graphs of Results
Co Frame Laacls After Termination of Load. Pulse 0. • • •
VI. SUMMARY Al\fD CONCLUSIONS
A. Applications o.f Frame Load Charts
Bo Conclusions o • • • 0 0 • • • • •
BIBLIOGRAPIfi
iii
iv
1
4
6
9
17
18
·20
23
24
32
34

iv
ACKNOWLEOOMEET
The author wishes to thank Professor :r{. M. Newmark, Research
Professor of structural Engineering at the University of illinois,
for his guidance and encouragement during the preparation of this
thesis, and to express his appreciation to Professor L. E. Goodman,
:formerly of the University of Illinois, for his many helpful sug
gestions and criticisms.

A STUDY OF BLAST LOADING
TRANSMITrED TO BUILDING FRAMES
I. INTRODUCTION
A. Introductory statement
The loading which a structure experiences due to the pressure waves
accompanying blasts from high explosive and atomic bombs has been the
subject of much study and research since the use of such bombs was begun
in the last war 0 The advent of more powerful atomic bombs and of the
"super tf bombs has increased even more the urgency of discovering with
greater exactness the nature of blast loads on structures.
A recent study in the field of blast lOading(l) has concluded that
a generalized triangular pulSe is a good approximation to the actual
transient loads which the front wall of a structure ~~erienceso However
depenullig on the action of the wall covering, the shape of the load=time
ctu~ves that reach the building frame itself may be quite different from
the pulse which impinges on the wall panelso It is the purpose of this
thesis to study the load-time relationship for the load transmitted by
the wall covering to the supporting frameo
The problem is necessarily complex and is approached by making use
of certain simplifying assumptionso The most important are~
(1) Given a typical bay of a one-story frame-type building, consider
that the wall covering of the bay- consists of a tlnest ll of closely-
spaced beams of unit width which are simply supported and act
(l)N. M. Newmark, HAn Engineering Approach to Blast Resistant Design", Proceedings ~SCE, Vole 79, Separate Noo 306, October 1953~
-1-

2
independently of one another. (Figure 1) These beams are
used in this study to approximate the action of a slab covering.
(2) Assume that the pressure loading which :impinges on the wall
panels can be represented by a triangular pulse function. (2)
.(Figure 2)
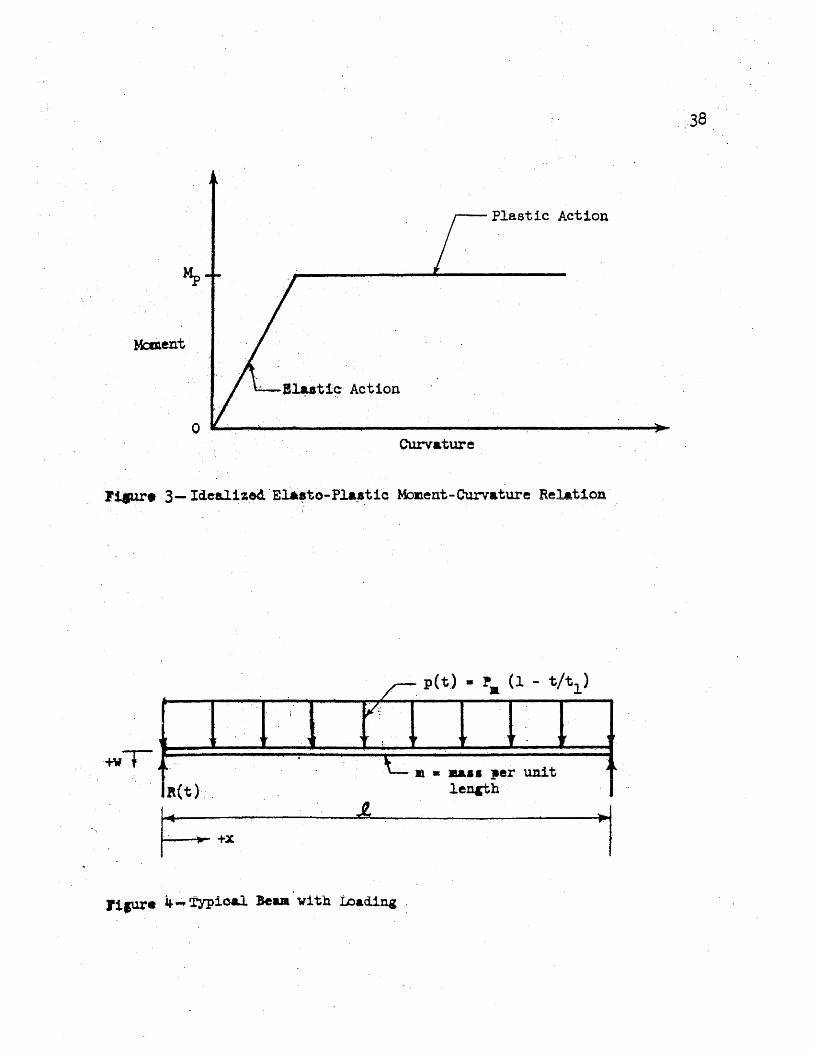
(3) Assume ideal elasto-plastic action of the beams. (Figure 3)
(4) Assume that the frame members supporting the wall covering
remain fixed in space; at least during the interval for which
this study is madeo
It is doubtful that movement of the frame would have much effect on
the loads reaching the frame members.. A deflect ion of' the frame away
from the blast source would result in a slight decrease in the beam end
reactions; but, since the period of vibration.of the supports is much
larger than that of the wall panels, the effect should be negligible except
possibly for load pulses of very long duration.
If the beams which approximate the wall covering were perfectly rigid
and massless, the shape of the load transmitted to the frame would be
identical to that of the blast pressure pulse (Figure 2). However in our
case, the beams have mass and also have elasto-plastic characteristics;
therefore, the load which reaches the support~lg members is much alteredo
In order to determine the frame loading for the give!l assumptions,
an elastic analysis and a simple plastic a.:.."lS.lysis are usedo The elastic
analysis is derived :from the familiar dyna:m.ic beam equation (1) and the
plastic one comes from a simplified consideration of beam action when a
(2)N. M. Newmark, 'iTAn Eng~"'1eering Approach to Blast Resistant DesigniY:; Proceedings ASCE, Vol. 79J Separate Noo 306, October 1953~

plastic hinge forms at the center. From these two analyses expressions
for the dynamic end reaction of the beams on the supports are derived.
Frame load charts giving the variation of dynamic end reaction
3
(frame load per unit height) with respect to time are drawn for different
beam resistance characteristics and different load pulse durations. The
frame loads are compared graphically with the load which the beam receives
as a result of the blast :pressure wave. Load-time curves for the supporting
frame are shown only for the duration of the loading pulse; however, a
method is indicated by which the relation may be found for times beyond
the end of the pulse.
As brought out in a subsequent section of this study, the elastic
reaction expression involves the sum of a trigonometric series 0 For certain
durations of loading pulses, the curves for one term, three terms and six
terms are drawn for comparison. By means of this graphical comparison of
a few representative pulse d~rratjons, it is demonstrated that the use of
only the ~irst term gives results which are fairly accurate for long pulses
but not very accurate for short pulseso For all the remaining pulse
durations, only the first mode (one term) is used although this is only an
approxiInation to the exact relation TN'hich theoret,ically would require an
infinite number of terms" No attempt is made by analytical means to
evaluate the accuracy obtainable for various pulse durations by using only
the first mode • Such an evaluation could be made the subject of further
study. The advantages of using the first mode approximation ir+ the
construction of the frame load charts is apparent, however, and such
use is intended ..

4
Bo Notation
Terms used in the <following sections are defined as they appear.
They are assembled here for convenience in reference. Dimensions of
the quantities are indicated by the symbols- F, M, L, T in parentheses :,
meaning respectively force, mass, length and t:imeo
a2 = EI/m (L
4/rf2) e
e
q>(t)
K
= angular displacement
= ~~ar velocity (liT)
= angular acceleration (1/T2)
tl = :impulse of load = J pdt (FTjL)
o = time distribution factor
i. = length of beam (wall panel strip) (L)
m = mass per unit length of beam (M)
~ = dynamic bending moment at center of beam (FL)
~ . = f'ully plastic moment of beam (FL)
Ms = max:irnum static center moment = Pm£2j8 (FL)
Mu = ultimate moment - carrJing capacity of beam (FL)
p = instanta1J.eous vcUue of applied pressure load (F/L) 00
p(x) = I PnXn = space distribution factor
n P = maxinr..:un value of applied :pressure load (F /L)
m
~ = dynamic end reaction (F)
= m&~imum static end reaction = P £/2 (F) m
t = time (T)
tl = duration of load pulse (T)
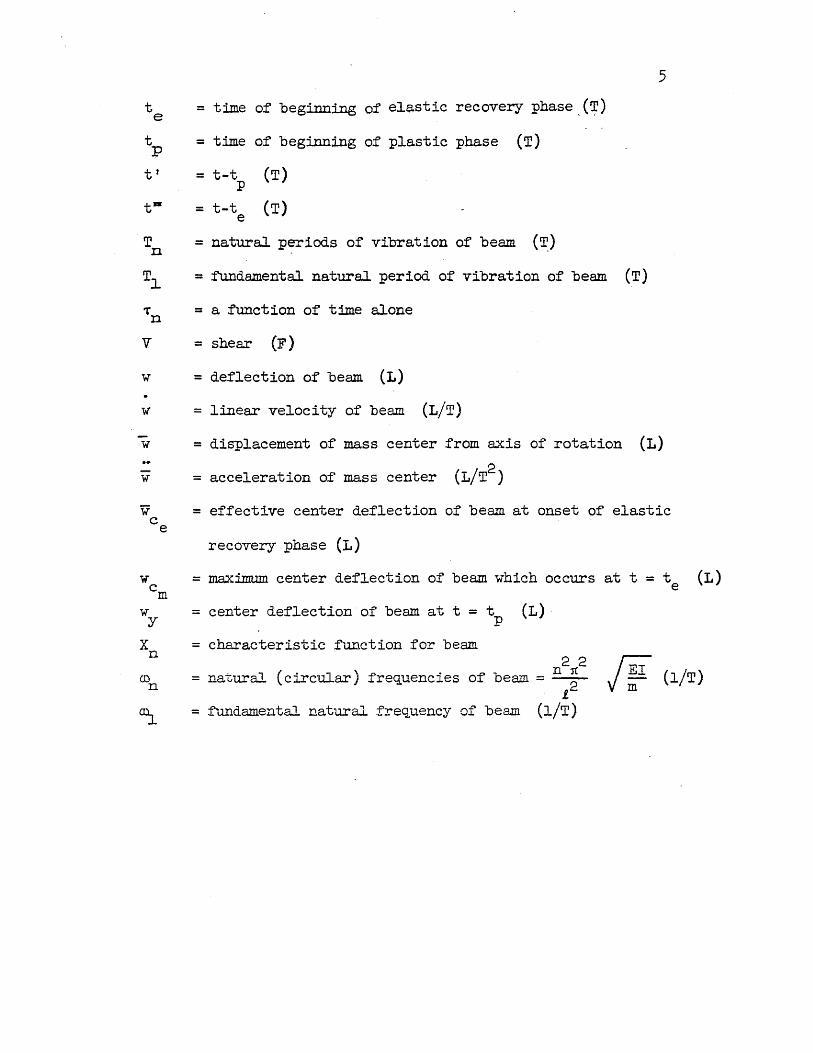
5
t = time of beginning of elastic recovery phase,(~) e
tp = time of beginning of plastic phase (T)
tf = t-t (T) p
t- = t-t (T) e
Tn = natural periods of vibration of beam (~)
Tl = fundamental natural. period of vibration of beam (T)
= a function of time alone
v = shear (F)
w = deflection of beam (L)
w = linear velocity of beam (LIT)
~ = displacement of mass center from axis of rotation (L)
w = acceleration of mass center (L/T2 )
w = effective center deflection of beam at onset of elastic c e
recovery phase (L)
= maximum center deflection of beam which occurs at t = t (L) e
Wy = center deflection of beam at t = tp (L)
X n
CD n
= characteristic function for beam 2 2 r;;-
= natural (circular) frequencies of beam = n ~ V ~ (l/T) 1
= :fundamental natural frequency of beam (l/T)

6
II. mITIAL ELASTIC BEHAVIOR OF WALL PANELS
Ao statement of the Problem
10 The Dynamic Beam Equation(3)
When a beam resists moving loads, the governing differential equation
of motion for the beam is, according to the ordinary Bernoulli-Euler
theor,y of flexure,
P X cp{t) Ii n I
a2 4 + o2w = £ = pex} 2(t) = _n ____ _ ox~ Ot2 m m m
(1)
where a2 = EI/m; w = deflection measured normal to the beam axis; m = mass
per unit 1ength~ p = external applied unit loatl; x = distance measured
f"""rom origin at left end of beam; and t = tim~ 0 'The external applied load co
is- -defined by a space distribution factor.? p{x) = "\ P X and a time L n n
-distribution factor, cp{ t) ~ Figu!"e 4 is a simPlii'i~d sketch of the loading .
. on a typical beam. For the given triw_gular load. ";ilg pulse, p(x} = 1 since
the beam is assumed to be unif'ormly lo&.-:ecl,9 anC4 o;{t) == Pm{l - t/t1)o The
characteristic function p X J for a s-i'mpl;y· supported beam is sin (nroc/ £.) 0
. n
The constants J P , are defined as ~ n
J g
o p = ------~--~-
n J~ '-0
X 2 d.."'{ n
Substituting in (2) and perform.ing the inte~ations leads tOg
Pn 4 .,
3.'1 5.'1 7 = -for n = ..... 0 0 0
n:n: -:""'J
p = 0 for n = 0.'1 2.9 4, 6 o ..... 0 •
n
(2)
(3 )See for example:; So Timoshenko:J i~Vibration Problems in Engineeringll, D. Van Nostrand COO) Inco~ New York~ N. Ye; Second Edition, July 1937, p~ 332"

7
The solution to (1) is taken in the form
where X = sin (n~/l), a function of x alone, and where T is a function n n
of time alone 0 The substitution of (3) in (1) with the subsequent
separation of variables leads to the following differential equations:
iiI I m 2X
X n n 0
2 = n a
.- 2 P q>( t)
n 1" +w 1" = n n n m
The solutions of (4) and (5) are respectively~
X n
T n
• n1C{ = Sl..D. --2.
=A cos . ill t n n
(alwElJSS true for s:i.mplysupported -beam)
+B sin ill t n n
(4)
(6)
p
r It qJ(t) ft (l)n tdt 1 + --E.- sin ru t cos CD tdt - cos rut q>{t) sin mro n n n n L 0 0
~
(7)
Equation (7) is the solution to the single-degree of freedom Equation (.5)" (4)
The first two terms in (7) are the free vibration terms and the last two
the ~orced vibration terms. For initial conditions of zero displacement
and zero velocity, ~he free vibration terms disappear since
( 4 ) S. Timoshenko, UVibration Problems in R.YJ.gineeringn, DC' Van Nostrand Coo J
Inc., New York, N. Y.) Second Edition, July 1937, po 348.

1.
J' w (x) X ax o n A =_0 _____ _
n J1. X 2 dx
n o
l,
J ;, (x) X dx 1 0 0 n
B =--------n (l) 1.
n J Xn2 dx
o
8
where w (x) and ~ (x) are the displacement and velocity respectively at o 0
zero time.
Substituting Equations (6) and (7) into the expression for deflection
(3), yields the following:
00
w =2: p n . n1tX
- Slll-mill 1.
n n
Substituting the values of P and <pet) in (8) and integrating, results in n
the following expression for w:
( n2~2/i.2) F Noting that (0 for a simply-supported beam = J~ a, where a = EI m: n
4p £4 00 r t I sin ClL t \ 1 m \' 1 n10C I (1 COS CD t) - -.1 1 , II 1 I (q) w == 5 SJ.D i -rc5EI L L\~ n t \- ron t ) J "'" I
n ). n=1,3,5---
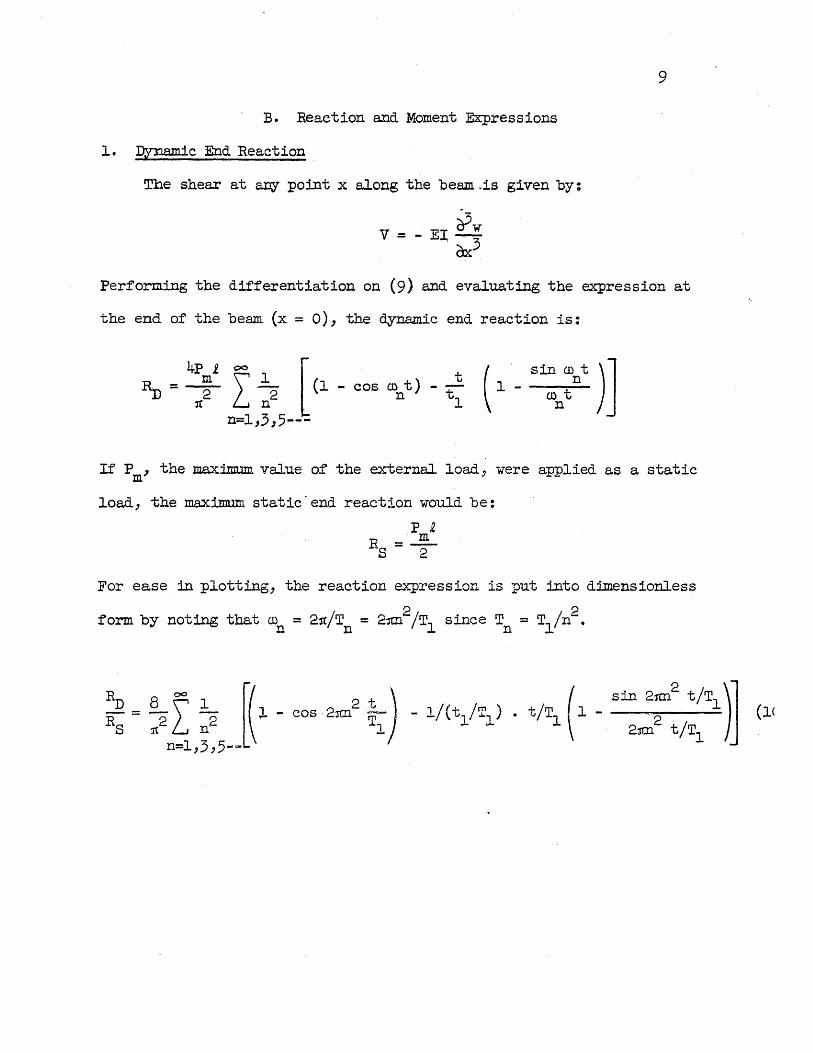
B. Reaction and Moment Expressions
1. Dynamic . End Reaction
Tbe shear at a:rJY point x along the beam -is given by:
'?Pw V=-El;-
Ox3
9
Performing the differentiation on (9) and evaluating the expression at
the end of the beam (x = 0), the dynamic end reaction is:
If P , the maximum value of the external. load, were applied as a static m
load, the maximum static-end reaction would be:
p 2 m
Rs=T
For ease.in plotting, the reaction expression is put into dimensionless
.form by noting that con = 21t./Tn = 21m2
/Tl since Tn = T1/n2
•

10
2. Magnitude of Reaction for LOng Pulses
As the duration of the load pulse ,goes to infinity, the coefficient
of the second term in (10) approaches zero and the reaction approaches:
lim ~ = :2 I ~2 (1 - cos 2m2 T~) n=1,3,5---
The maximum reaction then approaches:
DC 00
lim ~ I -~ = lim 16 I 222 -~ n 1C
n=odd n=odd
00
~2 I where lim I
The limit of the summation exists as shown. It is given by the Riemann Zeta
Function, the values of which are tabulated. (5)
For x = 2':;
2 .. 00
n=odd
Then :for pulses of duration approaching infinity, the dynamic reaction
approaches a value twice the maximuE static reaction. This result is
to be expected from energy considerations.
( 5 )Eo Jahnke and F. EmcLe, uTables of Functions wi th Formulae and Curves n ,
Dover Publications, New York, No YO) Fourth Edition, 1943-
11
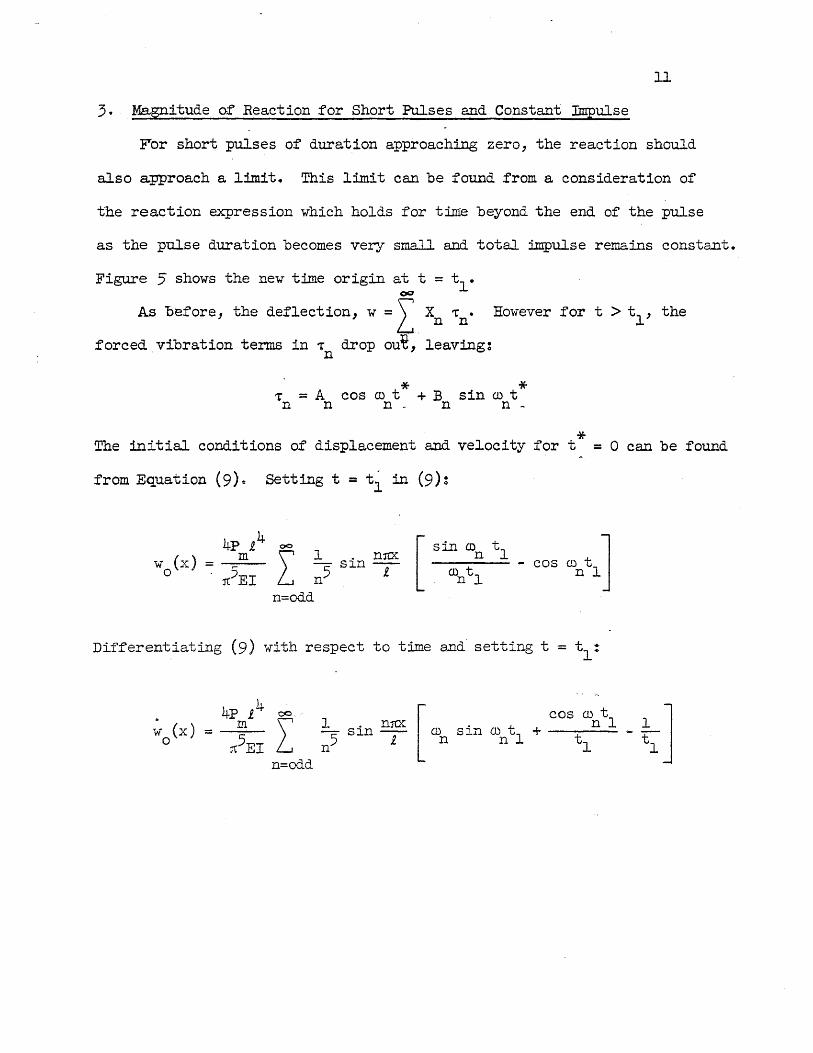
3. Magnitude of Reaction for Short Pulses and Constant Impulse
For short pulses of duration approaching zero, the reaction should
also approach a limit. This limit can be found from a consideration of
the reaction expression which holds for time beyond the end of the pulse
as the pulse duration becomes very small and total impulse remains constant.
Figure 5 shows the new time origin at t = t l • 00
As bef'ore, the deflection, w = I Xn 'tn· However for t > t l , the
forced vibration terms in ~ drop ou£, leaving: n
* T = A cos ru t + B n n n - n
* sin ill t n -
* The initial conditions of displacement and velocity for t = 0 can be found
from Equation (9)" Setting t = t~ in (9)~
w (x) = o I
oo 1 . n1lX - Sln--n5 £
n=odd
Differentiating (9) with respect to time and setting t = tl!
o
W (x) = o
4p 14 ~ ~ \ sin n~
rt EI L n n=odd

Values of A and B are then: n n
( v A = --.0_. _____ _
n J1 where Xn = sin n;x
o
B n
* Then for t = t - tl:
X 2 dx n
1
11 0
=-CD It n
0
;, (x) X dx o n
X 2 dx n
12
4p 1. 4 DO [( sin CDnt1 ~ (1) t cos CD t ) mIl. m1C{ * nl nl w (x) = 5 5 Sln -1.- cos ron t lin tl
:rc EI n=odd n

13
As before, find the shear and evaluate at x = q in order to get the
dynamiC end reaction:
4p 1 m
~=-2-~ I
OC'l
.2 n=Odd n
* + sin CD t n -
For aQY pulse duration, the impulse of the load is:
Now let tl o keeping the total impulse constant ..
rapidly, and in-terms of I is given by~
(ll)
P then increases m
Replacing Pm in (11) by its value in terms of I and taking t l - inside the
summation~
00
IL = 8!£ \' 1 r1
1) ltc' n=~d nCo
* + sin ill t n -

14
Now let tl approach zero:
lim ~ = 8~1 1( I
aO 1 '% S";,.., .. M. t* 41l IoO con. t* - - ...I.,..U. VJ - -- n2 Sill con _ n 2 2 'n - - 1(2
n=Odd n~odd
t, • 0 oJ.
Noting again that ron = 2n:/Tn and replacing I by (1/2) Pm tl:
~ 8t 000
lim-=2 L RS 1C
.n= d
Take the first mode by letting n = 1:
* sin ill t ' n -
(12)
The foregoing derivation has shown that for the conditions of very
short pulse duration (s80' when t1/T1 < 1/3) and constant impulse, the peak
normalized reaction approaches a value equal to (8/n: ) t1/T1. A plot -
of -reaction for t > tl in which the load pulse satisfies the two conditions
should verif'y (12)0
4. Dynamic Center Moment and Beam Resistance Parameter
The moment at a:ny point x' along the beam is given by:
2 M=_EI OW
Ox2

15
Performing the differentiation on (9), evaluating at x = 1./2 and noting
that P 12/8 is the maximum static center moment if P were applied as m m
a static load:
n-l
~=32 ~ i#2 Ms ~ ~odd Ii'
- cos 2® -2 t ) Tl
(13)
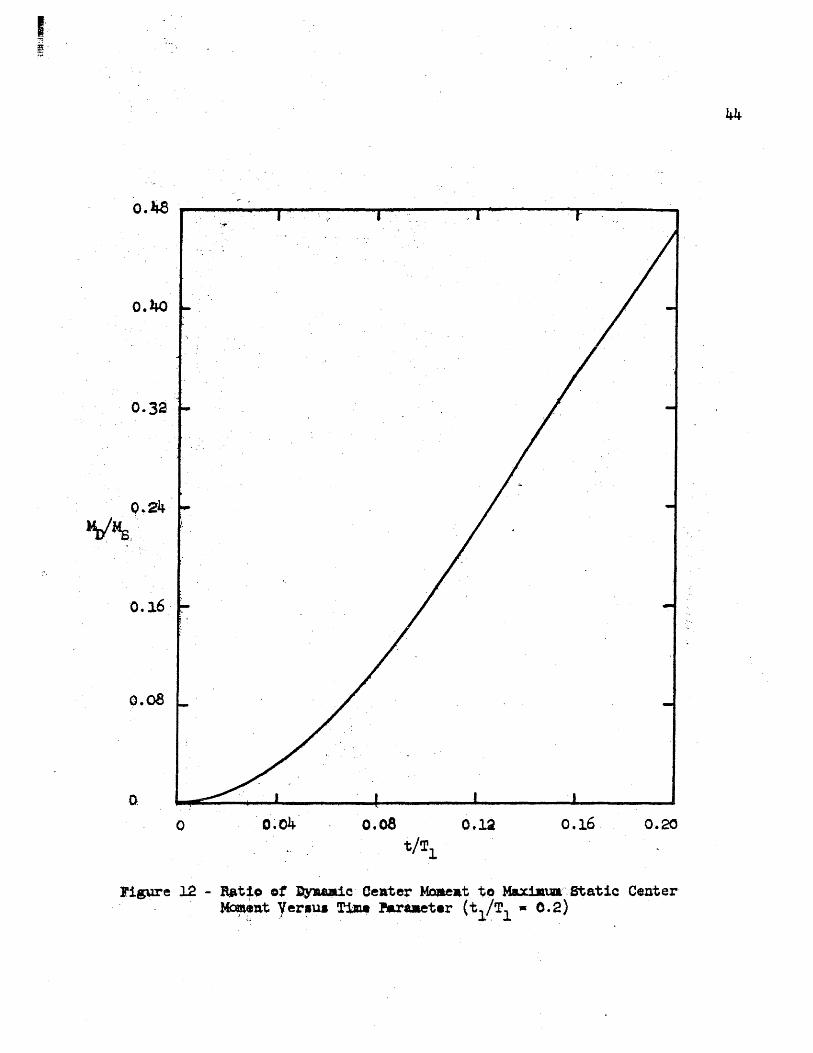
A plot of MD/Ms versus the time parameter t/Tl furnishes a con~enient
means of defining the limits of elastic and plastic beam action for different
pulse durations. As in the reaction plots, the first mOde(n = 1) in (13)
is used as a good approximation. Given a curve of MD/Ms versus t/Tl , the
fully plastic moment of the be~ cross-section may be considered to have
been reached for different values of ~o When a given ~MS is said to
equal MP/MS' the time corresponding to the particular value of MJMS is
the time of hinge formation, tp" The beam resistance parameter, ~Ms may
be thought of as the ratio of the yield value of the beam's moment resistance
to the maximum moment caused by the static application ,of Pm-

16
III. PLASTIC BEHAVIOR OF WAIL PANELS
A. Statement of the Problem
1. As~umptions in the Simplified Plastic Analysis
In order to derive a fairly simple expression for beam reaction when
the beam ceases to behave elastically, the following assumptions are made:
a. A plastic hinge .forms at the center of the beam when the dynamic
center moment, MD reaches a value equal to the fully plastic
moment of the section, Mp<> This time is designated tp.
b • Neglect the elast ic bending of the beam.
c • Assume that deflections are small ..
d. Assume that ~ remains equal to M.P until the beam velocity
becomes equal to zero 0 At this pOint, ~ becomes less than .
MP, the center hinge disappears, and the beam behaves elastically
again.
Figure 6 represents the idealized plastic behavior of the beam conforming
to the above assumptionso
Figure 7 is a free body diagram o~ half of the beam from which equations
of' motion may be written as follows:
- I :: l·o where w = 4 e; w = 4 e
(14)

R! 1 M..- _ ml3 •• 2 • 4 - -~ - ~_ e
B. Reaction Expression
From Equation (15) ~olve for the angular acceleration:
2 e 24 <E§-- - ~)
= m.t3
,_/''\ • / .. t.\ ".J:> Substitute \..LO) into Equatlon \.L~) and SO.Lve ..Lor R:
3--R = ~ + (' where p = :function o:f time.
17
In Equation (17), p is the external load acting on the beam at time t r
(15)
(16)
measured after the formation of the center hinge. Figure 8 represents
the time origins .for the different phases of beam. action which occur during
the load pulse.
With
1 - ( t p) lr" tr + t ]
1
and ti = t - t , and noting again that P 1./2 is the maximu.lil static reaction: p m
tT + t 24~ ( T p) + 2
1 P 1. m
] (18)
18
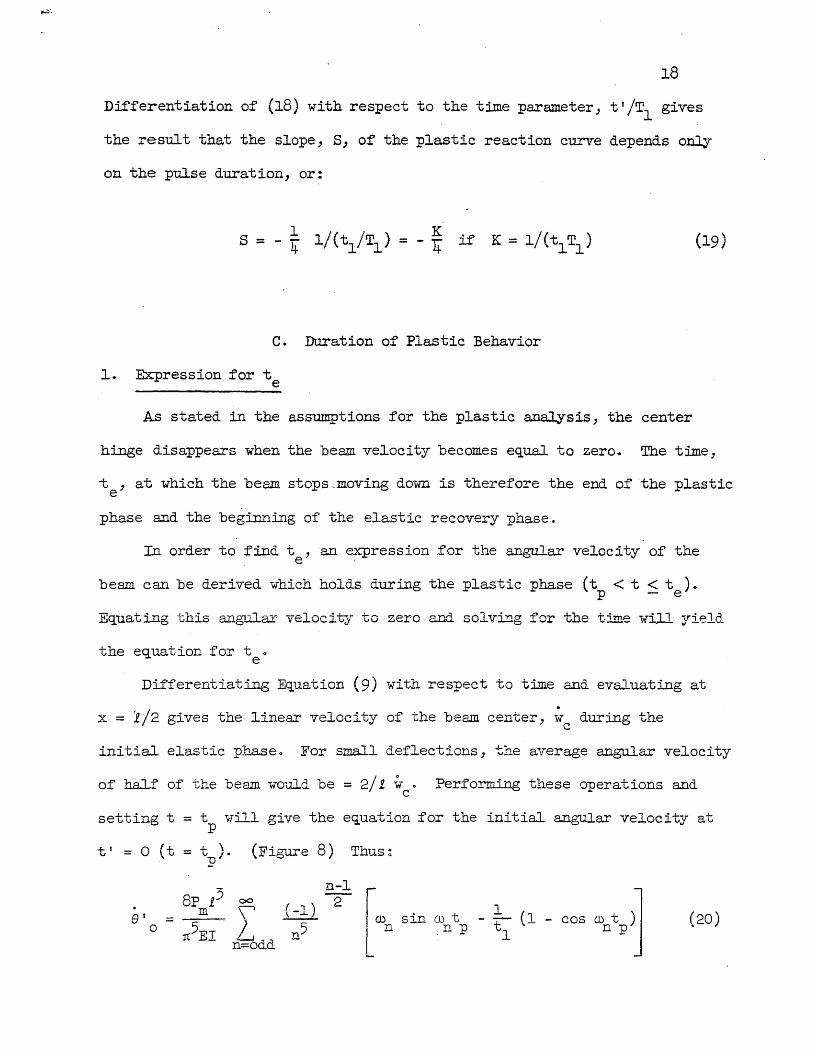
Differentiation o~ (18) with respect to the time parameter, t'/T1 gives
the result that the slope, S, o~ the ~lastic reaction curve depends only
on the pulse duration, or:
C. Duration of Plastic Behavior
1. Expression for te
As stated in the assumptions for the plastic analysis, the center
hinge disappears when the beam velocity becomes equal to zero. The time,
~ , at which the beam stops,moving down is therefore the end of the plastic e
phase and the beginning of the elastic recovery phase.
In order to find t , an express ion for the angular veloc i ty of the e .
beam can be derived which holds during the plastic phase (t < t < t ). p - e
Equating this angulaL'" -v-elocity to zero and solving for the time wi~l yield
the equation for t 0 e
Differentiating Equation (9) with respect to time and evaluating at .
x = 1/2 gives the linear velocity of the beam center, w during the c
initial elastic phaseo For small deflections, the average angular velocity
of half of the beam would be = 2/1 W 0 Performing these operations and c
setting t
t r = 0 (t
. at -0
= t will give the equation for the initial angular velocity at p
= t ). p
SF 1.3 m
:n:5EI
(Figure 8) Thus:
n-l
rm 00
(-1) 2 \' L n5 l n n=odd
)l 1 (1 sin mt - tl - cos rot (20)
.n p n p'J

19
The required angular velocity ~ now be found by integrating (16)
which was derived from the equations of motion for the plastic phase.
Noting· that P in (16) =
p(t')::: p [1 -C'< tp ) 1 • m •
3Pm [~ -t' +t) -p:~] e' =-
p ml tl
Integrating and evaluating the constant o:f integration by using (20):
'+ 8m.e4 ~
'7) 5ET 1-, ..,l! - n~odd
n-l 2 r Oln sin Oln \, - !1
'-
2 4 / 4 Simplify by letting n = 1 (:first mode) and note that ~ = ~ EI ml :
e t = 3P
m {tf [1 -!... (l: + t \ _ ~] ml t1 2 p;I MS
+ ~ If sin ~ t - ~t (l - cos m. tp)l"l, /~ - P ~ 1 .l-
L J j

20
When (2l) is equated to zero, the resulting equation is a quadratic
in t r which can be solved by the quadratic fornrula giving the following
result when put in dimensionless form:
te t tl (~+L ~-~ -=..l:+ Tl Tl Tl MS tl Tl
Tl
[tl ~~ + L ~ _ ~ ] 2 8 tl [sm 2rl l ~ -cos~] + +-- ~- 1 Tl ~ tl Tl 3'J{2 Tl Tl tl
21r -Tl Tl
TV. ELASTIC RECOVERY PHASE OF WALL PANEL BEHAVIOR
A. Statement of the Problem
1. Application of Dynamic Beam. Equation
Equation (22) def'ines the time at which the beam again behaves
elastically It The derivation of this elastic xecovery reaction expres·s:ion
follows the same method as used on the initial one; however, one free
vibration term is added. When tTl = 0 (t = t ), the initial velocity, e .
w 'I o:f the beam is zero, but the initial displacement, w 1 f has a finite o 0
value. 1m ex~ation of' the formulae for A and B (Section II) shows n n
that the f'irst free vibration term in Equation (7) has a value other
than zero.
22)

21
For time measured from t e
(til = t - t ), the elastic deflection is e
still o~ the form:
where X = sin n1C{j 1. and D
Pn A co '" t t1 +--1'n = n s """n men
n
where P = 4/n~ when n = oddo (See Equation (2).) n
The constant A is defined as D
J1W n(x) X dx ° n
An = _0 __________ = ~ J.-"I. W n(x) X dx
o n
Jl X 2 dx 0
n o
(23)
(24)
Now let wott(x) = we Sin;X where Wc is the effective center deflection e e
at the beginning of the elastic recovery phase. At first glance it appears
that a good approximation of w "(x) should be given by o
w "(x) = w o cm
• 10{ s~n -
f.
where w is the center deflection of the beam in the plastic phase at c
m the instant the be~ reaches its maximum deflection in the positive
\.
22
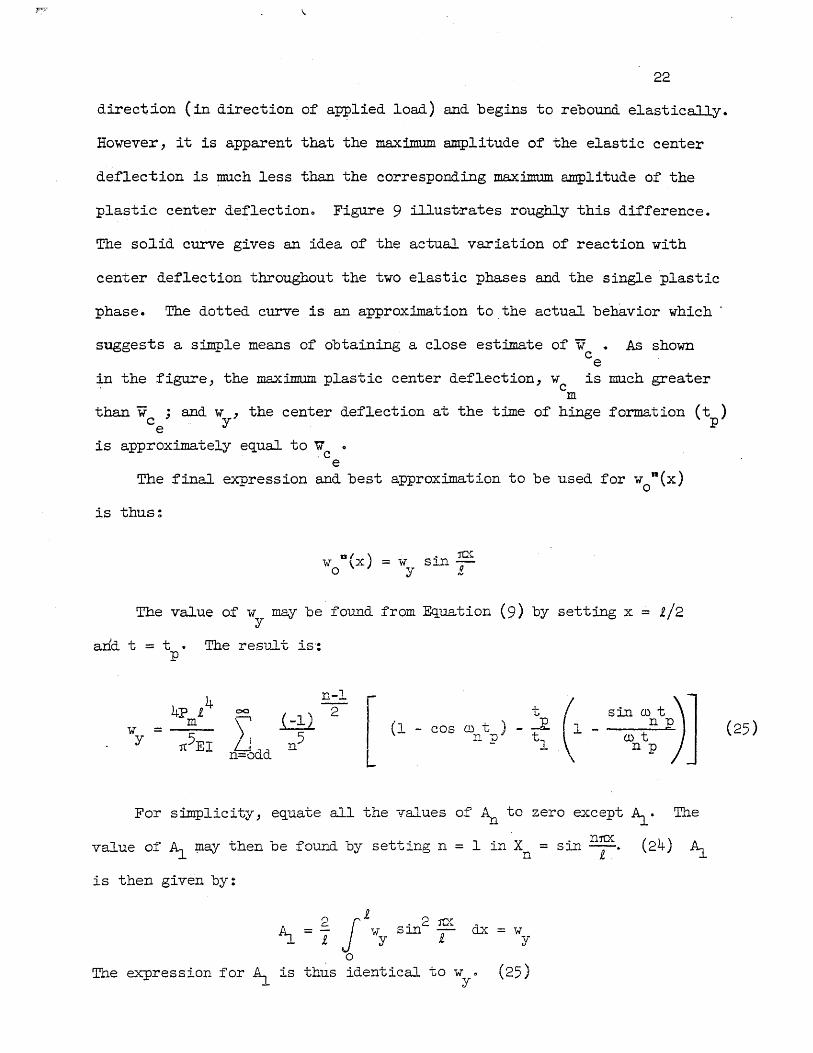
directi.on (in direction of applied load) and begins to rebound elastically.
However, it is apparent that the maximum amplitude of the elastic center
deflection is much less than the corresponding maximum amplitude of the
plastic center deflectiono Figure 9 illustrates roughly this difference.
The solid curve gives an idea of the actual variation of reaction with
center deflection throughout the two elastic phases and the single 'plastic
phase. The dotted curve is an approximation to the actual beh8..vior which'
suggests a s:ilIJ.ple means of obtaining a close estimate of w As shown c
e ~ the figure, the maximum plastic center deflection, Wc is much greater
m than w ; and w , the center deflection
c e .. Y at the time of hinge formation (t )
p
is approximately equal to w 0
.c e
The final expression and best approximation to be used for w n(x) o
is thus~
W D{X) = W o y
• :rtX sm -!,
The value of w may be found from Equation (9) by setting x = 1./2 Y
and t = t ~ The result is': p
n-l 4p 1.
4 2 l-(l - cos ill t )
np t ( sin ill t)]
w = m ~.I (:~) Y rc5EI!.J ~
n=Odd
_ ~ 1 n p tl (1) t _ . n p
For simplicity, equate all the values or ~ to zero except~. The
value of' ~ may then be fOu...11d by setting n = 1 in Xn = sin n;x. (24) A:L
is then given by:
r) ",1 f) ~
~ Co
J sin c:... J~ d.x = - w £
= w i. Y Y
0
The expression for ~ is thus identical to w " (25) y

23
Substituting the value of !p( to) (Figure 8) in (23) and performing
the integrations leads to values of ~ as follows: n .
4p
'r1 = ~ cos ~ t" + (1)~ 2
1'3 = o 4Pm
+----(3)~2
- cos ~ t" 0 -::) +
The remaining 1'n terms are formed in a similar manner.
B. Reaction Expression
The basic expression for deflection (page 20) may now be used directly to
obtain the beam end reaction:
An approximate equation for ~ is obtained by ignoring all 1"n in (26) for
n > 1 and taking only one term in the sunnnation of (25).. In dimensionless
form for plotting, the approximate reaction expression for te < t < tl is~
RD 8 t" [ 0 ~ cos 2r. ~) 1 ~ (1 _ sin 2r. t/T1) -=- cos 2n: -t1/Tl
.. RS 2 Tl Tl 2n: tp/Tl n:
-~ 1 :~ J sin 2:r! t"/T1
[1 - tJT1
(tn ;lte) ] (27) tl/Tl 0
+ 2n: t1/T1 +

24·
V. RESULTS AND DISCUSSION
A. Frame Load Charts
1. Construction pf Charts
In the previous sections of this paper~ expressions for the beam end
reactions have been derived for the elastic and plastic phases of beam
behavior. The reaction is expressed as a ratio of the dynamic 'end reaction
to the maximum static end 'reaction, (~RS); the time parameter is written
as the ratio of the elapsed time to the fundamental natural period of the
beam (t/Tl); and the beam resistance parameter is expressed as the ratio
of the fully plastic moment of the section to the maximum static center
moment (~MS). For convenience, the following table lists the various
phases of beam action, the time range of each phase (Figure 8), and the
governing reaction equation:
Phase Time Ran€2e Equation
Initial Elastic O<t<t (10) p
Plastic t <t <t (18) P e
Elastic Recovery ...).. <t < tl (27) IJ e ....
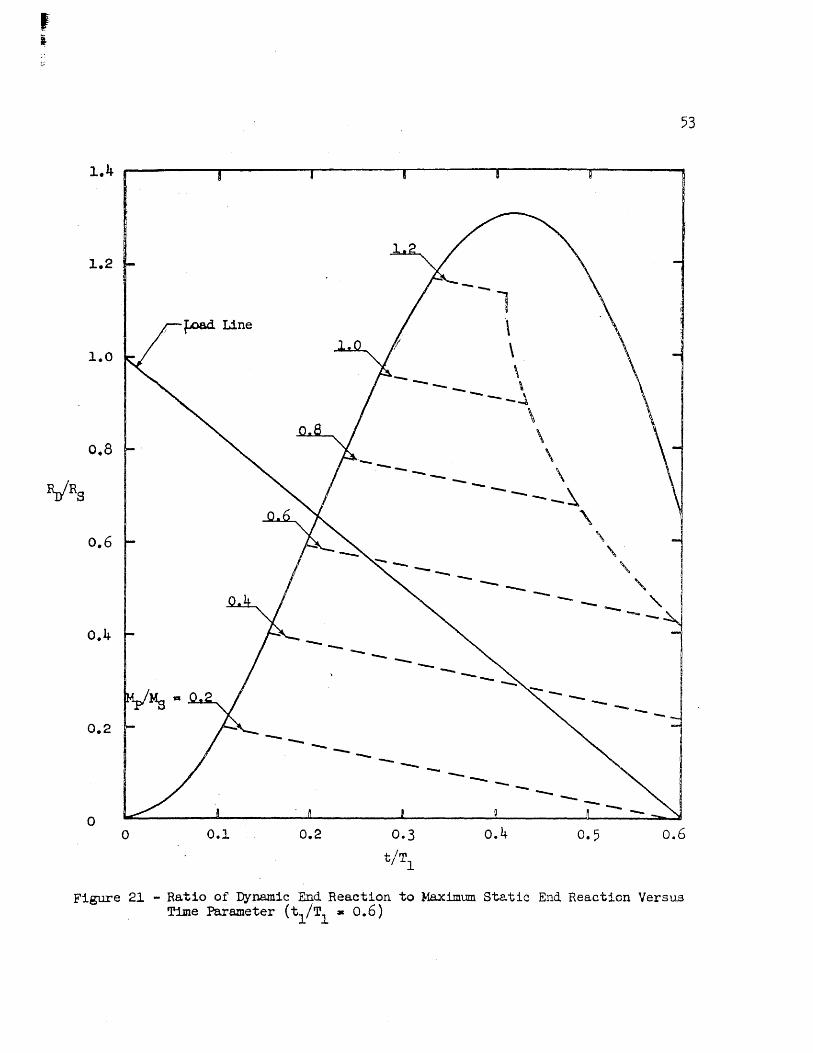
Figures 23, 27, and 29 contain plots of all three phaseso The remaining
reaction curves include only the initial elastic and the plastic phases.
On the same graph ,,!ith each reaction :plot is sho~m the external load which
impinges on half the beamo Thus at t = 0, the load on half the beam is
P £/2; the maximum static end reaction is also P 2/2; therefore the iriitial m m .
ratio of the half-beam load to the maximum static reaction is equal to oneo
The external load line thus starts at unity at t = 0, and drops in a

~-...
25
straight line to zero at t = tIe This is, then, a graphical representation
of the load which arrives on half of the beam, and what this haJ:f beam
transmits on to the frame as end reaction.
The moment curves are used to find the value of t for a given pulse p
du:ration t l , and. resistance parameter (~MS). (Figure 16) The duration
of the initial elastic phase is thus determined graphically from the
plot of MJ'Ms versus t/Tl by allowing ~ to equal ~ as ~ changes over
a range of values. This brings in the shape and physical characteristics
of the beam since the fully plastic moment varies with the shape and
material.
The duration of the plastic phase is fixed by Equation (22). The
loci of these times as found by solving (22) form a smooth curve and are
plotted on the reaction graphs. It will be noted that for a given pulse
duration, the loci of Equation (22) indicate the expected results; that is,
that beams of low resistance (small Mp/MS) have long plastic phases and
vice versa.
In the construction of the reaction curves, it was found that a
discontinuity always existed between the elastic and plastic phases.
This "jump" in reaction value is due to the relatively rough assumptions
of the plastic analysis used, the main error being the neglect of elastic
bending of the beam. Since the source of the discontinuity was known,
the reaction values were corrected by the amount of the initial reaction
error.

Plots of the elastic recovery phase were made only for a few representative
t1/T1 VMS Fig.
a. As an example of a short pulse 0.8 1.0 23
b. As examples of long pulses 5·0 1.4 27
5·0 1.0 27
10.0 1.4 29
10.0 1.0 29
2. Comparison of First Mode and MOre Exact Reaction Curves (6)
As stated in the introductory statement, no attempt is made in this
study to fina-out by analytical procedures the accuracy with which the first
mode approximation represents the exact elastic reaction curve. However,
for the initial-elastic phase, Equation (10) was expanded and data was collected
to plot curves for one term (n = -l)J three terms (n = 1, 3 and 5), and 6 terms
- -
(n = I, 3:; 5, 7; -9 Rnd ll) in order that a graphical comparison could be made ..
Figure 11 shows the results of the plot for a very short pulse. It is
obvious that the first mode approximation is not good for load pulses of such
short durationo Figure 35 illustrates the very great improvement in the ac-
curacy of the first mode a:pproximation for pulses of very long duration. It
would seem reasonable to expect then, t~~t as the load pulse duration increases
(6)This subsection refers to the uncompensated first mode reaction curves as derived from Equation (10) by setting n = 1. These curves are indicated in Figures 11, 19 and 35.. As brought out in the following subsection, all other reaction plots are constructed using the first mode multiplied by a compensating factor~
27,
from a small to a large value, the accuracy of the first mode should show
a gradual improvement. Figure 19 furnishes evidence of this trend since
it shows the first mode curve to be a better approximation than it is
for t l /T1 = 0.1 but not as good as for tl/Tl~= 100.0.
One situation in which the first mode curve gives a false impression
is encountered at very small values to t/Tl and ~MS. An example is
Figure li. Here the reaction in the plastic phase for V~ = .05 appears
end of the pulse. It is apparent j however,
that negative values would not be indicated if the plastic phase plot were I
started fram the more exact initial elastic curve (for 3 or 6 'terms). An
examination of pulses of longer duration will indicate this same ambiguity
3. Method Used to Make First Mode Approximat1.on More Conservative
Figures 11, 19, and 35 show that the first mode reactions plotted
from Equation (10) generally furnish values lower than those indicated by
the more exact curves~ In order to retain the advantages of the first
mode approximation but at the same t~e to obtain more conservative end
reaction magnitudes, the reaction expressions for the two elastic phases
(Equations (10) and (27) with n = l) were multiplied by a factor of ~2/8.
This step also increased the plastic reaction values by the same factor
since the plastic phase merges l,{i th the t1flO elastic phases 0 The reasoning
behind the use,or this factor followsQ
The use of the first mode curves for elastic reaction neglects the
contribution of the higher modes in (10) and (27) to the end reaction.

28
Such a simplifying approximation nl.a\Y be considered as being equivalent
to using an instantaneous beam loading represented b~ the first term in
the Fou:rier Series expansion of a uniform. load. This first term in the
Fourier expansion is merely a siIIIple sine curve distribution of' load.
Therefore, the actual pressure load which at any instant is unif'ormly
distributed, is replaced by a sine curve loading the total magnitude of'
which is very close to that of the actual load. Figure 36 illustrates
the 'shapes of the actual and approximately-equivalent loadings.
'The ratio of the end reaction calculated from the correci? loading
to that derived from the equivalent sine curve loading is found as follows:
(Figure 36)
1 Jl ~ R(2) = 2 J~ pet) o
sin ~ dx = 4p(t)1 '1. . 1(2
then
It seems reasonable then, that reaction values more nearly equal
to those resulting from a uniform load will result if Equations (10) and o ._
(27) (setting n = 1) are multiplied by the factor ~~/8~ Such a procedure
was followed in this papero

29
Figures 11, 19 and 35 contain'plots of the initial elastic reaction
expression wherein a comparison is made of the,curves plotted from
Equation (10) for the following conditions:
(1) n = 1
(2) n = 1 using multiplication factor of ~2/8
(3) three terms (n = 1, 3, 5)
(4) six terms (n ='1, 3, 5, 7,,9,11)
This graphical comparison shows that the use of the first mode
multiFlied by the factor ~2/8 gives results which are more conservative
al'proximations to the more exact curves.
Since values of tp/Tl are determined gr~phically from the ~/~
versus t/Tl plot, another source of error in the first mode reaction curves
is the use of only the first term (n = 1) in E~uation (13)- However, the
1 elastic center moment varies as ~ for n e~ual to odd integers; therefore, n
the approximation for center moment is less in error than the corresponding
approximation for reaction since elastic reaction varies as 12
_ A comparison n
of' the center moments due to the two loadings in Figure 36 gives the following
result:
then
2 = 4p(~)1 (.500 - .182) =
1C
M(l) _ .125 _ 1 = M(2) - ~129 - 1.032
2 0.129 p(t).e
·970

·30
By the foregoing reasoning, more accurate values of t /~ could . P ~
be gained by multiplying Equation (13) by 0.970. This factor is so close
to unity, however, that little change in the values of tp/Tl would result.
In this study, Equation (13) with n = 1 was. used as derived without applying
the correction factor.
4. Discussion of Different Phases of Wall Panel Action
In the introduction to this paper, the statement was made that the
characteristics of the wall panels would cause the shape of the load
transmitted to the· frame to be much different from that which impinges on
the panels themselves. A study of the Frame Load Charts (end reaction curves)
bears out this statement. The wall panels are aqted upon by an initial-peak,
triangular 'loading pulse but send to the frame by means of the· end reactions, a
loading which has been radically aJ. tered in shape.
The unit load which reaches the supporting members rises gradually
from zero along the initial elastic reaction curve. Depending on the
duration of the blast pulse and the' beam. resistance parameter, the beam
(wall panel) becomes plastic at a certain time and the reaction then
decreases linearly with time at a rate depending only on the pulse duration.
Then if' the panel has sufficient elastic resistance, the action again becomes
elastic and remains so throughout the remainder of the load. pulse ..
For very short pulse ~urationsJ the plastic phase continues to the
end of the pulse and no elastic recoveTY phase occurs. Figures ll, 13,
and 15 illustrate this behavior. As the pulse durations increase, the
elastic recovery phase begins to appear starting with panels of high
elastic resistance (large MP/MS)~ Figures 27 and 29 show how (for long

31
pulse duxations) the two elastic reaction curves oscillate about the
incident load line. It should be noted here that damping will tend to
decrease the amplitude of the elastic oscillations about the load line.
If the effects of damping could have been included in the deriva.tions
of-the elastic reaction expressions, Figures 27 and 29 would probably
indicate a gradual decrease with time in the amplitude of the vibrations
of elastic reaction about the external load line. Thus, in the elastic
recovery phase for low beam resistances, the elastic reaction would
become coincident with the load line as tapproaches t1Q
Theoretically, if a wall panel had infinite elastic resistance,
its end reaction would follow the initial elastic curve and the frame
loads would rise to a maximum. Plastic action takes place however,
since the panels have finite elastic resistance, and prevents the frame
loads from building up to these peak values. The formation of the center
plastic hinge, thus effectively cuts off the top of the elastic reaction
curve and consequently permits smalle+ loads to reach the fraIDe~
The occurrence of negative values of reaction in the elastic oscillations
about the load line ~ be highly signif'icant under certain conditions. If
the fasteners used to attach the wall pa..Tlels to the supporting fratIle are
not designed to withstand tension loads, it is very possible that such
fasteners ~-1l fail at the time the wall panel end reaction first becomes
negative. Such failure would alter the frame loads in the case of load
pulses of sufficient duration (tl/T1 > 0.8 in the frame load charts),
limiting the loads transmitted by the panels to the supporting members
to a single positive pulse.

32
B. Tables and Graphs of Results
Table 1 is presented for convenient reference. For given values
of :pulse /duration (tl/~), plots are also made of the beam resistance
parameter (MP/Ms) versus both the duration of the initial elastic phase
(tp/Tl) and the duration of the plastic phase (te/Tl - tp/Tl ).
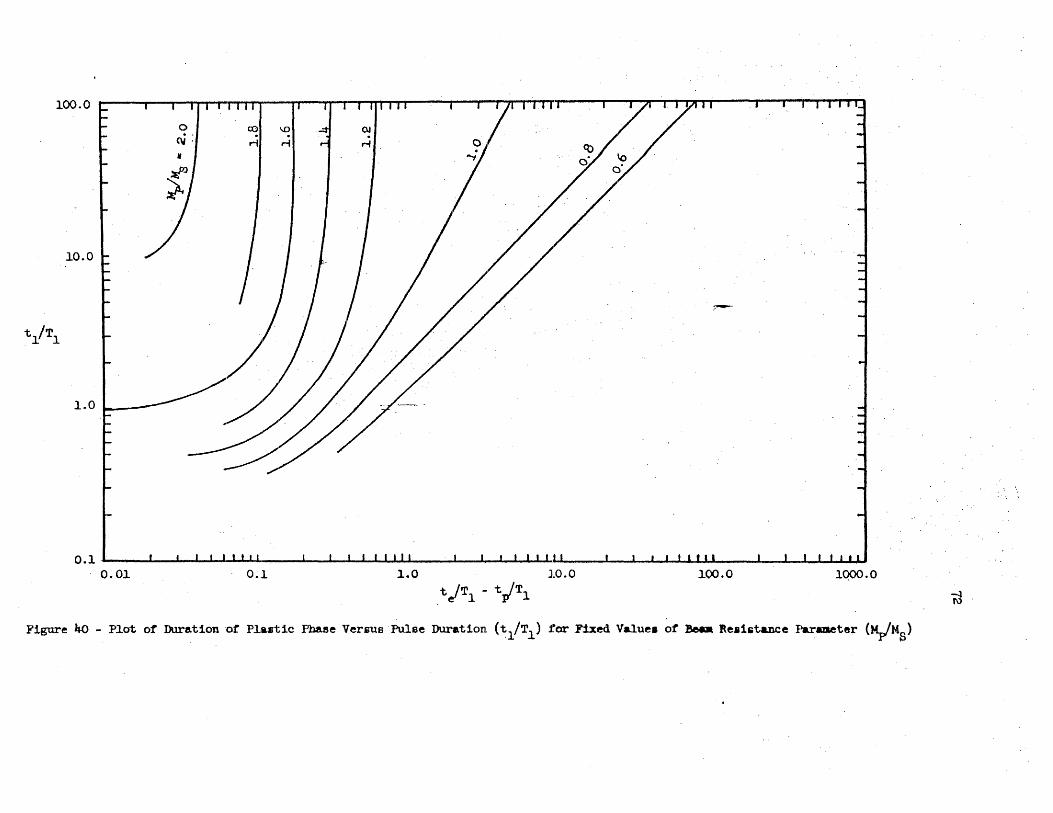
(Figures 37 and 39) SjndJar graphs are drawn with ~~ as the fixed
parameter. (Figures 38 and 40)
Figure 37 ShC7,iTS that the duration of' the initial elastic :phase
increases almost linearly with increasing values of' ~MS for fixed
load durations. Figure 38 demonstrates that for a given beam reSistance,
the duration of the load pulse has little effect on the length of time
which the panel remains elastic except in the case of the shorter load
pulses.
As might be e:b.,})ected, there is a very great increase in the duration
of the plastic phase (for given pulse duration) with a decrease in wall
panel resistance. (Figure 39) The increase is most pronounced for
long load pulse durations~
Figure 40 shows that the effect o.r load duration is largest for
low values of panel resistance, and that, in general, the plastic
phase· duration decreases as the duration of the load decreases (with
given panel resistance).

Table 1
J05
Values of ~/Ms
l/Tl 0.1 0.2 0.4 0,,6 o.B l~~ .100 .146 .. 182 .214
oo~o 2o lH(- * * 80.100 40.430 1- - .100 .146 ,,182 .214
50.0 2 * * 40 .. 100 20.400 ~-~-- .100 il146 .182 ~:4O 215 1
20 .. 0 2 * * 16.132 80>415 1 ~100 ~i46 .. 182 .216
10.0 2 * * 8.122 4.3,26 l .102 .. 146 .184 .216
5 .. 0 2 * -x- 4 .. 123 2.378 1 .. 104 .. 150 ~188 .2~4
1.0 2 * * -918 .681 1 ,,104 .. 150 .. 192 .. 228
0.8 2 * * .. 756 .586 1 .. 105 .. 155 .. 195 :-235
006 2 * * .. 595 0488 .. 10h .. 154
=
:196 .240 1 0 .. 5 2 * * * ~438
1· ~106 .. 158 10204 .250 0.4 2 * * * .386
1 .. 108 .162 .. 216 .280 0·)3 2 * '* * -x-
l ~076 .. 112 .178 0 .. 2 2' .)Eo * *
1 3055 .084 0.1 2~ * * -- -.-------~--
~IE-Beam velocity does not reach zero during t:iJne of pulse
1** tp/'I~l 2** te/r.I~l
1.2 .276 " 22 .27 ,,903
.2 .277 "2.325 u8 , .2 7 .27 1.6~
.2 .7~2 .2 0
11)170 1)707 .262 ·300 .~40 0472 ,,258 .310 0486 .443 0275 .330 .432 .410 .288 ~360 .401 .326 .312 .312
1.4 • .308 .631 .309 .616 .310 .604 .311 .~86 0314 ·557 v348 .444 .368 .430
.,
.492
.392
.488
.398
.480
.. 490
.. 55
.490
., 70 ,~420 I
\>J \>J
34
C • Frame Loads After Termination of Load Pulse
For time beyond th~ end of the pulse, the derivation of the elastic
reaction expression is similar in procedure to that used in Section II
in finding the limiting reaction for short pulses and constant load impulse.
Equation (26) would be used to find the diSJ?lacement and velocity at
t = tl in order that % and Bn could be evaluated; the expression for w
would then be found where
co
w =I n
X l' n n
and X still equals sin D.'ICA/ I. Reaction could be found as before by n ',I
evaJ.uating the shear at x = 0 ..

35
. VI. SUMMARY AND CONCLUSIONS
A. Applications of Frame Load Charts
A method has been :found :for determining the load-time relation for
blast load. transmitted by the wa.lJ.. panels of a structure to the supporting
members. The frame load charts lD.a\Y be used :for three possible types of
wall panel behavior; a pvxely elastic action, an elasto-plastic action,
and a brittle actiono
For a given pulse duration, and purely elastic behavior, the initial
elastic phase reaction curves apply throughout the duration of the pulse.
This assumes, of course, that the wall panel has sufficient elastic
resistance (high Mp/MS) to behave in this manner.
A more usual wall panel beha~!ior is the elasto-plastic type. Here
the elastic resistance is not high enough to confine the action to a purely
elastic one. Given the pulse duration and beam resistance parameter, the
frame load charts used in conjunction with the dynamic center moment curves
indicate the loads which are transmitted by the wall panels to the frame.
Wall panels constructed o~ brittle material will behave elastically up
to the ult:inla.te moment carrying capacity of the panel (~) and then
fracture suddenly. The time of fracture could be determined from the
dynamic center moment curves by setti.'Ylg ~ = ~ over a range of values
of~. The :frame load charts would indicate a rise in load. along the
initial elastic curve up to the point of :fracture at which time the
reaction would drop to zero.

In order to use the frame load charts for a..ll three types o:f wall
panel behavior, the following information nrust be available:
a~ Wall panel span and a curve of side-on overpressure versus time
from which Pm' t l , RS' and MS' can be calculated.(7)
b. Dimensions and properties of wall panel in order that Tl , ~
and IvU may be calculated or estimated.
Entering the charts with tl/Tl and ~~ or ~/MS' the magnitude
and time distribution of the uniform frame load can be determined.
T.ne frame load charts presented in this study repxesent an attempt
to evaluate the loads received by the supporting members ~rom the
building covering when the walls are subjected to a blast pressure wave.
Rough assumptions had to be made in some cases in order to obtain fairly
simple expressions from which the load charts could be constructed. Also,
since the elastic reaction expressions involve the sum of an infinite
series of terms, th~y could not be used in their exact form~ Therefore,
the first mode approximations to the exact elastic reaction expressions
were modified "by a compensating factor or ~2/8 and then used to construct
the :frame load charts. It is :felt that this step, although not
theoretically exact, provides good engineering approximations to the actual
blast loads which a frame would experience. Also, keeping in mind the
(7)N. M. Newmark, nAn Engineering Approach to Blast Resistant Design", Proceedings ABCE J Vol. 79; Separate No~ 306, October 1953-

36a
additional condition that uncertainties in loading and in the structural
properties of the wall panels will always exist, the author feels that
the frame loads indicated by the charts are sufficiently accurate to be
used in the design of building frames.
The basic relations for panel end reaction in all phases of elastic
and plastic action which occur during the load pulse have been derived.
For the values of pulse duration and beam resistance parameters considered,
the load charts are complete through the initial elastic and plastic
phases of wall panel action, and representative curves for the elastic
recovery phase have been drawn. Thus the main purpose of the stu~-
that of determining the shape of the loads transmitted to the frame
has been accomplished. Additional work is required to finish the elastic
recovery phase and to extend the study to time beyond the end of the pulse
using the methods outlined in this papere
\
BIBLIOGRAPHY
1. N. M. Newmark, nAn Engineering Approach to Blast Resistant Design",
Proceedings ABCE, Vol. 79, Separate No. 306, October 1953-
2. S. Timoshenko, ttVibration Problems in Engineering", D. Van Nostrand
Co., Inc., New York, N. Y., Second Edition, July 1937.
3. E. Jahnke and F. Emde, "Tables of Functions with Fornru.1ae and Curves",
Dover Publications, New York, N. Y., Fourth Edition, 1943-
4. L. E. Go 0 d!na.n , IItBehavior of' Structures Under Dynamic Loads n, Lecture
Course in StructurcU Engineering, University of nlinois, 1953.

37
r Cl0 ely-Bpaeed !emu 8
I
7
Bay
, ,
F1&Ure 1- Typical ~ With Nest of Beams Approximat!ng Wall , Covering , ,
p
Time
FigUre "2- Tr1a.ngular Load Pulse
Plastic Action
!wk:atent
o Curvature
p(t) ., (1 tit) r-. - 1 • i
~ •.
I ~ , ~ r l
.. It , ., ~
+wT .. ~. LIl .... Jerunit ~ ... • Ill(t): . len&th·
I: ~ +x

39
·F1aure 5- New Tiae Orilin for t >t1
~" p(t)
~
~ , ~ • ~ . ,II' ~ ~ -J" - --~-- -- ." -- ..... --..... ---:: .. :-' -- - - - -=- -:.. -- - ~~
-- - ;".,x. ...,. - , I
I: . . ~/2
•• ).,/2
Ficure 6 - Pla.tic Behavior of :Be ..

j 1
,.' .. '
. ' . .
•
~ :', ..•. ~", ," ',"', ' .
~""",+X··, l/2··
".)' ,
t' .. e
40:,· .
". ',,' .
. r /t'+t". \ 1 pet') • p.ll -\t
l ¥) J
[, '(tit + t )J p{t") • P.l - tl • .
1
-, .. Itll .. :-t . . tlf.O

,.
Initial ......... -- !la.tic
I . ~I
r--- Plastic
I /
l I·
I
I I I
/
41
JiIur' , ~ Graphical aepre.entat10. ot Actual and ApproxiaateVari&t1en or ... :Reaot1oa vita CaRter Deflection

0.14 .. r------.-----..,.....-----..----...... ----
0.1.2 t-
o.~o
" .•• 08
o _' ..... ..:::;; ___ --"' ____ -'-___ -..1-----.1..----.....1 o 0.02 •• 04 .0.06 0.08 0.10
tiT, ..I..
Ficure 10 - ~&tio .:r Dynudc OeJlter Mc.e:at to Maxiaua Static Center . ~ent Tersua T~. Paraaeter (t1/T1 • 0.1)

t I
0~9
0.8
0.6
0.4
0.2
0.1
o o 0.02 0.04 0.06 0.08 0.10
43
·1 tera (IIU.lt~lied by n /8)
0.12 0.14
Figure II - Ratio ot Dyn8:aia End Reaction to M&x1aDl Static End Reaction Veraua T1Jle Par .. eterl (t
l/T
1 • 0.1) . . . ,
, ... ~
44
o.liS ':~
0.40
0·32
0.].6 .
0.08
o o 0.08 0.12 0.16. 0.20
tlTl
Figure 12 - l\at10 ot ~c CeJlte~ Mo1Ie.t to MaxiAua·.Stat1c Center . - . ~~nt yer~u. Time laraaeter (t1(T1 • 0.2) .

45
. 1.O_-__ --.-....;.....,..---r--,r--,--.,....--..,...--r--,.~...,----r_-... ___,
0.;
·0"1
0.5~ ... ~.
•. 4
0,,21
. 0.·;1.
0\ ~ __ &---~--~--~-~--~~--~~~~~ __ ~--~--~---L-~ .0 0.04 0.01 0.12' •• 16 0.20 '. 0.24 0~2~
. . ,t/~, -FiJUre.13 .. J\at:1e et Iyluudc be! Raa.ct:1on ,to ·.Nu1malt&t:1c Bni. !!eaotion Verau. TiM hraeter
. . '. (tl/~l • •• 2) '. ;. . .

l~O ~------~--------~--------~------~
. i.a·
8.4
0.2
o • 0.08 0.24
J'1&UI"e 14 - Ratio or ~c Center ~e.t to Max1:aua Itat1. C •• ter M..ent Versus Tt.- laraaeter (t1/T1 • 0.3)
46

I~O
9·~
t"
~"'s ().4
0.2
o o
--------
~.---------IY~ :: 0.2 <
------------J 1
0.02- 0.04 0.06 0.08·0.10 0.12 0.14 ·0.:16 0.18 0.20 0.22: 0 •. 24 0.26 ·0.28 0·30
tiT. 1
!"iiure 15 - ltatio or Dyn.ulic End :Reaction to Ma.xiaa.static End Reactioll VerQ'w; Time Paralleter (t1/T
1 = 0.3). . .
J:::-...J
, I'l .. ti

1.2 ~-------,--------~--------~--------~---------
1.0
0.4
0.2
o o 0.08 0.16 0.24 0·32 0.40
Figurtt 16 - RatiQ.' or Dynudc Center Moaent to Maximum static Center MameRt VersuaTiMe Parameter (tI/TI = 0.4)
48

1.4
1.2
1 .. 8
••••
IJR:s ' 0.6
0.4
0.2
0' o
•. ~ I' ... : .... ,' ~~_ .... , .•.. , .... "' .....
, f· F/ 'F ~~ -.-'-- -- I
~~ .
---1 . \
\ \ \ \
------------ 4
------------------------,....--.. ...... - ......
,K/lls tc~ --- ------ ...... --...:.--
---------~-----------~.
--------1- I I P, ' ;'t
0.04 •• 08 0.12 ().16 0.20
t/i'l
0.24 0.28 0.32 0.36 0.40
FiIlUI'e 17 - Ratio ellf Dyna:aic End Reaction to Maximum Static End Reaction Versus Time :ParalI1eter (tJ./!l'l -0.4) .Jr \0

r i ~ ,
50
1.0"
, 0.8
0.6
0.4
0.2
o
Figure 18 '- !t&ti • • t ~c Caater M:laent to Max1 m - Static Center M::aent Versus Till. hraaoter (t1/T 1 • o. 5) ,

1~~
1.2
~.O
0.8
ltJ~
0.6
0.4
0.2
o o 0.05 0.10
;, ,:~"." ':'A<t{"'!:?r.i#t.-~'. au r/ ~:"1 , I
~r;-:': --~~~.
---:.----- :---~,
" "-
" -------------- --- --------
--- --- .... ---- ...... -.--
-- .... - ------.--
- -------------- ---- ----...,.---~ ---______ 1 ______ ------.1
0.15 0.20 0·25
t/T1
0·30 0·35 0.40 0.45
.:.r "
......
0·50
Fivrre 19 - Ratio or DynMdc .... l'teac~~oJl ,to'M.axiJiuiIl', Stat~c End Reaction Verau& TUle Paraaeter (t1/T1 III 0.5)
0\
\!ft_
\.n l-'

•
~.4 r-----~II-------,--------~------~---------
~.2
J..o
·0.1
0.6
0.4
0.2
o 0 .. 4 o n , "' .... 0.2
FigUre 20 - Ratio of Dynamic Center Moment to Maximum Static Center ' .. Moment Versus Time Parameter (t1/T1 m 0.6)
52
1.4
1.2
1.0
0.8
0.6
0.4 -- --0.2 -- -- -- --o
o 0.1 0.2
---
1 '\ \ \ - \
---~ \
--
53
\ \
\ -------i
------ -- -- ---- -- --
-- - ---- - - --0.4
--\
\,
'\
" -- "----_ ..
-- -- -- -
-- -- -- --0.6
Figure 21 - Ratio of Dynamic End Reaction to Maximum Static End Reaction Versus Time Parameter (t1/T1 a 0.6)

1.6
1.4
l.2
l.O
0.6
0.4
0.2
o o 0.10 0.20 0·30 0.40
Figure 22 - Ratio or Dynamic Center Moment to Maximum Static Center MOment VerSU8 Ttae Parameter (tl/Tl = 0.8)
54

. .~ ... "
1~1' .-l.l~
1 IJL= 1.2 ... rJJ:RM ~.n.J.J.. .
.v-l .~. '. "~-...,......,
0,.8 1-
0.2
o 0.1
-o.~~
-o.J ...
-o.~5 I'--, __ ~----
.. ~. fO ..
~~'r-~-- I ~.'II' T'
--~ .. -_ .
.. ~. \
--~4 , \
\ \.
" " ... ,--~ ....
'" " ~ - - .......... .... \ --------- - ............ ~
-- --.- -------- ........ - .......
0.6
Fig:ure 23 - Ratio o:f Dynamic bd Reaction to Matimual Static :iI1d Reac~tion Versua Tille Par-.eter (~/Tl. -·0.8)
"" '-J1
56
1.6
1.4
1.0
o.B
0.6
0.4
0.2
o o 0.10 0.20 0·30
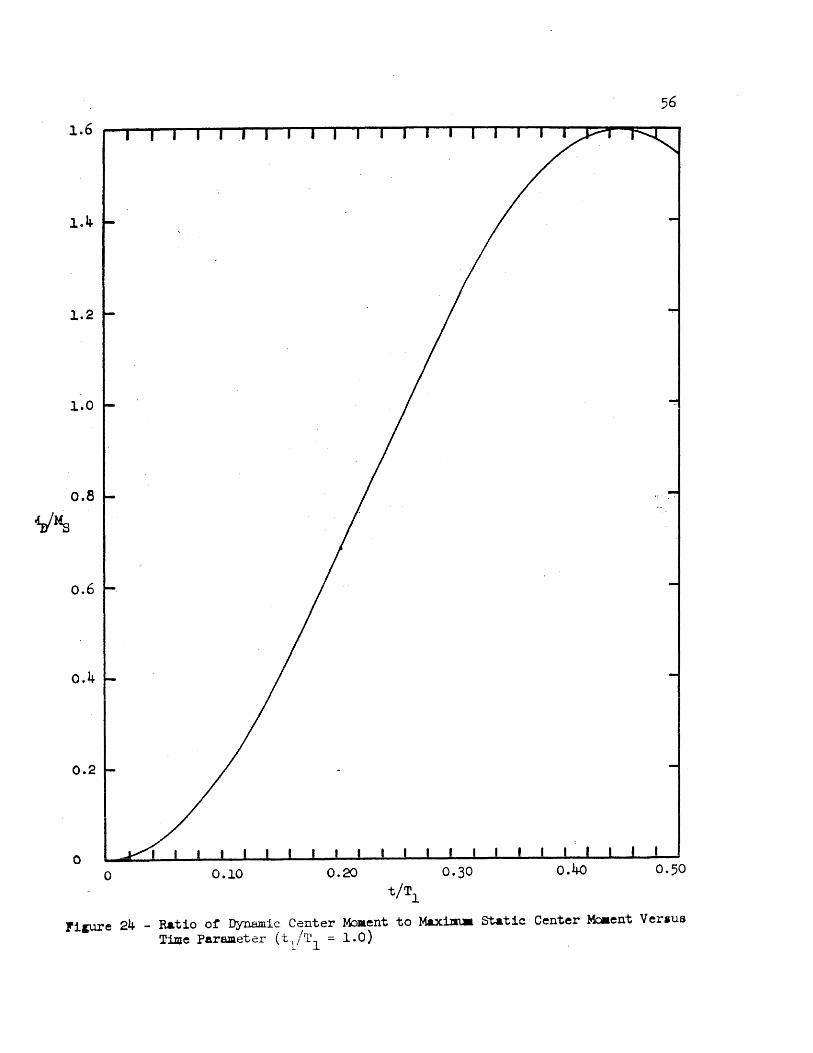
tlTl
lilUXe 24 - Ratio of Dynamic Center Moaent to Maxtmu. static Center Mo.ent Veraus Time Parameter (t1/'l11 = 1.0)

1.6
1 .....
1.2
1.0
0.8
-0.6
O.1t.
.,.,;~. 0.2
o
.-0.2 .
'-0.4
'-0.6
'-0.8
--1.0
--1.2
---~ \ \ \.
---.--..,..-~ ,. " ..... - ...... -- ..... .--. -- -- ...... ~~~~
. . ' .' "
- - --~~::::":. ...
--- ...... -~- ..... ---.-- -- ....... - .--.. ..... --.. ....................
I . I
0.2. ,0.3 o.~
ti7~
-:--- --- .-'- . . r--.;,~ --.- -.~.~":::r __ _
....
Figu:re 25 - Ratio or Dynadc. End React.ion to MR.:rl:Ina static End Reaction Veraua TDe hraeter (~/!1 - 1.0)
-", .
. /,;
" .
VI -4
.. ,

2.0
L8
1.6
1.4
1.2
1.0
/ 0.4
0.2
o o 0.08 0.16 0.24 0.40 0.48
Figure 26 • Ratio of Dynamic Center Moment to MaximU1 Static Center MOment Versus Time Paramet~r (tl./T1 :; 5.0)

2.' ~ .. 1.' 1.4
1.2
l .. t
1.1
~"
0.4
1.2
~ftS I
-0.2
-0.4
-I.'
-e.1
-1.1 tlTl
-1.2
-1.4
-1.' 0 1.1 2.0 3·1 4.1 5·'
~.
F!&Ul",e 21 - }\at!., .r ~c W. Reaction t.o MerltmIDt Static ElUl':Reaction Versua Time ~rameter (tl/Tl c, 5.~)

60
2.4
2.2
2.0
1.8
1.6
1~4
1.2
MJMs 1.0
0.8
0.6
0.4
0.2
0 0 0.10 .0.20 0.40
FiiUre 28 - Ratio of Dynamic Center Moment '0 Maxim~ Static Center Moment Vermu5 Time Parameter (t1/T1 = 10.0)

\ ..... -.
2.0
1.' 1.6
1.4
1.2
1.0
0.'
0.' 0.4
0.2
11/1\8 0
-0.2
-0.4
-0.6
-o.~ tlT1
-1.0
-1.2
-1.4
-1.6 0 1.0 2.0 3.0 4.0 5.0 6.0 1.0 B.o 9.0- 10.0
F~e 29 - Ra.tiQ of Dyuaic Rna. 1{eaction to Maxima static hi. Reaction Veriiu. The Par .. eter (tl./'fl. :: 10.0) ~.

2.4
2.2
2.0
1.8
1.6
1.4
1.2
MJ~ 1.0
0.8
0.6
0.4
0.2
0 0
Ficure 30 - Ratio of D,ynamic Center Moment to Maxiaua Static Center M~ent Ver.ua Tiae Parameter (tl/Tl ~ 20.0)

2.0
1.8
J..6
J..4
1.2
1.0
~/BS 0.8
0.6
0.4
0.2
0,
, !pad Line
0 0.1' 0.2 0·3 t/Tl'
, . ,
.~:'" .. , .
0.6
Figure 31 -' Ratio of Dynamic End Reaction to Maximum. static End Res.ction ,Versua 'Time Parameter ~(tl/TJ. = 20.0) 0\
W
/'

2.4
2.2
2.0
1.8
i.6
1.4
1.2
MJ~· 1.0
0.8
0.6
0.4
0.2
0 0
" 64
Fi&UXe 32 - Ratio or Dynaaic Center Moment to Maximua Static Center Moment Versus Time Parameter (tl/Tl 50.0)

. , .. ':;;> i ac:::::::::: . • 2.0 r- I . 1. .~ .............. .
' .. ~ . ',"U"
. ' .......
1.8 . ';"', \ ~;...--\
\ \
, 1.6 "
VRa
1.4
Load Line -----~ ~--.~ -~- ...... ---1.2
1.0 t- 'i. .. 0.8
0.6
0.4
0.2
o 0"; " 0.1
I .. _..--. ......... ...- ...... _. ____ ...... ~ __ ..... ~ ~_ ......
- -- - -, -- - - '---.. .- - -- - ~------ ~ ---.-
-----~----------~-~--~ ," .: .'
~ .-- .--. _ ..... -,--- ~ - ---~ ~ - - --- -- ...... - .... -- - ..... ..--. ---. - -
0412 0.3 t/'1.I~
I
0.4 0.5 0.6
Figure 33 - Ratio of DyJlamic End Reaction to Maxi.". static End Reaction VersU8 . . !rime Paraaeter (t~/T~ .. 50.0) . . . \ 0\
V1

66
\~.4
2.2
2.0
1.8
1.6
1.4
1.2
MJMs 1.0
0.8
0.6
0.4
0.2
a 0 0.10 0.20 0·30 0.40 0 .. 50
Figure 34 - Ratio of Dynamic Center Moment to Maximum Static Center Moment Versus Time Parameter (tl/Tl = 100.0)

2.5
2.6
2.4
2.2
2.0
1.a
1,6
VRs 1,~
1.2
1.0
0.8
0.6
0.4
0.2
0 0 0.05
.-----~-··I·'
1tera
~Load Line
- _ ....... - -- - - - - - - - - - - - - - - - - - -
0.10 0.15 0.20 0.25
tlT1
0.30
~
0.35 o.w 0.45·
Ngure 35 - Ratio of Dynamic inG. Reaction to M.a.x:illU!t Static End. Reaction Venau.. 'fiJIe Paraaeter (t1/i'1 = 100.0)
0.50
0\ -.J

68
-- i ;pet) 1r
1
. .
11&Ur. 36 - Ccapar1aon ot Actual&Iid Equiv&.l~nt ·Beea !Dad 1ng

69
2.0 r-------~--------~------~--------~--~~~--------~--------
1.8
l.6
'. t,
l.4
1.2
1.0
0.8
0.6
::1 J 0 I I
0 0.1 0.2 0·3 0.4 0.5 0.6 0.7
tp/TI
f1&UTe 37 - Plot or Duration of Initial Elastic Pha,aa (t/TI ) Ver:u: Be~ Reaist.an.ce Parameter (lI'tiMs) . tor Fixed ValueB or Pulse Duration (tI/TI )

loo.O
N co ... ~ 0
0 0 r-i C\I
.;!l ~
10.0 t
O.~L-__ -L __ ~ ____ ~--~----~--~----~---L--~~--~--~----~--~--~ 0.6 o~4 o 0·3
rigur~ 38 - Plot of Duration ot Initial Elastic Phase (tJ.Tl ) Versus Pulse IAlration (tl/T1 ) for Fixed Value a of Beam Resistance Parameter (M}/MS)
70

2.8 -I -II ji 11
2.~
2.2
2.0
1.8
1.6
llpIYo, l..~
l.?
1.0
0.8
0.6
o.~
0.2
0
.01 0.1 1.0
te!Tl - t-/Tl
10.0 l()O.O
1f1cure 39 - Plot or DuratlfD. or :Pl.arllc Phue Ter8UII Be_ :fte81atallce '~r '<M/Ha) 'tor -fixed Yaluea or PulJIe lAlrat10n (t1/T1
)
. p.
100.0
10.0
t!T1
1.0 .. h. __ -
COl \0 . . rl rl
OJ
rl
~
0.1 I I I I I I I I I I I I I I I I I , , l'
0.01 O.l. ~.O J.O.O 100.0 lQOO.O
.tJT1 - t/Tl
Figure IJo - Plot or Duration of PLutic Pbaee Versu8Mse Duration (~1/T1) :f~or Fixed Value. or Beaa Iteai&tance :Parameter (VNS
)
rJ


![[1059] 5.5 % & b s Y- — 11-1 1989 b: 1 2. 89 2. 89 2. …data.jci-net.or.jp/data_pdf/11/011-01-1059.pdf[1059] 5.5 % & b s Y- — 11-1 1989 b: 1 2. 89 2. 89 2. 89 2. 90 cm 2/ 3290](https://img.pdfslide.us/doc/110x75/5f7b57e0e1683b73d5699b9f/1059-55-b-s-y-a-11-1-1989-b-1-2-89-2-89-2-datajci-netorjpdatapdf11011-01-1059pdf.jpg)