Embed Size (px)
Citation preview
Zevenhoven & Kilpinen NITROGEN 13.4.2002 4-34
4.11 Chemistry of nitrogen oxides at atmospheric fluidized bedcombustion
In fluidized bed combustion, the combustion takes place in a bed ofparticles that is being fluidized by means of air blown through the bed frombelow. The bed is composed of sand, ash, char residue, and, possibly, SO2
sorbent. Fluidized bed combustion may be divided into two main groups:- Bubbling fluidized bed combustion (BFBC) is a combustion method
where the velocity of the gasflow upwards is between 1 and 3 m/s. Adistinct fluidized bed and a freeboard zone that is almost free of bedmaterial may be discerned in a BFBC reactor.
- In circulating fluidized bed combustion (CFBC) the air velocity is sohigh, some 5 to 10 m/s, that the bed material suspension fills the wholecombustion chamber. Entrained particles are caught in a cyclone andreturned to the combustion chamber.
The NO emission from fluidized bed combustion is, as a rule, significantlyless than that resulting from burner operation. This is partly explained bythe low fluidized bed combustion temperature (800 - 900 °C) as a result ofwhich the formation of thermal NO is negligible, and almost all of the nitricoxide originates from fuel nitrogen. In circulating fluidized bed combustion,the low NO emission is partly explained also by the efficient reduction ofnitric oxide by air staging, and reduction of nitric oxide with char. Incirculating fluidized bed combustion, significant amounts of char arepresent everywhere in the furnace, and the efficient interaction betweennitric oxide and char is possible in the whole reactor volume. With airstaging the amount of char in the furnace increases even more.
Describing the formation and decomposition of nitrogen oxides in fluidizedbed combustion is more complicated than describing that related to burnercombustion. Apart from the nitric oxide emission, the laughing gasemission at fluidized bed combustion must be accounted for too, becausethe low temperature favors the formation of laughing gas, whereby the N2Oemission at fluidized bed combustion is markedly higher than that withburner combustion. The dependences on combustion parameters are oftencontradictory for NO and N2O. Moreover, at fluidized bed combustion,many heterogeneous reactions between gas and particles become important,e.g., reduction of nitric oxide with char, which, aside from the homogeneousgas reactions, must be considered. This concerns especially circulatingfluidized bed combustion, where the interaction between gas and particles ismore intensive than in bubbling fluidized bed combustion.
The heterogeneous reactions of fluidized bed combustion may be eithercatalytic or noncatalytic. For example, the reduction of nitric oxide with
Zevenhoven & Kilpinen NITROGEN 13.4.2002 4-35
char may take place also catalytically if sufficient concentrations of reducinggases, such as carbon monoxide, are present. Apart from char, it has beenfound that an efficient catalyst for nitrogen reactions is, e.g., calcium oxide(CaO), which is added to the combustion chamber in the form oflimestone, (CaCO3) for binding sulfur dioxide (L Chapter 3). Limestoneitself and sulfated limestone (CaSO4) are generally less efficient catalyststhan CaO.
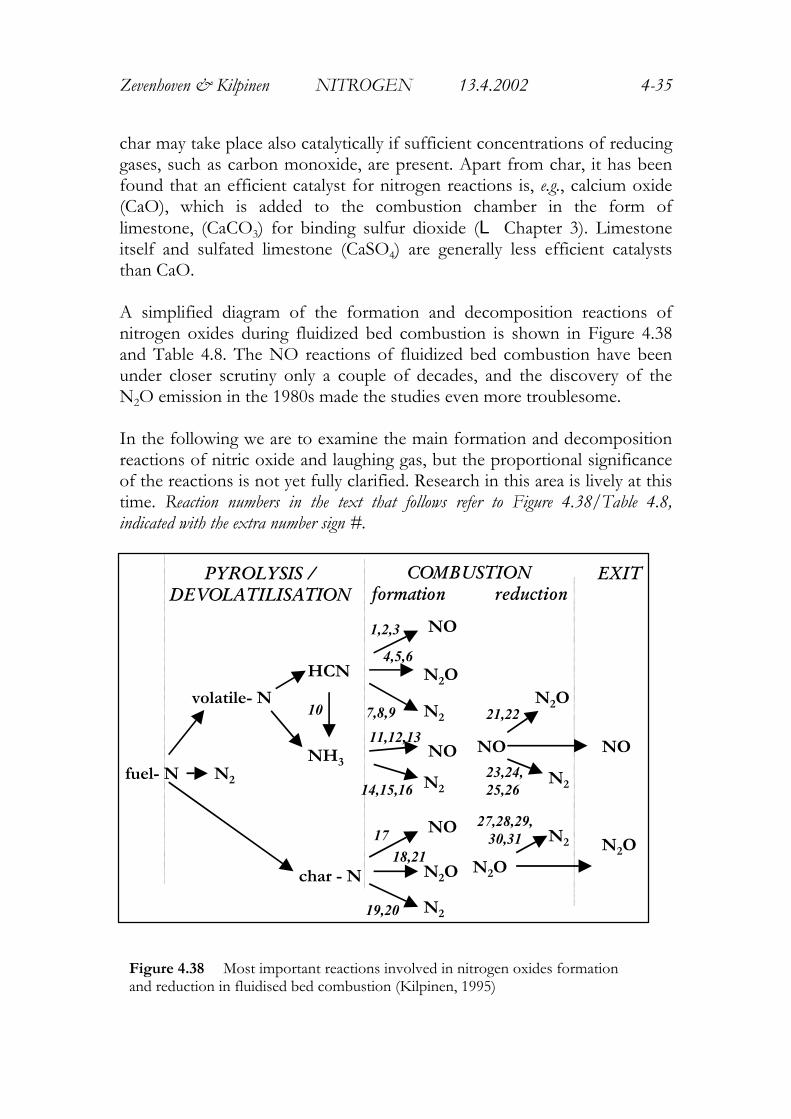
A simplified diagram of the formation and decomposition reactions ofnitrogen oxides during fluidized bed combustion is shown in Figure 4.38and Table 4.8. The NO reactions of fluidized bed combustion have beenunder closer scrutiny only a couple of decades, and the discovery of theN2O emission in the 1980s made the studies even more troublesome.
In the following we are to examine the main formation and decompositionreactions of nitric oxide and laughing gas, but the proportional significanceof the reactions is not yet fully clarified. Research in this area is lively at thistime. Reaction numbers in the text that follows refer to Figure 4.38/Table 4.8,indicated with the extra number sign #.
fuel- N N2
volatile- N
char - N
NH3
HCN
PYROLYSIS /DEVOLATILISATION
NO
N2O
N2O
N2
N2 N2O
NO
COMBUSTIONformation reduction
EXIT
10
NO
N2O
N2
NO
N2
NO
N2O
N2
1,2,3
4,5,6
7,8,9
11,12,13
14,15,16
17
18,21
19,20
21,22
23,24,25,26
27,28,29,30,31
Figure 4.38 Most important reactions involved in nitrogen oxides formationand reduction in fluidised bed combustion (Kilpinen, 1995)
Zevenhoven & Kilpinen NITROGEN 13.4.2002 4-36
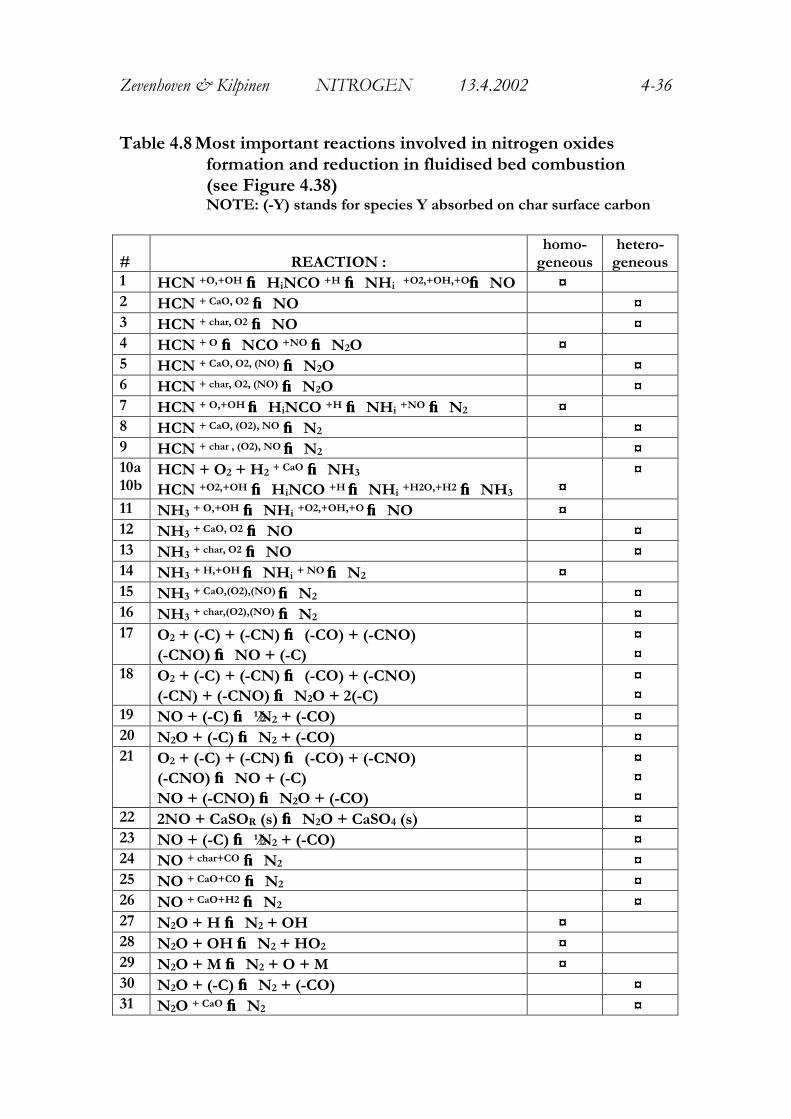
Table 4.8 Most important reactions involved in nitrogen oxidesformation and reduction in fluidised bed combustion(see Figure 4.38)NOTE: (-Y) stands for species Y absorbed on char surface carbon
# REACTION :homo-
geneoushetero-
geneous1 HCN +O,+OH →→ HiNCO +H →→ NHi +O2,+OH,+O→→ NO ♦♦2 HCN + CaO, O2 →→ NO ♦♦3 HCN + char, O2 →→ NO ♦♦4 HCN + O →→ NCO +NO →→ N2O ♦♦5 HCN + CaO, O2, (NO) →→ N2O ♦♦6 HCN + char, O2, (NO) →→ N2O ♦♦7 HCN + O,+OH →→ HiNCO +H →→ NHi +NO →→ N2 ♦♦8 HCN + CaO, (O2), NO →→ N2 ♦♦9 HCN + char , (O2), NO →→ N2 ♦♦10a10b
HCN + O2 + H2 + CaO →→ NH3
HCN +O2,+OH →→ HiNCO +H →→ NHi +H2O,+H2 →→ NH3 ♦♦♦♦
11 NH3 + O,+OH →→ NHi +O2,+OH,+O →→ NO ♦♦12 NH3 + CaO, O2 →→ NO ♦♦13 NH3 + char, O2 →→ NO ♦♦14 NH3 + H,+OH →→ NHi + NO →→ N2 ♦♦15 NH3 + CaO,(O2),(NO) →→ N2 ♦♦16 NH3 + char,(O2),(NO) →→ N2 ♦♦17 O2 + (-C) + (-CN) →→ (-CO) + (-CNO)
(-CNO) →→ NO + (-C)♦♦♦♦
18 O2 + (-C) + (-CN) →→ (-CO) + (-CNO)(-CN) + (-CNO) →→ N2O + 2(-C)
♦♦♦♦
19 NO + (-C) →→ ½N2 + (-CO) ♦♦20 N2O + (-C) →→ N2 + (-CO) ♦♦21 O2 + (-C) + (-CN) →→ (-CO) + (-CNO)
(-CNO) →→ NO + (-C)NO + (-CNO) →→ N2O + (-CO)
♦♦♦♦♦♦
22 2NO + CaSOR (s) →→ N2O + CaSO4 (s) ♦♦23 NO + (-C) →→ ½N2 + (-CO) ♦♦24 NO + char+CO →→ N2 ♦♦25 NO + CaO+CO →→ N2 ♦♦26 NO + CaO+H2 →→ N2 ♦♦27 N2O + H →→ N2 + OH ♦♦28 N2O + OH →→ N2 + HO2 ♦♦29 N2O + M →→ N2 + O + M ♦♦30 N2O + (-C) →→ N2 + (-CO) ♦♦31 N2O + CaO →→ N2 ♦♦
Zevenhoven & Kilpinen NITROGEN 13.4.2002 4-37
4.11.1 N2O formation mechanisms
Homogeneous oxidation of hydrogen cyanide
At fluidized bed combustion temperatures, about 10 to 50 %, of the volatilecyan and cyanide compounds of the fuel nitrogen, such as HCN, is oxidizedhomogeneously to laughing gas. The main reaction path from hydrogencyanide to laughing gas is:
HCN + O → NCO + H (R4-4#)NCO + NO → N2O + CO
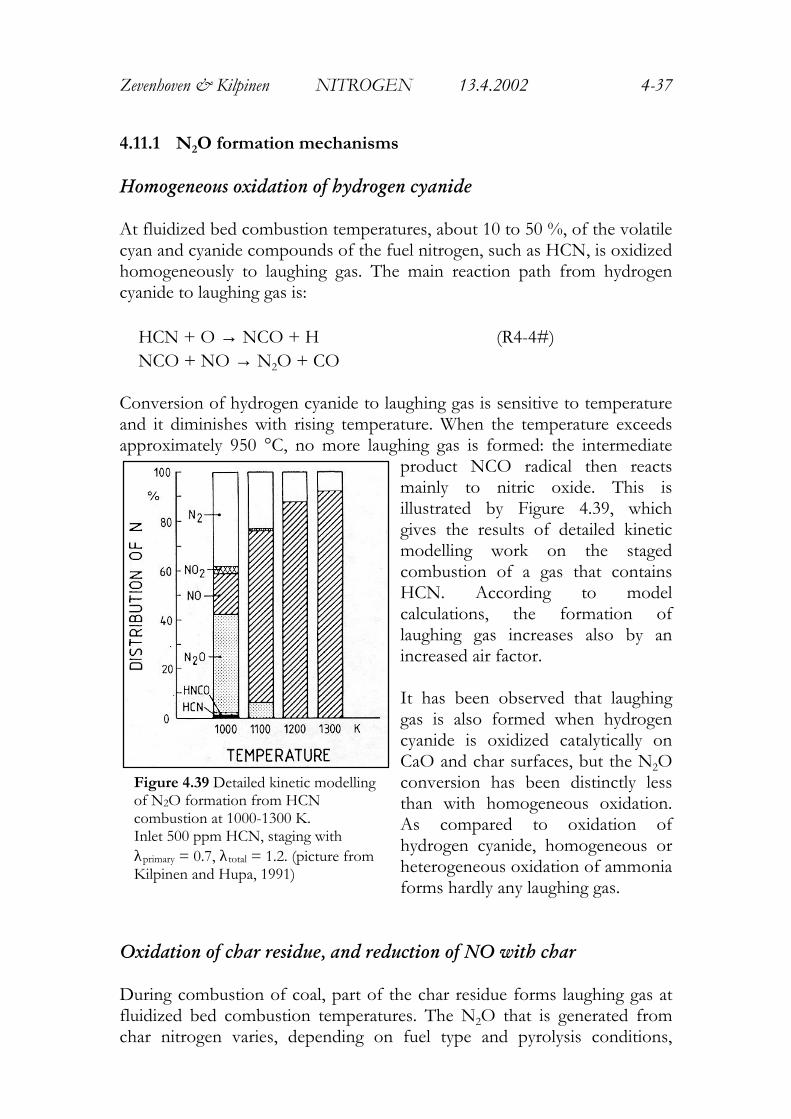
Conversion of hydrogen cyanide to laughing gas is sensitive to temperatureand it diminishes with rising temperature. When the temperature exceedsapproximately 950 °C, no more laughing gas is formed: the intermediate
product NCO radical then reactsmainly to nitric oxide. This isillustrated by Figure 4.39, whichgives the results of detailed kineticmodelling work on the stagedcombustion of a gas that containsHCN. According to modelcalculations, the formation oflaughing gas increases also by anincreased air factor.
It has been observed that laughinggas is also formed when hydrogencyanide is oxidized catalytically onCaO and char surfaces, but the N2Oconversion has been distinctly lessthan with homogeneous oxidation.As compared to oxidation ofhydrogen cyanide, homogeneous orheterogeneous oxidation of ammoniaforms hardly any laughing gas.
Oxidation of char residue, and reduction of NO with char
During combustion of coal, part of the char residue forms laughing gas atfluidized bed combustion temperatures. The N2O that is generated fromchar nitrogen varies, depending on fuel type and pyrolysis conditions,
Figure 4.39 Detailed kinetic modellingof N2O formation from HCNcombustion at 1000-1300 K.Inlet 500 ppm HCN, staging withλprimary = 0.7, λtotal = 1.2. (picture fromKilpinen and Hupa, 1991)
Zevenhoven & Kilpinen NITROGEN 13.4.2002 4-38
between 1 and 20 %. The formation mechanism of laughing gas from charnitrogen is not yet fully clarified, but, e.g., the following mechanism has beenproposed:
O2 + (-C) + (-CN) → (-CO) + (-CNO)(-CNO) → NO + (-C) (R4-21#)NO + (-CNO) → N2O + (-CO)
where (-Y) in the formulae refers to molecule Y bound to char. In thismechanism, oxygen oxidizes the nitrogen bound in char (-CN) producing asuitable intermediate product such as (-CNO). This intermediate (-CNO)may be decomposed further to nitric oxide or react together with the nitricoxide to laughing gas.
Alternative reaction mechanisms for formation of laughing gas from charnitrogen have been proposed also:
O2 + (-C) + (-CN) → (-CO) + (-CNO)(-CN) + (-CNO) → N2O + 2(-C) (R4-18#)
The first step of both above reaction mechanisms is the same. Theintermediate product (-CNO) reacts to laughing gas either with anothernitrogen atom on the char surface (-CN) (R4-18#) or with nitric oxide NO(R4-21#). Since the probability of two adjacent nitrogen atoms occurringon the char surface is very small, the significance of (R4-18#) is assumed tobe less than that of (R4-21#).
The NO reacting in the last phase of mechanism (R4-21#) may, aside fromresulting from oxidation of char nitrogen, originate from other sources,whereby it may later diffuse into the char pores.
4.11.2 N2O decomposition mechanisms
Homogeneous decomposition
Laughing gas may be decomposed both homogeneously andheterogeneously. Under fluidized bed combustion conditions the mainhomogeneous N2O decomposition mechanism is usually a reaction with ahydrogen atom.
N2O + H → N2 + OH (R4-27#)
The reaction rate constant and the concentration of H atoms increasestrongly with rising temperature and the decomposition of laughing gas is
Zevenhoven & Kilpinen NITROGEN 13.4.2002 4-39
markedly accelerated at high temperatures. As the laughing gas in a burnerflame enters hot zones of the flame, any or all of the N2O formed at lowertemperatures is decomposed according to the reaction above. Also atfluidized bed combustion temperatures, the concentration of H atomsduring oxidation is high enough to allow decomposition of a considerablepart of the laughing gas.
If the concentration of H atoms is low and the temperature over, say,900°C, laughing gas decomposes also thermally:
N2O + M → N2 + O + M (R4-29#)
where M represents any third (gas) component.
Heterogeneous decomposition
The main heterogeneous N2O decomposition mechanisms are those withchar and calcium oxide:
N2O + (-C) → N2 + (-CO) (R4-30#)N2O + CaO → N2 (R4-31#)
The N2O decomposing efficiency of char and calcium oxide variessomewhat depending on the types of fuel and calcium.
4.11.3 N2O emission at fluidized bed combustion
The main factors affecting the emission of laughing gas from fluidized bedcombustion are the type of fuel, the temperature, and the air factor. TheN2O emission increases when the temperature drops and the air factorincreases. The N2O emission is higher for geologically older fuels (e.g., coal)than for younger fuels (e.g., peat and wood). A typical N2O emission for coalranges between 50 and 150 ppmv. For peat at circulating fluidized bedcombustion, the typical N2O emission is less than 30 ppmv, and for wood,less than 10 ppmv. The N2O emission from bubbling fluidized bedcombustion is usually somewhat lower than in circulating fluidized bedcombustion.
It has frequently been observed that also the age of different coals or peatsaffects the N2O emission: the older the fuel, the higher is the N2O emission.The correlation is, however, not so clear as between coal, peat, and wood,since the fuel nitrogen content begins to have an increasing effect on the
Zevenhoven & Kilpinen NITROGEN 13.4.2002 4-40
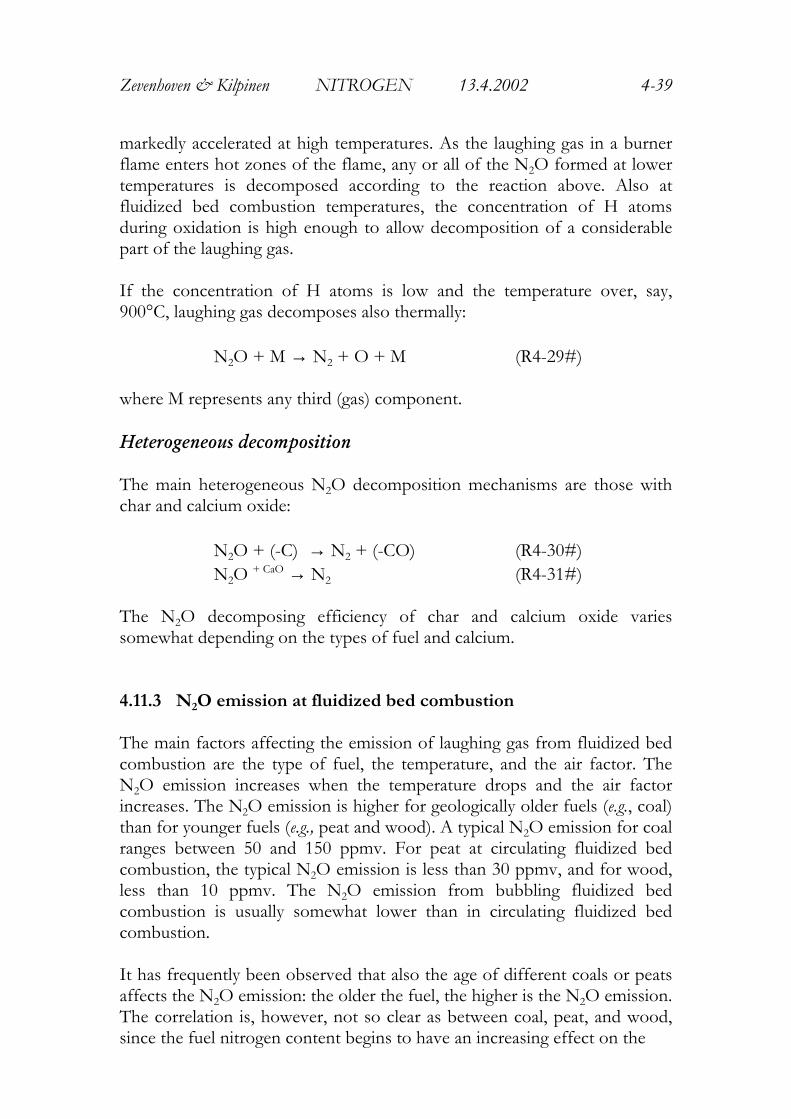
N2O emission. Figure 4.40 demonstrates the effects of fuel type,temperature, and air factor on the N2O emission and shows typical N2Oconcentration profiles measured at a full scale circulating fluidized bedcombustion plant.
Several methods have been proposed for reducing the N2O emission duringfluidized bed combustion. One is based on optimizing the combustionparameters to minimize the formation of laughing gas. This is possible, e.g.,by means of raising the temperature. A problem, however, arises as the
Figure 4.40 Top left : Effect of temperature on N2O emission, for different fuels inan 8 MW CFB boiler. Excess air ratio 1.2, bed material sand (picture from Åmand
and Andersson, 1989). Top right : Effect of excess air ratio on N2O and NOemission in a 12 MW CFBC boiler firing bituminous coal. The excess air ratio wasvaried in different ways by means of adjusting the total air supply or fuel feed. Bedmaterial sand (picture from Åmand and Leckner, 1992) Bottom : Typical measured
N2O and NO concentration profiles in a 12 MW CFB boiler firing bituminouscoal. Bed temperature 850 °C, air factor 1.2, primary stoichiometry 0.75, bed
material sand. (picture from Åmand et al., 1991)
Zevenhoven & Kilpinen NITROGEN 13.4.2002 4-41
various emissions from fluidized bed combustion are largely dependent oneach other. Reducing one emission often increases another. For example,when the temperature is raised, the N2O emission decreases but theemissions of NO and SO2 increase.
Another method proposed was to operate the boiler under conditionswhich minimize the NO and SO2 emissions at the cost of the N2Oemission. To decrease the laughing gas, a secondary fuel, e.g., natural gas,may be supplied to the cyclone. The burning gas would raise the cyclonetemperature and, e.g., the H-atom concentration, and part of the laughinggas decomposes through homogeneous reactions. Studies regarding catalyticdecomposition of laughing gas in a separate reactor with, e.g., limestonehave also been made.
4.11.4 NO formation mechanisms
Homogeneous reaction of ammonia (R4-11#), or heterogeneous oxidationwith calcium oxide (R4-12#), and oxidation of char nitrogen (R4-17#) havebeen suggested to be the most important formation mechanisms of nitricoxide.
NH3 + O,+OH → NHi
+O2,+OH,+O → NO (R4-11#)NH3
+ CaO, O2 → NO (R4-12#)
O2 + (-C) + (-CN) → (-CO) + (-CNO) (R4-17#)(-CNO) → NO + (-C)
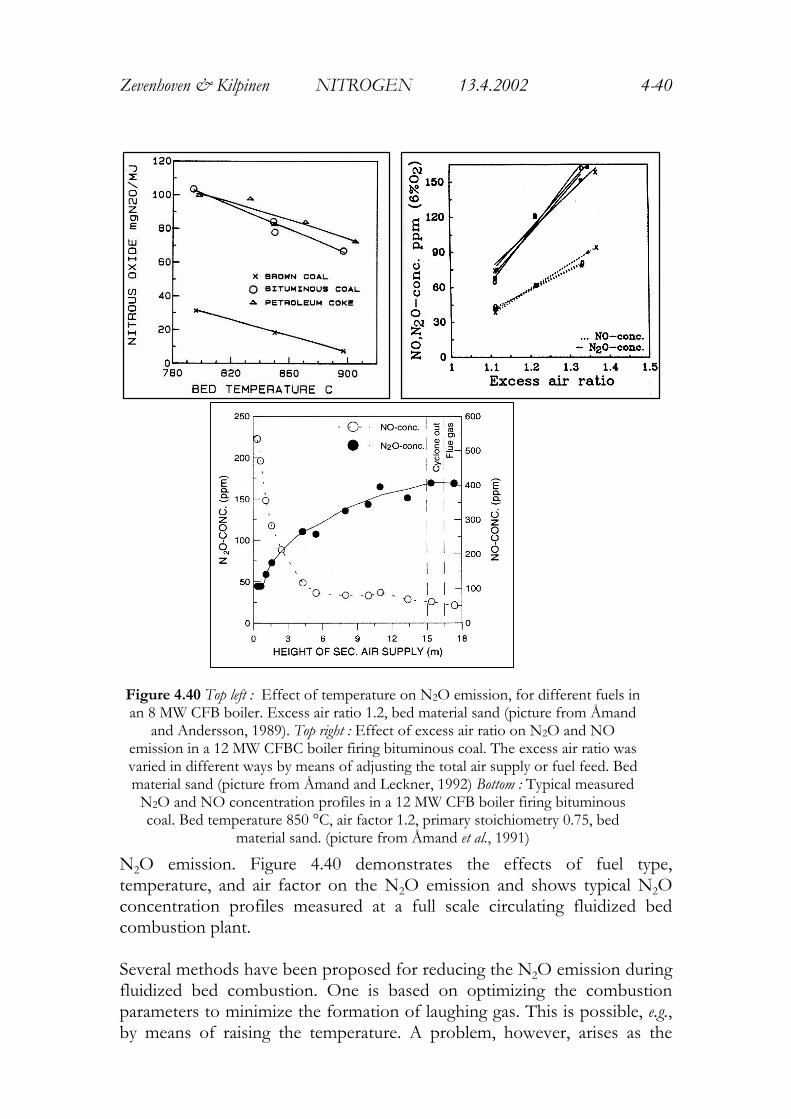
Figure 4.41 Typical measurement data for NH3 and HCN concentration profiles ina 12 MW CFBC boiler firing bimuminous coal. Bed temperature 850°C, air factor1.2-1.25, primary air factor 0.7-0.75 (picture from Åmand and Leckner 1994)
Zevenhoven & Kilpinen NITROGEN 13.4.2002 4-42
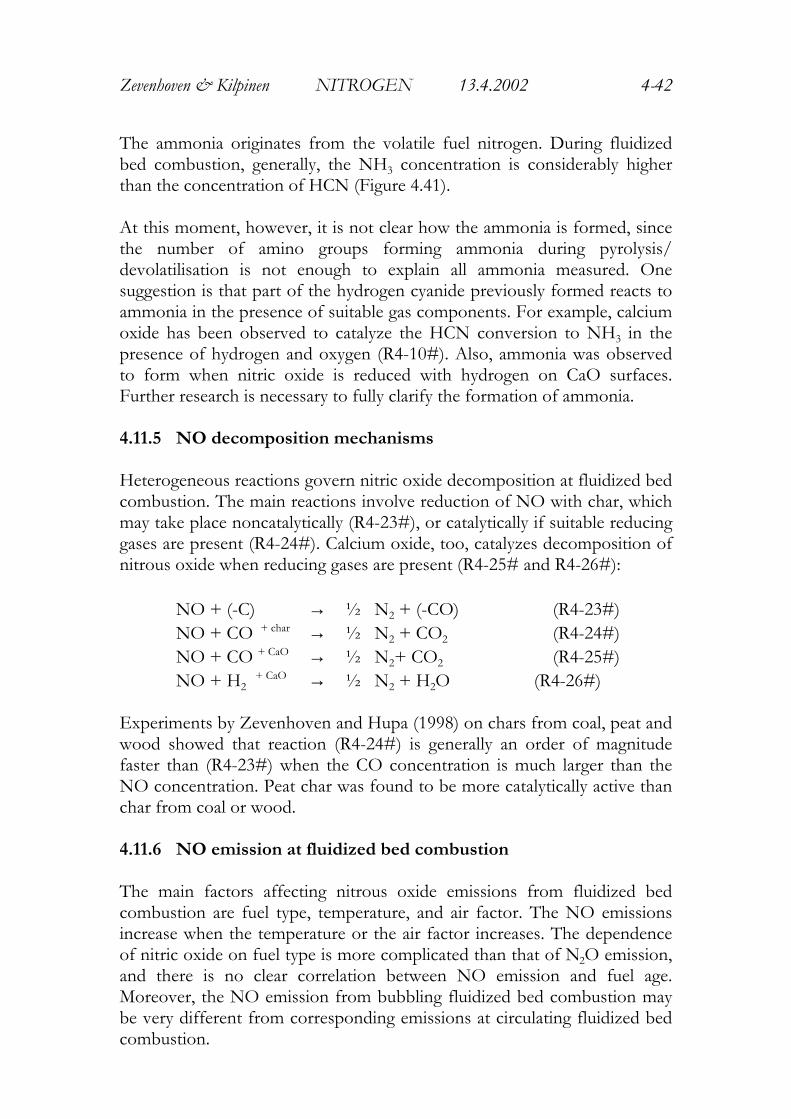
The ammonia originates from the volatile fuel nitrogen. During fluidizedbed combustion, generally, the NH3 concentration is considerably higherthan the concentration of HCN (Figure 4.41).
At this moment, however, it is not clear how the ammonia is formed, sincethe number of amino groups forming ammonia during pyrolysis/devolatilisation is not enough to explain all ammonia measured. Onesuggestion is that part of the hydrogen cyanide previously formed reacts toammonia in the presence of suitable gas components. For example, calciumoxide has been observed to catalyze the HCN conversion to NH3 in thepresence of hydrogen and oxygen (R4-10#). Also, ammonia was observedto form when nitric oxide is reduced with hydrogen on CaO surfaces.Further research is necessary to fully clarify the formation of ammonia.
4.11.5 NO decomposition mechanisms
Heterogeneous reactions govern nitric oxide decomposition at fluidized bedcombustion. The main reactions involve reduction of NO with char, whichmay take place noncatalytically (R4-23#), or catalytically if suitable reducinggases are present (R4-24#). Calcium oxide, too, catalyzes decomposition ofnitrous oxide when reducing gases are present (R4-25# and R4-26#):
NO + (-C) → ½ N2 + (-CO) (R4-23#)NO + CO + char → ½ N2 + CO2 (R4-24#)NO + CO + CaO → ½ N2+ CO2 (R4-25#)NO + H2
+ CaO → ½ N2 + H2O (R4-26#)
Experiments by Zevenhoven and Hupa (1998) on chars from coal, peat andwood showed that reaction (R4-24#) is generally an order of magnitudefaster than (R4-23#) when the CO concentration is much larger than theNO concentration. Peat char was found to be more catalytically active thanchar from coal or wood.
4.11.6 NO emission at fluidized bed combustion
The main factors affecting nitrous oxide emissions from fluidized bedcombustion are fuel type, temperature, and air factor. The NO emissionsincrease when the temperature or the air factor increases. The dependenceof nitric oxide on fuel type is more complicated than that of N2O emission,and there is no clear correlation between NO emission and fuel age.Moreover, the NO emission from bubbling fluidized bed combustion maybe very different from corresponding emissions at circulating fluidized bedcombustion.
Zevenhoven & Kilpinen NITROGEN 13.4.2002 4-43
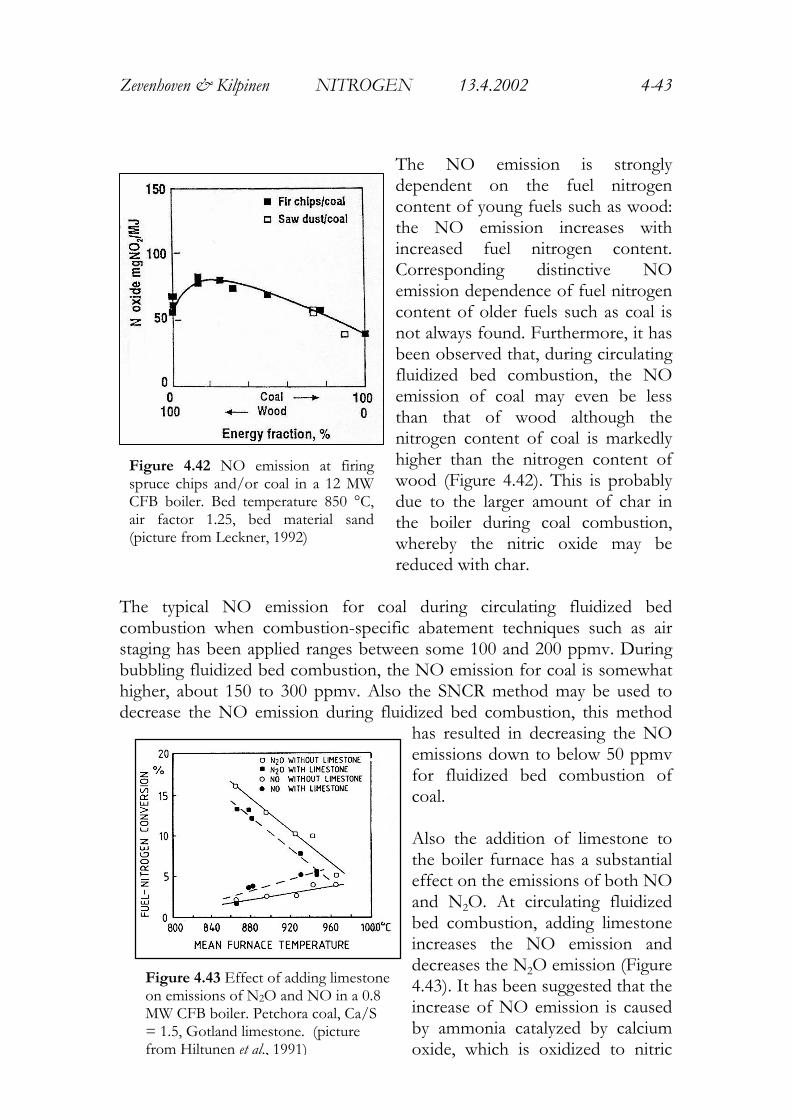
The NO emission is stronglydependent on the fuel nitrogencontent of young fuels such as wood:the NO emission increases withincreased fuel nitrogen content.Corresponding distinctive NOemission dependence of fuel nitrogencontent of older fuels such as coal isnot always found. Furthermore, it hasbeen observed that, during circulatingfluidized bed combustion, the NOemission of coal may even be lessthan that of wood although thenitrogen content of coal is markedlyhigher than the nitrogen content ofwood (Figure 4.42). This is probablydue to the larger amount of char inthe boiler during coal combustion,whereby the nitric oxide may bereduced with char.
The typical NO emission for coal during circulating fluidized bedcombustion when combustion-specific abatement techniques such as airstaging has been applied ranges between some 100 and 200 ppmv. Duringbubbling fluidized bed combustion, the NO emission for coal is somewhathigher, about 150 to 300 ppmv. Also the SNCR method may be used todecrease the NO emission during fluidized bed combustion, this method
has resulted in decreasing the NOemissions down to below 50 ppmvfor fluidized bed combustion ofcoal.
Also the addition of limestone tothe boiler furnace has a substantialeffect on the emissions of both NOand N2O. At circulating fluidizedbed combustion, adding limestoneincreases the NO emission anddecreases the N2O emission (Figure4.43). It has been suggested that theincrease of NO emission is causedby ammonia catalyzed by calciumoxide, which is oxidized to nitric
Figure 4.43 Effect of adding limestoneon emissions of N2O and NO in a 0.8MW CFB boiler. Petchora coal, Ca/S= 1.5, Gotland limestone. (picturefrom Hiltunen et al., 1991)
Figure 4.42 NO emission at firingspruce chips and/or coal in a 12 MWCFB boiler. Bed temperature 850 °C,air factor 1.25, bed material sand(picture from Leckner, 1992)
Zevenhoven & Kilpinen NITROGEN 13.4.2002 4-44
oxide (R4-12#), whereas the decrease of N2O emission is a result ofdecomposition of laughing gas catalyzed by calcium oxide (R4-31#).At this moment, knowledge on the effects of limestone addition on the NOand N2O emissions is not conclusive, because alternative explanations havealso been given, as for instance:
- When limestone is added the oxidizing reaction of hydrogen cyanideshifts from homogeneous (R4-1#, R4-4#, R4-7#) to heterogeneous (R4-2#, R4-5#, R4-8#). Heterogeneous oxidation of HCN catalyzed by calciumoxide produces, according to laboratory experiments, substantially morenitric oxide and less laughing gas than corresponding homogeneousoxidation of HCN at fluidized bed combustion temperatures.
- When limestone is added the concentrations of sulfur dioxide andcarbon monoxide decrease. According to laboratory experiments thedecrease of SO2 increases the NO conversion of the nitrogen compounds inthe fuel to some extent and decreases the N2O conversion. The decrease ofthe CO concentration, too, increases the NO emission, since the reductionof nitric oxide becomes less intense.
4.11.7 NOx and N2O from FBC - overview
A summary on the effect of various combustion parameters on the NO andN2O emissions at fluidized bed combustion is made in Table 4.9. The effectof pressure is still to be discussed below.
Table 4.9 Effect of process parameters on N2O and NO emissionsfrom bubbling and circulating FBC (Kilpinen, 1995)
Increasing parameter N2O emissions NO emissions
Temperature ↓ ↑Fuel volatile nitrogen content ↓ (BFB), ↓ (CFB) ↓ (BFB), ↑ (CFB)
Fuel nitrogen content ↑ ↑Excess air ↑ ↑Air staging ↓ ↓
Limestone addition ↓, - ↓ (BFB), ↑ (CFB)SO2 level ↑ ↓
SNCR – NH3 ↑, - ↓SNCR – urea ↑ ↓
SCR - ↓Pressure ↑, ↓ ↓ (but NO2 ↑ )
Zevenhoven & Kilpinen NITROGEN 13.4.2002 4-45
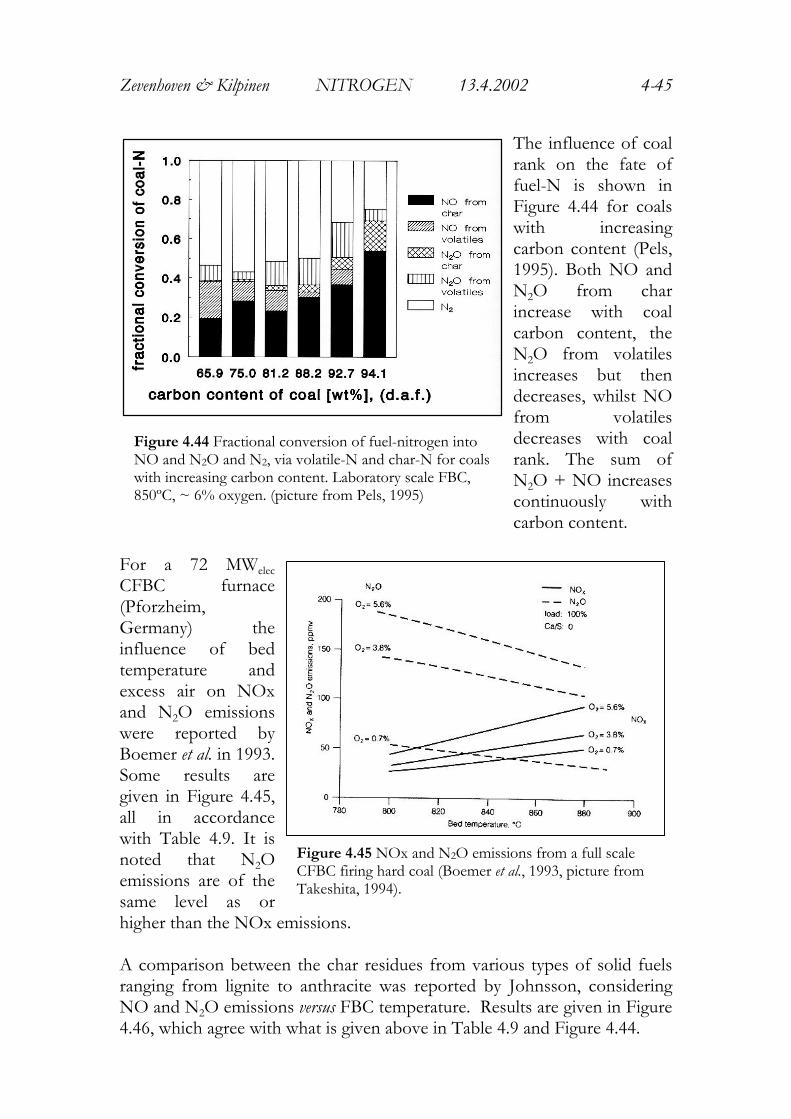
The influence of coalrank on the fate offuel-N is shown inFigure 4.44 for coalswith increasingcarbon content (Pels,1995). Both NO andN2O from charincrease with coalcarbon content, theN2O from volatilesincreases but thendecreases, whilst NOfrom volatilesdecreases with coalrank. The sum ofN2O + NO increasescontinuously withcarbon content.
For a 72 MWelec
CFBC furnace(Pforzheim,Germany) theinfluence of bedtemperature andexcess air on NOxand N2O emissionswere reported byBoemer et al. in 1993.Some results aregiven in Figure 4.45,all in accordancewith Table 4.9. It isnoted that N2Oemissions are of thesame level as orhigher than the NOx emissions.
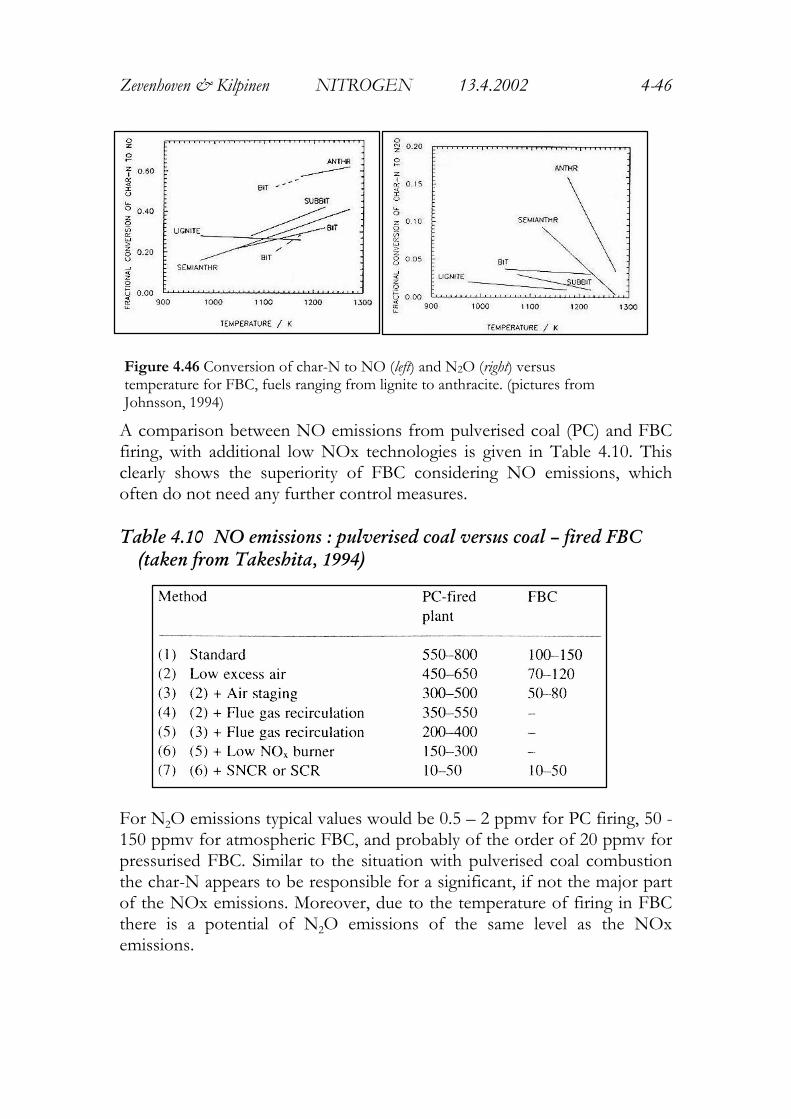
A comparison between the char residues from various types of solid fuelsranging from lignite to anthracite was reported by Johnsson, consideringNO and N2O emissions versus FBC temperature. Results are given in Figure4.46, which agree with what is given above in Table 4.9 and Figure 4.44.
Figure 4.44 Fractional conversion of fuel-nitrogen intoNO and N2O and N2, via volatile-N and char-N for coalswith increasing carbon content. Laboratory scale FBC,850ºC, ~ 6% oxygen. (picture from Pels, 1995)
Figure 4.45 NOx and N2O emissions from a full scaleCFBC firing hard coal (Boemer et al., 1993, picture fromTakeshita, 1994).
Zevenhoven & Kilpinen NITROGEN 13.4.2002 4-46
A comparison between NO emissions from pulverised coal (PC) and FBCfiring, with additional low NOx technologies is given in Table 4.10. Thisclearly shows the superiority of FBC considering NO emissions, whichoften do not need any further control measures.
Table 4.10 NO emissions : pulverised coal versus coal – fired FBC(taken from Takeshita, 1994)
For N2O emissions typical values would be 0.5 – 2 ppmv for PC firing, 50 -150 ppmv for atmospheric FBC, and probably of the order of 20 ppmv forpressurised FBC. Similar to the situation with pulverised coal combustionthe char-N appears to be responsible for a significant, if not the major partof the NOx emissions. Moreover, due to the temperature of firing in FBCthere is a potential of N2O emissions of the same level as the NOxemissions.
Figure 4.46 Conversion of char-N to NO (left) and N2O (right) versustemperature for FBC, fuels ranging from lignite to anthracite. (pictures fromJohnsson, 1994)
Zevenhoven & Kilpinen NITROGEN 13.4.2002 4-47
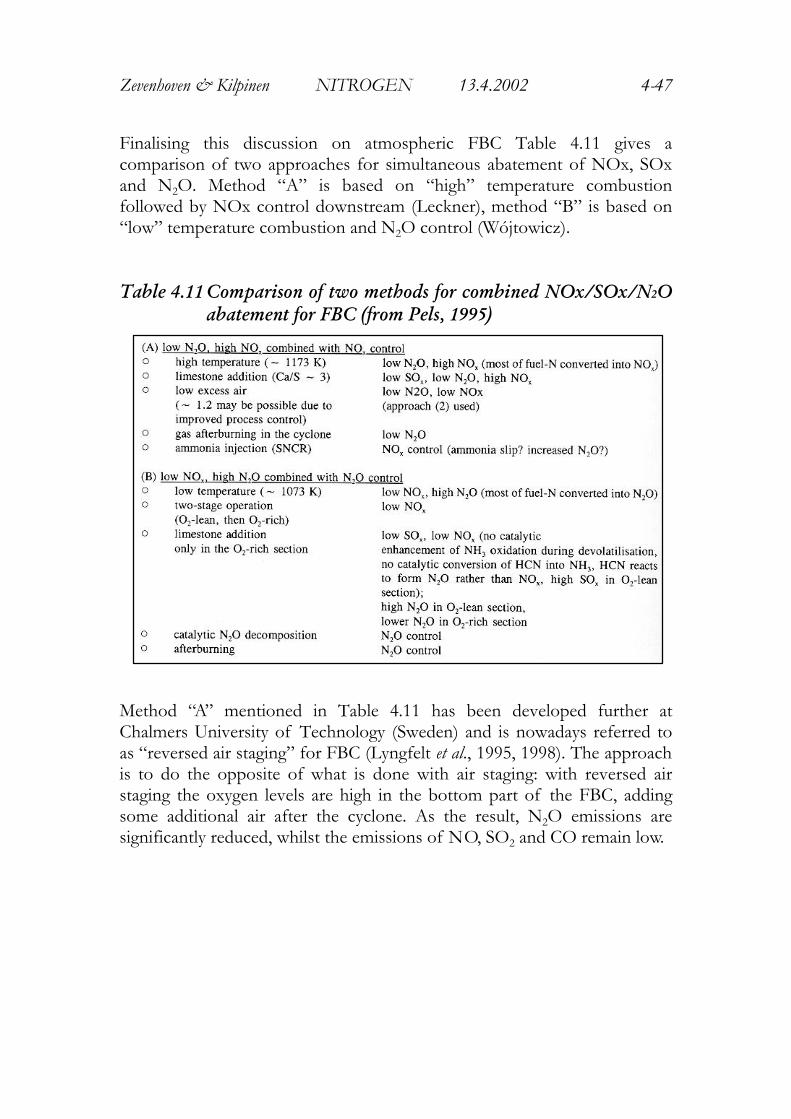
Finalising this discussion on atmospheric FBC Table 4.11 gives acomparison of two approaches for simultaneous abatement of NOx, SOxand N2O. Method “A” is based on “high” temperature combustionfollowed by NOx control downstream (Leckner), method “B” is based on“low” temperature combustion and N2O control (Wójtowicz).
Table 4.11 Comparison of two methods for combined NOx/SOx/N2Oabatement for FBC (from Pels, 1995)
Method “A” mentioned in Table 4.11 has been developed further atChalmers University of Technology (Sweden) and is nowadays referred toas “reversed air staging” for FBC (Lyngfelt et al., 1995, 1998). The approachis to do the opposite of what is done with air staging: with reversed airstaging the oxygen levels are high in the bottom part of the FBC, addingsome additional air after the cyclone. As the result, N2O emissions aresignificantly reduced, whilst the emissions of NO, SO2 and CO remain low.
Zevenhoven & Kilpinen NITROGEN 13.4.2002 4-48
4.12 Reaction of nitrogen oxides at pressurised combustion
Pressurized combustion processes in heat and power generation are likely togain importance. These processes comprise combustion or gasificationstages at elevated pressure (typically 10~ 20 bar) and gas or steam turbines.In production of electricity, the efficiency of the processes is calculated tobe 45 % or even more, i.e., ~ 10 % units higher than conventionalcondensing power plant techniques. (More details: L Chapter 2).
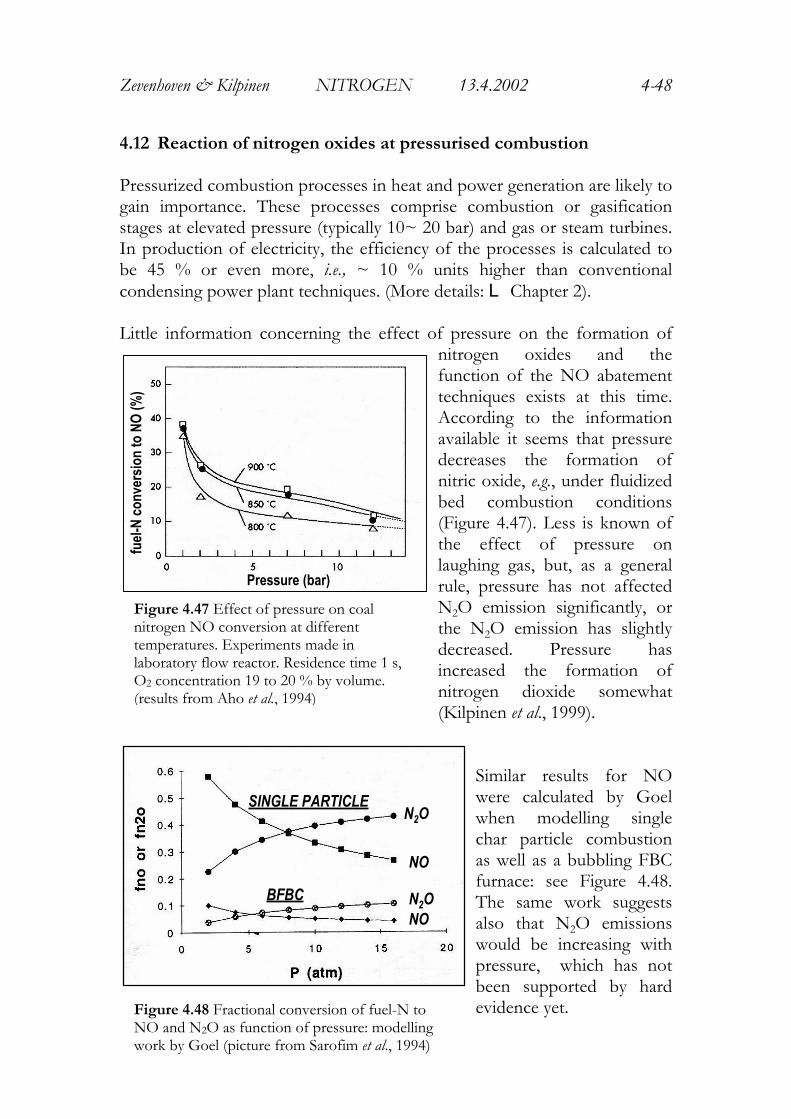
Little information concerning the effect of pressure on the formation ofnitrogen oxides and thefunction of the NO abatementtechniques exists at this time.According to the informationavailable it seems that pressuredecreases the formation ofnitric oxide, e.g., under fluidizedbed combustion conditions(Figure 4.47). Less is known ofthe effect of pressure onlaughing gas, but, as a generalrule, pressure has not affectedN2O emission significantly, orthe N2O emission has slightlydecreased. Pressure hasincreased the formation ofnitrogen dioxide somewhat(Kilpinen et al., 1999).
Similar results for NOwere calculated by Goelwhen modelling singlechar particle combustionas well as a bubbling FBCfurnace: see Figure 4.48.The same work suggestsalso that N2O emissionswould be increasing withpressure, which has notbeen supported by hardevidence yet.
Figure 4.47 Effect of pressure on coalnitrogen NO conversion at differenttemperatures. Experiments made inlaboratory flow reactor. Residence time 1 s,O2 concentration 19 to 20 % by volume.(results from Aho et al., 1994)
Pressure (bar)
fuel
-N c
onve
rsio
n to
NO
(%)
NO
NO
N2O
N2OBFBC
SINGLE PARTICLE
Figure 4.48 Fractional conversion of fuel-N toNO and N2O as function of pressure: modellingwork by Goel (picture from Sarofim et al., 1994)
Zevenhoven & Kilpinen NITROGEN 13.4.2002 4-49
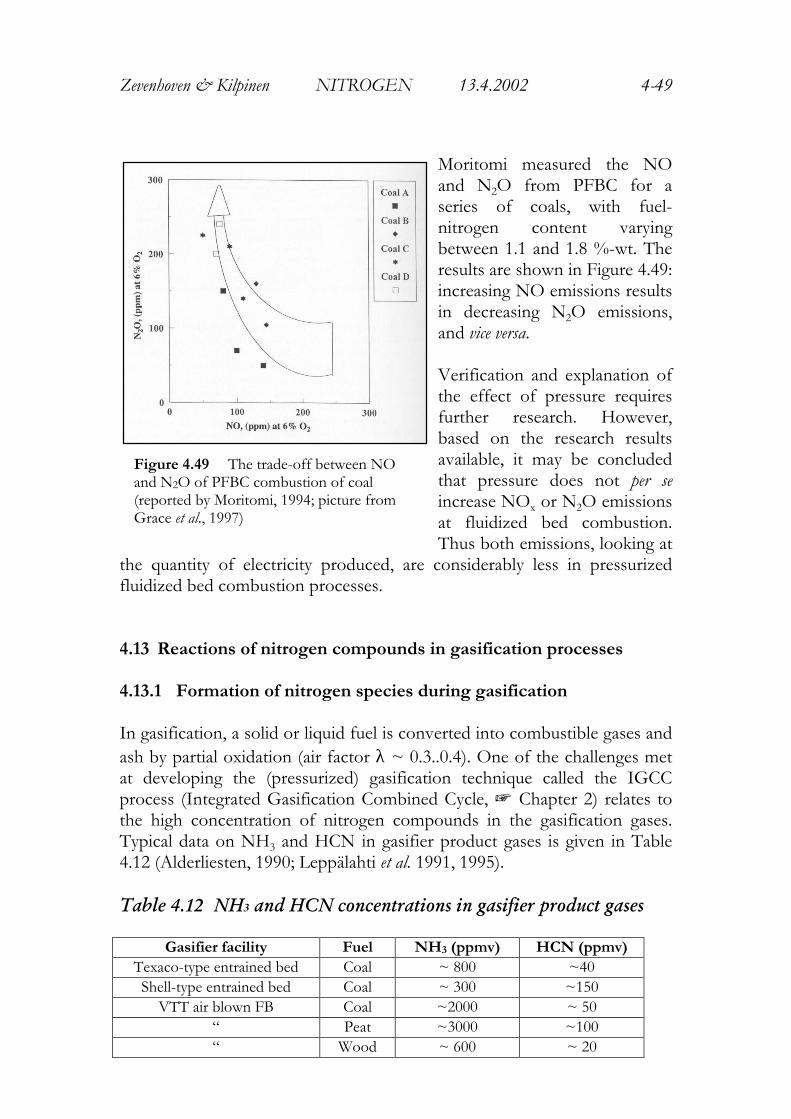
Moritomi measured the NOand N2O from PFBC for aseries of coals, with fuel-nitrogen content varyingbetween 1.1 and 1.8 %-wt. Theresults are shown in Figure 4.49:increasing NO emissions resultsin decreasing N2O emissions,and vice versa.
Verification and explanation ofthe effect of pressure requiresfurther research. However,based on the research resultsavailable, it may be concludedthat pressure does not per seincrease NOx or N2O emissionsat fluidized bed combustion.Thus both emissions, looking at
the quantity of electricity produced, are considerably less in pressurizedfluidized bed combustion processes.
4.13 Reactions of nitrogen compounds in gasification processes
4.13.1 Formation of nitrogen species during gasification
In gasification, a solid or liquid fuel is converted into combustible gases andash by partial oxidation (air factor λ ~ 0.3..0.4). One of the challenges metat developing the (pressurized) gasification technique called the IGCCprocess (Integrated Gasification Combined Cycle, + Chapter 2) relates tothe high concentration of nitrogen compounds in the gasification gases.Typical data on NH3 and HCN in gasifier product gases is given in Table4.12 (Alderliesten, 1990; Leppälahti et al. 1991, 1995).
Table 4.12 NH3 and HCN concentrations in gasifier product gases
Gasifier facility Fuel NH3 (ppmv) HCN (ppmv)Texaco-type entrained bed Coal ~ 800 ~40Shell-type entrained bed Coal ~ 300 ~150
VTT air blown FB Coal ~2000 ~ 50“ Peat ~3000 ~100“ Wood ~ 600 ~ 20
Figure 4.49 The trade-off between NOand N2O of PFBC combustion of coal(reported by Moritomi, 1994; picture fromGrace et al., 1997)
Zevenhoven & Kilpinen NITROGEN 13.4.2002 4-50
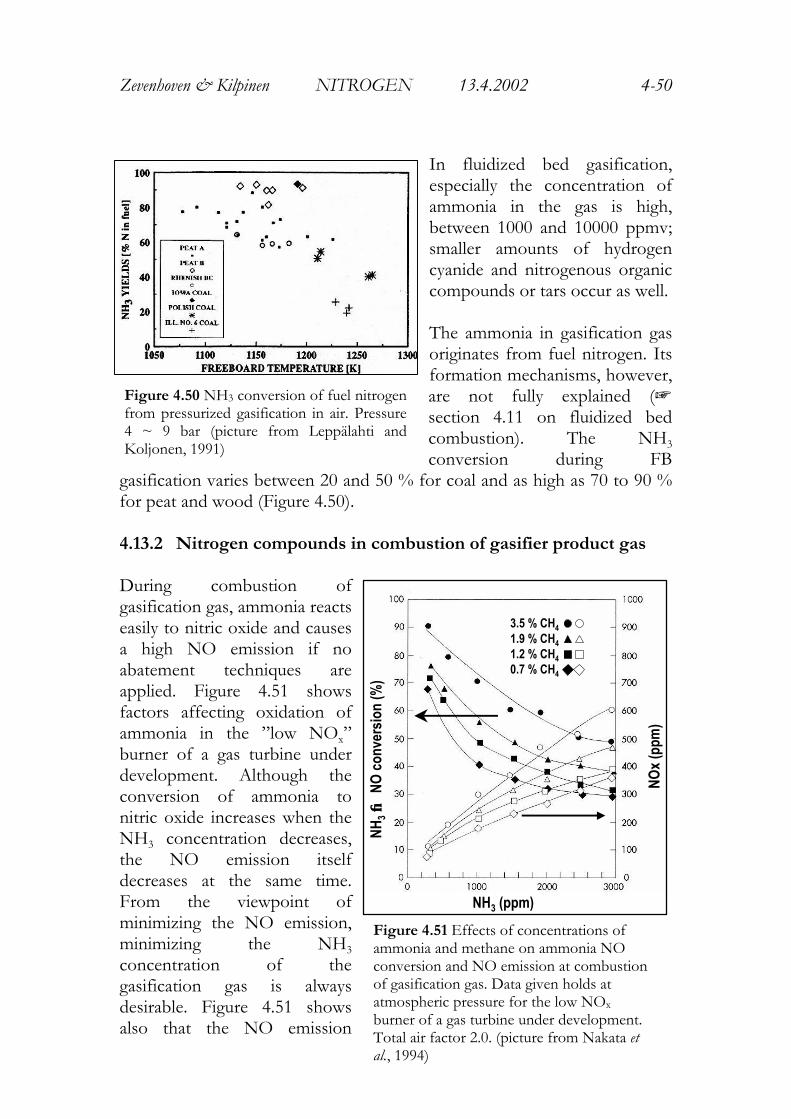
In fluidized bed gasification,especially the concentration ofammonia in the gas is high,between 1000 and 10000 ppmv;smaller amounts of hydrogencyanide and nitrogenous organiccompounds or tars occur as well.
The ammonia in gasification gasoriginates from fuel nitrogen. Itsformation mechanisms, however,are not fully explained (+section 4.11 on fluidized bedcombustion). The NH3
conversion during FBgasification varies between 20 and 50 % for coal and as high as 70 to 90 %for peat and wood (Figure 4.50).
4.13.2 Nitrogen compounds in combustion of gasifier product gas
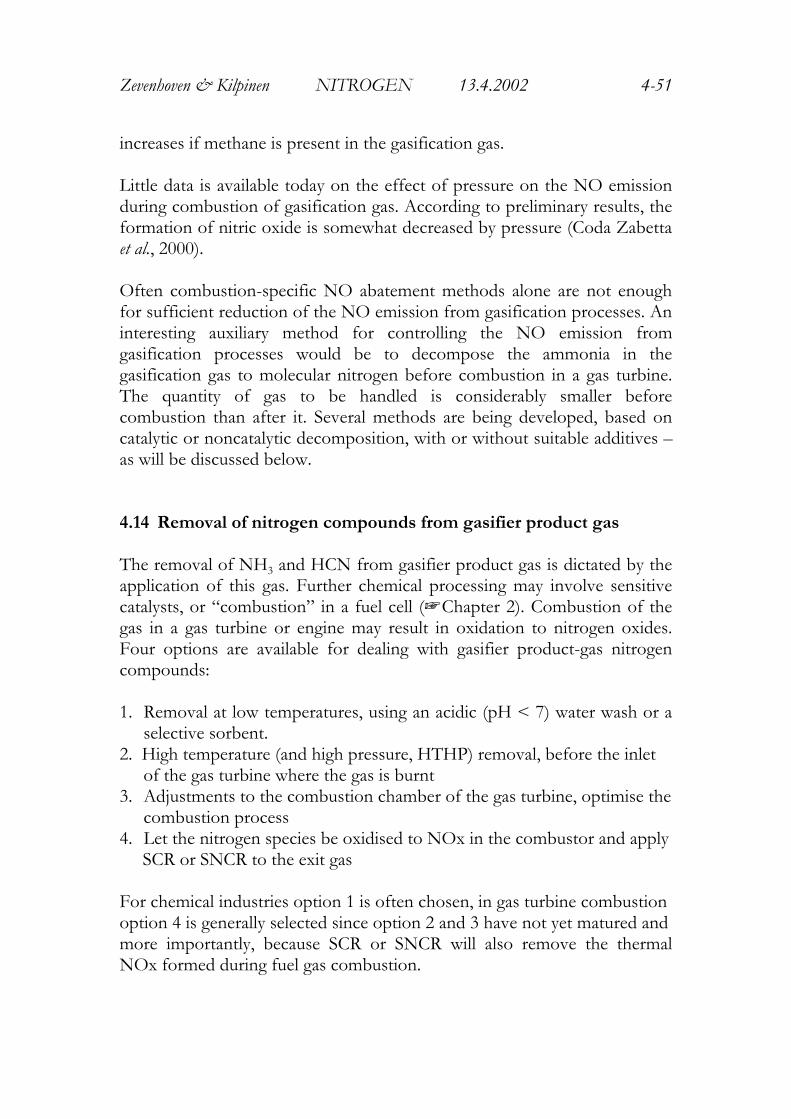
During combustion ofgasification gas, ammonia reactseasily to nitric oxide and causesa high NO emission if noabatement techniques areapplied. Figure 4.51 showsfactors affecting oxidation ofammonia in the ”low NOx”burner of a gas turbine underdevelopment. Although theconversion of ammonia tonitric oxide increases when theNH3 concentration decreases,the NO emission itselfdecreases at the same time.From the viewpoint ofminimizing the NO emission,minimizing the NH3
concentration of thegasification gas is alwaysdesirable. Figure 4.51 showsalso that the NO emission
Figure 4.50 NH3 conversion of fuel nitrogenfrom pressurized gasification in air. Pressure4 ~ 9 bar (picture from Leppälahti andKoljonen, 1991)
NO
x (p
pm)
NH
3 →→ N
O c
onve
rsio
n (%
)
NH3 (ppm)
3.5 % CH4
1.9 % CH4
1.2 % CH4
0.7 % CH4
Figure 4.51 Effects of concentrations ofammonia and methane on ammonia NOconversion and NO emission at combustionof gasification gas. Data given holds atatmospheric pressure for the low NOx
burner of a gas turbine under development.Total air factor 2.0. (picture from Nakata etal., 1994)
Zevenhoven & Kilpinen NITROGEN 13.4.2002 4-51
increases if methane is present in the gasification gas.
Little data is available today on the effect of pressure on the NO emissionduring combustion of gasification gas. According to preliminary results, theformation of nitric oxide is somewhat decreased by pressure (Coda Zabettaet al., 2000).
Often combustion-specific NO abatement methods alone are not enoughfor sufficient reduction of the NO emission from gasification processes. Aninteresting auxiliary method for controlling the NO emission fromgasification processes would be to decompose the ammonia in thegasification gas to molecular nitrogen before combustion in a gas turbine.The quantity of gas to be handled is considerably smaller beforecombustion than after it. Several methods are being developed, based oncatalytic or noncatalytic decomposition, with or without suitable additives –as will be discussed below.
4.14 Removal of nitrogen compounds from gasifier product gas
The removal of NH3 and HCN from gasifier product gas is dictated by theapplication of this gas. Further chemical processing may involve sensitivecatalysts, or “combustion” in a fuel cell (+Chapter 2). Combustion of thegas in a gas turbine or engine may result in oxidation to nitrogen oxides.Four options are available for dealing with gasifier product-gas nitrogencompounds:
1. Removal at low temperatures, using an acidic (pH < 7) water wash or aselective sorbent.
2. High temperature (and high pressure, HTHP) removal, before the inletof the gas turbine where the gas is burnt
3. Adjustments to the combustion chamber of the gas turbine, optimise thecombustion process
4. Let the nitrogen species be oxidised to NOx in the combustor and apply SCR or SNCR to the exit gas
For chemical industries option 1 is often chosen, in gas turbine combustionoption 4 is generally selected since option 2 and 3 have not yet matured andmore importantly, because SCR or SNCR will also remove the thermalNOx formed during fuel gas combustion.
Zevenhoven & Kilpinen NITROGEN 13.4.2002 4-52
4.14.1 Low temperature processes for NH3 and HCN removal from fuel gas
At low temperatures (n 300 ºC) NH3 and HCN can be removed from a gasstream by a gas/liquid absorption process. In general this is accomplishedsimultaneously with removal of H2S and CO2. Three major routes werestudied by Boon (1995) for removal of NH3 and/or HCN:1. NH3 and HCN are both very well soluble in water, making it a good
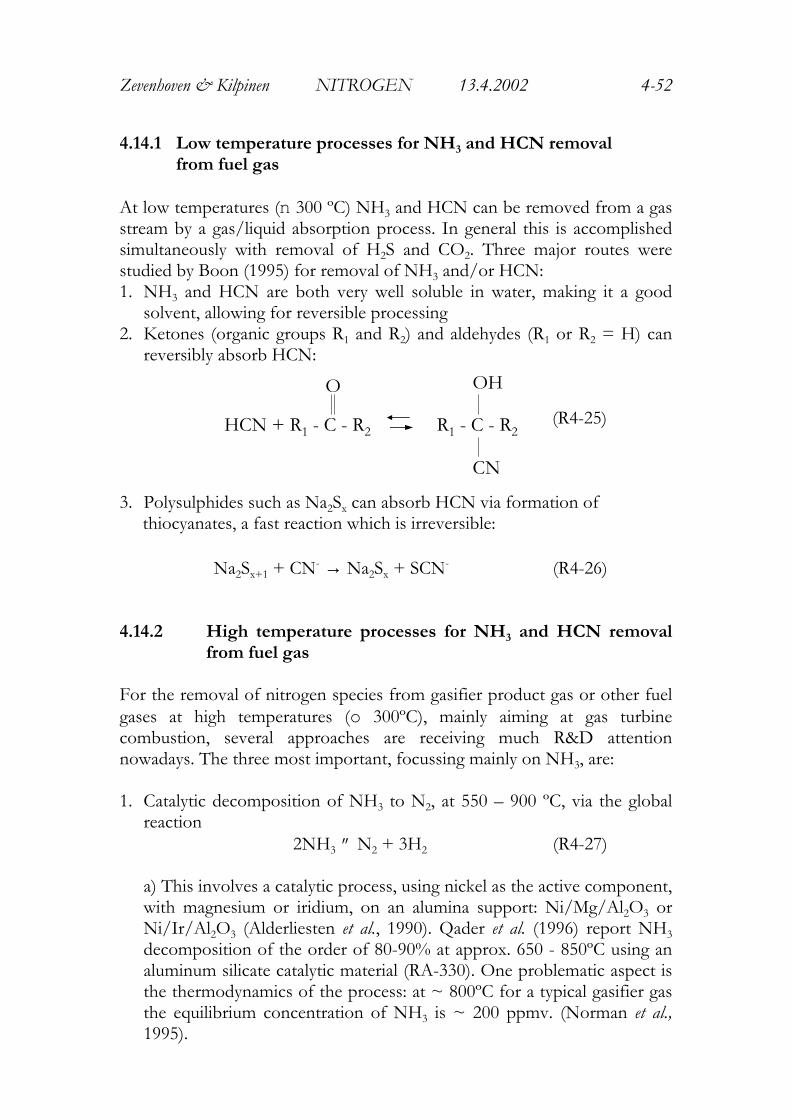
solvent, allowing for reversible processing2. Ketones (organic groups R1 and R2) and aldehydes (R1 or R2 = H) can
reversibly absorb HCN:
(R4-25)
3. Polysulphides such as Na2Sx can absorb HCN via formation of thiocyanates, a fast reaction which is irreversible:
Na2Sx+1 + CN- → Na2Sx + SCN- (R4-26)
4.14.2 High temperature processes for NH3 and HCN removalfrom fuel gas
For the removal of nitrogen species from gasifier product gas or other fuelgases at high temperatures (o 300ºC), mainly aiming at gas turbinecombustion, several approaches are receiving much R&D attentionnowadays. The three most important, focussing mainly on NH3, are:
1. Catalytic decomposition of NH3 to N2, at 550 – 900 ºC, via the globalreaction
2NH3 º N2 + 3H2 (R4-27)
a) This involves a catalytic process, using nickel as the active component,with magnesium or iridium, on an alumina support: Ni/Mg/Al2O3 orNi/Ir/Al2O3 (Alderliesten et al., 1990). Qader et al. (1996) report NH3
decomposition of the order of 80-90% at approx. 650 - 850ºC using analuminum silicate catalytic material (RA-330). One problematic aspect isthe thermodynamics of the process: at ~ 800ºC for a typical gasifier gasthe equilibrium concentration of NH3 is ~ 200 ppmv. (Norman et al.,1995).
HCN + R1 - C - R2 R1 - C - R2
O OH
CN
Zevenhoven & Kilpinen NITROGEN 13.4.2002 4-53
Some other decomposition studies consider the use of the zinc titanatecatalyst for H2S removal (+ Chapter 3) as a basis for catalytic NH3
decomposition (Jothimurugesan and Gangwal, 1996), or methanolinjection (Qader et al., 1996).
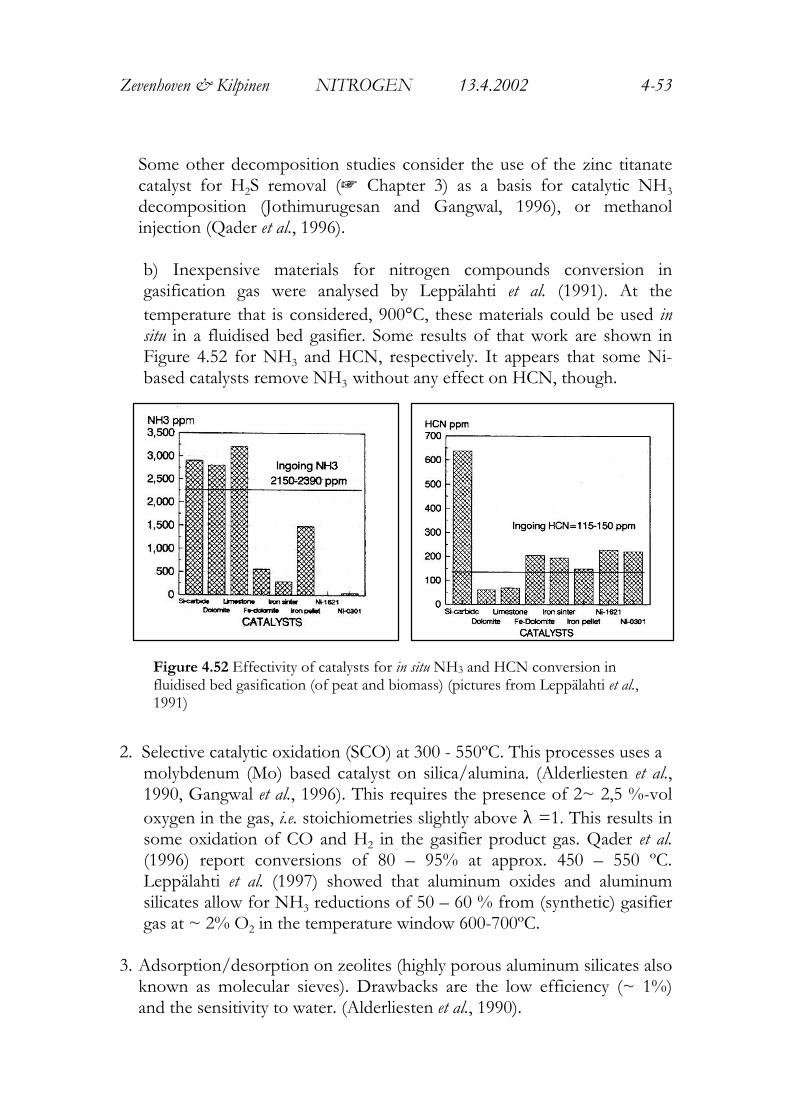
b) Inexpensive materials for nitrogen compounds conversion ingasification gas were analysed by Leppälahti et al. (1991). At thetemperature that is considered, 900°C, these materials could be used insitu in a fluidised bed gasifier. Some results of that work are shown inFigure 4.52 for NH3 and HCN, respectively. It appears that some Ni-based catalysts remove NH3 without any effect on HCN, though.
2. Selective catalytic oxidation (SCO) at 300 - 550ºC. This processes uses amolybdenum (Mo) based catalyst on silica/alumina. (Alderliesten et al.,1990, Gangwal et al., 1996). This requires the presence of 2~ 2,5 %-voloxygen in the gas, i.e. stoichiometries slightly above λ =1. This results insome oxidation of CO and H2 in the gasifier product gas. Qader et al.(1996) report conversions of 80 – 95% at approx. 450 – 550 ºC.Leppälahti et al. (1997) showed that aluminum oxides and aluminumsilicates allow for NH3 reductions of 50 – 60 % from (synthetic) gasifiergas at ~ 2% O2 in the temperature window 600-700ºC.
3. Adsorption/desorption on zeolites (highly porous aluminum silicates alsoknown as molecular sieves). Drawbacks are the low efficiency (~ 1%)and the sensitivity to water. (Alderliesten et al., 1990).
Figure 4.52 Effectivity of catalysts for in situ NH3 and HCN conversion influidised bed gasification (of peat and biomass) (pictures from Leppälahti et al.,1991)
Zevenhoven & Kilpinen NITROGEN 13.4.2002 4-54
4.15 Nitrogen oxides formation and reduction in gas turbines
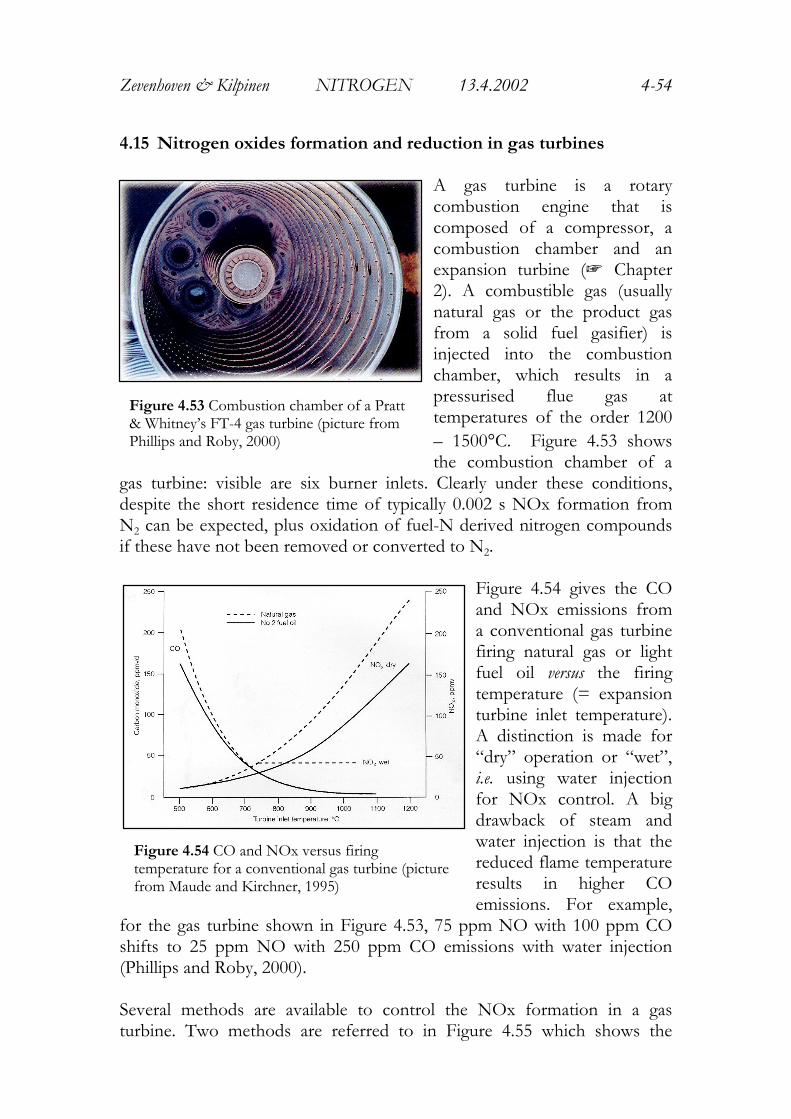
A gas turbine is a rotarycombustion engine that iscomposed of a compressor, acombustion chamber and anexpansion turbine (+ Chapter2). A combustible gas (usuallynatural gas or the product gasfrom a solid fuel gasifier) isinjected into the combustionchamber, which results in apressurised flue gas attemperatures of the order 1200– 1500°C. Figure 4.53 showsthe combustion chamber of a
gas turbine: visible are six burner inlets. Clearly under these conditions,despite the short residence time of typically 0.002 s NOx formation fromN2 can be expected, plus oxidation of fuel-N derived nitrogen compoundsif these have not been removed or converted to N2.
Figure 4.54 gives the COand NOx emissions froma conventional gas turbinefiring natural gas or lightfuel oil versus the firingtemperature (= expansionturbine inlet temperature).A distinction is made for“dry” operation or “wet”,i.e. using water injectionfor NOx control. A bigdrawback of steam andwater injection is that thereduced flame temperatureresults in higher COemissions. For example,
for the gas turbine shown in Figure 4.53, 75 ppm NO with 100 ppm COshifts to 25 ppm NO with 250 ppm CO emissions with water injection(Phillips and Roby, 2000).
Several methods are available to control the NOx formation in a gasturbine. Two methods are referred to in Figure 4.55 which shows the
Figure 4.53 Combustion chamber of a Pratt& Whitney’s FT-4 gas turbine (picture fromPhillips and Roby, 2000)
Figure 4.54 CO and NOx versus firingtemperature for a conventional gas turbine (picturefrom Maude and Kirchner, 1995)
Zevenhoven & Kilpinen NITROGEN 13.4.2002 4-55
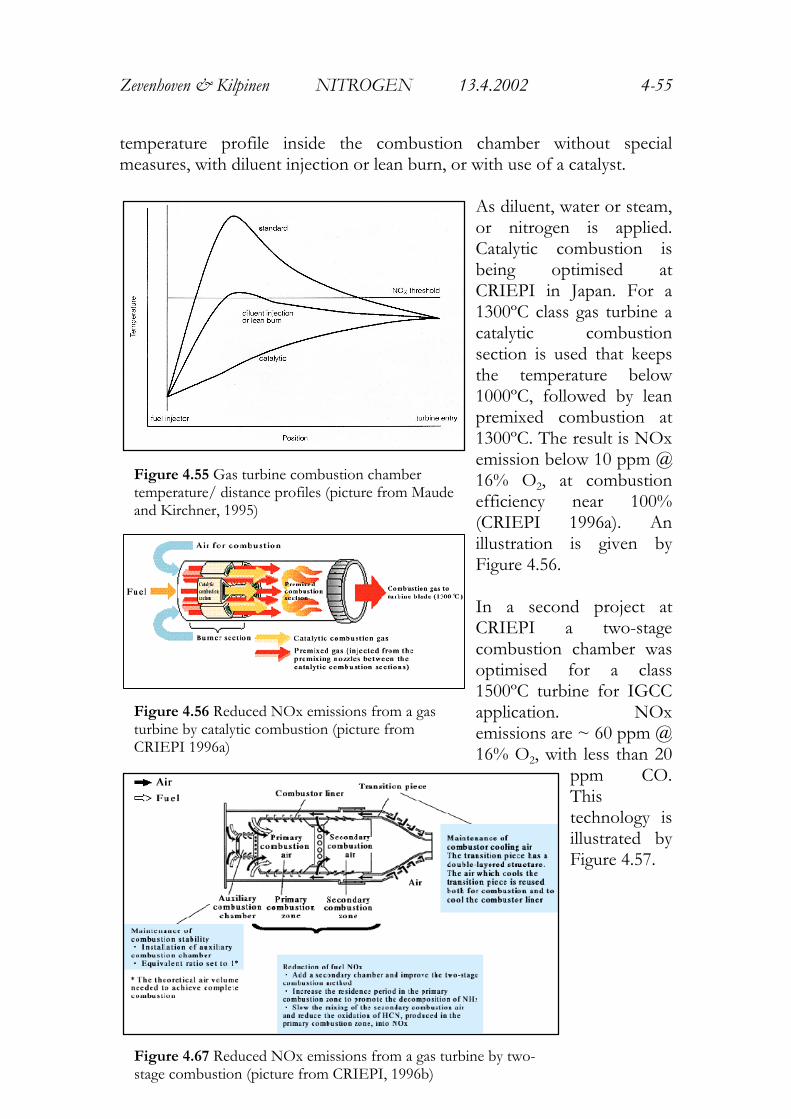
temperature profile inside the combustion chamber without specialmeasures, with diluent injection or lean burn, or with use of a catalyst.
As diluent, water or steam,or nitrogen is applied.Catalytic combustion isbeing optimised atCRIEPI in Japan. For a1300ºC class gas turbine acatalytic combustionsection is used that keepsthe temperature below1000ºC, followed by leanpremixed combustion at1300ºC. The result is NOxemission below 10 ppm @16% O2, at combustionefficiency near 100%(CRIEPI 1996a). Anillustration is given byFigure 4.56.
In a second project atCRIEPI a two-stagecombustion chamber wasoptimised for a class1500ºC turbine for IGCCapplication. NOxemissions are ~ 60 ppm @16% O2, with less than 20
ppm CO.Thistechnology isillustrated byFigure 4.57.
Figure 4.55 Gas turbine combustion chambertemperature/ distance profiles (picture from Maudeand Kirchner, 1995)
Figure 4.56 Reduced NOx emissions from a gasturbine by catalytic combustion (picture fromCRIEPI 1996a)
Figure 4.67 Reduced NOx emissions from a gas turbine by two-stage combustion (picture from CRIEPI, 1996b)
Zevenhoven & Kilpinen NITROGEN 13.4.2002 4-56
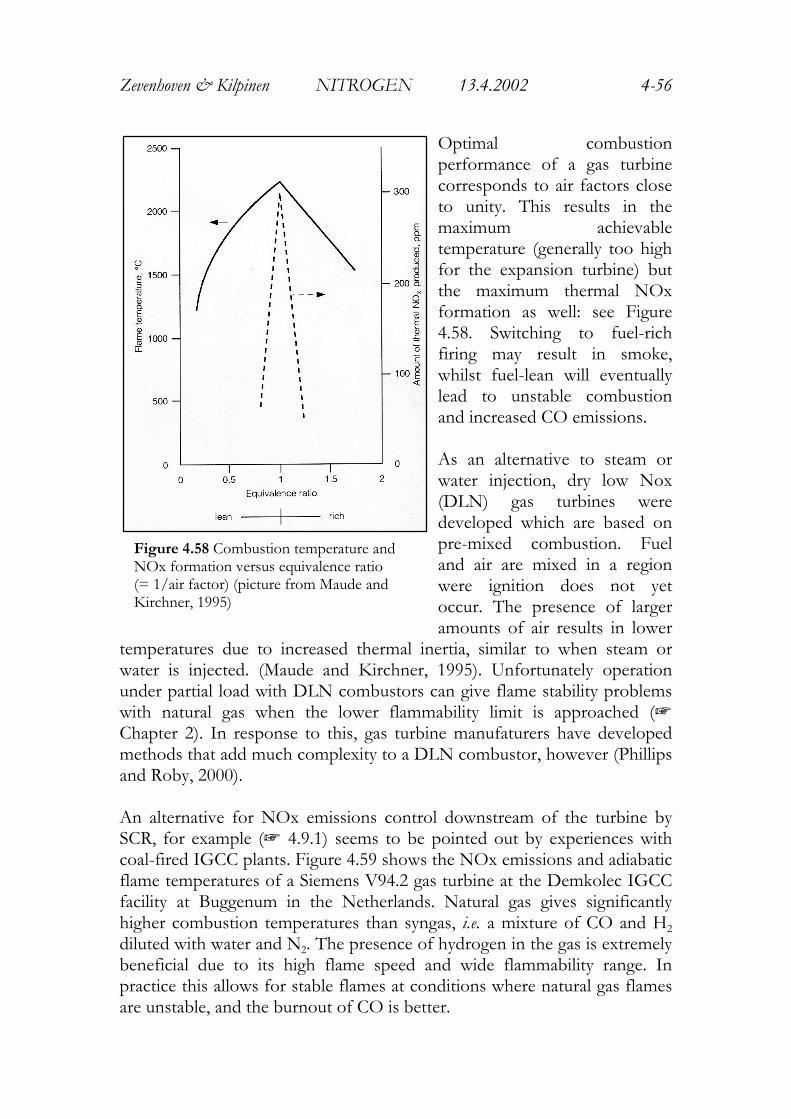
Optimal combustionperformance of a gas turbinecorresponds to air factors closeto unity. This results in themaximum achievabletemperature (generally too highfor the expansion turbine) butthe maximum thermal NOxformation as well: see Figure4.58. Switching to fuel-richfiring may result in smoke,whilst fuel-lean will eventuallylead to unstable combustionand increased CO emissions.
As an alternative to steam orwater injection, dry low Nox(DLN) gas turbines weredeveloped which are based onpre-mixed combustion. Fueland air are mixed in a regionwere ignition does not yetoccur. The presence of largeramounts of air results in lower
temperatures due to increased thermal inertia, similar to when steam orwater is injected. (Maude and Kirchner, 1995). Unfortunately operationunder partial load with DLN combustors can give flame stability problemswith natural gas when the lower flammability limit is approached (+Chapter 2). In response to this, gas turbine manufaturers have developedmethods that add much complexity to a DLN combustor, however (Phillipsand Roby, 2000).
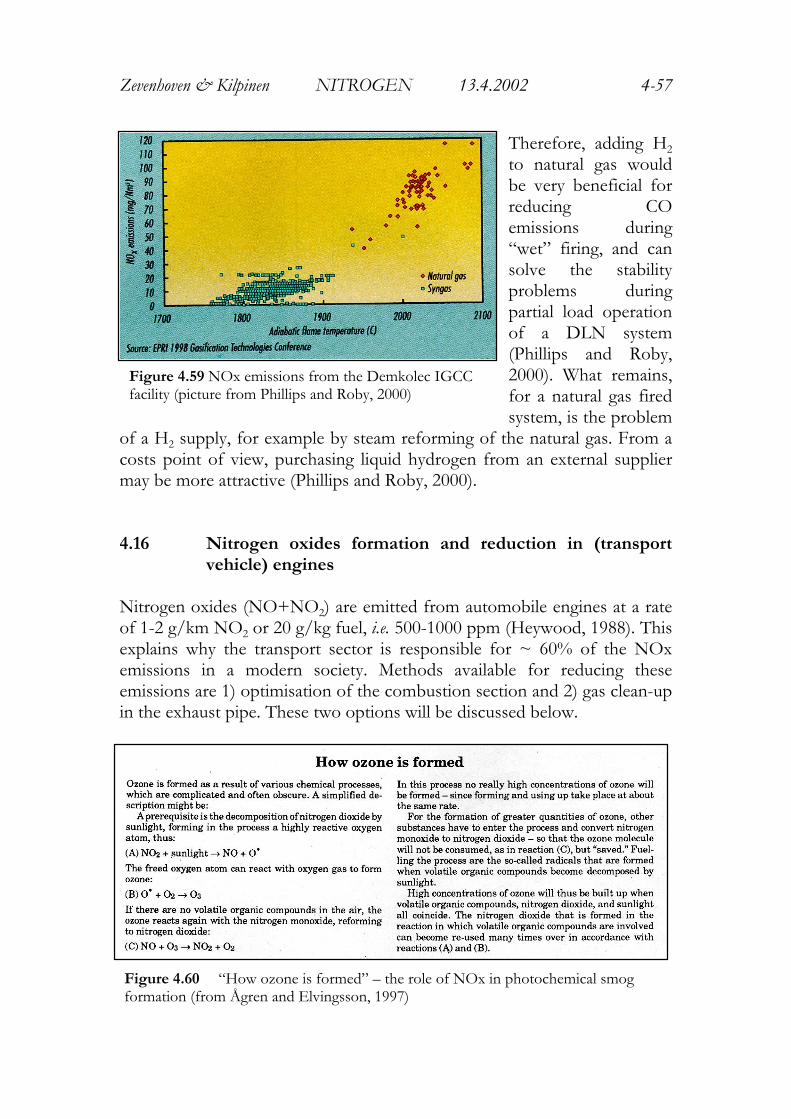
An alternative for NOx emissions control downstream of the turbine bySCR, for example (+ 4.9.1) seems to be pointed out by experiences withcoal-fired IGCC plants. Figure 4.59 shows the NOx emissions and adiabaticflame temperatures of a Siemens V94.2 gas turbine at the Demkolec IGCCfacility at Buggenum in the Netherlands. Natural gas gives significantlyhigher combustion temperatures than syngas, i.e. a mixture of CO and H2
diluted with water and N2. The presence of hydrogen in the gas is extremelybeneficial due to its high flame speed and wide flammability range. Inpractice this allows for stable flames at conditions where natural gas flamesare unstable, and the burnout of CO is better.
Figure 4.58 Combustion temperature andNOx formation versus equivalence ratio(= 1/air factor) (picture from Maude andKirchner, 1995)
Zevenhoven & Kilpinen NITROGEN 13.4.2002 4-57
Therefore, adding H2
to natural gas wouldbe very beneficial forreducing COemissions during“wet” firing, and cansolve the stabilityproblems duringpartial load operationof a DLN system(Phillips and Roby,2000). What remains,for a natural gas firedsystem, is the problem
of a H2 supply, for example by steam reforming of the natural gas. From acosts point of view, purchasing liquid hydrogen from an external suppliermay be more attractive (Phillips and Roby, 2000).
4.16 Nitrogen oxides formation and reduction in (transportvehicle) engines
Nitrogen oxides (NO+NO2) are emitted from automobile engines at a rateof 1-2 g/km NO2 or 20 g/kg fuel, i.e. 500-1000 ppm (Heywood, 1988). Thisexplains why the transport sector is responsible for ~ 60% of the NOxemissions in a modern society. Methods available for reducing theseemissions are 1) optimisation of the combustion section and 2) gas clean-upin the exhaust pipe. These two options will be discussed below.
Figure 4.59 NOx emissions from the Demkolec IGCCfacility (picture from Phillips and Roby, 2000)
Figure 4.60 “How ozone is formed” – the role of NOx in photochemical smogformation (from Ågren and Elvingsson, 1997)
Zevenhoven & Kilpinen NITROGEN 13.4.2002 4-58
A direct effect of these NOx emissions is the formation of photochemicalsmog, apart from the toxicity effects of mainly NO2. The role of NOx insmog formation with groundlevel ozone is explained in Figure 4.60.
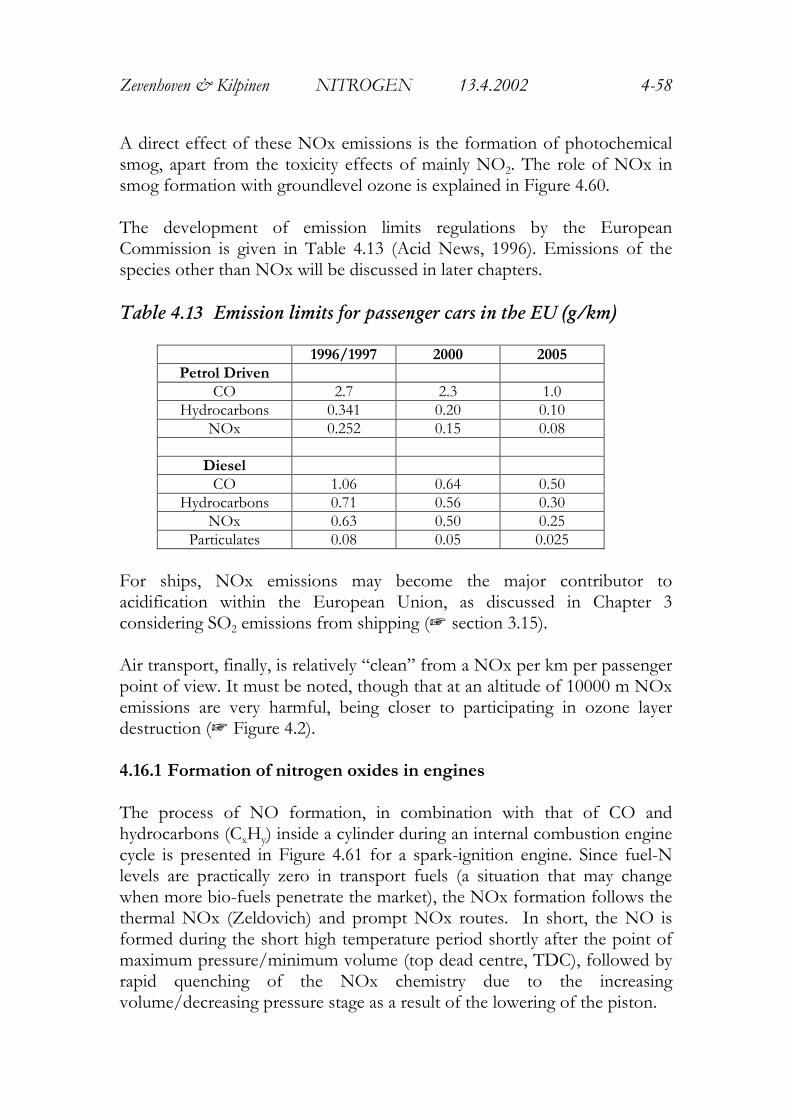
The development of emission limits regulations by the EuropeanCommission is given in Table 4.13 (Acid News, 1996). Emissions of thespecies other than NOx will be discussed in later chapters.
Table 4.13 Emission limits for passenger cars in the EU (g/km)
1996/1997 2000 2005Petrol Driven
CO 2.7 2.3 1.0Hydrocarbons 0.341 0.20 0.10
NOx 0.252 0.15 0.08
DieselCO 1.06 0.64 0.50
Hydrocarbons 0.71 0.56 0.30NOx 0.63 0.50 0.25
Particulates 0.08 0.05 0.025
For ships, NOx emissions may become the major contributor toacidification within the European Union, as discussed in Chapter 3considering SO2 emissions from shipping (+ section 3.15).
Air transport, finally, is relatively “clean” from a NOx per km per passengerpoint of view. It must be noted, though that at an altitude of 10000 m NOxemissions are very harmful, being closer to participating in ozone layerdestruction (+ Figure 4.2).
4.16.1 Formation of nitrogen oxides in engines
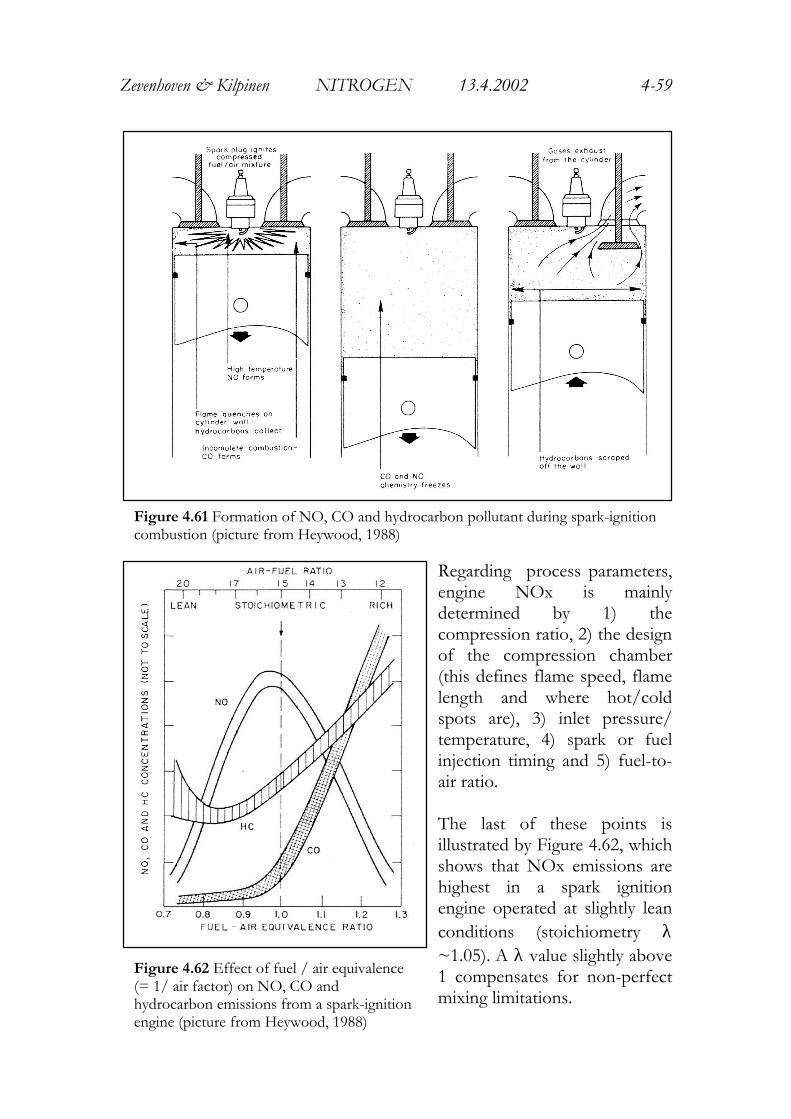
The process of NO formation, in combination with that of CO andhydrocarbons (CxHy) inside a cylinder during an internal combustion enginecycle is presented in Figure 4.61 for a spark-ignition engine. Since fuel-Nlevels are practically zero in transport fuels (a situation that may changewhen more bio-fuels penetrate the market), the NOx formation follows thethermal NOx (Zeldovich) and prompt NOx routes. In short, the NO isformed during the short high temperature period shortly after the point ofmaximum pressure/minimum volume (top dead centre, TDC), followed byrapid quenching of the NOx chemistry due to the increasingvolume/decreasing pressure stage as a result of the lowering of the piston.
Zevenhoven & Kilpinen NITROGEN 13.4.2002 4-59
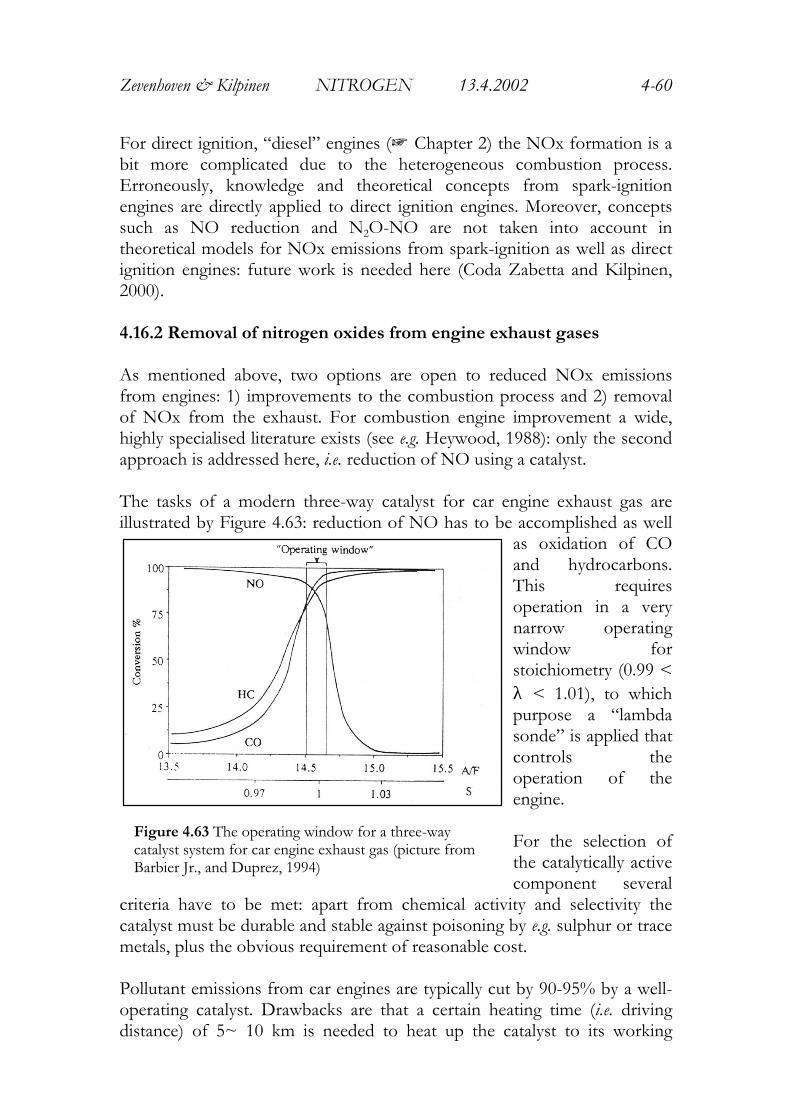
Regarding process parameters,engine NOx is mainlydetermined by 1) thecompression ratio, 2) the designof the compression chamber(this defines flame speed, flamelength and where hot/coldspots are), 3) inlet pressure/temperature, 4) spark or fuelinjection timing and 5) fuel-to-air ratio.
The last of these points isillustrated by Figure 4.62, whichshows that NOx emissions arehighest in a spark ignitionengine operated at slightly leanconditions (stoichiometry λ~1.05). A λ value slightly above1 compensates for non-perfectmixing limitations.
Figure 4.61 Formation of NO, CO and hydrocarbon pollutant during spark-ignitioncombustion (picture from Heywood, 1988)
Figure 4.62 Effect of fuel / air equivalence(= 1/ air factor) on NO, CO andhydrocarbon emissions from a spark-ignitionengine (picture from Heywood, 1988)
Zevenhoven & Kilpinen NITROGEN 13.4.2002 4-60
For direct ignition, “diesel” engines (+ Chapter 2) the NOx formation is abit more complicated due to the heterogeneous combustion process.Erroneously, knowledge and theoretical concepts from spark-ignitionengines are directly applied to direct ignition engines. Moreover, conceptssuch as NO reduction and N2O-NO are not taken into account intheoretical models for NOx emissions from spark-ignition as well as directignition engines: future work is needed here (Coda Zabetta and Kilpinen,2000).
4.16.2 Removal of nitrogen oxides from engine exhaust gases
As mentioned above, two options are open to reduced NOx emissionsfrom engines: 1) improvements to the combustion process and 2) removalof NOx from the exhaust. For combustion engine improvement a wide,highly specialised literature exists (see e.g. Heywood, 1988): only the secondapproach is addressed here, i.e. reduction of NO using a catalyst.
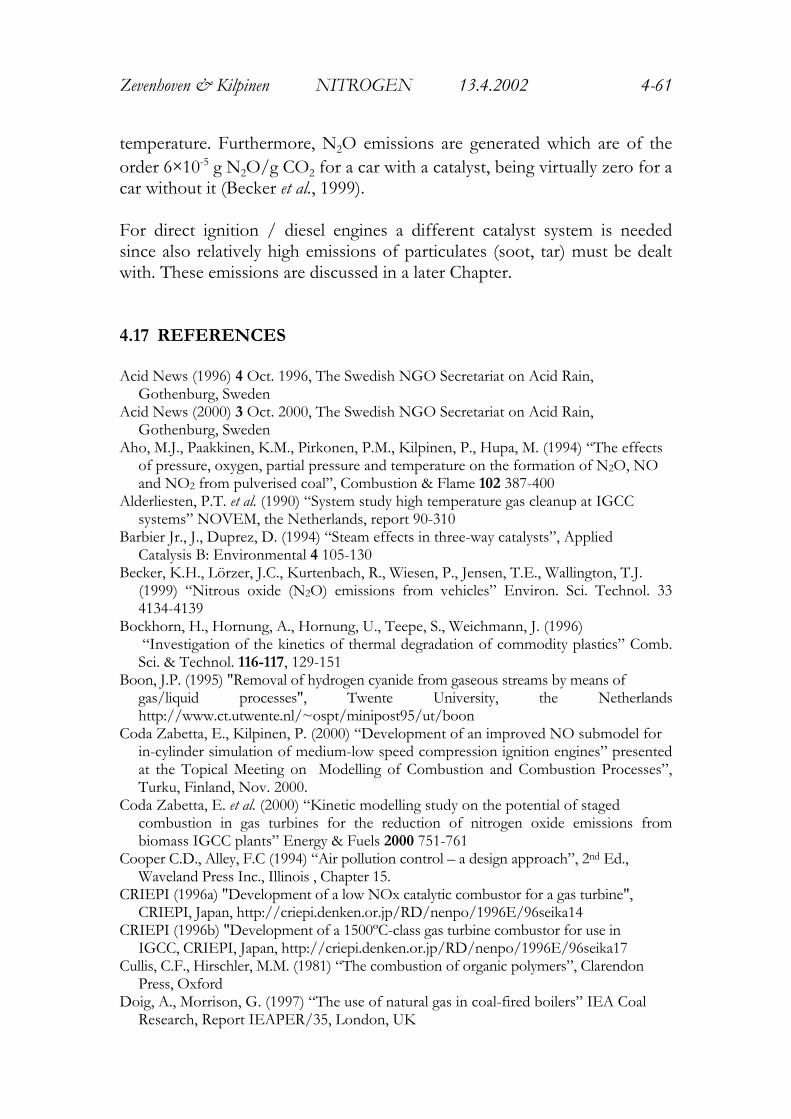
The tasks of a modern three-way catalyst for car engine exhaust gas areillustrated by Figure 4.63: reduction of NO has to be accomplished as well
as oxidation of COand hydrocarbons.This requiresoperation in a verynarrow operatingwindow forstoichiometry (0.99 <λ < 1.01), to whichpurpose a “lambdasonde” is applied thatcontrols theoperation of theengine.
For the selection ofthe catalytically activecomponent several
criteria have to be met: apart from chemical activity and selectivity thecatalyst must be durable and stable against poisoning by e.g. sulphur or tracemetals, plus the obvious requirement of reasonable cost.
Pollutant emissions from car engines are typically cut by 90-95% by a well-operating catalyst. Drawbacks are that a certain heating time (i.e. drivingdistance) of 5~ 10 km is needed to heat up the catalyst to its working
Figure 4.63 The operating window for a three-waycatalyst system for car engine exhaust gas (picture fromBarbier Jr., and Duprez, 1994)
Zevenhoven & Kilpinen NITROGEN 13.4.2002 4-61
temperature. Furthermore, N2O emissions are generated which are of theorder 6×10⁻⁵ g N2O/g CO2 for a car with a catalyst, being virtually zero for acar without it (Becker et al., 1999).
For direct ignition / diesel engines a different catalyst system is neededsince also relatively high emissions of particulates (soot, tar) must be dealtwith. These emissions are discussed in a later Chapter.
4.17 REFERENCES
Acid News (1996) 4 Oct. 1996, The Swedish NGO Secretariat on Acid Rain,Gothenburg, Sweden
Acid News (2000) 3 Oct. 2000, The Swedish NGO Secretariat on Acid Rain, Gothenburg, SwedenAho, M.J., Paakkinen, K.M., Pirkonen, P.M., Kilpinen, P., Hupa, M. (1994) “The effects
of pressure, oxygen, partial pressure and temperature on the formation of N2O, NOand NO2 from pulverised coal”, Combustion & Flame 102 387-400
Alderliesten, P.T. et al. (1990) “System study high temperature gas cleanup at IGCC systems” NOVEM, the Netherlands, report 90-310Barbier Jr., J., Duprez, D. (1994) “Steam effects in three-way catalysts”, Applied Catalysis B: Environmental 4 105-130Becker, K.H., Lörzer, J.C., Kurtenbach, R., Wiesen, P., Jensen, T.E., Wallington, T.J.
(1999) “Nitrous oxide (N2O) emissions from vehicles” Environ. Sci. Technol. 334134-4139
Bockhorn, H., Hornung, A., Hornung, U., Teepe, S., Weichmann, J. (1996)“Investigation of the kinetics of thermal degradation of commodity plastics” Comb.Sci. & Technol. 116-117, 129-151
Boon, J.P. (1995) "Removal of hydrogen cyanide from gaseous streams by means ofgas/liquid processes", Twente University, the Netherlandshttp://www.ct.utwente.nl/~ospt/minipost95/ut/boon
Coda Zabetta, E., Kilpinen, P. (2000) “Development of an improved NO submodel forin-cylinder simulation of medium-low speed compression ignition engines” presentedat the Topical Meeting on Modelling of Combustion and Combustion Processes”,Turku, Finland, Nov. 2000.
Coda Zabetta, E. et al. (2000) “Kinetic modelling study on the potential of stagedcombustion in gas turbines for the reduction of nitrogen oxide emissions frombiomass IGCC plants” Energy & Fuels 2000 751-761
Cooper C.D., Alley, F.C (1994) “Air pollution control – a design approach”, 2nd Ed., Waveland Press Inc., Illinois , Chapter 15.CRIEPI (1996a) "Development of a low NOx catalytic combustor for a gas turbine", CRIEPI, Japan, http://criepi.denken.or.jp/RD/nenpo/1996E/96seika14CRIEPI (1996b) "Development of a 1500ºC-class gas turbine combustor for use in IGCC, CRIEPI, Japan, http://criepi.denken.or.jp/RD/nenpo/1996E/96seika17Cullis, C.F., Hirschler, M.M. (1981) “The combustion of organic polymers”, Clarendon Press, OxfordDoig, A., Morrison, G. (1997) “The use of natural gas in coal-fired boilers” IEA Coal Research, Report IEAPER/35, London, UK
Zevenhoven & Kilpinen NITROGEN 13.4.2002 4-62
Flagan, R.C, Seinfeld, J.H. (1988) "Fundamentals of air pollution control engineering", Prentice-Hill, New Jersey Chapter 8.5Gangwal, S.K. et al. (1996) “Catalytic ammonia decomposition for coal-derived fuel gas” in:
Proc. of the Advance Coal-Fired Power Systems ’96 review meeting, Morgantown, June1996.
Glarborg, P. (1993) “NOx chemistry in pulse combustion”, keynote lecture, Workshop on Pulsating Combustion and its Applications, Lund, Sweden, August 1993.Grace, J.R., Avidan, A.A., Knowlton, T.M. (Eds.) (1997) “Circulating fluidised beds”, Chapman & Hall, LondonHeywood, J.B. (1988) “Internal combustion engine fundamentals” McGraw-Hill, New YorkHiltunen, M., Kilpinen, P., Hupa, M., Lee, Y.Y. (1991) “N2O emissions from CFB boilers: experimental results and chemical interpretation” Proc. of the 11th Int. Conf. on FBC,
E.J. Anthony, (Ed.)., ASME, New York, p. 687-694Hämäläinen, J.P., Aho, M.J., Tummavuori, J.L. (1994) "Formation of nitrogen oxides from fuel-N through HCN and NH3 : a model-compound study" FUEL 73(12) 1894-1898Johnsson. J.E. (1993) "Formation and reduction of nitrogen oxides in fluidized-bed combustion", FUEL, 73(9) 1398-1415Jothimurugesan, K, Gangwal, S.K. “Advances in ammonia removal from hot coal gas” in:
Proc. of the Advance Coal-Fired Power Systems ’96 review meeting, Morgantown, June1996.
Kilpinen, P. (1990) “Kinetic modelling of gas phase nitrogen chemistry in combustion” lic.tech. thesis / report 90-13, Åbo Akademi University, Combustion Chemistry ResearchGroup, Turku, Finland
Kilpinen, P. (1995) “Typen oksidien muodostuminen ja hajoaminen”, Chapter 9 in: “Poltto ja palaminen”, R. Raiko et al. (Eds.), IFRF, Gummerus, Jyväskylä, FinlandKilpinen, P., Hupa, M. (1991) “Homogeneous N2O chemistry at fluidised bed combustion: a kinetic modelling study” Combustion and Flame 85 94-104Kilpinen, P., Aho., M., Seetula, J., Hupa, M (1994) “Gas phase chemistry of NOx and N2O
at pressurised combustion between temperatures 700 and 1000 ºC” Proc. of the 6th Int.Workshop on Nitrous oxide emissions”, Turku, Finland June 1994, p. 333-344
Kilpinen, P., Norström, T., Mueller, C., Kallio, S., Hupa, M. (1999) “Homogeneous NO and N2O chemistry in FBC” Proc. of the 38th IEA FBC meeting, Savannah (GA) May1999
Kilpinen, P. (2000) course material “Chemistry of Combustion Processes – Part 1”, May 2000, Åbo Akademi University, Combustion Chemistry Research Group, Turku, Finlandvan der Lans, R.P. (1997) “Influence of process parameters on coal combustion performance” PhD thesis Technical Univ. of Denmark, LyngbyLeckner, B., Karlsson, M., Dam-Johansen, K., Weinell, C.E., Kilpinen, P., Hupa, M. (1991)
“Influence of additives on selective noncatalytic reduction of NO with NH3 incirculating fluidised bed combustors” Ind. & Eng. Chem. Res. 30 2396-2404
Leckner, B. (1992) “Emissioner vid förbränning av biobränslen i fluidiserad bädd”, ABBs Energidag, 21.10.1992Leppälahti, J., Koljonen, T., Hupa, M., Kilpinen, P. (1997) “Selective catalytic oxidation of
NH3 in gasification gas. 2. Oxidation on aluminum oxides and aluminum silicates”Energy & Fuels, 11(1) 39-45
Leppälahti, J., Koljonen, T. (1995) “Nitrogen evolution from coal, peat and wood during gasification: literatyre review” Fuel Proc. Technol. 43 1-45Leppälahti, J., Simell, P., Kurkela, E. (1991) “Catalytic conversion of nitrogen compounds in gasification gas” Fuel Proc. Technol. 29 43-56
Zevenhoven & Kilpinen NITROGEN 13.4.2002 4-63
Lyngfelt, A., Åmand, L.-E., Leckner, B. (1998) “Reversed air staging – a method forreduction of N2O emissions from fluidized bec combustion of coal” Fuel 77(9/10)953-959
Lyngfelt, A., Åmand, L.-E., Leckner, B. (1995) “Obtaining low N2O, NO and SO2
emissions from circulating fluidized bed boilers by reversing the air stagingconditions” Energy & Fuels 9, 386-387
Maude, C.W., Kirchner, A.T. (1995) “Gas turbine developments”, Report IEACR/84, IEA Coal Research, LondonMcConville, A. (1997) “Emission standards handbook 1996: air pollutant standards for coal
-fired plant” Report IEACR/96, IEA Coal Research, LondonMiller, J.A., Bowman, C.T. (1989) “Mechanism and modelling of nitrogen chemistry in combustion” Prog. Energy Combust. Sci. 15 287-338Mitchell, S. (1998) “NOx in pulverised coal combustion”, Report CCC/05, IEA Coal Research, LondonMPS(2000) Modern Power Systems, 20(12) Dec. 2000 p. 11Nakata, T., Ninomiya, T., Sato, M. (1990) “Development of a gas turbine combustor
fired on low BTU gases. Experimental evaluation of an advanced type combustor”Report EW90009, Yokosuka Research Laboratory
Nelson, P.F., Buckley, A.N., Kelly, M.D. (1992) “Functional forms of nitrogen in coals andthe release of nitrogen as NOx precursors (HCN and NH3) Proc. of the CombustionInstitute, The Combustion Institute, Pittsburgh (PA) 24 1259-1267
Norman, J.S., Pourkashanian, M., Williams, A. (1995) “Ammonia and its control in clean coal technology systems” Proc. of the 12th Annual Pittsburgh Coal Conf,. S.-H-. Shiang(Ed.), Pitssburgh (PA) 193-198
OECD/IEA & ETSU (1993) “Clean coal technology – options for the future” Paris, FranceQader, S.A., Qader, Q.A., Muzio, L.J. (1996) “Decomposition of ammonia in IGCC fuel
gas streams” in: Proc. of the Advance Coal-Fired Power Systems ’96 review meeting,Morgantown, June 1996.
Pels, J.R. (1995) “Nitrous oxide in coal combustion”, PhD thesis, Delft Univ. of Technol., the NetherlandsPhillips, J.N, Roby, R.J. (2000) “Hydrogen enriched natural gas offers economic NOx reduction alternative” Power Engineering, 104(5) / May 2000 36-40.Rozendaal, M. (1999) “Impact of coal quality on NOx emissions for power plants”, PhD thesis, Delft Univ. of Technol., the NetherlandsSarofim, A.F., Goel, S.K., Morihara, A. (1994) "Fluidized bed combustion and control issues", Proc. Int. Clean Coal Symp. on PFBC, Kitakyushu, Japan, July 1994, p. 12-17de Soete, G.G. (1988) “The nitrous oxide problem” Helsinki Univ. of Technol.., Dept. of Energy Engineering, Seminar 21.10.1988, report 28Soud, H. Fukasawa, K. (1996) “Developments in NOx abatement sand control”, Report IEACR/89, IEA Coal Research, LondonTakeshita, M. (1994) “Environmental performance of coal-fired FBC”, Report IEACR/75, IEA Coal Research, LondonTakeshita, M. (1995) “Air pollution control costs for coal-fired power stations”, Perspectives # 17, IEA Coal Research, LondonUS (1997) “Six greenhouse gases”, Fact sheet US Delegation to the 3rd Conf. of the
Parties, United Nations Committee on Climate Change, Kyoto, Japan, Dec. 5, 1997(http://www.state.gov/www/global/oes/fs_sixgas_cop.html)
US DOE (1996) “Reducing emissions of nitrogen oxides via low-NOx burner techniques” Clean Coal Technology, Topical Report 5 (Sept. 1996)
Zevenhoven & Kilpinen NITROGEN 13.4.2002 4-64
US DOE (1997) “Control of nitrogen oxide emissions: selective catalytic reduction (SCR)” Clean Coal Technology, Topical Report 9 (July 1997)US DOE (1999) “Technologies for the combined control of sulphur dioxide and
nitrogen oxides emissions from coal-fired boilers” Clean Coal Technology, TopicalReport 13 (May 1999)
US DOE (2000) “Clean coal technology demonstration program” Program Update September 1999, US DOE, Washington (DC) (April 2000).Werther, J., Ogada, T. (1999) “Sewage sludge combustion” Progr. Energy Comb. Sci. 25 55-116Wójtowicz, M.A., Pels, J.R., Moulijn, J.A. (1993) "Combustion of coal as a source on N2O emission", Fuel Proc. Technol. 34 1-71Zevenhoven, R., Axelsen, E.P., Kilpinen, P., Hupa, M. (1999) “Nitrogen oxides from
nitrogen-containing waste fuels at FBC conditions – # 1” Proc. 39th IEA FBCmeeting, Madrid, Spain, Nov. 1999
Zevenhoven, R., Axelsen, E.P., Elomaa, M., Liukkonen, V.-P., Kilpinen, P., Hupa, M.(2000) “Nitrogen oxides from nitrogen-containing waste fuels at FBC conditions – #2” Proc. 40th IEA FBC meeting, Turku, Finland, May 2000
Zevenhoven, R., Hupa, M. (1998) “The reduction of NO on chars from coal, peat and wood, with and without CO”, FUEL 77(11) 1169-1176 Åbo Akademi University (2001) http://www.abo.fi/fak/ktf/cmc/research/r_schemes.htmlÅgren, C., Elvingson, P. (1997) "Still with us - the acidification of the environment is still going on", The Swedish NGO Sectretariat on Acid Rain, Gothenburg, SwedenÅmand, L.E., Andersson, S. (1989) “Emissions of nitrous oxides (N2O) from fluidised bed
boilers” Proc. of the 10th Int. Conf. on FBC, A.M. Manaker (Ed.) ASME, New York,49-56
Åmand, L.-E., Leckner, B., Andersson, S. (1991) “Formation of N2O in circulating fluidized bed boilers”, Energy & Fuels 5 815-823Åmand, L.-E., Leckner, B. (1992) “Influence of air supply on the emissions of NO and
N2O from a circulating fluidized bed” Proc. of the Combustion Institute/ TheCombustion Institute, Pittsburgh (PA) 24 1407-1414
Åmand, L.-E., Leckner, B. (1994) “Homogeneous and heterogeneous reactions forformation and destruction of N2O – Results from the 12 MW CFB boiler atChalmers”,Proc. of the 6th Int. Workshop on Nitrous oxide emissions”, Turku,Finland June 1994, pp. 95-113