Embed Size (px)
Citation preview
TREATMENT OF NITROGEN OXIDES BY CHLORELLA VULGARIS
ALGAE IN PHOTOBIOREACTORS
A Thesis
presented to
the Faculty of California Polytechnic State University,
San Luis Obispo
In Partial Fulfillment
of the Requirements for the Degree
Master of Science in
Civil and Environmental Engineering
by
Steven Shihady
August 2014

ii
© 2014
Steven Shihady
ALL RIGHTS RESERVED
iii
COMMITTEE MEMBERSHIP
TITLE: Treatment of Nitrogen Oxides by Chlorella Vulgaris Algae
in Photobioreactors
AUTHOR: Steven Shihady
DATE SUBMITTED: August 2014
COMMITTEE CHAIR: Dr. Yarrow Nelson
Professor of Civil and Environmental Engineering
COMMITTEE MEMBER: Dr. Brian Hampson
Professor of Food Science and Nutrition
COMMITTEE MEMBER: Dr. Tryg Lundquist
Associate Professor of Civil and Environmental Engineering
COMMITTEE MEMBER: Dr. Tracy Thatcher
Associate Professor of Civil and Environmental Engineering
iv
ABSTRACT
Treatment of Nitrogen Oxides by Chlorella Vulgaris Algae in Photobioreactors
Steven Shihady
The effectiveness of algae to treat NO2 and NO in simulated flue gas was tested
using Chlorella vulgaris in photobioreactors (PBRs) using NOx concentrations between
30 ppm to 780 ppm. NOx dissolved and reacted in water to form NO3- and NO2
- in the
PBR growth medium, providing a nitrogen source that the algae readily assimilated for
cell synthesis. Three 20-L photobioreactors were inoculated with a pure culture of
C. vulgaris prepared in Bristol growth medium and algae were grown in the PBRs at
25°C and pH of 7.0 in a modified Bristol medium that did not contain nitrogen
compounds. The C. vulgaris grew substantially using NO3-/NO2
- as its nitrogen source
for cell synthesis. The NO3- and NO2
- were formed through the dissolution and
oxidation/reduction of NOx from the simulated flue gas. Algal growth by assimilation of
NO3- and/or NO2
- allowed for continual dissolution of NOx, resulting in NOx removal
rates from the gas phase of up to 97%, with residual nitrogen of up to 7 mg-N/L in
solution. Algae grew from an initial cell density of 3.1 x 10⁵ cells/L to cell densities of
up to 1.85 x 10⁷ cells/mL and dry weights of up to 243 mg/L. Cell nitrogen content
varied from 4-8%. PBR to treatment of gaseous NOx was analyzed in terms of mass
transfer rates, chemical kinetics, and biological growth.
v
ACKNOWLEDGMENTS
To Dr. Yarrow Nelson:
Thank you for your incredible knowledge, dedication, patience, mentorship, and
encouragement during my research, experimentation, and writing. I cannot begin to
express my gratitude for your endless support during this process.
To Dr. Brian Hampson:
Thank you for all of your support and vast knowledge on everything algae. Your
mentorship provided me with opportunities beyond this research and for that I am ever
grateful.
To Dr. Tryg Lundquist and Dr. Tracy Thatcher:
Thank you also for your support and wisdom. Success would not have been
possible without your contributions.
To Dr. Doug Charlton:
Thank you for believing in and supporting the team every step of the way and for
providing me with the opportunity to work on this research.
To Christina Brox, Jason Anthony, and James Taplin:
Thank you for all of your long hours in the lab and your encouragement
through all of the experimentation. It was a privilege to work with you and I am
incredibly grateful of your help and support.
To my friends and family:
Thank you for your limitless encouragement during this process. I could not have
achieved what I have without your inspiration and backing.
Thank you to Paradigm Biosciences International and the CSU Agriculture Research
Initiative for funding this research.
vi
TABLE OF CONTENTS
LIST OF TABLES ........................................................................................................... viii
LIST OF FIGURES ........................................................................................................... ix
1. INTRODUCTION .......................................................................................................... 1
2. BACKGROUND ............................................................................................................ 5
2.1 NOx Hazards and Government Regulations .............................................................. 5
2.2 NOx Production from Stationary and Mobile Sources .............................................. 6
2.3 Conventional Post-Combustion NOx Treatment Methods ........................................ 7
2.3.1 Selective Catalytic Reduction ............................................................................. 7
2.3.2 Selective Noncatalytic Reduction ....................................................................... 8
2.3.3 Adsorption and Absorption ................................................................................ 8
2.3.4 Nitrification ........................................................................................................ 9
2.3.5 Denitrification ..................................................................................................... 9
2.4 Chemistry and Kinetics of Nitrogen Oxides ........................................................... 10
2.4.1 NO2 ................................................................................................................... 10
2.4.2 NO .................................................................................................................... 13
2.5 Algae Nitrogen Assimilation ................................................................................... 15
2.6 Previous Research on Growing Algae with Flue Gas ............................................. 16
3. METHODS ................................................................................................................... 23
3.1 PBR Design ............................................................................................................. 23
3.2 Growth Medium ...................................................................................................... 24
3.3 Chlorella Culture ..................................................................................................... 25
3.4 PBR Set-up and Operation ...................................................................................... 25
3.4.1 Run 1 - Pure NO2 Feed Source ......................................................................... 25
3.4.2 Run 2 - Pure NO2 Feed Source with Gas Recycle ............................................ 28
3.4.3 Run 3 - Calibration Gas Feed Source ............................................................... 30
3.5 Sampling and Testing Procedures ........................................................................... 34
3.5.1 Gas Sampling .................................................................................................... 34
3.5.2 Algae Cell Counts ............................................................................................. 35
3.5.3 Dry Weight ....................................................................................................... 36
vii
3.5.4 Nitrate/Nitrite.................................................................................................... 36
3.5.5 Organic Nitrogen .............................................................................................. 37
3.6 Laboratory Safety .................................................................................................... 38
4. RESULTS ..................................................................................................................... 39
4.1 NOx Removal Efficiency and Cell Growth ............................................................. 39
4.1.1 Run 1 - Pure NO2 Feed Source ......................................................................... 39
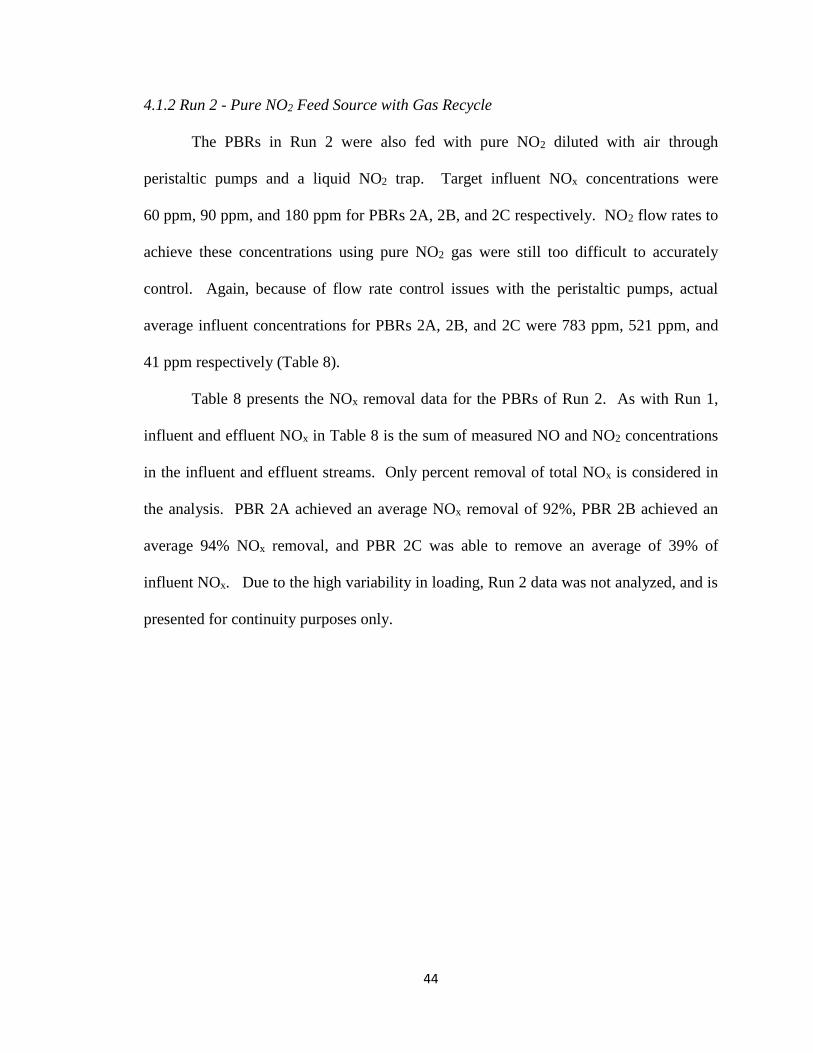
4.1.2 Run 2 - Pure NO2 Feed Source with Gas Recycle ............................................ 44
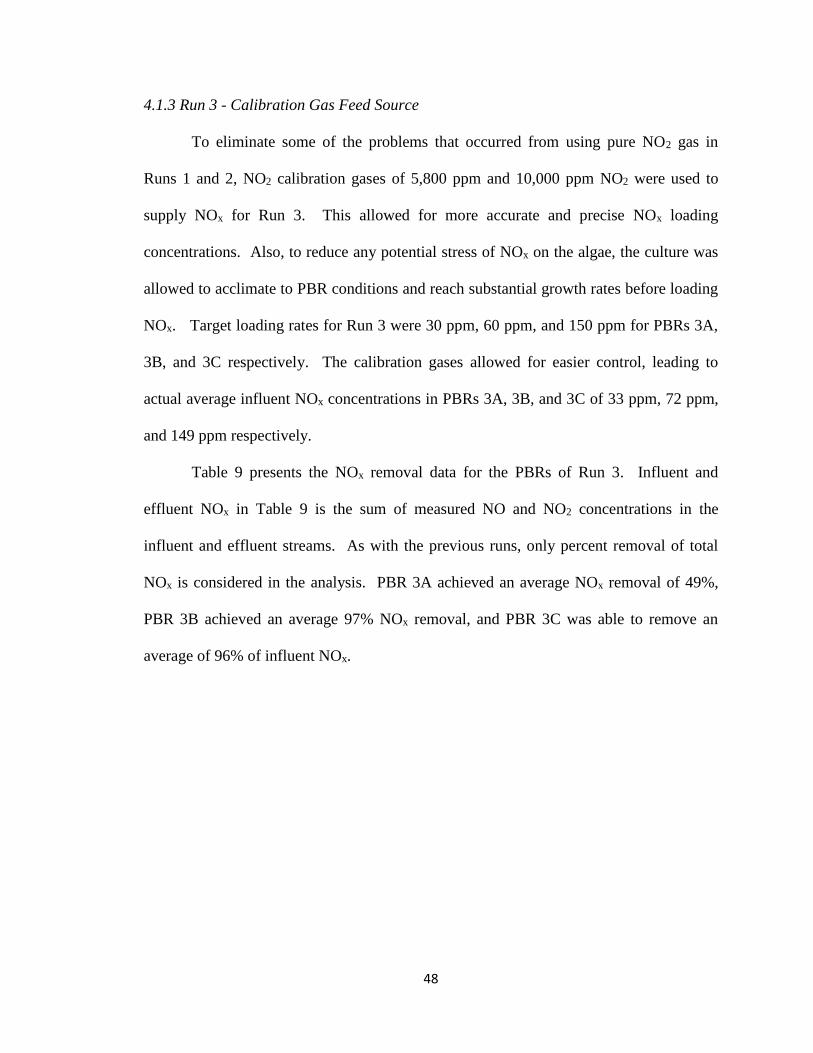
4.1.3 Run 3 - Calibration Gas Feed Source ............................................................... 48
4.2 Nitrate/Nitrite .......................................................................................................... 52
4.3 Organic Nitrogen Content and Mass Balance ......................................................... 54
5. DISCUSSION ............................................................................................................... 56
5.1 NOx Feed System .................................................................................................... 56
5.2 NOx Removal .......................................................................................................... 56
5.3 Cell Growth ............................................................................................................. 57
5.4 Nitrate/Nitrite .......................................................................................................... 60
5.5 Nitrogen Mass Balance ........................................................................................... 61
5.6 Cell Nitrogen Content and Residual Aqueous Nitrogen ......................................... 63
5.7 Removal Mechanisms ............................................................................................. 65
6. CONCLUSIONS........................................................................................................... 68
REFERENCES ................................................................................................................. 72
viii
LIST OF TABLES
Table 1. Modified Bristol growth medium (UTEX) ......................................................... 25
Table 2. Run 1 experimental set points ............................................................................. 27
Table 3. Run 2 experimental set points ............................................................................. 29
Table 4. Run 3 experimental set points ............................................................................. 33
Table 5. Sample and analysis procedure summary ........................................................... 34
Table 6. Influent and effluent NOx concentrations ........................................................... 39
Table 7. NOx removal data for PBRs 1A, 1B, and 1C for Run 1 ..................................... 41
Table 8. NOx removal data for PBRS 2A, 2B, and 2C for Run 2 ..................................... 45
Table 9. NOx removal data for PBRS 3A, 3B, and 3C for Run 3 ..................................... 49
Table 10. Total suspended solids of Run 3 PBRs ............................................................. 52
Table 11. Total organic nitrogen content of algal cultures in Run 3 ................................ 55
Table 12. Run 3 nitrogen mass balance data and results .................................................. 55
Table 13. Comparison of cell growth to nitrogen content and uptake. ............................. 63
ix
LIST OF FIGURES
Figure 1. PBR system for lab experiments ....................................................................... 24
Figure 2. Diagram of lighting behind PBRs ..................................................................... 27
Figure 3. Process flow diagram of Run 1 ......................................................................... 28
Figure 4. Process flow diagram of Run 2 ......................................................................... 30
Figure 5. Process flow diagram of Run 3 ......................................................................... 32
Figure 6. Run 1 growth curves; a) PBR 1A. b) PBR 1B. c) PBR 1C. .............................. 43
Figure 7. Run 2 growth curves; a) PBR 2A. b) PBR 2B. c) PBR 2C. .............................. 47
Figure 8. Run 3 growth curves; a) PBR 3A. b) PBR 3B. c) PBR 3C. .............................. 51
Figure 9. a) Nitrate concentrations in Run 3 over time. b) Nitrite concentrations in
Run 3 over time. ................................................................................................................ 53
Figure 10. Correlation between final dissolved nitrate concentration and N content in
biomass. ............................................................................................................................ 64
1
1. INTRODUCTION
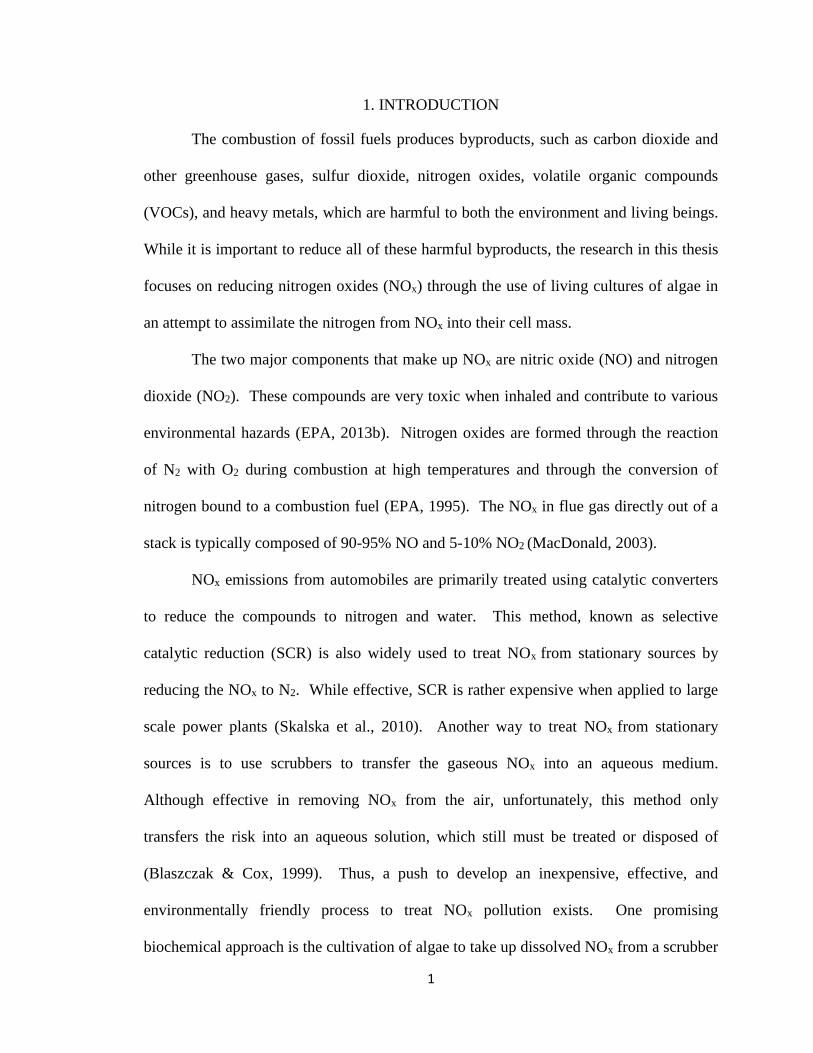
The combustion of fossil fuels produces byproducts, such as carbon dioxide and
other greenhouse gases, sulfur dioxide, nitrogen oxides, volatile organic compounds
(VOCs), and heavy metals, which are harmful to both the environment and living beings.
While it is important to reduce all of these harmful byproducts, the research in this thesis
focuses on reducing nitrogen oxides (NOx) through the use of living cultures of algae in
an attempt to assimilate the nitrogen from NOx into their cell mass.
The two major components that make up NOx are nitric oxide (NO) and nitrogen
dioxide (NO2). These compounds are very toxic when inhaled and contribute to various
environmental hazards (EPA, 2013b). Nitrogen oxides are formed through the reaction
of N2 with O2 during combustion at high temperatures and through the conversion of
nitrogen bound to a combustion fuel (EPA, 1995). The NOx in flue gas directly out of a
stack is typically composed of 90-95% NO and 5-10% NO2 (MacDonald, 2003).
NOx emissions from automobiles are primarily treated using catalytic converters
to reduce the compounds to nitrogen and water. This method, known as selective
catalytic reduction (SCR) is also widely used to treat NOx from stationary sources by
reducing the NOx to N2. While effective, SCR is rather expensive when applied to large
scale power plants (Skalska et al., 2010). Another way to treat NOx from stationary
sources is to use scrubbers to transfer the gaseous NOx into an aqueous medium.
Although effective in removing NOx from the air, unfortunately, this method only
transfers the risk into an aqueous solution, which still must be treated or disposed of
(Blaszczak & Cox, 1999). Thus, a push to develop an inexpensive, effective, and
environmentally friendly process to treat NOx pollution exists. One promising
biochemical approach is the cultivation of algae to take up dissolved NOx from a scrubber
2
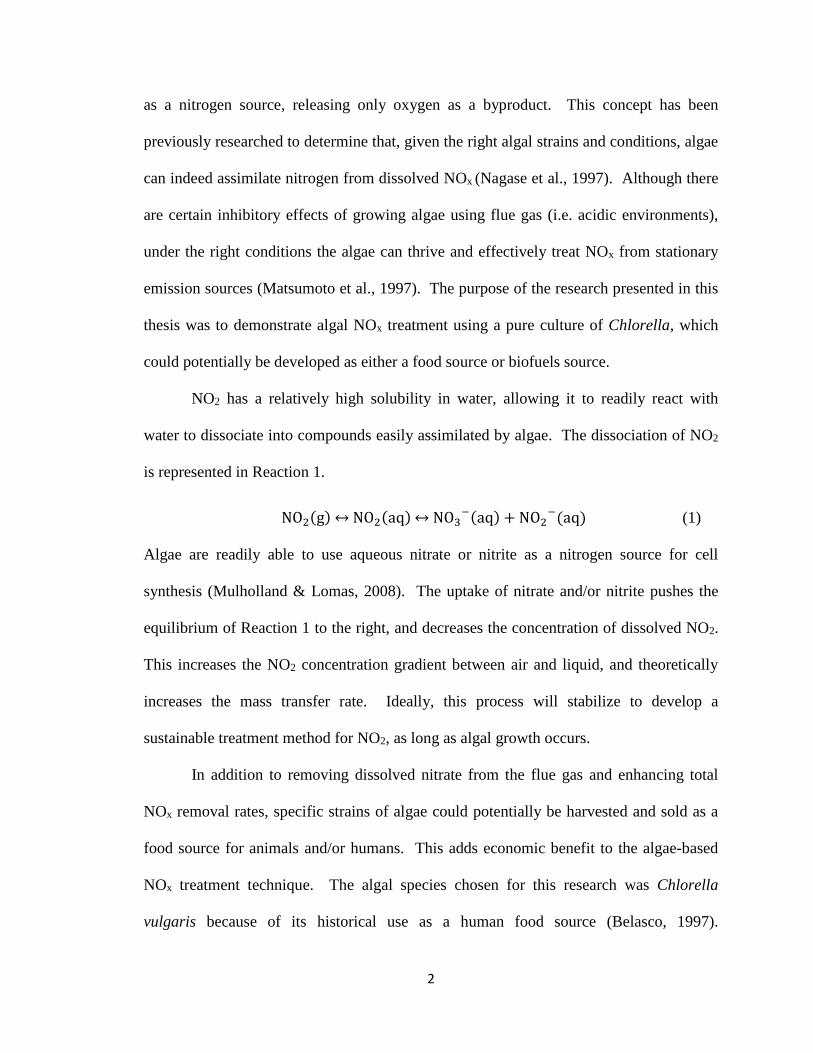
as a nitrogen source, releasing only oxygen as a byproduct. This concept has been
previously researched to determine that, given the right algal strains and conditions, algae
can indeed assimilate nitrogen from dissolved NOx (Nagase et al., 1997). Although there
are certain inhibitory effects of growing algae using flue gas (i.e. acidic environments),
under the right conditions the algae can thrive and effectively treat NOx from stationary
emission sources (Matsumoto et al., 1997). The purpose of the research presented in this
thesis was to demonstrate algal NOx treatment using a pure culture of Chlorella, which
could potentially be developed as either a food source or biofuels source.
NO2 has a relatively high solubility in water, allowing it to readily react with
water to dissociate into compounds easily assimilated by algae. The dissociation of NO2
is represented in Reaction 1.
NO2(g) ↔ NO2(aq)↔ NO3−(aq) + NO2
−(aq) (1)
Algae are readily able to use aqueous nitrate or nitrite as a nitrogen source for cell
synthesis (Mulholland & Lomas, 2008). The uptake of nitrate and/or nitrite pushes the
equilibrium of Reaction 1 to the right, and decreases the concentration of dissolved NO2.
This increases the NO2 concentration gradient between air and liquid, and theoretically
increases the mass transfer rate. Ideally, this process will stabilize to develop a
sustainable treatment method for NO2, as long as algal growth occurs.
In addition to removing dissolved nitrate from the flue gas and enhancing total
NOx removal rates, specific strains of algae could potentially be harvested and sold as a
food source for animals and/or humans. This adds economic benefit to the algae-based
NOx treatment technique. The algal species chosen for this research was Chlorella
vulgaris because of its historical use as a human food source (Belasco, 1997).
3
Chlorella is a spherical, single-celled, green freshwater alga. It has been widely
researched and used as a food since the late 1940's, after fears of population boom and
food shortages occurred after World War II. NASA space programs and health food
companies began funding research into developing algae as a source of sustenance.
Chlorella was chosen because of its potential nutritional value (Belasco, 1997). It
contains a combination of more than 50% protein, 20% fat, 20% carbohydrates, and
includes essential amino acids, minerals, and vitamins as well as potent flavonoids
(Sandoval, 2007). Chlorella is also especially adept at producing chlorophyll, allowing it
to rapidly and efficiently harness energy from sunlight. Chlorella supplements are
becoming increasingly popular in Japan and the United States (Sandoval, 2007).
The current research utilized these concepts to test the effectiveness of treating
NOx from simulated flue gas using Chlorella vulgaris in a photobioreactor (PBR). Three
mechanisms affecting the potential productivity of such a system were examined. First,
mass transfer of NOx from the gas to liquid phases must provide sufficient amounts of
dissolved nitrogen (NO3-/NO2
-) for the algae to assimilate. Second, the dissolved NO2
and NO must react to form dissolved nitrogen compounds available for the algae to
assimilate. The low solubility of NO becomes an important limitation to the system.
Third, biological conditions must be met for the uptake of the nitrate and/or nitrite by the
algae. After examining these mechanisms, potential enhancements can be considered.
For instance, the bioreactor can be designed to optimize mass transfer. Further, because
biological growth is dependent on the health and activity of the algae and their enzymes,
environmental conditions can be optimized for algal growth. This is very important,
because small changes in operating conditions can mean the difference between a lively,
4
active culture and a decaying one. Conditions affecting algal growth include light, water
temperature, pH, and growth medium (Barsanti & Gualtieri, 2006).
Three separate experiments were conducted to determine the optimal growth
conditions and the ability of the algae to effectively remove the NOx from simulated flue
gas with varying NOx loading rates. This simulated flue gas consisted of a mixture of
NO2, NO, and CO2 in air. In each experiment, three different NOx concentrations were
supplied to three separate, but identical, PBRs inoculated with C. vulgaris. The growth
medium in the reactors was depleted of nitrate to prove the algae were able to grow using
dissolved NOx as their sole source of nitrogen. The two most important parameters
determined through each run were NOx removal efficiencies and algal cell growth for
each PBR.
5
2. BACKGROUND
This background section first provides an understanding of the reasons NOx
requires treatment. Then the conventional methods used for treatment are described,
along with reasons for developing an unconventional method. The underlying
mechanisms of how nitrogen oxides react in gas and aqueous phases are then described,
since understanding these reactions is vital to understanding the proposed treatment
method with algae. Finally, a review of previous research and experimentation in using
algae for NOx uptake is given. This background section explores each of these topics as
they pertain to researching and testing the treatment of nitrogen oxides using C. vulgaris
algae.
2.1 NOx Hazards and Government Regulations
NO is a colorless, nonflammable, poisonous, oxidizing gas at room temperature
and can be very toxic if inhaled, even at very low concentrations (Airgas, 2013a). NO2 is
red-brown colored gas above 20°C that is also nonflammable and oxidizing. It has a
pungent, acrid odor and is very toxic and corrosive on skin, eyes, and major organs if
inhaled or ingested (Airgas, 2013b).
The Occupational Safety and Health Administration (OSHA) has set a permissible
exposure limit (PEL) of NO at 25 ppm (Airgas, 2013a). The PEL for NO2 set by OSHA
is 5 ppm (Airgas, 2013b). NO and NO2 may both cause target organ damage and
possibly death if inhaled. NO is severely irritating to eyes and skin while NO2 can result
in severe respiratory tract burns and is severely corrosive to the eyes and skin
(Airgas, 2013a; Airgas, 2013b). The PELs for these two NOx components are an
indication that they can be toxic even at very low concentrations.
6
Together NO and NO2 contribute to the "formation of fine particles...and ground-
level ozone...[which] are associated with thousands of premature deaths and illnesses
each year" (EPA, 2012). Fine particles are formed when NOx reacts with ammonia,
water, and other compounds. These small particles are able to enter deep into the lungs
causing respiratory disease and aggravating existing heart disease. Ground-level ozone is
formed through a series complex reactions involving NOx and volatile organic
compounds (VOCs) under heat and sunlight (Pudasainee et al., 2006). Ozone also has
adverse effects on the respiratory system, particularly in children and elderly individuals
(EPA, 2013b).
The U.S. Environmental Protection Agency (EPA) Clean Air Act (CAA),
implemented in 1971, established primary and secondary national ambient air quality
standards (NAAQS) for NO2 at 52 ppb, averaged annually. In 2010, the EPA established
an additional NAAQS primary standard of 100 ppb averaged over one hour to further
protect public health (EPA, 2013b). In 2005, the EPA also finalized the Clean Air
Interstate Rule (CAIR) to further reduce nitrogen oxide levels. The rule establishes a
cap-and-trade approach to reduce NOx emissions from power plants by 2 million tons in
27 eastern states by 2015 (EPA, 2012).
2.2 NOx Production from Stationary and Mobile Sources
Automobiles are the largest contributor of NOx emissions in the United States,
followed by stationary fuel combustion. In 2012, the transportation sector contributed
56% of total NOx nationwide, while stationary fuel combustion contributed 32%
(NEI, 2012). Because of the mobile and compact nature of automobile combustion
7
engines, NOx reduction technology for this source is greatly limited. Therefore, a focus
can be made to reduce the nitrogen oxides emitted through stationary sources,
particularly power plants. Of the 32% of total NOx emissions produced through
stationary fuel combustion in 2012, nearly half was caused by fuel combustion for
electricity generation (NEI, 2012).
2.3 Conventional Post-Combustion NOx Treatment Methods
2.3.1 Selective Catalytic Reduction
Currently, the most widely used post-combustion treatment of NOx for stationary
sources is selective catalytic reduction (SCR) (Skalska et al., 2010). This method uses
either a noble metal catalyst, metal oxide catalyst, or metal ion exchange zeolite along
with ammonia to reduce NO to N2 based on the following reaction:
4NO + 4NH3 → 4N2 + 6H2 (2)
The main benefit of SCR is that the catalyst allows the reaction to occur at lower
temperatures, between 300-800 K.
Precautions must be taken when using this technology, because of the use of
ammonia. Unreacted NH3 may slip into the exhaust gas and enter the atmosphere as an
air pollutant. Spent catalyst must be replaced or regenerated, resulting in both a capital
expenditure and an expensive maintenance cost. Overall, the process ordinarily removes
approximately 60%-85% of NO and results in concentrations from 1-5 ppm NH3 in the
exhaust stream. To reduce the amount of reduction catalyst required, an oxidation
catalyst may be implemented upstream to convert NO to NO2. Another effective method
is to inject ozone upstream to achieve the same purpose. To avoid ammonia slip, as well
8
as difficulties involved in transporting and storing ammonia, certain hydrocarbons are
also effective reactants for the process (Skalska et al., 2010).
2.3.2 Selective Noncatalytic Reduction
Selective noncatalytic reduction (SNCR) utilizes the same concepts as SCR, but
without the use of a catalyst. This means that the reactions must take place at higher
temperatures. SNCR uses ammonia, urea, or cyanuric acid to reduce NO to N2. This
process is less efficient than SCR, achieving between 30%-70% removal of NO
(Skalska et al., 2010). Because of the lower efficiencies, this method must be coupled
with combustion process modifications or other post-combustion treatment techniques to
meet regulatory requirements. The process may also produce byproducts of N2O and
CO, which are themselves harmful to the environment (Skalska et al., 2010).
2.3.3 Adsorption and Absorption
Both absorption and adsorption can be used to collect gaseous NOx. Dry,
powdered limestone can be sprayed into flue gas through a scrubber to react with both
sulfuric acid and nitric acid formed through the reaction of SOx and NOx with water.
Another approach is to spray a slurry of dry limestone and aqueous ammonia. The
limestone will react preferentially with SOx, while the ammonia will react with NOx,
creating an aqueous solution that can be further treated or disposed of. Dry sorbents can
also be injected in-duct to form ammonium nitrate that can be used to make explosives or
fertilizers. Activated carbon can be used to finish the capture of NOx, and then collected
through existing particulate removal methods (Blaszczak & Cox, 1999).
9
2.3.4 Nitrification
Nitrification is a process in which bacteria oxidize ammonium to nitrate through a
series of intermediate steps. Two types of bacteria are required to complete the process,
bacteria that oxidize ammonium to nitrite, and those that oxidize nitrite to nitrate. Using
nitrifying bacteria to degrade NOx into nitrate has promise as a NOx treatment method,
because NO is a known intermediate in the nitrification steps. Unfortunately, most
nitrifying bacteria would not survive in very high temperatures, so flue gas would need to
be cooled drastically for this method to prove effective. Studies have found that NO
inhibits biomass and biofilm growth, increasing the required residence time of
nitrification systems. Even with an established biofilm, the poor solubility of NO does
not allow for practical residence times when using nitrification to treat NOx
(Jin et al. 2005).
2.3.5 Denitrification
Denitrification is the reduction of nitrate to nitrogen gas. Bacteria are capable of
reducing nitrogen oxides when oxygen is limited or unavailable. As with nitrification,
NO is an intermediate in the denitrification process. Evidence suggests that all, or most,
denitrifying bacteria share a common ability to reduce NO, making the process a
promising method for treating NOx (Jin et al., 2005). Unfortunately, as with nitrification,
the majority of successful research has been conducted in mesophilic conditions. This
again raises the question of whether it is cost effective to cool emitted flue gas to
appropriate temperatures to treat NOx with bacteria (Jin et al. 2005).
10
2.4 Chemistry and Kinetics of Nitrogen Oxides
The basis of the current research depends on the dissolution of gaseous NOx in
water, followed by reactions to form NO3- and NO2
-. Therefore, an important aspect of
this study is the solution chemistry and kinetics of NOx. The solubility of NO2 in water is
213 g/L, while the solubility of NO in water is only 0.032 g/L (more than 6,000 times less
soluble than NO2) (Van Den Hende et al. 2012).
2.4.1 NO2
NO2 exists in equilibrium with N2O4 in both the gaseous and aqueous phases. The
aqueous phase reaction, shown in Reaction 3, has an equilibrium constant of
6.54 x 10⁴ M-1 at 20°C (Schwartz & White, 1981) and a second-order rate constant for the
formation of N2O4 of 4.5 x 10⁸ M-1s-1 at 25°C (Gebicka & Stawowska, 2012).
2NO2 ↔ N2O4 (3)
The formation of N2O4 is the intermediary step in the conversion from dissolved NO2 to
NO3- and NO2
- as shown in Reaction 4.
N2O4 + H2O → NO2− + NO3
− (4)
The first-order rate constant for Reaction 4 is 1 x 10³ s-1 at 25°C (Gebicka &
Stawowska, 2012).
According to Cheung et al. (2000), the high solubility of the N2O4 dimer results in
complications when trying to measure and understand NO2 solubility. This is especially
important at high NO2 (g) concentrations, when N2O4 is present as a significant fraction
of the total NOx concentration. Cheung et al. overcame the problems with previous
studies by using a horizontal bubble train flow reactor with precise control of the gas-
11
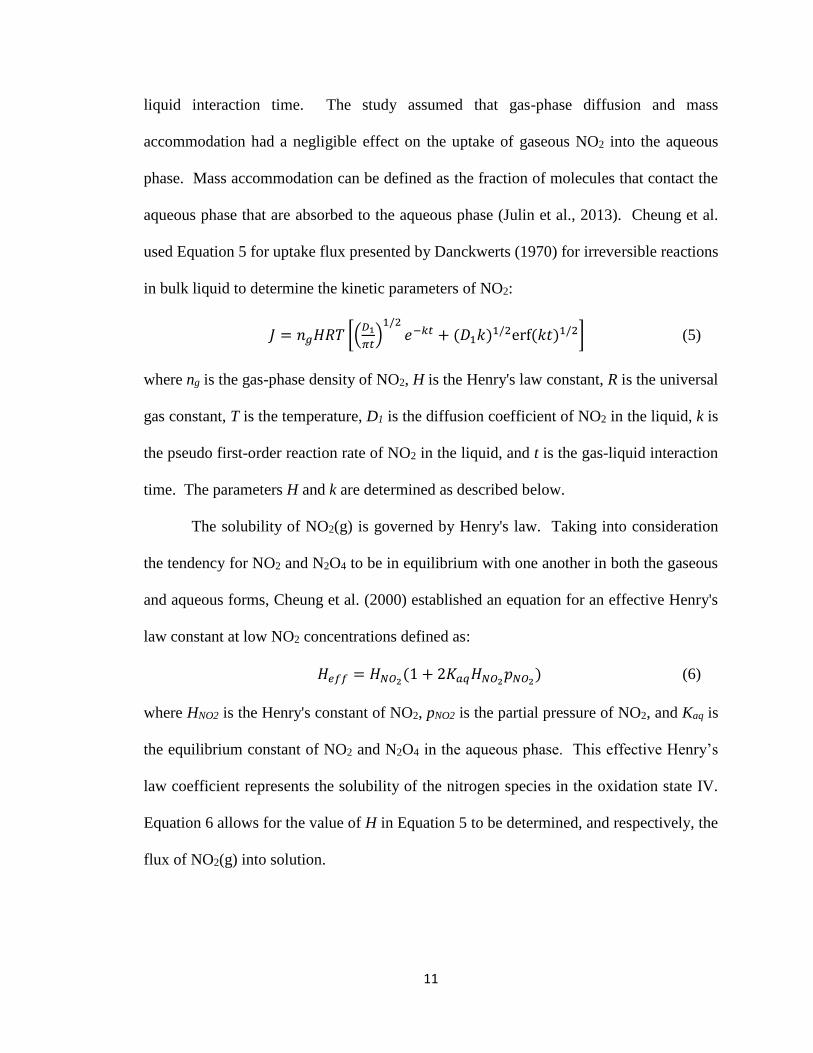
liquid interaction time. The study assumed that gas-phase diffusion and mass
accommodation had a negligible effect on the uptake of gaseous NO2 into the aqueous
phase. Mass accommodation can be defined as the fraction of molecules that contact the
aqueous phase that are absorbed to the aqueous phase (Julin et al., 2013). Cheung et al.
used Equation 5 for uptake flux presented by Danckwerts (1970) for irreversible reactions
in bulk liquid to determine the kinetic parameters of NO2:
𝐽 = 𝑛𝑔𝐻𝑅𝑇 [(𝐷1
𝜋𝑡)1/2
𝑒−𝑘𝑡 + (𝐷1𝑘)1/2erf(𝑘𝑡)1/2] (5)
where ng is the gas-phase density of NO2, H is the Henry's law constant, R is the universal
gas constant, T is the temperature, D1 is the diffusion coefficient of NO2 in the liquid, k is
the pseudo first-order reaction rate of NO2 in the liquid, and t is the gas-liquid interaction
time. The parameters H and k are determined as described below.
The solubility of NO2(g) is governed by Henry's law. Taking into consideration
the tendency for NO2 and N2O4 to be in equilibrium with one another in both the gaseous
and aqueous forms, Cheung et al. (2000) established an equation for an effective Henry's
law constant at low NO2 concentrations defined as:
𝐻𝑒𝑓𝑓 = 𝐻𝑁𝑂2(1 + 2𝐾𝑎𝑞𝐻𝑁𝑂2𝑝𝑁𝑂2) (6)
where HNO2 is the Henry's constant of NO2, pNO2 is the partial pressure of NO2, and Kaq is
the equilibrium constant of NO2 and N2O4 in the aqueous phase. This effective Henry’s
law coefficient represents the solubility of the nitrogen species in the oxidation state IV.
Equation 6 allows for the value of H in Equation 5 to be determined, and respectively, the
flux of NO2(g) into solution.
12
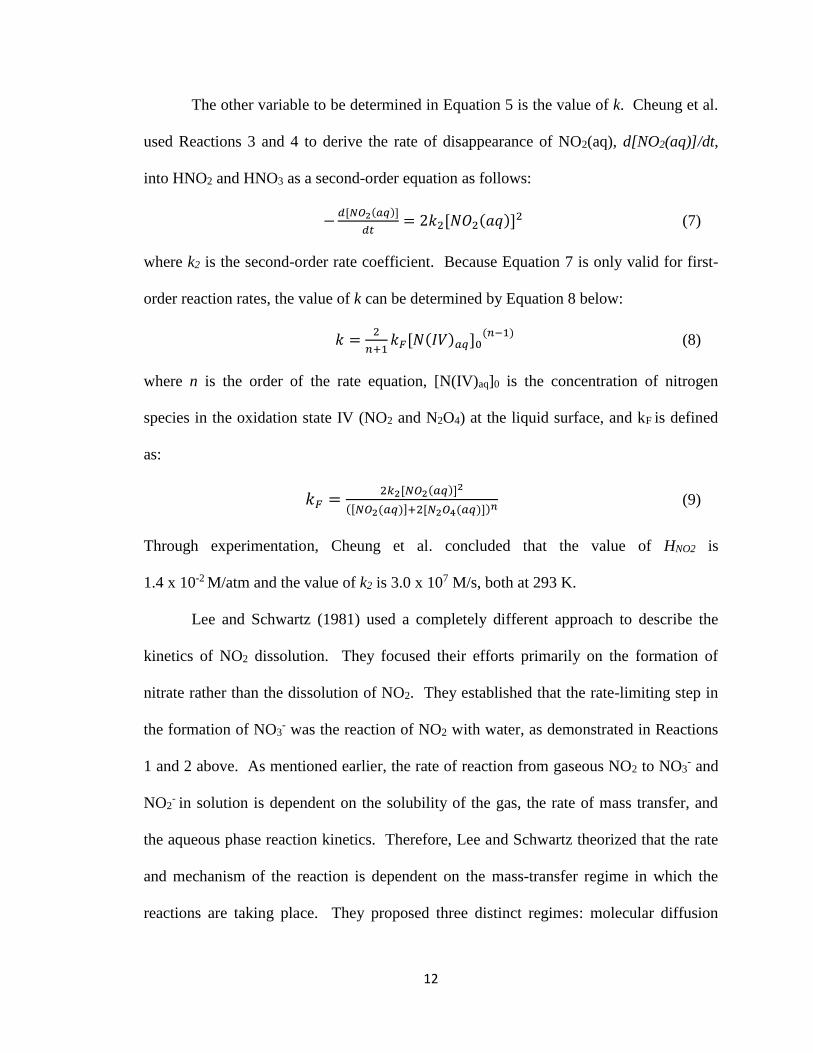
The other variable to be determined in Equation 5 is the value of k. Cheung et al.
used Reactions 3 and 4 to derive the rate of disappearance of NO2(aq), d[NO2(aq)]/dt,
into HNO2 and HNO3 as a second-order equation as follows:
−𝑑[𝑁𝑂2(𝑎𝑞)]
𝑑𝑡= 2𝑘2[𝑁𝑂2(𝑎𝑞)]
2 (7)
where k2 is the second-order rate coefficient. Because Equation 7 is only valid for first-
order reaction rates, the value of k can be determined by Equation 8 below:
𝑘 =2
𝑛+1𝑘𝐹[𝑁(𝐼𝑉)𝑎𝑞]0
(𝑛−1) (8)
where n is the order of the rate equation, [N(IV)aq]0 is the concentration of nitrogen
species in the oxidation state IV (NO2 and N2O4) at the liquid surface, and kF is defined
as:
𝑘𝐹 =2𝑘2[𝑁𝑂2(𝑎𝑞)]
2
([𝑁𝑂2(𝑎𝑞)]+2[𝑁2𝑂4(𝑎𝑞)])𝑛 (9)
Through experimentation, Cheung et al. concluded that the value of HNO2 is
1.4 x 10⁻² M/atm and the value of k2 is 3.0 x 10⁷ M/s, both at 293 K.
Lee and Schwartz (1981) used a completely different approach to describe the
kinetics of NO2 dissolution. They focused their efforts primarily on the formation of
nitrate rather than the dissolution of NO2. They established that the rate-limiting step in
the formation of NO3- was the reaction of NO2 with water, as demonstrated in Reactions
1 and 2 above. As mentioned earlier, the rate of reaction from gaseous NO2 to NO3- and
NO2- in solution is dependent on the solubility of the gas, the rate of mass transfer, and
the aqueous phase reaction kinetics. Therefore, Lee and Schwartz theorized that the rate
and mechanism of the reaction is dependent on the mass-transfer regime in which the
reactions are taking place. They proposed three distinct regimes: molecular diffusion
13
controlled, convective mass-transfer controlled, and phase mixed. The conditions for
each regime were established based on the characteristic times of reaction, mixing, and
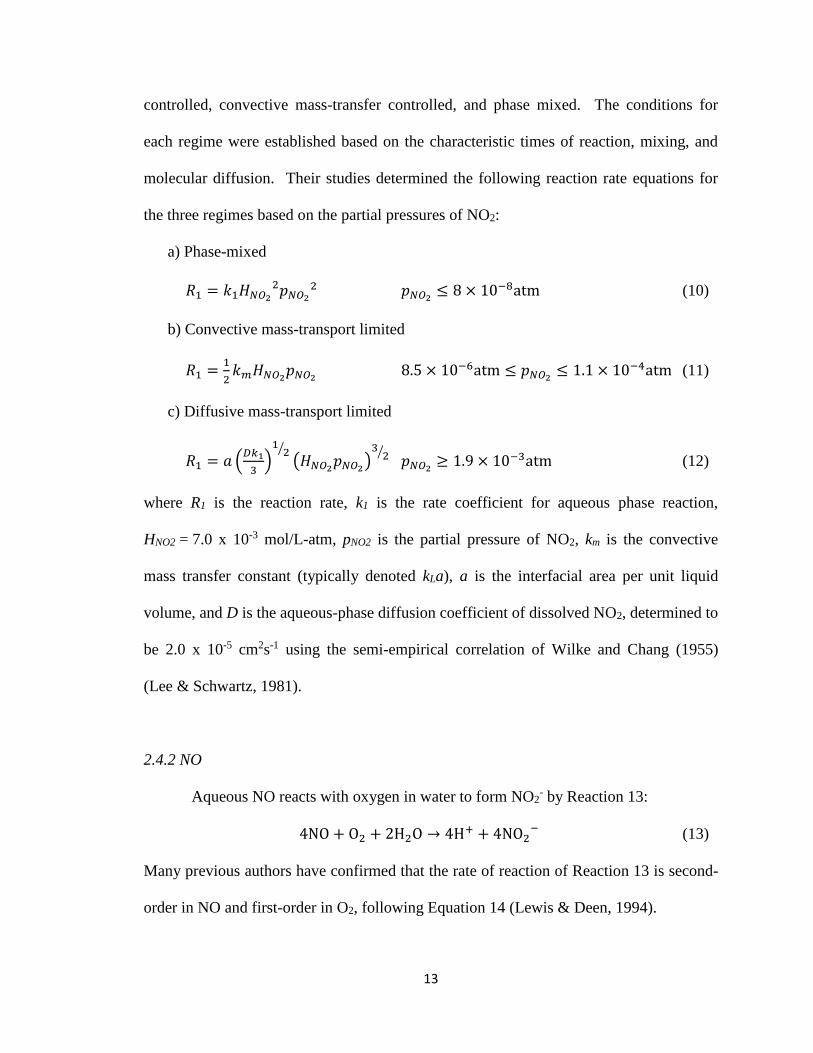
molecular diffusion. Their studies determined the following reaction rate equations for
the three regimes based on the partial pressures of NO2:
a) Phase-mixed
𝑅1 = 𝑘1𝐻𝑁𝑂22𝑝𝑁𝑂2
2 𝑝𝑁𝑂2 ≤ 8 × 10⁻⁸atm (10)
b) Convective mass-transport limited
𝑅1 =1
2𝑘𝑚𝐻𝑁𝑂2𝑝𝑁𝑂2 8.5 × 10⁻⁶atm ≤ 𝑝𝑁𝑂2 ≤ 1.1 × 10⁻⁴atm (11)
c) Diffusive mass-transport limited
𝑅1 = 𝑎 (𝐷𝑘1
3)12⁄
(𝐻𝑁𝑂2𝑝𝑁𝑂2)32⁄ 𝑝𝑁𝑂2 ≥ 1.9 × 10⁻³atm (12)
where R1 is the reaction rate, k1 is the rate coefficient for aqueous phase reaction,
HNO2 = 7.0 x 10⁻³ mol/L-atm, pNO2 is the partial pressure of NO2, km is the convective
mass transfer constant (typically denoted kLa), a is the interfacial area per unit liquid
volume, and D is the aqueous-phase diffusion coefficient of dissolved NO2, determined to
be 2.0 x 10⁻⁵ cm2s-1 using the semi-empirical correlation of Wilke and Chang (1955)
(Lee & Schwartz, 1981).
2.4.2 NO
Aqueous NO reacts with oxygen in water to form NO2- by Reaction 13:
4NO + O2 + 2H2O → 4H+ + 4NO2−
(13)
Many previous authors have confirmed that the rate of reaction of Reaction 13 is second-
order in NO and first-order in O2, following Equation 14 (Lewis & Deen, 1994).
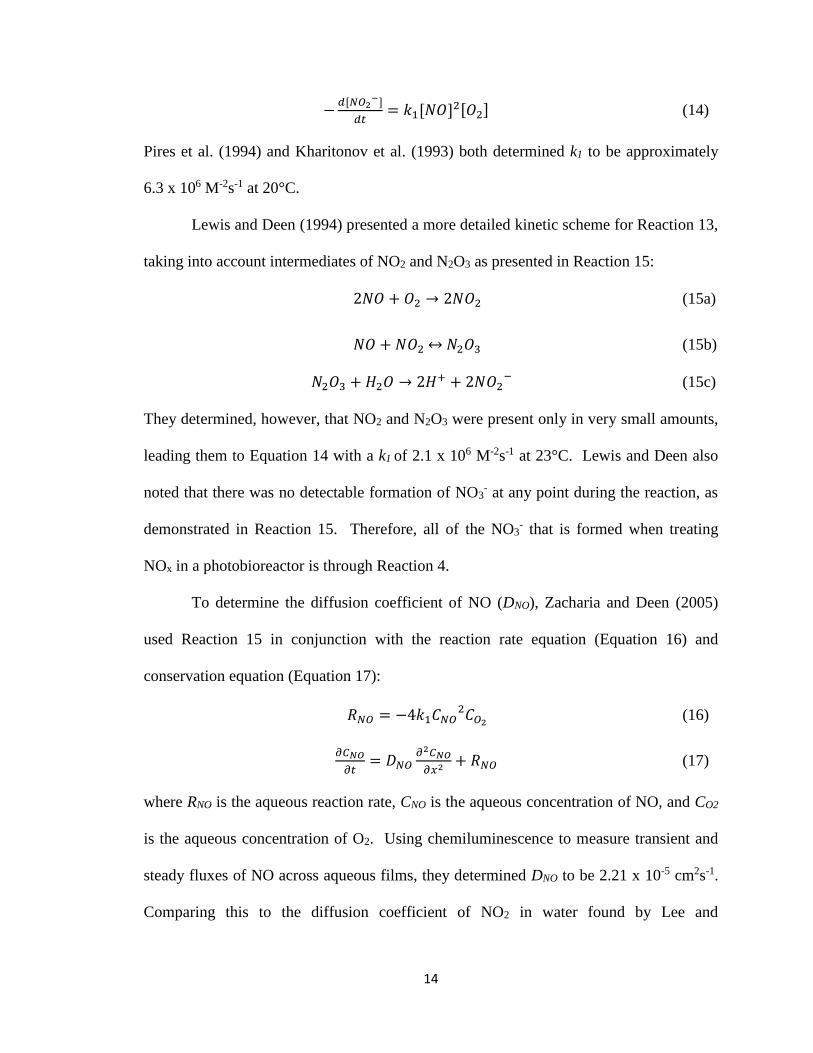
14
−𝑑[𝑁𝑂2
−]
𝑑𝑡= 𝑘1[𝑁𝑂]
2[𝑂2] (14)
Pires et al. (1994) and Kharitonov et al. (1993) both determined k1 to be approximately
6.3 x 10⁶ M-2s-1 at 20°C.
Lewis and Deen (1994) presented a more detailed kinetic scheme for Reaction 13,
taking into account intermediates of NO2 and N2O3 as presented in Reaction 15:
2𝑁𝑂 + 𝑂2 → 2𝑁𝑂2 (15a)
𝑁𝑂 + 𝑁𝑂2↔𝑁2𝑂3 (15b)
𝑁2𝑂3 + 𝐻2𝑂 → 2𝐻+ + 2𝑁𝑂2−
(15c)
They determined, however, that NO2 and N2O3 were present only in very small amounts,
leading them to Equation 14 with a k1 of 2.1 x 10⁶ M-2s-1 at 23°C. Lewis and Deen also
noted that there was no detectable formation of NO3- at any point during the reaction, as
demonstrated in Reaction 15. Therefore, all of the NO3- that is formed when treating
NOx in a photobioreactor is through Reaction 4.
To determine the diffusion coefficient of NO (DNO), Zacharia and Deen (2005)
used Reaction 15 in conjunction with the reaction rate equation (Equation 16) and
conservation equation (Equation 17):
𝑅𝑁𝑂 = −4𝑘1𝐶𝑁𝑂2𝐶𝑂2 (16)
𝜕𝐶𝑁𝑂
𝜕𝑡= 𝐷𝑁𝑂
𝜕2𝐶𝑁𝑂
𝜕𝑥2+ 𝑅𝑁𝑂 (17)
where RNO is the aqueous reaction rate, CNO is the aqueous concentration of NO, and CO2
is the aqueous concentration of O2. Using chemiluminescence to measure transient and
steady fluxes of NO across aqueous films, they determined DNO to be 2.21 x 10⁻⁵ cm2s-1.
Comparing this to the diffusion coefficient of NO2 in water found by Lee and
15
Schwartz (1981) (2.0 x 10⁻⁵ cm2s-1), the diffusion of NO and NO2 in water are nearly
identical.
2.5 Algae Nitrogen Assimilation
Microalgae have the ability to assimilate nitrogen from a multitude of compounds,
including ammonium, nitrate, nitrite, urea, organic compounds, and sometimes amino
acids and purines (Mulholland & Lomas, 2008). Uptake through passive diffusion
through a cell membrane is considered minimal, and therefore it is important to look at
active membrane transport systems to determine how and why certain sources are utilized
preferentially. NH4+ appears to be the most preferred nitrogen source for algae as it is the
most energetically efficient form for the algae to take up (Mulholland & Lomas, 2008).
Assimilation of NO3- and/or NO2
- requires added energy and reductants necessary to
reduce these forms. To use nitrogen, the cells must first take up the dissolved NO3- or
NO2-, reduce it to ammonium, and then assimilate it into amino acids. Therefore, if NH4
+
is present, little additional energy is required as further reduction is not necessary, and it
becomes the preferred source (Mulholland & Lomas, 2008).
When NH4+, NO3
-, and NO2- are all present in a culture medium, the NH4
+ is
thought to have an inhibitory effect on the uptake of NO3- and NO2
-. Algal cells grown
initially on ammonium have no ability to take up NO3- and NO2
- unless completely
deprived of nitrogen first (Syrett, 1988). NO3- transporters are thought to only be induced
under nitrogen starvation or growth on NO3- enriched medium. It appears that NO2
- is
more readily assimilated than NO3- (Mulholland & Lomas, 2008). The rate-limiting step
in NO3- assimilation is thought to be the reduction of NO3
- to NO2-, not the reduction of
16
NO2- to NH4
+. Also, because nitrite reductase is required in the assimilation of NO3-,
organisms which are able to take up NO3- are also able to take up NO2
- (Mulholland &
Lomas, 2008). However, higher concentrations of nitrite may inhibit algal growth
(Syrett, 1962).
When algae are grown under nitrogen-deficient conditions, the products of
photosynthesis change from proteins to carbohydrates and lipids (Syrett, 1962). These
cells also develop a carbohydrate reserve not found in normal algal cells. This results in
a decrease in nitrogen content of the cells from 8-10% to about 2%. The amount of
chlorophyll also decreases, as well as the overall rate of photosynthesis (Syrett, 1962).
The reduction and uptake of nitrate may be stimulated by light for a variety of
reasons (Syrett, 1962). One theory is that light increases permeability of cells to NO3-.
Another is that a photochemically produced reductant or a product of photosynthesis may
be readily available as an electron source for the reduction of NO3- and/or NO2
-. Photo-
phosphorylation may also stimulates NO2- reduction (Syrett, 1962).
2.6 Previous Research on Growing Algae with Flue Gas
The majority of literature on growing algae using flue gas is directed at
determining the algae's ability to grow under high concentrations of CO2 and whether
SOx and/or NOx inhibit algal growth. Little research has been completed specifically on
growing algae using NOx as a nitrogen source. However, the pioneers of growing algae
in simulated flue gas did determine that it would be possible to achieve such a feat. Their
research focused mainly on testing with NO rather than NO2. The details of their
research are described below.
17
To first determine whether it would even be possible to grow algae under the high
CO2 concentrations in a flue gas, Negoro et al. (1991) tested ten strains of algae to
determine which strains were able to survive with CO2 concentrations of up to 15% by
volume. It was found that half of the strains exhibited very poor growth while the other
half grew after extended lag phases and with decreased growth rates. This was attributed
to the drop in pH caused by the high CO2 concentrations. The three species that grew the
best were further tested under various pH conditions. It was found that certain species of
algae grew just as well under slightly acidic conditions (pH of 6.1) as they did in a neutral
pH medium. Taking this to the next step, the three strains were further tested to
determine the effects of NOx and SOx at up to 300 ppm and 400 ppm, respectively. The
drastic drop in pH with 400 ppm SOx, as well as the accumulation of sulfate, completely
inhibited the growth of algae after 20 hours. With 300 ppm NO feed, one strain was
completely inhibited, despite little change in pH, while the other grew after a prolonged
lag phase. However, nitrite was detected in both culture broth and cell-free medium,
suggesting that NO can be converted to nitrite abiotically. This information, coupled
with the fact that an increase in nitrite concentration slowed after the start of growth,
suggests that some nitrogen oxides were assimilated by the cells. While effluent NOx
concentration was not measured to determine removal, because both aqueous nitrite was
detected and algal growth occurred, the overall conclusion was that nitrogen oxides from
flue gas are a feasible nitrogen source for certain algal strains (Negoro et al. 1991).
As a continuation of the above study, the ability of algae to eliminate both CO2
and NO from flue gas was investigated. A model flue gas of 15% CO2 and 100-300 ppm
NO was fed to a culture of marine microalga NOA-113. After the initial pH drop from
18
the 15% CO2, no further drop in pH was observed from the addition of NO. However,
the addition of NO completely suppressed growth when initial cell concentrations were
low (1.0 g ash-free cell dry weight/L). The cells were then cultivated without NO until
halfway through their linear growth phase (approximately 4 days), and no inhibition was
found. This resulted in almost 50% elimination of NO gas, proving the ability of algae to
assimilate nitrogen oxides. The study also showed that the exposure of NO to the cells in
the dark inhibited growth due to the lack of photosynthetic oxygen, which was found to
play an important role in NO elimination (Yoshihara et al. 1996).
Further studies by Maeda et al. (1995) were conducted to determine the effects of
NOx on growth rate and the plausibility of growing algae on flue gas. NO fed at
concentrations of up to 60 ppm with 15% CO2 had no effect on pH, and no effect on algal
growth. However, at NO concentrations above 150 ppm, pH dropped below 3 and
growth was inhibited. When a buffer was added to control pH, no inhibition was
detected. This held true for both simulated and actual (13% CO2, 10 ppm SOx, 150 ppm
NOx) flue gas (Maeda et al. 1995).
Another study, focusing on CO2 uptake, determined the algal strain
Monoraphidium minutum was able to tolerate 200 ppm SOx and 150 ppm NOx
(Brown, 1996). In this study, algae was grown in a medium that contained excess
NaNO3. It was determined that the small amount of nitrogen provided by the flue gas,
along with the poor solubility of NO, provided no measurable stimulation of growth as an
added nitrogen source. However, the concentration of NO2- in flue gas treated cultures
were higher than control cultures, showing that some NO may be dissolving to form
nitrite, and in turn is available as a nitrogen source for the algae. The NO3-
19
concentrations over time were quite similar in both the flue gas treated cultures and the
control, although slightly higher in flue gas treated cultures (Brown 1996). While the
authors attributed this to the flue gas retarding NO3- utilization, it is possible that NO
and/or NO2- chemically reacted to form an accumulation of NO3
-. This is supported with
the observation that there was no measurable difference in growth rate between the two
cultures.
Hauck et al. (1996) determined that the inhibitory effects of SOx went beyond
simply lowering the pH of the medium. SO2 at 200 ppm was added to two strains of
algae: Chlorella vulgaris because of its use in previous research, and Cyanidium
caldarium because of its alleged ability to thrive in acidic conditions and slightly elevated
temperatures. Both strains experienced growth inhibition by dissolved SO2 or an aqueous
oxidation product of SO2. C. vulgaris was completely unable to grow, while
C. caldarium showed some growth at first but then crashed shortly thereafter. C. vulgaris
crashed even in a buffered medium. This shows that the inhibition due to SOx may be
due to an accumulation of dissolved SO2 or an aqueous oxidation product of the gas
(Hauck et al., 1996). Therefore, in support of the conclusions made by Negoro et al.
(1991), to grow algae using NOx, the flue gas must be conditioned to exclude high
concentrations of SOx.
Matsumoto et al. (1997) later studied the effects of high concentrations of CO2 as
well as 400 ppm SOx and 70 ppm NOx on Nannochloropsis salina and Phaeodactylum
tricornutum. As with previous research, it was found that algae could indeed grow with
CO2 concentrations of up to 20% by volume. After adding 400 ppm SO2, a drop in pH
was also observed. In contrast to earlier studies, no inhibition of growth was observed
20
when the medium was buffered with NaOH and the pH was increased to 8. Therefore,
Matsumoto et al. were able to conclude that the effect of SOx on the inhibition of algal
growth was indeed due solely to the resulting acidic conditions. NO was also observed to
dissolve and oxidize to NO2- under high concentrations of O2. The accumulation of NO2
-
was found to slightly decrease algae production initially, but significantly increased
growth rates later on. To substantiate this result, NaNO3 was replaced with NaNO2 in the
culture medium, and the same result was observed, further verifying previous conclusions
that NO2- can in fact be used as a nitrogen source for algal growth
(Matsumoto et al. 1997).
Perhaps the first to try to use algae exclusively as a means of NOx removal from
flue gas were Nagase et al. in 1997. The primary experiment involved feeding a
Dunaliella tertiolecta culture with a simulated flue gas containing 100 ppm NO and 15%
CO2 in N2 at 25oC with white fluorescent lamp illumination in a long tubular
photobioreactor. The reactor was cycled through alternating light and dark phases. It
was found that the removal rate of NO increased sharply during the light phase, but
leveled off around 60% removal. Removal during the dark phase decreased by about
20% when 2% O2 was added to the influent gas. When no O2 was added in the model
flue gas, removal during the dark phase essentially stopped. Therefore, to obtain
continued NO removal in light and dark phases, O2 needs to be added during the dark
phase to supplement the lack of O2 produced photosynthetically. This further
substantiates previous research that shows "NO removal...occurs by means of some
mechanism related to light and O2 dissolved in water." Because the NO removal rate
leveled off between 60% and 65% in media with and without cells and in both light and
21
dark phases, a rate-limiting step independent of cell concentration and light was involved.
By varying the column height, and therefore gas-liquid contact time, it was found that
"the dissolution of NO in water obeys first-order kinetics with respect to the inlet NO
concentration." This was suggested to be the rate-limiting step in the removal of NO.
The authors substantiate this suggestion with the lack of NO removal in the absence of O2
and the subsequent suppression of cell growth. It was concluded that the removal of NO
can be explained in three steps. First, the NO is dissolved in the aqueous phase. Then,
the NO is oxidized by algal cells via reaction with O2. Finally, oxidized NO is
assimilated by the algae as a nitrogen source. It was suggested that the most effective
way to enhance NO removal would be to increase the gas-liquid contact area by reducing
the bubble size (Nagase et al. 1997)
The effect of reducing the bubble size was later researched by the same team that
accomplished the above study. A decrease in bubble size resulted in a higher volumetric
mass-transfer coefficient and consequently higher removal rates. Unfortunately, when
the bubbles were too small, the algal cells became concentrated at the top of the reactor
due to froth floatation (dissolved air floatation) and sustained NO removal was not
achieved. After also trying multiple reactor types, it was found that a counter-flow airlift
reactor achieved the best NO removal. This type of reactor allowed for proper
suspension of the cells and decreased the rising rate of the bubbles, allowing an 83%
removal rate. To further enhance removal, air was used instead of nitrogen as the make-
up gas to provide O2 to the system. Greater than 90% removal efficiency was achieved
for this model flue gas with 15% CO2, 85% air, and 100 ppm NO in a counter-flow airlift
reactor with a mean bubble diameter of 0.26-mm (Nagase et al. 1998). This result

22
validates previous conclusions about the necessity of O2 and the importance of
optimizing mass transfer rates of NOx gas into the aqueous phase.
23
3. METHODS
The following experiments tested the ability of C. vulgaris to grow in a 20-L
photobioreactor utilizing dissolved nitrogen from a simulated flue gas inlet stream
containing between 30 ppm and 450 ppm gaseous nitrogen oxides at 3.0 – 3.6 L/min.
The efficiency of NOx removal in the gaseous stream was measured to determine whether
the use of photobioreactors to treat NOx is a viable and sustainable treatment method.
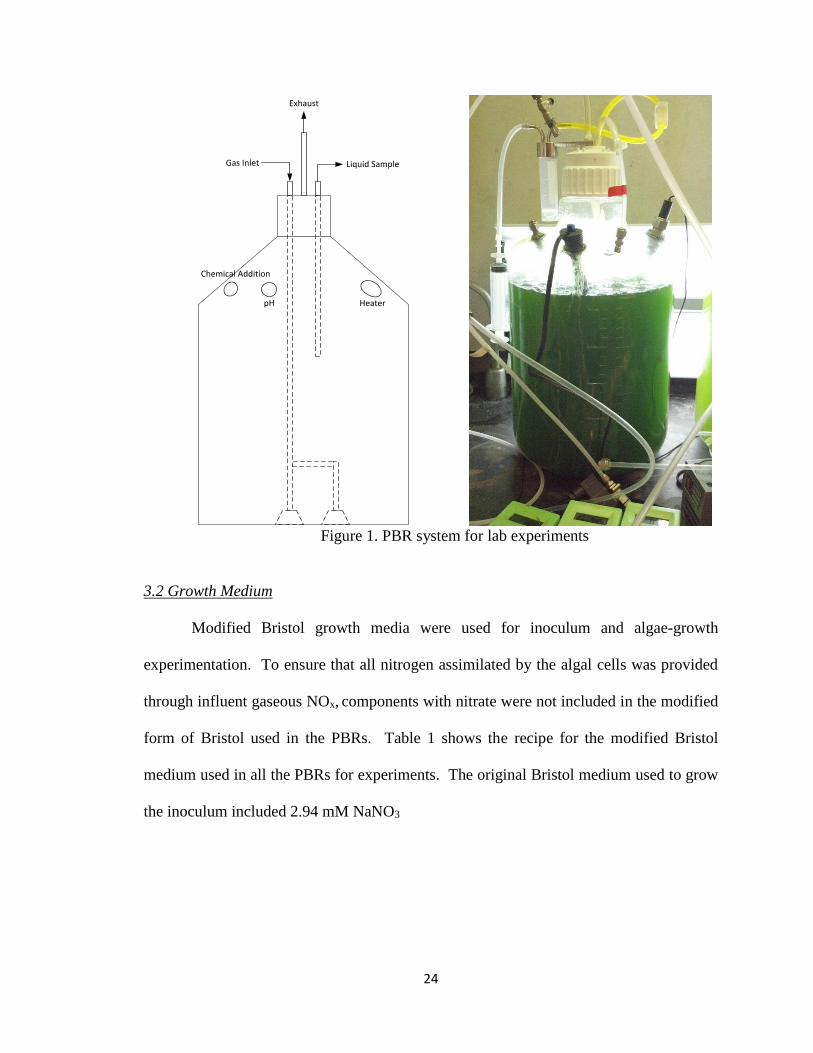
3.1 PBR Design
All experiments were run in photobioreactors set up using three, 20-L Nalgene®
Clearboy® round polycarbonate carboys operated under a fume hood. Each carboy was
sealed with a threaded cap with three ports. One port was used to connect influent gas
tubing, another for effluent gas tubing, and the third was used for liquid sampling. Three
holes were drilled into the top of each carboy to allow ports for chemical addition, a pH
probe, and an aquarium heater. Figure 1 shows the design of the typical PBR used for all
experiments. PBR system design and operation varied for each of the three experiments.
The details of each experiment are described in the sections below.
24
Figure 1. PBR system for lab experiments
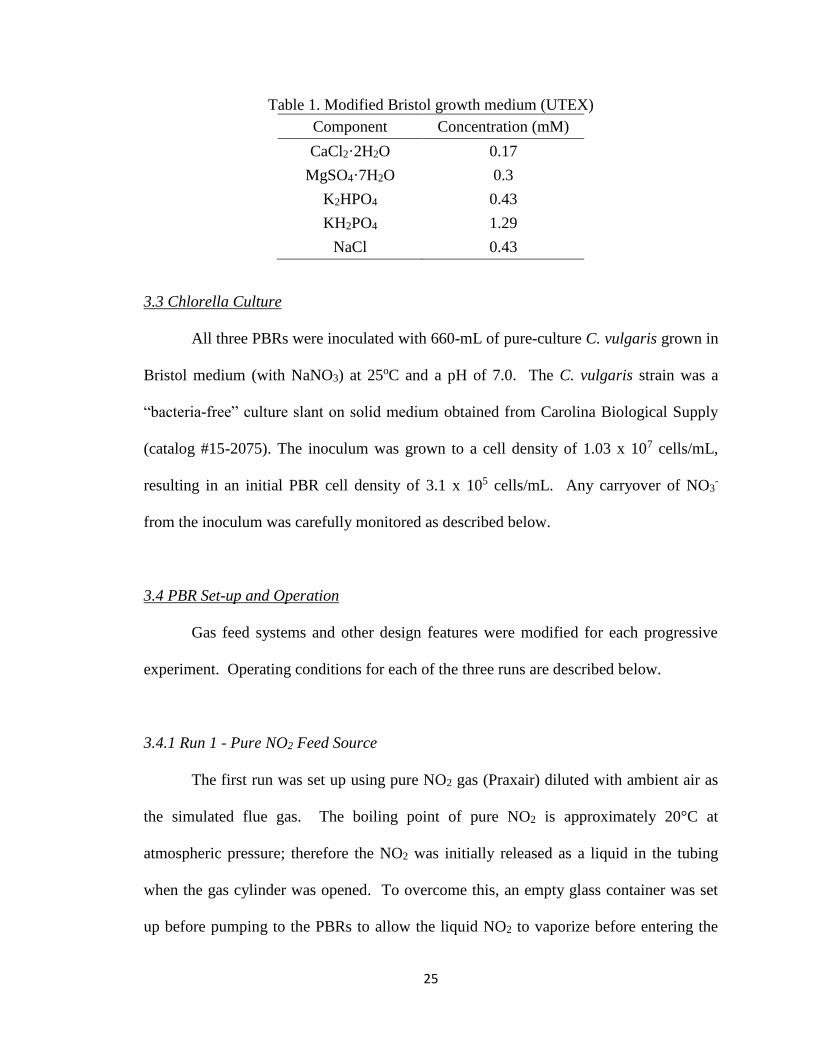
3.2 Growth Medium
Modified Bristol growth media were used for inoculum and algae-growth
experimentation. To ensure that all nitrogen assimilated by the algal cells was provided
through influent gaseous NOx, components with nitrate were not included in the modified
form of Bristol used in the PBRs. Table 1 shows the recipe for the modified Bristol
medium used in all the PBRs for experiments. The original Bristol medium used to grow
the inoculum included 2.94 mM NaNO3
Chemical Addition
Gas Inlet
Exhaust
pH Heater
Liquid Sample
25
Table 1. Modified Bristol growth medium (UTEX)
Component Concentration (mM)
CaCl2·2H2O 0.17
MgSO4·7H2O 0.3
K2HPO4 0.43
KH2PO4 1.29
NaCl 0.43
3.3 Chlorella Culture
All three PBRs were inoculated with 660-mL of pure-culture C. vulgaris grown in
Bristol medium (with NaNO3) at 25oC and a pH of 7.0. The C. vulgaris strain was a
“bacteria-free” culture slant on solid medium obtained from Carolina Biological Supply
(catalog #15-2075). The inoculum was grown to a cell density of 1.03 x 10⁷ cells/mL,
resulting in an initial PBR cell density of 3.1 x 10⁵ cells/mL. Any carryover of NO3-
from the inoculum was carefully monitored as described below.
3.4 PBR Set-up and Operation
Gas feed systems and other design features were modified for each progressive
experiment. Operating conditions for each of the three runs are described below.
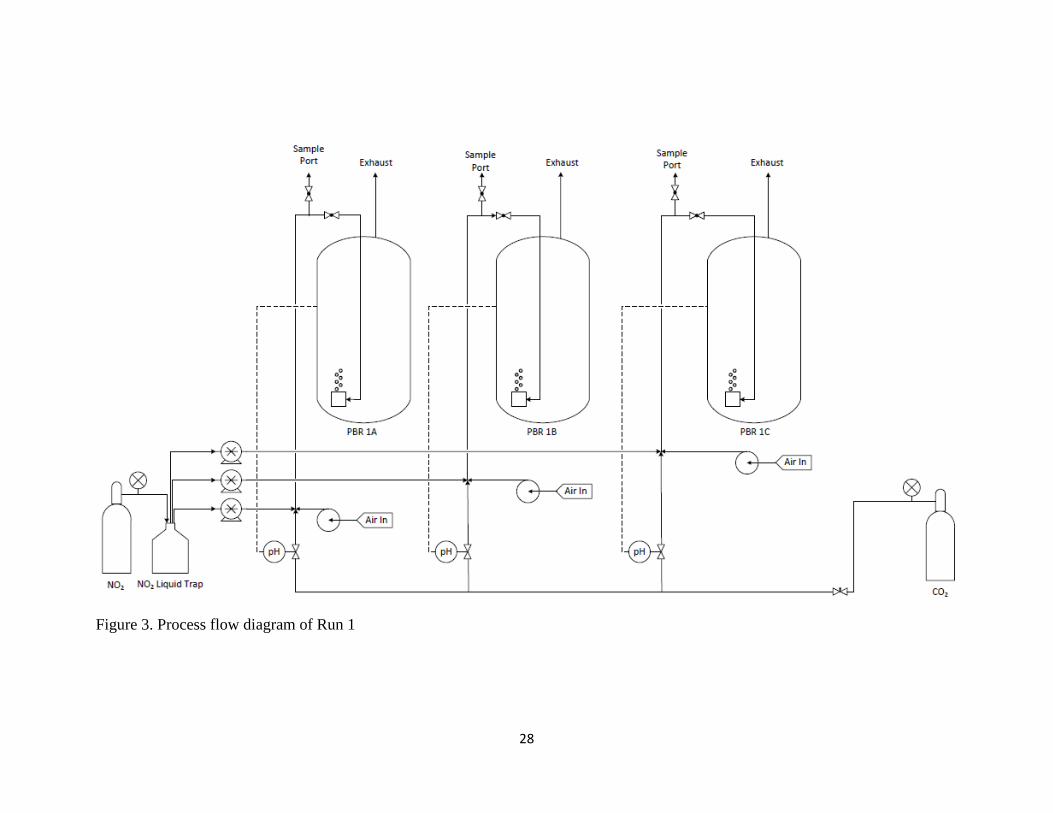
3.4.1 Run 1 - Pure NO2 Feed Source
The first run was set up using pure NO2 gas (Praxair) diluted with ambient air as
the simulated flue gas. The boiling point of pure NO2 is approximately 20°C at
atmospheric pressure; therefore the NO2 was initially released as a liquid in the tubing
when the gas cylinder was opened. To overcome this, an empty glass container was set
up before pumping to the PBRs to allow the liquid NO2 to vaporize before entering the
26
PBRs (Figure 1). NO was produced passively through natural chemical reaction before
entering the PBR, and no additional NO was fed into the system. Therefore, no attempt
was made to control the production or concentration of NO. The NO2 was blended with
3.6 L/min of air through a series of peristaltic pumps in an attempt to achieve target NOx
influent concentrations of 150 ppm, 300 ppm, and 450 ppm in PBRs 1A, 1B, and 1C
respectively.
The blended gas entered each PBR through a single 15-cm aquarium air stone
placed flush with the bottom of each reactor. Carbon dioxide feed was regulated by
separate solenoid valves to each PBR controlled based on the pH inside the reactor. The
solenoid valves would open to allow CO2 to flow if the pH raised above 8.0. A process
flow diagram of the PBR configuration in Run 1 is shown in Figure 3. All connections
were made with 6.35-mm Teflon tubing with stainless steel or brass connectors and
fittings. The system was run for four days to assess NOx removal efficiencies.
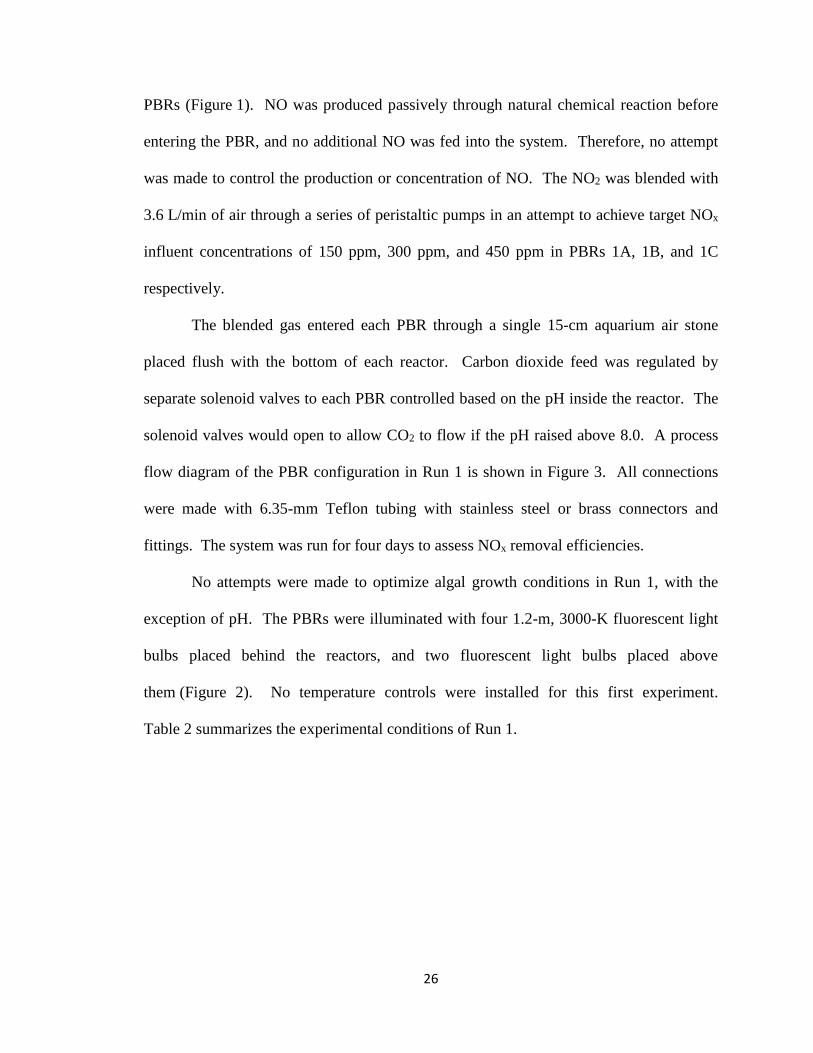
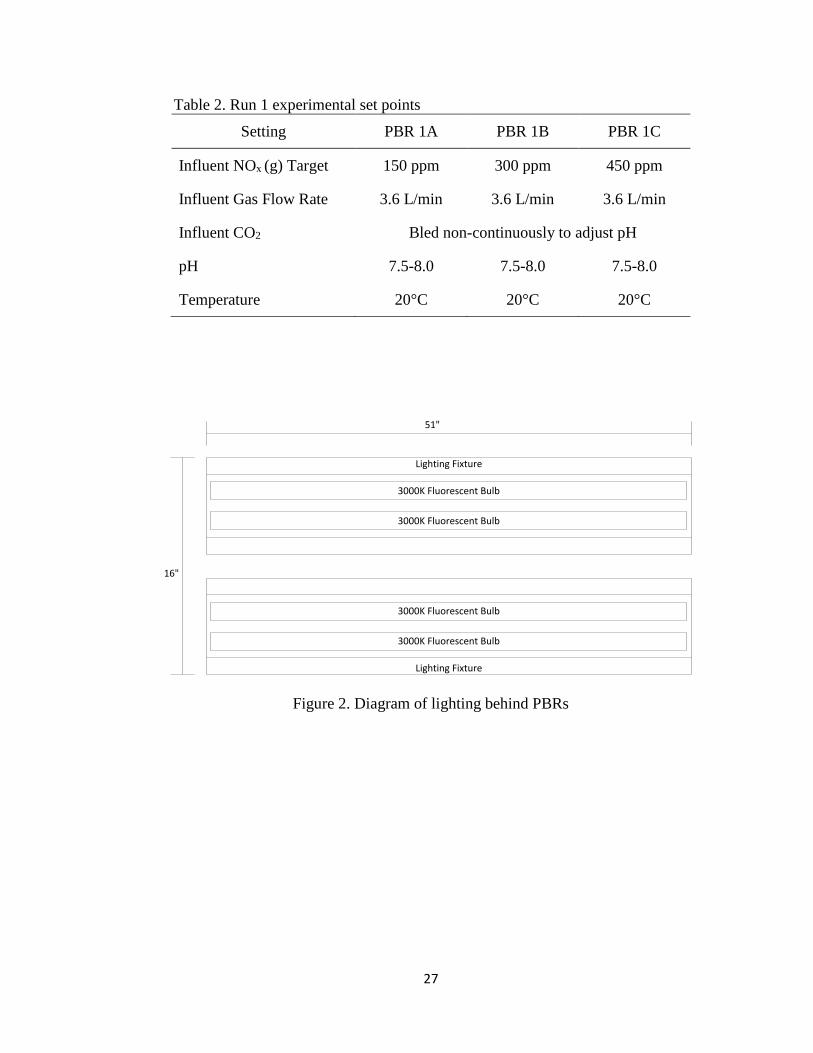
No attempts were made to optimize algal growth conditions in Run 1, with the
exception of pH. The PBRs were illuminated with four 1.2-m, 3000-K fluorescent light
bulbs placed behind the reactors, and two fluorescent light bulbs placed above
them (Figure 2). No temperature controls were installed for this first experiment.
Table 2 summarizes the experimental conditions of Run 1.
27
Table 2. Run 1 experimental set points
Setting PBR 1A PBR 1B PBR 1C
Influent NOx (g) Target 150 ppm 300 ppm 450 ppm
Influent Gas Flow Rate 3.6 L/min 3.6 L/min 3.6 L/min
Influent CO2 Bled non-continuously to adjust pH
pH 7.5-8.0 7.5-8.0 7.5-8.0
Temperature 20°C 20°C 20°C
51"
16"
Lighting Fixture
3000K Fluorescent Bulb
3000K Fluorescent Bulb
Lighting Fixture
3000K Fluorescent Bulb
3000K Fluorescent Bulb
Figure 2. Diagram of lighting behind PBRs
28
Figure 3. Process flow diagram of Run 1
29
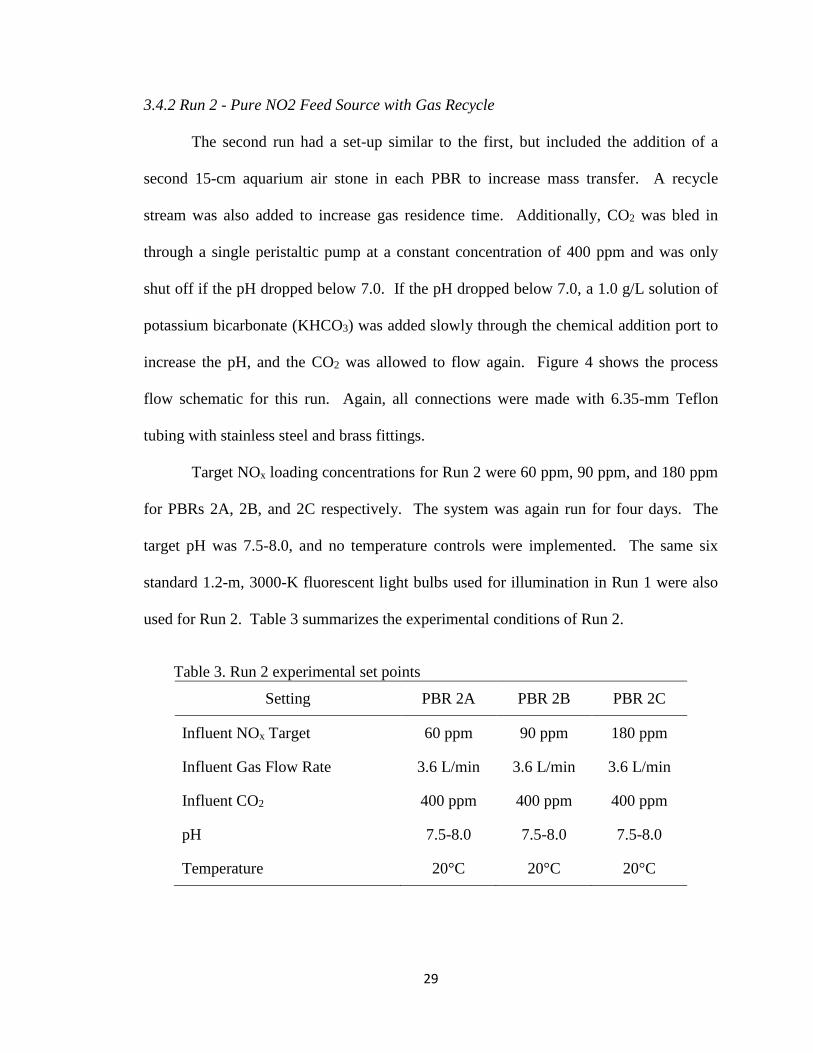
3.4.2 Run 2 - Pure NO2 Feed Source with Gas Recycle
The second run had a set-up similar to the first, but included the addition of a
second 15-cm aquarium air stone in each PBR to increase mass transfer. A recycle
stream was also added to increase gas residence time. Additionally, CO2 was bled in
through a single peristaltic pump at a constant concentration of 400 ppm and was only
shut off if the pH dropped below 7.0. If the pH dropped below 7.0, a 1.0 g/L solution of
potassium bicarbonate (KHCO3) was added slowly through the chemical addition port to
increase the pH, and the CO2 was allowed to flow again. Figure 4 shows the process
flow schematic for this run. Again, all connections were made with 6.35-mm Teflon
tubing with stainless steel and brass fittings.
Target NOx loading concentrations for Run 2 were 60 ppm, 90 ppm, and 180 ppm
for PBRs 2A, 2B, and 2C respectively. The system was again run for four days. The
target pH was 7.5-8.0, and no temperature controls were implemented. The same six
standard 1.2-m, 3000-K fluorescent light bulbs used for illumination in Run 1 were also
used for Run 2. Table 3 summarizes the experimental conditions of Run 2.
Table 3. Run 2 experimental set points
Setting PBR 2A PBR 2B PBR 2C
Influent NOx Target 60 ppm 90 ppm 180 ppm
Influent Gas Flow Rate 3.6 L/min 3.6 L/min 3.6 L/min
Influent CO2 400 ppm 400 ppm 400 ppm
pH 7.5-8.0 7.5-8.0 7.5-8.0
Temperature 20°C 20°C 20°C
30
Figure 4. Process flow diagram of Run 2
31
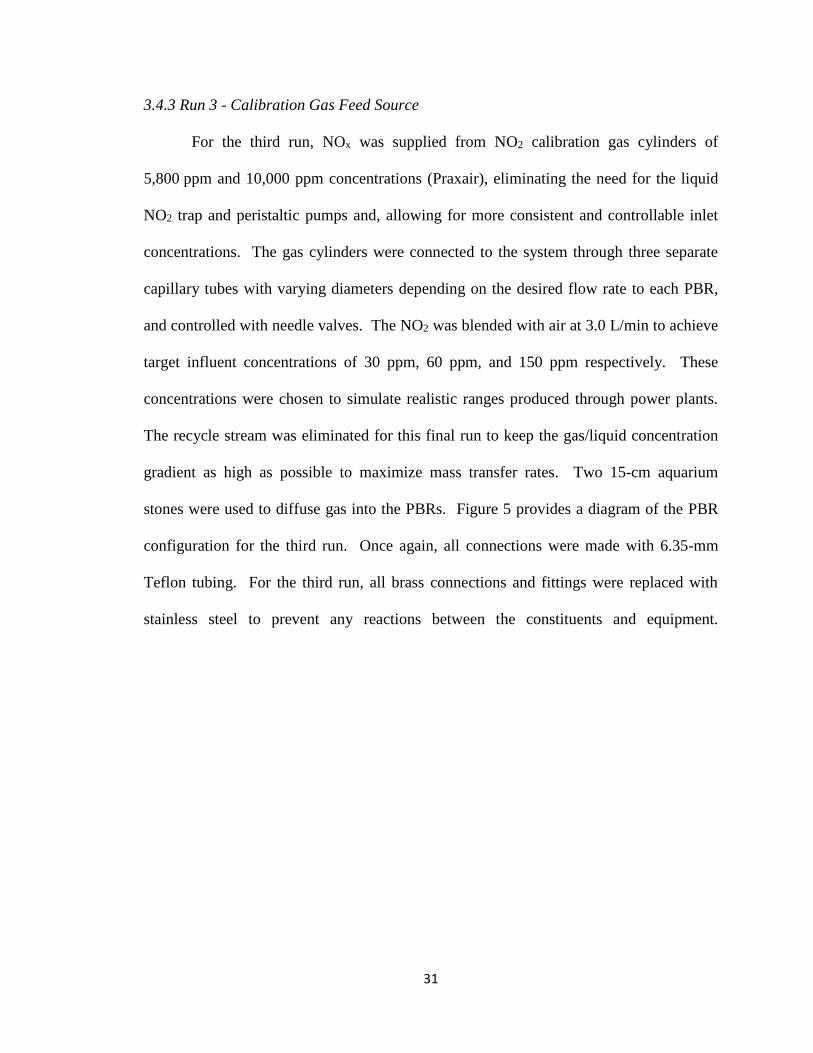
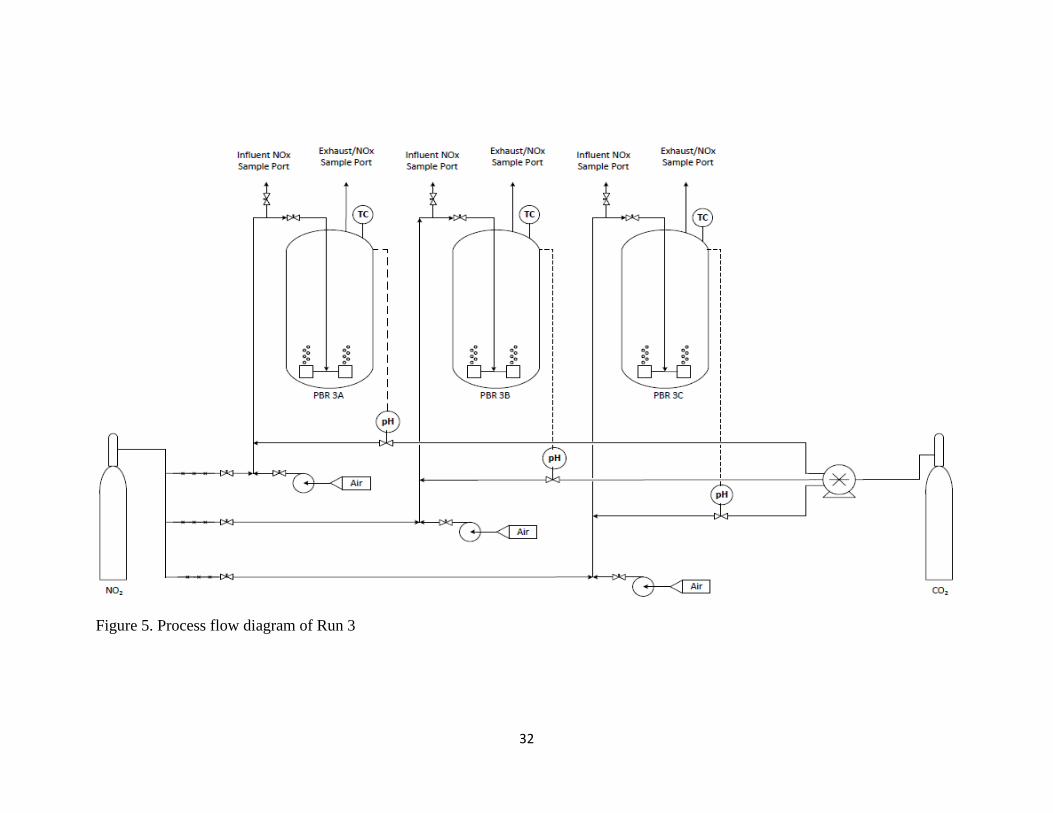
3.4.3 Run 3 - Calibration Gas Feed Source
For the third run, NOx was supplied from NO2 calibration gas cylinders of
5,800 ppm and 10,000 ppm concentrations (Praxair), eliminating the need for the liquid
NO2 trap and peristaltic pumps and, allowing for more consistent and controllable inlet
concentrations. The gas cylinders were connected to the system through three separate
capillary tubes with varying diameters depending on the desired flow rate to each PBR,
and controlled with needle valves. The NO2 was blended with air at 3.0 L/min to achieve
target influent concentrations of 30 ppm, 60 ppm, and 150 ppm respectively. These
concentrations were chosen to simulate realistic ranges produced through power plants.
The recycle stream was eliminated for this final run to keep the gas/liquid concentration
gradient as high as possible to maximize mass transfer rates. Two 15-cm aquarium
stones were used to diffuse gas into the PBRs. Figure 5 provides a diagram of the PBR
configuration for the third run. Once again, all connections were made with 6.35-mm
Teflon tubing. For the third run, all brass connections and fittings were replaced with
stainless steel to prevent any reactions between the constituents and equipment.
32
Figure 5. Process flow diagram of Run 3
33
Temperature control was added during the third run to provide a more optimal
environment for the algae. A 50-W aquarium heater was added to each PBR and set to
25oC. The four standard fluorescent bulbs behind the PBRs were replaced with four
1.2-m, 5600-K "Natural Light" fluorescent bulbs to provide better quality light to the
PBRs. The two fluorescent bulbs above the PBRs were unchanged from the previous
runs. CO2 was bled into the system, as with Run 2, at a constant 400 ppm. The pH was
adjusted manually with either a basic solution of 1.0 g/L KHCO3, or an acidic solution of
0.5 M HCl to maintain the target pH of 8.0 to 8.5. Table 4 provides a summary of the
target experimental conditions for Run 3.
Table 4. Run 3 experimental set points
Setting PBR 3A PBR 3B PBR 3C
Influent NOx Target 30 ppm 60 ppm 150 ppm
Influent Gas Flow Rate 3.0 L/min 3.0 L/min 3.0 L/min
Influent CO2 400 ppm 400 ppm 400 ppm
pH 8.0-8.5 8.0-8.5 8.0-8.5
Temperature 25°C 25°C 25°C
To prevent culture crashes and allow the algae to acclimate to PBR conditions, the
PBRs were inoculated 48 hours prior to the start of NOx loading. During this 48-hour
period, only ambient air was run through the system, and the algae grew on residual
nitrate from the inoculation solution. After the 48-hour acclimation period, the algae had
begun their exponential growth phase, and NOx loading was started. The system was run
for an additional 144 hours to ensure the algae were able to achieve peak growth.
34
3.5 Sampling and Testing Procedures
Sampling and testing procedures are summarized in Table 5 and described in the
subsequent sections.
Table 5. Sample and analysis procedure summary
Metric Sampling/Analysis
Method Frequency Analytical Method
Temperature Infrared Thermometer Several times/day Infrared Thermometer
Influent/Effluent
Flow Rates
Calibrated Flow
Meter Several times/day
Calibrated Flow
Meter
pH pH Probe Several times/day pH Meter
Influent/Effluent
NOx Tedlar Bags 4x/day Chemiluminescence
Aqueous
Nitrate/Nitrite 25-mL Filtered 2x/day Spectrophotometer
Organic Nitrogen 50-mL Initial and Final Total Kjeldahl
Method
Cell Count Aqueous Sampler 2x/day Hemocytometer
Algal Weight 100-mL Filtered Initial and Final Total Suspended
Solids Method
3.5.1 Gas Sampling
Influent and effluent gas samples were taken four times daily, approximately three
hours apart, between the hours of 7am and 7pm. NO and NO2 concentrations were
measured using an Advanced Pollution Instrumentation Model 200AH
chemiluminescence analyzer. The influent sampling port consisted of two valves
positioned immediately prior to the inlet port to each PBR, as depicted in Figures 3-5.
35
During sampling, the valve to the PBR inlet was closed and the valve to the sample port
was opened. In this way the NOx stream was directed to either a Tedlar bag or directly to
the analyzer. When a Tedlar bag was used to collect the sample, NOx concentration
measurements were measured discretely. Effluent samples were collected similarly,
although no valves were used to direct flow. Effluent samples were taken directly off the
exhaust stream of the PBR, either through collection into Tedlar bags or diverted directly
into the analyzer. The process flow diagrams in Figures 3-5 show a visual representation
of the sampling streams.
The NOx analyzer was calibrated every morning prior to collecting samples using
EPA Protocol 1 NO gas concentrations of 40.3 ppm, 198 ppm, and 441 ppm. The
analyzer was also checked periodically throughout the day using the calibration gases to
ensure the accuracy of the data collected. The analyzer was recalibrated if measured
concentrations deviated from the EPA Protocol 1 calibration gas concentrations by
greater than 3%.
3.5.2 Algae Cell Counts
Cell counts were measured twice daily using a hemocytometer. A liquid sample
was taken from each PBR twice daily, and approximately 7µL of each sample was
pipetted into a counting chamber. The central 1-mm square of each chamber was viewed
at 200x magnification using bright field microscopy. The number of suspended cells
were counted from each of the four corners and the middle 0.25 mm square. The final
cell count in each chamber was then determined by multiplying the total number of
36
suspended cells counted by 250,000. Four counting chambers per sample were analyzed
and averaged to obtain the cell density of each PBR in cells/mL.
3.5.3 Dry Weight
Dry weight samples were taken at the beginning and end of each run and analyzed
for the total suspended solids (TSS) concentration of each sample. A gravimetric
analysis was used following the American Public Health Association (APHA) Standard
Methods for the Examination of Water and Wastewater Method 2540 (Rice &
Bridgewater, 2012). A 100-mL liquid sample from each PBR was filtered using a
standard Fisherbrand grade G4, glass-fiber filter. The filters were conditioned prior to
TSS testing by washing with 50-mL of filtered, deionized water while applying a
vacuum. Conditioned filters were placed in aluminum weighing dishes, dried for one
hour at 105oC, and then placed in a desiccator. At the time of sampling, the conditioned
filters were removed from the desiccator and weighed on aluminum weighing dishes to
obtain the initial weight. The 100-mL liquid samples from each PBR were filtered
through the conditioned filters and then dried at 105oC. Three samples were filtered for
each PBR. The final weights of each filter were recorded and an average TSS was
calculated for each PBR per Equation 18.
𝑇𝑆𝑆 = (𝑤𝑒𝑖𝑔ℎ𝑡𝑎𝑓𝑡𝑒𝑟𝑑𝑟𝑦𝑖𝑛𝑔−𝑤𝑒𝑖𝑔ℎ𝑡𝑜𝑓𝑐𝑜𝑛𝑑𝑖𝑡𝑖𝑜𝑛𝑒𝑑𝑓𝑖𝑙𝑡𝑒𝑟)
𝑠𝑎𝑚𝑝𝑙𝑒𝑣𝑜𝑙𝑢𝑚𝑒 (18)
3.5.4 Nitrate/Nitrite
Liquid samples were analyzed for nitrate and nitrite concentrations for Run 3
only. Approximately 25-mL samples were taken from each PBR twice daily, and filtered
37
using the Fisherbrand grade G4, glass-fiber filters. The filtrates were analyzed using a
Hach® DR 3800™ UV-Vis Spectrophotometer and Nitrate and Nitrate TNTplus, using
LR pre-coded vials. Methods TNT 835 and TNT 839 were followed to determine nitrate
and nitrite concentrations, respectively. The Hach® chemicals were added to the vials,
mixed and allowed to react per each method, and then placed in the spectrophotometer.
The spectrophotometer automatically scanned the barcode of each vial and ran the correct
program, analyzing each sample instantaneously.
3.5.5 Organic Nitrogen
Also exclusive to Run 3 was the determination of the total organic nitrogen
content of the algal cells at the beginning and end of the run. This was done using the
Total Kjeldahl Nitrogen (TKN) method adapted from the APHA Standard Methods for
the Examination of Water and Wastewater 4500-NorgB and 4500-NH3C (Rice &
Bridgewater, 2012). Duplicate initial and final samples for each PBR were collected and
digested with strong sulfuric acid at 189oC, oxidizing the organic material and liberating
the organic nitrogen as ammonium. The solution was then cooled and neutralized with
sodium hydroxide to convert ammonium to ammonia gas. The ammonia gas was then
trapped in a solution of boric acid to neutralize the ammonia, and then titrated with
0.02 N sulfuric acid using a mixed pH indicator that changes from purple to green under
basic conditions.
38
3.6 Laboratory Safety
As previously discussed, nitrogen oxides are highly toxic and harmful to both
living beings and the environment. Great care and consideration must be taken with
regard to laboratory safety and proper handling of the nitrogen oxides gases. All
experiments were conducted in a fume hood to ensure proper ventilation and to limit
contamination of ambient laboratory air with nitrogen oxides. Passive continuous
monitoring of ambient nitrogen oxide concentrations was conducted using the
chemiluminescence analyzer. All experimentation was conducted in a laboratory with an
emergency shower and eyewash station, particularly in case of contact with the highly
corrosive liquid NO2. Nitrile gloves were worn when handling the PBRs and associated
equipment, and during all sampling and testing. All gas cylinders were properly secured
and chained to limit movement during a potential seismic event. Any and all adverse
effects from potential exposure to NOx were treated with utmost seriousness and
consultation with a medical professional.
39
4. RESULTS
4.1 NOx Removal Efficiency and Cell Growth
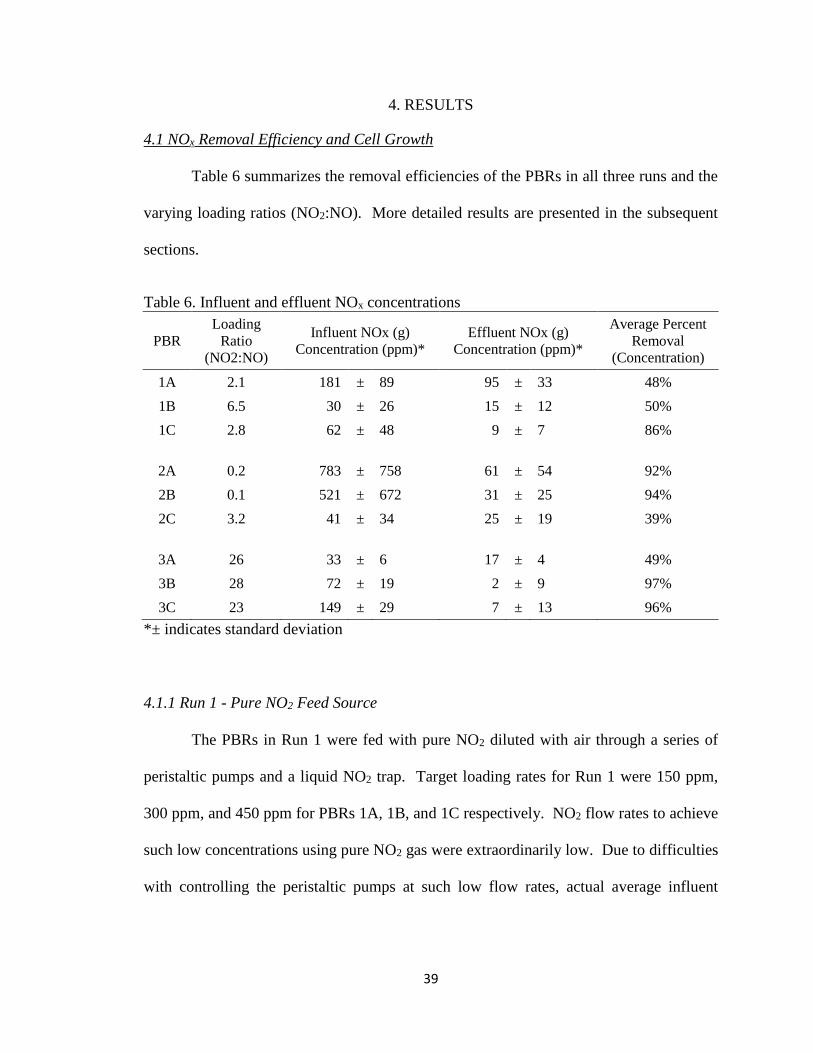
Table 6 summarizes the removal efficiencies of the PBRs in all three runs and the
varying loading ratios (NO2:NO). More detailed results are presented in the subsequent
sections.
Table 6. Influent and effluent NOx concentrations
PBR
Loading
Ratio
(NO2:NO)
Influent NOx (g)
Concentration (ppm)*
Effluent NOx (g)
Concentration (ppm)*
Average Percent
Removal
(Concentration)
1A 2.1 181 ± 89 95 ± 33 48%
1B 6.5 30 ± 26 15 ± 12 50%
1C 2.8 62 ± 48 9 ± 7 86%
2A 0.2 783 ± 758 61 ± 54 92%
2B 0.1 521 ± 672 31 ± 25 94%
2C 3.2 41 ± 34 25 ± 19 39%
3A 26 33 ± 6 17 ± 4 49%
3B 28 72 ± 19 2 ± 9 97%
3C 23 149 ± 29 7 ± 13 96%
*± indicates standard deviation
4.1.1 Run 1 - Pure NO2 Feed Source
The PBRs in Run 1 were fed with pure NO2 diluted with air through a series of
peristaltic pumps and a liquid NO2 trap. Target loading rates for Run 1 were 150 ppm,
300 ppm, and 450 ppm for PBRs 1A, 1B, and 1C respectively. NO2 flow rates to achieve
such low concentrations using pure NO2 gas were extraordinarily low. Due to difficulties
with controlling the peristaltic pumps at such low flow rates, actual average influent
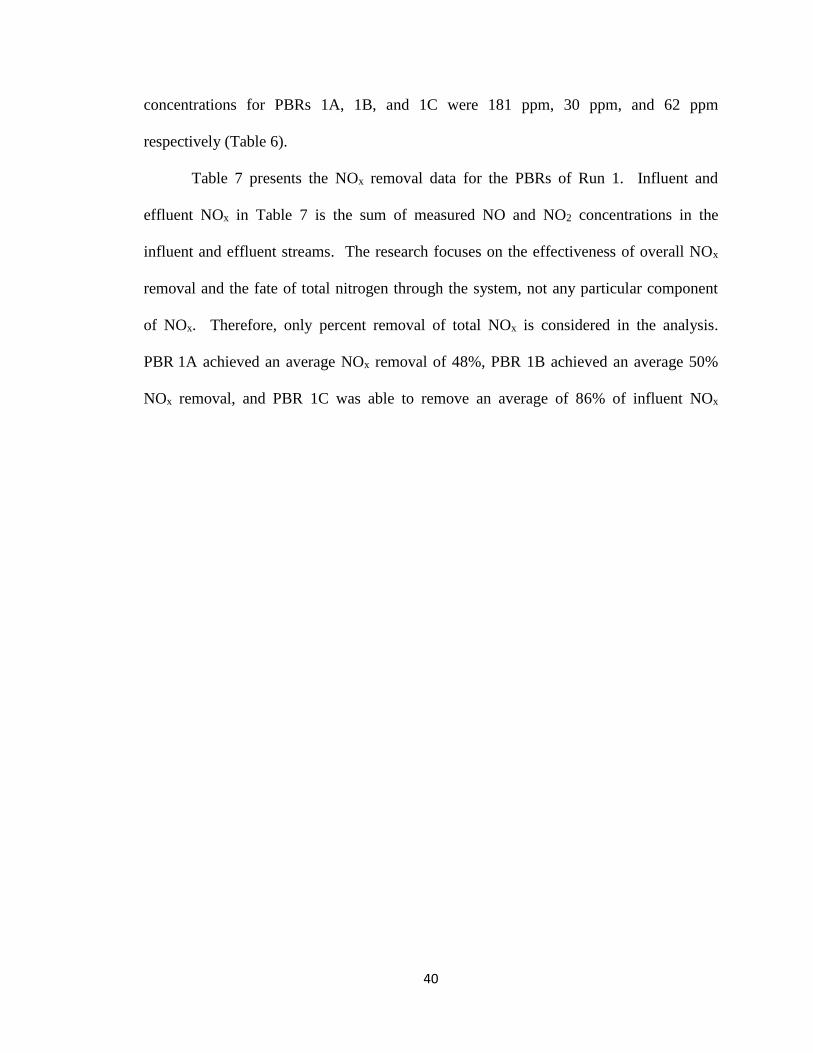
40
concentrations for PBRs 1A, 1B, and 1C were 181 ppm, 30 ppm, and 62 ppm
respectively (Table 6).
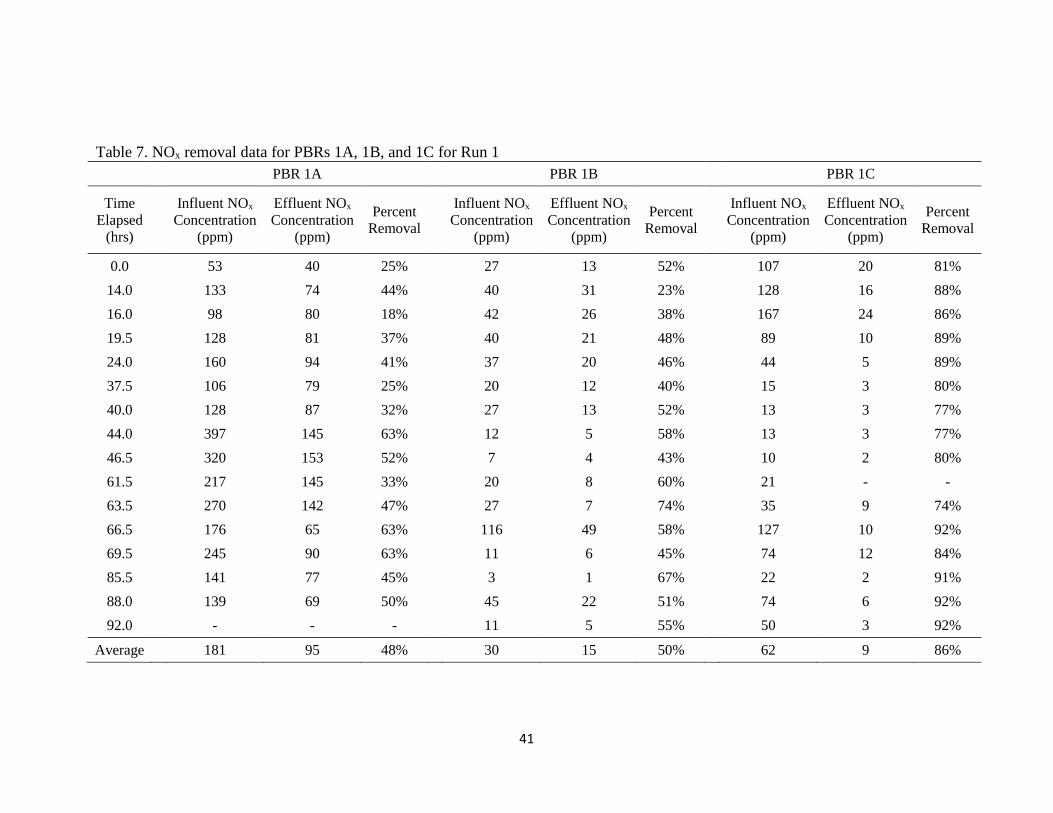
Table 7 presents the NOx removal data for the PBRs of Run 1. Influent and
effluent NOx in Table 7 is the sum of measured NO and NO2 concentrations in the
influent and effluent streams. The research focuses on the effectiveness of overall NOx
removal and the fate of total nitrogen through the system, not any particular component
of NOx. Therefore, only percent removal of total NOx is considered in the analysis.
PBR 1A achieved an average NOx removal of 48%, PBR 1B achieved an average 50%
NOx removal, and PBR 1C was able to remove an average of 86% of influent NOx
41
Table 7. NOx removal data for PBRs 1A, 1B, and 1C for Run 1
PBR 1A PBR 1B PBR 1C
Time
Elapsed
(hrs)
Influent NOx
Concentration
(ppm)
Effluent NOx
Concentration
(ppm)
Percent
Removal
Influent NOx
Concentration
(ppm)
Effluent NOx
Concentration
(ppm)
Percent
Removal
Influent NOx
Concentration
(ppm)
Effluent NOx
Concentration
(ppm)
Percent
Removal
0.0 53 40 25% 27 13 52% 107 20 81%
14.0 133 74 44% 40 31 23% 128 16 88%
16.0 98 80 18% 42 26 38% 167 24 86%
19.5 128 81 37% 40 21 48% 89 10 89%
24.0 160 94 41% 37 20 46% 44 5 89%
37.5 106 79 25% 20 12 40% 15 3 80%
40.0 128 87 32% 27 13 52% 13 3 77%
44.0 397 145 63% 12 5 58% 13 3 77%
46.5 320 153 52% 7 4 43% 10 2 80%
61.5 217 145 33% 20 8 60% 21 - -
63.5 270 142 47% 27 7 74% 35 9 74%
66.5 176 65 63% 116 49 58% 127 10 92%
69.5 245 90 63% 11 6 45% 74 12 84%
85.5 141 77 45% 3 1 67% 22 2 91%
88.0 139 69 50% 45 22 51% 74 6 92%
92.0 - - - 11 5 55% 50 3 92%
Average 181 95 48% 30 15 50% 62 9 86%
42
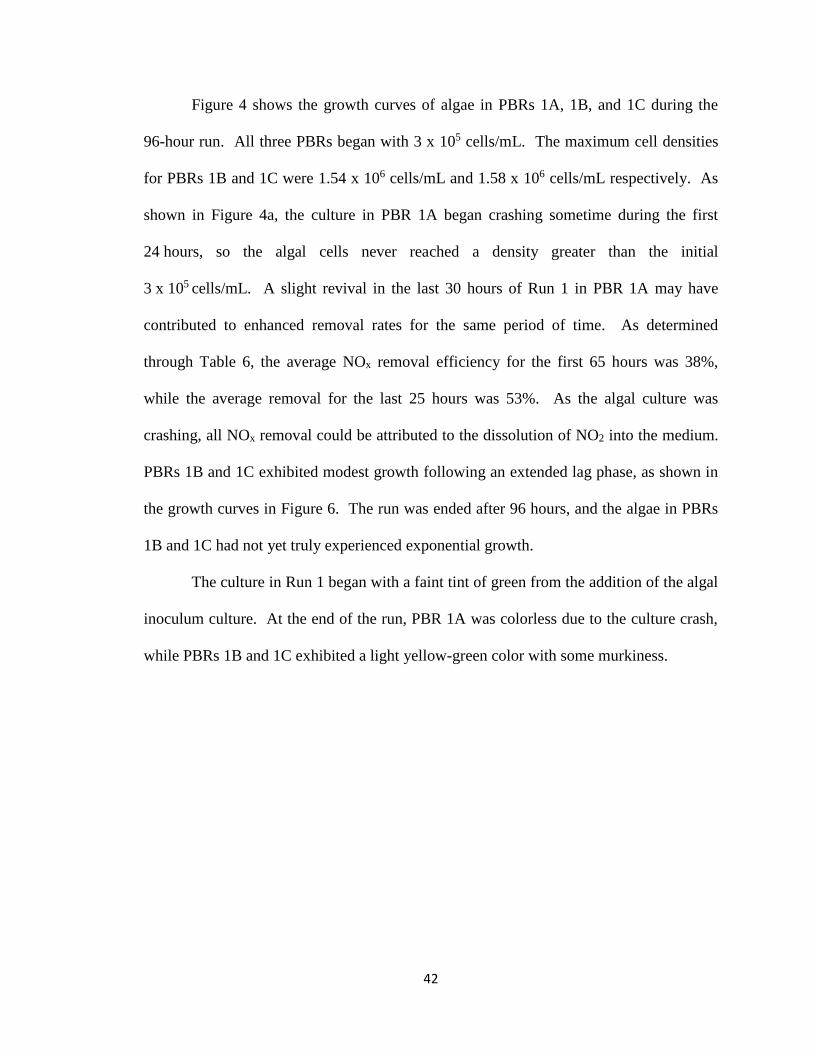
Figure 4 shows the growth curves of algae in PBRs 1A, 1B, and 1C during the
96-hour run. All three PBRs began with 3 x 10⁵ cells/mL. The maximum cell densities
for PBRs 1B and 1C were 1.54 x 10⁶ cells/mL and 1.58 x 10⁶ cells/mL respectively. As
shown in Figure 4a, the culture in PBR 1A began crashing sometime during the first
24 hours, so the algal cells never reached a density greater than the initial
3 x 10⁵ cells/mL. A slight revival in the last 30 hours of Run 1 in PBR 1A may have
contributed to enhanced removal rates for the same period of time. As determined
through Table 6, the average NOx removal efficiency for the first 65 hours was 38%,
while the average removal for the last 25 hours was 53%. As the algal culture was
crashing, all NOx removal could be attributed to the dissolution of NO2 into the medium.
PBRs 1B and 1C exhibited modest growth following an extended lag phase, as shown in
the growth curves in Figure 6. The run was ended after 96 hours, and the algae in PBRs
1B and 1C had not yet truly experienced exponential growth.
The culture in Run 1 began with a faint tint of green from the addition of the algal
inoculum culture. At the end of the run, PBR 1A was colorless due to the culture crash,
while PBRs 1B and 1C exhibited a light yellow-green color with some murkiness.
43
a)
b)
c)
Figure 6. Run 1 growth curves; a) PBR 1A. b) PBR 1B. c) PBR 1C.
1.0E+04
1.0E+05
1.0E+06
1.0E+07
0 24 48 72 96
Alg
ae C
ell
Den
sity
(ce
lls/
mL
)
Time (hr)
PBR 1A
1.0E+04
1.0E+05
1.0E+06
1.0E+07
0 24 48 72 96
Alg
ae C
ell
Den
sity
(ce
lls/
mL
)
Time (hr)
PBR 1B
1.0E+04
1.0E+05
1.0E+06
1.0E+07
0 24 48 72 96
Alg
ae C
ell
Den
sity
(ce
lls/
mL
)
Time (hr)
PBR 1C
44
4.1.2 Run 2 - Pure NO2 Feed Source with Gas Recycle
The PBRs in Run 2 were also fed with pure NO2 diluted with air through
peristaltic pumps and a liquid NO2 trap. Target influent NOx concentrations were
60 ppm, 90 ppm, and 180 ppm for PBRs 2A, 2B, and 2C respectively. NO2 flow rates to
achieve these concentrations using pure NO2 gas were still too difficult to accurately
control. Again, because of flow rate control issues with the peristaltic pumps, actual
average influent concentrations for PBRs 2A, 2B, and 2C were 783 ppm, 521 ppm, and
41 ppm respectively (Table 8).
Table 8 presents the NOx removal data for the PBRs of Run 2. As with Run 1,
influent and effluent NOx in Table 8 is the sum of measured NO and NO2 concentrations
in the influent and effluent streams. Only percent removal of total NOx is considered in
the analysis. PBR 2A achieved an average NOx removal of 92%, PBR 2B achieved an
average 94% NOx removal, and PBR 2C was able to remove an average of 39% of
influent NOx. Due to the high variability in loading, Run 2 data was not analyzed, and is
presented for continuity purposes only.
45
Table 8. NOx removal data for PBRS 2A, 2B, and 2C for Run 2
PBR 2A PBR 2B
PBR 2C
Time
elapsed
(hrs)
Influent NOx
Concentration
(ppm)
Effluent NOx
Concentration
(ppm)
Percent
Removal
Influent NOx
Concentration
(ppm)
Effluent NOx
Concentration
(ppm)
Percent
Removal
Influent NOx
Concentration
(ppm)
Effluent NOx
Concentration
(ppm)
Percent
Removal
0.0 85 51 40% 157 63 60% 123 61 50%
13.5 78 43 45% 64 38 41% 45 1.6 96%
16.0 24 31 -29% 124 44 65% 1.5 1.5 0%
18.5 170 87 49% 153 62.5 59% 2.9 1.5 48%
19.0 164 85 48% 136 57.9 57% 3.4 1.8 47%
20.5 205 88 57% 123 55 55% 94 51 46%
37.5 1712 29 98% 1.1 0.8 27% 34 24 29%
39.0 1374 17 99% - - - 31 26 16%
43.0 208 170 18% 99 36.1 64% 58 39.2 32%
45.5 360 172 52% 64 37.9 41% 41 26.7 35%
61.5 1473 2.3 100% 1375 3.9 100% 29.8 24.4 18%
64.0 1822 9.1 100% 1821 2.9 100% 37.6 34.7 8%
67.0 1833 34.5 98% 1548 1.7 100% 44.3 33.5 24%
70.0 1448 29 98% 1110 4.5 100% 24.7 22.6 9%
Average 783 61 92% 521 31 94% 41 25 39%
46
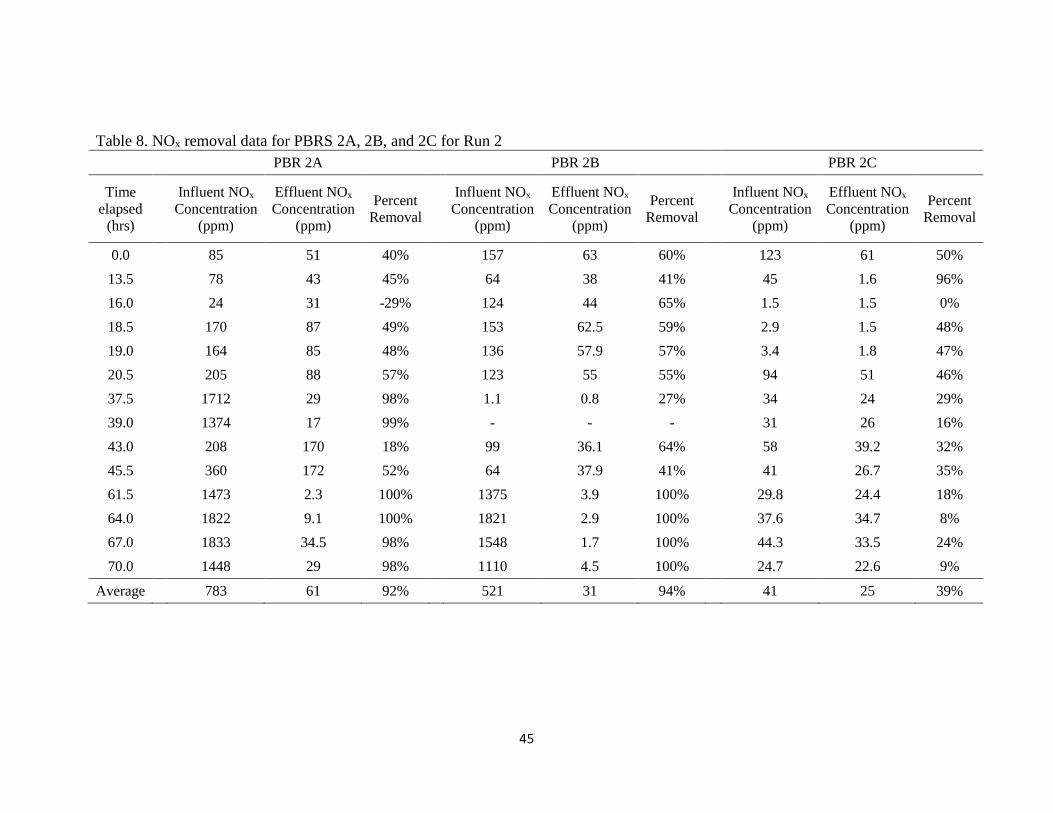
Figure 7 represents the growth curves of PBRs 2A, 2B, and 2C during the 70-hour
run. All three PBRs began with 3 x 10⁵ cells/mL. The maximum cell densities for PBRs
2A, 2B, and 2C were 4.50 x 10⁵ cells/mL, 1.09 x 10⁶ cells/mL, and 5.80 x 10⁵ cells/mL
respectively. Figure 7 shows that the algae did not crash immediately, but little growth
was observed, and two of the PBRs went into early death phases. This may have been
due to highly variable loading rates and high NOx concentrations, which may have
stressed the algae. Again, exponential growth was never observed. The growth medium
in Run 2 began with a faint tint of green from the addition of the algal inoculum culture.
At the end of the run, the culture in the PBRs had a brown tint, a possible result of very
high NOx concentrations.
After approximately 62 hours, the peristaltic pumps began to malfunction and
influent NOx to PBRs 2B and 2C far exceeded concentrations of 1000 ppm for the
remainder of the run. While this caused a crash in PBR 2C, slight growth was observed
in PBR 2B (Figure 7). Removal during the last 30 hours was measured to be essentially
100% for both reactors. Run 2 was terminated early because of the equipment
malfunction. Due to the uncontrolled experimental conditions and inexplicable nature of
the results, Run 2 data were used solely for experimental understanding, rather than
analysis.
47
a)
b)
c)
Figure 7. Run 2 growth curves; a) PBR 2A. b) PBR 2B. c) PBR 2C.
1.0E+04
1.0E+05
1.0E+06
1.0E+07
0 24 48 72 96
Alg
ae C
ell
Den
sity
(ce
lls/
mL
)
Time (hr)
PBR 2A
1.0E+04
1.0E+05
1.0E+06
1.0E+07
0 24 48 72 96
Alg
ae C
ell
Den
sity
(ce
lls/
mL
)
Time (hr)
PBR 2B
1.0E+04
1.0E+05
1.0E+06
1.0E+07
0 24 48 72 96
Alg
ae C
ell
Den
sity
(ce
lls/
mL
)
Time (hr)
PBR 2C
48
4.1.3 Run 3 - Calibration Gas Feed Source
To eliminate some of the problems that occurred from using pure NO2 gas in
Runs 1 and 2, NO2 calibration gases of 5,800 ppm and 10,000 ppm NO2 were used to
supply NOx for Run 3. This allowed for more accurate and precise NOx loading
concentrations. Also, to reduce any potential stress of NOx on the algae, the culture was
allowed to acclimate to PBR conditions and reach substantial growth rates before loading
NOx. Target loading rates for Run 3 were 30 ppm, 60 ppm, and 150 ppm for PBRs 3A,
3B, and 3C respectively. The calibration gases allowed for easier control, leading to
actual average influent NOx concentrations in PBRs 3A, 3B, and 3C of 33 ppm, 72 ppm,
and 149 ppm respectively.
Table 9 presents the NOx removal data for the PBRs of Run 3. Influent and
effluent NOx in Table 9 is the sum of measured NO and NO2 concentrations in the
influent and effluent streams. As with the previous runs, only percent removal of total
NOx is considered in the analysis. PBR 3A achieved an average NOx removal of 49%,
PBR 3B achieved an average 97% NOx removal, and PBR 3C was able to remove an
average of 96% of influent NOx.
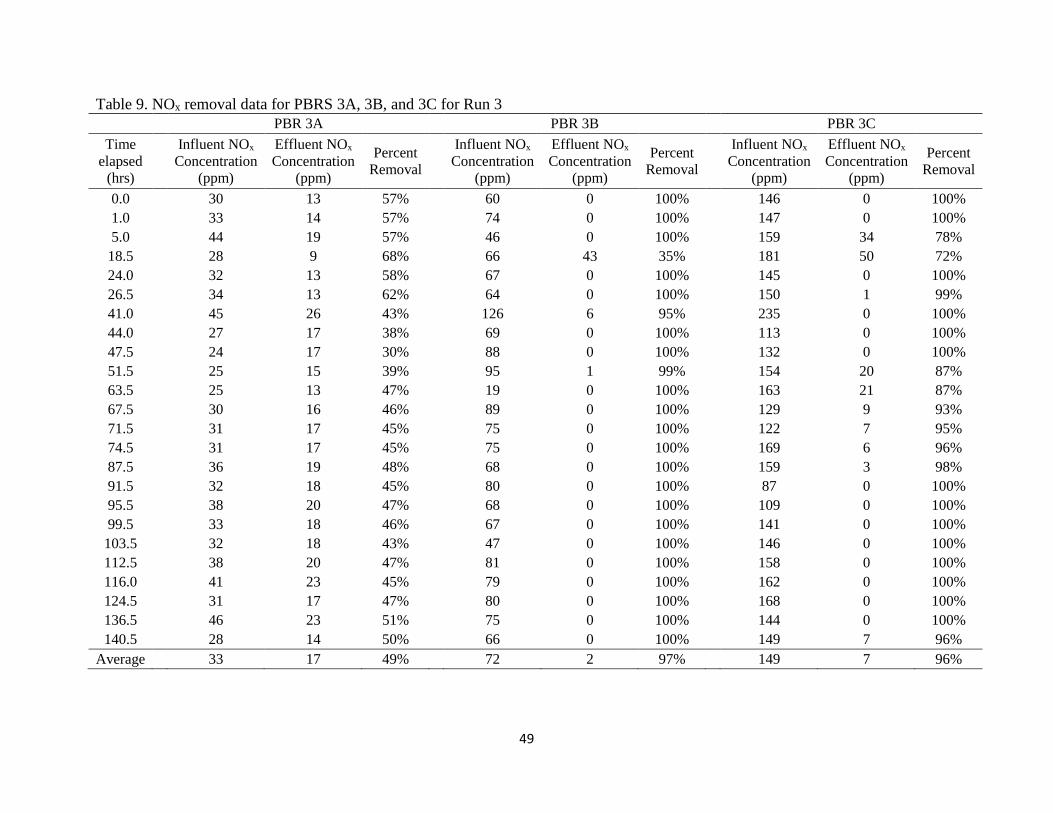
49
Table 9. NOx removal data for PBRS 3A, 3B, and 3C for Run 3
PBR 3A PBR 3B PBR 3C
Time
elapsed
(hrs)
Influent NOx
Concentration
(ppm)
Effluent NOx
Concentration
(ppm)
Percent
Removal
Influent NOx
Concentration
(ppm)
Effluent NOx
Concentration
(ppm)
Percent
Removal
Influent NOx
Concentration
(ppm)
Effluent NOx
Concentration
(ppm)
Percent
Removal
0.0 30 13 57% 60 0 100% 146 0 100%
1.0 33 14 57% 74 0 100% 147 0 100%
5.0 44 19 57% 46 0 100% 159 34 78%
18.5 28 9 68% 66 43 35% 181 50 72%
24.0 32 13 58% 67 0 100% 145 0 100%
26.5 34 13 62% 64 0 100% 150 1 99%
41.0 45 26 43% 126 6 95% 235 0 100%
44.0 27 17 38% 69 0 100% 113 0 100%
47.5 24 17 30% 88 0 100% 132 0 100%
51.5 25 15 39% 95 1 99% 154 20 87%
63.5 25 13 47% 19 0 100% 163 21 87%
67.5 30 16 46% 89 0 100% 129 9 93%
71.5 31 17 45% 75 0 100% 122 7 95%
74.5 31 17 45% 75 0 100% 169 6 96%
87.5 36 19 48% 68 0 100% 159 3 98%
91.5 32 18 45% 80 0 100% 87 0 100%
95.5 38 20 47% 68 0 100% 109 0 100%
99.5 33 18 46% 67 0 100% 141 0 100%
103.5 32 18 43% 47 0 100% 146 0 100%
112.5 38 20 47% 81 0 100% 158 0 100%
116.0 41 23 45% 79 0 100% 162 0 100%
124.5 31 17 47% 80 0 100% 168 0 100%
136.5 46 23 51% 75 0 100% 144 0 100%
140.5 28 14 50% 66 0 100% 149 7 96%
Average 33 17 49% 72 2 97% 149 7 96%
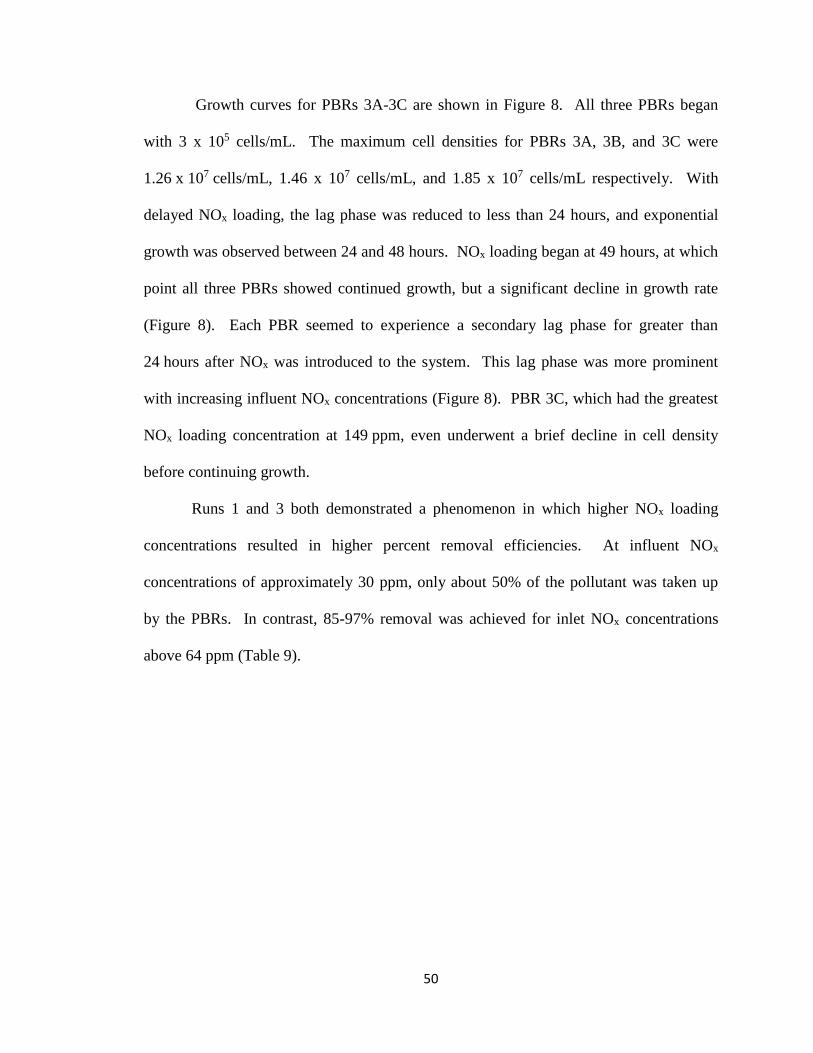
50
Growth curves for PBRs 3A-3C are shown in Figure 8. All three PBRs began
with 3 x 10⁵ cells/mL. The maximum cell densities for PBRs 3A, 3B, and 3C were
1.26 x 10⁷ cells/mL, 1.46 x 10⁷ cells/mL, and 1.85 x 10⁷ cells/mL respectively. With
delayed NOx loading, the lag phase was reduced to less than 24 hours, and exponential
growth was observed between 24 and 48 hours. NOx loading began at 49 hours, at which
point all three PBRs showed continued growth, but a significant decline in growth rate
(Figure 8). Each PBR seemed to experience a secondary lag phase for greater than
24 hours after NOx was introduced to the system. This lag phase was more prominent
with increasing influent NOx concentrations (Figure 8). PBR 3C, which had the greatest
NOx loading concentration at 149 ppm, even underwent a brief decline in cell density
before continuing growth.
Runs 1 and 3 both demonstrated a phenomenon in which higher NOx loading
concentrations resulted in higher percent removal efficiencies. At influent NOx
concentrations of approximately 30 ppm, only about 50% of the pollutant was taken up
by the PBRs. In contrast, 85-97% removal was achieved for inlet NOx concentrations
above 64 ppm (Table 9).
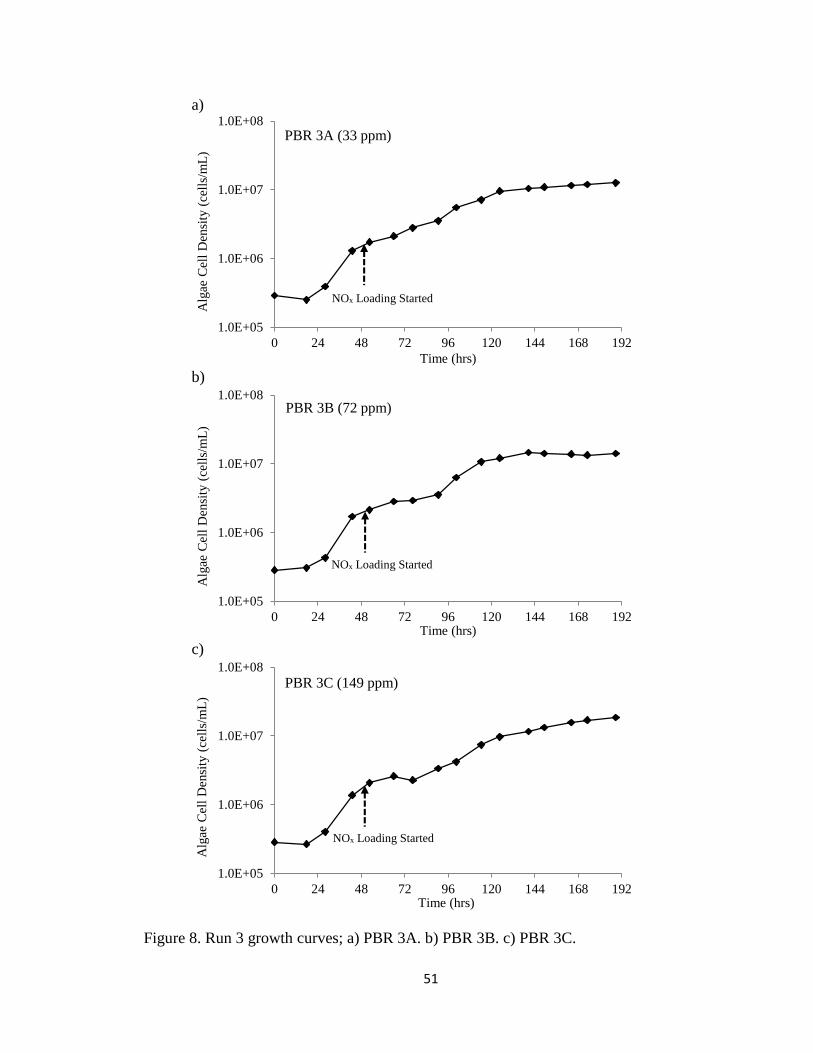
51
a)
b)
c)
Figure 8. Run 3 growth curves; a) PBR 3A. b) PBR 3B. c) PBR 3C.
1.0E+05
1.0E+06
1.0E+07
1.0E+08
0 24 48 72 96 120 144 168 192
Alg
ae C
ell
Den
sity
(ce
lls/
mL
)
Time (hrs)
PBR 3A (33 ppm)
1.0E+05
1.0E+06
1.0E+07
1.0E+08
0 24 48 72 96 120 144 168 192
Alg
ae C
ell
Den
sity
(ce
lls/
mL
)
Time (hrs)
PBR 3B (72 ppm)
1.0E+05
1.0E+06
1.0E+07
1.0E+08
0 24 48 72 96 120 144 168 192
Alg
ae C
ell
Den
sity
(ce
lls/
mL
)
Time (hrs)
PBR 3C (149 ppm)
NOx Loading Started
NOx Loading Started
NOx Loading Started
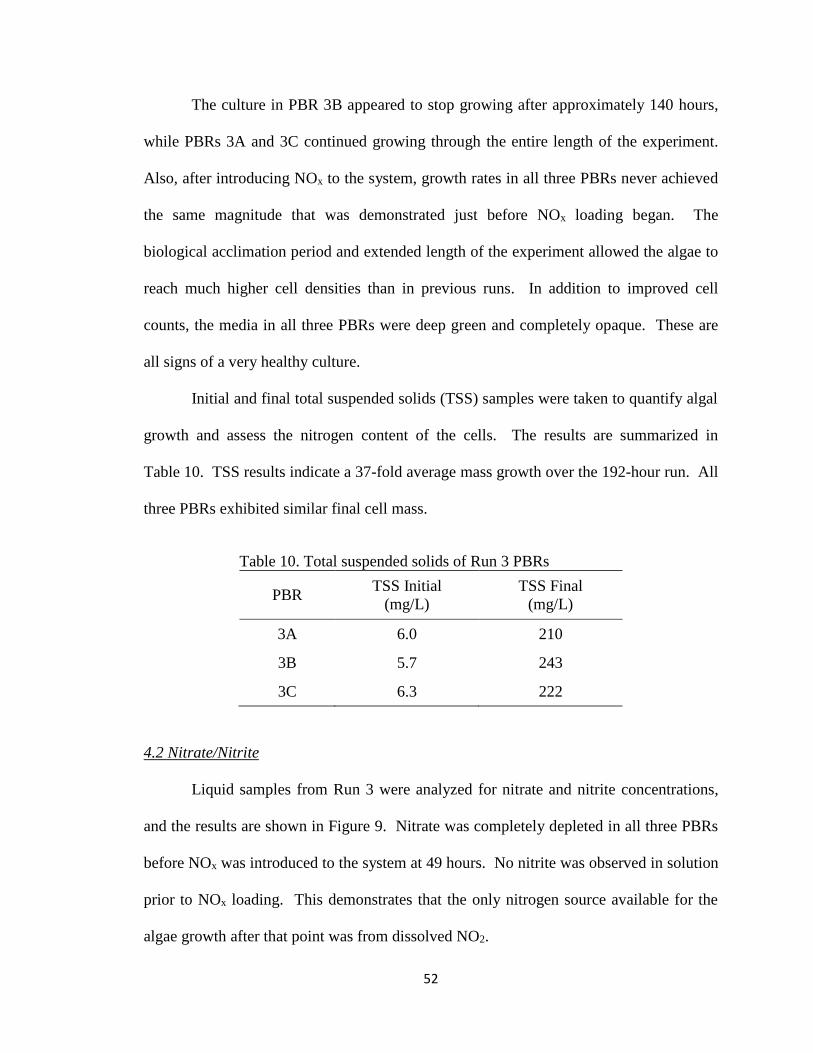
52
The culture in PBR 3B appeared to stop growing after approximately 140 hours,
while PBRs 3A and 3C continued growing through the entire length of the experiment.
Also, after introducing NOx to the system, growth rates in all three PBRs never achieved
the same magnitude that was demonstrated just before NOx loading began. The
biological acclimation period and extended length of the experiment allowed the algae to
reach much higher cell densities than in previous runs. In addition to improved cell
counts, the media in all three PBRs were deep green and completely opaque. These are
all signs of a very healthy culture.
Initial and final total suspended solids (TSS) samples were taken to quantify algal
growth and assess the nitrogen content of the cells. The results are summarized in
Table 10. TSS results indicate a 37-fold average mass growth over the 192-hour run. All
three PBRs exhibited similar final cell mass.
Table 10. Total suspended solids of Run 3 PBRs
PBR TSS Initial
(mg/L)
TSS Final
(mg/L)
3A 6.0 210
3B 5.7 243
3C 6.3 222
4.2 Nitrate/Nitrite
Liquid samples from Run 3 were analyzed for nitrate and nitrite concentrations,
and the results are shown in Figure 9. Nitrate was completely depleted in all three PBRs
before NOx was introduced to the system at 49 hours. No nitrite was observed in solution
prior to NOx loading. This demonstrates that the only nitrogen source available for the
algae growth after that point was from dissolved NO2.
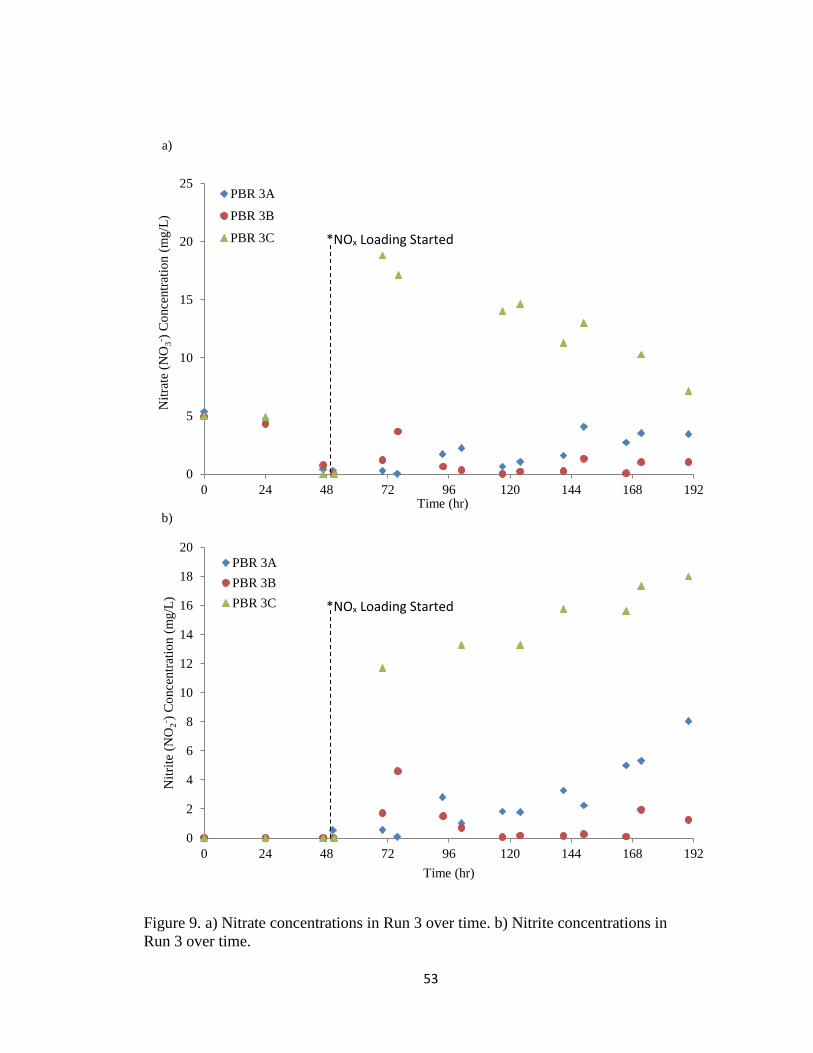
53
Figure 9. a) Nitrate concentrations in Run 3 over time. b) Nitrite concentrations in
Run 3 over time.
0
5
10
15
20
25
0 24 48 72 96 120 144 168 192
Nit
rate
(N
O3- )
Co
nce
ntr
atio
n (
mg/L
)
Time (hr)
PBR 3A
PBR 3B
PBR 3C
0
2
4
6
8
10
12
14
16
18
20
0 24 48 72 96 120 144 168 192
Nit
rite
(N
O2
- ) C
once
ntr
atio
n (
mg/L
)
Time (hr)
PBR 3A
PBR 3B
PBR 3C
*NOx Loading Started
a)
b)
*NOx Loading Started
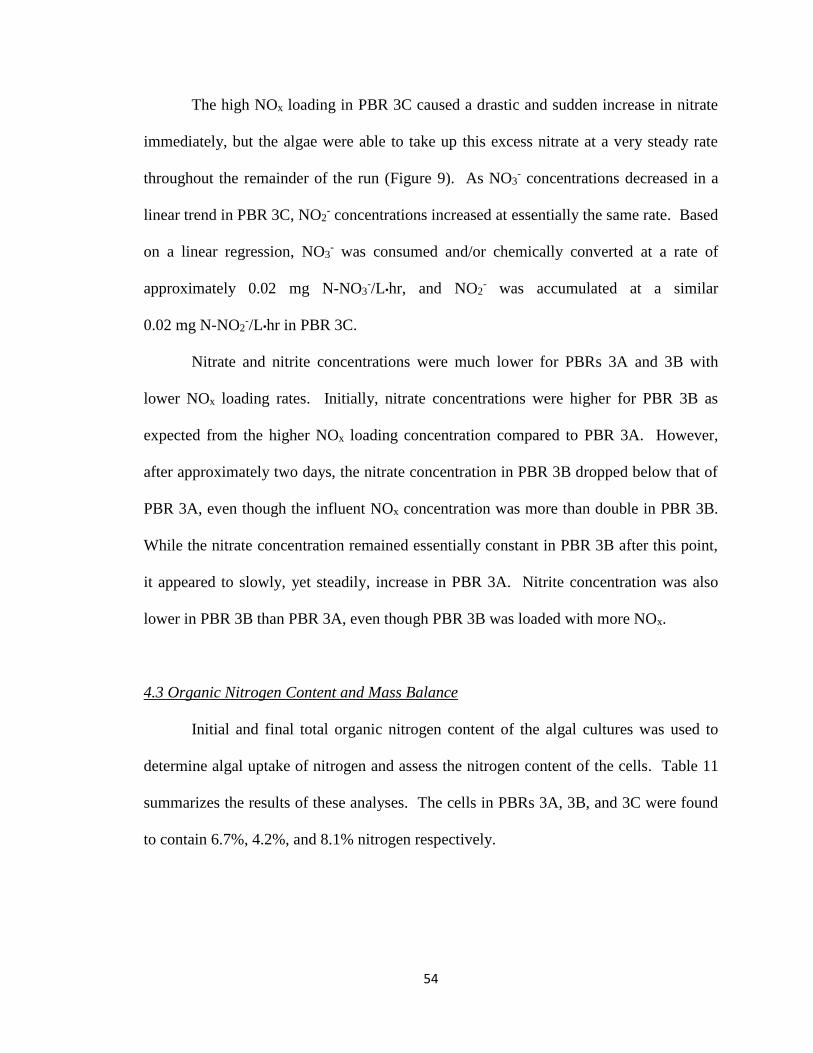
54
The high NOx loading in PBR 3C caused a drastic and sudden increase in nitrate
immediately, but the algae were able to take up this excess nitrate at a very steady rate
throughout the remainder of the run (Figure 9). As NO3- concentrations decreased in a
linear trend in PBR 3C, NO2- concentrations increased at essentially the same rate. Based
on a linear regression, NO3- was consumed and/or chemically converted at a rate of
approximately 0.02 mg N-NO3-/L•hr, and NO2
- was accumulated at a similar
0.02 mg N-NO2-/L•hr in PBR 3C.
Nitrate and nitrite concentrations were much lower for PBRs 3A and 3B with
lower NOx loading rates. Initially, nitrate concentrations were higher for PBR 3B as
expected from the higher NOx loading concentration compared to PBR 3A. However,
after approximately two days, the nitrate concentration in PBR 3B dropped below that of
PBR 3A, even though the influent NOx concentration was more than double in PBR 3B.
While the nitrate concentration remained essentially constant in PBR 3B after this point,
it appeared to slowly, yet steadily, increase in PBR 3A. Nitrite concentration was also
lower in PBR 3B than PBR 3A, even though PBR 3B was loaded with more NOx.
4.3 Organic Nitrogen Content and Mass Balance
Initial and final total organic nitrogen content of the algal cultures was used to
determine algal uptake of nitrogen and assess the nitrogen content of the cells. Table 11
summarizes the results of these analyses. The cells in PBRs 3A, 3B, and 3C were found
to contain 6.7%, 4.2%, and 8.1% nitrogen respectively.
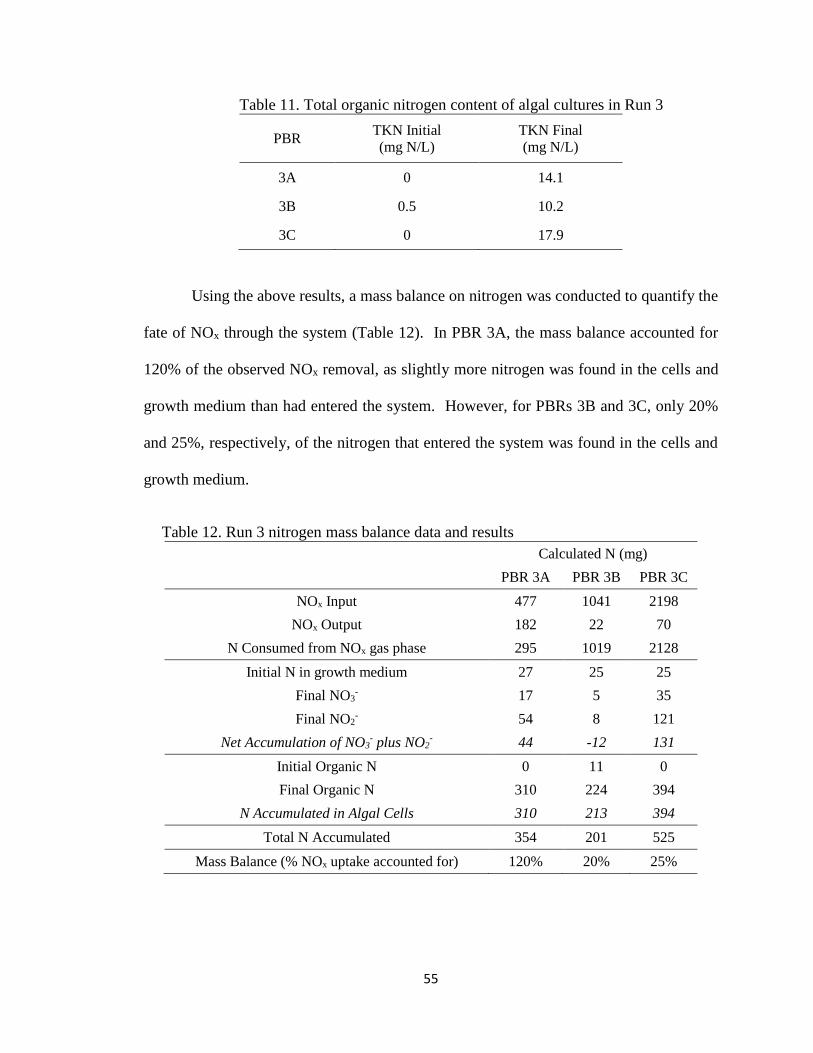
55
Table 11. Total organic nitrogen content of algal cultures in Run 3
PBR TKN Initial
(mg N/L)
TKN Final
(mg N/L)
3A 0 14.1
3B 0.5 10.2
3C 0 17.9
Using the above results, a mass balance on nitrogen was conducted to quantify the
fate of NOx through the system (Table 12). In PBR 3A, the mass balance accounted for
120% of the observed NOx removal, as slightly more nitrogen was found in the cells and
growth medium than had entered the system. However, for PBRs 3B and 3C, only 20%
and 25%, respectively, of the nitrogen that entered the system was found in the cells and
growth medium.
Table 12. Run 3 nitrogen mass balance data and results
Calculated N (mg)
PBR 3A PBR 3B PBR 3C
NOx Input 477 1041 2198
NOx Output 182 22 70
N Consumed from NOx gas phase 295 1019 2128
Initial N in growth medium 27 25 25
Final NO3- 17 5 35
Final NO2- 54 8 121
Net Accumulation of NO3- plus NO2
- 44 -12 131
Initial Organic N 0 11 0
Final Organic N 310 224 394
N Accumulated in Algal Cells 310 213 394
Total N Accumulated 354 201 525
Mass Balance (% NOx uptake accounted for) 120% 20% 25%
56
5. DISCUSSION
5.1 NOx Feed System
Loading NOx at a consistent concentration proved to be very difficult for the first
two runs, as can be seen by the large standard deviations in Table 6. For the first two
runs, NOx was supplied from a cylinder of pure NO2, and then the vapors from this liquid
were pumped into the PBRs using peristaltic pumps. This method was unreliable due to
the large deviations in concentration, so Run 3 was operated using calibration gases. The
loading ratio (NO2:NO) was low and varied largely for the first two runs. Considering no
NO was purposely included in the influent gas stream, all the NO that appeared was due
to natural chemical reactions, which made the ratio uncontrollable. Much more NO was
created when using pure NO2 as the feed gas than was created when using dilute NO2
calibration gas as shown by the large loading ratios for PBRs 3A, 3B, and 3C in Table 6.
Once calibration gases were used, the influent NO2 and NO concentration were fairly
consistent, with NO comprising about 4% of the NOx stream. Because of the NOx feed
issues with Runs 1 and 2, removal data analysis will only be considered for Run 3.
5.2 NOx Removal
Run 3 resulted in NOx removal rates of 96-97% for PBRs 3B and 3C, which had
the highest NOx loading rates. In contrast, only 49% NOx removal was achieved in
PBR 3A, which had the lowest NOx loading rate. The only difference in the three PBRs
during Run 3 were the NOx loading rates. With everything else identical, it can be
hypothesized that varying mass transfer rates cause better removal efficiencies. The
smaller concentration gradient between the inlet gas and the aqueous solution may have
reduced mass transfer rates, effectively reducing NOx removal. This is difficult to
57
rationalize, however, because one would expect the algae to more easily uptake smaller
amounts of NO3-. The large discrepancies in the mass balances for PBRs 3B and 3C may
also demonstrate a possible lab anomaly. Nonetheless, no definitive explanation has been
found to support the outcome of higher loading concentration resulting in higher removal
rates. These results will require more data to substantiate the mass transfer rates and their
dependency on concentration gradient.
The conditions in each PBR, including light, temperature, and pH, all showed
equal variability and were all well within range of each other. In addition, Figure 8
shows comparable algal growth in all three reactors. However, the nitrogen uptake by the
algae in PBR 3A appears to have been limited, which might explain the low NOx removal
observed. Figure 9 shows that aqueous nitrate and nitrite concentrations in PBR 3A were
higher than those measured in PBR 3B, even though more NOx was loaded to PBR 3B.
Something appears to have limited the ability for the algae to take up nitrogen in
PBR 3A, which will be explored further in later sections.
5.3 Cell Growth
The results of PBR 1A showed that an increase in algal cell growth was
associated with increased NOx removal rates, supporting the hypothesis that algal growth
facilitates NOx removal. Algal growth consumes dissolved NO3- as a nitrogen source.
Reduced concentrations of dissolved NO3- allows reaction rates of NO2 (aq) to NO3
- (aq)
to increase based on Reaction 1.
NO2(g) ↔ NO2(aq) ↔ NO3−(aq) + NO2
−(aq) (1)
58
This would result in a decreased concentration of NO2 (aq) which would increase the
mass transfer of NO2 from the gas to liquid phase, effectively increasing removal of
gaseous NOx.
NOx loading had numerous effects on the observed growth of algae. The
biological crash that was observed in PBR 1A can be blamed on the sudden drop in pH
caused by high NOx loading rates. After 13.5 hours, the pH in this PBR had dropped to
3.8, and ultimately reached a minimum pH of 2.9, until experimental adjustments were
made. According to Rachlin and Grosso (1991), growth of Chlorella vulgaris is
substantially retarded at such low pH. After approximately 65 hours, sodium bicarbonate
was used to adjust the pH in PBR 1A up to 6.7 to examine the effect of pH on cell growth
and NOx removal. Adjusting the pH to more neutral conditions stimulated some growth
in the PBR, as shown in Figure 6a, and increased NOx removal. The average removal
rate for the first 65 hours of operation was 38%. After pH adjustments were made,
average NOx removal for the final 25 hours was 53%.
Allowing the algae to acclimate to the PBR environment and conditions in Run 3,
and allowing the culture to reach a substantial cell density before exposing it to
potentially toxic NOx loading, resulted in higher initial growth rates. Consequently, the
average specific growth rate for the first 48 hours in PBRs 3A, 3B, and 3C was
0.035 hr-1, 0.039 hr-1, and 0.036 hr-1 respectively. In contrast, the average specific growth
rates for the same period in PBRs 1B and 1C were both negative, signifying an overall
decay in cells. This suggests that the algae are initially shocked by the introduction of
NOx. The cells will eventually adapt to NOx as a food source and continue to grow, but
this comes after an extended lag phase as shown in the growth curves of Figure 6.
59
The initial shock of NOx loading is further represented by the growth curves of
Run 3 in Figure 8. Although the algae continued to grow, a decline in growth rate was
observed immediately after introducing NOx, even after allowing the algae to properly
acclimate. After introducing NOx, growth rates began to decline in all three PBRs and
never achieved the same magnitude as before NOx loading began. The extent of decline
is proportional to the concentration of NOx entering the system. In other words, higher
NOx concentrations resulted in lower growth of the algae initially. This effect lasted for
approximately 48 hours after NOx loading, after which the inlet concentration of NOx
appeared to have no effect on algal growth. Therefore, it took approximately 48 hours
for the algae to adapt to their new nitrogen source. Once adapted, the concentration of
NOx was no longer a growth inhibitor.
In addition to environmental acclimation, other factors were adjusted in Run 3 to
enhance algal growth. Unlike the first two runs, the pH never became acidic in any of the
three PBRs in Run 3, and in general, pH remained in the optimum range of 7.5-8.0. The
installation of heaters for Run 3 also ensured the temperatures were much warmer for the
algae than in previous runs. Light was also enhanced, providing more photosynthetic
energy for the algae to grow. Since all changes were made at once, it is impossible to
determine which change had the greatest effect on algae growth. At this point it can only
be concluded that consistent and non-extreme conditions, as well as sufficient cell density
before NOx loading, are favorable to avoid culture crashes. Further experiments should
be conducted, changing one variable at a time, to determine precise optimal conditions
and how to accurately maintain them.
60
5.4 Nitrate/Nitrite
The algae were able to take up all nitrate in solution before NOx was introduced
into the PBRs. The only source of nitrogen available to the algae after approximately
48 hours was from NOx. The fact that the algae continued to grow for the last 144 hours
of Run 3 is proof that the algae was able to grow on NOx as a nitrogen source. The
steady decline in NO3- concentrations and accumulation of NO2
- in PBR 3C suggests that
the algae preferred NO3- as its nitrogen source over NO2
-. PBRs 3A and 3B do not show
this as clearly. Although all three PBRs in Run 3 showed an accumulation of NO2-, PBR
3A also showed a slight accumulation in NO3-, and PBR 3B showed a relatively steady
NO3- concentration. The NO2
- may have accumulated because the algae were only taking
up NO3- as a nitrogen source. Another possible explanation may be, as noted in Section
2.5, that only NO2 is capable of forming NO3-, while both NO2 and NO can react with
water to form NO2-, resulting in excess nitrite. Because of the differing nitrate and nitrite
concentrations in each of the PBRs, and the chemistry of aqueous nitrogen oxides, it
cannot be conclusively determined whether the algae used NO3-, NO2
-, or both as their
nitrogen sources.
Substantial and steady growth in all three PBRs in Run 3 demonstrates neither
NO3- nor NO2
- were ever a limiting constituent. Also, with steady removal efficiencies in
PBRs 3B and 3C, the PBRs never reached their saturation limit of aqueous NO2. The
higher NO3- concentrations in PBR 3C theoretically decreased the reaction rate of
aqueous NO2 to NO3- and caused an accumulation of dissolved NO2. If saturation were
achieved, further dissolution of NO2 would have been unfavorable, and gaseous NO2
would have passed through the system and into the exhaust, decreasing removal rates.
61
5.5 Nitrogen Mass Balance
The mass balance on nitrogen for the treatment system was relatively accurate for
PBR 3A, but most of the nitrogen could not be accounted for in PBRs 3B and 3C. The
mass balance for PBRs 3B and 3C (with high observed NOx removals) only accounted
for 20% and 25% of the nitrogen consumed from gaseous NOx. Numerous potential
explanations for the poor mass balance results for PBRs 3B and 3C were explored. The
following are the most likely explanations:
Gas leaks
One possible source of error is potential gas leaks on both the inlet and outlet
ports. Although inlet flow rate was sampled at regular intervals and leak tests were
administered periodically, a leak between the sample port and PBR inlet is possible. Exit
flow rates were measured at approximately 27% lower than their respective inlet flow
rates. If this leak occurred in the short stretch of tubing between the sample port and
PBR inlet, 27% less NOx would have been entering the measurement system than was
measured, therefore inflating removal percentages. However, if inlet flow rates were
adjusted to the measured outlet flow rates to account for leaks, the 27% difference in flow
corresponds to a 14% difference in nitrogen removal in PBR 3A, and only a 1-2%
difference in NOx removal rates for PBRs 3B and 3C.
The drastic differences in the amount of organic nitrogen accumulated in the
biomass and in solution and the difference in organic nitrogen in the influent and effluent
gas concentrations was not likely due to inaccurate flow measurements and potential
leaks. The differences are too severe to be accounted for, as shown in the analyses
above. Other possible explanations for the poor mass balances are described below.
62
Total Kjeldahl Nitrogen errors
The complex procedures followed to determine Total Kjeldahl Nitrogen may have
been a source of significant error in calculating the nitrogen balance for the PBRs. In
addition, the APHA Standard Method 4500-NorgB suggests that if an immediate analysis
is not possible, the sample should be preserved by acidifying and storing at 4°C
(APHA, 1995). While the samples were acidified appropriately, they were not
immediately refrigerated. It is thus possible that the inaccurate mass balance was due to
experimental error in the TKN analysis.
Other forms of nitrogen not accounted for
Another likely explanation for the poor mass balances is other forms of nitrogen
in the system that were not accounted for in measuring nitrogen compounds. This could
include either aqueous nitrogen compounds in solution or gaseous forms of nitrogen
oxides other than NO2 and NO in the effluent streams, among others. Some likely
compounds could include aqueous NH4+ in solution or gaseous N2O4 in the effluent gas
stream. Neither of these nitrogen compounds were measured during experimentation, but
are potential intermediates in the known reaction chemistries of NO and NO2. The
measured forms of NOx have rather complex chemistries in both the aqueous and gaseous
phases, so large concentrations of alternate forms of nitrogen could explain the large
variability in the mass balances of PBRs 3B and 3C.
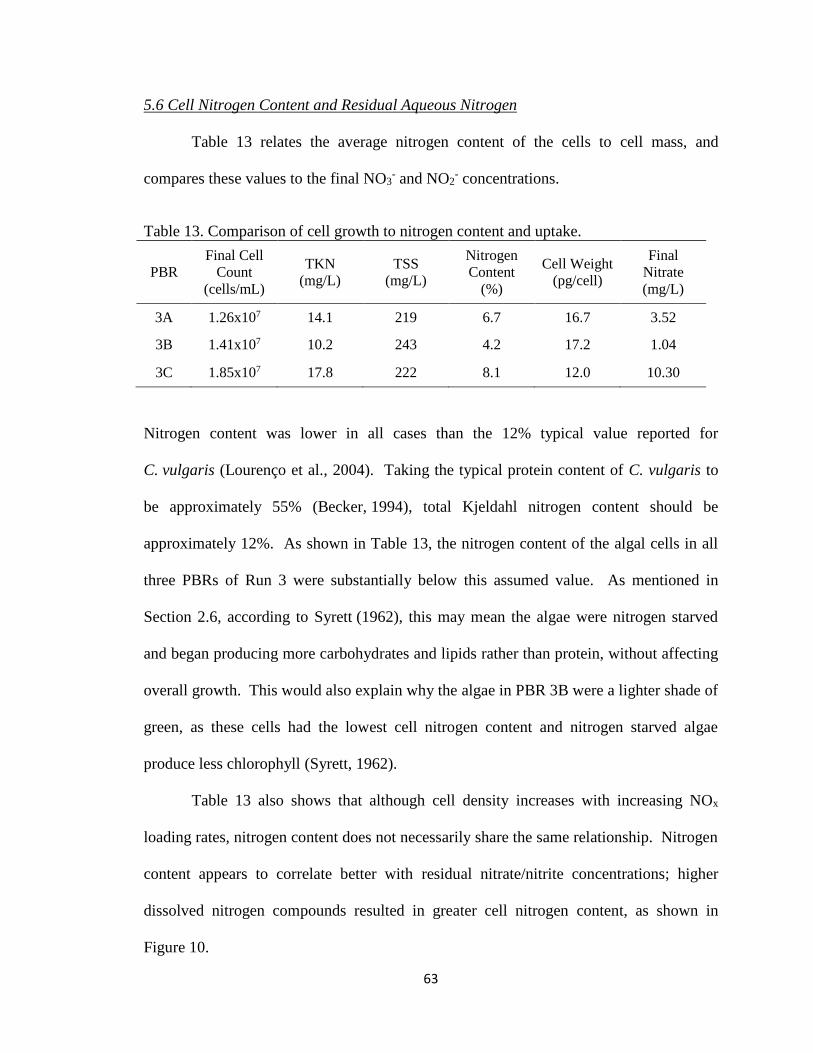
63
5.6 Cell Nitrogen Content and Residual Aqueous Nitrogen
Table 13 relates the average nitrogen content of the cells to cell mass, and
compares these values to the final NO3- and NO2
- concentrations.
Table 13. Comparison of cell growth to nitrogen content and uptake.
PBR
Final Cell
Count
(cells/mL)
TKN
(mg/L)
TSS
(mg/L)
Nitrogen
Content
(%)
Cell Weight
(pg/cell)
Final
Nitrate
(mg/L)
3A 1.26x10⁷ 14.1 219 6.7 16.7 3.52
3B 1.41x10⁷ 10.2 243 4.2 17.2 1.04
3C 1.85x10⁷ 17.8 222 8.1 12.0 10.30
Nitrogen content was lower in all cases than the 12% typical value reported for
C. vulgaris (Lourenço et al., 2004). Taking the typical protein content of C. vulgaris to
be approximately 55% (Becker, 1994), total Kjeldahl nitrogen content should be
approximately 12%. As shown in Table 13, the nitrogen content of the algal cells in all
three PBRs of Run 3 were substantially below this assumed value. As mentioned in
Section 2.6, according to Syrett (1962), this may mean the algae were nitrogen starved
and began producing more carbohydrates and lipids rather than protein, without affecting
overall growth. This would also explain why the algae in PBR 3B were a lighter shade of
green, as these cells had the lowest cell nitrogen content and nitrogen starved algae
produce less chlorophyll (Syrett, 1962).
Table 13 also shows that although cell density increases with increasing NOx
loading rates, nitrogen content does not necessarily share the same relationship. Nitrogen
content appears to correlate better with residual nitrate/nitrite concentrations; higher
dissolved nitrogen compounds resulted in greater cell nitrogen content, as shown in
Figure 10.
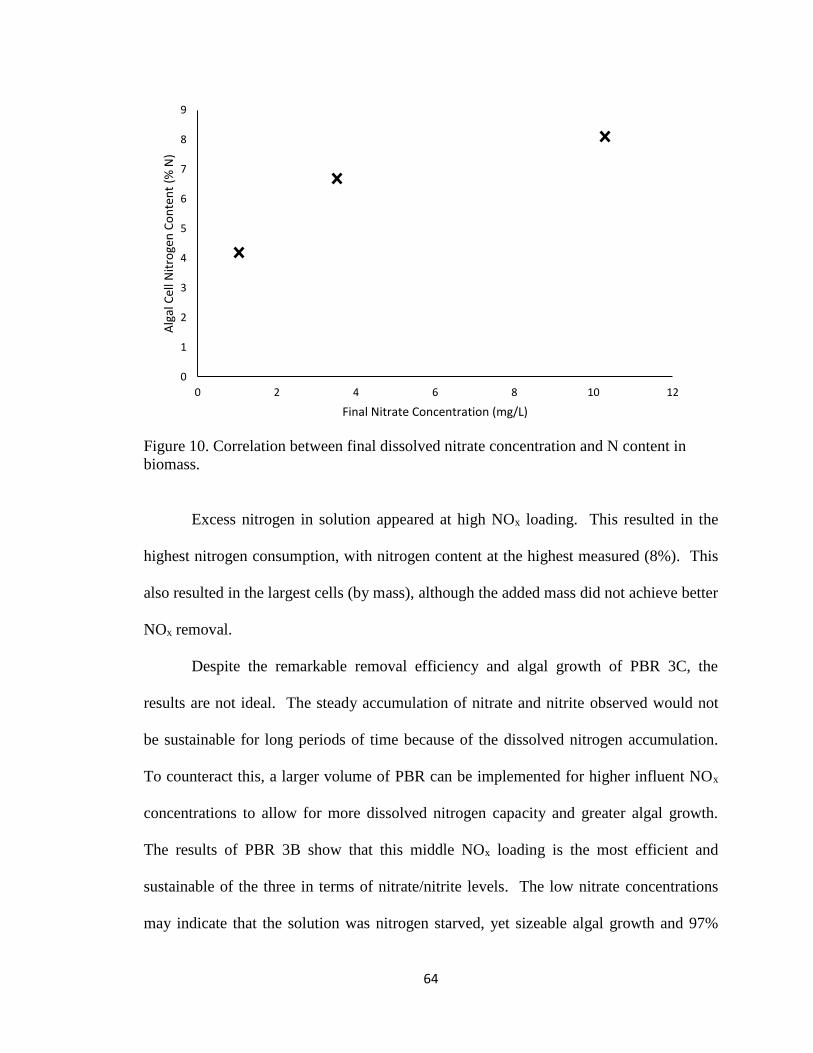
64
Figure 10. Correlation between final dissolved nitrate concentration and N content in
biomass.
Excess nitrogen in solution appeared at high NOx loading. This resulted in the
highest nitrogen consumption, with nitrogen content at the highest measured (8%). This
also resulted in the largest cells (by mass), although the added mass did not achieve better
NOx removal.
Despite the remarkable removal efficiency and algal growth of PBR 3C, the
results are not ideal. The steady accumulation of nitrate and nitrite observed would not
be sustainable for long periods of time because of the dissolved nitrogen accumulation.
To counteract this, a larger volume of PBR can be implemented for higher influent NOx
concentrations to allow for more dissolved nitrogen capacity and greater algal growth.
The results of PBR 3B show that this middle NOx loading is the most efficient and
sustainable of the three in terms of nitrate/nitrite levels. The low nitrate concentrations
may indicate that the solution was nitrogen starved, yet sizeable algal growth and 97%
0
1
2
3
4
5
6
7
8
9
0 2 4 6 8 10 12
Alg
al C
ell N
itro
gen
Co
nte
nt
(% N
)
Final Nitrate Concentration (mg/L)
65
NOx removal demonstrates that this did not affect growth and efficiency. Instead, PBR
3B appeared to take up nitrogen most efficiently, assimilating nitrate at the same rate
NO2 was dissolving and dissociating into the system. Based on nitrate concentrations in
solution, the cells were able to assimilate the nitrogen most effectively while maintaining
the greatest mass density.
5.7 Removal Mechanisms
To determine possible explanations as to why lower NOx loading concentration
resulted in lower removal rates, the data from Run 3 were analyzed in more detail. Run 3
proved to be the most consistent in terms of both experimental conditions and data
obtained. Again, three possible mechanisms were explored, including mass transfer,
chemical reactions to form nitrate, and biological uptake.
The limitations do not appear to be chemical in nature, as it can be assumed that
the saturation point of aqueous NO2 was never reached in any of the three PBRs, and
Reaction 1 progressed in the forward direction to produce nitrate.
NO2(g) ↔ NO2(aq) ↔ NO3−(aq) + NO2
−(aq) (1)
If saturation had been reached, a decrease in removal rates toward the end of the run
would have been witnessed, as undissolved NO2 would have passed directly through the
system and into the exhaust. This would have been particularly true in PBR 3B, which
had the greatest overall accumulation of nitrate and nitrite. The high nitrate/nitrite
concentrations would have prevented the equilibrium of Reaction 1 to proceed in the
forward direction, and dissolved NO2 would have accumulated and saturated the solution.
Because no such decrease in removal rate was seen in PBR 3C, chemical saturation
66
and/or the inability for aqueous NO2 to oxidize/reduce, could not have been the limiting
factor in NOx removal.
Based on the algal growth results of Run 3, it appears that the limitation is not
entirely from biological growth, but possibly some other biological factor. All three
PBRs grew comparably well no matter the conditions or loading NOx concentrations.
Biological growth was more dependent on environmental conditions (such as pH,
temperature, and acclimation) than the amount of NOx loaded into the system. This also
eliminates the possibility of NOx toxicity. If NOx was indeed toxic, higher concentrations
would have resulted in poorer overall growth rates. While NOx loading did initially
cause a decline in cell growth, this may be attributed to environmental acclimation. The
fact that the algae grew just as well, if not slightly better, with higher loading
concentrations, shows that the limitations to the system are not biological, in terms of
pure algal growth. While algal growth was not directly a factor in differing removal
rates, various other biological effects may have prevented the algae from efficiently
assimilating nitrogen, indirectly affecting NOx removal.
Mass transfer limitations seem to be the most likely cause of the large discrepancy
in NOx removal between the PBR 3A and the other two PBRs in Run 3. No
enhancements were made to increase mass transfer for this study. The dissolution of NO2
into solution is partially dependent on the concentration gradient between the inlet gas
stream and aqueous nitrogen oxide. This difference was least in PBR 3A. Further
studies should optimize mass transfer to validate the effect of concentration gradient on
NOx removal.
67
Based on the results of these preliminary experiments, it can be concluded that the
limiting factors in NOx removal are a combination of biological nitrate uptake and/or
mass transfer rates. The slower uptake of nitrate by the algae caused an increase in
nitrate concentration, effectively decreasing the driving force for mass transfer of NO2
from the gaseous to aqueous phases.
68
6. CONCLUSIONS
One of the primary purposes of this study was to test the hypothesis that C.
vulgaris can grow on nitrogen from dissolved NO2 as its sole nitrogen source for cell
synthesis. C. vulgaris grew substantially using only nitrate and/or nitrite generated by
NOx dissolution for cell synthesis, formed through Reaction 1, reaching a maximum cell
density of 1.85 x 10⁷ cells/mL (a 60-fold increase in cell density).
NO2(g) ↔ NO2(aq) ↔ NO3−(aq) + NO2
−(aq) (1)
This growth and assimilation of nitrogen allowed continual dissolution of NO2 into
solution, resulting in NOx removal rates of up to 97%.
Although a major accomplishment, this pilot study simply shows a proof of
concept. An anomaly emerged in the study in which one PBR with lower NO2 loading
concentrations resulted in lower NOx removal rates. For this PBR, nitrate was not
assimilated as efficiently as a similar PBR with greater NOx loading. For the third run of
the study, conditions in all three photobioreactors (i.e. light, temperature, pH, etc.) were
comparable with reasonable precision. Light was identical, all reactors had an average
temperature of approximately 22°C, and average pH ranged from 8.0-8.5. The only
observable and substantial difference between the reactors was the concentration of
influent NOx.
In Run 3, cell growth by mass was between 200 mg/L to 240 mg/L. Nitrogen was
removed from gaseous NOx at a rate of 0.07 – 0.49 mg N/mg cell growth. Assuming a
600-MW natural gas fired power plant can produce up to 1,600,000 m3/hr of flue gas
with approximately 40 ppm NOx concentrations (Mimura, 1997), growth of a minimum
of 75 kg algal cells/hr would be required to effectively treat this stream. One power plant
69
could therefore produce about 660,000-kg of C. vulgaris per year treating its NOx
emissions. This could provide a substantial revenue stream if food-grade algae is
produced in the treatment.
Further studies should be completed to determine the true limitations to NOx
removal by C. vulgaris and identify optimal conditions. This should include optimization
of reactor geometry, enhanced environmental conditions for algal growth, and testing of
large scale reproducibility. Any further study should focus on eliminating as many
variables as possible and optimizing the system for NOx removal.
Enhancing the geometry of the PBR will allow for the optimization of the mass
transfer rates of NOx from the gaseous to aqueous phases. This can also be accomplished
through adjusting the sparger’s bubble size and increasing bubble residence time. By
ensuring the maximum amount of NOx is dissolving in the system, other limitations of
the treatment method can be better determined.
In addition, optimization of algal growth conditions can further help narrow the
scope of possible limitations. By ensuring light, pH, and temperature conditions are
optimal for the particular strain of algae used, any biological limitations can be reduced.
If environmental conditions allow the algae to grow to their maximum potential, then the
only effect on algal growth will theoretically be from outside sources, such as possible
NOx toxicity or inability to assimilate a particular nitrogen source. Sufficient cell density
should exist before any NOx loading is introduced. Future studies should take this a step
further to determine the minimum cell density required to overcome any growth
inhibition caused by NOx. This will minimize the time and resources necessary to
achieve effective removal.
70
To determine the actual feasibility of using algae to treat nitrogen oxides, actual
conditioned flue gas should be used in future experiments. This will determine whether
any additional components in flue gas have an inhibitory effect or otherwise prevent the
inlet stream from being conditioned (e.g. SOx). Using flue gas with steady NOx
concentrations and NO2:NO ratios will prevent problems with loading fluctuations as
witnessed in this study. Adding NO to the system may make the gas more difficult to
treat because of the poor solubility of NO. A pre-treatment oxidation process may help
increase removal efficiencies by oxidizing the NO to the more soluble NO2.
If true flue gas cannot be obtained, it is advised that NO be loaded in addition to
NO2 to more accurately simulate real world conditions. In this case, to avoid
fluctuations, a larger system with higher flow rates should be tested. With higher flow
rates, the low NOx concentrations required will be much easier to obtain without the use
of peristaltic pumps or highly sensitive valves that proved significant obstacles in the
above experiments.
As also shown in this study, it may be difficult to control the ratio of NO2 to NO.
NO appeared in the inlet gas in varying concentrations even though no NO was
intentionally loaded into the system. Due to the unstable nature of both NO and NO2, the
two constituents are constantly converting back and forth to and from one another. This
would be true no matter what source of NOx is used. The instability of NOx may
therefore present an insurmountable limitation to this treatment method, largely due to
the insoluble nature of NO. If NO dominates over NO2, removal rates will decrease no
matter how optimized the system may be. Therefore, an appropriate and reliable
conditioning method, as well as a delivery system completely isolated from the
71
environment with constant temperature and pressure, will be needed to ensure that NOx
ratios always favor NO2.
Beyond optimization of these factors, the next step should include a scale-up of
the model and a cost analysis to determine whether a full scale system is economically
feasible. The actual size of a system used in real world power-plant applications would
require extremely large volumes, depending on the flue gas production. In this research,
nitrogen was removed at a rate of between 15 – 106 mg N/L in the 20-L PBR. Assuming
a 1,600,000 m3/hr stream of flue gas with approximately 40 ppm NOx concentration
(Mimura, 1997) and similar removal efficiencies with a scale up, a full scale system to
treat nitrogen oxides from a 600-MW natural gas fired power plant using algae would
require 50,000-m3 of photobioreactors. For this scale-up, algae would need to be
harvested every 140 hours, as with the experimentation presented above. The ability to
scale these parameters depends on various factors, including the ability to grow and
harvest the algae, mass transfer rates, geometry of the photobioreactors, cell densities,
and many other factors. Future studies would require testing these variables to determine
the minimum volume capable of treating an actual flue gas stream to minimize the
footprint and reduce the cost of this treatment method.
To maximize its effectiveness, this method of NOx treatment should be optimized
and implemented as soon as possible for power plants to utilize the technology to stay in
compliance with more stringent future emission standards. Overall, with appropriate
environmental conditions and land area, the treatment of NOx in photobioreactors using
C. vulgaris could provide an effective and possibly inexpensive method of meeting NOx
emission standards.
72
REFERENCES
Airgas (2013a). Nitric Oxide; MSDS 001039 [Online]; Retrieved November 1, 2013
from http://www.airgas.com/documents/pdf/001039.pdf.
Airgas (2013b). Nitrogen Dioxide; MSDS 001041 [Online]; Retrieved November 1, 2013
from http://www.airgas.com/documents/pdf/001041.pdf.
Barsanti, L., & Gualtieri, P. (2006). Algae: Anatomy, Biochemistry, and Biotechnology.
Boca Raton: Taylor & Francis Group.
Becker, E. W. (1994). Microalgae: Biotechnology and microbiology. Cambridge:
Cambridge University Press.
Belasco, W. (1997). Algae Burgers for a Hungry World? The Rise and Fall of Chlorella
Cuisine. Technology and Culture, 38(3), 608-634.
Blaszczak, R., & Cox, L. (1999). Nitrogen oxides (NOx): Why and how they are
controlled. (United States, US EPA, Office of Air Quality Planning and
Standards). Research Triangle Park, NC: U.S. Environmental Protection Agency,
Office of Air Quality Planning and Standards, Information Transfer and Program
Integration Division, Clean Air Technology Center.
Brown, L. (1996). Uptake of carbon dioxide from flue gas by microalgae. Energy
Conversion and Management, 37(6-8), 1363-1367.
Cheung, J. L., Li, Y. Q., Boniface, J., Shi, Q., Davidovits, P., Worsnop, D. R., … Kolb,
C. E. (2000). Heterogeneous Interactions of NO2 with Aqueous Surfaces. The
Journal of Physical Chemistry A, 104(12), 2655-2662.
Environmental Protection Agency (EPA), Office of Air Quality Planning and Standards
and Office of Air and Radiation. (1995). Compilation of Air Pollutant Emission
Factors (Vol. I). Research Triangle Park, NC.
73
Environmental Protection Agency (EPA). (2012). Clean Air Interstate Rule - Basic
Information. Retrieved November 09, 2013, from
http://www.epa.gov/cair/basic.html
Environmental Protection Agency (EPA). (2013a). Climate Change: Basic Information.
Retrieved September 15, 2013, from http://www.epa.gov/climatechange/basics/
Environmental Protection Agency (EPA). (2013b). Nitrogen Dioxide. Retrieved February
02, 2013 from http://www.epa.gov/air/nitrogenoxides/.
Gebicka, L., & Stawowska, K. (2012). Spectrophotometric studies of the reaction of
quercetin with peroxynitrite at different pH. Central European Journal of
Chemistry, 10(1), 187-193.
Hauck, J. T., Olson, G. J., Scierka, S. J., Perry, M. B., & Ataai, M. M. (1996). Effects of
Simulated Flue Gas on Growth of Microalgae. (U.S., Department of Energy,
Pittsburgh Energy Technology Center). Pittsburgh, PA.
Jin, Y., Veiga, M. C., & Kennes, C. (2005). Bioprocesses for the removal of nitrogen
oxides from polluted air. Journal of Chemical Technology &
Biotechnology, 80(5), 483-494.
Julin, J., Shiraiwa, M., Miles, R. E., Reid, J. P., Pöschl, U., & Riipinen, I. (2013). Mass
Accommodation of Water: Bridging the Gap Between Molecular Dynamics
Simulations and Kinetic Condensation Models. The Journal of Physical
Chemistry A, 117(2), 410-420.
Kharitonov, V. G., Sundquist, A. R., & Sharma, V. S. (1994). Kinetics of Nitric Oxide
Autoxidation in Aqueous Solution. The Journal of Biological Chemistry, 269(8),
5881-5883.
Lee, Y. N., & Schwartz, S. E. (1981). Reaction kinetics of nitrogen dioxide with liquid
water at low partial pressure. The Journal of Physical Chemistry, 85(7), 840-848.
Lewis, R. S., & Deen, W. M. (1994). Kinetics of the Reaction of Nitric Oxide with
Oxygen in Aqueous Solutions. Chemical Research in Toxicology, 7(4), 568-574.
74
Lourenço, S. O., Barbarino, E., Lavin, P. L., Lanfer Marquez, U. M., & Aidar, E. (2004).
Distribution of intracellular nitrogen in marine microalgae: Calculation of new
nitrogen-to-protein conversion factors. European Journal of Phycology, 39(1),
17-32.
MacDonald, J. A. (2003, October). Power Plant Emissions Controls NOx Reduction
Technologies & Systems. Energy-Tech.
Maeda, K., Owada, M., Kimura, N., Omata, K., & Karube, I. (1995). CO2 fixation from
the flue gas on coal-fired thermal power plant by microalgae. Energy Conversion
and Management, 36(6-9), 717-720.
Matsumoto, H., Hamasaki, A., Sioji, N., & Ikuta, Y. (1997). Influence of CO2, SO2 and
NO in Flue Gas on Microalgae Productivity. Journal of Chemical Engineering Of
Japan, 30(4), 620-624.
Mimura, T., Simayoshi, H., Suda, T., Iijima, M., & Mituoka, S. (1997). Development of
energy saving technology for flue gas carbon dioxide recovery in power plant by
chemical absorption method and steam system. Energy Conversion and
Management, 38, S57-S62.
Mulholland, M. R., & Lomas, M. W. (2008). Nitrogen Uptake and Assimilation. In D. G.
Capone, D. A. Bronk, M. R. Mulholland, & E. J. Carpenter (Eds.), Nitrogen in the
marine environment (2nd ed., pp. 303-384). Amsterdam: Elsevier Academic
Press.
Nagase, H. (1997). Characteristics of biological NOx removal from flue gas in a
Dunaliella tertiolecta culture system. Journal of Fermentation and
Bioengineering, 83(5), 461-465.
Nagase, H. (1998). Improvement of microalgal NOx removal in bubble column and airlift
reactors. Journal of Fermentation and Bioengineering, 86(4), 421-423.
National Emissions Inventory (NEI). (2012, November 28). [1970 - 2012 Average annual
emissions, all criteria pollutants]. Published raw data.
75
Negoro, M., Shioji, N., Miyamoto, K., & Micira, Y. (1991). Growth of Microalgae in
High CO2 Gas and Effects of SOx and NOx. Applied Biochemistry and
Biotechnology, 28-29(1), 877-886.
Pires, M., Rossi, M. J., & Ross, D. S. (1994). Kinetic and mechanistic aspects of the NO
oxidation by O2 in aqueous phase. International Journal of Chemical
Kinetics, 26(12), 1207-1227.
Pudasainee, D., Sapkota, B., Shrestha, M. L., Kaga, A., Kondo, A., & Inoue, Y. (2006).
Ground level ozone concentrations and its association with NOx and
meteorological parameters in Kathmandu valley, Nepal. Atmospheric
Environment, 40(40), 8081-8087.
Rachlin, J. W., & Grosso, A. (1991). The Effects of pH on the Growth of Chlorella
vulgaris and Its Interactions with Cadmium Toxicity. Archives of Environmental
Contamination and Toxicology, 20, 505-508.
Rice, E. W., & Bridgewater, L. (2012). Standard methods for the examination of water
and wastewater. Washington, D.C.: American Public Health Association.
Sandoval, D. (2007). The green foods bible: Everything you need to know about barley
grass, wheatgrass, kamut, chlorella, spirulina and more. Topanga, CA: Freedom
Press.
Schwartz, S. E., & White, W. H. (1981). Solubility Equilibria of the Nitrogen Oxides and
Oxyacids in Dilute Aqueous Solution. In J. R. Pfafflin & E. N. Ziegler
(Eds.), Advances in environmental science and engineering (Vol. 4). New York:
Gordon and Breach.
Skalska, K., Miller, J. S., & Ledakowicz, S. (2010). Trends in NOx abatement: A
review. Science of the Total Environment, 408(19), 3976-3989.
Syrett, P. (1962). Nitrogen Assimilation. In R. A. Lewin (Ed.), Physiology and
biochemistry of algae. (pp. 171-188). New York: Academic Press.
76
Syrett, P. (1988). Uptake and utilization of nitrogen compounds. In L. J. Rogers & J. R.
Gallon (Eds.), Biochemistry of the algae and cyanobacteria (pp. 23-39). Oxford:
Clarendon Press.
UTEX. Bristol Medium. Retrieved February, 2012, from
http://web.biosci.utexas.edu/utex/mediaDetail.aspx?mediaID=29
Van Den Hende, S., Vervaeren, H., & Boon, N. (2012). Flue gas compounds and
microalgae: (Bio-)chemical interactions leading to biotechnological
opportunities. Biotechnology Advances, 30(6), 1405-1424.
Yoshihara, K., Nagase, H., Eguchi, K., Hirata, K., & Miyamoto, K. (1996). Biological
elimination of nitric oxide and carbon dioxide from flue gas by marine microalga
NOA-113 cultivated in a long tubular photobioreactor. Journal of Fermentation
and Bioengineering, 82(4), 351-354.
Zacharia, I. G., & Deen, W. M. (2005). Diffusivity and Solubility of Nitric Oxide in
Water and Saline. Annals of Biomedical Engineering, 33(2), 214-222.


![Earth Science & Climatic Change...Algae Green algae Chlorella vulgaris is grown near Petrich in South-West Bulgaria [21]. For the test dry extract of Chlorella vulgaris produced by](https://img.pdfslide.us/doc/110x75/5e93d3fcb8548c28da3c9f6b/earth-science-climatic-change-algae-green-algae-chlorella-vulgaris-is.jpg)