Embed Size (px)
Citation preview
Nitrogen Oxides in the Troposphere, Andreas Richter, ERCA 2012 1
Nitrogen Oxides in the Troposphere
sources, distributions, impacts, and trends
Lecture at the ERCA 2012Grenoble, February 3, 2012
Andreas RichterInstitute of Environmental Physics
University of BremenBremen, Germany
Nitrogen Oxides in the Troposphere, Andreas Richter, ERCA 2012 2
Overview
1. What is NOx?
2. What is it doing in the troposphere?
3. Why should we care?
4. Where does it come from?
5. How can it be measured?
6. Is it changing with time?
Nitrogen Oxides in the Troposphere, Andreas Richter, ERCA 2012 3
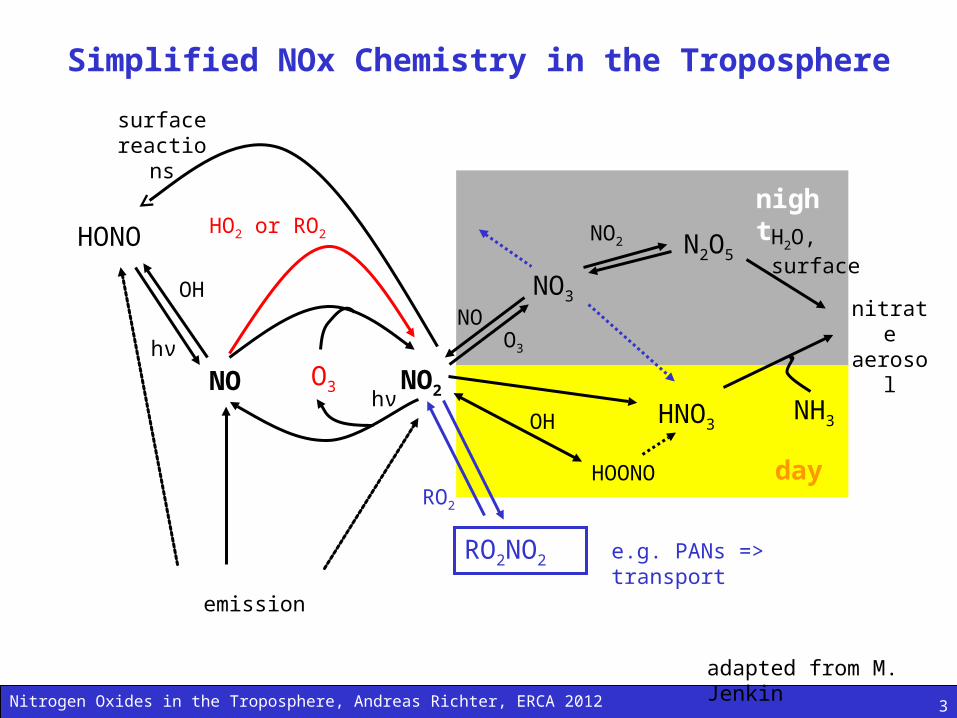
Simplified NOx Chemistry in the Troposphere
HO2 or RO2
NO3
N2O5
NO
NO2
O3
H2O,surface
night
NO NO2O3
hνHNO3
NH3OH
day
nitrate aerosol
HONO
OH
hν
surface reactions
adapted from M. Jenkin
emission
RO2NO2
RO2
e.g. PANs => transport
HOONO
Nitrogen Oxides in the Troposphere, Andreas Richter, ERCA 2012 4
Some facts on NOx in the Troposphere
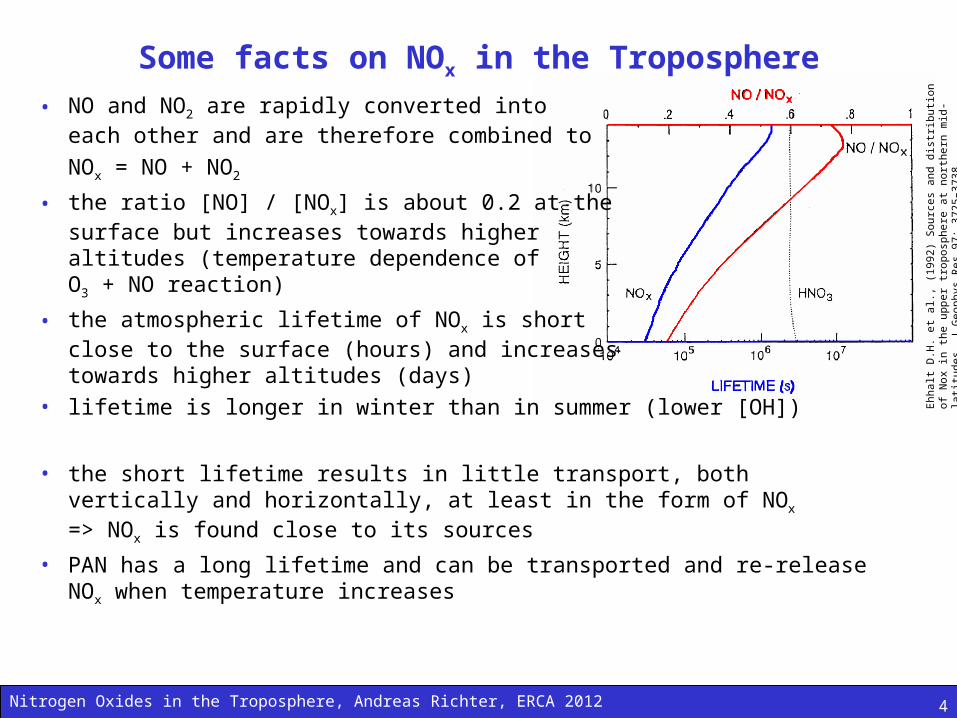
• NO and NO2 are rapidly converted into each other and are therefore combined to
NOx = NO + NO2
• the ratio [NO] / [NOx] is about 0.2 at the surface but increases towards higher altitudes (temperature dependence of O3 + NO reaction)
• the atmospheric lifetime of NOx is short close to the surface (hours) and increases towards higher altitudes (days)
• lifetime is longer in winter than in summer (lower [OH])
• the short lifetime results in little transport, both vertically and horizontally, at least in the form of NOx
=> NOx is found close to its sources
• PAN has a long lifetime and can be transported and re-release NOx when temperature increases
Ehh
alt
D.H
. et
al.,
(19
92)
Sou
rces
and
dis
trib
utio
n of
Nox
in t
he u
pper
tr
opos
pher
e at
nor
ther
n m
id-la
titud
es.
J G
eoph
ys R
es 9
7: 3
725–
3738
Nitrogen Oxides in the Troposphere, Andreas Richter, ERCA 2012 5
Why should we care about NOx in the Troposphere?
NOx• is a key species in tropospheric ozone formation
• leads to formation of HNO3 and thereby acid rain
• contributes to eutrophication
• acts as a greenhouse gas (NO2, at least locally)
• acts indirectly on climate through ozone formation• can contribute to aerosol formation
Nitrogen Oxides in the Troposphere, Andreas Richter, ERCA 2012 6
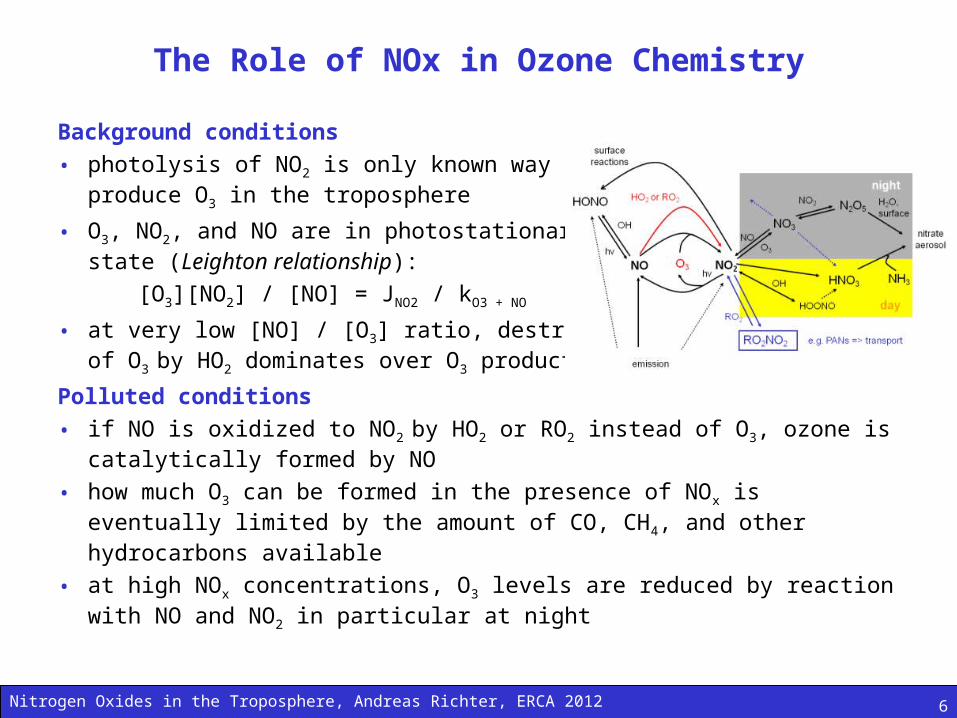
The Role of NOx in Ozone Chemistry
Background conditions
• photolysis of NO2 is only known way to produce O3 in the troposphere
• O3, NO2, and NO are in photostationary state (Leighton relationship):
[O3][NO2] / [NO] = JNO2 / kO3 + NO
• at very low [NO] / [O3] ratio, destructionof O3 by HO2 dominates over O3 production
Polluted conditions
• if NO is oxidized to NO2 by HO2 or RO2 instead of O3, ozone is catalytically formed by NO
• how much O3 can be formed in the presence of NOx is eventually limited by the amount of CO, CH4, and other hydrocarbons available
• at high NOx concentrations, O3 levels are reduced by reaction with NO and NO2 in particular at night
Nitrogen Oxides in the Troposphere, Andreas Richter, ERCA 2012 7
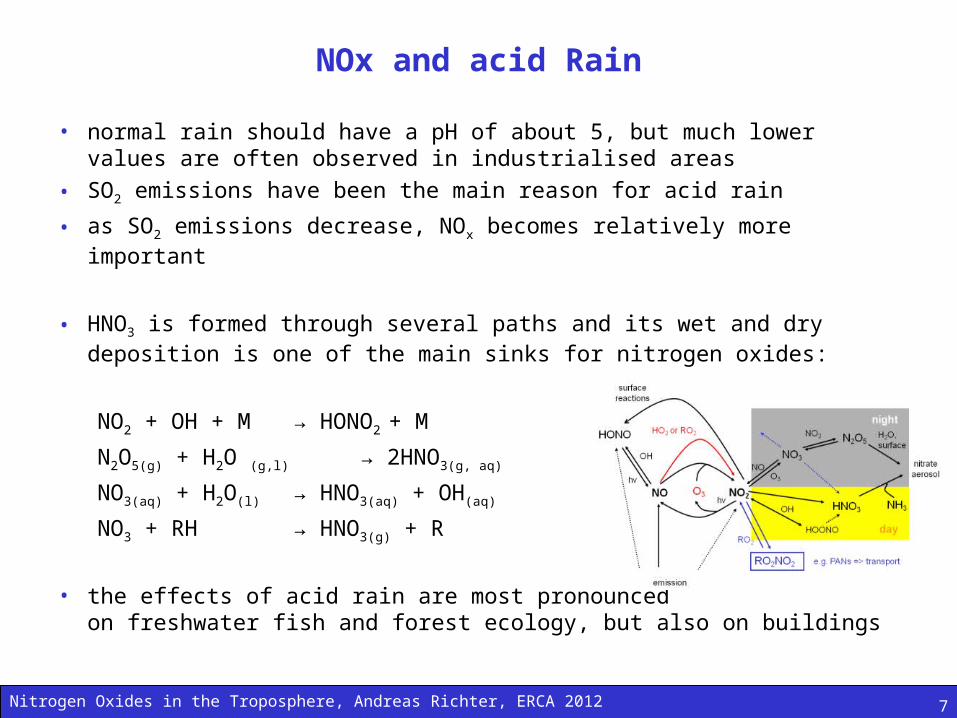
NOx and acid Rain
• normal rain should have a pH of about 5, but much lower values are often observed in industrialised areas
• SO2 emissions have been the main reason for acid rain
• as SO2 emissions decrease, NOx becomes relatively more important
• HNO3 is formed through several paths and its wet and dry deposition is one of the main sinks for nitrogen oxides:
NO2 + OH + M → HONO2 + M
N2O5(g) + H2O (g,l) → 2HNO3(g, aq)
NO3(aq) + H2O(l) → HNO3(aq) + OH(aq)
NO3 + RH → HNO3(g) + R
• the effects of acid rain are most pronounced on freshwater fish and forest ecology, but also on buildings
Nitrogen Oxides in the Troposphere, Andreas Richter, ERCA 2012 8
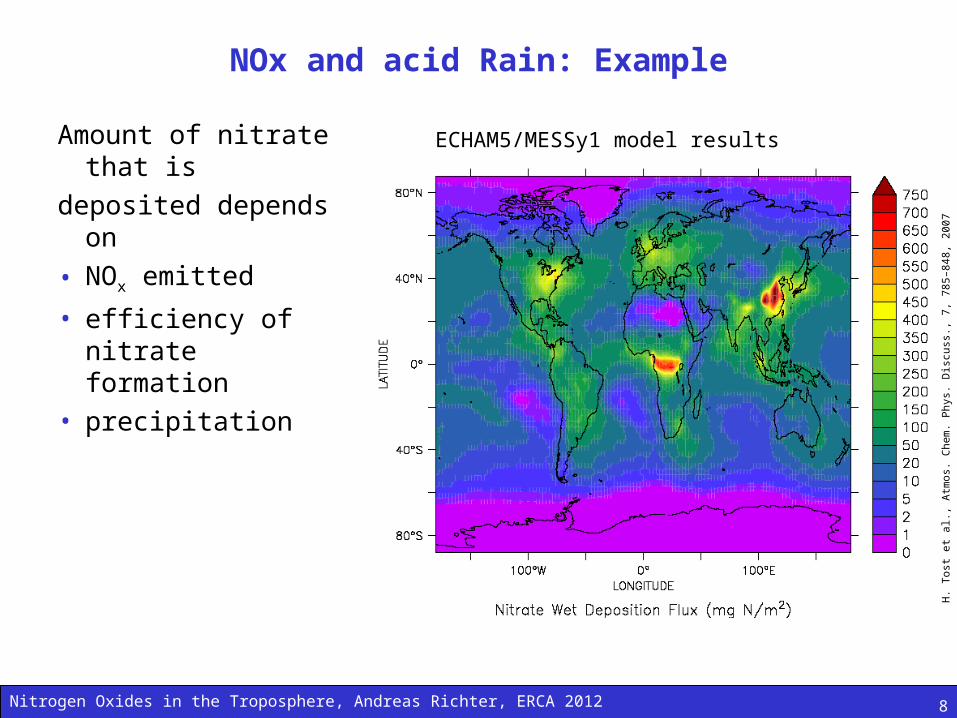
NOx and acid Rain: Example
Amount of nitrate that is
deposited depends on
• NOx emitted
• efficiency of nitrate formation
• precipitation
H.
Tos
t et
al.,
Atm
os.
Che
m.
Phy
s. D
iscu
ss.,
7,
785–
848,
200
7
ECHAM5/MESSy1 model results
Nitrogen Oxides in the Troposphere, Andreas Richter, ERCA 2012 9
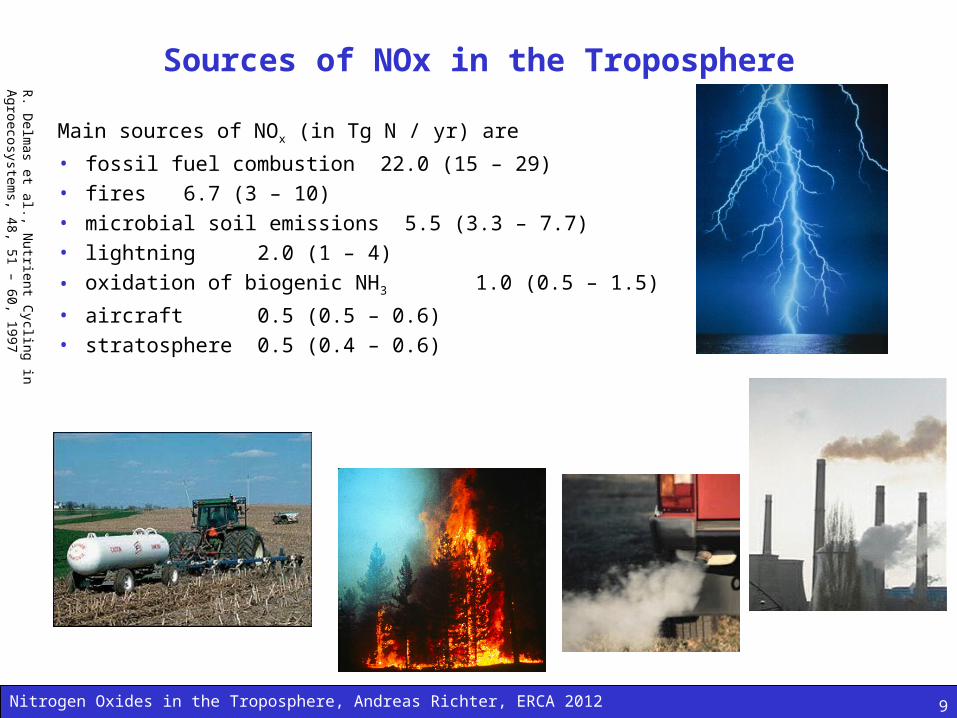
Sources of NOx in the Troposphere
Main sources of NOx (in Tg N / yr) are
• fossil fuel combustion 22.0 (15 – 29)• fires 6.7 (3 – 10)• microbial soil emissions 5.5 (3.3 – 7.7)• lightning 2.0 (1 – 4)
• oxidation of biogenic NH3 1.0 (0.5 – 1.5)
• aircraft 0.5 (0.5 – 0.6)• stratosphere 0.5 (0.4 – 0.6)
R. D
elmas et al., N
utrient Cycling in A
groecosystems, 48, 51 – 60, 1997
Nitrogen Oxides in the Troposphere, Andreas Richter, ERCA 2012 10
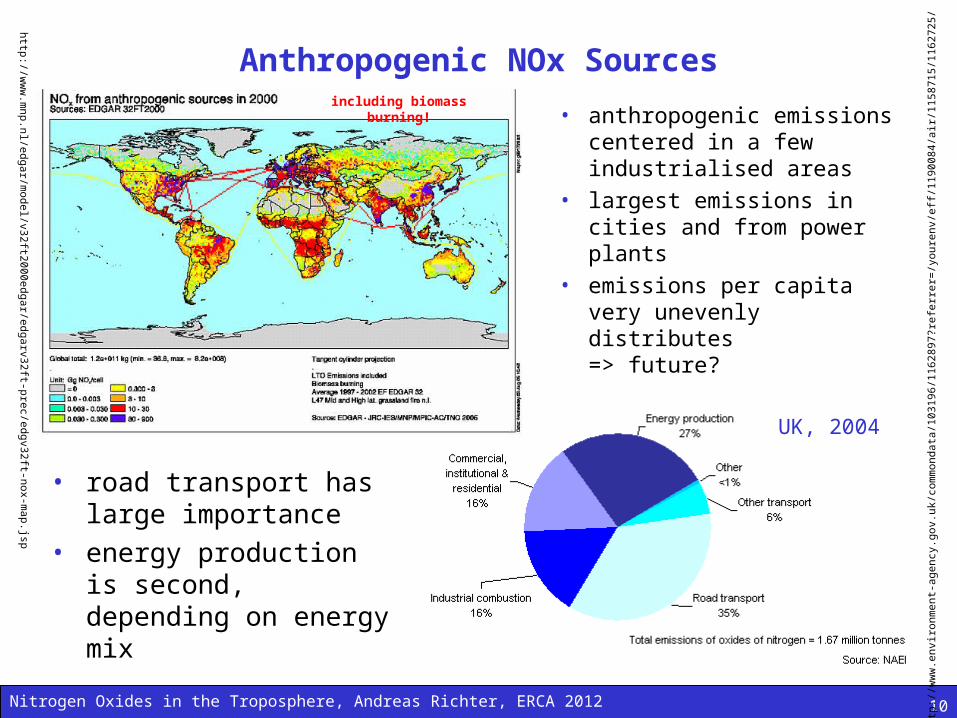
Anthropogenic NOx Sources
• anthropogenic emissions centered in a few industrialised areas
• largest emissions in cities and from power plants
• emissions per capita very unevenly distributes=> future?
http
://w
ww
.env
ironm
ent-
agen
cy.g
ov.u
k/co
mm
onda
ta/1
0319
6/11
6289
7?re
ferr
er=
/you
renv
/eff
/119
0084
/air/
1158
715/
1162
725/
UK, 2004
http://ww
w.m
np.nl/edgar/model/v32ft2000edgar/edgarv32ft-prec/edgv32ft-nox-m
ap.jsp
including biomass burning!
• road transport has large importance
• energy production is second, depending on energy mix
Nitrogen Oxides in the Troposphere, Andreas Richter, ERCA 2012 11
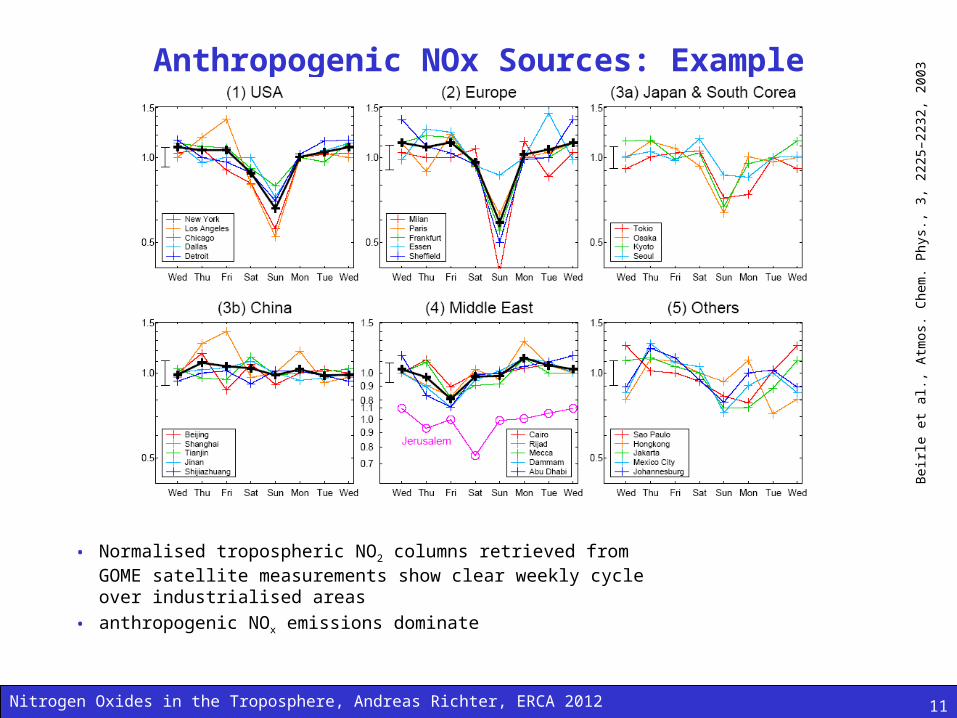
Anthropogenic NOx Sources: Example
• Normalised tropospheric NO2 columns retrieved from GOME satellite measurements show clear weekly cycle over industrialised areas
• anthropogenic NOx emissions dominate
Bei
rle e
t al.,
Atm
os. C
hem
. Phy
s., 3
, 222
5–22
32, 2
003
Nitrogen Oxides in the Troposphere, Andreas Richter, ERCA 2012
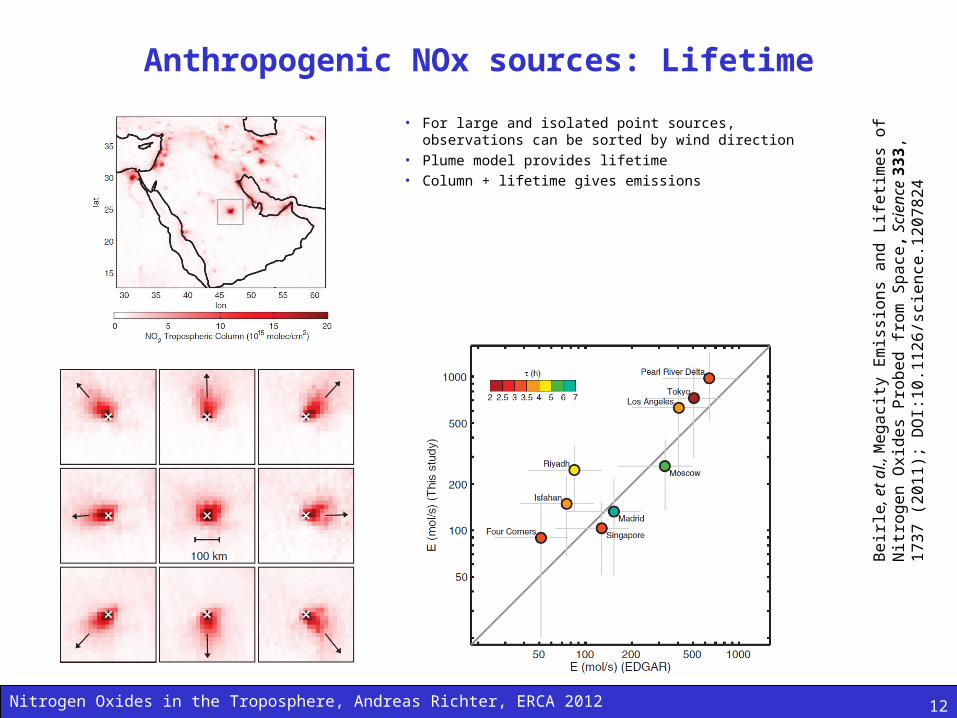
Anthropogenic NOx sources: Lifetime
• For large and isolated point sources, observations can be sorted by wind direction
• Plume model provides lifetime• Column + lifetime gives emissions
12
Be
irle
, e
t a
l., M
eg
aci
ty E
mis
sio
ns
an
d L
ifetim
es
of
Nitr
og
en
O
xid
es
Pro
be
d f
rom
Sp
ace
, S
cie
nce
33
3,
17
37
(2
01
1);
D
OI:
10
.11
26
/sci
en
ce.1
20
78
24
Nitrogen Oxides in the Troposphere, Andreas Richter, ERCA 2012 13
Soil Sources of NOx
• NO and N2O are emitted from microbial activities in the soil, both during nitrification (NH4
+ → NO3-) and denitrification (NO3
- → N2)
• function of soil moisture and texture, inorganic nitrogen availability, the carbon to nitrogen ratio, temperature and precipitation
• typical parameterisation using T, precipitation and fertilisation• usually observed as strong pulses after fertilisation and rain• in ecosystems with dense vegetation cover (e.g. rain forests), part of
the NOx emitted is lost by NO2 deposition
• NOx soil emissions seem to be underestimated in current models
• potential for increases as use of fertilizers increases, but strong dependence on actual practices used
Nitrogen Oxides in the Troposphere, Andreas Richter, ERCA 2012 14
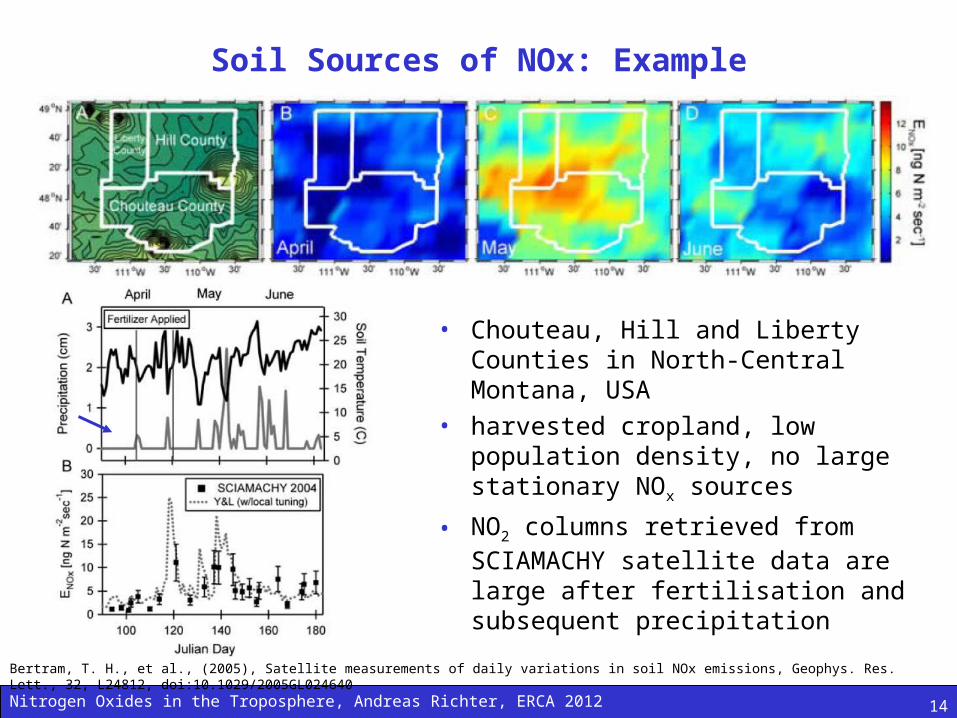
Soil Sources of NOx: Example
• Chouteau, Hill and Liberty Counties in North-Central Montana, USA
• harvested cropland, low population density, no large stationary NOx sources
• NO2 columns retrieved from SCIAMACHY satellite data are large after fertilisation and subsequent precipitation
Bertram, T. H., et al., (2005), Satellite measurements of daily variations in soil NOx emissions, Geophys. Res. Lett., 32, L24812, doi:10.1029/2005GL024640
Nitrogen Oxides in the Troposphere, Andreas Richter, ERCA 2012 15
NOx from Biomass Burning
• biomass burning is happening on large scales on a regular basis as part of– agricultural practices– wild fires– domestic fires
• it is a significant source of NOx
• the amount of NOx emitted per biomass burned varies strongly between different biomass types (savannah, tropical rain forests, boreal forests)
• large amounts of NOx are emitted in the tropics, much less e.g. in Alaska or Siberia
• in big fires, enough heat is produced to start pyroconvection and to inject NOx in the upper troposphere
Nitrogen Oxides in the Troposphere, Andreas Richter, ERCA 2012 16
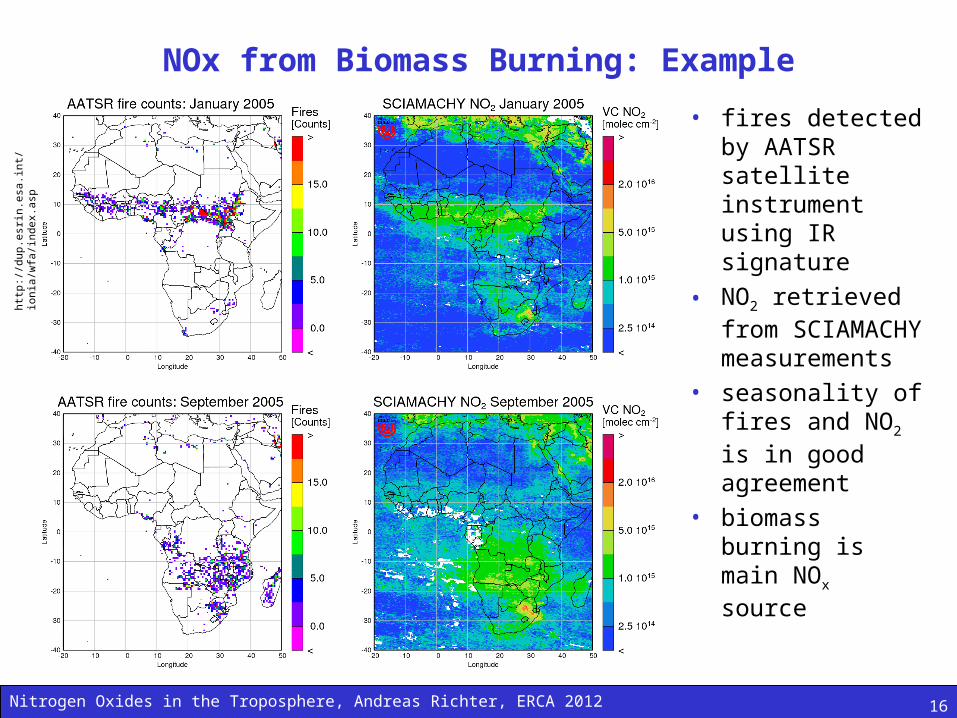
NOx from Biomass Burning: Example
• fires detected by AATSR satellite instrument using IR signature
• NO2 retrieved from SCIAMACHY measurements
• seasonality of fires and NO2 is in good agreement
• biomass burning is main NOx source
http
://d
up.e
srin
.esa
.int/
ioni
a/w
fa/in
dex.
asp
Nitrogen Oxides in the Troposphere, Andreas Richter, ERCA 2012 17
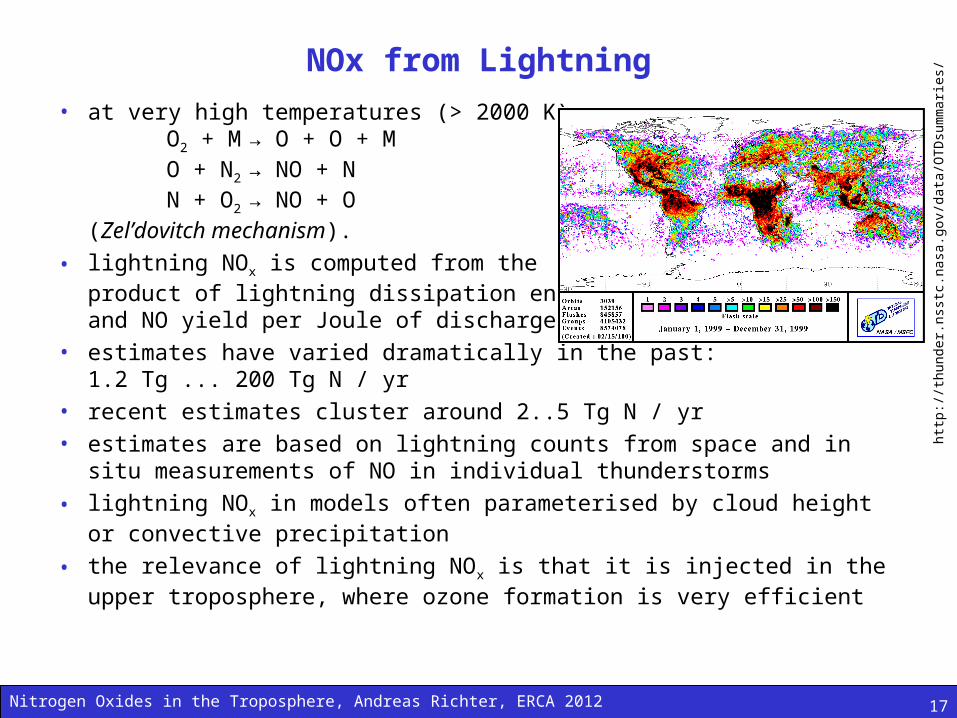
NOx from Lightning
• at very high temperatures (> 2000 K) O2 + M → O + O + MO + N2 → NO + N N + O2 → NO + O
(Zel’dovitch mechanism).
• lightning NOx is computed from theproduct of lightning dissipation energyand NO yield per Joule of discharge
• estimates have varied dramatically in the past: 1.2 Tg ... 200 Tg N / yr
• recent estimates cluster around 2..5 Tg N / yr• estimates are based on lightning counts from space and in situ measurements
of NO in individual thunderstorms
• lightning NOx in models often parameterised by cloud height or convective precipitation
• the relevance of lightning NOx is that it is injected in the upper troposphere, where ozone formation is very efficient
http
://th
unde
r.ns
stc.
nasa
.gov
/dat
a/O
TD
sum
mar
ies/
Nitrogen Oxides in the Troposphere, Andreas Richter, ERCA 2012 18
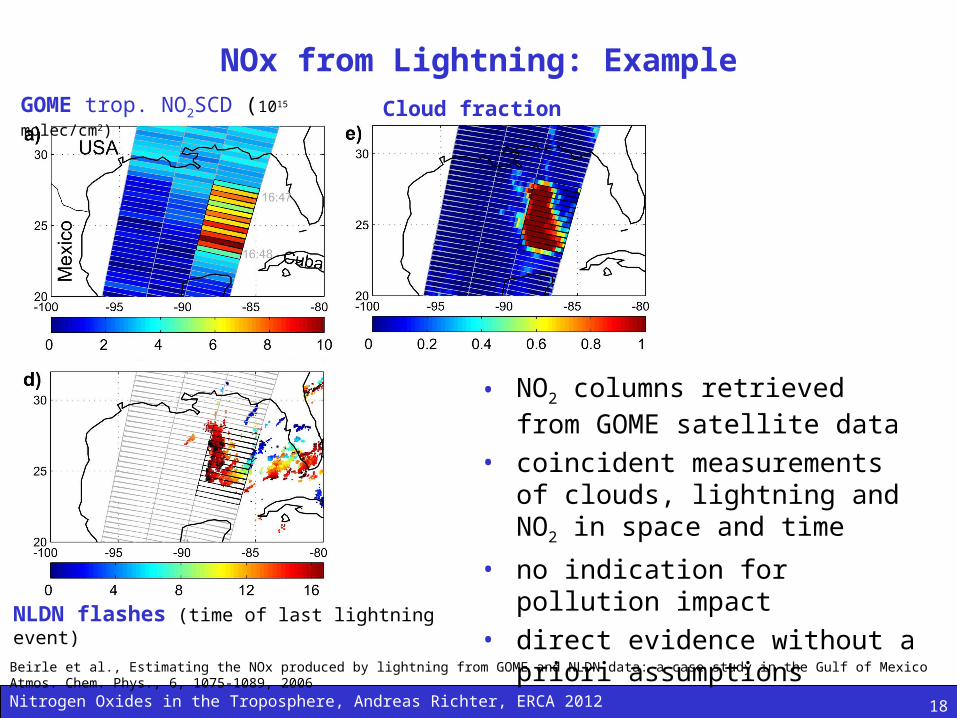
NOx from Lightning: Example
• NO2 columns retrieved from GOME satellite data
• coincident measurements of clouds, lightning and NO2 in space and time
• no indication for pollution impact• direct evidence without a priori
assumptions
GOME trop. NO2SCD (1015 molec/cm2) Cloud fraction
NLDN flashes (time of last lightning event)
Beirle et al., Estimating the NOx produced by lightning from GOME and NLDN data: a case study in the Gulf of Mexico Atmos. Chem. Phys., 6, 1075-1089, 2006
Nitrogen Oxides in the Troposphere, Andreas Richter, ERCA 2012 19
Measurements of NOx
Challenges• high spatial and temporal variability• what is a representative measurement location?• vertical distribution
Techniques• in-situ using chemiluminescence• locally using absorption spectroscopy• globally using remote sensing in the visible spectral range
Nitrogen Oxides in the Troposphere, Andreas Richter, ERCA 2012 20
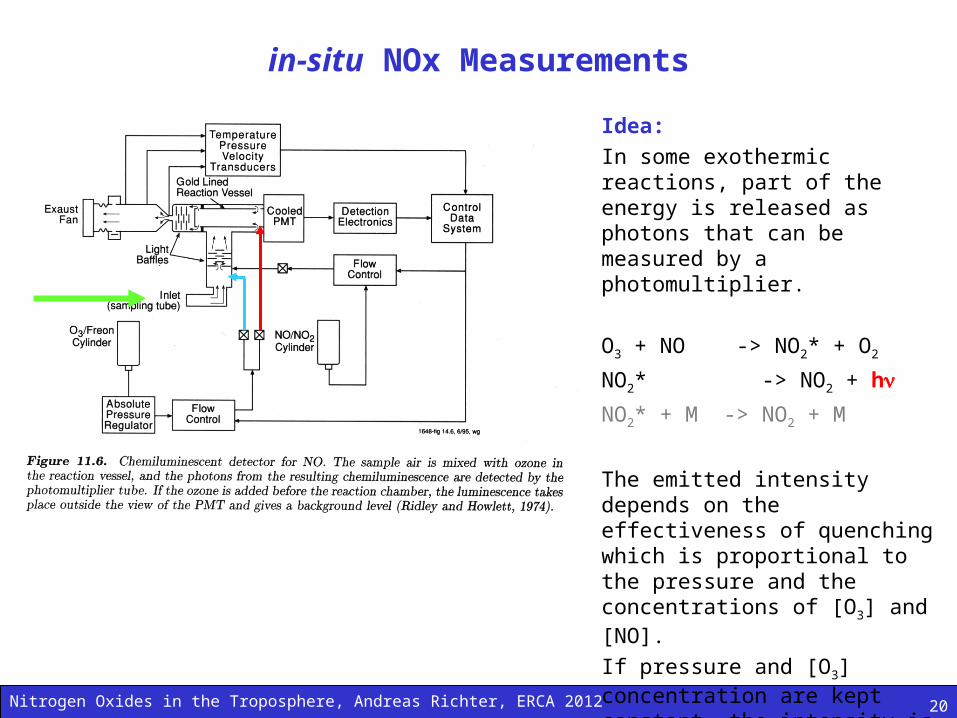
in-situ NOx Measurements
Idea:
In some exothermic reactions, part of the energy is released as photons that can be measured by a photomultiplier.
O3 + NO -> NO2* + O2
NO2* -> NO2 + h
NO2* + M -> NO2 + M
The emitted intensity depends on the effectiveness of quenching which is proportional to the pressure and the concentrations of [O3] and [NO].
If pressure and [O3] concentration are kept constant, the intensity is proportional to the concentration of the NO.
Nitrogen Oxides in the Troposphere, Andreas Richter, ERCA 2012 21
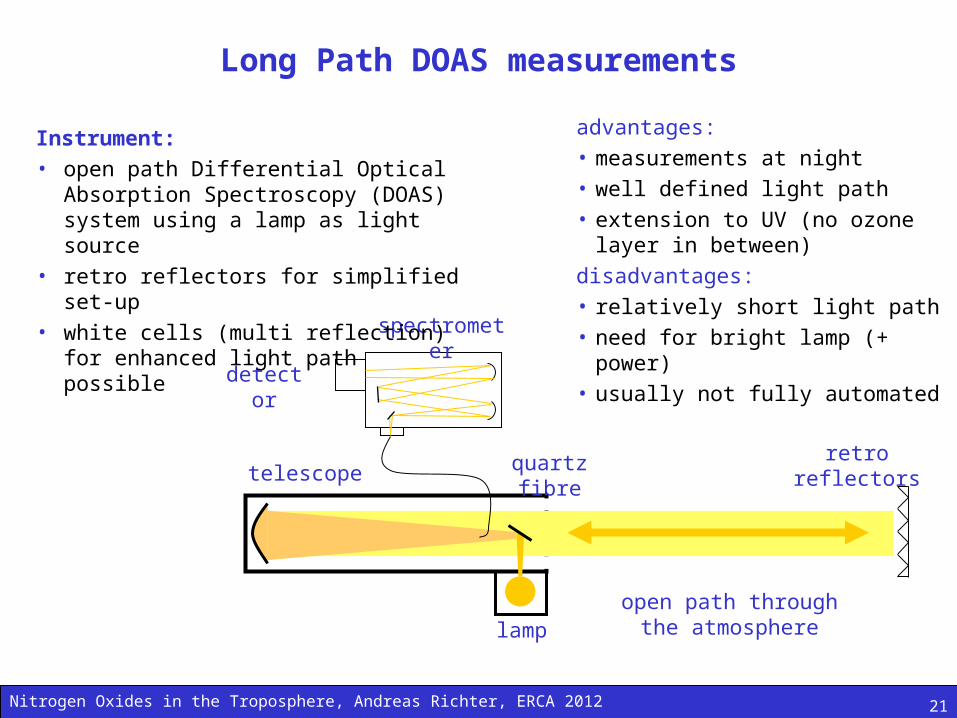
Long Path DOAS measurements
open path through the atmospherelamp
telescoperetro reflectors
spectrometer
detector
quartz fibre
Instrument:• open path Differential Optical Absorption
Spectroscopy (DOAS) system using a lamp as light source
• retro reflectors for simplified set-up• white cells (multi reflection) for enhanced
light path possible
advantages:• measurements at night• well defined light path• extension to UV (no ozone layer in
between)
disadvantages: • relatively short light path• need for bright lamp (+ power)• usually not fully automated
Nitrogen Oxides in the Troposphere, Andreas Richter, ERCA 2012 22
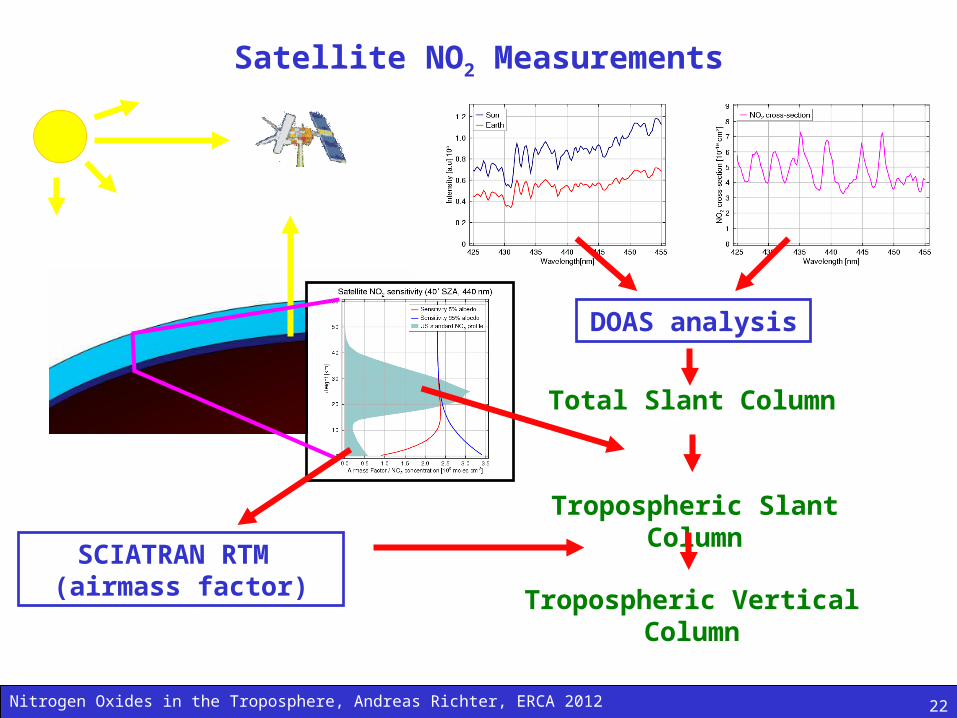
Satellite NO2 Measurements
DOAS analysis
Total Slant Column
Tropospheric Slant Column
Tropospheric Vertical Column
SCIATRAN RTM (airmass factor)
Nitrogen Oxides in the Troposphere, Andreas Richter, ERCA 2012 23
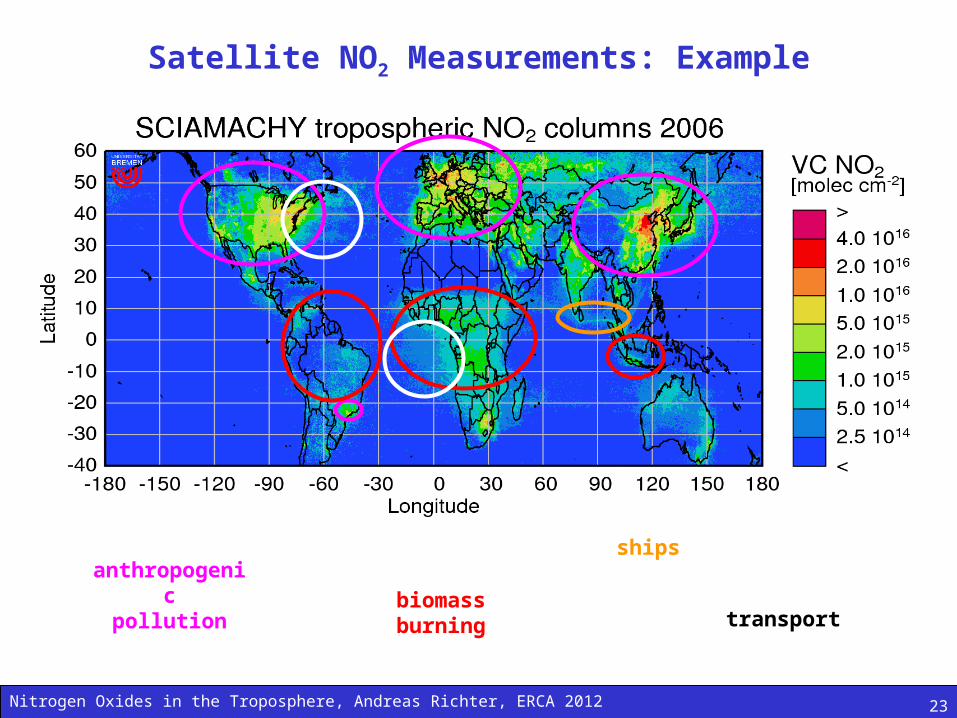
Satellite NO2 Measurements: Example
anthropogenicpollution biomass
burning
ships
transport
Nitrogen Oxides in the Troposphere, Andreas Richter, ERCA 2012 24
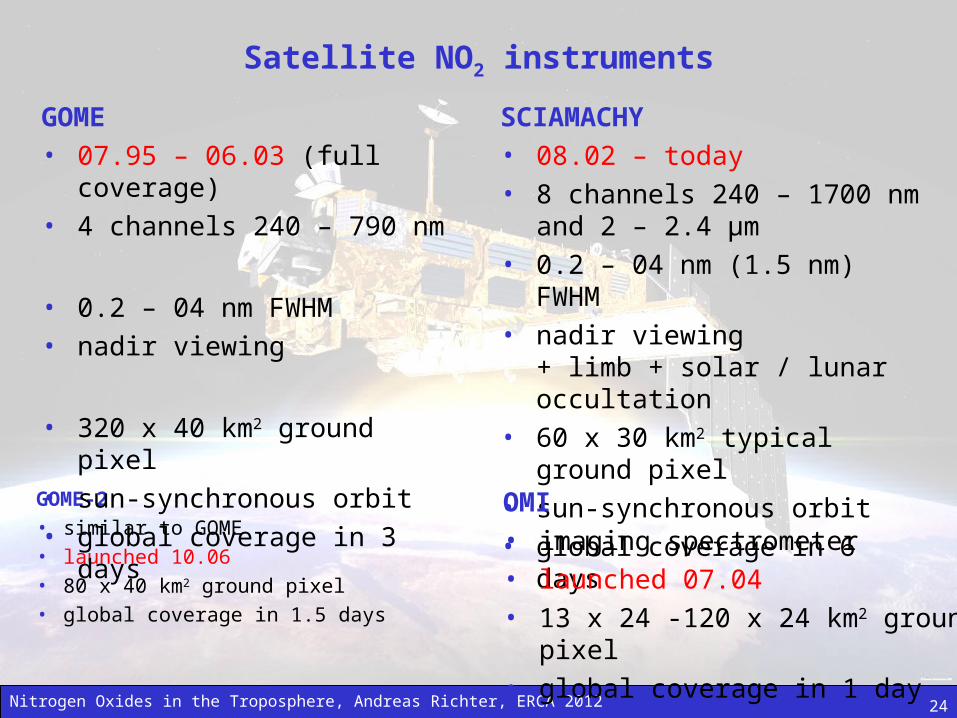
Satellite NO2 instruments
GOME-2• similar to GOME• launched 10.06• 80 x 40 km2 ground pixel• global coverage in 1.5 days
GOME• 07.95 – 06.03 (full coverage)• 4 channels 240 – 790 nm
• 0.2 – 04 nm FWHM• nadir viewing
• 320 x 40 km2 ground pixel• sun-synchronous orbit• global coverage in 3 days
SCIAMACHY• 08.02 – today• 8 channels 240 – 1700 nm
and 2 – 2.4 μm• 0.2 – 04 nm (1.5 nm) FWHM• nadir viewing
+ limb + solar / lunar occultation• 60 x 30 km2 typical ground pixel• sun-synchronous orbit• global coverage in 6 days
OMI• imaging spectrometer• launched 07.04• 13 x 24 -120 x 24 km2 ground pixel• global coverage in 1 day
Nitrogen Oxides in the Troposphere, Andreas Richter, ERCA 2012 25
NOx Emission Estimates
“bottom up”• using statistical data on activities (e.g. number and type of cars,
average mileage, average fuel consumption)• and data on emission factors (x g NO emitted per l fuel)
“top down”
• using measurements of e.g. NO2 or other species influenced by NOx
• applying a model to establish the connection between emissions and atmospheric concentrations (or columns)
• iterating emissions in the model to improve agreement between model prediction and measurements
• the more measurements, the better => satellite data should be optimal, but accuracy and lack of vertical resolution is a problem
Nitrogen Oxides in the Troposphere, Andreas Richter, ERCA 2012 26
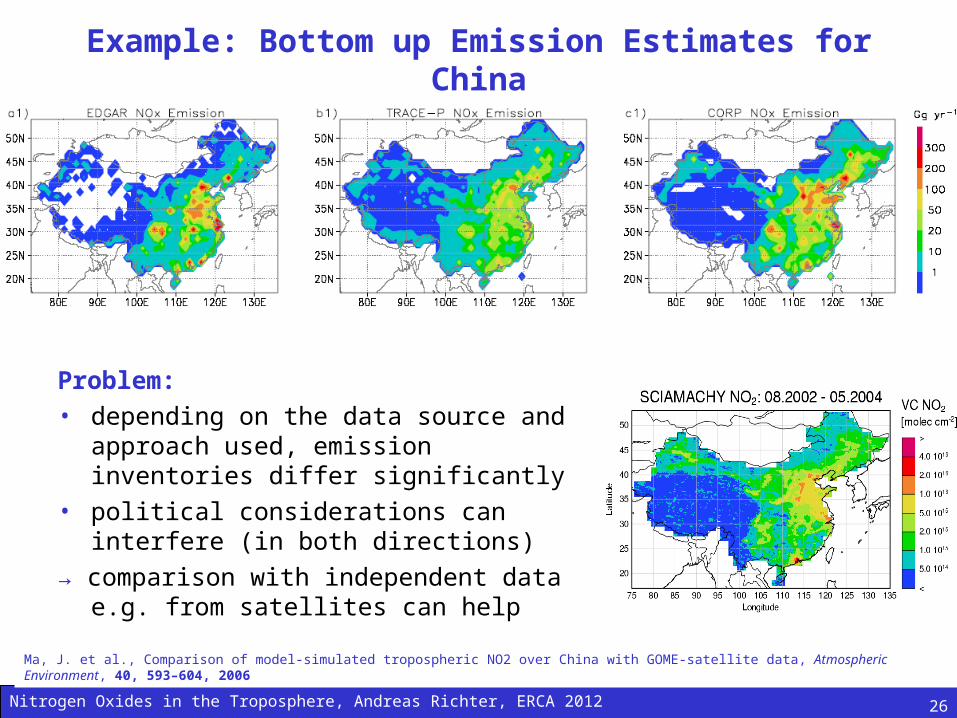
Example: Bottom up Emission Estimates for China
Problem:
• depending on the data source and approach used, emission inventories differ significantly
• political considerations can interfere (in both directions)
→ comparison with independent data e.g. from satellites can help
Ma, J. et al., Comparison of model-simulated tropospheric NO2 over China with GOME-satellite data, Atmospheric Environment, 40, 593–604, 2006
Nitrogen Oxides in the Troposphere, Andreas Richter, ERCA 2012 27
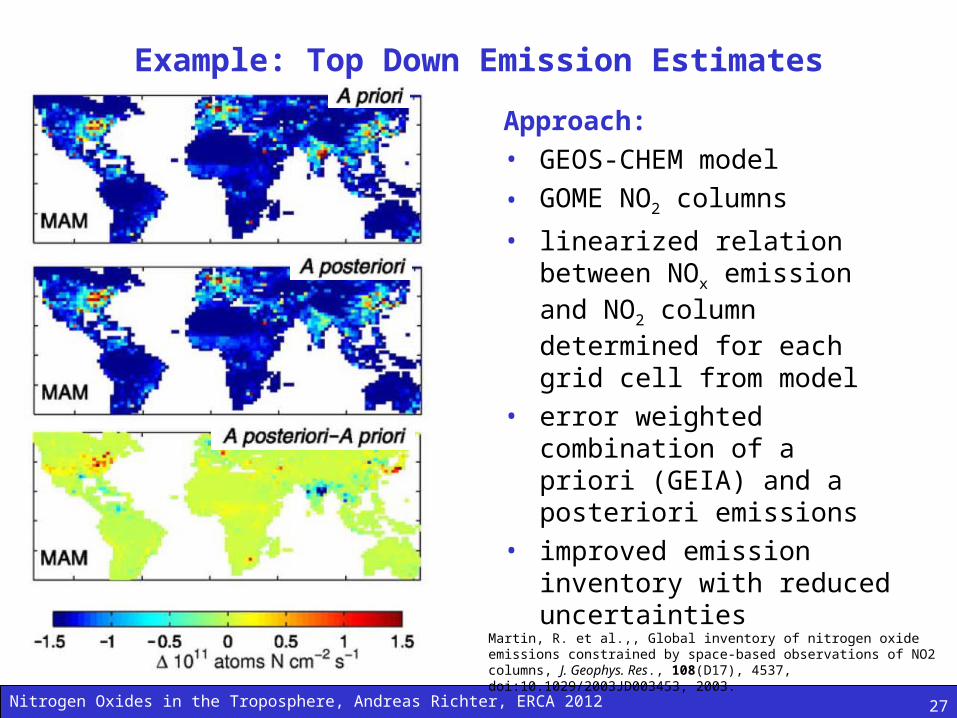
Example: Top Down Emission Estimates
Approach:• GEOS-CHEM model
• GOME NO2 columns
• linearized relation between NOx emission and NO2 column determined for each grid cell from model
• error weighted combination of a priori (GEIA) and a posteriori emissions
• improved emission inventory with reduced uncertainties
Martin, R. et al.,, Global inventory of nitrogen oxide emissions constrained by space-based observations of NO2 columns, J. Geophys. Res., 108(D17), 4537, doi:10.1029/2003JD003453, 2003.
Nitrogen Oxides in the Troposphere, Andreas Richter, ERCA 2012 28
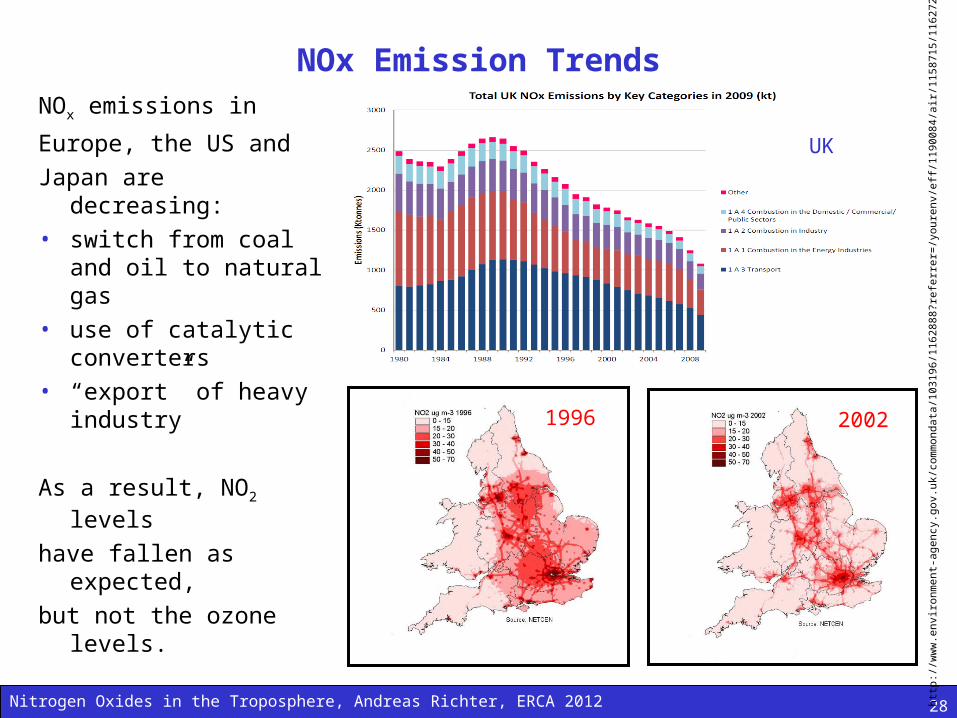
NOx Emission Trends
NOx emissions in
Europe, the US and
Japan are decreasing:• switch from coal and
oil to natural gas• use of catalytic
converters• “export” of heavy
industry
As a result, NO2 levels
have fallen as expected,
but not the ozone levels.
http
://w
ww
.env
ironm
ent-
agen
cy.g
ov.u
k/co
mm
onda
ta/1
0319
6/11
6288
8?re
ferr
er=
/you
renv
/eff
/119
0084
/air/
1158
715/
1162
725/
UK
1996 2002
Nitrogen Oxides in the Troposphere, Andreas Richter, ERCA 2012 29
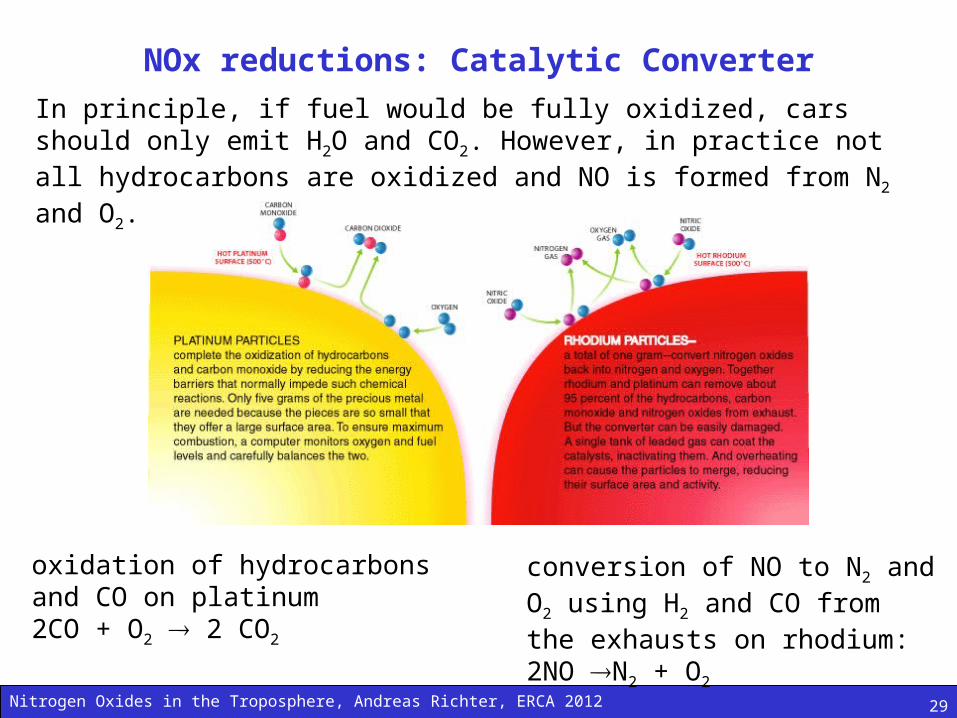
NOx reductions: Catalytic Converter
oxidation of hydrocarbons and CO on platinum2CO + O2 2 CO2
In principle, if fuel would be fully oxidized, cars should only emit H2O and CO2. However, in practice not all hydrocarbons are oxidized and NO is formed from N2 and O2.
conversion of NO to N2 and O2 using H2 and CO from the exhausts on rhodium:2NO N2 + O2
Nitrogen Oxides in the Troposphere, Andreas Richter, ERCA 2012 30
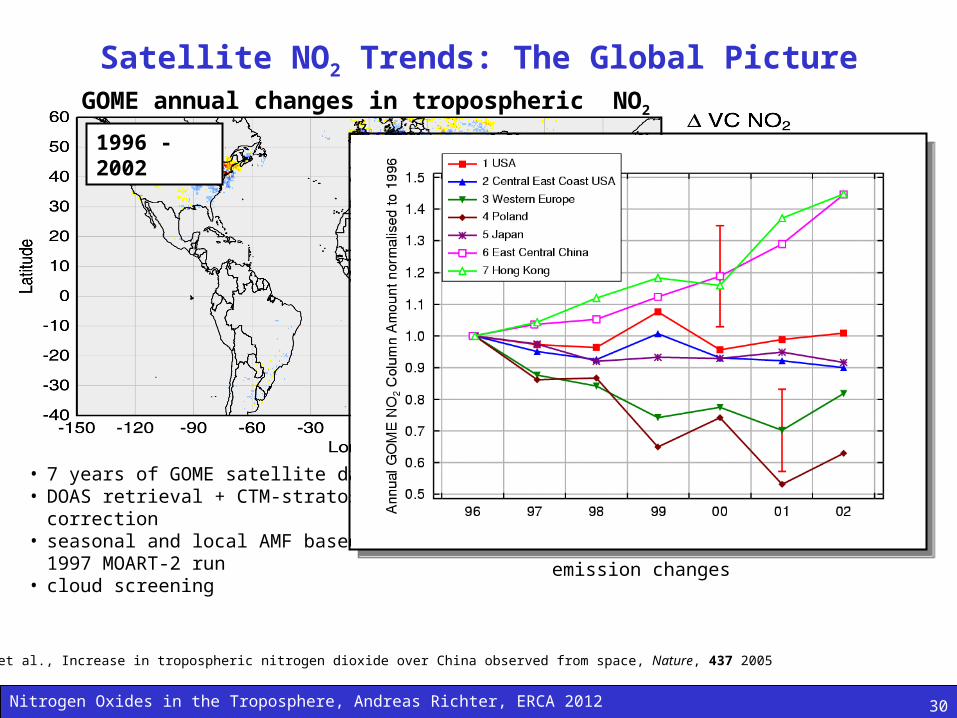
A. Richter et al., Increase in tropospheric nitrogen dioxide over China observed from space, Nature, 437 2005
Satellite NO2 Trends: The Global Picture
• NO2 reductions in Europe and parts of the US• strong increase over China• consistent with significant NOx emission
changes
• 7 years of GOME satellite data• DOAS retrieval + CTM-stratospheric correction• seasonal and local AMF based on
1997 MOART-2 run• cloud screening
1996 - 2002
GOME annual changes in tropospheric NO2
Nitrogen Oxides in the Troposphere, Andreas Richter, ERCA 2012 31
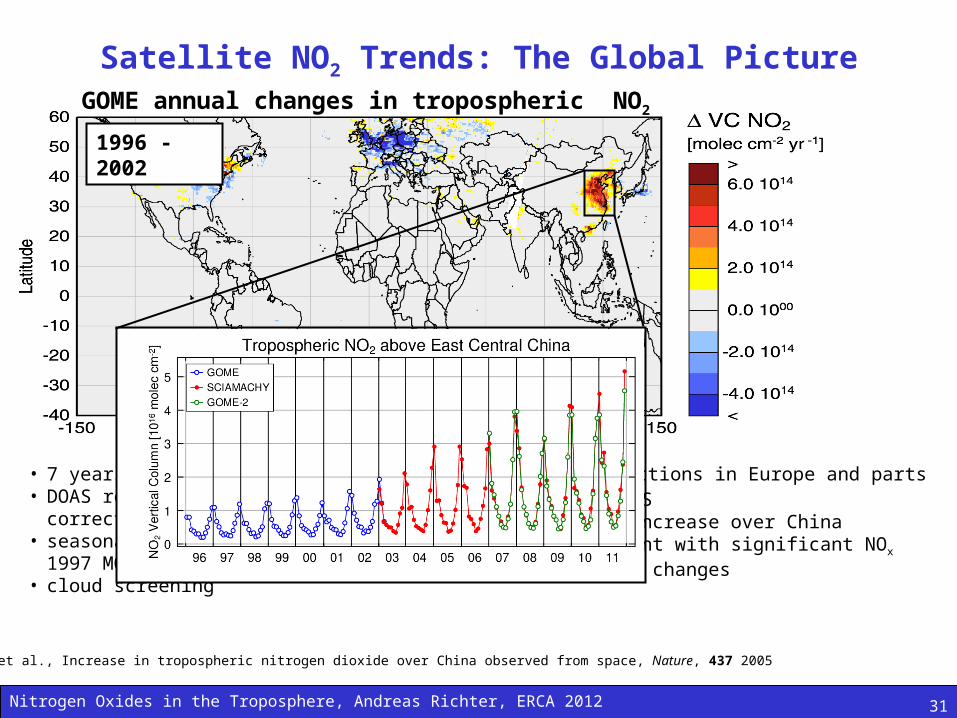
A. Richter et al., Increase in tropospheric nitrogen dioxide over China observed from space, Nature, 437 2005
Satellite NO2 Trends: The Global Picture
• NO2 reductions in Europe and parts of the US• strong increase over China• consistent with significant NOx emission
changes
• 7 years of GOME satellite data• DOAS retrieval + CTM-stratospheric correction• seasonal and local AMF based on
1997 MOART-2 run• cloud screening
1996 - 2002
GOME annual changes in tropospheric NO2
Nitrogen Oxides in the Troposphere, Andreas Richter, ERCA 2012 32
Satellite NO2 Trends: Caveats
What can explain the observed increase in NO2 over China?
• A GOME instrument drift
=> this should affect Japan as well but not SCIAMACHY• A change in viewing conditions as a result of changes in cloud
cover, aerosol loading or vertical transport
=> there is no indication for this from the GOME data themselves
• A change in NO to NO2 partitioning at constant NOx levels, for example as a result of a change in O3
• A change in NO2 losses, for example as a result of decreased OH concentrations
• An increase in NO2 concentrations as a result of increased NOx emissions
Nitrogen Oxides in the Troposphere, Andreas Richter, ERCA 2012 33
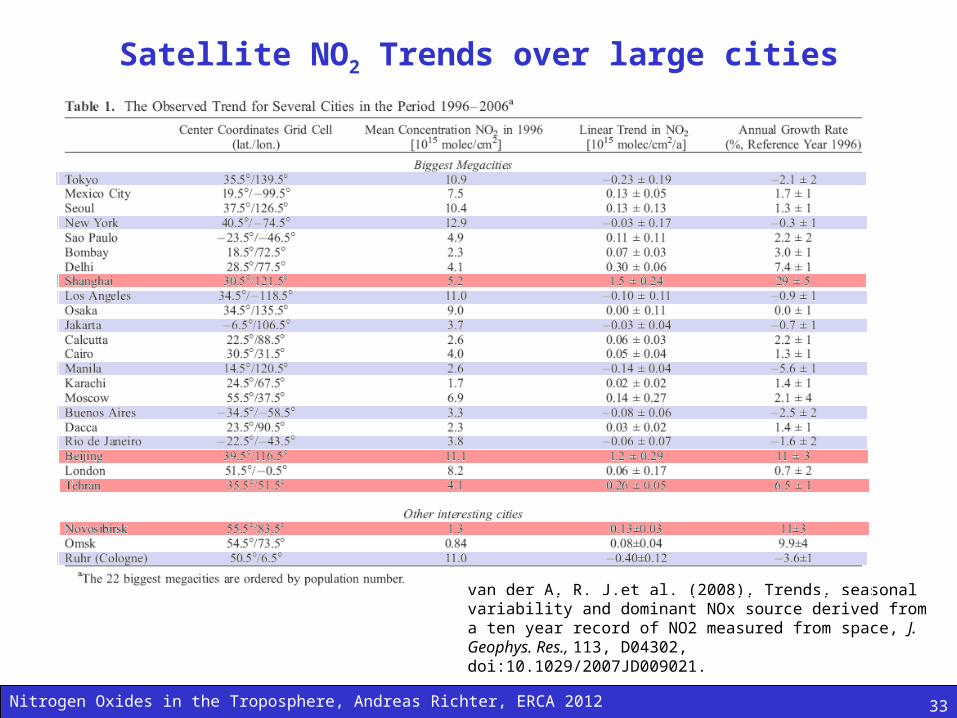
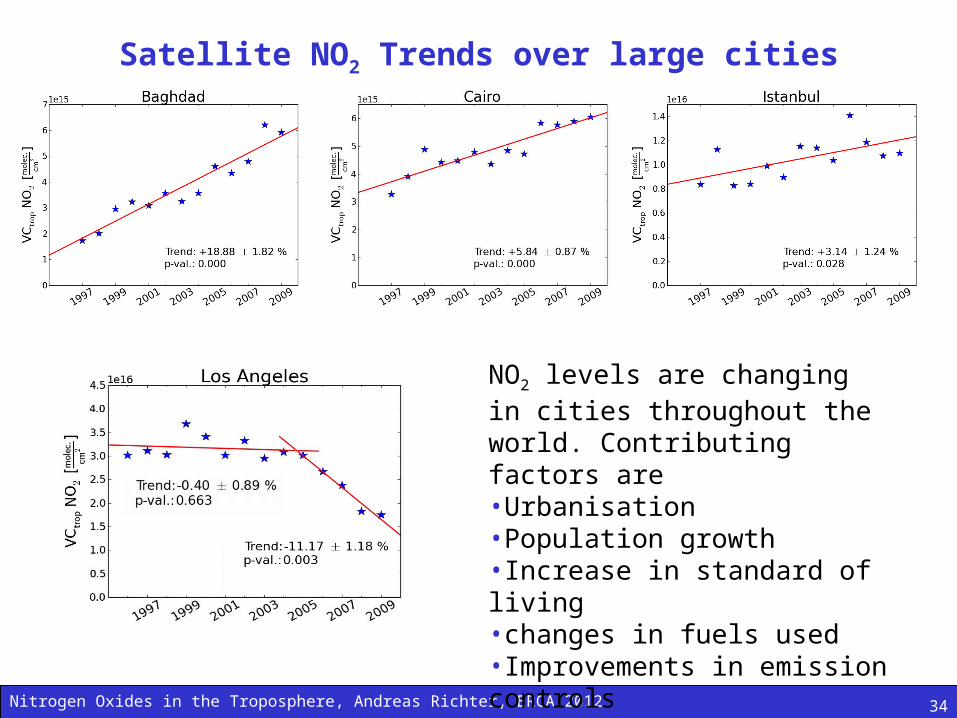
van der A, R. J.et al. (2008), Trends, seasonal variability and dominant NOx source derived from a ten year record of NO2 measured from space, J. Geophys. Res., 113, D04302, doi:10.1029/2007JD009021.
Satellite NO2 Trends over large cities
Nitrogen Oxides in the Troposphere, Andreas Richter, ERCA 2012 34
Satellite NO2 Trends over large cities
NO2 levels are changing in cities throughout the world. Contributing factors are•Urbanisation•Population growth•Increase in standard of living•changes in fuels used•Improvements in emission controls
Nitrogen Oxides in the Troposphere, Andreas Richter, ERCA 2012 35
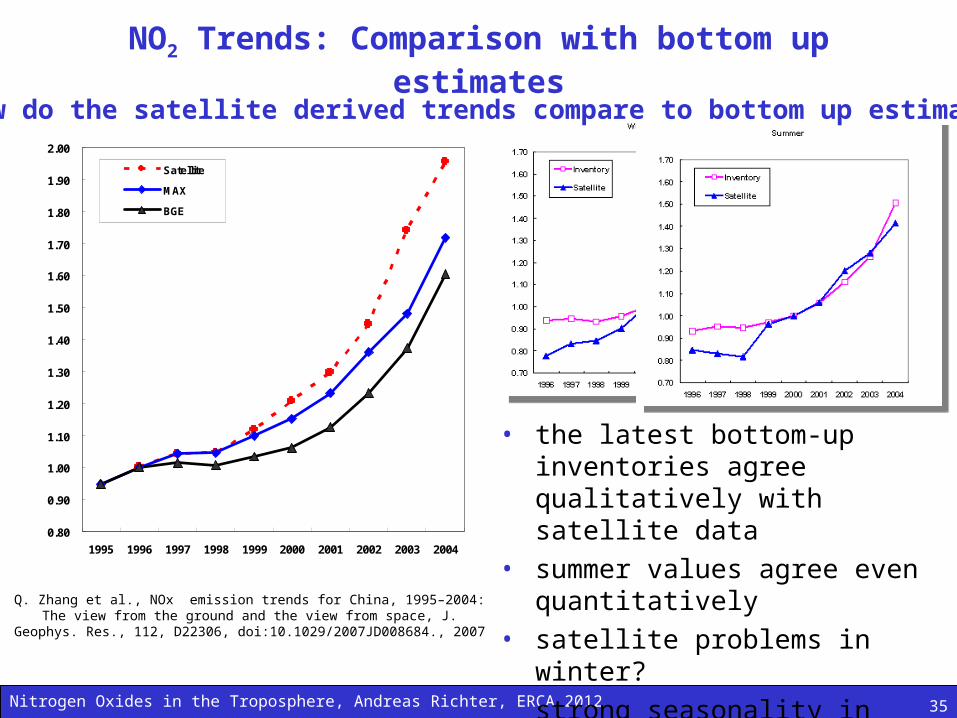
NO2 Trends: Comparison with bottom up estimates
0.80
0.90
1.00
1.10
1.20
1.30
1.40
1.50
1.60
1.70
1.80
1.90
2.00
1995 1996 1997 1998 1999 2000 2001 2002 2003 2004
Satellite
MAX
BGE
Q. Zhang et al., NOx emission trends for China, 1995–2004: The view from the ground and the view from space, J. Geophys. Res., 112, D22306,
doi:10.1029/2007JD008684., 2007
• the latest bottom-up inventories agree qualitatively with satellite data
• summer values agree even quantitatively
• satellite problems in winter?• strong seasonality in emissions?
How do the satellite derived trends compare to bottom up estimates?
Nitrogen Oxides in the Troposphere, Andreas Richter, ERCA 2012 36
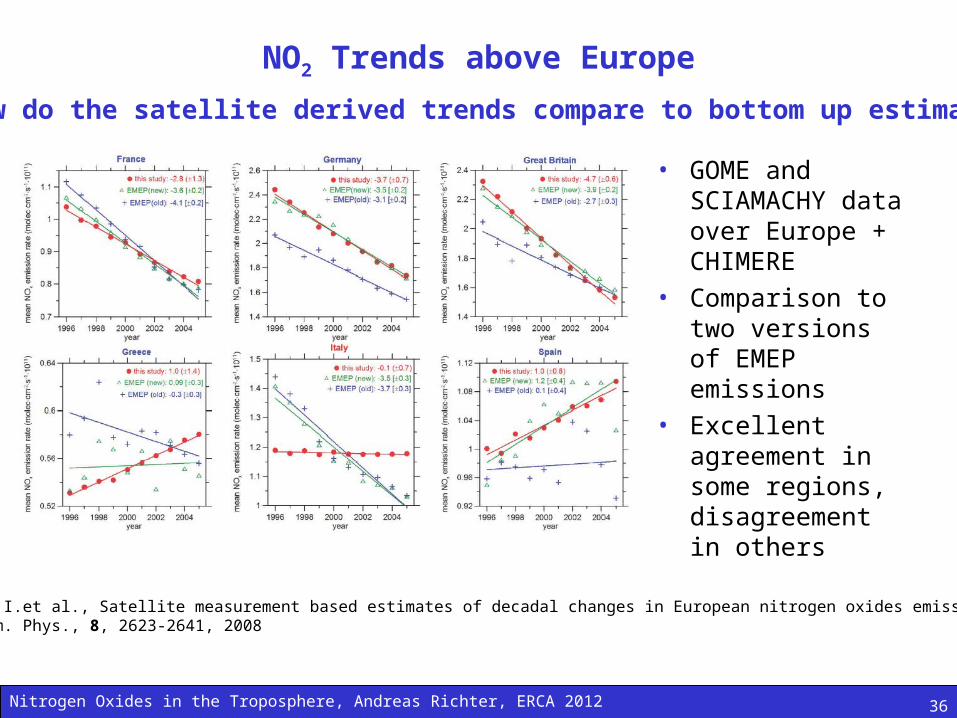
NO2 Trends above Europe
How do the satellite derived trends compare to bottom up estimates?
• GOME and SCIAMACHY data over Europe + CHIMERE
• Comparison to two versions of EMEP emissions
• Excellent agreement in some regions, disagreement in others
Konovalov, I.et al., Satellite measurement based estimates of decadal changes in European nitrogen oxides emissions, Atmos. Chem. Phys., 8, 2623-2641, 2008
Nitrogen Oxides in the Troposphere, Andreas Richter, ERCA 2012 37
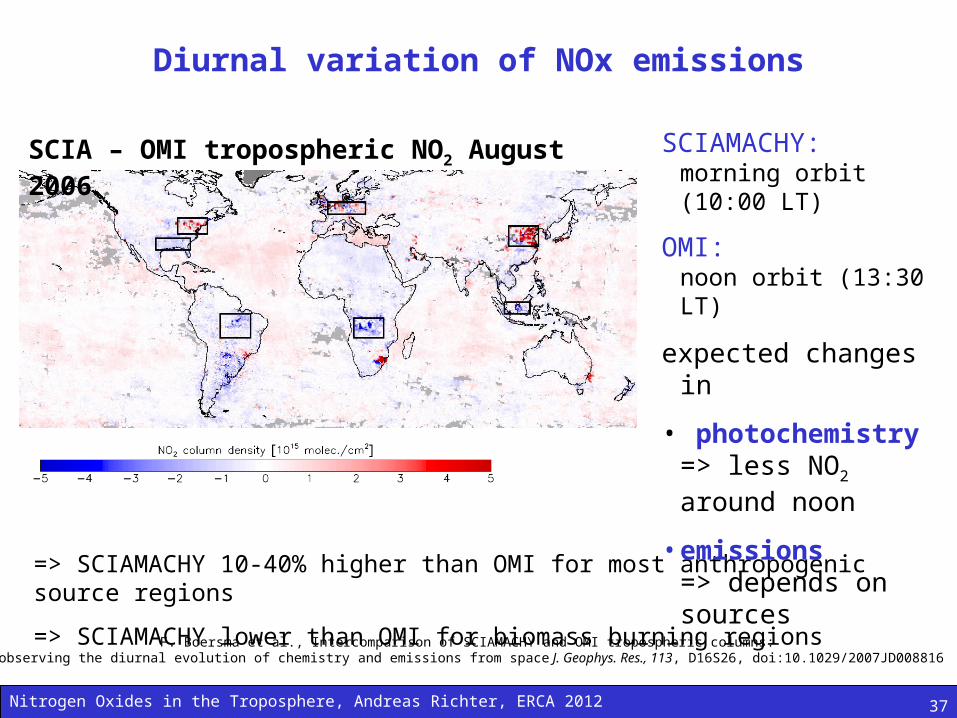
Diurnal variation of NOx emissions
=> SCIAMACHY 10-40% higher than OMI for most anthropogenic source regions
=> SCIAMACHY lower than OMI for biomass burning regionsF. Boersma et al., Intercomparison of SCIAMACHY and OMI tropospheric columns:
observing the diurnal evolution of chemistry and emissions from space J. Geophys. Res., 113, D16S26, doi:10.1029/2007JD008816
SCIAMACHY:morning orbit (10:00 LT)
OMI:noon orbit (13:30 LT)
expected changes in
• photochemistry => less NO2 around noon
• emissions => depends on sources
SCIA – OMI tropospheric NO2 August 2006
Nitrogen Oxides in the Troposphere, Andreas Richter, ERCA 2012 38
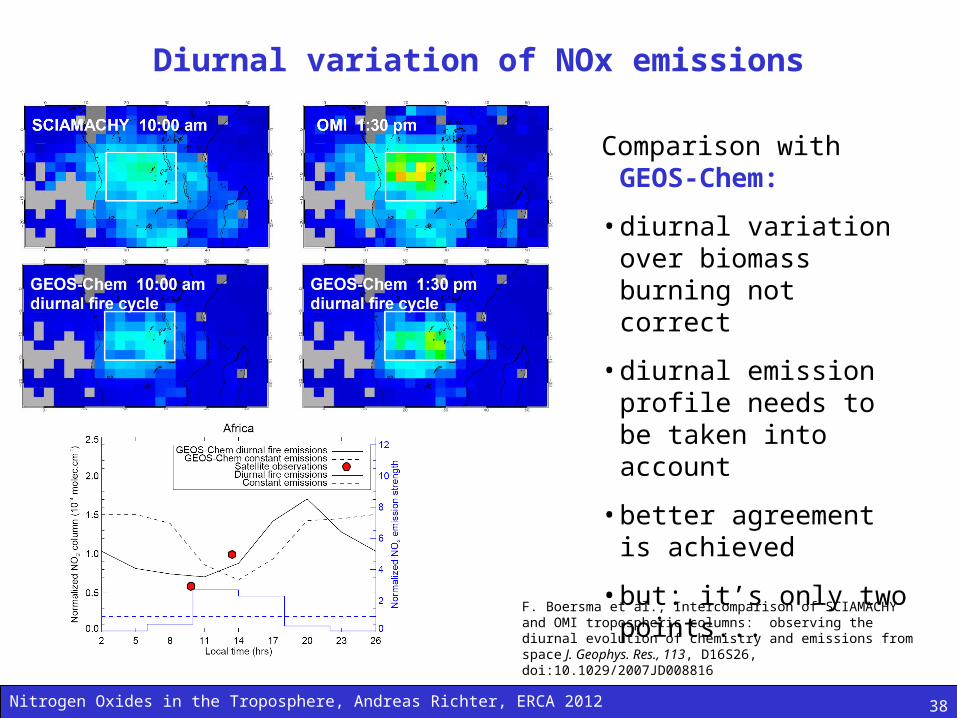
Diurnal variation of NOx emissions
Comparison with GEOS-Chem:
• diurnal variation over biomass burning not correct
• diurnal emission profile needs to be taken into account
• better agreement is achieved
• but: it’s only two points...
F. Boersma et al., Intercomparison of SCIAMACHY and OMI tropospheric columns: observing the diurnal evolution of chemistry and emissions from space J. Geophys. Res., 113, D16S26, doi:10.1029/2007JD008816
Nitrogen Oxides in the Troposphere, Andreas Richter, ERCA 2012 39
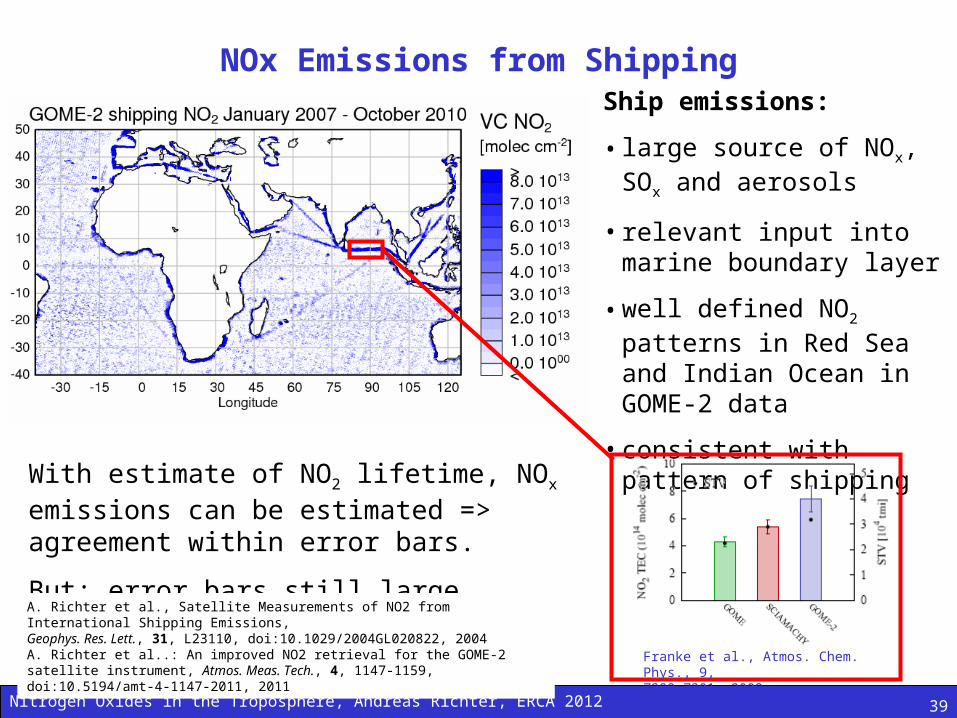
NOx Emissions from ShippingShip emissions:
• large source of NOx, SOx and aerosols
• relevant input into marine boundary layer
• well defined NO2 patterns in Red Sea and Indian Ocean in GOME-2 data
• consistent with pattern of shipping
With estimate of NO2 lifetime, NOx emissions can be estimated => agreement within error bars.
But: error bars still large (mainly from lifetime) A. Richter et al., Satellite Measurements of NO2 from International Shipping Emissions, Geophys. Res. Lett., 31, L23110, doi:10.1029/2004GL020822, 2004A. Richter et al..: An improved NO2 retrieval for the GOME-2 satellite instrument, Atmos. Meas. Tech., 4, 1147-1159, doi:10.5194/amt-4-1147-2011, 2011
Franke et al., Atmos. Chem. Phys., 9, 7289-7301, 2009
Nitrogen Oxides in the Troposphere, Andreas Richter, ERCA 2012
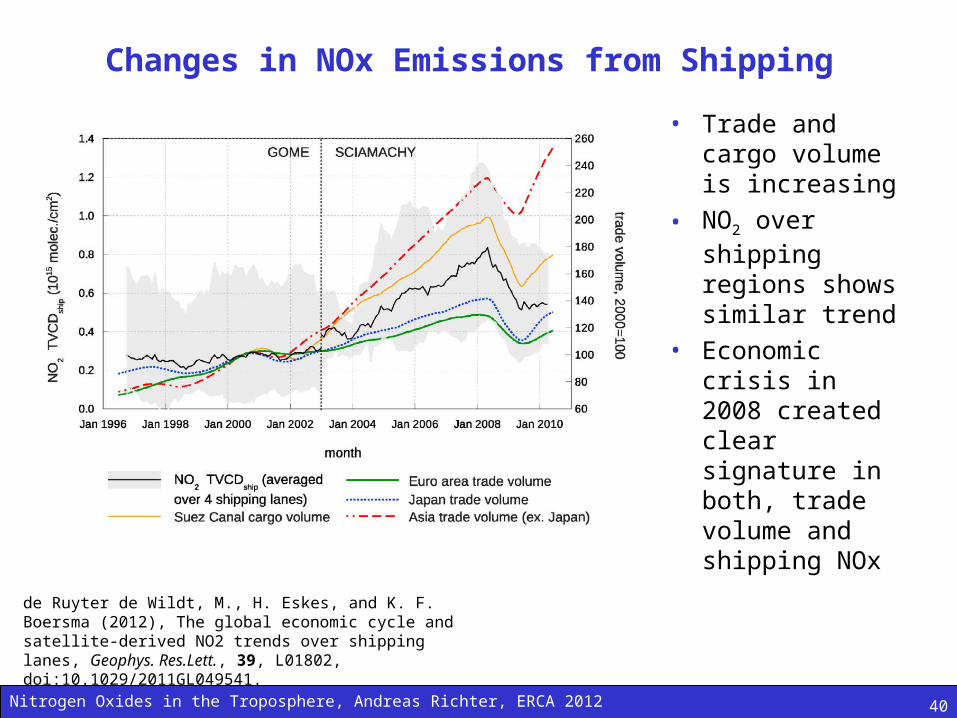
Changes in NOx Emissions from Shipping
• Trade and cargo volume is increasing
• NO2 over shipping regions shows similar trend
• Economic crisis in 2008 created clear signature in both, trade volume and shipping NOx
40
de Ruyter de Wildt, M., H. Eskes, and K. F. Boersma (2012), The global economic cycle and satellite-derived NO2 trends over shipping lanes, Geophys. Res.Lett., 39, L01802, doi:10.1029/2011GL049541.
Nitrogen Oxides in the Troposphere, Andreas Richter, ERCA 2012 41
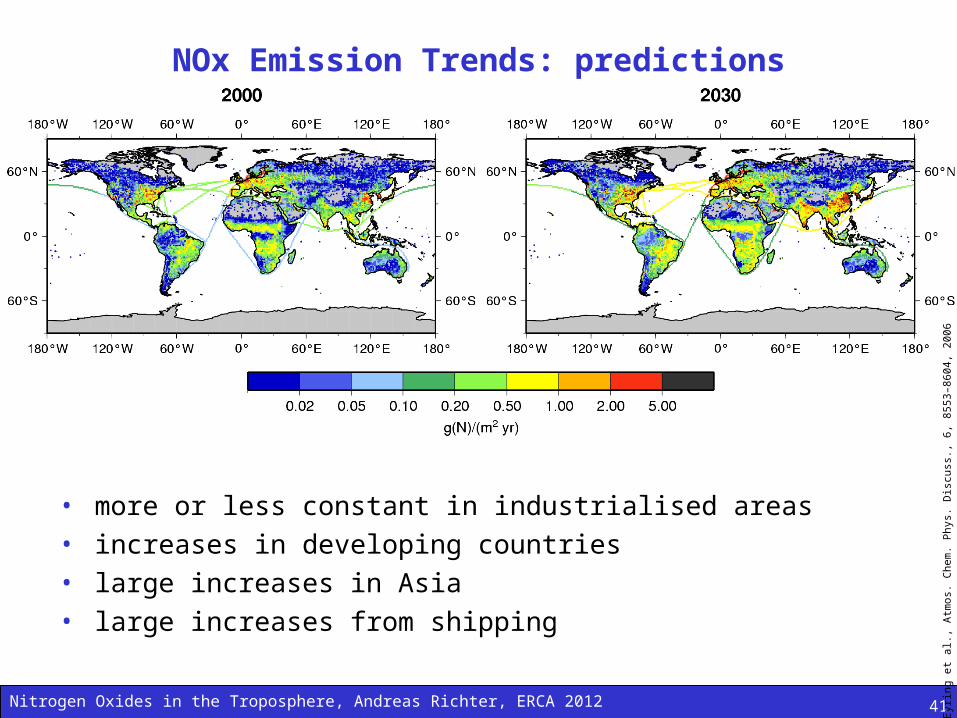
NOx Emission Trends: predictions
• more or less constant in industrialised areas• increases in developing countries• large increases in Asia• large increases from shipping
Eyr
ing
et a
l., A
tmos
. C
hem
. P
hys.
Dis
cuss
., 6
, 85
53–8
604,
200
6
Nitrogen Oxides in the Troposphere, Andreas Richter, ERCA 2012 42
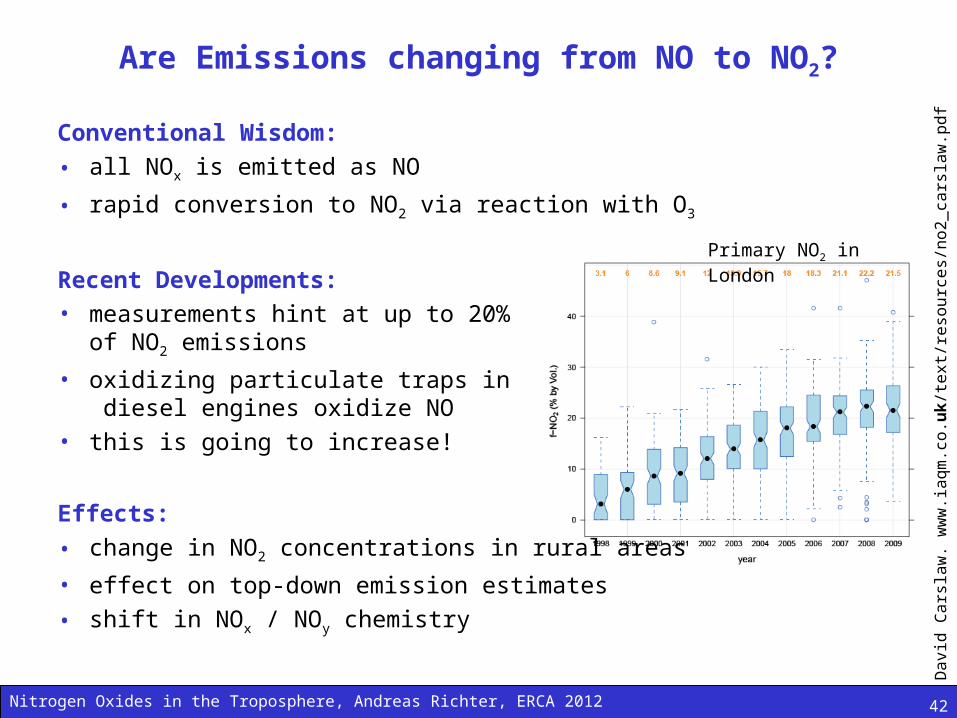
Are Emissions changing from NO to NO2?
Conventional Wisdom:
• all NOx is emitted as NO
• rapid conversion to NO2 via reaction with O3
Recent Developments:• measurements hint at up to 20%
of NO2 emissions
• oxidizing particulate traps in diesel engines oxidize NO
• this is going to increase!
Effects:
• change in NO2 concentrations in rural areas
• effect on top-down emission estimates
• shift in NOx / NOy chemistry
Da
vid
Ca
rsla
w.
ww
w.ia
qm
.co
.uk
/te
xt/r
eso
urc
es/
no
2_
cars
law
.pd
f
Primary NO2 in London
Nitrogen Oxides in the Troposphere, Andreas Richter, ERCA 2012 43
Summary
• NOx (NO + NO2) in the troposphere is relevant for ozone chemistry, acid deposition
• NOx emissions are both natural (soils, lightning, fires) and anthropogenic (fossil fuels, fires), the latter dominating
• NOx can be measured in-situ, NO2 also by spectroscopic methods both locally and from satellite
• satellite measurements provide interesting insights in many aspects of NOx emissions and chemistry
• NOx emissions are changing with decreasing values in the already industrialised countries (improved technology, fuel changes) and increasing values in the industrialising countries (intensified used of fossil fuels) with some short term effects of economic crisis
• technological changes can have unexpected results on NOx emissions (e.g. diesel engines, soot filters)
=> we are not going to run out of interesting NOx topics anytime soon!


![Surface and lightning sources of nitrogen oxides …acmg.seas.harvard.edu/publications/2007/hudman2007.pdf[3] Ozone production in the troposphere is principally limited by the supply](https://img.pdfslide.us/doc/110x75/5e911253145c592661096692/surface-and-lightning-sources-of-nitrogen-oxides-acmgseas-3-ozone-production.jpg)