Embed Size (px)
Citation preview
State of CaliforniaAir Resources Board
Method 20
Determination of Nitrogen Oxides, Sulfur Dioxide andDiluent Emissions from Stationary Gas Turbines
Adopted: March 28, 1986Amended: July 1, 1999
July 1999 CARB Method 20 Page 1
Method 20 - Determination of Nitrogen Oxides, Sulfur Dioxide, and DiluentEmissions from Stationary Gas Turbines
1. APPLICABILITY AND PRINCIPLE
1.1 Applicability. This method is applicable for the determination of nitrogenoxides (NOx), sulfur dioxide (SO2), and a diluent gas, either oxygen (O2) or carbondioxide (CO2), emissions from stationary gas turbines. For the NOx and diluentdeterminations, this method includes: (1) measurement system design criteria, (2)analyzer performance specifications and performance test procedures; and (3)procedures for emission testing.
1.2 Principle. A gas sample in continuously extracted from the exhaust stream ofa stationary gas turbine; a portion of the sample stream is conveyed toinstrumental analyzers for determination of NOx and diluent content. During eachNOx and diluent determination, a separate measurement of SO2 emissions ismade, using Method 6, or its equivalent. The diluent determination is used toadjust the NOx and SO2 concentrations to a reference condition.
Any modification of this method beyond those expressly permitted shall beconsidered a major modification subject to the approval of the Executive Officer.The term Executive Officer as used in this document shall mean the ExecutiveOfficer of the Air Resources Board (ARB), or his or her authorized representative.
2. DEFINITIONS
2.1 Measurement System. The total equipment required for the determination ofa gas concentration or a gas emission rate. The system consists of the followingmajor subsystems:
2.1.1 Sample Interface. That portion of a system that is used for one ormore of the following: sample acquisition, sample transportation, sampleconditioning, or protection of the analyzers from the effects of the stackeffluent.
2.1.2 NOx Analyzer. That portion of the system that senses NOx andgenerates an output proportional to the gas concentration.
2.1.3 O2 Analyzer. That portion of the system that senses O2 and generatesan output proportional to the gas concentration.
2.1.4 CO2 Analyzer. That portion of the system that senses CO2 andgenerates an output proportional to the gas concentration.
2.1.5 Data Recorder. That portion of the measurement system that provides
July 1999 CARB Method 20 Page 2
a permanent record of the analyzer(s) output. The data recorder may includeautomatic data reduction capabilities.
2.2 Span Value. The upper limit of a gas concentration measurement range thatis specified for affected source categories in the applicable part of the regulations.
2.3 Calibration Gas. A known concentration of a gas in an appropriate diluentgas.
2.4 Calibration Error. The difference between the gas concentration indicated bythe measurement system and the known concentration of the calibration gas.
2.5 Zero Drift. The difference in the measurement system output readings fromzero after a stated period of operation during which no unscheduled maintenance,repair, or adjustment took place and the input concentration at the time of themeasurements was zero.
2.6 Calibration Drift. The difference in the measurement system output readingsfrom the known concentration of the calibration gas after a stated period ofoperation during which no unscheduled maintenance, repair, or adjustment tookplace and the input at the time of the measurements was a high-level value.
2.7 Response Time. The amount of time required for the continuous monitoringsystem to display on the data output 95 percent of a step change in pollutantconcentration.
2.8 Interference Response. The output response of the measurement system toa component in the sample gas other than the gas component being measured.
3. MEASUREMENT SYSTEM PERFORMANCE SPECIFICATIONS
3.1 NO2 to NO Converter. Greater than 90 percent conversion efficiency of NO2
to NO.
3.2 Interference Response. Less than ±2 percent of span value.
3.3 Response Time. No greater than 30 seconds.
3.4 Zero Drift. Less than ±2 percent of span value over the period of each testrun.
3.5 Calibration Drift. Less than ±2 percent of span value over the period of eachtest run.
July 1999 CARB Method 20 Page 3
4. APPARATUS AND REAGENTS
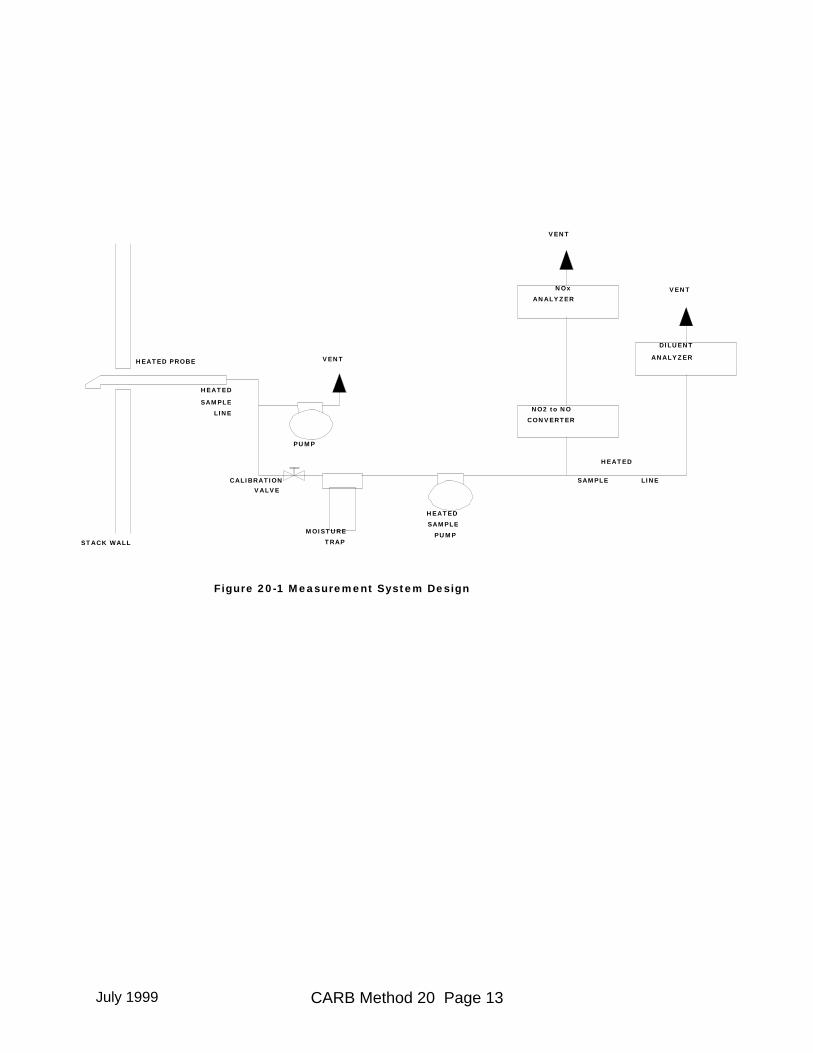
4.1 Measurement System. Use any measurement system for NOx and diluentthat is expected to meet the specifications in this method. A schematic of anacceptable measurement system is shown in Figure 20-1. The essentialcomponents of the measurement system are described below:
4.1.1 Sample Probe. Heated stainless steel, or equivalent, open-ended,straight tube of sufficient length to traverse the sample points.
4.1.2 Sample Line. Heated (>95oC) stainless steel or Teflon tubing totransport the sample gas to the sample conditioners and analyzers.
4.1.3 Calibration Valve Assembly. A three-way valve assembly to directthe zero and calibration gases to the sample conditioners and to theanalyzers. The calibration valve assembly shall be capable of blocking thesample gas flow and of introducing calibration gases to the measurementsystem when in the calibration mode.
4.1.4 NO2 to NO Converter. That portion of the system that converts NO2 inthe sample gas to NO. Some analyzers are designed to measure NOx asNO2 on a wet basis and can be used without an NO2 to NO converter or amoisture removal trap provided the sample line to the analyzer is heated(>95oC) to the inlet of the analyzer. In addition, an NO2 to NO converter is notnecessary if the NO2 portion of the exhaust gas is less than 5 percent of thetotal NOx concentration. As a guideline, an NO2 to NO converter is notnecessary if the gas turbine is operated at 90 percent or more of peak loadcapacity. A converter is necessary under lower load conditions.
4.1.5 Moisture Removal Trap. A refrigerator-type condenser or other typedevice designed to remove continuously condensate from the sample gaswhile maintaining minimal contact between any condensate and the samplegas. The moisture removal trap is not necessary for analyzers that canmeasure NOx concentrations on a wet basis; for these analyzers, (a) heat thesample line up to the inlet of the analyzers, (b) determine the moisturecontent using methods subject to the approval of the Executive Officer, and(c) correct the NOx and diluent concentration to a dry basis.
4.1.6 Particulate Filter. An in-stack or an out-of-stack glass fiber filter, ofthe type specified in Method 5; however, an out-of-stack filter isrecommended when the stack gas temperature exceeds 250 to 300oC.
4.1.7 Sample Pump. A nonreactive leak-free sample pump to pull thesample gas through the system at a flow rate sufficient to minimize transportdelay. The pump shall be made from stainless steel or coated with Teflon, orequivalent.
July 1999 CARB Method 20 Page 4
4.1.8 Sample Gas Manifold. A sample gas manifold to divert portions of thesample gas stream to the analyzers. The manifold may be constructed ofglass, Teflon, stainless steel, or equivalent.
4.1.9 Diluent Gas Analyzer. An analyzer to determine the percent O2 orCO2 concentration of the sample gas stream.
4.1.10 Nitrogen Oxides Analyzer. An analyzer to determine the ppm NOx
concentration in the sample gas stream.
4.1.11 Data Output. A strip-chart recorder, analog computer, or digitalrecorder for recording measurement data.
4.2 SO2 Analysis. Method 6 apparatus and reagents.
4.3 NOx Calibration Gases. The calibration gases for the NOx analyzer shall beNO in N2. Use four calibration gas mixtures as specified below:
4.3.1 High-level Gas. A gas concentration that is equivalent to 80 to90 percent of the span value.
4.3.2 Mid-level Gas. A gas concentration that is equivalent to 45 to 55percent of the span value.
4.3.3 Low-level Gas. A gas concentration that is equivalent to 20 to 30percent of the span value.
4.3.4 Zero Gas. A gas concentration of less than 0.25 percent of the spanvalue. Ambient air may be used for the NOx zero gas.
4.4 Diluent Calibration Gases.
4.4.1 For O2 calibration gases, use purified air at 20.9 percent O2 as the high-level O2 gas. Use a gas concentration between 11 and 15 percent O2 in N2
for the mid-level gas. Use purified N2 for the zero gas.
4.4.2 For CO2 calibraton gases, use a gas concentration between 8 and 12percent CO2 in air for the high-level CO2 gas. Use a gas concentrationbetween 2 and 5 percent CO2 in air for the mid-level gas, and use purified air(<100 ppm CO2) as the zero level calibration gas.
5. MEASUREMENT SYSTEM PERFORMANCE TEST PROCEDURES
Perform the following procedures before measurement of emissions (Section 6) andonly once for each test program, i.e., the series of all test runs for a given gas turbine
July 1999 CARB Method 20 Page 5
engine.
5.1 Calibration Gas Checks. There are two alternatives for checking gases.
(a) The first is to use calibration gases that are documented traceable to NationalBureau of Standards Reference Materials. Use "Traceability Protocol forEstablishing True Concentrations of Gases Used for Calibrations and Audits ofContinuous Source Emission Monitors" (Protocol Number 1) that is available fromthe Environmental Monitoring Support Laboratory, Quality Assurance Branch, MailDrop 77, Environmental Protection Agency, Research Triangle Park, NC 27711.Obtain a certification from the gas manufacturer that the protocol was followed.These calibration gases are not to be analyzed with the Reference Methods.
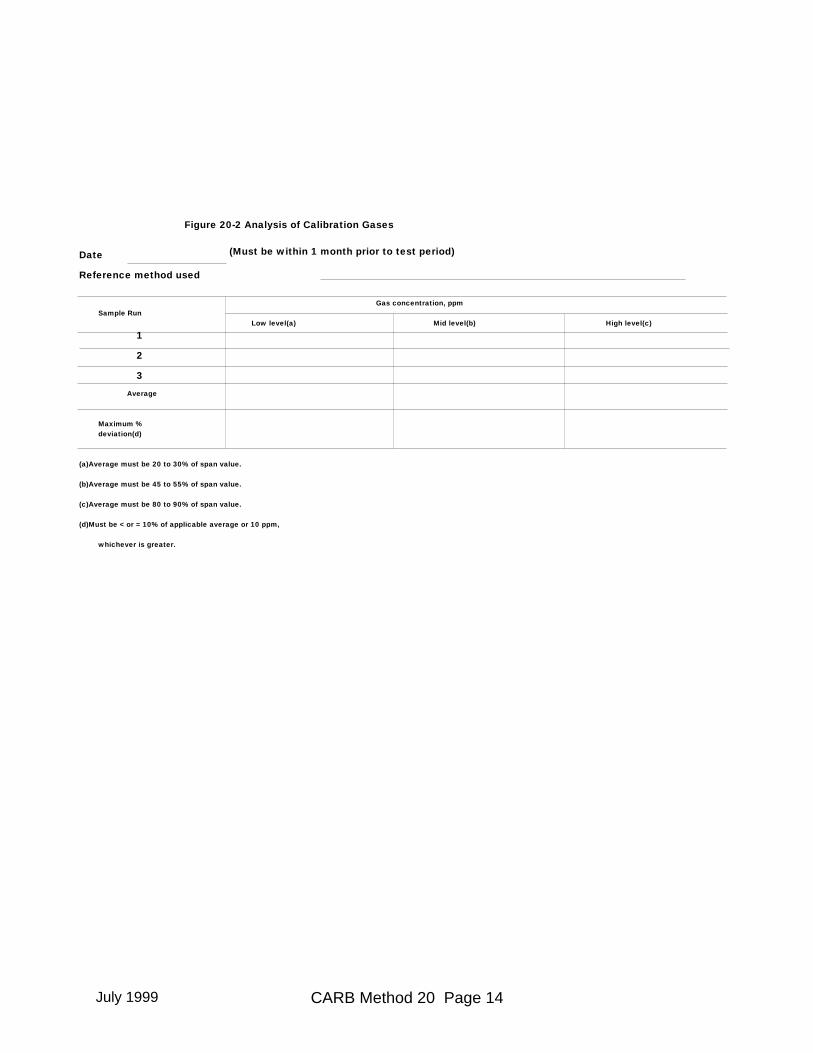
(b) The second alternative is to use calibration gases not prepared according tothe protocol. If this alternative is chosen, within 1 month prior to the emission test,analyze each of the calibration gas mixtures in triplicate using Method 7 or analternative procedure approved by the United States Environmental ProtectionAgency for NOx and use Method 3 for O2 or CO2 . Record the results on a datasheet (example is shown in Figure 20-2). For the low-level, mid-level, or high-levelgas mixtures, each of the individual NOx analytical results must be within 10percent (or 10 ppm, whichever is greater) of the triplicate set average (O2 or CO2
test results must be within 0.5 percent O2 or CO2 ); otherwise, discard the entireset and repeat the triplicate analyses. If the average of the triplicate referencemethod test results is within 5 percent for NOx gas or 0.5 percent O2 or CO2 for theO2 or CO2 gas of the calibration gas manufacturer's tag value, use the tag value;otherwise, conduct at least three additional reference method test analyses untilthe results of six individual NOx runs (the three original plus three additional) agreewithin 10 percent (or 10 ppm, whichever is greater) of the average (O2 or CO2 testresults must be within 0.5 percent O2 or CO2 ). Then use this average for thecylinder value.
5.2 Measurement System Preparation. Before the emission test, assemble themeasurement system following the manufacturer's written instructions in preparingand operating the NO2 to NO converter, the NOx analyzer, the diluent analyzer,and other components.
5.3 Calibration Check. Conduct the calibration checks for both the NOx and thediluent analyzers as follows:
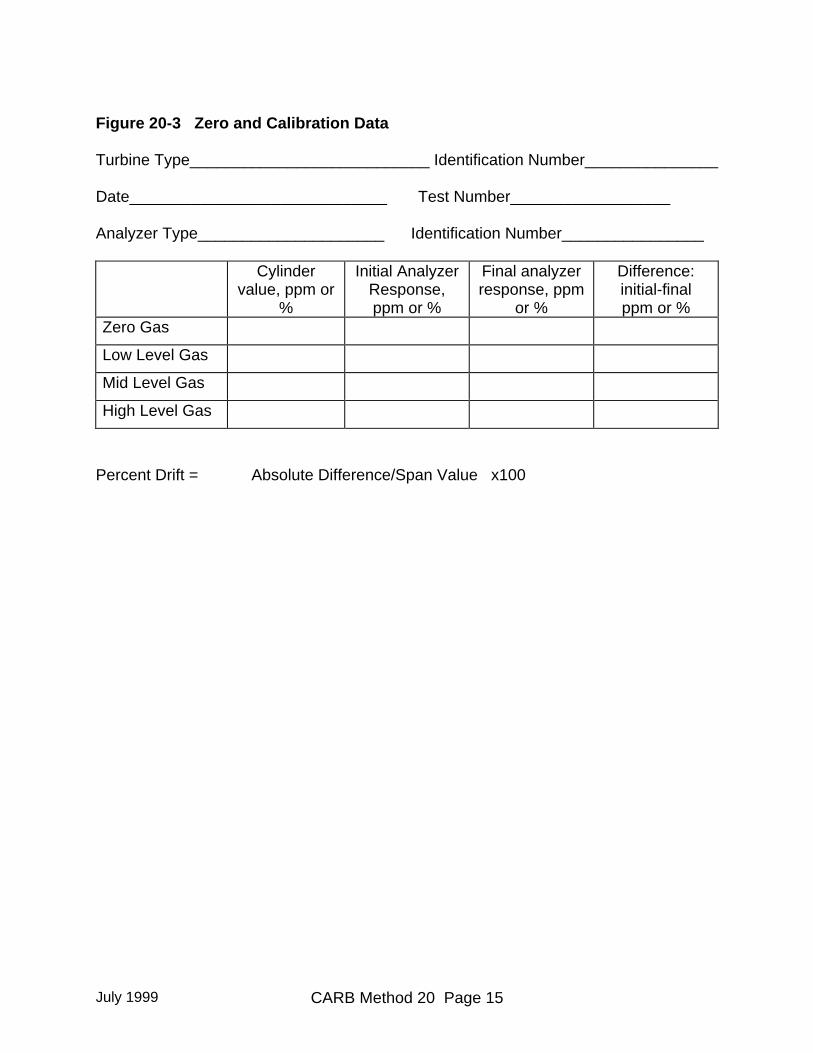
5.3.1 After the measurement system has been prepared for use (Section5.2), introduce zero gases and the mid-level calibration gases; set theanalyzer output responses to the appropriate levels. Then introduce each ofthe remainder of the calibration gases described in Section 4.3 or 4.4, one ata time, to the measurement system. Record the responses on a form similarto Figure 20-3.
July 1999 CARB Method 20 Page 6
5.3.2 If the linear curve determined from the zero and mid-level calibrationgas responses does not predict the actual response of the low-level (notapplicable for the diluent analyzer) and high-level gases within ±2 percent ofthe span value, the calibration shall be considered invalid. Take correctivemeasures on the measurement system before proceeding with the test.
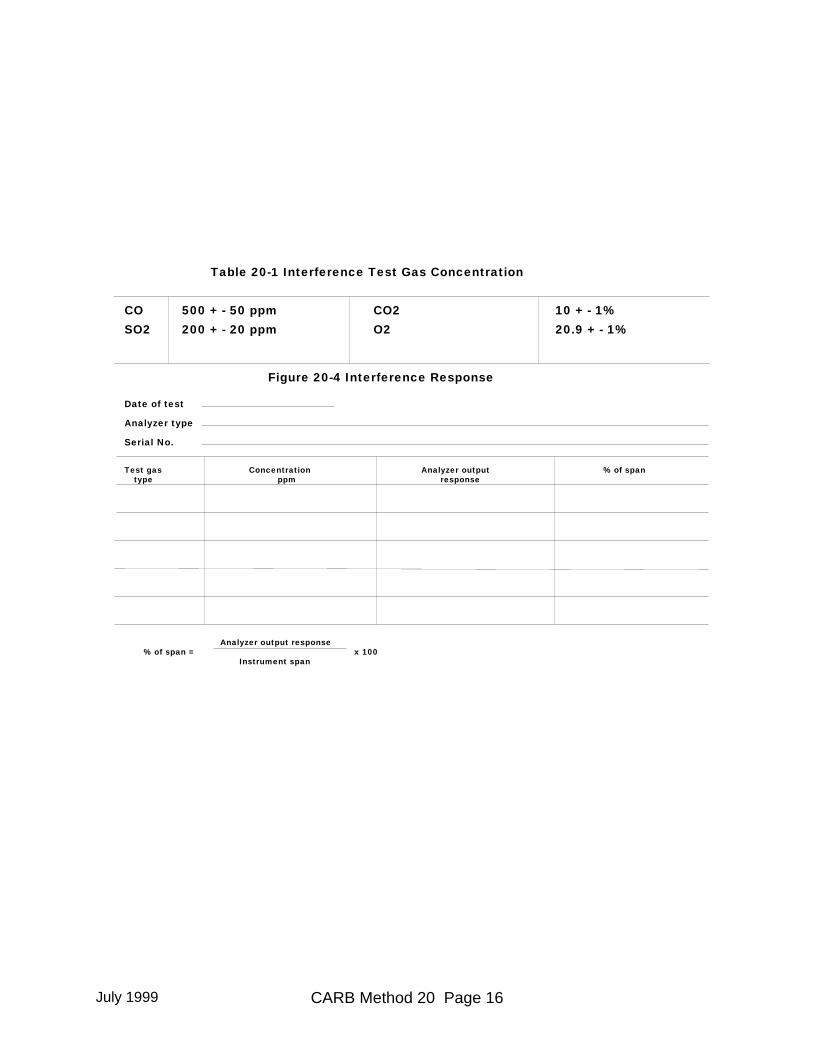
5.4 Interference Response.
Introduce the gaseous components listed in Table 20-1 into the measurementsystem separately, or as gas mixtures. Determine the total interference outputresponse of the system to these components in concentration units; record thevalues on a form similar to Figure 20-4. If the sum of the interference responses ofthe test gases for either the NOx or diluent analyzer is greater than 2 percent of theapplicable span value, take corrective measures on the measurement system.
Conduct an interference response test of each analyzer before its initial use in thefield. Thereafter, recheck the measurement system if changes are made in theinstrumentation that could alter the interference response, e.g., changes in the typeof gas detector.
In lieu of conducting the interference response test, instrument vendor data, whichdemonstrate that for the test gases of Table 20-1 the interference performancespecification is not exceeded, are acceptable.
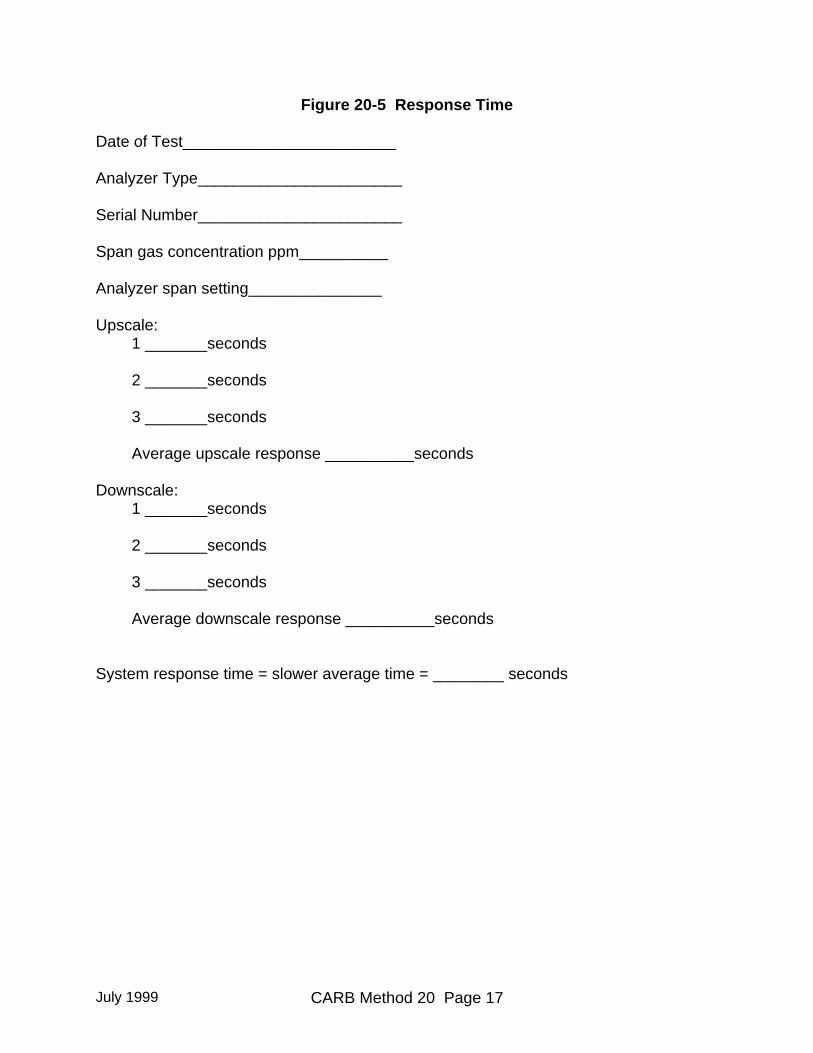
5.5 Response Time. To determine response time, first introduce zero gas intothe system at the calibration valve until all readings are stable; then, switch tomonitor the stack effluent until a stable reading can be obtained. Record theupscale response time. Next, introduce high-level calibration gas into the system.Once the system has stabilized at the high-level calibration concentration, switch tomonitor the stack effluent and wait until a stable value is reached. Record thedownscale response time. Repeat the procedure three times. A stable value isequivalent to a change of less than 1 percent of span value for 30 seconds or lessthan 5 percent of the measured average concentration for 2 minutes. Record theresponse time data on a form similar to Figure 20-5, the readings of the upscale ordownscale response time, and report the greater time as the "response time" forthe analyzer. Conduct a response time test before the initial field use of themeasurement system, and repeat if changes are made in the measurementsystem.
5.6 NO2 to NO Conversion Efficiency.
5.6.1 Add gas from the mid-level NO in N2 calibration gas cylinder to a clean,evacuated, leak-tight Tedlar bag. Dilute this gas approximately 1:1 with20.9 percent O2, purified air. Immediately attach the bag outlet to thecalibration valve assembly and begin operation of the sampling system.Operate the sampling system, recording the NOx response, for at least 30
July 1999 CARB Method 20 Page 7
minutes. If the NO2 to NO conversion is 100 percent, the instrumentresponse will be stable at the highest peak value observed. If the response atthe end of 30 minutes decreases more than 2.0 percent of the highest peakvalue, the system is not acceptable and corrections must be made beforerepeating the check.
5.6.2 Alternatively, the NO2 to NO converter check described in CFR Title 40,Part 86 Section 86.332-79, “Oxides of Nitrogen Analyzer Calibration”, may beused. Other alternative procedures may be used with approval of theExecutive Officer.
6. EMISSION MEASUREMENT TEST PROCEDURE
6.1 Preliminaries.
6.1.1 Selection of a Sampling Site. Select a sampling site as close aspractical to the exhaust of the turbine. Turbine geometry, stack configuration,internal baffling, and point of introduction of dilution air will vary for differentturbine designs. Thus, each of these factors must be given specialconsideration in order to obtain a representative sample. Whenever possible,the sampling site shall be located upstream of the point of introduction ofdilution air into the duct. Sample ports may be located before or after theupturn elbow, in order to accommodate the configuration of the turning vanesand baffles and to permit a complete, unobstructed traverse of the stack. Thesample ports shall not be located within 5 feet or 2 diameters (whichever isless) of the gas discharge to atmosphere. For supplementary-fired,combined-cycle plants, the sampling site shall be located between the gasturbine and the boiler. The diameter of the sample ports shall be sufficient toallow entry of the sample probe.
6.1.2 A preliminary O2 or CO2 traverse is made for the purpose of selectingsampling points of low O2 values or high CO2 concentrations as appropriatefor the measurement system. Conduct this test at the turbine operatingcondition that is the lowest percentage of peak load operation included in theprogram. Follow the procedure below or alternative procedures subject to theapproval of the Executive Officer.
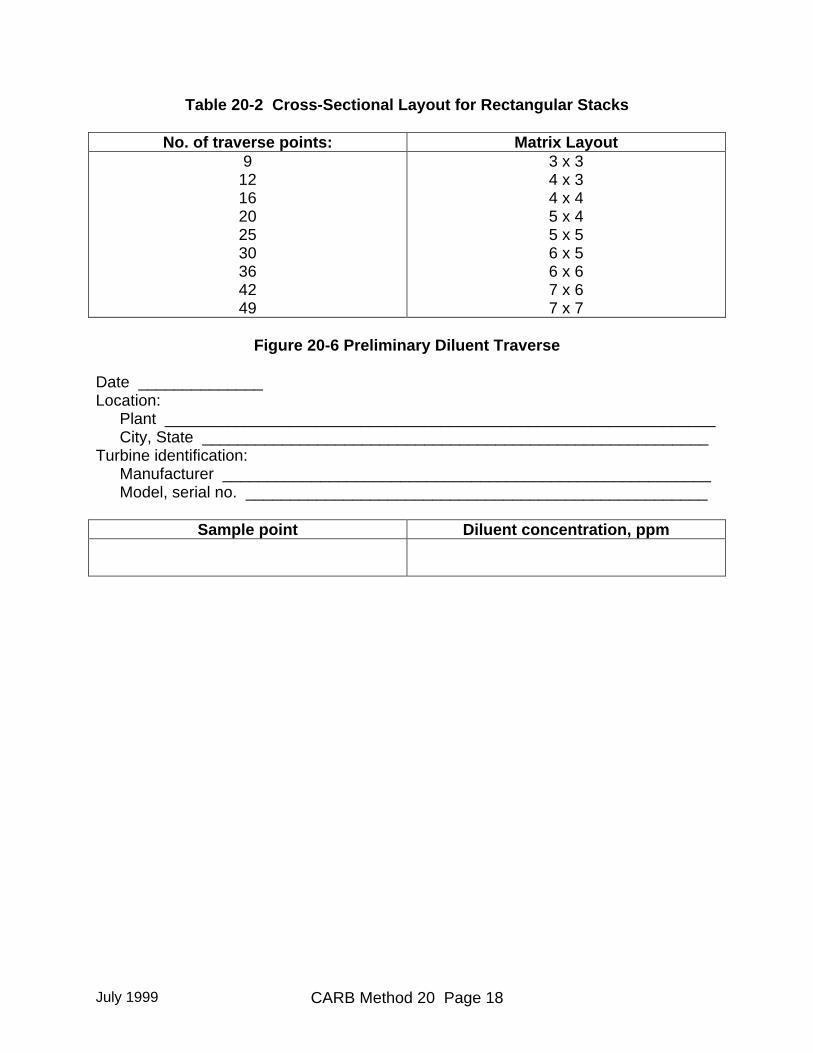
6.1.2.1 Minimum Number of Points. Select a minimum number ofpoints as follows: (1) Eight, for stacks having cross-sectional areas lessthan 1.5 m2 (16.1 ft2); (2) eight plus one additional sample point for each0.2 m2 (2.2 ft2) of area, for stacks of 1.5 m2 to 10.0 m2 (16.1 to 107.6 ft2)in crosssectional area; and (3) 49 sample points (48 for circular stacks)for stacks greater than 10.0 m2 (107.6 ft2) in cross-sectional area. Notethat for circular ducts, the number of sample points must be a multiple of4, and for rectangular ducts, the number of points must be one of thoselisted in Table 20-2; therefore, round off the number of points (upward),
July 1999 CARB Method 20 Page 8
when appropriate.
6.1.2.2 Cross-sectional Layout and Location of Traverse Points.After the number of traverse points for the preliminary diluent samplinghas been determined, use Method 1 to locate the traverse points.
6.1.2.3 Preliminary Diluent Measurement. While the gas turbine isoperating at the lowest percent of peak load, conduct a preliminarydiluent measurement as follows: Position the probe at the first traversepoint and begin sampling. The minimum sampling time at each pointshall be 1 minute plus the average system response time. Determinethe average steady-state concentration of O2 or CO2 at each point andrecord the data on Figure 20-6.
6.1.2.4 Selection of Emission Test Sampling Points. Select the eightsampling points at which the lowest O2 concentrations or highest CO2
concentrations were obtained. Sample at each of these selected pointsduring each run at the different load conditions. More than eight pointsmay be used, if desired, providing that the points selected as describedabove are included.
6.2 NOx and Diluent Measurement. This test is to be conducted at each of thespecified load conditions. Three test runs at each load condition constitute acomplete test.
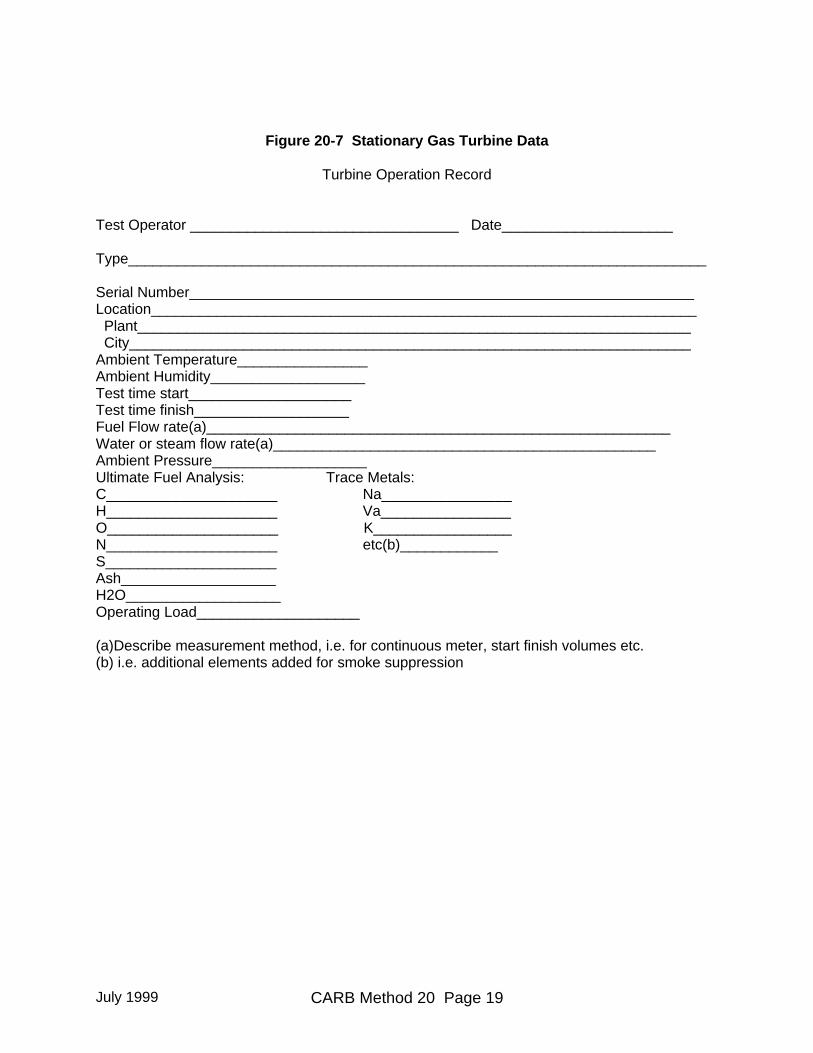
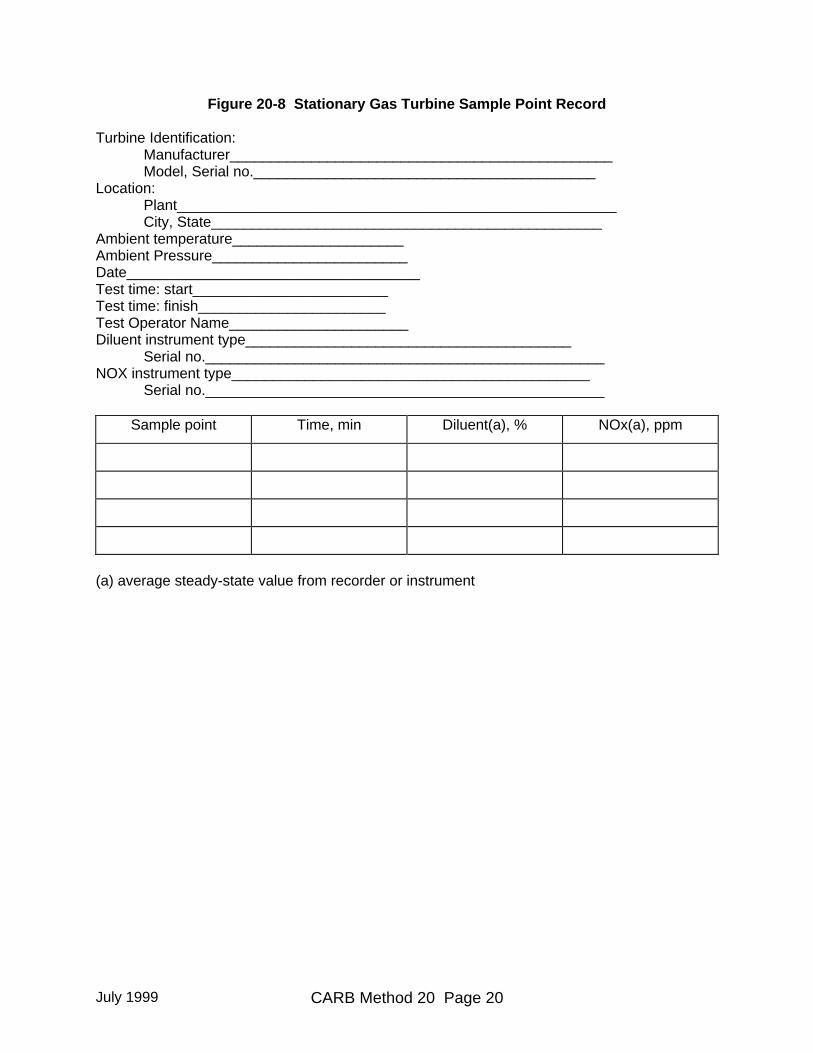
6.2.1 At the beginning of each NOx test run and, as applicable, during therun, record turbine data as indicated in Figure 20-7. Also, record the locationand number of the traverse points on a diagram.
6.2.2 Position the probe at the first point determined in the preceding sectionand begin sampling. The minimum sampling time at each point shall be atleast 1 minute plus the average system response time. Determine theaverage steady-state concentration of diluent and NOx at each point andrecord the data on Figure 20-8.
6.2.3 After sampling the last point, conclude the test run by recording thefinal turbine operating parameters and by determining the zero and calibrationdrift, as follows: Immediately following the test run at each load condition, orif adjustments are necessary for the measurement system during the tests,reintroduce the zero and mid-level calibration gases as described in Sections4.3 and 4.4, one at a time, to the measurement system at the calibration valveassembly. (Make no adjustments to the measurement system until after thedrift checks are made). Record the analyzers' responses on a form similar toFigure 20-3. If the drift values exceed the specified limits, the test runpreceding the check is considered invalid and will be repeated followingcorrections to the measurement system. Alternatively, recalibrate the
July 1999 CARB Method 20 Page 9
measurement system and recalculate the measurement data. Report the testresults based on both the initial calibration and the recalibration data.
6.3 SO2 Measurement.
This test is conducted only at the 100 percent peak load condition. Determine SO2
using Method 6, or equivalent, during the test. Select a minimum of six total pointsfrom those required for the NOx measurements; use two points for each samplerun. The sample time at each point shall be at least 10 minutes. Average thediluent readings taken during the NOx test runs at sample points corresponding tothe SO2 traverse points (see Section 6.2.2) and use this average diluentconcentration to correct the integrated SO2 concentration obtained by Method 6 to15 percent O2 (see equations in Section 7.3).
If the applicable regulation allows fuel sampling and analysis for fuel sulfur contentto demonstrate compliance with regulatory requirements, emission sampling withMethod 6 is not required, provided the fuel sulfur content meets the limits of theregulation.
7. EMISSION CALCULATIONS
7.1 Moisture Correction. Measurement data used in most of these calculationsmust be on a dry basis. If measurements must be corrected to dry conditions, usethe following equation:
where:
Cd = Pollutant or diluent concentration adjusted to dry conditions, ppm orpercent
Cw = Pollutant or diluent concentration measured under moist sampleconditions, ppm or percent.
Bws = Moisture content of sample gas as measured with Method 4 oranother method approved by the Executive Officer, percent/100.
7.2 CO2 Correction Factor. If pollutant concentrations are to be corrected to 15percent O2 and CO2 concentration is measured in lieu of O2 concentrationmeasurement, a CO2 correction factor is needed. Calculate the CO2 correctionfactor as follows:
7.2.1 Calculate the fuel-specific F0 value for the fuel burned during the testusing values obtained from EPA Method 19, Section 3, and the followingequation.
C = C
1-B Eq. 20 -1d
w
ws
F = 0.209 F
F Eq. 20 - 2o
d
c
July 1999 CARB Method 20 Page 10
where:Fo = Fuel factor based on the ratio of oxygen volume to the
ultimate CO2 volume produced by the fuel at zero percentexcess air, dimensionless.
0.209 = Fraction of air that is oxygen, percent/100.Fd = Ratio of the volume of dry effluent gas to the gross calorific
value of the fuel from EPA Method 19, dsm3/J (dscf/106 Btu).Fc = Ratio of the volume or carbon dioxide produced to the gross
calorific value of the fuel from EPA Method 19, dsm3/J(dscf/106 Btu).
7.2.2 Calculate the CO2 correction factor for correcting measurement data to15 percent oxygen, as follows:
where:XCO2 = CO2 Correction factor, percent.5.9 = 20.9 percent O2 - 15 percent O2, the defined O2 correction value,
percent.
7.3 Correction of Pollutant Concentrations to 15 percent O2. Calculate theNOx and SO2 gas concentrations adjusted to 15 percent O2 using Equation 20-4 or20-5, as appropriate. The correction to 15 percent O2 is very sensitive to theaccuracy of the O2 or CO2 concentration measurement. At the level of theanalyzer drift specified in Section 3, the O2 or CO2 correction can exceed 5 percentat the concentration levels expected in gas turbine exhaust gases. Therefore, O2
or CO2 analyzer stability and careful calibration are necessary.
7.3.1 Correction of Pollutant Concentration Using O2 Concentration.Calculate the O2 corrected pollutant concentration, as follows:
where:Cadj = Pollutant concentration corrected to 15 percent O2, ppm.Cd = Pollutant concentration measured, dry basis, ppm.%O2 = Measured O2 concentration dry basis, percent.
7.3.2 Correction of Pollutant Concentration Using CO2 Concentration.Calculate the CO2 corrected pollutant concentration, as follows:
X = 5.9F
Eq. 20 - 3COo
2
C = C 5.9
20.9 - %O Eq. 20 - 4adj d
2
C = C X
%CO Eq. 20 - 5adj d
CO
2
2
July 1999 CARB Method 20 Page 11
where:%CO2 = Measured CO2 concentration, dry basis, percent.
7.4 Average Adjusted NOx Concentration. Calculate the average adjusted NOx
concentration by summing the point values and dividing by the number of points.
7.5 NOx and SO2 Emission Rate Calculations. The emission rates for NOx andSO2 in units of pollutant mass per quantity of heat input can be calculated usingthe pollutant and diluent concentrations and fuel-specific F-factors based on thefuel combustion characteristics. The measured concentrations of pollutant in unitsof parts per million by volume (ppm) must be converted to mass per unit volumeconcentration units for these calculations. Use the following table for suchconversions:
CONVERSION FACTORS FOR CONCENTRATION
To convert...From To Multiply byg/sm3 ng/sm3 109
mg/sm3 ng/sm3 106
lb/scf ng/sm3 1.602 x 10¹³
ppm (SO2) ng/sm3 2.660 x 10⁶
ppm (NOx) ng/sm3 1.912 x 10⁶
ppm (SO2) lb/scf 1.660 x 10⁻⁷
ppm (NOx) lb/scf 1.194 x 10⁻⁷
7.5.1 Calculation of Emission Rate Using Oxygen Correction. Both theO2 concentration and the pollutant concentration must be on a dry basis.Calculate the pollutant emission rate, as follows:
where:E = Mass emission rate of pollutant, ng/J (lb/106 Btu).
7.5.2 Calculation of Emission Rate Using Carbon Dioxide Correction.The CO2 concentration and the pollutant concentration may be on either a drybasis or a wet basis, but both concentrations must be on the same basis forthe calculations. Calculate the pollutant emission rate using Equation 20-7 or20-8:
E = C F 20.9
20.9 - %O Eq. 20 - 6d d
2
E = C F 100
%CO Eq. 20 - 7d c
2
July 1999 CARB Method 20 Page 12
where:
Cw = Pollutant concentration measured on a moist sample basis,ng/sm3 (lb/scf).
%CO2 W = CO2 concentration measured on a moist sample basis,percent.
8. BIBLIOGRAPHY
1. EPA Method 20, Determination of Nitrogen Oxides, Sulfur Dioxide and DiluentEmissions from Stationary Gas Turbines, CFR40, Part 60, Appendix A
2. EPA Method 19, Determination of Surfur Dioxide Removal Efficiency andParticulate Matter, Sulfur Dioxide, and Nitrogen Oxides Emission Rates, CFR40,Part 60, Appendix A
3. ARB Method 1, Sample and Velocity Traverses for Stationary Sources
4 ARB Method 3, Gas Analysis for Carbon Dioxide, Oxygen, Excess Air, and DryMolecular Weight
5 ARB Method 4, Determination of Moisture Content in Stack Gases
6 ARB Method 5, Determination of Particulate Matter Emissions from StationarySources
7 ARB Method 6, Determination of Sulfur Dioxide Emissions from Stationary Sources
8 ARB Method 7, Determination of Nitrogen Oxide Emissions from StationarySources
E = C F 100
%CO Eq. 20 - 8w c
2w
July 1999 CARB Method 20 Page 13
Figure 20-1 Measurement System Design
STACK WALL
HEATED PROBE
HEATED
HEATED
SAMPLE
SAMPLE LINE
LINE
CALIBRATIONVALVE
MOISTURETRAP
HEATEDSAMPLE
PUMP
PUMP
VENT
VENT
VENT
ANALYZER
ANALYZERNOx
NO2 to NOCONVERTER
DILUENT
July 1999 CARB Method 20 Page 14
Figure 20-2 Analysis of Calibration Gases
Date (Must be within 1 month prior to test period)
Reference method used
Sample RunGas concentration, ppm
Low level(a) Mid level(b) High level(c)
1
2
3Average
Maximum %deviation(d)
(a)Average must be 20 to 30% of span value.
(b)Average must be 45 to 55% of span value.
(c)Average must be 80 to 90% of span value.
(d)Must be < or = 10% of applicable average or 10 ppm,
whichever is greater.
July 1999 CARB Method 20 Page 15
Figure 20-3 Zero and Calibration Data
Turbine Type___________________________ Identification Number_______________
Date_____________________________ Test Number__________________
Analyzer Type_____________________ Identification Number________________
Cylindervalue, ppm or
%
Initial AnalyzerResponse,ppm or %
Final analyzerresponse, ppm
or %
Difference:initial-finalppm or %
Zero Gas
Low Level Gas
Mid Level Gas
High Level Gas
Percent Drift = Absolute Difference/Span Value x100
July 1999 CARB Method 20 Page 16
Table 20-1 Interference Test Gas Concentration
COSO2 200 + - 20 ppm
CO2O2
10 + - 1%20.9 + - 1%
Figure 20-4 Interference Response
% of span =Analyzer output response
Instrument spanx 100
Test gastype
Concentrationppm
Analyzer outputresponse
% of span
Date of test
Analyzer type
Serial No.
500 + - 50 ppm
July 1999 CARB Method 20 Page 17
Figure 20-5 Response Time
Date of Test________________________
Analyzer Type_______________________
Serial Number_______________________
Span gas concentration ppm__________
Analyzer span setting_______________
Upscale:1 _______seconds
2 _______seconds
3 _______seconds
Average upscale response __________seconds
Downscale:1 _______seconds
2 _______seconds
3 _______seconds
Average downscale response __________seconds
System response time = slower average time = ________ seconds
July 1999 CARB Method 20 Page 18
Table 20-2 Cross-Sectional Layout for Rectangular Stacks
No. of traverse points: Matrix Layout9
1216202530364249
3 x 34 x 34 x 45 x 45 x 56 x 56 x 67 x 67 x 7
Figure 20-6 Preliminary Diluent Traverse
Date ______________Location:
Plant ______________________________________________________________City, State _________________________________________________________
Turbine identification:Manufacturer _______________________________________________________Model, serial no. ____________________________________________________
Sample point Diluent concentration, ppm
July 1999 CARB Method 20 Page 19
Figure 20-7 Stationary Gas Turbine Data
Turbine Operation Record
Test Operator _________________________________ Date_____________________
Type_______________________________________________________________________
Serial Number______________________________________________________________Location___________________________________________________________________ Plant____________________________________________________________________ City_____________________________________________________________________Ambient Temperature________________Ambient Humidity___________________Test time start____________________Test time finish___________________Fuel Flow rate(a)_________________________________________________________Water or steam flow rate(a)_______________________________________________Ambient Pressure___________________Ultimate Fuel Analysis: Trace Metals:C_____________________ Na________________H_____________________ Va________________O_____________________ K_________________N_____________________ etc(b)____________S_____________________Ash___________________H2O___________________Operating Load____________________
(a)Describe measurement method, i.e. for continuous meter, start finish volumes etc.(b) i.e. additional elements added for smoke suppression
July 1999 CARB Method 20 Page 20
Figure 20-8 Stationary Gas Turbine Sample Point Record
Turbine Identification:Manufacturer_______________________________________________Model, Serial no.__________________________________________
Location:Plant______________________________________________________City, State________________________________________________
Ambient temperature_____________________Ambient Pressure________________________Date____________________________________Test time: start________________________Test time: finish_______________________Test Operator Name______________________Diluent instrument type________________________________________
Serial no._________________________________________________NOX instrument type____________________________________________
Serial no._________________________________________________
Sample point Time, min Diluent(a), % NOx(a), ppm
(a) average steady-state value from recorder or instrument


![How to reduce emission of nitrogen oxides [NOx] from](https://img.pdfslide.us/doc/110x75/616a4dd111a7b741a35108dc/how-to-reduce-emission-of-nitrogen-oxides-nox-from-.jpg)