Embed Size (px)
Citation preview

3D GIS Modeling at Semantic Level using CityGML for
Urban Segment
Thesis submitted to the Andhra University, Visakhapatnam in partial fulfilment of
requirement for the award of Master of Technology in Remote Sensing and GIS
Submitted By:
Parag Sudhir Wate
Supervised By:
Dr. Sameer Saran
Scientist SE
Geoinformatics Department
Indian Institute of Remote Sensing, ISRO,
Dept. of Space, Govt. of India,
Dehradun – 248001
Uttarakhand, India
August, 2014

ii
DISCLAIMER
This work has been carried out in partial fulfillment of Masters of Technology program in
Remote Sensing and Geographic Information System at Indian Institute of Remote Sensing,
Dehradun, India. The author is solely responsible for the contents of the thesis.

iii
Acknowledgement
The presented research is part of my M. Tech. Project work that has been carried out at
Indian Institute of Remote Sensing. The guidance and support of colleagues in the making of
the thesis deserve a special mention. It is a pleasure to convey my gratitude to them all in my
humble acknowledgement.
The first of all I am extremely indebted to my supervisor, Dr. Sameer Saran, Scientist ‘SE’,
GID, IIRS. This work would not have been possible without his valuable guidance and
support. Under his guidance I successfully overcame many difficulties and learned a lot. He
has given me a freedom to explore and learn new things throughout the project. I gratefully
acknowledge his valuable suggestions not only bounded for my project work but also for my
better career prospective in the field of 3D geoinformation. His conviction will always
inspire me to work hard.
I am thankful to Dr. S.K. Srivastav, Head GID, Shri. P.L.N. Raju, Head RS &
Geoinformatics Group and Dr. Y. V. N. Krishna Murthy, Director IIRS for their valuable
advices, and support during my research work.
The fruitful discussion during project work with Amit Singh is highly acknowledged.
A sincere gratitude to Shri. Arun Kumar Sardar and staff for providing required help to
access library facilities, and to CMA members for maintaining computer systems including
software installation in GID Lab during the project work.
I pay respect to the Indian Institute of Remote Sensing, Dehradun for providing necessary
infrastructure and resources to learn and accomplish the M.Tech. Course in Remote Sensing
& GIS. My sincere thanks to Andhra University, Visakhapatnam for awarding me this
opportunity.
I extend my thanks to departments that have provided satellite and in-situ datasets for
research purpose. I would like to thank Data Equipment Section (DES) in IIRS for providing
archived satellite data used in this study. I would also like to thank Construction and
Maintenance Department (CMD) in IIRS for providing plan layout of study area.
I would like to express my heartfelt gratitude to Col. Sanjay Mohan for his valuable advice,
encouragement and moral support during the entire course. I would also like to thank Shri.
Manoj Semwal (Scientist, CSIR) for giving me a learning opportunity during course
curriculum.
My deep sense of gratitude towards my friend Unmesh Khati, for helping and encouraging
me willingly and selflessly during my research endeavour.

iv
I owe a special gratitude to my loving brother Harshad, my parents and relatives for
advising, educating and awarding me independence till now. I owe everything to them.
Besides this, I thank all colleagues who have knowingly and unknowingly helped me in the
successful completion of this project.

v
Certificate
This is to certify that Mr. Parag Sudhir Wate has carried out the dissertation entitled “3D
GIS Modeling at Semantic Level using CityGML for Urban Segment” in partial fulfilment
of the requirements for the award of M. Tech. in Remote Sensing and GIS. This work has
been carried out under the supervision of Dr. Sameer Saran, Scientist „SE‟, Geoinformatics
Department, Indian Institute of Remote Sensing, ISRO, Dehradun, Uttarakhand, India.
Dr. Sameer Saran Dr. S. K. Srivastav
Project Supervisor Head
Geoinformatics Department Geoinformatics Department
IIRS, Dehradun IIRS, Dehradun
Dr. S. K. Saha Dr. Y.V.N. Krishna Murthy
Dean (Academics) Director
IIRS, Dehradun IIRS, Dehradun

vi
Declaration
I, Parag Sudhir Wate, hereby declare that this dissertation entitled “3D GIS Modeling at
Semantic Level using CityGML for Urban Segment” submitted to Andhra University,
Visakhapatnam in partial fulfilment of the requirements for the award of M. Tech. in
Remote Sensing and GIS, is my own work and that to the best of my knowledge and belief.
It is a record of original research carried out by me under the guidance and supervision of
Dr. Sameer Saran, Scientist „SE‟, GID, Indian Institute of Remote Sensing, Dehradun. It
contains no material previously published or written by another person nor material which to
a substantial extent has been accepted for the award of any other degree or diploma of the
university or other institute of higher learning, except where due acknowledgment has been
made in the text.
Place: Dehradun Mr. Parag Sudhir Wate
Date:

vii
Dedicated to my Parents and brother Harshad

viii
Abstract
The study cogitate third dimensional modelling of geographic phenomenon related to urban
segment. The abstraction of multiresolution third dimensional (3D) geoinformation of city
objects in virtual model enables visualisation of physical structures in addition to dynamic
semantic and qualitative information. The recent studies in virtual 3D city modeling have
demonstrated its utility in different applications such as environmental simulations,
navigation, noise mapping, urban energy simulations, architecture and city planning. The
present research has evaluated the applicability of 3D city models in formulation of urban
energy conservation strategies. Due to urbanization, the exponential growth of cities in India
has resulted in increased use of non-renewable energy resources to meet the essential power
requirements of urban built environment. The urban planners are required to provide
innovative solutions in context of urban energy simulation based on virtual 3D City models.
Currently, 3D GIS data is acquired in discrete LODs (Level of Detail) depending upon the
application requirement and input data used. The present research work has proposed unique
3D data acquisition framework with reference to LoD concept. There are various 3D GIS
modeling softwares like Google SketchUp, ESRI CityEngine etc. which are being used for
geometry reconstruction lacking semantic information. City Geography Markup Language
(CityGML) is common semantic information model for spatio-semantic data storage and
exchange of virtual 3D city models. The 3D GIS data conversion from native format into
CityGML enhances it by providing spatio-semantic information in interoperable format. A
building information model of study area is generated using ESRI CityEngine and converted
into CityGML using developed customised converter. A model is also exported to energy
modelling program in gbXML schema. The spatio-semantic characteristics of derived
CityGML model have been explored for assessment of active and passive solar potential of
buildings. The effective areas of urban surfaces exposed to solar radiation are examined
using SunCast application in Virtual Environment software. The energy simulation results
are integrated with building semantic features to perform basic spatio-semantic analysis. An
approach is developed to extend CityGML classes with application specific properties using
Application Domain Extension (ADE) mechanism. The required input indicators and energy
simulation results are integrated into conceptual schema of CityGML Energy ADE
represented in Unified Modeling Language (UML). An instance document of ADE schema
could be used for interoperable data exchange between design and energy modelling
softwares. The presented research would help city planners and policy makers in formulation
of integrated planning and robust decision support system for urban energy infrastructure
with modifications in areas of modeling, simulation systems, and software platforms.
Keywords: LoD, CityGML, semantic analysis, urban energy, Energy ADE.

ix
Table of Contents
1 Introduction ........................................................................................................... 1
1.1 Background .............................................................................................................. 1
1.2 Motivation and Problem Statement .......................................................................... 2
1.2.1 Related to User Applications ............................................................................ 2
1.2.2 Related to Technology Progress ....................................................................... 2
1.3 Research Identification ............................................................................................. 3
1.3.1 Research Objective ........................................................................................... 3
1.3.1.1 Sub-objectives .............................................................................................. 3
1.3.2 Research Questions .......................................................................................... 4
1.3.3 Innovation aimed at .......................................................................................... 4
1.4 Research Hypothesis ................................................................................................ 4
1.5 Thesis Outline ........................................................................................................... 4
2 Materials and Methods ......................................................................................... 7
2.1 Study area and data ................................................................................................... 7
2.2 Tools and Instrumentation ........................................................................................ 8
2.2.1 Hardware Tools and Field Instrumentation ...................................................... 8
2.2.2 Software Tools .................................................................................................. 8
2.3 Field data analysis .................................................................................................... 8
2.3.1 Illustration for Calculation of Window-to-Wall Ratio from Field Data ......... 11
3 3D Data Acquisition Framework ....................................................................... 14
3.1 CityGML LoD Concept .......................................................................................... 14
3.1.1 Uniqueness of LoD Concept .......................................................................... 16
3.1.1.1 Properties of LoD concept .......................................................................... 16
3.2 Review of 3D Data Acquisition Techniques .......................................................... 16
3.2.1 Coarser LoD Reconstruction .......................................................................... 17
3.2.2 Detailed LoD Reconstruction ......................................................................... 18
3.3 Customised methodologies for LoD reconstruction ............................................... 19
3.3.1 LoD0 Methodology ........................................................................................ 19
3.3.2 LoD1 Methodology ........................................................................................ 21
3.3.3 LoD2 Methodology ........................................................................................ 21
3.3.4 LoD3 Methodology ........................................................................................ 23

x
3.3.5 LoD4 methodology ......................................................................................... 24
3.4 Matrix for 3D GIS Modeling Techniques .............................................................. 24
4 Transformation Mechanism for Interoperable Model ..................................... 26
4.1 Review of 3D data standards and formats .............................................................. 26
4.1.1 3D computer graphics and visualisation formats............................................ 26
4.1.2 Building Information Models (BIM) .............................................................. 27
4.1.3 Comparison of 3D standards and formats ...................................................... 27
4.2 Rationale for 3D City Modeling at Semantic Level ............................................... 28
4.2.1 CityGML (Version 2.0.0) ............................................................................... 28
4.2.1.1 CityGML LoD2 Building model ................................................................ 29
4.2.1.2 CityGML LoD3 Building model ................................................................ 30
4.3 Transformation Methodology ................................................................................. 31
4.3.1 LoD2 and LoD3 Building Model Generation ................................................. 31
4.3.2 Semantic Categorization ................................................................................. 32
4.3.3 Transformation of Google SketchUp model to CityGML .............................. 33
4.3.4 Storage of semantic components in Open source RDBMS ............................ 37
4.3.5 Model Preparation for export to Energy modelling program ......................... 37
4.3.6 Integration of Energy simulation data and semantic analysis ........................ 37
4.4 Dissemination of Interoperable Model ................................................................... 38
5 Semantic Analysis for Urban Energy conservation strategies ........................ 41
5.1 Review of Urban Energy conservation Case Studies ............................................. 41
5.2 Review of Solar Radiation Simulation algorithm in urban context ........................ 42
5.2.1 Basic Terminologies in Solar Radiation Model ............................................. 43
5.2.2 Sun-Earth Geometry ....................................................................................... 43
5.2.3 Beam Radiation on tilted surfaces .................................................................. 45
5.2.4 Diffused Radiation on tilted surfaces ............................................................. 45
5.2.4.1 Isotropic Diffuse Model ............................................................................. 46
5.2.5 Reflected Radiation from ground on tilted surfaces ....................................... 46
5.3 Semantic Analysis based on CityGML model ....................................................... 46
5.3.1 Solar Radiation Mapping on LoD2 model ..................................................... 46
5.3.2 Solar Luminance and Illuminance Mapping on LoD3 model ........................ 47
5.3.3 Basic semantic Query on LoD2 model ........................................................... 48

xi
6 Formulation of CityGML Energy ADE ............................................................. 52
6.1 Interoperability gap between BIM and Energy Models ......................................... 52
6.2 Overview of CityGML ADE mechanism ............................................................... 53
6.3 UML based modelling of CityGML ADE .............................................................. 54
6.4 Review of CityGML Energy ADE Test beds ......................................................... 55
6.4.1 Energy Atlas of Berlin – CityGML Energy ADE Test Bed ........................... 55
6.4.2 I-SCOPE Project – Solar ADE Test Bed ........................................................ 56
6.4.3 EnergyADE Proposal of the HFT Stuttgart and TU Munich ......................... 56
6.5 Conceptual schema for Proposed Energy ADE ...................................................... 57
7 Conclusions and Recommendations ................................................................... 59
7.1 Conclusion .............................................................................................................. 59
7.1.1 Answers to research questions ........................................................................ 59
7.2 Recommendations .................................................................................................. 60
7.3 Practical Application of Study ................................................................................ 61
References ................................................................................................................. 62
APPENDIX 1 ............................................................................................................ 66

xii
List of Abbreviations
3D GIS - Third Dimension Geographic Information System
ADE - Application Domain Extension
BIM - Building Information Modeling
CityGML - City Geography Markup Language
COLLADA - COLLAborative Design Activity
GML - Geography Markup Language
IESVE - Integrated Environmental Solutions Virtual Environment
IFC - Industry Foundation Classes
ISO - International Organisation for Standardisation
KML - Keyhole Markup Language
LoD - Level of Detail
OGC - Open Geospatial Consortium
UML - Unified Modeling Language
VRML - Virtual Reality Modelling Language
X3D - Extensible 3D

xiii
List of Figures
Figure 1-1: Proposed Research Methodology .......................................................................... 5
Figure 2-1: Geographic Location and PAN Imagery of Study area - IIRS Campus ................ 7
Figure 2-2: Ground Trace of control points ........................................................................... 10
Figure 2-3: GID building height measurement....................................................................... 12
Figure 2-4: GID window width measurement ........................................................................ 13
Figure3-1: Five discrete CityGML LoDs(Wate et al., 2013) ................................................. 15
Figure 3-2: Classification of acquisition techniques .............................................................. 17
Figure 3-3: LoD0 Methodology ............................................................................................. 19
Figure 3-4: Space use map of IIRS Campus .......................................................................... 20
Figure 3-5: LoD0 (2.5D) representation ................................................................................. 20
Figure 3-6: LoD1 Methodology ............................................................................................. 21
Figure 3-7: LoD1 representation ............................................................................................ 21
Figure 3-8: LoD2 Methodology ............................................................................................. 22
Figure 3-9: LoD2 representation ............................................................................................ 22
Figure 3-10: LoD3 Methodology ........................................................................................... 23
Figure 3-11: LoD3 representation .......................................................................................... 23
Figure 3-12: LoD4 Methodology ........................................................................................... 24
Figure 4-1: Illustration of CityGML LoD2 Building feature structure as UML instance
diagram ................................................................................................................................... 30
Figure 4-2: Illustration of CityGML LoD3 Building feature structure as UML instance
diagram ................................................................................................................................... 31
Figure 4-3: Transformation Methodology for derivation of Interoperable Model ................. 32
Figure 4-4: Thematically layered LoD2 Model ...................................................................... 33
Figure 4-5: Thematically layered LoD3 Model ...................................................................... 33
Figure 4-6: SketchUp to CityGML LoD2 customised converter using FME ........................ 35
Figure 4-7: SketchUp to CityGML LoD3 customised converter using FME ........................ 36
Figure 4-8: SketchUp to CityGML (LoD2 & LoD3) customised converter for Vegetation
object ...................................................................................................................................... 37
Figure 4-9: IIRS LoD2 CityGML model rendered in FZK Viewer ....................................... 39
Figure 4-10: IIRS LoD3 CityGML model rendered in FZK Viewer ..................................... 40
Figure 4-11: Basic semantic query results dissemination through Web browser ................... 40
Figure 5-1: Sun-Earth geometry(Duffie and Beckman, 1980) ............................................... 44
Figure 5-2: Beam radiation on tilted surface(Duffie and Beckman, 1980) ............................ 45
Figure 5-3: Components of diffuse radiation over sky dome(Perez et al., 1988) ................... 45
Figure 5-4: Mapping of annual solar radiation incident on building surfaces ........................ 47
Figure 5-5: Luminance Mapping and Glare analysis on LoD3 model ................................... 48
Figure 5-6: Illuminance mapping on external facade of LoD3 model ................................... 48
Figure 5-7: WallSurfaces above 50% threshold of annual percentage of exposed area ......... 49
Figure 5-8: WallSurfaces above 50% threshold of winter percentage of exposed area ......... 50
Figure 5-9: WallSurfaces above 50% threshold of summer percentage of exposed area ....... 50
Figure 6-1: Process workflow for information integration ..................................................... 52

xiv
Figure 6-2: Bidirectional workflow for information exchange and integration ..................... 53
Figure 6-3: Proposed Energy ADE schema ............................................................................ 58
Figure A1-1: LoD3 schema of Gymnasium Building Rule File............................................. 66

xv
List of Tables
Table 2-1: Hardware Details .................................................................................................... 8
Table 2-2: Details of Software used ......................................................................................... 8
Table 3-1: LoD Discretization(Albert et al., 2003) ................................................................ 16
Table 3-2: Matrix for 3D GIS Modelling Techniques ............................................................ 25
Table 4-1: 3D data standards and file formats(Zlatanova et al., 2012) .................................. 28
Table 4-2: LoD2 semantic features summary......................................................................... 39
Table 4-3: LoD3 semantic features summary......................................................................... 39

3D GIS Modeling at Semantic Level using CityGML for Urban Segment
1
1 Introduction
Twenty-first century is recognized as the century of globalization. The pace of globalization
has affected every human on Earth. Due to globalization, the small towns are getting
transformed into cities and small cities into the mega-cities. Mega-cities hold most of the
potential for economic growth (Zhang et al., 2011). The geographical location of a city plays
important role in its economic development. The geographical location of a particular mega-
city is unique and hence the amount of non-renewable and land resources available are
variable. The abundance or scarcity of such resources affects overall development of city. In
order to achieve appreciable economic growth and sustainable management of available land
resources, it is essential to develop underground and aboveground urban establishments
(Zhang et al., 2011).Therefore, it needs to be understood that the integration of latest
technological development in Architectural Engineering & Construction (AEC) along with
the third dimensional (3D) geospatial information is essential (Zhang et al., 2011). Thus, it is
found that the need for 3D City Models with geo-referenced information has increased
rapidly over last few years in the field of 3D urban planning & development,
telecommunication network planning, emergency services and disaster management
(Brugman, B., 2010).
1.1 Background
Commercial Off-The-Shelf (COTS) systems in 3D GIS market accounts for the efficient
handling of 3D data in 3D visualization aspect as well as for data processing to a certain
extent (Zlatanova et al., 2002). The abstraction of real world 3D objects into 3D data
structure and consequently in 3D spatial data model are the 3D GIS key research areas. The
current general purpose GIS vendors does not offer full 3D GIS functionality in terms of 3D
structuring (geometry and topology), 3D manipulation and 3D analysis (semantics) instead
they only offer tools for 3D navigation, animation, visualization and exploration (Zlatanova
et al., 2002).
Zlatanova et al., (2004) describes different 3D topological models such as Simplicial
complex, 3D Formal vector data structure (3DFDS), TEtrahedral Network (TEN), Simplified
Spatial Model (SSM), Urban Data Model (UDM), etc but they are still in hands of
researcher. The Constructive Solid Geometry (CSG), Tessellation (Voxel representation),
Tetrahedrons and Boundary representation are some 3D geometrical models that abstract and
represent real 3D objects (Richardson, 2002). The Boundary representation of 3D
geometrical model is the optimal model for representation of real world 3D objects like
present 2D objects because it is possible to map geometrical objects into topological
primitives and encode the same in spatial frameworks for spatial relationship representation
and detection (Richardson, 2002).

3D GIS Modeling at Semantic Level using CityGML for Urban Segment
2
The major drawback of Boundary representation model is that the boundary representation
corresponding to a particular 3D object is not unique and constraints of lower order
primitives on higher order primitives may get very complex (Richardson, 2002). Moreover,
as far as the virtual 3D city models are concerned this model can only be used for
visualization purposes but not for thematic queries, spatio-semantic analysis tasks or spatial
data mining because complexity of tasks those have to be tackled and the information that
has to be processed will increase (Kolbe et al., 2012). The limited utility of geometrical
models restricts the broader use of 3D city models. Hence, there is need for more general
modeling approach for 3D city objects in terms of topological and spatio-semantic aspects to
account for the information requirements of various application fields (Kolbe et al., 2012).
1.2 Motivation and Problem Statement
1.2.1 Related to User Applications
GIS is a collection of information about the real world phenomenon abstracted into systems
to analyze the interesting patterns governing it and thus enabling to gain the knowledge of
surrounding world (Rolf A. de et al., 2001). In other words, GIS is termed as the integration
of semantic and geometric data along with the spatial relationships to ensure large scope for
analysis and also to serve many applications (Zlatanova et al., 2002). The 2D GIS analysis
has limitations in certain 3D urban segment situations. The situations such as Infrastructure
development to address the issue of interaction between newly designed city elements and
existing infrastructure; real estate market to address the issue of property tax collection
categorised according to floor-wise space use; prediction of increase in noise levels due to
new communication and transportation networks (Zlatanova, 2000), visualisation of design
for site planning of cultural and architectural monuments; modelling of water inundation
scenarios in urban areas (Breunig and Zlatanova, 2011) are distinct which requires unique
modeling and analysis approach. Thus, the need for 3D geo-referenced information for
modeling and analysis is extremely high.
1.2.2 Related to Technology Progress
The current GIS software-tools have also made significant contribution towards 3D GIS
development by improving 3D visualisation and animation (Zlatanova et al., 2002). The
other motivation behind 3D GIS development is hardware development in terms of increased
processing speeds, availability of large storage memory and disk space devices, especially
graphic processing units (GPUs) which aid3D data rendering(Richardson, 2002). There are
also positive developments in 3D GIS data acquisition techniques in context of each Level-
of-Detail (LoD) (Richardson, 2002). However, the current status of 3D operations which are
required to access and manipulate 3D spatial data are still in amateur state, non-standardised,
non-transparent, non user-friendly and requires large number of specialised settings
3D GIS Modeling at Semantic Level using CityGML for Urban Segment
3
(Zlatanova et al., 2002). The conceptual models provide application dependent feature-
geometry linkage which is not conducive from interoperability point of view.
Moreover, the spatial operators operate only on x, y values and also models provide limited
semantic hierarchy (Zlatanova et al., 2002). The fact of lacking true 3D GIS functionality
such as efficient querying 3D geo-objects, 3D analyses (3D overlay, 3D buffering, 3D
shortest route), 3D inter-visibility, etc has been regularly reported in literature. In recent
years, CityGML has provided a semantic information model to abstract the virtual 3D city
models which can be shared over various vibrant user applications. Henceforth, the modeling
and analysis of 3D space at semantic level including aboveground and underground, indoor
and outdoor environment is needed to provide an optimum total solution (Zhang et al.,
2011).
1.3 Research Identification
In last few years, it was noted in literature that there had been no commonly agreed standard
available to represent and to exchange 3D city models in an interoperable way. Usually, 3D
city models were represented and exchanged in non GIS computer graphics standards (3D
Studio Max or VRML) lacking interoperability that were necessary for many user specific
applications of 3D city models for data exchange. But, from last couple of years onwards,
CityGML has emerged as a common geometrical and semantic model which enables and
facilitates many user specific applications of 3D city models. Currently, CityGML is widely
accepted OGC standard for 3D city models by geospatial industry (Gröger and Plümer,
2012). Hence, the need for advanced 3D data acquisitions for cities and encoding of same in
CityGML for semantic analysis is identified.
1.3.1 Research Objective
The primary objective of proposed research work is to encode the complex and geo-
referenced 3D vector data in CityGML at semantic level according to the user requirements.
1.3.1.1 Sub-objectives
1. To formulate a framework for 3D GIS data acquisition techniques in context of
CityGML LoD concept.
2. To derive a mechanism for transformation of 3D vector data referring to LoD2 and
LoD3 into CityGML semantic model.
3. To perform CityGML model based spatio-semantic analysis related to urban energy
conservation strategies.
4. To develop a conceptual schema for integration of semantic analysis results with
CityGML to allow interoperable exchange of application specific information
between heterogeneous systems.

3D GIS Modeling at Semantic Level using CityGML for Urban Segment
4
1.3.2 Research Questions
1. How to abstract and represent the 3D vector data into a semantic model of CityGML
standard?
2. What kind of spatio-semantic analysis possible based on geometric and semantic
properties derived from CityGML model for urban energy conservation strategies?
3. How to formulate the conceptual schema for integration of application specific
information with CityGML model to allow interoperable and lossless exchange?
1.3.3 Innovation aimed at
The progress in 3D GIS till now have shown that there is still lack of true 3D model which
will allow user community to integrate heterogeneous representations and models from
different domains. The proposed 3D geo-objects modelling and analysis using CityGML will
focus on spatio-semantic integration of unique identity of these 3D entities along with
application specific information in an interoperable way.
1.4 Research Hypothesis
The previous studies in 3D geoinformation modelling and analysis in urban segment have
stated that there is lack of availability of interoperable 3D city model to address particular
problem. An interoperable 3D city dataset of urban block could be useful for data exchange
between urban design and simulation software platforms. The presented research would
attempt to establish end-to-end process workflow beginning with 3D data acquisition,
derivation of interoperable 3D city dataset of urban block, analysis and application
integration. Figure 1-1 shows the proposed methodology to implement process workflow for
3D city dataset based spatio-semantic analysis. The outcomes of the research work could be
formulation of data acquisition framework with reference to LoD, data transformation
mechanism for derivation of interoperable model and 3D city dataset based simulation for
user requirement specific application.
1.5 Thesis Outline
The proposed research work is outlined as follows: Chapter 1 gives an overview of research
topic, including introduction, topic background, motivation behind the investigation,
research objectives and questions, and organization of the thesis. Chapter 2 deals with the
description of geographic area under study, remote sensing and ancillary datasets, tools and
instrumentation required, and analysis of acquired field data. Chapter 3 describes the
CityGML LoD concept, different 3D data acquisition techniques and their implementation in
context of LoD. Chapter 4 discusses various native 3D dataset standards, rationale behind
semantic 3D city modelling and transformation methodology for interoperable 3D data
standard.

3D GIS Modeling at Semantic Level using CityGML for Urban Segment
5
Figure 1-1: Proposed Research Methodology
Chapter 5 details urban energy conservation case studies and semantic analysis performed
using CityGML model. Chapter 6 provides the conceptual schema for integration of
application specific information with CityGML model using concept of Application Domain
Extension (ADE). Chapter 7 provides answers to the research questions, future scope and
practical applications of research work.
The thesis chapters are based on the following research papers and abstract which are
referred in text.
I. Wate P., Saran S., Srivastav S.K., Murthy Y.V.N.K., 2013. Formulation of
Hierarchical Framework for 3D-GIS Data Acquisition Techniques in context of
Level-of-Detail (LoD), in: 2013 IEEE Second International Conference on Image
Information Processing (ICIIP-2013). IEEE, Shimla, India, pp. 154–159.
doi:10.1109/ICIIP.2013.6707573.
II. Saran S., Wate P., Srivastav S.K., Murthy Y.V.N.K., 2014. CityGML at Semantic
Level for Urban Energy Conservation Strategies, in: Annals of GIS. Manuscript ID:
TAGI-2014-0023. (Under Revision).
III. Wate P., Saran S., 2014. Design of CityGML Energy Application Domain Extension
for Integration of Urban Solar Potential Indicators using object-oriented UML,
(Under Preparation).

3D GIS Modeling at Semantic Level using CityGML for Urban Segment
6
In paper I, the authors have proposed 3D data acquisition framework in context of LoD
(Objective 1) which is referred as Chapter 3 of thesis. The paper II is divided into two
Chapter4 & Chapter 5 addressing data conversion and analysis process (Objective 2 &
Objective3). In paper III, the conceptual schema for integration of urban energy conservation
data with CityGML will be proposed (Objective 4).

3D GIS Modeling at Semantic Level using CityGML for Urban Segment
7
2 Materials and Methods
2.1 Study area and data
The study was carried out on Indian Institute of Remote Sensing (IIRS) Campus, Dehradun,
India spread over an area of 84425.00519 sq m as shown inFigure 2-1. The study area is
geographically located between 78°02‟35.56” to 78°02‟52.224” East longitudes and
30°20‟23.0784” to 30°20‟29.8104” North latitudes. The average altitudinal height of
underlying terrain is 653.573 m above ellipsoidal datum (WGS 84) and lies at foot hills of
Himalayas.
Figure 2-1: Geographic Location and PAN Imagery of Study area - IIRS Campus
The IKONOS PAN and Cartosat 2 imagery of study area, and Cartosat 1 stereo pair of
Dehradun region archived by Data Equipment Section (DES) in IIRS have been used to
extract building footprints and map the open spaces. The Plan Layout of IIRS has been
obtained from Construction and Maintenance Department (CMD) in IIRS to generate Digital
Elevation Model (DEM). The data about the building dimensions has been obtained from
field survey.

3D GIS Modeling at Semantic Level using CityGML for Urban Segment
8
2.2 Tools and Instrumentation
2.2.1 Hardware Tools and Field Instrumentation
The hardware tools and field instrumentation used in research has been listed in Table 2-1.
Table 2-1: Hardware Details
Hardware / Instrument Purpose
Trimble GNSS R7 To collect Ground Control Points (GCPs)
Leica Total Station TPS1200 To measure building dimensions
NIKON Digital Camera To texture 3D objects
2.2.2 Software Tools
The list of software used in research work has been provided in Table 2-2.
Table 2-2: Details of Software used
Software / Tool Purpose
ESRI ArcGIS 10 To perform georeferencing and map composition
Leica Photogrammetry Suite To generate terrain model & ortho-rectified images
PhotoModeler Scanner 6 Close-Range Photogrammetry software
ESRI CityEngine 2012 To create rule based 3D vector data
Google SketchUp 8 To perform pre-processing tasks
FME Desktop 2013 To execute data manipulation operations
FZK Viewer 4.1 To parse and render XML files
PostGIS 2.0 To store 3D vector data
gModeller SketchUp Plug-in To import and export gbXML files
IES Virtual Environment 2013 Simulation Platform
Enterprise Architect 9 To create UML diagrams
ShapeChange 2.0.0 To generate GML schemas (XSD files)
LiquidXml 2014 To edit and validate XML files
WampServer 2.2 To setup local server for hosting of application
2.3 Field data analysis
The differential GPS survey has been carried out to collect the two near accurate Ground
Control Points (GCPs): one near the direction board and second one in front of the IIRS
Main building. These GCPs were used to orient the total station instrument with plane metric
and height tolerance limits of 10 cm and 50 cm respectively. The total station points within
tolerance limits are considered while some exceptionally erroneous readings were excluded
from further analysis. Out of these valid total station points (200 points approx.) collected,
the sparsely distributed points were used for geo-referencing of satellite imagery. The

3D GIS Modeling at Semantic Level using CityGML for Urban Segment
9
location for point collection has been chosen in such way that they are accessible for total
station instrument setup and are well distributed in all directions (360° view) of building. The
map of collected total station points is shown in Figure 2-2.

3D GIS Modeling at Semantic Level using CityGML for Urban Segment
10
Figure 2-2: Ground Trace of control points
Direction Board
Main Building

3D GIS Modeling at Semantic Level using CityGML for Urban Segment
11
For every building in study area, these surrounding total station points were used to measure
building dimensions such as building height, storey height, etc. in addition to door and
window dimension measurements. The point cloud dataset of surveyed points were analyzed
in ArcGIS LiDAR Analyst to derive the values for building height, storey height, window
height, window width, door width and door height. The database of derived values for every
building in campus was created for its further use in 3D object generation.
2.3.1 Illustration for Calculation of Window-to-Wall Ratio from Field Data
Figure 2-3 & Figure 2-4 show building height and window width measurement illustration
using ArcGIS LiDAR Analyst for Geoinformatics department (GID) building in IIRS
campus. In Figure 2-3, the highlighted points showed using LiDAR Analyst profile view
represent bottom and top corner points of GID building. The table view shown provides
plane metric coordinates and height information of these corner points. The building height
is obtained using measurement tool and it is measured to be as 7.124 meters. In Figure 2-4,
the highlighted points showed are the four corner points of building window. These top,
bottom, right and left corner points are used to measure the window dimensions. For
particular window of building wall (gml_id = "fme_bf881a27-7857-4529-a21e-
c25d0347fc9d"), the width and height measured are 0.75 and 1.5 meters respectively. This
wall is having six windows of mentioned dimensions. Therefore, total openings area =
6*1.5*0.75 = 6.75 sq. m. and computed wall area = 54.83 sq. m. So, Window-to-Wall Ratio
= 6.75/54.83 = 12.31%.In general, depending upon building dimensions the Window-to-
Wall ratio lies between 10-20%. The window-wall ratio of 20% is considered for further
computations of incident solar radiation on bounding surfaces.

3D GIS Modeling at Semantic Level using CityGML for Urban Segment
12
Figure 2-3: GID building height measurement

3D GIS Modeling at Semantic Level using CityGML for Urban Segment
13
Figure 2-4: GID window width measurement

3D GIS Modeling at Semantic Level using CityGML for Urban Segment
14
3 3D Data Acquisition Framework
3.1 CityGML LoD Concept
Like multi-scale representation concept of topographic maps, the 3D objects which are
nearer to synoptic view are detailed represented than farther objects(Gröger and Plümer,
2012). LoD concept in 3D City Modeling depicts the respective data acquisition method with
particular application requirement. Biljecki F., et al., (2013) reviews LoD concept in
different standards and products such as City Geography Markup Language (CityGML)
standard, Blom3D product range and NAVTEQ datasets based on semantic properties,
surface texture, geometry and type of city objects. The author has restructured LoD concept
stated in these standards into respective Sub-levels of details (SLoD) based three major
driving components: exterior and interior geometry, and external appearance. The author has
also proposed a framework specification for LoD definition in context of geometry quality,
appearance, positional accuracy, geometry details, granularity of semantic hierarchy and
quality of semantic details.
The new building LoD concept proposed by Benner et al., (2013) is based on geometric and
semantic properties of building exterior and interior shell in five distinct levels. The authors
discuss deficits of current CityGML LoD concept in applicability of one LoD concept to all
thematic modules and also its flexibility in hybrid LoD approach realization. The authors
have also mentioned about lack of metadata about LoD information in current concept.
There are three classes of LoD which have been described in computer graphics domain:
namely discrete LoD, continuous LoD and view-dependent LoD (Luebke et al., 2003). The
discrete LoD categorization for building thematic module is discussed in CityGML multi-
scale modelling approach. This approach allows simultaneous multi-scale resolution
representation of same object in a single CityGML dataset.
Biljecki, (2013) has proposed for integration of scale as spatial dimension in 3D city
modelling and also researched applicability of hyper-dimensional theories to represent object
in 4D space (x, y, z and scale). The outcomes of the proposed investigation will be to
formulate definition for context-aware LoD, intermediate scale (hybrid LoD) and mixed-
scale or perspective view oriented LoD.
CityGML encoding standard for 3D city modeling issued by Open Geospatial Consortium
(OGC) and ISO TC211 describes multi-scale modeling of real world 3D objects specifically
urban objects in five discrete LoD(Kolbe et al., 2012). The conceptual differentiation
between CityGML discrete LoD mentioned in OGC project document can be reviewed in
following manner:

3D GIS Modeling at Semantic Level using CityGML for Urban Segment
15
LoD0 is earth‟s terrain feature abstraction as a Digital Terrain Model (DTM) with
draping of ortho-rectified satellite images over terrain. An urban object such as
building may be represented in LoD0 as footprint and/or roof-edge boundary
polygon extracted from ortho images. LoD0 is a coarsest level representation of 3D
city models. It is a model representation at regional and landscape scale.
LoD1 is abstraction of objects over earth‟s terrain as a Digital Surface Model
(DSM). A building object in LoD1 may be represented into prismatic blocks with
vertical walls and horizontal flat roof structures. LoD1 is a block level representation
of 3D city objects at city scale.
LoD2 is representation of specific type of city objects such as residential buildings
and landmarks differentiated by thematically textured boundary surfaces and
prototypic roof structures at city district scale.
LoD3 is representation of architectural features of outermost building structure
along with textured building surfaces, installation parts, facades and openings. LoD3
is a finest resolution model for exterior shell with textured wall and detailed roof
structures including openings such as doors and windows. It is a representation at
neighbourhood scale.
LoD4 is abstraction of architectural features of innermost building shell with interior
structures along with LoD3 representation of outermost shell. CityGML LoD4 is
finest resolution model for building interior consisting of rooms, stairs, furniture,
interior doors and windows.
An example of a building object represented in CityGML LoD concept is shown in
Figure3-1. A referred building object is a Gymnasium Building in IIRS Campus.
Figure3-1: Five discrete CityGML LoDs(Wate et al., 2013)

3D GIS Modeling at Semantic Level using CityGML for Urban Segment
16
3.1.1 Uniqueness of LoD Concept
Table 3-1shows five discrete LoD specifying the distinct features that can be identified in
each LoD. The continuous LoD is used in Computer Graphics (CG) domain which aims only
at continuous visualization (Gröger and Plümer, 2012). The discrete LoD not only addresses
the geometric aspects of 3D entities but also semantic ones and that too with increase in
semantic richness with increase in LoD.
3.1.1.1 Properties of LoD concept
Facilitates the integration of features represented in same LoD in an interoperable
way.
Each LoD implies requirements for certain class of applications.
Allows multi-resolution representation of a particular feature.
The peculiar property of LoD concept is that particular LoD intuitively depicts the
respective data acquisition method.
Table 3-1: LoD Discretization (Albert et al., 2003)
LoD Abstract Feature
Representation
Distinct Features Identified Accuracy
(position / height)
LoD0 Digital Terrain Model (DTM) Building footprints lowest
LoD1 Digital Surface Model (DSM) Building as prismatic object 5/5m
LoD2 Building Structures with
prototypic features
Buildings with prototypic roof
shapes
2/2m
LoD3 Buildings with architectural
features
Buildings with openings and
textured wall surface
0.5/0.5m
LoD4 Buildings with interior
architectural features
Buildings rooms with interior
furniture and texturing
0.2/0.2m
3.2 Review of 3D Data Acquisition Techniques
The recent developments in satellite and airborne sensor technology providing improved
image qualities especially in terms of spatial resolution has helped the 3D GIS progress in
terms of 3D reconstruction of cities for various user specific applications. In order to
reconstruct the 3D representation of earth surface objects, the techniques such as Satellite
Photogrammetry, LiDAR data processing in addition to building structure extraction
algorithms are applied on satellite observation based data (Sirmacek et al., 2012). Moreover,
the field based observation techniques such as Close-Range Photogrammetry; Total station
survey; Terrestrial Laser scanning also contributes towards 3D reconstruction of real world
objects. In order to generate 3D city datasets with reference to LoD, various data acquisition
techniques have been investigated. These 3D data acquisition techniques are widely
classified as satellite and field based observation techniques, and Volunteered Geographic
Information (VGI) based techniques as shown inFigure 3-2.

3D GIS Modeling at Semantic Level using CityGML for Urban Segment
17
Figure 3-2: Classification of acquisition techniques
3.2.1 Coarser LoD Reconstruction
Satellite based observation techniques are usually deployed for coarser CityGML LoD
reconstruction specifically LoD0 and LoD1.
Satellite Photogrammetry is a technique which uses either a rigorous or Rational Function
Model (RFM) of satellite sensors to reconstruct the physical imaging geometry of
topographic features on earth surface from stereo-pair images by transforming the image
space coordinates to object space coordinates (DeWitt and Wolf, 2000). The conditions of
co-linearity and co-planarity are satisfied for reconstruction of earth‟s terrain topography.
The obtained digital terrain model (DTM) is 2.5D representation with elevation as attribute
value. It is a coarsest LoD (LoD0) reconstruction technique of terrain features.
LiDAR data processing involves generation of digital surface models (DSM) of natural and
artificial objects on earth‟s surface from geo-referenced LIDAR point cloud data obtained
from space borne or airborne laser scanning (Kalantaitė et al., 2012).There are techniques to
classify the point cloud data as earth‟s surface features and natural or artificial objects.
Bartels et al., (2006) have demonstrated the methodology for classification of LiDAR point
cloud data (DSM) using skewness balancing algorithm with overall accuracy of 95.65% and
kappa coefficient of 91.27%. The algorithm is based on assumption that the object points
disturb the normal distribution of raw point cloud data and by filtering object points from
raw data the ground points are obtained. The algorithm iterates over raw data under
boundary conditions of statistical measures of distribution i.e. statistical moments: skewness
(sk) & kurtosis (ku). With sk> 0 and ku> 3, raw data represents the dominance of peaks and
algorithm goes on classifying maximum value as object point until sk = 0 and ku = 3. The
algorithm results in extraction of ground points (DTM = DSM - nDSM) and object points
(nDSM) as LoD0 and LoD1 representation respectively.
Arefi et al., (2008) have proposed hybrid approach to extract building outlines from LiDAR
DSM for LoD definition based 3D building models generation. The method provides two

3D GIS Modeling at Semantic Level using CityGML for Urban Segment
18
LoD: LoD0 and LoD1. LoD0 (building outlines and DTM) is obtained by filtering of non-
ground points from LiDAR DSM using geodesic reconstruction process. The extracted
building outlines are segmented and approximated to a straight line using MBR & RANSAC
fitting and merging algorithms. The building height is estimated by averaging of cloud points
lying inside the building outline to generate the prismatic model (LoD1). The other similar
approach involves segmentation of DSMs, building edge extraction, masking, Hough
transformation, line segmentation and polygon tracing to extract approximate building
structures (Oda et al.).
3.2.2 Detailed LoD Reconstruction
The field based data acquisition techniques are used for reconstruction of relatively finer
resolution 3D city models (LoD2 & LoD3).
Terrestrial Laser Scanning (TLS) acquires 3D point cloud data that represents detailed 3D
features of building object. Tang et al., (2008) have illustrated surface reconstruction and
texturing over 3D TIN model of building obtained from pre-processing and matching of
adjacent LiDAR point cloud datasets. Nguyen et al., (2012) have also demonstrated principle
for 3D object reconstruction by processing of TLS acquired point cloud data in RiSCAN
PRO 3D modelling software module. The principle governs registration of scan positions,
merging and matching of adjacent scans, 3D mesh generation and texturing.
Close-range photogrammetry is a technique which uses photographic measurements for 3D
reconstruction of imaged object. The terrestrial images are acquired from all directions at
total station surveyed points surrounding the object to ensure sufficient overlap between two
adjacent images. The principle of epipolar geometry (space resection method) detects the
points in space corresponding to a particular control point in different photographs. The
control points on different photographs are used to define extrinsic (orientation & position)
and intrinsic camera (focal length and distortion) parameters. Brunetaud et al., (2012) have
demonstrated close-range photogrammetry method to reconstruct the east tower of the castle
of Chambord, France based on calibrated photographs and their projections as textures on
generated 3D model.
Goetz and Zipf, (2012) have developed framework for automatic derivation of 3D CityGML
models (LoD1 & LoD2) from Volunteered Geographic Information (VGI). The proposed
framework has stated two-tier method for derivation of CityGML models from
OpenStreetMap (OSM). In first step, the set of rules for semantic mapping between key-
value pair in OSM with CityGML attributes has been defined and secondly, the geometry
reconstruction techniques for CityGML LoD have been devised. The similar approach has
been adopted and continued for creation of detailed 3D CityGML models (LoD3 & LoD4)
from OSM (Goetz, 2013).

3D GIS Modeling at Semantic Level using CityGML for Urban Segment
19
3.3 Customised methodologies for LoD reconstruction
The customized methodologies based on mentioned techniques have been developed by
(Wate et al., 2013)in order to formulate 3D GIS data acquisition framework with reference to
LoD.
3.3.1 LoD0 Methodology
Figure 3-3 depicts the data acquisition methodology for LoD0 model. In this methodology,
Leica Photogrammetry Suite software was used to generate DTM and orthodata (building
footprints) from satellite stereo pair and GCPs. Then, the subsequent map composition of
extracted building footprints and open spaces was performed in ArcMap application of
ArcGIS. LoD0 is not a “true” 3D city model as it is boundary representation of features in
2D with height as an attribute. LoD0 usually include ortho-rectified data of building features
and plane metric information of other land use-land cover features. Figure 3-4shows space
use map of IIRS campus. LoD0 (Figure 3-5) reconstruction of IIRS campus was
complemented with DEM obtained from surveyed plan Layout contour layer.
Figure 3-3: LoD0 Methodology

3D GIS Modeling at Semantic Level using CityGML for Urban Segment
20
Figure 3-4: Space use map of IIRS Campus
Figure 3-5: LoD0 (2.5D) representation

3D GIS Modeling at Semantic Level using CityGML for Urban Segment
21
3.3.2 LoD1 Methodology
Figure 3-6 shows the data acquisition methodology for LoD1 model. In this methodology,
extracted building footprints were extruded with Z height value by enabling extrusion
property of feature in ArcScene application of ArcGIS. The height value for individual
buildings was obtained from total station survey. Figure 3-7 depicts LoD1 representation
with imagery draped over DEM.
Figure 3-6: LoD1 Methodology
Figure 3-7: LoD1 representation
3.3.3 LoD2 Methodology
Figure 3-8 represents the data acquisition methodology for LoD2 model. This methodology
uses close-range photogrammetry approach to obtain textured 3D models by generating tie
points in adjacent photographs. This approach of LoD2 reconstruction was implemented

3D GIS Modeling at Semantic Level using CityGML for Urban Segment
22
only for Gymnasium building in campus (Figure3-1). Since, methodology involves extensive
manual intervention to generate tie points and wire mesh model of object, it is not feasible to
adopt this approach for object reconstruction at urban design scale. During the course of
research work, this approach was modified and automatic 3D object reconstruction approach
was developed. The developed approach involves the rule-based 3D geometry creation in
ESRI CityEngine software based on Computer Generated Architecture (CGA) grammar. The
method requires only prototype rule to be written which is efficient and flexible to
reconstruct 3D geometry at urban design scale. Figure 3-9 shows the LoD2 representation of
staff quarters building with gable roof type.
Figure 3-8: LoD2 Methodology
Figure 3-9: LoD2 representation

3D GIS Modeling at Semantic Level using CityGML for Urban Segment
23
3.3.4 LoD3 Methodology
Figure 3-10shows the data acquisition methodology for LoD3 model. This methodology uses
hand drafted content design tool called Google SketchUp to reconstruct architectural features
of buildings. The manual 3D content creation is a tedious and extensive process for urban
design problem. For current research work, the CGA rule was created for reconstruction of
detailed architectural features of certain institutional and residential buildings in study area.
The approach is semi-automatic method as rule file is unique for particular building and
needs minor modifications in CGA grammar for other type of building. The sample rule file
schema for LoD2 reconstruction is given in Appendix (Figure A1-1).Figure 3-11 shows
Main building in study area with detailed architectural features. The sample CGA grammar
file for LoD3 reconstruction is given in Appendix.
Figure 3-10: LoD3 Methodology
Figure 3-11: LoD3 representation

3D GIS Modeling at Semantic Level using CityGML for Urban Segment
24
3.3.5 LoD4 methodology
Figure 3-12 shows the data acquisition methodology for LoD4 model. This methodology
makes use of interior components available in Google SketchUp in addition to interior
texturing to realise Indoor 3D virtualization. The approach was adopted to demonstrate
LoD4 reconstruction of only Gymnasium building in study area (Figure3-1). The LoD4
reconstruction of other buildings in study area lies outside the scope of objectives of present
investigation.
Figure 3-12: LoD4 Methodology
3.4 Matrix for 3D GIS Modeling Techniques
There are certain demerits and limitations of each 3D GIS data acquisition methodology. The
2.5D model generated with stated technique does not account for the accurate positioning of
building footprints with respect to the underlying terrain. But, plane metric error can be
minimized by obtaining GCPs through DGPS survey. The proposed methodology for
prismatic 3D model does not address the errors in building height but they were quantified
from total station survey readings. The stated technique used for LoD2 model (close-range
photogrammetry) approximates the 3D surface orientation thus results in violation of
orthogonal representation of 3D structures. This discrepancy was eliminated and
reconstruction process was automated by using rule-based modeling in CityEngine. The
methodology used for finest 3D model generation is extensively manual process and hence
the abstraction of every detail was cumbersome and also complex from geometry
representation point of view. It was semi-automated by using CGA grammar based modeling
in CityEngine. Indoor model acquisition methodology is also a manual process and raises
questions about the level of indoor modeling acceptable from administration point of view.

3D GIS Modeling at Semantic Level using CityGML for Urban Segment
25
The proposed hierarchical framework suggests suitable 3D data acquisition mechanism in
context of respective LoD. There are certain drawbacks of proposed methodologies which
need to be understood while deriving a model for specific user application. Table 3-2shows
3D GIS modeling matrix which provides general guidelines for 3D datasets generation in
context of distinct CityGML LoD.
Table 3-2: Matrix for 3D GIS Modelling Techniques
LoD Aerial Acquisition Terrestrial Acquisition
Satellite
Photogrammetry
Spaceborne /
Airborne LiDAR
Close-Range
Photogrammetry
Mobile Laser
Scanner
LoD0
LoD1
LoD2
LoD3
LoD4
The current developments in 3D GIS account only for data acquisition, visualization and
animation. Moreover, the available 3D operationwhich are required to access and manipulate
3D spatial data are very limited and does not address application specific spatial analysis.The
3D GIS models derived from proposed framework can be encoded into a common semantic
information model according to user requirements to provide true 3D GIS functionality in an
interoperable way.

3D GIS Modeling at Semantic Level using CityGML for Urban Segment
26
4 Transformation Mechanism for Interoperable Model
4.1 Review of 3D data standards and formats
The standards and formats for representation, storage and exchange of 3D city models are
the results of application requirements or purpose of use. The focus of today‟s 3D city
models presentation is at geovisualisation using computer graphics method and their
representation and design using Building Information Models (BIM)(Gröger and Plümer,
2012). The most demanding are the data storage and exchange standards and formats like
CityGML, Industry Foundation Classes (IFC) (ISO, 2005b) and green building XML
(gbXML) for lossless and interoperable information integration between different Computer-
aided architectural design (CAAD) and geospatial analysis softwares. The bi-directional
information exchange is advantageous as geospatial models are benefited from detailed BIM
representation and geospatial analysis can provide spatial reference and enrich BIM with
application specific information.
Although the 3D standards are emerged for fulfilling goals of various international standard
organizations in different domains, the information content in them deals mainly with object
geometry, surface textures, semantics and their inter-relationships (Zlatanova et al., 2012).
The authors have distinguished surface based (e.g. Constructive Solid Geometry-CSG,
Boundary Representation-BRep) and volume based (e.g. Voxel) representations for
modelling of 3D objects. CSG representation is used by IFC data exchange format as its
main emphasis is on construction and design of buildings using basic construction elements
(slabs, beams, walls, etc.), while CityGML spatial data model represents 3D geometry by
boundary representation to describe human conceptualisation of buildings (Gröger and
Plümer, 2012).
4.1.1 3D computer graphics and visualisation formats
The 3D city models abstracted in X3D (ISO, 2005a),3ds Max, 3D PDF, VRML (ISO, 2004)
formats belong computer graphics domain (Gröger and Plümer, 2012). Virtual Reality
Markup Language (VRML) is a web standard for modelling of interactive 3D realistic scenes
(RHYNE, 1999). Later, VRML consortium (Feb-98) had approved Geo-VRML format to
generate and exchange georeferenced data in VRML. Web consortium (1998) had developed
XML based file format which was improvement of VRML but too complex for
interpretation. 3D PDF format exchanges the 3D design information in normal PDF file
format which can be integrated with text document using Adobe software(Zlatanova et al.,
2012).
Keyhole Markup Language (KML) and Collaborative Design Activity (COLLADA) are
geovisualisation standards for geometry representation without semantics. KML is an XML

3D GIS Modeling at Semantic Level using CityGML for Urban Segment
27
based format for geovisualisation of objects in Google Earth and for web applications. Since,
its adoption by Open Geospatial Consortium (OGC), the support for geometry is given by
Geographic Markup Language (GML). COLLADA describes 3D content with geometry,
topology, and texture but without semantics. All the mentioned graphic and geovisualisation
formats only support realistic and interactive visualisation.
4.1.2 Building Information Models (BIM)
BIM is the semantic information modelling of building exterior and interior structures with
their physical and functional characteristics (Kolbe, 2009 & Gröger and Plümer, 2012). IFC,
an ISO standard developed by International Alliance for Interoperability (IAI) is used as data
exchange format for building information with support of WGS84 global reference system in
its current version 2x Edition 3 (buildingSMART, 2007). IFC provides semantic model only
for building objects with single LoD representation unlike CityGML semantic model.
However, relation between two semantic models (IFC and CityGML) for BIM (design
model) and geospatial models (real world model) has been researched to develop common
unified spatial applications with minimum conversion overhead. El-Mekawy et al., (2012)
has proposed unified building model (UBM) by analyzing relation between CityGML
features and corresponding IFC feature with 1:1, 1:n and n:1 relationship. Isikdag and
Zlatanova, (2009) have proposed framework for automatic derivation of buildings in
different CityGML LoDs from BIM by defining set of rules for semantic mapping and
geometry transformation.
4.1.3 Comparison of 3D standards and formats
Zlatanova et al., (2012) have compared standards based on 11 criterias categorised into three
groups: shape and appearance, object identification and attributes, and syntax and web
visualisation. The criterias of geometry, topology, texture and LoD are classified into shape
and appearance group. The criterias of objects, semantics and attributes are categorised in
object identification and attribute group, while syntax and web visualisation group deals with
the XML, web, georeferencing and vendor acceptance criterias. The authors provide
overview of discussed 3D data standards and its excerpt is listed in Table 4-1. The standards
(DXF, VRML, X3D and COLLADA) from Computer Aided Design (CAD) domain in
general follow geometry and texture criterias of 1st category. On other hand, the standards
(KML, Geo-VRML, 3D PDF) from Computer Graphics (CG) domain are in accordance with
the geo-referencing and XML based web geo-visualization category. CityGML and IFC 3D
standard from Building Information Model (BIM) accounts for the object identity
(semantics), attributes along with its thematic properties. CityGML is a GML3 based object-
oriented model for real 3D objects representation in terms of their semantic, geometry,
topology and appearance characteristics (Kolbe et al., 2012).

3D GIS Modeling at Semantic Level using CityGML for Urban Segment
28
Table 4-1: 3D data standards and file formats (Zlatanova et al., 2012)
Category Criteria Domain 3D standards
and file formats
Shape and
Appearance
Geometry, texture,
LoD, topology
Computer Aided Design
(CAD)
DXF, VRML,
X3D, COLLADA
Syntax and Web
visualization
XML and Web based,
georeferencing
Computer Graphics (CG) KML, Geo-
VRML, 3D PDF
Object identification
and attributes
Object semantics and
attributes
Building Information Model
(BIM)
CityGML, IFC
4.2 Rationale for 3D City Modeling at Semantic Level
In last decade, it was reportedly noted in literature that there had been no commonly agreed
standard available to represent and exchange 3D city models in an interoperable way. Hence,
the need for more general interoperable modeling approach for 3D city objects in terms of
topological and semantic aspects to account for the information requirements of various
vibrant user application fields was identified (Richardson, 2002). Usually, 3D city models
were represented and exchanged in non GIS computer graphics standards (3D Studio Max or
VRML) lacking interoperability as it was necessary for many user specific applications of
3D city models (Gröger and Plümer, 2012).
But, from last couple of years onwards, CityGML has emerged as a common geometric and
semantic information model to abstract the virtual 3D city objects and to facilitate lossless
data exchange in interoperable way. The only geometry representation of 3D objects may
results in more complex and redundant 3D content. This restricts utility of geometrical
models for broader use of 3D city models (Kolbe et al., 2012). CityGML is widely accepted
OGC standard for 3D city models by geospatial industry to facilitate spatio-semantic
analysis (Gröger and Plümer, 2012). Henceforth, the modeling and encoding of 3D space in
CityGML standard at semantic level including aboveground and underground, indoor and
outdoor built environment is needed to provide an optimum total solution for integrated
urban planning and decision making.
4.2.1 CityGML (Version 2.0.0)
Semantic information about 3D city object (e.g. building) is human conceptualisation of
different geometries (e.g. Wall surface, Roof surface, Door, Window) associated with it.
Semantic information helps to reduce ambiguities for geometric integration, if it is
coherently structured with respect to geometry (Stadler and Kolbe, 2007). “CityGML is a
common semantic information model based on ISO 191xx family standards for the
representation of 3D urban objects that can be shared over different applications” (Kolbe et
al., 2012). CityGML is an open data model and XML-based format for representation of 3D
geometries of most relevant city objects such as buildings, city furniture, land use and
3D GIS Modeling at Semantic Level using CityGML for Urban Segment
29
vegetation (Krüger A. and Kolbe T.H., 2012). The applicability of model for different
applications facilitates the cost-effective sustainable maintenance of various 3D city models.
The class diagram representation of relevant topographic objects in cities abstracts their
appearance, geometrical, topological and semantic properties along with application specific
data (e.g. values concerning urban energy consumption and production) to develop specific
Application Domain Extension (ADE) for strategic urban energy planning. CityGML
standard compliant 3D city model facilitates large and small scale representation of urban 3D
objects in different levels of detail simultaneously. The peculiarity of CityGML is
interoperability, in general and lossless information exchange between heterogeneous GI
systems and users, in particular (Kolbe et al., 2012).
The 3D urban segment can be decomposed into several natural and man-made entities. City
is a man-made entity which abstracts major components such as buildings, commutation
networks, city furniture, etc in a structured manner in terms of their semantics and well
defined spatial and thematic properties. Building component is the most important man-
made object in a city. Building module in CityGML contributes to a significant quantum of
semantics of City module. It also accounts for multi-resolution representation of buildings
and their installation parts. A particular module in CityGML is specified by Unified
Modeling Language (UML) instance diagrams. The geometry of building semantics is given
by externally referenced GML3.1.1 application schema. In order to support data integration
and spatio-semantic queries, it is essential to have structurally consistent models in terms of
their geometry and semantic properties (Stadler and Kolbe, 2007).
4.2.1.1 CityGML LoD2 Building model
Figure 4-1 illustrates CityGML feature structure as UML instance diagram of basic LoD2
building model. CityGML Building model is defined by the Building thematic extension
module. It allows multi-resolution representation of thematic and spatial properties of
buildings and building parts in discrete LoD.
Figure 4-1 shows corresponding classification of BoundarySurfaces. The _AbstractBuilding
is parent class of building model which is sub-class of thematic class _Site and which is sub-
class of root class _CityObject. Building and BuildingPart are the specialized classes of
_AbstractBuilding class. GML3 feature properties and CityGML specific properties from
_CityObject class are inherited by _AbstractBuilding class. The building class, building
function (e.g. residential, commercial, etc.), building usage, year of construction and
demolition, roof type, building and storey height attributes of _AbstractBuilding class are
inherited by Building and BuildingPart.
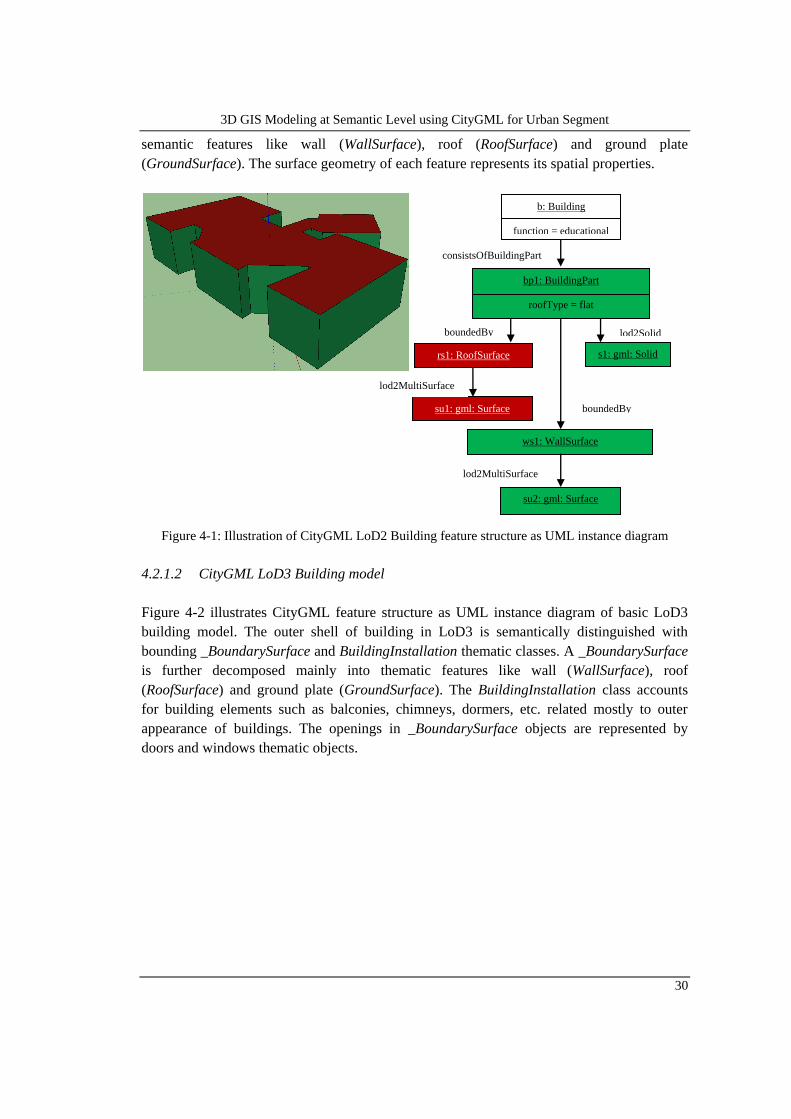
In LoD2 building model, the exterior surface of building is semantically categorised into
bounding _BoundarySurface class. The _BoundarySurface class primarily consists of
3D GIS Modeling at Semantic Level using CityGML for Urban Segment
30
semantic features like wall (WallSurface), roof (RoofSurface) and ground plate
(GroundSurface). The surface geometry of each feature represents its spatial properties.
Figure 4-1: Illustration of CityGML LoD2 Building feature structure as UML instance diagram
4.2.1.2 CityGML LoD3 Building model
Figure 4-2 illustrates CityGML feature structure as UML instance diagram of basic LoD3
building model. The outer shell of building in LoD3 is semantically distinguished with
bounding _BoundarySurface and BuildingInstallation thematic classes. A _BoundarySurface
is further decomposed mainly into thematic features like wall (WallSurface), roof
(RoofSurface) and ground plate (GroundSurface). The BuildingInstallation class accounts
for building elements such as balconies, chimneys, dormers, etc. related mostly to outer
appearance of buildings. The openings in _BoundarySurface objects are represented by
doors and windows thematic objects.
s1: gml: Solid
b: Building
function = educational
bp1: BuildingPart
roofType = flat
rs1: RoofSurface
su1: gml: Surface
ws1: WallSurface
su2: gml: Surface
consistsOfBuildingPart
lod2Solid boundedBy
boundedBy
lod2MultiSurface
lod2MultiSurface

3D GIS Modeling at Semantic Level using CityGML for Urban Segment
31
Figure 4-2: Illustration of CityGML LoD3 Building feature structure as UML instance diagram
4.3 Transformation Methodology
In order to generate 3D model, the IKONOS imagery of IIRS campus was rectified and
georeferenced with reference to Ground control points (GCPs) obtained from field survey.
Map composition of IIRS campus area was carried out and building footprints were
obtained. The extracted building footprints were imported as shapefile in ESRI CityEngine
software. Figure 4-3shows methodology for derivation of interoperable model.
4.3.1 LoD2 and LoD3 Building Model Generation
The LoD2 model of IIRS campus and LoD3 model of institutional buildings were generated
from building footprint shapefile using CGA grammar in ESRI CityEngine software. The
extensive field data about the building & openings dimensions was being used for
reconstruction of actual architectural geometry. The 3D shape models of building were
exported to KML format for pre-processing. The trees surrounding the buildings modelled in
CityEngine was also exported in KML format.
s1: gml: Solid
b: Building
function = educational
bp1: BuildingPart
roofType = flat
bi: BuildingInstallation
su4: gml: Surface
rs1: RoofSurface
su1: gml: Surface
ws1: WallSurface
su2: gml: Surface
d: Door
w: Window
su4: gml: Surface
su3: gml: Surface
consistsOfBuildingPart
lod1Solid
boundedBy
boundedBy
lod3MultiSurface
opening
outerBuildingInstallation
lod3Geometry lod3MultiSurface
lod3MultiSurface

3D GIS Modeling at Semantic Level using CityGML for Urban Segment
32
Figure 4-3: Transformation Methodology for derivation of Interoperable Model
4.3.2 Semantic Categorization
The LoD2 and LoD3 KML models were imported in Google SketchUp for thematic layering
of models into different semantic components of building. The LoD2 model was
thematically layered into bounding features such as WallSurface, RoofSurface,
GroundSurface and Tree (Figure 4-4) while LoD3 model was layered into
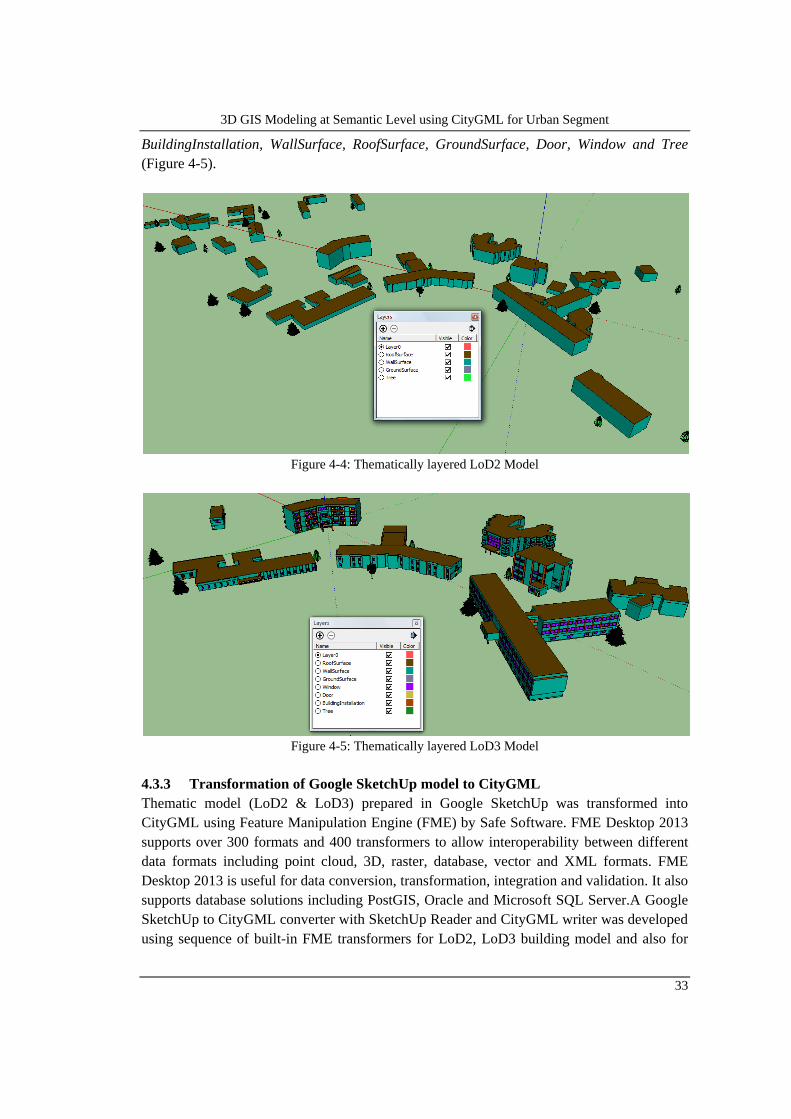
3D GIS Modeling at Semantic Level using CityGML for Urban Segment
33
BuildingInstallation, WallSurface, RoofSurface, GroundSurface, Door, Window and Tree
(Figure 4-5).
Figure 4-4: Thematically layered LoD2 Model
Figure 4-5: Thematically layered LoD3 Model
4.3.3 Transformation of Google SketchUp model to CityGML
Thematic model (LoD2 & LoD3) prepared in Google SketchUp was transformed into
CityGML using Feature Manipulation Engine (FME) by Safe Software. FME Desktop 2013
supports over 300 formats and 400 transformers to allow interoperability between different
data formats including point cloud, 3D, raster, database, vector and XML formats. FME
Desktop 2013 is useful for data conversion, transformation, integration and validation. It also
supports database solutions including PostGIS, Oracle and Microsoft SQL Server.A Google
SketchUp to CityGML converter with SketchUp Reader and CityGML writer was developed
using sequence of built-in FME transformers for LoD2, LoD3 building model and also for

3D GIS Modeling at Semantic Level using CityGML for Urban Segment
34
Vegetation (Tree) model. For LoD3 model, the feature classes for Building, RoofSurface,
WallSurface, GroundSurface, BuildingInstallation, Window and Door have been created
with Building as parent feature class. While for LoD2 model, feature classes only for
bounding surfaces (Building, RoofSurface, WallSurface and GroundSurface) have been
created. The FME workspace which contains readers, writers and transformers of LoD2 and
LoD3 converter is shown in Figure 4-6 &
Figure 4-7 respectively. A separate converter was developed for vegetation object to create
SolitaryVegetationObject feature class (Figure 4-8). The execution of conversion process
was iterated for every LoD2, LoD3 building and all vegetation objects.

3D GIS Modeling at Semantic Level using CityGML for Urban Segment
35
Figure 4-6: SketchUp to CityGML LoD2 customised converter using FME
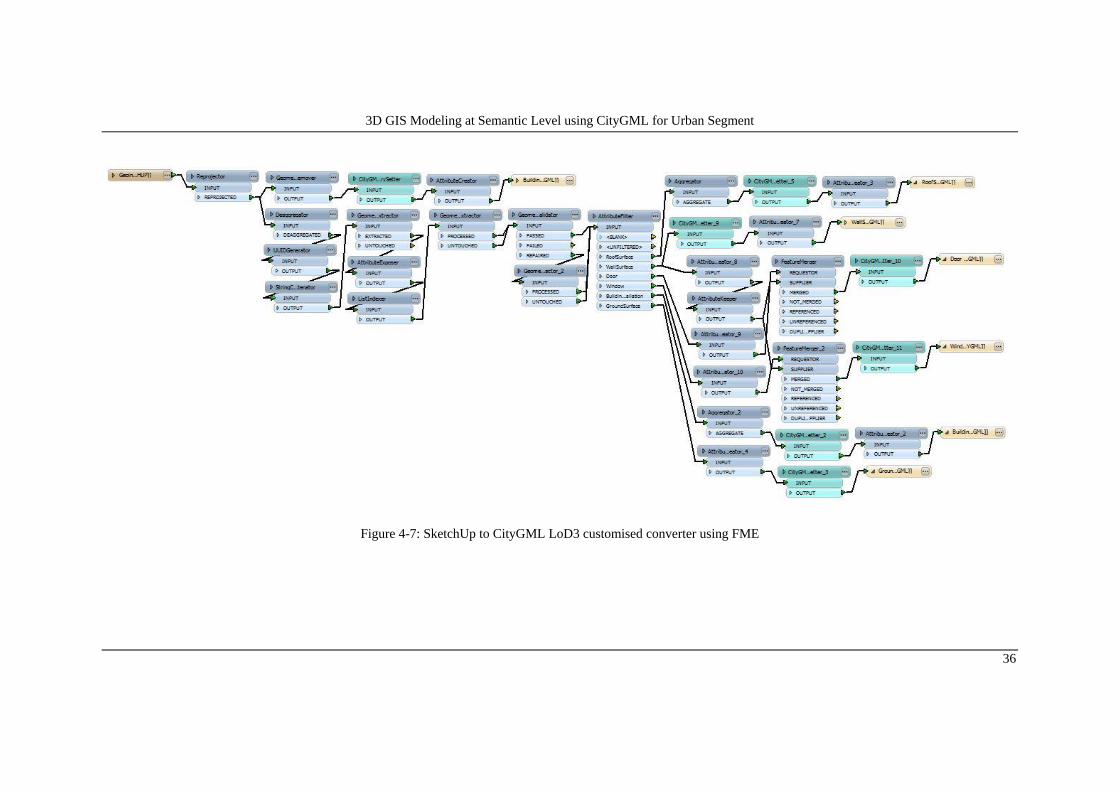
3D GIS Modeling at Semantic Level using CityGML for Urban Segment
36
Figure 4-7: SketchUp to CityGML LoD3 customised converter using FME

3D GIS Modeling at Semantic Level using CityGML for Urban Segment
37
LoD3 Converter: GeometryPropertyExtractor transformer in customised converter extracts
the geometry trait or name from different SketchUp layers by trait “sketchup_layer_name” –
Building, BuildingInstallation, RoofSurface, WallSurface, GroundSurface, Window and
Door. The CityGMLGeometrySetter transformer was used to assign CityGML LoD name
and Feature Role to CityGML Feature corresponding to extracted geometry trait.
GeometryValidator transformer repairs geometry defects in processed input features.
AttributeCreator creates new CityGML features and assigns unique ids to generated features.
The CityGML feature writers in FME imports the XSD schema of core and base profiles to
write CityGML instance document. The citygml_parent_id for the RoofSurface, WallSurface
and GroundSurface was set to Building ID. While for Building, the citygml_parent_id was
set to CityModel ID. Thus, the corresponding CityGML LoD3 model has been derived from
SketchUp model.
Figure 4-8: SketchUp to CityGML (LoD2 & LoD3) customised converter for Vegetation object
4.3.4 Storage of semantic components in Open source RDBMS
The separate CityGML files generated were combined into a single CityGML file for
respective LoD. The combined CityGML model corresponding to particular LoD was
imported in open source PostGIS database for semantic querying. There were nine relations
(Building, BuildingInstallation, CityModel, RoofSurface, WallSurface, GroundSurface,
Door, Window, SolitaryVegetationObject) of LoD3 model and six relations (Building,
CityModel, RoofSurface, WallSurface, GroundSurface, SolitaryVegetationObject) of LoD2
model imported into separate PostGIS database using FME CityGML reader and PostGIS
writer with key of “citygml_parent_id” field.
4.3.5 Model Preparation for export to Energy modelling program
The building information designed in Google Sketchup is transformed into space model by
selecting shading surfaces as bounding surfaces and creating the Room space using
gModeller-Energy Analysis Plug-in for Google Sketchup. The space model is then exported
to IESVE energy modelling program in gbXML schema to allow interoperable use of
building information model into energy analysis software program.
4.3.6 Integration of Energy simulation data and semantic analysis
For energy conservation strategy in urban segment, building object was considered as
hemispherical dome and sun elevation above horizon was categorized as 30°, 60°, 90°, 120°
and 150°. The solar energy potential of WallSurface and RoofSurface of LoD2 building
model was assessed by quantising amount of solar intensity irradiated on walls and roofs of
building using SunCast application in IES Virtual Environment Software. The application
provides effective percentage of wall surface areas exposed to insolation during every hour

3D GIS Modeling at Semantic Level using CityGML for Urban Segment
38
throughout the year. The unique identity of semantic components of model is stored as
distinct relation in PostGIS database. The integration of application specific data of
percentage of sun exposed walls in winter and summer was performed with respective
semantic relations using SQL.
A basic semantic query was performed to find out number of semantic components receiving
solar radiation for maximum duration of year and to observe the effect of seasonal variation
(summer and winter) on number of bounding elements receiving solar radiation for
maximum duration of season.
4.4 Dissemination of Interoperable Model
The LoD2 and LoD3 CityGML XML schema obtained from converter uses externally
referenced GML3.1.1 schema for storage of geometry of semantic components. It derives
required XML elements of building module from the XSD document of externally
referenced base profile module. It derives gml: envelope element from CityGML core
module to define the spatial bounding box of building model. The cityObjectMember
element of core module contains all elements required for definition of building semantic
components.
A building object is bounded by WallSurface with openings which are stored as exterior and
interior LinearRing geometry type. It stores the coordinates of points forming the LinearRing
geometry in gml: posList element. The building installation semantic component is stored in
bldg: BuildingInstallation element as lod3Geometry with gml: MultiSurface, gml:
surfaceMember, gml: Polygon, gml: LinearRing as child elements and bldg:
outerBuildingInstallation as parent element. On similar lines building surface bounding
components such as WallSurface, RoofSurface and GroundSurface are stored as
lod2MultiSurface and lod3MultiSurfacegeometries for respective LoD2 and LoD3 models.
The opening semantic components (Door and Window) of building are also stored as
lod3MultiSurface geometries with hierarchy of gml: MultiSurface, gml: surfaceMember,
gml: Polygon, gml: LinearRing and gml: posList as child elements inside bldg: opening
parent element.
Table 4-2 & Table 4-3 show the summary of semantic features of all buildings (Lod2 &
Lod3) in study area written by the FME CityGML writer of developed customised converter.
Figure 4-9 & Figure 4-10 shows the LoD2 & LoD3 CityGML building model with semantic
layers rendered in FZK viewer.

3D GIS Modeling at Semantic Level using CityGML for Urban Segment
39
Table 4-2: LoD2 semantic features summary
Features of IIRS LoD2 model Number of Features
CityModel 001
Building 034
WallSurface 410
RoofSurface 034
GroundSurface 034
SolitaryVegetationObject 020
Total Features Written 533
Table 4-3: LoD3 semantic features summary
Features of IIRS LoD3 model Number of Features
CityModel 0001
Building 0011
BuildingInstallation 0011
WallSurface 1359
RoofSurface 0014
GroundSurface 0011
Window 0642
Door 0061
SolitaryVegetationObject 0009
Total Features Written 2119
Figure 4-9: IIRS LoD2 CityGML model rendered in FZK Viewer

3D GIS Modeling at Semantic Level using CityGML for Urban Segment
40
Figure 4-10: IIRS LoD3 CityGML model rendered in FZK Viewer
Figure 4-11shows basic semantic analysis results in web browser for LoD3 model of
Geoinformatics department building in 3D PDF format. It provides information about
insolation on semantic components of building for given time of day. The web interface
allows choosing of good, medium and poor intensity facades at every hour of day. It also
facilitates end user to analyse the particular openings of buildings receiving enough
illumination during day time.
Figure 4-11: Basic semantic query results dissemination through Web browser

3D GIS Modeling at Semantic Level using CityGML for Urban Segment
41
5 Semantic Analysis for Urban Energy conservation strategies
5.1 Review of Urban Energy conservation Case Studies
The exponential growth of cities in India due to urbanization resulted in increased use of
non-renewable energy resources to meet the essential power requirements of urban built
environment. The urban segment consumes large percentage of total energy produced. The
energy produced by burning fossil fuels leads to emission of greenhouse gases affecting the
environment and posing adverse climate change impacts. Hence, meeting of increase urban
energy demand by reducing carbon footprint is a challenge for cities to make necessary
amendments in their urban energy infrastructure strategies towards efficient and sustainable
management of available energy resources.The urban energy modeling studies are facing the
problems of data availability of real-time city-wide energy consumption which is useful for
simulation of various urban energy scenarios and subsequent decision making. Hence, the
complex urban energy system in sustainable cities must model, simulate and analyze the
spatially distributed urban energy demand and supply based on building energy component
characteristics and urban morphology (2D & 3D) at building and city scale respectively.
The European Institute for Energy Research (EIFER) has proposed 3D urban morphology
based spatial model for simulation of heat energy demand and spatial Agent-Based models
for simulation of smart grids (Bahu et al., 2013). The authors have used 3D city models for
assessment of solar potential and heat energy demand of residential buildings. In another
study, Krüger A. and Kolbe T.H., (2012) have derived energy-related key indicators of
buildings from spatio-semantic properties of CityGML compliant 3D city models for
estimation of heating energy consumption in buildings. The authors have also mentioned
about applicability of proposed research into analysis of different energy simulation
scenarios for urban energy planning and decision making. The integration of 3D geodata and
urban energy models is advantageous for both urban and energy planning domains. The
energy models are enriched with high resolution spatio-semantic content from 3D city
models while on other hand 3D models are complemented with description of their energy
performance and use at semantic level.
Ratti et al., (2005) have attempted to integrate the urban geoinformation and energy system
by assessing the impacts of urban geometry, building design, system efficiency and occupant
behaviour on building energy performance. The values for urban geometry (e.g. surface-to-
volume ratio, passive zones identification and zones) were calculated from DEM and
Lighting and Thermal (LT) model. The LT model developed by Baker et al., (2000) provides
the relation between architectural parameters and building energy consumption as a function
of illuminance level, boiler efficiency and heat transfer coefficients (U-values). Ratti et al.,
(2005) have also studied the effects of urban morphology on building energy consumption

3D GIS Modeling at Semantic Level using CityGML for Urban Segment
42
by defining urban parameters (passive / non-passive zones, orientation of facade, urban
horizon angle, and obstruction sky view) in LT model.
Carrión et al., (2010) have proposed a methodology for estimation of energetic rehabilitation
state of buildings by calculating heating energy consumption as a function of building energy
characteristics derived from CityGML compliant 3D city model. The estimation is based on
assumption that heating energy consumption of buildings is strongly correlated to their
energy relevant geometric and semantic parameters. The building energy parameter values
for volume, assignable area, surface-to-volume (s-v) ratio, average storey height and
building type were derived from spatio-semantic properties of CityGML 3D city model.
Eicker et al., (2012) have also developed methodology for estimation of heating energy
demand of residential buildings from virtual 3D city models.
Strzalka et al., (2010) have demonstrated implementation of two simulation models in
Integrated Simulation Environment Language (INSEL) software for estimation of heating
energy demand at city scale and building level. The heating energy demand was calculated
using parameters of heated volume, s-v ratio, and heat transfer coefficients and weather data.
The first model implemented degree day method(Sarak and Satman, 2003) considering only
transmission losses through building envelope while second model implemented energy
balance method taking into account transmission and ventilation losses, and solar and
internal heat gains. Kaden and Kolbe, (2013) have also calculated net energy demand for
space heating based on energy balance method as function of building geometry, building
usage, building construction material parameters derived from semantic 3D city models.
Compared to these methods, current research work aims to assess the active and passive
solar potential of built environment at urban design scale. The study aims to examine urban
surfaces exposed to global (direct and diffuse) solar irradiance for identification of suitable
location to collect solar energy on seasonal basis. The qualitative computation of amount of
irradiance on roofs and facades in terms of exposed areas is performed for active solar
potential assessment. The amount solar illuminance through the facade fenestrations is
determined to develop approach for passive solar potential assessment. The values of floor
area and percentage exposed areas of facades and roofs from simulation model are integrated
using SQL with the respective semantic components of developed CityGML LoD2 and
LoD3 model stored in RDBMS. The semantic analysis is performed and simulation results
are visualised in viewer for sustainable urban planning and efficient decision making.
5.2 Review of Solar Radiation Simulation algorithm in urban context
The study of solar radiation over urban texture by Lee and Zlatanova, (2009) have been
identified as the most relevant to the current research. The authors have presented the
environmental analysis of 2.5D urban surface model extracted from LIDAR and image
processing techniques to examine the energy performance at city scale. The authors have

3D GIS Modeling at Semantic Level using CityGML for Urban Segment
43
also implemented the tool to estimate percentage of urban surfaces exposed to direct solar
radiation and amount of total solar irradiance (diffuse and beam) incident on facades and
roofs.
5.2.1 Basic Terminologies in Solar Radiation Model
Beam Radiation: “The solar radiation received from sun without having been scattered by
the atmosphere”(Duffie and Beckman, 1980). It is also often called as direct normal
radiation. It is the amount of solar radiation incident on a surface perpendicular to beam of
radiation (Ibeam).
Diffuse Radiation: “The solar radiation received from sun after direction has been changed
by scattering by atmosphere” (Idiff). It has two components: diffuse radiation from sky (Isdiff)
and diffuse radiation from ground (Igdiff).
Total Solar Radiation: “The sum of beam and diffuse solar radiation on a surface”. It is also
referred as global radiation on surface (Iglob).
Irradiance: “The rate at which radiant energy is incident on a per unit area of a surface
perpendicular to the direction of propagation of radiation, at mean earth-sun distance,
outside of atmosphere”. It is given by solar constant Gsc equal to 1367 W/m2adopted by
World Radiation Center (WRC) with uncertainty of 1%.
Irradiation or Radiant Exposure (J/m2): “The incident energy per unit area on a surface”.
The term insolation is used for solar energy irradiation.
5.2.2 Sun-Earth Geometry
The geometry between any oriented surface relative to earth‟s surface at any time and beam
radiation or position of sun relative to surface is defined by sun altitude (s), zenith (z) and
azimuth angle (s) and angle of beam radiation incidence (), surface azimuth angle () and
slope (), location (latitude-angular location , longitude) of surface on earth and hour angle
(). A geometrical relationship was described in terms of these angles by Benrod and Bock,
(1934). Figure 5-1 shows the sun-earth geometry between a beam radiation and tilted
surface.

3D GIS Modeling at Semantic Level using CityGML for Urban Segment
44
Figure 5-1: Sun-Earth geometry(Duffie and Beckman, 1980)
The relation between the beam angle of incidence and surface angles is given by equations
mentioned in Duffie and Beckman, (1980).
cos 𝜃 = sin 𝛿 sin 𝜑 cos 𝛽 − sin 𝛿 cos 𝜑 sin 𝛽 cos 𝛾+ cos 𝛿 cos 𝜑 cos 𝛽 cos 𝜔+ cos 𝛿 sin 𝜑 sin 𝛽 cos 𝛾 cos 𝜔+ cos 𝛿 sin 𝛽 sin 𝛾 sin 𝜔
(5-1)
cos 𝜃 = cos 𝜃𝑧 cos 𝛽 + sin 𝜃𝑧 sin 𝛽 cos (𝛾𝑠 − 𝛾) (5-2)
For vertical surfaces (e.g. facades), = 90°, substituting in (5-1,
cos 𝜃 = − sin 𝛿 cos 𝜑 cos 𝛾 + cos 𝛿 sin 𝜑 cos 𝛾 cos 𝜔+ cos 𝛿 sin 𝛾 sin 𝜔
(5-3)
For horizontal surfaces (e.g. roofs), = 0° then = z, substituting in (5-1,
cos 𝜃𝑧 = cos 𝜑 cos 𝛿 cos 𝜔 + sin 𝜑 sin 𝛿 (5-4)
In order to estimate active and passive solar potential of urban surfaces, it is required to
calculate solar radiation incident on facades and windows ( = 90°), flat and gabled roof
structures, and horizontal surfaces. The total incident solar radiation on tilted surface is the
sum of beam radiation, three components of diffuse radiation from sky (mainly, isotropic
component in this research context) and radiation reflected from ground.

3D GIS Modeling at Semantic Level using CityGML for Urban Segment
45
5.2.3 Beam Radiation on tilted surfaces
For solar calculation purposes, it is required to calculate the radiation on tilted surface (in
context of this research work, facades and gabled roof structures) from measurements or
simulation estimates of radiation on horizontal surfaces. Usually, measurement data of total
radiation on horizontal surface is available and, beam, diffuse and total radiation data on
tilted surface is derived. The relation between beam radiation on tilted surface to that on
horizontal surface is given by the geometric factor; Rb. Figure 5-2illustrates the ray diagram
for calculation of radiation on horizontal and tilted surface.
𝑅𝑏 = 𝐵𝑒𝑎𝑚 𝑟𝑎𝑑𝑖𝑎𝑡𝑖𝑜𝑛 𝑜𝑛 𝑡𝑖𝑙𝑡𝑒𝑑 𝑠𝑢𝑟𝑓𝑎𝑐𝑒 (𝐼𝑡𝑏𝑒𝑎𝑚 )
𝐵𝑒𝑎𝑚 𝑟𝑎𝑑𝑖𝑎𝑡𝑖𝑜𝑛 𝑜𝑛 𝑜𝑟𝑖𝑧𝑜𝑛𝑡𝑎𝑙 𝑠𝑢𝑟𝑓𝑎𝑐𝑒 (𝐼𝑏𝑒𝑎𝑚 )=
𝐼𝑏𝑒𝑎𝑚 cos 𝜃
𝐼𝑏𝑒𝑎𝑚 cos 𝜃𝑧
= 𝑐𝑜𝑠 𝜃
𝑐𝑜𝑠 𝜃𝑧
(5-5)
The beam radiation on tilted surface is given by (5-6.
𝐼𝑡𝑏𝑒𝑎𝑚 = 𝑅𝑏𝐼𝑏𝑒𝑎𝑚 (5-6)
Figure 5-2: Beam radiation on tilted surface(Duffie and Beckman, 1980)
5.2.4 Diffused Radiation on tilted surfaces
The study of profiles of diffuse radiation from sky by Coulson, (1975) has categorised
diffuse radiation into three main components – isotropic component received uniformly from
sky and two anisotropic component: circumsolar diffuse from forward scattering of solar
radiation concentrated in part of sky around the sun and horizon brightening concentrated
near horizon shown in Figure 5-3.
Figure 5-3: Components of diffuse radiation over sky dome(Perez et al., 1988)
Ibeam
Ibeam
Ihbeam
Itbeam
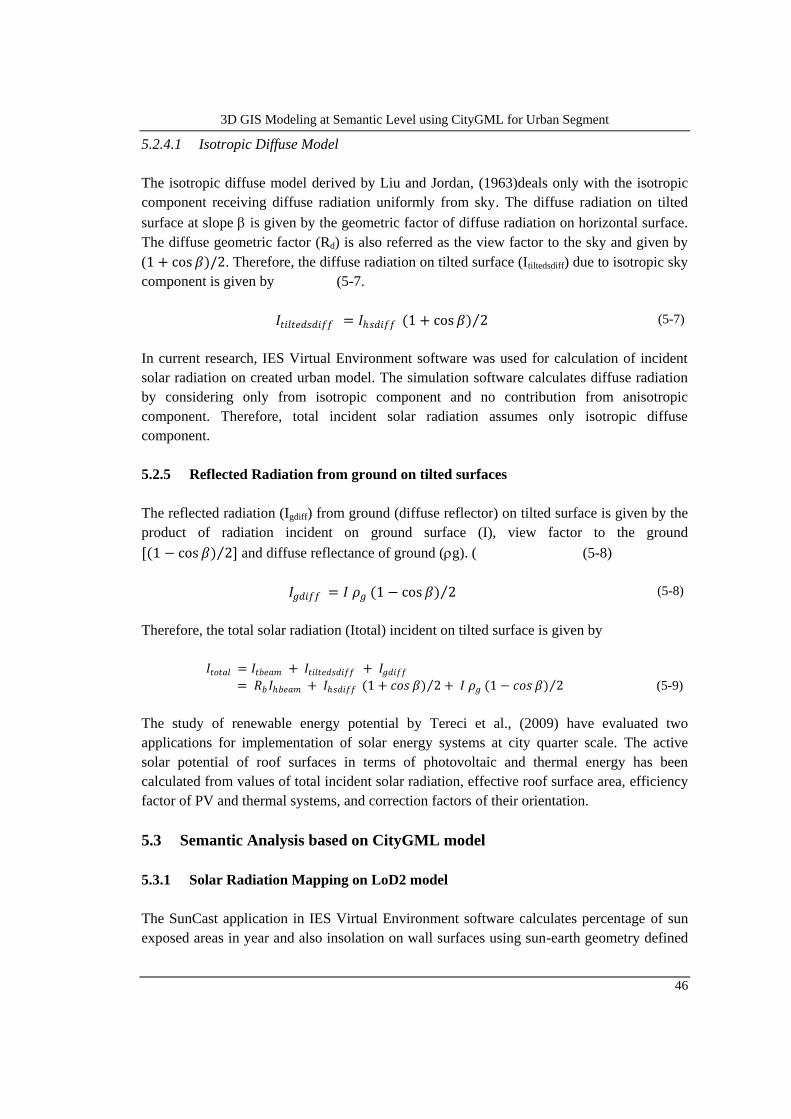
3D GIS Modeling at Semantic Level using CityGML for Urban Segment
46
5.2.4.1 Isotropic Diffuse Model
The isotropic diffuse model derived by Liu and Jordan, (1963)deals only with the isotropic
component receiving diffuse radiation uniformly from sky. The diffuse radiation on tilted
surface at slope is given by the geometric factor of diffuse radiation on horizontal surface.
The diffuse geometric factor (Rd) is also referred as the view factor to the sky and given by
(1 + cos 𝛽)/2. Therefore, the diffuse radiation on tilted surface (Itiltedsdiff) due to isotropic sky
component is given by (5-7.
𝐼𝑡𝑖𝑙𝑡𝑒𝑑𝑠𝑑𝑖𝑓𝑓 = 𝐼𝑠𝑑𝑖𝑓𝑓 (1 + cos 𝛽) 2 (5-7)
In current research, IES Virtual Environment software was used for calculation of incident
solar radiation on created urban model. The simulation software calculates diffuse radiation
by considering only from isotropic component and no contribution from anisotropic
component. Therefore, total incident solar radiation assumes only isotropic diffuse
component.
5.2.5 Reflected Radiation from ground on tilted surfaces
The reflected radiation (Igdiff) from ground (diffuse reflector) on tilted surface is given by the
product of radiation incident on ground surface (I), view factor to the ground
[(1 − cos 𝛽) 2 ] and diffuse reflectance of ground (g). ( (5-8)
𝐼𝑔𝑑𝑖𝑓𝑓 = 𝐼 𝜌𝑔 (1 − cos 𝛽) 2 (5-8)
Therefore, the total solar radiation (Itotal) incident on tilted surface is given by
𝐼𝑡𝑜𝑡𝑎𝑙 = 𝐼𝑡𝑏𝑒𝑎𝑚 + 𝐼𝑡𝑖𝑙𝑡𝑒𝑑𝑠𝑑𝑖𝑓𝑓 + 𝐼𝑔𝑑𝑖𝑓𝑓
= 𝑅𝑏𝐼𝑏𝑒𝑎𝑚 + 𝐼𝑠𝑑𝑖𝑓𝑓 (1 + 𝑐𝑜𝑠 𝛽) 2 + 𝐼 𝜌𝑔 (1 − 𝑐𝑜𝑠 𝛽) 2
(5-9)
The study of renewable energy potential by Tereci et al., (2009) have evaluated two
applications for implementation of solar energy systems at city quarter scale. The active
solar potential of roof surfaces in terms of photovoltaic and thermal energy has been
calculated from values of total incident solar radiation, effective roof surface area, efficiency
factor of PV and thermal systems, and correction factors of their orientation.
5.3 Semantic Analysis based on CityGML model
5.3.1 Solar Radiation Mapping on LoD2 model
The SunCast application in IES Virtual Environment software calculates percentage of sun
exposed areas in year and also insolation on wall surfaces using sun-earth geometry defined

3D GIS Modeling at Semantic Level using CityGML for Urban Segment
47
by solar angles (zenith, azimuth, and local angle of incidence), date, time, plane orientation
and tilt, plane surface azimuth, site longitude and latitude. The sun-earth geometry
establishes the relation between beam radiation and oriented plane on earth‟s surface. It
allows generating of temporal images which can be used for solar surface shading and
insolation analysis. The software has computed the total incident solar Irradiance values are
for full year using object location information and weather data files of point nearest to it.
The simulated full year global radiation values on walls and roofs can be used to quantify the
solar thermal and photovoltaic potential of building objects in study area. Figure 5-4 shows
mapping of incident solar radiation on vertical and horizontal surfaces of building objects.
Figure 5-4: Mapping of annual solar radiation incident on building surfaces
The application provides simulation with temporal granularity of hour, day and month which
is useful to evaluate building semantic features exposed to sun for longer duration during
summer and winter. The temporal simulation plays important role in calculation of actual
solar panel size and their placement on walls and roofs to easily collect incident solar energy.
The SunCast application can be used to analyze the effects of surrounding building and tree
obstructions on concerned buildings and also visualize different building orientations at
designing stage.
5.3.2 Solar Luminance and Illuminance Mapping on LoD3 model
The RadianceIES application in IES Virtual Environment software visualizes the distribution
of amount of light available in given 3D environment. It is useful to compute the solar
illuminance on semantic feature surfaces (windows), luminance due to facades, daylight

3D GIS Modeling at Semantic Level using CityGML for Urban Segment
48
factors and perform glare analysis. RadianceIES works on “ray-tracing” algorithm which
traces ray of light from eye position into the source and generates luminance and illuminance
images based on loaded sky conditions. Figure 5-5shows luminance mapping and glare
analysis through openings of south-west oriented facade of Geoinformatics department
building in study area due to reflections surrounding building and tree obstructions at 15:00
hrs on April 10.
Figure 5-5: Luminance Mapping and Glare analysis on LoD3 model
Figure 5-6 shows illuminance on external south-west oriented building facade and openings
due to loaded sky conditions at 15:00 hrs on April 10. The illuminance mapping can be
performed on facades of all buildings in study area for analysis of daylight conditions and
glare due to reflections from surrounding obstructions.
Figure 5-6: Illuminance mapping on external facade of LoD3 model
5.3.3 Basic semantic Query on LoD2 model
The presented simulation could be useful to address certain queries related to semantic
features of building object. The values for percentage of exposed areas in summer, winter
and throughout the year of walls and roofs are integrated with respective tables WallSurface
and RoofSurface in PostGIS RDBMS. The results of basic semantic query performed were
visualised in viewer of FME data inspector.
The first basic query was performed to find out number of walls and roofs receiving solar
radiation for maximum duration of year. The criterion was set on percentage of wall or roof

3D GIS Modeling at Semantic Level using CityGML for Urban Segment
49
area exposed to radiation throughout the year. A particular wall or roof is receiving solar
radiation for maximum duration, if its annual percentage of area exposed to radiation is
above the threshold. After evaluating the values of percentage areas, the threshold of 50%
was set for walls and 80% was set for roofs. There were 107 walls out of total 410 and 29
roofs out of total 34 retrieved above the set threshold. The wall with ID gml_id =
“GML_21fa3755-12ba-4cfe-9fa2-3891662f6102” of International hostel building was with
maximum percentage of exposed area of 80%, while wall with ID gml_id =
“GML_e465dc6c-550e-4058-af89-d8d4ebf480f0” of Lecture hall building was with
minimum of 50.34%. Figure 5-7 shows the walls of building above the threshold,
highlighting wall exposed to radiation for maximum duration of year.
Figure 5-7: WallSurfaces above 50% threshold of annual percentage of exposed area (The solar
radiation is available on 80% area of highlighted wall throughout the year, which is maximum)
The second query was to observe the effect of seasonal variation (summer and winter) on
number of bounding elements receiving solar radiation for maximum duration of season. The
same criterion of previous query was set for this query.
For winter season, there were 127 walls out of total 410 and 30 roofs out of total 34 retrieved
above the set threshold. The wall with ID gml_id = “GML_d1964098-5f94-4695-8432-
2199d4fc56e6” and gml_id = “GML_d1964098-5f94-4695-8432-2199d4fc56e6” of
International hostel building was with maximum percentage of exposed area of 100%, while
wall with ID gml_id = “GML_810d6b99-c893-42c1-98b3-8b7575789e2d” of Type C2
Quarters building was with minimum of 50.08%. Figure 5-8 shows the walls of building
above the threshold, highlighting wall exposed to radiation for maximum duration of winter
season.

3D GIS Modeling at Semantic Level using CityGML for Urban Segment
50
Figure 5-8: WallSurfaces above 50% threshold of winter percentage of exposed area (The solar
radiation is available on whole area of highlighted wall throughout winter season, which is maximum)
For summer season, there were 83 walls out of total 410 and 30 roofs out of total 34
retrieved above the set threshold. The wall with ID gml_id = “GML_21fa3755-12ba-4cfe-
9fa2-3891662f6102” of International hostel building and ID gml_id = “GML_8c1db66c-
ae23-4d57-bcb8-196671644ef6” Type C2 Quarters building was with maximum percentage
of exposed area of 63.75%, while wall with ID gml_id = “GML_5980b93f-8e46-485c-b0a2-
f92fb8fe5b25” of Guest House Room building was with minimum of 50.39%.shows the
walls of building above the threshold, highlighting wall exposed to radiation for maximum
duration of summer season.
Figure 5-9: WallSurfaces above 50% threshold of summer percentage of exposed area (The solar
radiation is available on 63.75% area of highlighted wall throughout summer season, which is
maximum)

3D GIS Modeling at Semantic Level using CityGML for Urban Segment
51
The identification of effective facade areas exposed to radiation provides the active solar
potential assessment at urban design scale by accumulating maximum incident solar energy.
Depending upon total incident solar radiation values and efficiency factors of solar panels,
the amount of photovoltaic and thermal energy potential can be quantified. For passive solar
assessment at urban design scale, the daylight penetrations through facade fenestrations can
be assessed. The calculations of amount of daylight penetrations and light efficacy of
electrical systems (lumens/watt) could give the savings in electricity used for lighting.

3D GIS Modeling at Semantic Level using CityGML for Urban Segment
52
6 Formulation of CityGML Energy ADE
6.1 Interoperability gap between BIM and Energy Models
With the advent of energy rating systems (e.g. LEED – Leadership in Energy and
Environment Design) and energy efficiency requirements of built environment, the
assessment of energy performance of new buildings and refurbishment rates of existing
buildings has become important compliance in building design process. In order to
implement the energy efficient measures for building, it is essential that spatio-semantic
information interoperability between BIM softwares and energy modelling softwares must
exist. Interoperability facilitates the different domain teams (design, engineering and energy
modelling) to interact with single building model and to make necessary changes in design
depending upon the analysis of “what-if” scenarios. But still, the BIM-energy modelling
interoperability explored so far is unidirectional process work flow between BIM and energy
simulation systems.
The unidirectional process workflow was implemented using Green Building XML schema
(referred to as “gbXML”) to export the building information model into energy modelling
softwares. In order to benefit the BIM from energy performance results (workflow from
energy models to BIM), the process of integration of energy simulation results with semantic
features from CityGML based building model was attempted. The integrated CityGML
model was used as basis for formulation of conceptual schema for CityGML Energy
Application Domain Extension (ADE). Figure 6-1 elaborates the process workflow
attempted in present investigation.
Figure 6-1: Process workflow for information integration
The application domain extension (ADE) mechanism discussed in OGC document for
CityGML standard can simplify the above workflow by providing XML based exchange of

3D GIS Modeling at Semantic Level using CityGML for Urban Segment
53
information with BIM and energy simulation softwares. Figure 6-2 depicts simplified
bidirectional workflow for integration and exchange of BIM and simulation information.
Figure 6-2: Bidirectional workflow for information exchange and integration
6.2 Overview of CityGML ADE mechanism
CityGML is interoperable information model which defines mostly all the relevant city
objects and their attributes to address broad range of applications. However, model allows
extending of its capabilities to include requirements of specific user application. CityGML
ADE concept provides mechanism for integration of simulation input parameters and results
with CityGML in form of conceptual schema to allow interoperable information exchange
between design and simulation systems. CityGML provides two mechanisms to define
application specific objects and their attributes for encoding of simulation indicators and
results which are not explicitly modelled in CityGML (Kolbe et al., 2012):
1. Generic objects and attributes: The generic extensions of CityGML are given by
GenericCityObject and _genericAttribute classes defined in Generics thematic
extension module. The attributes and features which are not modelled by predefined
by thematic CityGML classes are incorporated into any _CityObject as generic
objects without any change in CityGML XML schema. For example, current
CityGML version does not provide explicit thematic models for embankments and
city walls.
2. Application Domain Extension (ADE): ADE mechanism specifies additions of
application specific properties to particular CityGML module by defining an extra
XML schema definition file based on the CityGML schema definitions with its own
namespace, explicitly importing the XML schema definition of extended CityGML
module. An ADE schema can extend one or more CityGML module schemas. An
OGC document defining CityGML standard has specified Noise ADE for
Environmental Noise Dispersion simulation.
ADE mechanism allows validation of instance documents against both the extended
CityGML and ADE schema which is advantageous for different GI users working in same
application field to maintain semantic and syntactic interoperability. ADE mechanism
provides two ways extending existing CityGML modules or classes. The first way, is to
define new application specific feature types in ADE classes derived from respective abstract
or concrete CityGML classes allowing inheritance of all properties and associations. The
second way is to extend existing CityGML class with application specific properties by

3D GIS Modeling at Semantic Level using CityGML for Urban Segment
54
“hook” mechanism. A “hook” in every XML schema definition of CityGML class or feature
facilitates inclusion of additional properties into it by ADEs using substitution of attributes
and properties. A “hook” element is defined by “xsd: anyType” data type from XSD
namespace and implemented as a GML property of the form
“_GenericApplicationPropertyOf<Featuretypename>”where <Featuretypename>is equal to
name of CityGML class or feature in which it is incorporated. The arbitrary number of
application specific properties can be defined for CityGML feature or class with XML
content with name “_GenericApplication-PropertyOf<Featuretypename>”. A “hook”
element is assigned to substitution group in concerned CityGML module namespace by
defining corresponding “_GenericApplicationPropertyOf<Featuretypename>”.
6.3 UML based modelling of CityGML ADE
Van den Brink et al., (2013) have given UML based modelling approach to develop
CityGML ADE. The authors have used model driven approach to extend CityGML data
model for inclusion of application specific information starting from UML diagrams. Out of
six alternatives described and compared, an optimal alternative was chosen for modelling of
ADEs in UML. These six alternatives were evaluated to address problem of representing
sub-classing and substitution of properties (“ade_hooks”) in UML. In order to overcome this
problem, an optimal alternative of adding these properties in a subclass in ADE package and
suppressing it from XML schema generation was selected. The subclasses have same name
as CityGML class they are extending with stereotype <<ADEElement>> and <<ADE>>
assigned to these subclasses and their specialized relation respectively. This representation
depicts that stereotypes marked subclasses are special subclasses adding only properties to
CityGML class and are exempted while creating XML schema. The authors have also
generated an XML schema (GML application schema)from IMGeo ADE defined in UML
(XMI file of ADE UML model exported from Enterprise Architect) using ShapeChange Java
tool which implements UML to GML encoding rules described in ISO standards. A custom
encoding rule was added in ShapeChange for classes with <<ADEElement>> stereotype in
order to suppress them from GML application schema generation but at the same time
allowing addition of properties to ADE namespace as substitutes for the CityGML
“_GenericApplicationPropertyOf<Featuretypename>” hooks. As there are no guidelines
provided in current OGC CityGML specification for extension of CityGML to correctly
model an ADE in UML, the described model driven approach will be considered as best
practice for modelling of CityGML Energy ADE in UML, which is the goal of current
investigation.

3D GIS Modeling at Semantic Level using CityGML for Urban Segment
55
6.4 Review of CityGML Energy ADE Test beds
6.4.1 Energy Atlas of Berlin – CityGML Energy ADE Test Bed
Urban energy consumption in terms of power/electricity, water, gas and heating is directly
correlated with building information such as envelope volume, assignable area, its type and
no. of inhabitants (Krüger A. and Kolbe T.H., 2012). The case study of area in Berlin
demonstrates the existence of relationship between energy consumption values and building
spatio-semantic properties derived from CityGML model of Berlin City. The test bed
provides estimation of heating energy consumption based on building information
parameters, indexes, elementary and complex indicators. Indicator values are derived from
the semantic, geometric and topological properties of CityGML compliant 3D city model of
Berlin. The excerpt from study (Krüger A. and Kolbe T.H., 2012) is mentioned below.
Elementary indicator values explicitly taken from semantic properties of building are number
of storeys, building usage, construction year and no. of accommodation units.
𝐸𝐼𝑁𝑢𝑚𝑏𝑒𝑟𝑂𝑓𝑆𝑡𝑜𝑟𝑖𝑒𝑠 = 𝑃𝑟𝑜𝑝𝑒𝑟𝑡𝑦 𝐵𝑢𝑖𝑙𝑑𝑖𝑛𝑔 𝑛𝑢𝑚𝑏𝑒𝑟𝑂𝑓𝑆𝑡𝑜𝑟𝑒𝑦𝑠
𝐸𝐼𝑈𝑠𝑎𝑔𝑒 = 𝑃𝑟𝑜𝑝𝑒𝑟𝑡𝑦 𝐵𝑢𝑖𝑙𝑑𝑖𝑛𝑔 𝑓𝑢𝑛𝑐𝑡𝑖𝑜𝑛
𝐸𝐼𝐶𝑜𝑛𝑠𝑡𝑟 𝑢𝑐𝑡𝑖𝑜𝑛𝑌𝑒𝑎𝑟 = 𝑃𝑟𝑜𝑝𝑒𝑟𝑡𝑦 𝐵𝑢𝑖𝑙𝑑𝑖𝑛𝑔 𝑦𝑒𝑎𝑟𝑂𝑓𝐶𝑜𝑛𝑠𝑡𝑟𝑢𝑐𝑡𝑖𝑜𝑛
𝐸𝐼𝐴𝑐𝑐𝑜𝑚𝑜𝑑𝑎𝑡𝑖𝑜𝑛𝑈𝑛𝑖𝑡𝑠 = 𝑃𝑟𝑜𝑝𝑒𝑟𝑡𝑦 𝐵𝑢𝑖𝑙𝑑𝑖𝑛𝑔 𝑛𝑢𝑚𝑏𝑒𝑟𝑂𝑓𝐴𝑐𝑐𝑜𝑚𝑜𝑑𝑎𝑡𝑖𝑜𝑛𝑈𝑛𝑖𝑡𝑠
Complex indicators such as building height and heated volume are extracted from overall
geometry of building, while building vicinity indicator is derived from topological property
of buildings in city.
𝐶𝐼𝐵𝑢𝑖𝑙𝑑𝑖𝑛𝑔𝐻𝑒𝑖𝑔 𝑡 = 𝑓(𝐺𝑒𝑜𝑚𝑒𝑡𝑟𝑦[𝐵𝑢𝑖𝑙𝑑𝑖𝑛𝑔])
𝐶𝐼𝐻𝑒𝑎𝑡𝑒𝑑𝑉𝑜𝑙𝑢𝑚𝑒 = 𝑓(𝐺𝑒𝑜𝑚𝑒𝑡𝑟𝑦[𝐵𝑢𝑖𝑙𝑑𝑖𝑛𝑔])
𝐶𝐼𝑉𝑖𝑐𝑖𝑛𝑖𝑡𝑦 = 𝑓(𝑇𝑜𝑝𝑜𝑙𝑜𝑔𝑦[𝐵𝑢𝑖𝑙𝑑𝑖𝑛𝑔])
There are some indicators which are derived from previously defined elementary and
complex indicators such as storey height, floor area and building type. Those are defined as:
𝐶𝐼𝑆𝑡𝑜𝑟𝑒𝑦𝐻𝑒𝑖𝑔 𝑡 = 𝑓(𝐶𝐼𝐵𝑢𝑖𝑙𝑑𝑖𝑛𝑔𝐻𝑒𝑖𝑔 𝑡 , 𝐸𝐼𝑁𝑢𝑚𝑏𝑒𝑟𝑂𝑓𝑆𝑡𝑜𝑟𝑖𝑒𝑠 )
𝐶𝐼𝐴𝑠𝑠𝑖𝑔𝑛𝑎𝑏𝑙𝑒𝐴𝑟 𝑒𝑎 = 𝑓(𝐶𝐼𝑆𝑡𝑜𝑟𝑒𝑦𝐻𝑒𝑖𝑔 𝑡 , 𝐶𝐼𝐻𝑒𝑎𝑡𝑒𝑑𝑉𝑜𝑙𝑢𝑚𝑒 )
𝐶𝐼𝐵𝑢𝑖𝑙𝑑𝑖𝑛𝑔𝑇𝑦𝑝𝑒 = 𝑓(𝐸𝐼𝑈𝑠𝑎𝑔𝑒 , 𝐸𝐼𝑁𝑢𝑚𝑏𝑒𝑟𝑂𝑓𝑆𝑡𝑜𝑟𝑖𝑒𝑠 , 𝐸𝐼𝐴𝑐𝑐𝑜𝑚𝑜𝑑𝑎𝑡𝑖𝑜𝑛𝑈𝑛𝑖𝑡𝑠 , 𝐶𝐼𝑉𝑖𝑐𝑖𝑛𝑖𝑡𝑦 )
The urban heating energy consumption estimation is a function of mentioned elementary and
derived complex indicator. It can be given as:
𝐶𝐼𝐻𝑒𝑎𝑡𝑖𝑛𝑔𝐸𝑛𝑒𝑟𝑔𝑦𝐶𝑜𝑛𝑠𝑢𝑚𝑝𝑡𝑖𝑜𝑛 = 𝑓(𝐸𝐼𝐶𝑜𝑛𝑠𝑡𝑟𝑢𝑐𝑡𝑖𝑜𝑛𝑌𝑒𝑎𝑟 , 𝐶𝐼𝐴𝑠𝑠𝑖𝑔𝑛𝑎𝑏𝑙𝑒𝐴𝑟𝑒𝑎 , 𝐶𝐼𝐵𝑢𝑖𝑙𝑑𝑖𝑛𝑔𝑇𝑦𝑝𝑒 )
Apart from heating energy consumption, heating energy can be generated within buildings.
The solar-thermal energy yield value can be directly taken from attribute field of
RoofSurface semantic element of building.
𝐸𝐼𝑅𝑜𝑜𝑓𝑆𝑜𝑙𝑎𝑟𝑇 𝑒𝑟𝑚𝑎𝑙𝑌𝑖𝑒𝑙𝑑 = 𝐴𝑡𝑡𝑟𝑖𝑏𝑢𝑡𝑒 𝑅𝑜𝑜𝑓𝑆𝑢𝑟𝑓𝑎𝑐𝑒 𝑠𝑜𝑙𝑎𝑟𝑇 𝑒𝑟𝑚𝑎𝑙𝑌𝑖𝑒𝑙𝑑

3D GIS Modeling at Semantic Level using CityGML for Urban Segment
56
The remaining urban heating energy demand can be obtained by subtracting solar-thermal
energy yield from estimated heating energy consumption. The test bed proposes a heating
energy demand estimation model in terms of heating energy consumption estimation and
heating energy potential from solar energy irradiated over roof surfaces. It also provides
CityGML Energy ADE conceptual schema for heating energy consumption estimation.
6.4.2 I-SCOPE Project – Solar ADE Test Bed
Interoperable Smart City services through an Open Platform for urban Ecosystems (I-
SCOPE) Project is based on use of CityGML as Urban Information Model to provide smart
services for accurate assessment of solar energy potential at building level(Amicis R. et al.,
2012). The estimation of solar energy potential of roof is based on parameters such as
effective roof area from city model, total solar irradiation dataset stored in CityGML
textures, panel efficiency and roof orientation(Prandi et al., 2013). The single irradiation
value is assigned to roof area by overlaying corresponding areas of irradiation maps to the
roof areas(“Solar potential assessment - SmartCity Wiki,” 2013). The study provides
conceptual schema for RoofSurface Solar energy potential assessment as Solar ADE.
6.4.3 EnergyADE Proposal of the HFT Stuttgart and TU Munich
The Energy ADE proposals by HFT Stuttgart(Casper, 2014)and TU Munich(“EnergyADE
Proposal of TU Munich,” 2013) are the current developments in formulation of Energy ADE
for integration of results of different types of simulations with CityGML. The goal of HFT
Stuttgart Energy ADE is to extend CityGML data model with building energy state data for
energy refurbishment planning while Energy ADE of TU Munich deals with integration of
energy demand estimation indicators with CityGML model. The spatio-semantic information
in CityGML is important input to most of the building energy simulations and this
simulation information can also be again integrated back into the CityGML data model
through the concept of ADE. This concept of energy ADE can address the previously
mentioned interoperability gap by implementing the bidirectional workflow between design
and energy models.
The HFT Energy ADE (version 0.2, Revision 14) proposal extends AbstractBuilding and
BoundarySurface classes of CityGML to integrate the building spatial and physics
properties. It incorporates the energy simulation results such as space heating and cooling
demand, maximum heat load, etc. with AbstractBuilding class to perform building energy
diagnostics. The HFT Energy ADE XML schema definition file and example GML file
demonstrates the encoding of defined Energy ADE. The TU Munich Energy ADE provides
exhaustive indicators as input to energy demand estimation model. The overall results of
monthly and annual energy demand simulation are integrated with CityObjectGroup subclass
of AbstractCityObject CityGML class.

3D GIS Modeling at Semantic Level using CityGML for Urban Segment
57
6.5 Conceptual schema for Proposed Energy ADE
In context of present research, the geometrical properties of building semantics are used as
indicators for assessment of active and passive solar potential of building by considering
seasonal variation in incident solar radiation. The AbstractBuilding class is enriched with
attributes of seasonal active solar energy production potential, annual passive electricity
savings potential and cost of photovoltaic system, etc. The AbstractBoundarySurface class is
augmented with attributes such as effective areas exposed to radiation and amount of total
incident radiation. The values for the required attributes are obtained from simulation
performed in IES Virtual Environment software. Figure 6-3 shows conceptual schema for
proposed energy ADE. The XML schema definition file of ADE schema is generated using
Enterprise Architect.
The derived CityGML instance from proposed Energy ADE schema will contain not only
spatio-semantic content but also energy simulation indicators and results. This CityGML
ADE instance can be used as common interoperable model for both design softwares and
energy simulation systems. The geometry, semantics and application specific content in
instance document can be validated against the CityGML and ADE schema in order to test
the conformance with the CityGML standard.

3D GIS Modeling at Semantic Level using CityGML for Urban Segment
58
Figure 6-3: Proposed Energy ADE schema

3D GIS Modeling at Semantic Level using CityGML for Urban Segment
59
7 Conclusions and Recommendations
7.1 Conclusion
The presented research has attempted to model the spatio-semantic properties of 3D urban
objects using CityGML encoding standard. The topic has been researched at urban design
scale scenario in several aspects. The study has provided detailed overview of 3D urban data
reconstruction techniques and proposed acquisition framework with reference to CityGML
LoD concept. The 3D reconstructed data of building and vegetation objects has been
encoded into CityGML standard using developed transformation methodology. The derived
CityGML model in interoperable format represents the spatio-semantic properties of urban
objects. The semantic analysis based on solar radiation simulation results have been carried
out for evaluation of energy conservation strategies in urban segment. The study has
proposed the conceptual schema for implementation of CityGML Energy ADE to
demonstrate integration of energy simulation results with spatio-semantic characteristics of
building. The integrated instance document of ADE schema could be useful for interoperable
and lossless data exchange between design and energy simulation softwares.
7.1.1 Answers to research questions
1. How to abstract and represent the 3D vector data into a semantic model of
CityGML standard?
In this research, 3D vector data has been abstracted into the five discrete CityGML LoD. The
methodologies were implemented for respective LoD reconstruction. The LoD2 and LoD3
reconstruction was automated by adopting procedural modelling approach. The complex 3D
content has been generated in ESRI CityEngine software using rule based modelling. The
generated 3D vector data has been thematically layered into building semantic components
and converted into respective CityGML classes with reference to CityGML data model. A
customised converter was developed using built-in transformers in FME to encode LoD2 and
LoD3 3D vector data into CityGML format.
2. What kind of spatio-semantic analysis possible based on geometric and semantic
properties derived from CityGML model for urban energy conservation strategies?
The solar radiation simulation was performed on 3D model and results of simulation were
integrated with semantic components of derived CityGML model. The integrated 3D model
was queried to retrieve the potential urban surfaces (facades and roofs) for deployment of
photovoltaic energy systems. The effective areas exposed to radiation were evaluated for
assessment of active solar potential of buildings. It is being observed that the seasonal
variation in incident solar radiation has not only affected the number of exposed surfaces but

3D GIS Modeling at Semantic Level using CityGML for Urban Segment
60
also their effective percentage areas. The number of surfaces exposed to radiation is more in
winter than in summer because of fact that most of the buildings in study area are oriented in
east-west direction with their facades facing north-south. As sun zenith angle is more in
winter, facades receiving the radiation for longer duration are more and hence larger
effective area is under radiation.
3. How to formulate the conceptual schema for integration of application specific
information with CityGML model to allow interoperable and lossless exchange?
The conceptual schema was formulated based on solar active and passive potential indicators
of buildings. The input indicators and energy simulation results were integrated with
CityGML data model using ADE mechanism. The optimal alternative was chosen from
literature for extending CityGML with application specific properties. The proposed
CityGML Energy ADE was modelled in UML using Enterprise Architect. The XML schema
definition file of proposed ADE was generated from UML. The instance document of ADE
schema could be used as interoperable format for information exchange between design and
energy simulation systems.
7.2 Recommendations
Based on the study presented in current research, the following points can be considered for
future work:
The process of computing building dimensions from field data can be automated by
using hybrid approach. The hybrid approach will be based on processing of LiDAR
point clouds from Spaceborne and Terrestrial laser scanning for automatic derivation
of building height, facade and fenestration dimensions.
The other city objects such as traffic lights, city furniture, etc. accounting sufficient
energy consumption can be modelled in CityGML for assessment of their energy
demand and production potential.
The energy simulation can be performed with more complex urban environment
accounting effect of obstructions such as neighbourhood buildings and vegetation on
urban surfaces.
The anisotropic diffuse model can be considered for calculation of diffuse radiation
on surfaces to improve the accuracy simulation results.
The robust statistical analysis could be provided for assessment of active and passive
solar potential of buildings.
A prototype can be developed to validate both semantics and geometry of data with
CityGML standard.
The extensive RDBMS support for polyhedral data type could be provided to
facilitate the geometric computation of surface area, perimeter and volume of
polyhedral object.

3D GIS Modeling at Semantic Level using CityGML for Urban Segment
61
The working database schemas can be designed and implemented for CityGML
ADE UML model.
The present research could be complemented with integration of sky illuminance
model to predict internal illumination through fenestrations for assessment of
passive solar potential of building structure at urban design scale.
7.3 Practical Application of Study
The spatially distributed urban energy demand and supply modelling requires the integration
of urban and energy planning. It involves government organizations, stakeholders, power
industries and consumers to interact with each other for decision making and energy
planning. The presented study can be used in formulation of integrated planning and robust
decision support system for urban energy infrastructure with modifications in areas of
modeling, simulation systems, and software platforms.

3D GIS Modeling at Semantic Level using CityGML for Urban Segment
62
References
Albert, J., Bachmann, M., Hellmeier, A., 2003. Zielgruppen und Anwendungen für Digitale
Stadtmodelle und Digitale Geländemodelle.
Amicis R., Conti G., Patti D., Ford M., Elisei P., 2012. I-Scope–Interoperable Smart City
Services through an Open Platform for Urban Ecosystems.
Arefi, H., Engels, J., Hahn, M., 2008. Levels of Detail in 3D Building Reconstruction from
LiDAR data.
Bahu, J.M., Koch, A., Kremers, E., Murshed, S.M., 2013. Towards a 3D Spatial Urban
Energy Modelling Approach, in: ISPRS Annals of the Photogrammetry, Remote
Sensing and Spatial Information Sciences. Presented at the ISPRS 8th 3DGeoInfo
Conference, Istanbul, Turkey This contribution.
Baker, N., Hoch, D., Steemers, K., 2000. Lighting and Thermal Method.
Bartels, M., Wei, H., Mason, D.C., 2006. DTM generation from LIDAR data using skewness
balancing, in: Pattern Recognition, 2006. ICPR 2006. 18th International Conference
On. pp. 566–569.
Benner, J., Geiger, A., Gröger, G., Hafele, K., Lowner, M., 2013. Enhanced LOD Concepts
for Virtual 3D City Models, in: ISPRS Annals of the Photogrammetry, Remote
Sensing and Spatial Information Sciences. Presented at the ISPRS 8th 3DGeoInfo
Conference, Istanbul, Turkey.
Benrod, F., Bock, J., 1934. A time analysis of sunshine. Trans. Am. Illum. Eng. Soc. 34,
200–218.
Biljecki F., Zhao J., Sototer J., Ledoux H., 2013. Revisiting the Concept of Level of Detail in
3D City Modelling, in: ISPRS Annals of the Photogrammetry, Remote Sensing and
Spatial Information Sciences. Presented at the ISPRS 8th 3DGeoInfo Conference,
Istanbul, Turkey.
Biljecki, I.F., 2013. The concept of level of detail in 3D city models (PhD Research Proposal
No. GISt Report No. 62).
Breunig, M., Zlatanova, S., 2011. 3D geo-database research: Retrospective and future
directions. Comput. Geosci. 37, 791–803. doi:10.1016/j.cageo.2010.04.016
Brugman, B., 2010. 3D topological structure management within a DBMS. Delft University
of Technology Institutional Repository.
Brunetaud, X., Stefani, C., Badosa, S.J., Beck, K., Al-Mukhtar, M., 2012. Comparison
between photomodelling and laser scanning to create a 3D model for a digital health
record. Eur. J. Environ. Civ. Eng. 16, s48–s63. doi:10.1080/19648189.2012.681957
buildingSMART, 2007. Industry Foundation Classes IFC2x3 TC1 Release.
Carrión, D., Lorenz, A., Kolbe, T.H., 2010. Estimation of the energetic rehabilitation state of
buildings for the city of Berlin using a 3D city model represented in CityGML. Int.
Arch. Photogramm. Remote Sens. Spat. Inf. Sci. 38, 31–35.
Casper, E., 2014. EnergyADE Proposal of HfT Stuttgart [WWW Document].
2014_S_HfT_EnergyADE.URL
http://en.wiki.modeling.sig3d.org/index.php?title=2014_S_HfT_EnergyADE&oldid
=494 (accessed 6.14.14).
Coulson, K.L., 1975. Solar and Terrestrial Radiation. Academic press, New York.
DeWitt, B.A., Wolf, P.R., 2000. Elements of Photogrammetry(with Applications in GIS),
3rd ed. McGraw-Hill Higher Education.
3D GIS Modeling at Semantic Level using CityGML for Urban Segment
63
Duffie, J., Beckman, W., 1980. Solar Engineering of Thermal Processes, Second. ed. John
Wiley & Sons, Inc.
Eicker, U., Nouvel, R., Schulte, C., Schumacher, J., Coors, V., 2012. 3D-STADTMODELLE
FÜR DIE WÄRMEBEDARFBERECHNUNG, in: BauSIM. Presented at the Fourth
German-Austrian IBPSA Conference.
El-Mekawy, M., Östman, A., Hijazi, I., 2012. A Unified Building Model for 3D Urban GIS.
Isprs Int. J. Geo-Inf. 1, 120–145. doi:10.3390/ijgi1020120
EnergyADE Proposal of TU Munich [WWW Document], 2013. URL
http://en.wiki.modeling.sig3d.org/images/upload/20140519_EnergyADE_TUM.pdf
(accessed 6.14.14).
Goetz, M., 2013. Towards generating highly detailed 3D CityGML models from
OpenStreetMap. International Journal of Geographic Information Science. 27, 845–
865. doi:10.1080/13658816.2012.721552
Goetz, M., Zipf, A., 2012. Towards Defining a Framework for the Automatic Derivation of
3D CityGML Models from Volunteered Geographic Information. Int. J. 3- Inf.
Model. Volume 1, 1–16.
Gröger, G., Plümer, L., 2012. CityGML – Interoperable semantic 3D city models. Isprs J.
Photogramm. Remote Sens. 71, 12–33. doi:10.1016/j.isprsjprs.2012.04.004
Isikdag, U., Zlatanova, S., 2009. Towards defining a framework for automatic generation of
buildings in CityGML using building Information Models, in: 3D Geo-information
Sciences. Springer, pp. 79–96.
Kaden, R., Kolbe, T.H., 2013. City-Wide Total Energy Demand Estimation of Buildings
using Semantic 3D City Models and Statistical Data, in: ISPRS Annals. Presented at
the ISPRS 8th 3DGeoInfo Conference, Istanbul, Turkey, pp. 163–171.
Kalantaitė, A., Parseliūnas, E.K., Romanovas, D., Slikas, D., 2012. Generating the open
space 3D model based on LiDAR data. Geod. Cartogr. 38, 152–156.
Kolbe, T.H., 2009. Representing and exchanging 3D city models with CityGML, in: 3D
Geo-information Sciences. Springer, pp. 15–31.
Kolbe, T.H., Gerhard Gröger, Claus Nagel, Karl-Heinz Häfele (Eds.), 2012. OGC City
Geography Markup Language (CityGML) En-coding Standard.
Krüger A., Kolbe T.H., 2012. Building Analysis For Urban Energy Planning Using Key
Indicators On Virtual 3D City Models - The Energy Atlas Of Berlin, in:
International Archives of the Photogrammetry, Remote Sensing and Spatial
Information Sciences. Presented at the XXII ISPRS Congress, Melbourne, Australia.
Lee, J., Zlatanova, S., 2009. Solar radiation over the urban texture: LIDAR data and image
processing techniques for environmental analysis at city scale, in: 3D Geo-
Information Sciences. Springer, pp. 319–340.
Liu, B.Y.H., Jordan, R.C., 1963. The Long-Term Average Performance of Flat-Plate Solar-
Energy Collectors. Solar Energy 7, 53–74.
Luebke, D., Reddy, M., Cohen, J.D., Varshney, A., Watson, B., Huebner, R., 2003. Level of
detail for 3D graphics, morgan kaufmann publishers ed. ed. Morgan Kaufmann Pub.
Nguyen, T.T., Nguyen, Q.M., Liu, X.G., Ziggah, Y.Y., 2012. 3D Object Model
Reconstruction based on LASER Scanning Point Cloud Data. Int. Symp.
Geoinformatics Spat. Infrastruct. Dev. Earth Allied Sci.
Oda, K., Takano, T., Doihara, T., Shibasaki, R., Automatic Building Extraction and 3-D City
Modeling from LIDAR data based on Hough Transformation.
Perez, Richard, R., Stewart, R., Guertin, T., 1988. The development and verification of the
Perez diffuse radiation model. (No. No. SAND-88-7030). Atmospheric Sciences

3D GIS Modeling at Semantic Level using CityGML for Urban Segment
64
Research Center,Sandia National Labs., Albuquerque, NM (USA);State Univ. of
New York, Albany (USA).
Prandi, F., De Amicis, R., Piffer, S., Soavea, M., Cadzowb, S., Boix, E.G., D‟Hondt, E.,
2013. Using CityGML To Deploy Smart-City Services For Urban Eco-Systems.
Ratti, C., Baker, N., Steemers, K., 2005. Energy consumption and urban texture. Energy
Build. 37, 762–776. doi:10.1016/j.enbuild.2004.10.010
RHYNE, T.-M., 1999. A commentary on GeoVRML: a tool for 3D representation of
georeferenced data on web. Int. J. Geogr. Inf. Sci. 439–443.
Richardson, D.E., 2002. 3D GIS, where are we standing?, in: Advances in Spatial Data
Handling. Springer, Berlin.
Rolf A. de, Knippers, R., Sun, Y., Ellis, M., Kraak, M.-J., Weir, M., Georgiadou, Y.,
Radwan, M., Westen, C., Kainz, W., Sides, E., 2001. Principles of geographic
information systems: an introductory textbook. International Institute for Aerospace
Survey and Earth Sciences, Enschede, The Netherlands.
Sarak, H., Satman, A., 2003. The degree-day method to estimate the residential heating
natural gas consumption in Turkey: a case study. Energy Volume 28, 929–939.
Sirmacek, B., Taubenboeck, H., Reinartz, P., 2012. A Novel 3D City Modeling approach for
satellite stereo data using 3D active shape models on DSMS, in: International
Archives of the Photogrammetry, Remote Sensing and Spatial Information Sciences,
XXII ISPRS Congress. Melbourne, Australia, pp. 325–330.
Solar potential assessment - SmartCity Wiki [WWW Document], 2013. URL
http://smartcity.gistandards.eu/index.php/Solar_potential_assessment (accessed
11.30.13).
Stadler, A., Kolbe, T.H., 2007. Spatio-semantic coherence in the integration of 3D city
models, in: Proceedings of the 5th International Symposium on Spatial Data Quality,
Enschede.
Strzalka, A., Eicker, U., Coors, V., Schumacher, J., 2010. Modeling Energy Demand for
Heating at City Scale, in: SimBuild–Fourth National Conference. New York:
IBPSA-USA. pp. 358–364.
Tang, T., Zhao, W., Gong, H., Zhang, A., Pan, J., Liu, Z., 2008. Terrestrial laser scan survey
and 3D TIN model construction of urban buildings in a geospatial database.
Geocarto Int. 23, 259–272. doi:10.1080/10106040801915917
Tereci, A., Schneider, D., Kesten, D., Strzalka, A., Eicker, U., 2009. Energy Saving Potential
and Economical Analysis of Solar Systems in Urban Quarter Scharnhaauser Park.
Presented at the ISES Solar World Congress 2009 : Renewable energyShaping our
Future.
Van den Brink, L., Stoter, J., Zlatanova, S., 2013. UML-Based Approach to Developing a
CityGML Application Domain Extension. Trans. Gis 17, 920–942.
doi:10.1111/tgis.12026
Wate, P., Saran, S., Srivastav, S.K., Murthy, Y.V.N.K., 2013. Formulation of Hierarchical
Framework for 3D-GIS Data Acquisition Techniques in context of Level-of-Detail
(LoD), in: 2013 IEEE Second International Conference on Image Information
Processing (ICIIP-2013). IEEE, Shimla, India, pp. 154–159.
doi:10.1109/ICIIP.2013.6707573
Zhang, Y., Zhu, Q., Liu, G., Zheng, W., Li, Z., Du, Z., 2011. GeoScope: Full 3D geospatial
information system case study. Geo-Spat. Inf. Sci. 14, 150–156.
doi:10.1007/s11806-011-0478-z

3D GIS Modeling at Semantic Level using CityGML for Urban Segment
65
Zlatanova, S., 2000. 3D GIS for urban development. International Institute for Aerospace
Survey and Earth Sciences ; Institute for Computer Graphics and Vision, Graz
University of Technology, Enschede, Netherlands; Graz, Australia.
Zlatanova, S., Rahman, A., Pilouk, M., 2002. 3D GIS: current status and perspectives. Int.
Arch. Photogramm. Remote Sens. Spat. Inf. Sci. 34, 66–71.
Zlatanova, S., Rahman, A.A., Shi, W., 2004. Topological models and frameworks for 3D
spatial objects. Comput. Geosci. 30, 419–428. doi:10.1016/j.cageo.2003.06.004
Zlatanova, S., Stoter, J., Isikdag, U., 2012. Standards for exchange and storage of 3D
information: Challenges and opportunities for emergency response, in: Proceedings
of the Fourth International Conference on Cartography and GIS, Albena, Bulgaria.
pp. 17–28.

3D GIS Modeling at Semantic Level using CityGML for Urban Segment
66
APPENDIX 1
Figure A1-1: LoD3 schema of Gymnasium Building Rule File


![Semantic GIS - start [CourseWare Wiki]](https://img.pdfslide.us/doc/110x75/6289aa599510f312885e9f4a/semantic-gis-start-courseware-wiki.jpg)