Embed Size (px)
Citation preview

3. Water Quality Monitoring
This chapter provides information about water quality monitoring—the first step in the process of generating timely information about water quality and making it available to the public. Each section’s contents are as follows:
■ Section 3.1 provides a broad overview of water quality monitoring. The chapter then focuses on the remote real-time water quality monitoring conducted as part of the River Index Project.
■ Section 3.2 discusses factors to consider when designing a remote real-time water quality monitoring project.
■ Sections 3.3 and 3.4 explain how to select remote real-time monitoring frequencies and parameters, respectively.
■ Sections 3.5 and 3.6 discuss selecting monitoring equipment and the location of your remote real-time water quality monitoring stations, respectively.
■ Sections 3.7, 3.8, and 3.9 explain how to install, calibrate, and maintain the remote real-time water quality monitoring equipment used in the River Index Project.
Readers primarily interested in an overview of water quality monitoring might want to focus on the introductory information in Sections 3.1 and 3.2. If you are responsible for the actual design and implementation of a monitoring project, you also should review Sections 3.3 through 3.9. They provide an introduction to the specific steps involved in developing and operating a remote real-time water quality monitoring project and information on where to find additional guidance.
3.1 Water Quality Monitoring: An Overview
Water quality monitoring provides information about the condition of streams, lakes, ponds, estuaries, and coastal waters. The information reveals whether these waters are safe for swimming, fishing, or as a source for drinking water. The Web site of EPA’s Office of Water (www.epa.gov/owow/monitoring) provides essential background information on water quality monitoring. Another good source of information on water quality monitoring is the Web site for the River Index Project (www.riverindex.org). Information presented in the following paragraphs is summarized from these Web sites.
The following parameters often are measured to evaluate the quality of surface waters:
1. Chemicals. These include both inorganic and organic chemicals. Inorganic chemicals include metals such as iron, calcium, and magnesium, and nutrients such as nitrogen and phosphorus. Organic chemicals include a wide range of carbon-containing compounds. Some organic chemicals originate from natural sources, while others, such as pesticides and solvents, are synthetic.
W a t e r Q u a l i t y M o n i t o r i n g 9
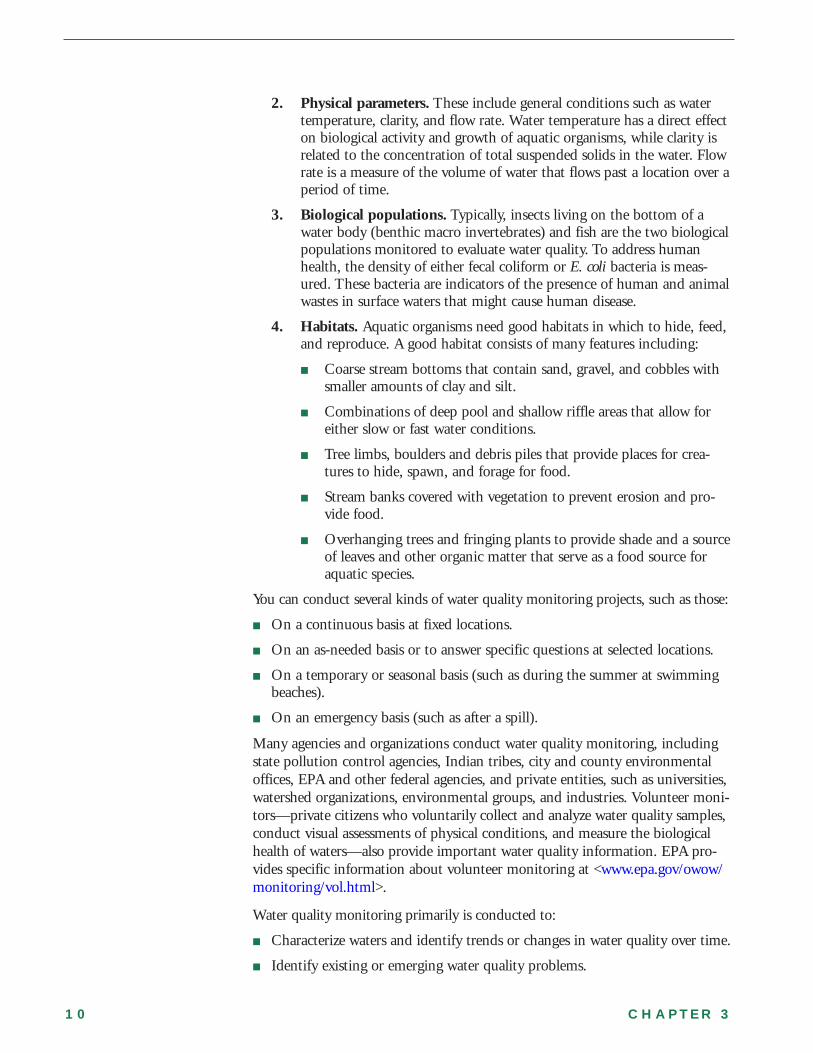
2. Physical parameters. These include general conditions such as water temperature, clarity, and flow rate. Water temperature has a direct effect on biological activity and growth of aquatic organisms, while clarity is related to the concentration of total suspended solids in the water. Flow rate is a measure of the volume of water that flows past a location over a period of time.
3. Biological populations. Typically, insects living on the bottom of a water body (benthic macro invertebrates) and fish are the two biological populations monitored to evaluate water quality. To address human health, the density of either fecal coliform or E. coli bacteria is measured. These bacteria are indicators of the presence of human and animal wastes in surface waters that might cause human disease.
4. Habitats. Aquatic organisms need good habitats in which to hide, feed, and reproduce. A good habitat consists of many features including:
■
■
■
■
■
Coarse stream bottoms that contain sand, gravel, and cobbles with smaller amounts of clay and silt.
Combinations of deep pool and shallow riffle areas that allow for either slow or fast water conditions.
Tree limbs, boulders and debris piles that provide places for creatures to hide, spawn, and forage for food.
Stream banks covered with vegetation to prevent erosion and pro-vide food.
Overhanging trees and fringing plants to provide shade and a source of leaves and other organic matter that serve as a food source for aquatic species.
You can conduct several kinds of water quality monitoring projects, such as those:
■ On a continuous basis at fixed locations.
■ On an as-needed basis or to answer specific questions at selected locations.
■ On a temporary or seasonal basis (such as during the summer at swimming beaches).
■ On an emergency basis (such as after a spill).
Many agencies and organizations conduct water quality monitoring, including state pollution control agencies, Indian tribes, city and county environmental offices, EPA and other federal agencies, and private entities, such as universities, watershed organizations, environmental groups, and industries. Volunteer monitors—private citizens who voluntarily collect and analyze water quality samples, conduct visual assessments of physical conditions, and measure the biological health of waters—also provide important water quality information. EPA provides specific information about volunteer monitoring at <www.epa.gov/owow/ monitoring/vol.html>.
Water quality monitoring primarily is conducted to:
■ Characterize waters and identify trends or changes in water quality over time.
■ Identify existing or emerging water quality problems.
1 0 C H A P T E R 3
■ Gather information for the design of pollution prevention or restoration projects.
■ Determine if the goals of specific programs (such as the implementation of pollution prevention strategies) are being met.
■ Respond to emergencies such as spills or floods.
EPA helps administer grants for water quality monitoring projects and provides technical guidance on how to monitor and report monitoring results. You can find a number of EPA’s water quality monitoring technical guidance documents on the Internet at <www.epa.gov/owow/monitoring/techmon.html>. EPA’s “Surf Your Watershed” Web site (www.epa.gov/surf3) also contains information on water quality monitoring.
In some cases, special types of water quality data (e.g., real-time data) or special water quality monitoring methods (e.g., remote monitoring) are needed to meet a water quality monitoring program's objectives. Real-time environmental data are data collected and communicated to the public in a time frame that makes them useful for making day-to-day decisions about public health and the environment. They may be displayed immediately after the data are collected or after a time delay depending on the equipment used to process the data. Monitoring is considered “remote” when the operator collects and analyzes data from a location different from the monitoring site itself.
Remote Real-Time Water Quality Monitoring: The River Index Project The River Index Project Team uses state-of-the-art automated monitoring equipment to collect daily data for flow and key water quality parameters, while data for other water quality parameters such as E. coli bacteria are collected manually. Remote monitoring is conducted at six locations—the Englewood Dam station on the Stillwater River, the Huffman Dam station on the Mad River, the Wolf Creek station in west Dayton, the Taylorsville Dam Station on the Great Miami River, and the Miamisburg Station on the Great Miami River (see Figure 3).
W a t e r Q u a l i t y M o n i t o r i n g 1 1

Miamisburg
Wolf Creek
Downtown Dayton
Huffman Dam
Englewood Dam
Taylorsville DamTaylorsville Dam
Englewood Dam
Wolf Creek
Miamisburg
Downtown Dayton
Huffman Dam
Figure 3. Location of Water Quality Monitoring Stations for the River Index Project
Existing MCD and USGS gauge houses are used to house the monitoring instrumentation at the Englewood Dam, Miamisburg, Huffman Dam, and Taylorsville Dam sites. A phone line and an electric line were installed at the Englewood Dam, Miamisburg, and Huffman Dam sites. A cell phone powered by a solar panel is used at the Taylorsville Dam site. In addition, river intake pipes were installed at each site, and tanks, pumps, and monitoring sondes were installed in each of the existing gauge houses at the Englewood Dam, Miamisburg, and Huffman Dam monitoring stations. Because there is no electrical service at the Taylorsville Dam station, the monitoring sonde was placed directly into the river intake pipe, and batteries are used to power the sonde.
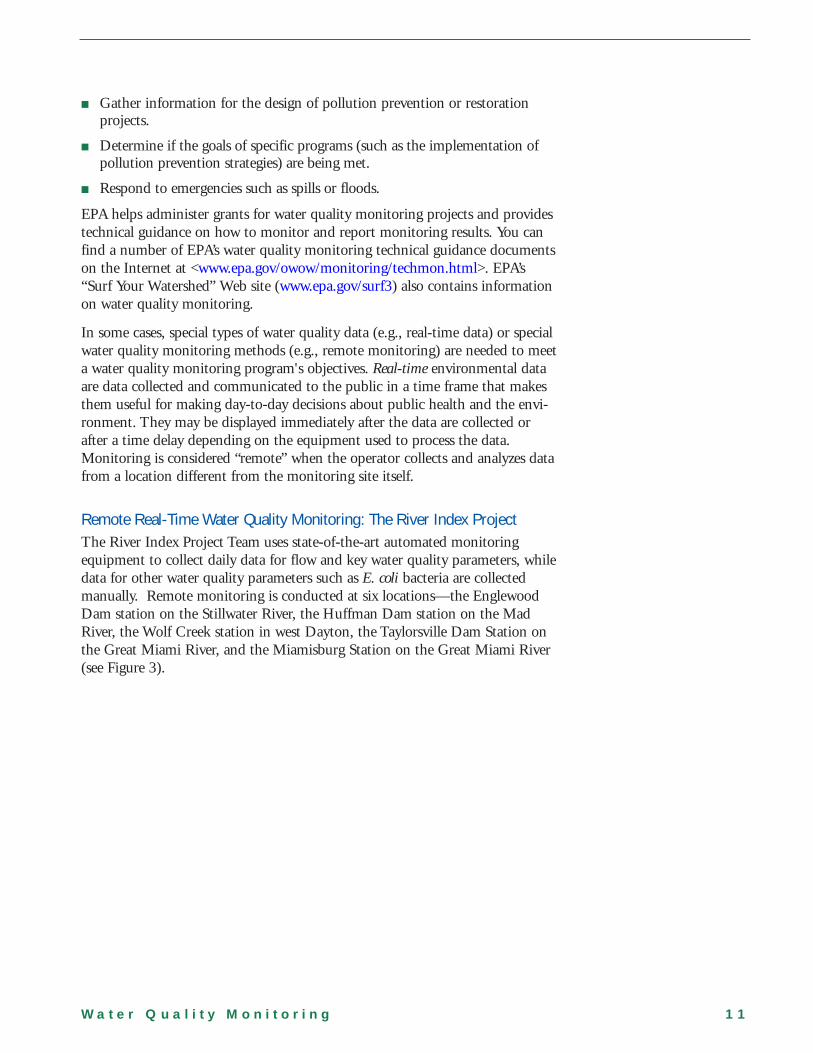
At the Downtown Dayton site, a monitoring station was established in a City of Dayton storm sewer pump station. For the Wolf Creek monitoring station, MCD relocated an out-of-use concrete gauge house from a site south of Dayton and modified it so that it could be used in the River Index Project (see Figure 4).
1 2 C H A P T E R 3
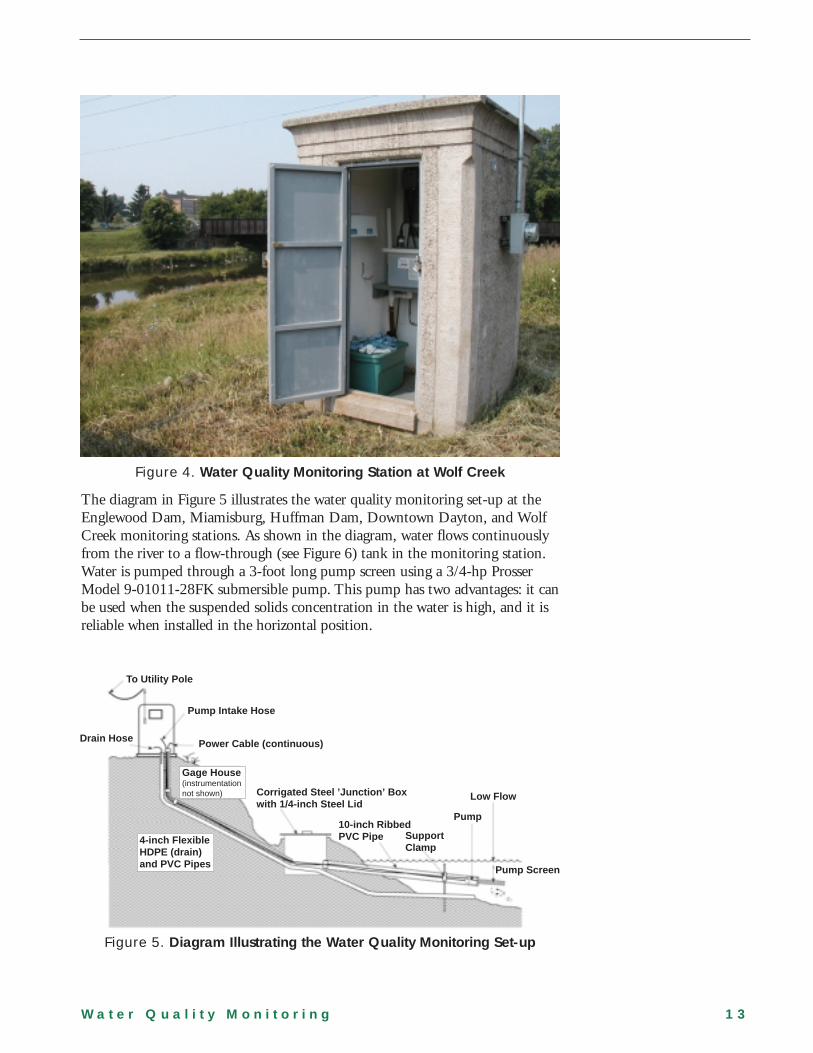
Figure 4. Water Quality Monitoring Station at Wolf Creek
The diagram in Figure 5 illustrates the water quality monitoring set-up at the Englewood Dam, Miamisburg, Huffman Dam, Downtown Dayton, and Wolf Creek monitoring stations. As shown in the diagram, water flows continuously from the river to a flow-through (see Figure 6) tank in the monitoring station. Water is pumped through a 3-foot long pump screen using a 3/4-hp Prosser Model 9-01011-28FK submersible pump. This pump has two advantages: it can be used when the suspended solids concentration in the water is high, and it is reliable when installed in the horizontal position.
To Utility Pole
Pump Intake Hose
Drain Hose Power Cable (continuous)
Gage House (instrumentationnot shown) Corrigated Steel ’Junction’ Box Low Flow
with 1/4-inch Steel Lid Pump
10-inch Ribbed
4-inch Flexible PVC Pipe Support
HDPE (drain) Clamp
and PVC Pipes Pump Screen
Figure 5. Diagram Illustrating the Water Quality Monitoring Set-up
W a t e r Q u a l i t y M o n i t o r i n g 1 3

To ensure that the water quality monitoring probes are completely submerged, water fills the flow-through tank to a depth of 10 inches. The water drains by gravity through an overflow pipe and is discharged back to the river several feet downstream of the pump intake. If operated during winter, heaters can be placed in the monitoring stations to keep the equipment warm.
The set-up illustrated in Figure 5 offers the following advantages:
■ It reduces the probability of vandalism because monitoring equipment is kept in a secure building.
■ It reduces the probability of losing equipment during high flow events.
■ It facilitates field calibration of equipment during bad weather conditions.
Figure 6. Flow-through Tank at the Wolf Creek Monitoring Station
Data for several parameters were collected at each monitoring station and used to calculate river indexes during the first monitoring season in 2000. The parameters included:
■ Ammonia-Nitrogen ■ Polycyclic hydrocarbons■ Atrazine ■ pH■ Chlorpyrifos ■ Specific Conductance■ Dissolved Oxygen ■ Turbidity■ E. coli Bacteria ■ Water Temperature■ Fish Toxicity ■ Fish and Benthic Communities■ Flow (River Discharge) ■ Habitat■ Nitrate - Nitrogen
1 4 C H A P T E R 3
Real-time data for ammonia-nitrogen, dissolved oxygen, flow rate, nitrate-nitrogen, pH, specific conductance, turbidity, and water temperature were collected hourly, and retrieved automatically three times per day. The data were then uploaded automatically to a central database. In addition, concentration data for pesticides (i.e., atrazine and chlorpyrifos), E. coli bacteria, and polycylic aromatic hydrocarbons (PAH) were collected weekly, and fish toxicity data were collected monthly; those data also were entered into the central database. Data for all of these parameters were used to calculate the river indexes for each monitoring station. Fish and benthic communities and habitat data also were collected seasonally, but were not used to calculate the indexes.
During and following the first monitoring season, the monitoring parameters were evaluated with respect to importance in characterizing overall water quality and cost-effectiveness. Based on the results of those evaluations, the number of monitoring parameters was reduced during the second and third monitoring seasons.
Parameters that were deleted include: ammonia-nitrogen, atrazine, chlorpyrifos, fish toxicity, nitrate-nitrogen, PAH, fish and benthic communities, and habitat. Data for these parameters were not cost-effective with respect to providing sustainable and timely information to characterize water quality and river conditions. Parameters for which data currently are collected in the River Index Project include:
■ Dissolved Oxygen
■ E. coli Bacteria
■ Flow (River Discharge)
■ pH
■ Specific Conductance
■ Turbidity
■ Water Temperature
3.2 Designing a Real-Time Water Quality Monitoring Project
The first step in developing any water quality monitoring project is to define your objectives. Keep in mind that remote monitoring might not be the best method for your organization or community. For example, you would not likely require a remote real-time monitoring capability when conducting monthly monitoring to comply with a state or federal regulation.
Here are some questions to help determine if remote monitoring is appropriate for your monitoring objectives:
■ What types of questions about water quality do you want to answer? Do you need real-time data to answer these questions? For example, do you want to know more about how rapid events, such as urban or agricultural runoff from storms, might affect water quality in your area by stimulating algal blooms?
W a t e r Q u a l i t y M o n i t o r i n g 1 5

■ If you already have other water quality monitoring projects in place, how does the addition of real-time data enhance them? For example, does the frequent review of real-time data allow you to tailor your other monitoring projects to yield more representative water quality data or conserve your organization's labor and analytical resources?
■ How does your community or organization benefit from a real-time monitoring project? For example, do real-time data provide you with a better opportunity to communicate water quality issues to your community?
Making the Most of Your Real-Time Water Quality Data
Currently, your organization will find a limited number of cost-effective real-time monitoring technologies available. Also keep in mind that real-time data might not be as accurate, precise, or consistent as “conventional” laboratory data. You should carefully consider how your project uses real-time data and make the most of data for the real-time monitoring parameters you select.
In designing your program, think about how you could use real-time measurements of certain parameters as indicators of the phenomena you wish to document. For example, depending on your water body's characteristics and the location of your monitoring equipment, you could use turbidity and dissolved oxygen measurements as indicators of an algae bloom. Then you could learn more about the bloom by conducting manual monitoring of parameters that might not currently be avail-able to you on a cost-effective, real-time basis (e.g., atrazine and chlorpyrifos). Another example might involve using real-time measurements of turbidity and conductivity to estimate the impact of a storm event on the concentration of particulate matter (as indicated by turbidity) and dissolved solids (as indicated by conductivity) in a stream or river.
Designing the River Index Project The River Index Project Team's decision to collect near real-time water quality data grew out of an interest to make the public better informed about water quality in the Lower Great Miami River Watershed. The objectives of the River Index Project are presented in the box on page 17.
After you define the objectives of a water quality monitoring project, the frequency of monitoring, parameters for which data are collected, and the equipment used to monitor water quality have to be selected. The sites where monitoring occurs also have to be selected.
1 6 C H A P T E R 3
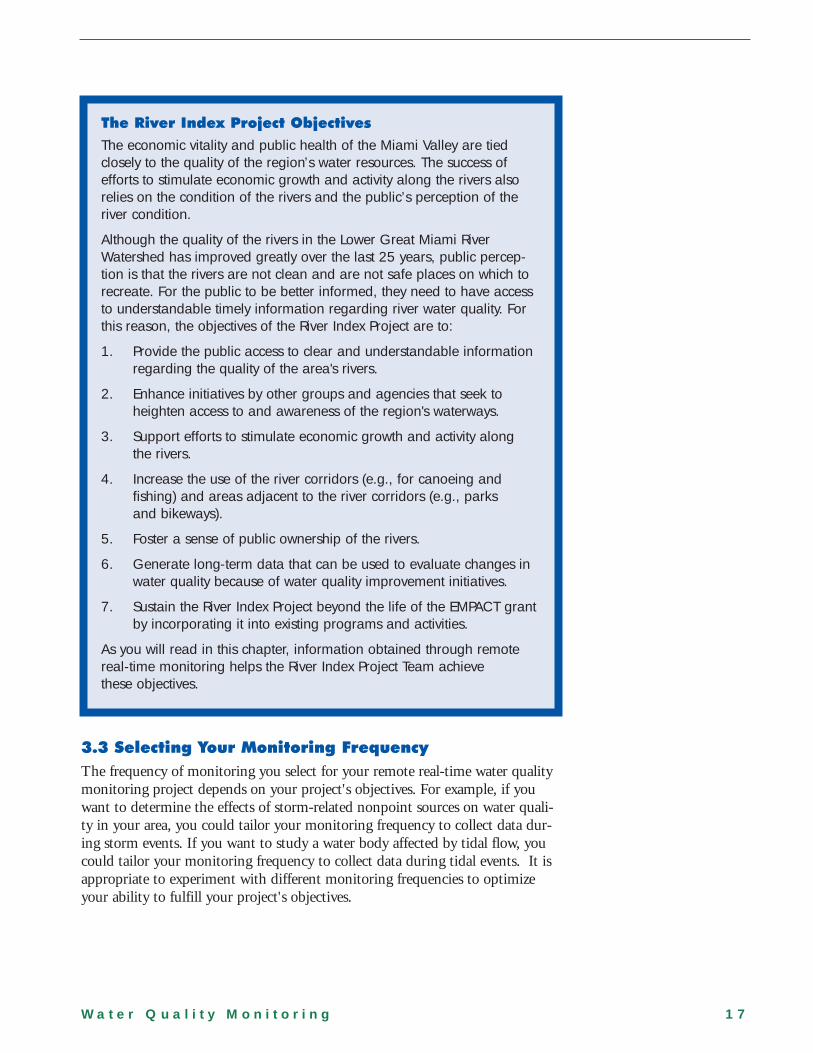
The River Index Project Objectives
The economic vitality and public health of the Miami Valley are tied closely to the quality of the region’s water resources. The success of efforts to stimulate economic growth and activity along the rivers also relies on the condition of the rivers and the public’s perception of the river condition.
Although the quality of the rivers in the Lower Great Miami River Watershed has improved greatly over the last 25 years, public perception is that the rivers are not clean and are not safe places on which to recreate. For the public to be better informed, they need to have access to understandable timely information regarding river water quality. For this reason, the objectives of the River Index Project are to:
1. Provide the public access to clear and understandable information regarding the quality of the area's rivers.
2. Enhance initiatives by other groups and agencies that seek to heighten access to and awareness of the region's waterways.
3. Support efforts to stimulate economic growth and activity along the rivers.
4. Increase the use of the river corridors (e.g., for canoeing and fishing) and areas adjacent to the river corridors (e.g., parks and bikeways).
5. Foster a sense of public ownership of the rivers.
6. Generate long-term data that can be used to evaluate changes in water quality because of water quality improvement initiatives.
7. Sustain the River Index Project beyond the life of the EMPACT grant by incorporating it into existing programs and activities.
As you will read in this chapter, information obtained through remote real-time monitoring helps the River Index Project Team achieve these objectives.
3.3 Selecting Your Monitoring Frequency
The frequency of monitoring you select for your remote real-time water quality monitoring project depends on your project's objectives. For example, if you want to determine the effects of storm-related nonpoint sources on water quality in your area, you could tailor your monitoring frequency to collect data during storm events. If you want to study a water body affected by tidal flow, you could tailor your monitoring frequency to collect data during tidal events. It is appropriate to experiment with different monitoring frequencies to optimize your ability to fulfill your project's objectives.
W a t e r Q u a l i t y M o n i t o r i n g 1 7
River Index Project Monitoring Frequency Data for several of the water quality parameters monitored in the River Index Project are collected hourly and are retrieved three times per day. This monitoring frequency allows the river index for each monitoring station to be updated every eight hours. To insure the quality of the data collected, the data's accuracy and precision have to be certified. See the discussion on Data Quality Assurance and Quality Control (QA/QC) in the box below.
Data Quality Assurance and Quality Control (QA/QC)
QA/QC procedures ensure that collected data are accurate, precise, and consistent. QA/QC involves following established rules in the field and in the laboratory to ensure that samples are representative of the water you are monitoring, free from contamination as a result of the sampling activity, and analyzed using standard procedures.
Two types of water quality data were collected in the River Index Project:
1. Real-time data collected using YSI, Inc. water quality sensors.
2. Data obtained from the collection and analyses of weekly and monthly water samples by trained staff. In addition, fish and benthic community samples and habitat samples were collected and analyzed seasonally.
To ensure the QA/QC of data collected using YSI sensors, the River Index Project Team follows the manufacturer's instructions for sensor calibration and maintenance (See Sections 3.8 and 3.9 for more information on the calibration and maintenance procedures). To ensure QA/QC of the other data collected, the River Index Project Team follows guide-lines set forth by EPA and the American Public Health Association.
The team also has several years of experience identifying systematic errors associated with sensor deterioration, or biofouling, that occurs when algae, bacteria, and fungi grow on the sensor when it is sub-merged continually in water.
EPA’s publication The Volunteer Monitor's Guide to Quality Assurance Project Plans provides more information on QA/QC plans for monitoring projects. For information on this guide, visit <www.epa.gov/ volunteer/qappexec.htm>.
3.4 Selecting Water Quality Parameters for Monitoring
Your selection of real-time water quality monitoring parameters depends on your project’s objectives and on the remote real-time technologies available to you. To satisfy the objectives of the River Index Project, the project team chose to monitor parameters important to aquatic life. In selecting those parameters, the project team considered information such as EPA’s water quality criteria, Ohio Environmental Protection Agency water quality and biocriteria standards, existing water quality in the Lower Great Miami River Watershed, the cost-
1 8 C H A P T E R 3
effectiveness of data for each parameter, and the expense and availability of the monitoring equipment.
Six parameters were chosen to be monitored on a real-time basis: dissolved oxygen, flow rate, pH, conductivity, turbidity, and water temperature (ammonia-nitrogen and nitrate-nitrogen also were monitored at the Taylorsville and Miamisburg stations during the first year of the project). A brief description of these parameters is presented in the box below.
River Index Project Real-Time Water Quality Parameters
Dissolved Oxygen. The concentration of dissolved oxygen (DO) in water affects the number and type of aquatic organisms that live in the water. Dissolved oxygen must be present at a concentration high enough to sustain these organisms. It is important to measure DO frequently. For example, some streams impacted by wastewater discharges have a fluctuating DO. An average DO of eight is not acceptable if there are episodes where the DO is zero, even for short periods.
Flow Rate. The volume of water that flows past a monitoring station over a period of time (e.g., cubic feet per second). River stage data were collected during the River Index Project and then converted to flow rate data.
pH. pH is a measure of the acidity of the water. A pH of seven is neutral. Values lower than seven are acidic and higher than seven are basic. Many important chemical and biological reactions are strongly affected by pH. In turn, chemical reactions and biological processes (e.g., photosynthesis and respiration) affect pH. Low pH values increase the concentration of some dissolved metals in the water, increasing the toxicity of these metals.
Conductivity. Conductivity is an estimator of the amount of total dissolved salts or total dissolved ions in water. Many factors influence the conductivity of water, including the watershed's geology, wastewater from point sources, runoff from nonpoint sources, atmospheric inputs, evaporation rates, and some types of bacterial metabolism. Conductivity also is a function of temperature; therefore, the data have to be standardized to 25° C. Conductivity corrected to 25° C is specific conductance.
Turbidity. Turbidity describes the clarity of water. Turbidity increases as the concentration of total suspended solids in the water increases.
Water Temperature. Water temperature has a direct effect on biological activity and the growth of aquatic organisms because most aquatic organisms are “cold-blooded” (i.e., they cannot regulate their core body temperature). Temperature also affects biological activity by influencing water chemistry. For example, because warm water holds less oxygen than does cold water, warm water might not contain enough oxygen to support some types of aquatic life.
W a t e r Q u a l i t y M o n i t o r i n g 1 9
In addition to the real-time parameters, measurements were taken for atrazine, chlorpyrifos, E. coli bacteria, and PAH on a weekly basis during the first monitoring season. Also, fish toxicity was measured monthly, and habitat and benthic community analyses were conducted seasonally during the first monitoring sea-son. Results of the habitat and fish and benthic community analyses were not included in the calculation of the river indexes.
3.5 Selecting Monitoring Equipment
Your selection of remote real-time water quality monitoring equipment also depends on your project's objectives. When selecting monitoring equipment, you should consider equipment lifetime, reliability, and maintenance requirements.
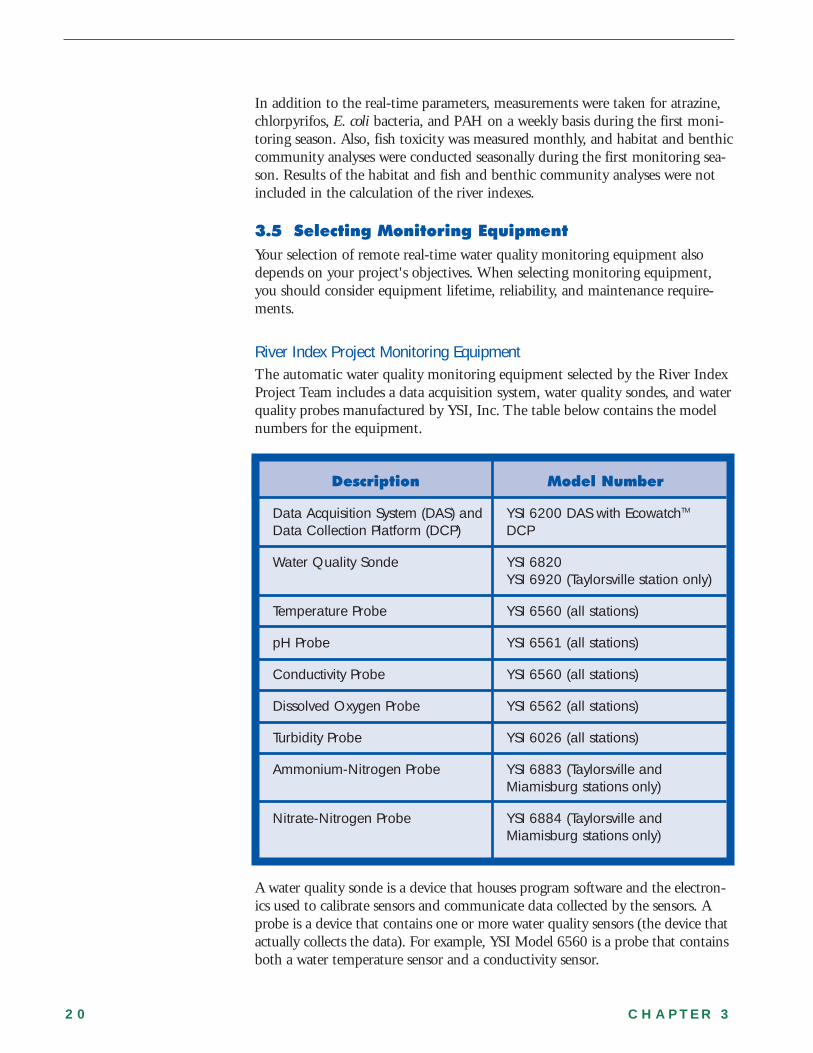
River Index Project Monitoring Equipment The automatic water quality monitoring equipment selected by the River Index Project Team includes a data acquisition system, water quality sondes, and water quality probes manufactured by YSI, Inc. The table below contains the model numbers for the equipment.
Description Model Number
Data Acquisition System (DAS) and Data Collection Platform (DCP)
YSI 6200 DAS with EcowatchTM
DCP
Water Quality Sonde YSI 6820 YSI 6920 (Taylorsville station only)
Temperature Probe YSI 6560 (all stations)
pH Probe YSI 6561 (all stations)
Conductivity Probe YSI 6560 (all stations)
Dissolved Oxygen Probe YSI 6562 (all stations)
Turbidity Probe YSI 6026 (all stations)
Ammonium-Nitrogen Probe YSI 6883 (Taylorsville and Miamisburg stations only)
Nitrate-Nitrogen Probe YSI 6884 (Taylorsville and Miamisburg stations only)
A water quality sonde is a device that houses program software and the electronics used to calibrate sensors and communicate data collected by the sensors. A probe is a device that contains one or more water quality sensors (the device that actually collects the data). For example, YSI Model 6560 is a probe that contains both a water temperature sensor and a conductivity sensor.
2 0 C H A P T E R 3

The ammonium-nitrogen and nitrate-nitrogen probes require additional calibration steps that are cumbersome to do in the field. For this reason, extra sondes were purchased at the beginning of the River Index Project. This allowed sondes to be calibrated in the laboratory and then switched with the sondes in the field.
3.6 Siting Monitors
You should select monitoring locations that best fulfill the objectives of your remote real-time water quality monitoring project. You should consider several factors when making your final siting decisions. See the checklist of questions below when choosing your location.
Monitoring Site-Selection Checklist
❏ Are the real-time data you collect at these locations likely to fulfill your project's objectives? Specifically, what questions can you answer with your data, and how do the answers help you to meet those objectives?
❏ Do people in your community support equipment installation and remote real-time monitoring at your locations?
❏ Does the monitoring equipment pose a potential danger to the people in your community? For example, are your monitoring locations near a heavy traffic area?
❏ Is monitoring equipment safe at your locations? For example, is the equipment susceptible to vandalism or tampering?
❏ What local, state, or federal regulations do you need to consider when choosing your locations?
❏ Is flexibility important to your project? Do you want the option to move your monitoring equipment to different locations, or do you want to monitor at several locations concurrently?
❏ Do you foresee any site-specific problems with installing, operating, and maintaining your monitoring equipment at these locations? Do these locations pose any safety hazards to your personnel?
❏ Can you adequately survey and access your locations? What equipment-specific considerations do you need to make?
The River Index Project Monitoring Locations Six monitoring stations are used in the River Index Project to collect water quality data in the Lower Great Miami River Watershed (see Figure 3). The selected locations are near recreational areas, key habitat areas, and population centers. Several of these locations allow the water quality monitoring station to be located in an existing MCD river gauge station.
W a t e r Q u a l i t y M o n i t o r i n g 2 1
One station is located at each of the three flood control dams in the Dayton area. The dams, which are the location of popular nature reserves, are on the Stillwater River (Englewood Dam), the Great Miami River (Taylorsville Dam), and the Mad River (Huffman Dam). Another monitoring station is located in the downtown Dayton area, immediately downstream of the confluence of the Stillwater, Great Miami, and Mad Rivers in the middle section of a popular downtown bikeway. A fifth monitoring station is located on Wolf Creek, which runs through a highly populated portion of West Dayton. Another monitoring station is located on the Great Miami River in Miamisburg, several miles south of the Downtown Dayton area.
3.7 Installing Monitoring Equipment
This section summarizes the basic procedures for installing the water quality monitoring equipment used in the River Index Project. These procedures were taken from the YSI Environmental Operations Manual available from YSI, Inc., 1725 Brannum Lane, Yellow Springs, OH 45387. Consult the YSI, Inc. manual for detailed step-by-step installation, calibration, and maintenance guidance. You also may contact YSI, Inc. at <www.ysi.com>.
The monitoring equipment used at each monitoring station in the River Index Project includes a water quality sonde, a temperature probe, a pH probe, a conductivity probe, a dissolved oxygen (DO) probe, and a turbidity probe. In addition, ammonium-nitrogen and nitrate-nitrogen probes were used during the first year of the River Index Project at the Taylorsville Dam and Miamisburg monitoring stations.
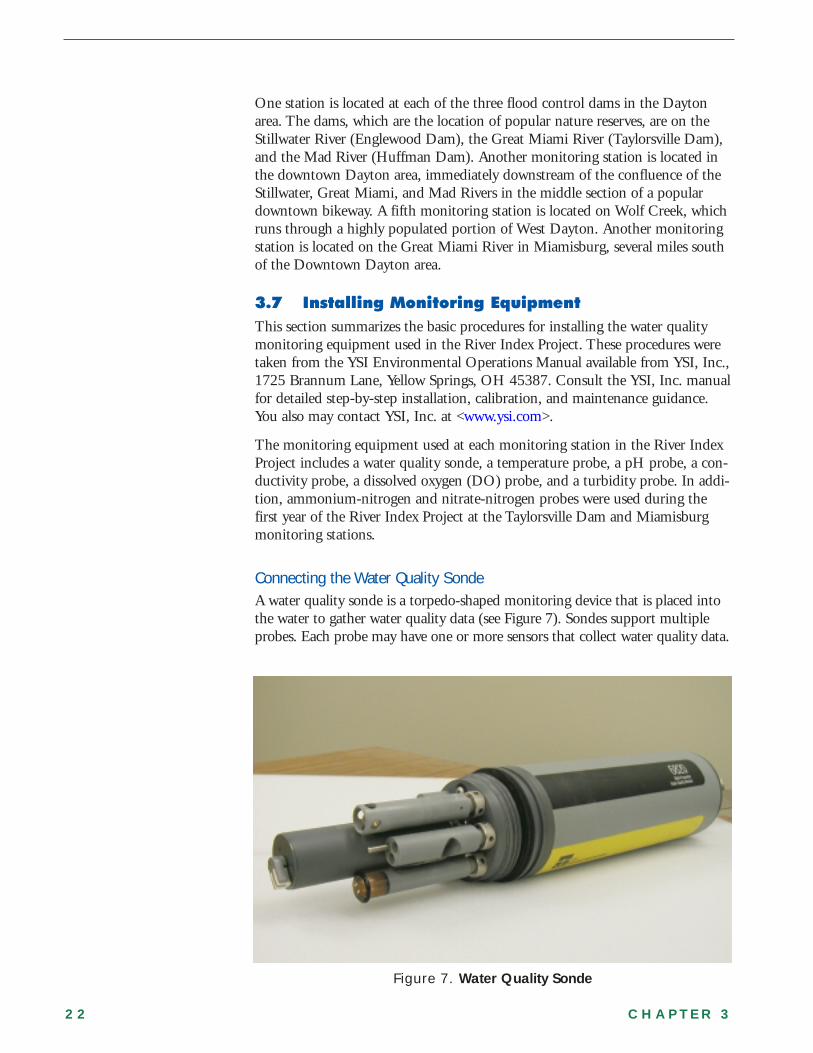
Connecting the Water Quality Sonde A water quality sonde is a torpedo-shaped monitoring device that is placed into the water to gather water quality data (see Figure 7). Sondes support multiple probes. Each probe may have one or more sensors that collect water quality data.
Figure 7. Water Quality Sonde
2 2 C H A P T E R 3
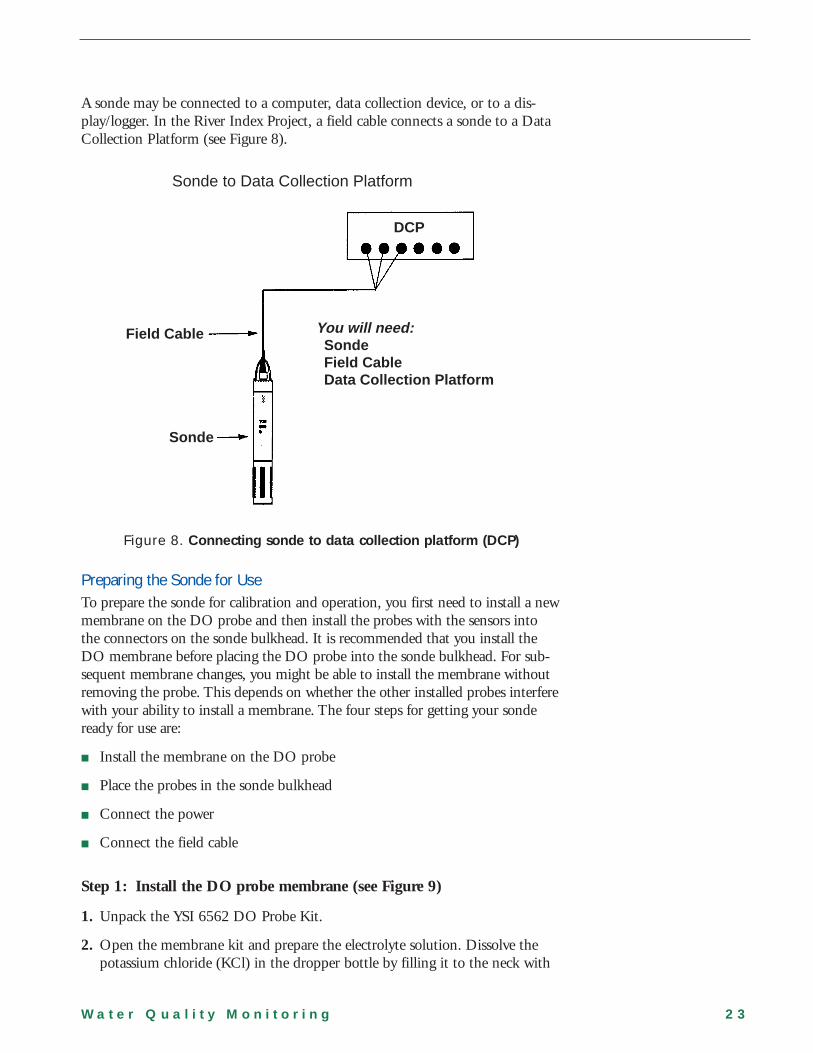
A sonde may be connected to a computer, data collection device, or to a display/logger. In the River Index Project, a field cable connects a sonde to a Data Collection Platform (see Figure 8).
Sonde to Data Collection Platform
DCP
Field Cable
Sonde
You will need: Sonde Field Cable Data Collection Platform
Figure 8. Connecting sonde to data collection platform (DCP)
Preparing the Sonde for Use To prepare the sonde for calibration and operation, you first need to install a new membrane on the DO probe and then install the probes with the sensors into the connectors on the sonde bulkhead. It is recommended that you install the DO membrane before placing the DO probe into the sonde bulkhead. For sub-sequent membrane changes, you might be able to install the membrane without removing the probe. This depends on whether the other installed probes interfere with your ability to install a membrane. The four steps for getting your sonde ready for use are:
■ Install the membrane on the DO probe
■ Place the probes in the sonde bulkhead
■ Connect the power
■ Connect the field cable
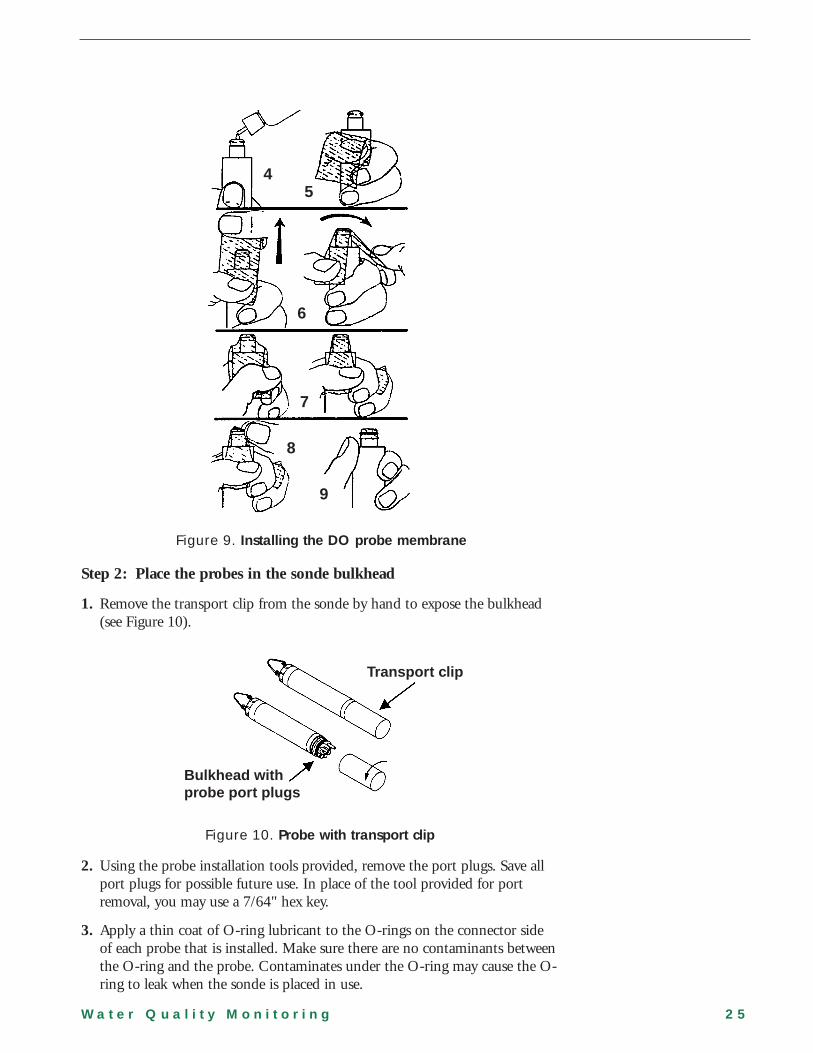
Step 1: Install the DO probe membrane (see Figure 9)
1. Unpack the YSI 6562 DO Probe Kit.
2. Open the membrane kit and prepare the electrolyte solution. Dissolve the potassium chloride (KCl) in the dropper bottle by filling it to the neck with
W a t e r Q u a l i t y M o n i t o r i n g 2 3

deionized or distilled water and shaking until the solids are fully dissolved. After the KCl is dissolved, wait a few minutes until the solution is free of bubbles.
3. Remove the protective cap from the DO probe and the dry membrane from the DO sensor. Be careful not to scratch or contaminate the sensor tip.
4. Hold the probe in the vertical position and apply a few drops of KCl solution to the tip. The fluid should completely fill the small moat around the electrodes and form a meniscus on the tip of the sensor. Be sure no air bubbles are stuck to the face of the sensor. If necessary, shake off the electrolyte and start over.
5. Secure a membrane between your left thumb and the probe body. Always handle the membrane with care, touching it only at the ends.
6. With the thumb and forefinger of your right hand, grasp the free end of the membrane. With one continuous motion, gently stretch it up, over, and down the other side of the sensor. The membrane should conform to the face of the sensor.
7. Using the thumb and forefinger of your left hand, secure the end of the membrane.
8. Roll the O-ring over the end of the sensor, being careful not to touch the membrane surface with your fingers. No wrinkles or trapped air bubbles should be in the membrane. Small wrinkles can be removed by lightly tugging on the edges of the membrane. If bubbles are present, remove the membrane and install again using Steps 4 through 9.
9. Trim off any excess membrane with a sharp knife or scissors. Rinse off an excess KCl solution, but be careful not to get any water in the connector.
TIP: You may find it more convenient to mount the probe vertically in a vise with rubber jaws while applying the electrolyte and membrane to the sensor tip.
2 4 C H A P T E R 3
4 5
6
7
8
9
Figure 9. Installing the DO probe membrane
Step 2: Place the probes in the sonde bulkhead
1. Remove the transport clip from the sonde by hand to expose the bulkhead (see Figure 10).
Transport clip
Bulkhead with probe port plugs
Figure 10. Probe with transport clip
2. Using the probe installation tools provided, remove the port plugs. Save all port plugs for possible future use. In place of the tool provided for port removal, you may use a 7/64" hex key.
3. Apply a thin coat of O-ring lubricant to the O-rings on the connector side of each probe that is installed. Make sure there are no contaminants between the O-ring and the probe. Contaminates under the O-ring may cause the O-ring to leak when the sonde is placed in use.
W a t e r Q u a l i t y M o n i t o r i n g 2 5

4. Before installing a probe, be sure the probe port is free of moisture. If moisture is present, you may use a can of compressed air to blow out the moisture.
5. Place a probe into the correct port and gently rotate the probe until the two connectors align. With the connectors aligned, tighten the probe slip nut with the probe installation tool provided. Do not cross thread the probe nut and do not over tighten the slip nut.
6. A turbidity probe should be installed first due to its center position in the sonde bulkhead.
7. Ammonium-nitrogen and nitrate-nitrogen probes do not have slip nuts and should be installed without tools. Use only your fingers to tighten.
8. After the probes are placed in the bulkhead, install the probe guard by aligning it with the threads on the bulkhead and turn the guard clockwise until it is secure. The probe guard protects the probes during calibration and measurement procedures (see Figure 11).
Caution: Be careful not to damage the DO membrane during installation of the probe guard.
Probe guard Bulkhead
(probes installed)
Turn clockwise by hand to secure
Figure 11. Sonde with probe guard
Step 3: Connect the power
1. Connect the sonde to an external power source.
2. For the YSI 6920 sonde, place the batteries into the sonde using the following procedure (see Figure 12):
■ Position the bail so that it is perpendicular to the sonde and use it as a lever to unscrew the battery cap by hand. Then slide the battery lid up and over the bulkhead connector.
■ Insert eight AA-size alkaline batteries into the sonde, paying special attention to polarity. Labeling on the sonde body describes the proper orientation of the batteries with respect to polarity.
2 6 C H A P T E R 3

■ Check the O-ring and sealing surfaces for any contaminants that could interfere with the O-ring seal of the battery chamber. Contaminants under the O-ring may cause the O-ring to leak when the sonde is placed in use.
■ Lightly lubricate the O-ring on the outside of the battery cover. DO NOT lubricate the internal O-ring.
■ Replace the battery lid and tighten by hand. DO NOT OVER TIGHTEN.
Bulkhead connector with cap
Bail
Screw on battery cap
AA batteries (note polarity)
Sonde body (not shown)
Figure 12. Location of sonde batteries
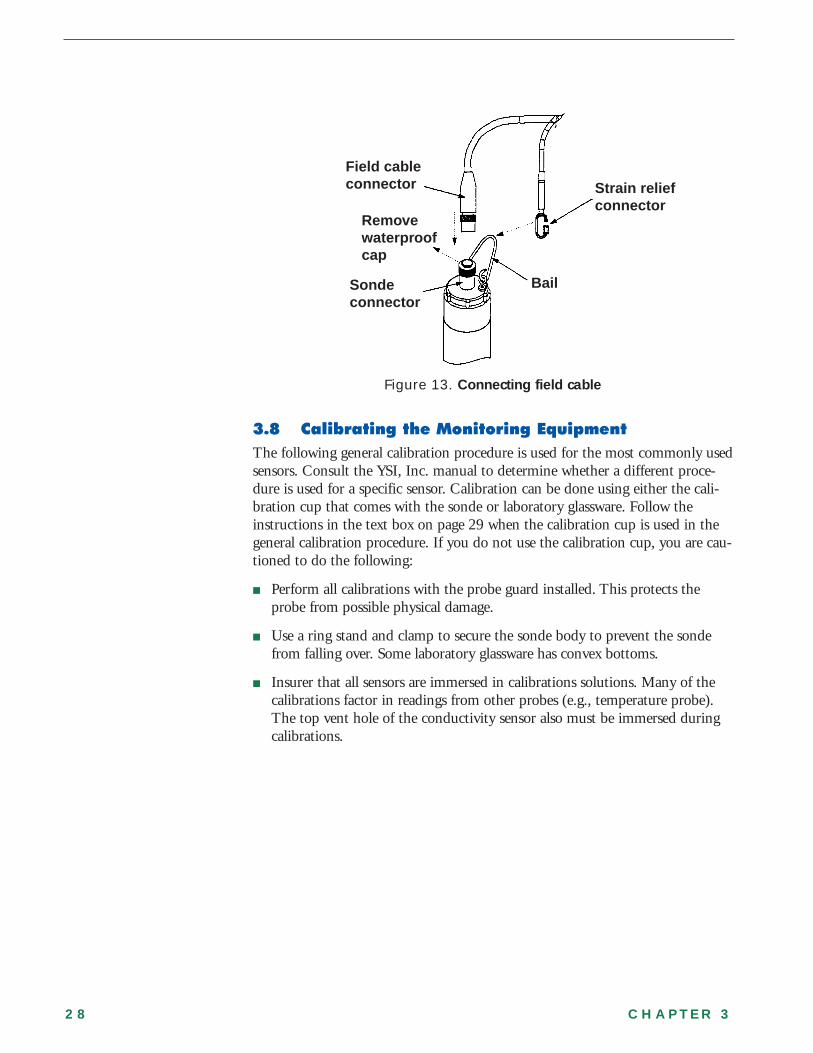
Step 4: Connect the field cable (see Figure 13)
1. Remove the waterproof cap from the sonde connector and set it aside for later reassembly during storage.
2. Connect the field cable to the sonde connector. A built-in “key” ensures proper pin alignment. Rotate the cable gently until the “key” engages and then tighten the connectors together by rotating them clockwise.
3. Attach the strain relief connector to the sonde bail. Rotate the strain relief connector nut to close the connector's opening.
4. The other end of the field cable for all sondes is a military-style 8-pin connector (MS-8). Through the use of a YSI 6095B MS-8 to DB-9 adapter, the sonde can be connected to a computer for setup, calibration, measurement, and uploading files.
5. For laboratory use, a YSI 6067B calibration cable can be used instead of a field cable. This cable is not waterproof and should not be submersed in water. To use, plug the proper end of the cable into the sonde connector and attach the DB-9 connector of the cable to the COM port of your computer.
W a t e r Q u a l i t y M o n i t o r i n g 2 7
Bail connector
Remove waterproof
Field cable connector Strain relief
connector
cap
Sonde
Figure 13. Connecting field cable
3.8 Calibrating the Monitoring Equipment
The following general calibration procedure is used for the most commonly used sensors. Consult the YSI, Inc. manual to determine whether a different procedure is used for a specific sensor. Calibration can be done using either the calibration cup that comes with the sonde or laboratory glassware. Follow the instructions in the text box on page 29 when the calibration cup is used in the general calibration procedure. If you do not use the calibration cup, you are cautioned to do the following:
■ Perform all calibrations with the probe guard installed. This protects the probe from possible physical damage.
■ Use a ring stand and clamp to secure the sonde body to prevent the sonde from falling over. Some laboratory glassware has convex bottoms.
■ Insurer that all sensors are immersed in calibrations solutions. Many of the calibrations factor in readings from other probes (e.g., temperature probe). The top vent hole of the conductivity sensor also must be immersed during calibrations.
2 8 C H A P T E R 3

The following are the steps in the general calibration procedure:
Using the Calibration Cup to Calibrate Sensors in YSI 6820/6920 Sondes
✓ Ensure that a gasket is installed in the gasket groove of the calibration cup bottom cap and that the bottom cap is tightened.
✓ Remove the probe guard from the sonde, if installed.
✓ Remove the sonde O-ring, if installed.
✓ Inspect the installed gasket on the sonde for obvious defects and, if necessary, replace it with the extra gasket (supplied).
✓ Screw calibration cup assembly into place on the threaded end of the sonde and securely tighten, but do not over tighten.
✓ Sonde calibration can be accomplished with the sonde upright or upside down. A separate clamp and stand, such as a ring stand, is required to support the sonde in the inverted position.
✓ To calibrate the DO sensor, loosen the bottom cap or cup assemble to allow pressure equilibration before calibration. The DO calibration is a water-saturated air calibration.
✓ Follow the general calibration procedure to calibrate a sensor unless a different procedure is used for a specific sensor.
✓ To ensure more accurate results, you can rinse the calibration cup with water, and then rinse with a small volume of calibration solution for the sensor that you are calibrating. Discard the rinse solution and add fresh calibration solution. Consult the YSI, Inc. manual for the correct volume of calibration solution for a sensor.
Step 1:
Carefully immerse the probes in the calibration solution. It is recommended that the sonde be supported with a ring stand and clamp to prevent the sonde from falling over.
Step 2:
With a field cable connecting the sonde to a personal computer (PC), access EcoWatch for Windows and proceed to the Main menu. From the Main menu, select number 2-Calibrate.
W a t e r Q u a l i t y M o n i t o r i n g 2 9
Step 3:
From the Calibrate menu, select the number of the sensor that you are calibrating. A number in parenthesis appears next to the selected parameter. This is a default value that is used during calibration unless you input a different value. For parameters for which no default value is shown, you must type in a value. After you are satisfied with the default value, press “enter.”
Step 4:
After you press “enter,” a real-time display appears on the screen. Carefully observe the stabilization of the readings for the parameter that is being calibrated. When the readings are stable for approximately 30 seconds, press “enter” to accept the calibration.
Step 5:
Press “enter” to return to the Calibrate menu, and proceed with the calibration for the other sensors.
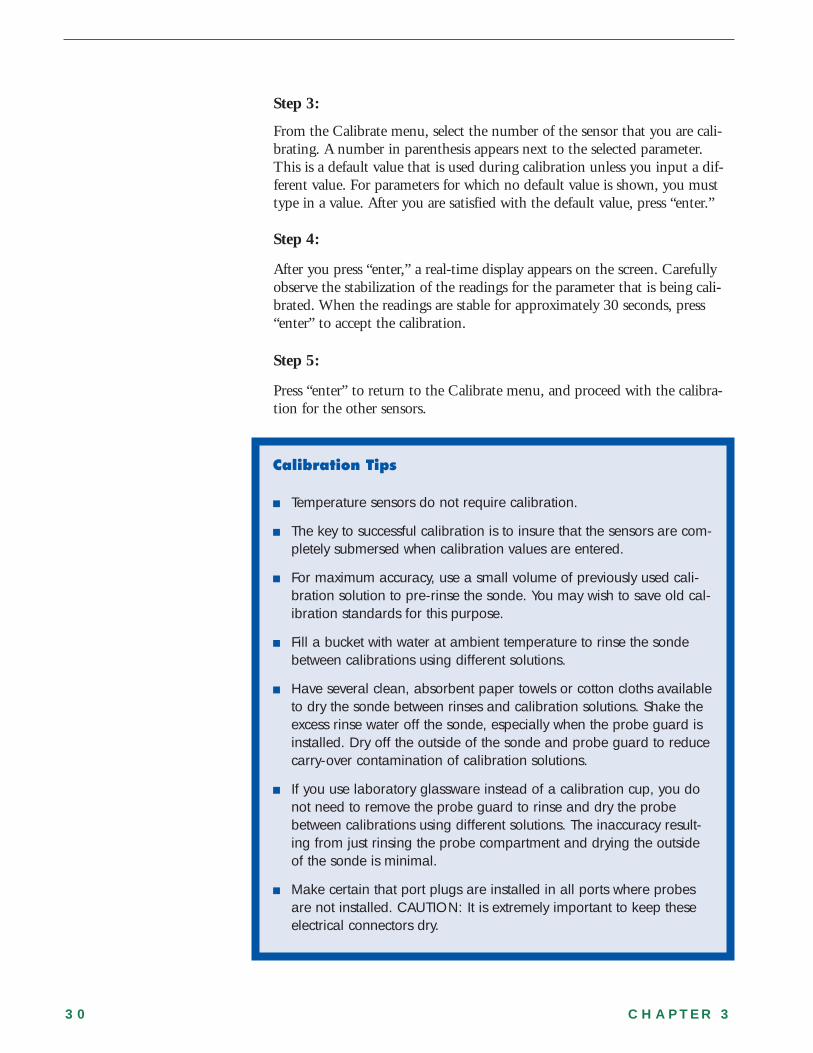
Calibration Tips
■ Temperature sensors do not require calibration.
■ The key to successful calibration is to insure that the sensors are completely submersed when calibration values are entered.
■ For maximum accuracy, use a small volume of previously used calibration solution to pre-rinse the sonde. You may wish to save old calibration standards for this purpose.
■ Fill a bucket with water at ambient temperature to rinse the sonde between calibrations using different solutions.
■ Have several clean, absorbent paper towels or cotton cloths available to dry the sonde between rinses and calibration solutions. Shake the excess rinse water off the sonde, especially when the probe guard is installed. Dry off the outside of the sonde and probe guard to reduce carry-over contamination of calibration solutions.
■ If you use laboratory glassware instead of a calibration cup, you do not need to remove the probe guard to rinse and dry the probe between calibrations using different solutions. The inaccuracy resulting from just rinsing the probe compartment and drying the outside of the sonde is minimal.
■ Make certain that port plugs are installed in all ports where probes are not installed. CAUTION: It is extremely important to keep these electrical connectors dry.
3 0 C H A P T E R 3
River Index Project
For the River Index Project, the probes were calibrated initially on a weekly basis. After several weeks of testing the equipment, the calibration frequency was decreased to biweekly.
The ammonium-nitrogen and nitrate-nitrogen probes require additional calibration steps that are cumbersome to do at a monitoring site. For this reason, extra sondes were purchased at the beginning of the River Index Project. This allowed sondes to be calibrated in the laboratory and then switched with the sondes at the monitoring site.
3.9 Maintaining Monitoring Equipment
Most of the maintenance activities for the monitoring equipment focus on cleaning the sondes and the probes. The activities vary by the type of probe used.
The YSI 6570 Maintenance Kit is available for a sonde. The kit includes two types of O-rings (for probes and cable connector), probe installation and replacement tools, two cleaning brushes for the conductivity sensor, O-ring lubricant, and a syringe for cleaning the depth sensor port. These items are helpful in performing routine maintenance on your sondes.
To prevent water from entering a sonde port, it is extremely important that the entire sonde and all probes be thoroughly dried prior to the removal of a probe or probe plug. If moisture is present inside a probe port when either a probe or plug is removed, use compressed air to completely dry the connector inside the port. Remember, you will never a need to gain access to the interior circuitry of a sonde during cleaning, because the sonde is sealed at the factory.
Maintenance activities for the cable connector port and the different sensors are discussed below.
Cable Connector Port
The cable connector port at the top of the sonde should be covered at all times, and the cable should be tightened at all times. This assures that a proper connection is made and prevents moisture and contaminants from entering the sonde. If moisture enters a connector, dry the connector completely using compressed air, a clean cloth, or a paper towel.
When a communications cable is not connected to the cable connector port, the pressure cap supplied with the instrument should be tightened. Apply a thin coat of the lubricant that comes in the maintenance kit to the O-ring inside the cable connector cap prior to each use.
DO Probe
For best results, the KCl solution and the membrane on the tip of the DO probe should be changed prior to each time the sonde is used and at least every 30 days during use. The KCl solution and membrane also should be changed if 1) bubbles are visible under the membrane, 2) if significant deposits of dried
W a t e r Q u a l i t y M o n i t o r i n g 3 1

electrolyte are visible on the membrane or O-ring, or 3) if the probe provides unstable readings.
■ Dry the probe tip completely with lens cleaning tissue.
■ Hold the probe in a vertical position and place one of the sanding disks sup-plied by manufacturer under your thumb.
■ Stroke the probe face in a direction parallel to the gold electrode (located between the two silver electrodes). The motion is similar to that used to strike a match.
■ Usually, 10 to 15 strokes of the sanding disk are sufficient to remove the black deposits on the silver electrodes. In extreme cases, more sanding may be required to regenerate the original silver surface.
■ After completing the sanding procedure, rinse the probe face with clean water and wipe with lens cleaning tissue to remove any grit from the sanding disk.
■ Rinse the entire tip of the probe with distilled or deionized water and install a new membrane.
■ Be sure only to use the fine sanding disk provided by the manufacturer and sand in the direction of the gold electrode. Not adhering to both of these instructions can damage the electrodes.
Conductivity/Temperature Probe
The openings that allow liquid access to the conductivity electrodes must be cleaned regularly. Dip a small cleaning brush (provided in the maintenance kit) in clean water and insert it into each hole 15 to 20 times. In the event that deposits are on the electrodes, adding a mild detergent in the cleaning water might be necessary. After cleaning, check the response and accuracy of the conductivity cell with a calibration solution.
The temperature portion of the probe requires no maintenance.
pH Probe
Cleaning of the pH probe is required whenever deposits or contaminants are on the glass surfaces of the probe, or whenever there is a slow response. Several procedures are used to clean the pH probe after it is removed from the sonde.
The initial procedure is to use clean water and either a saturated soft clean cloth, lens cleaning tissue, or cotton swab to remove all foreign material from the glass bulb. Then, use a moistened cotton swab to carefully remove material that may block the reference electrode junction of the sensor. Be careful not to wedge the swab tip between the guard and the glass sensor. If necessary, remove the cotton from the swab tip so that the cotton can reach all parts of the sensor tip without stress.
3 2 C H A P T E R 3

If good pH response is not restored using the initial procedure, perform the following procedure:
1. Soak the probe for 10 to 15 minutes in clean water containing a few drops of commercial dishwashing liquid.
2. Gently clean the glass bulb by rubbing with a cotton swab soaked in cleaning solution.
3. Rinse the probe in clean water, wipe with a cotton swab saturated with clean water, and then rinse again with clean water.
If good pH response still is not restored, perform the following additional procedures:
1. Soak the probe for 30 to 60 minutes in one molar hydrochloric acid solution. Be sure to follow the safety instructions that come with the acid solution.
2. Gently clean the glass bulb by rubbing with a cotton swab soaked in the acid solution.
3. Rinse the probe in clean water, wipe with a cotton swab saturated with clean water, and then rinse again with clean water. To be certain that all of the acid solution is removed from the probe crevices, soak the probe in clean water for about an hour with occasional stirring.
If good pH response is not restored through the above procedures or if biological contamination of the reference junction is suspected, perform the following additional cleaning step.
1. Soak the probe for approximately one hour in a one-to-one dilution of commercially available chlorine bleach.
2. Rinse the probe with clean water and then soak for at least one hour in clean water with occasional stirring to remove residual bleach from the junction. If possible, soak the probe for longer than one hour to be certain that all traces of chlorine beach are removed. Then rinse the probe with clean water and retest.
If good pH response is achieved at the end of any of the above procedures, dry the sonde port and probe connector with compressed air and apply a thin coat of lubricant to all O-rings. Then place the pH probe in the sonde. If good pH response is still not achieved, consult the manufacturer.
Turbidity Probe
The turbidity probe requires minimal maintenance. After each use, the optical surface of the tip of the turbidity probe should be inspected for fouling. If necessary, clean the surface by gently wiping the probe face with moist lens-cleaning paper. The wiper assembly might have to be replaced periodically depending on the quality of water that is monitored.
W a t e r Q u a l i t y M o n i t o r i n g 3 3
River Index Project
Initially, maintenance activities were performed weekly in the River Index Project. After several weeks of testing, the maintenance frequency was reduced to biweekly.
As mentioned previously, extra sondes were purchased at the beginning of the River Index Project so that sondes could be maintained in the laboratory and then switched with sondes at the monitoring sites. Approximately one hour is needed to clean, service, maintain, and calibrate a sonde in the laboratory. The time required for maintenance of each sonde and any problems encountered with the sonde are recorded in a log book.
Field maintenance includes cleaning of the flow-through tank wall, back flushing of the monitoring system by turning off the pump, cleaning pipes, and confirming the pump is in good working condition by recording the time it takes to refill the flow-through tank. All field activities are recorded on a sheet that remains at the monitoring station.
3 4 C H A P T E R 3