Embed Size (px)
Citation preview

March 2021
Northeast Ohio AreawideCoordinating Agency
Air Quality Trends Report2020

This page is intentionally left blank.

��������
��
��
���
��
��
���
��
��
������
��
���
���
��
��
��
��
��
���
���
��
��
��
��
����
���������
����������
��������
���������
����
� �����
���������
���������
�����������
���������
���������
�����������
��������
����������
��������
���������
���������� ������
��������
�������
������������
����������
��������
���������
������ ������������
���� �� ����
���������������
����������
��������
���������
������
�����������
������
��������
����������
����������
����������������
��
����� ��������
����������
��
��������
������
��������������
����
���������
����������
�������
���������
�������� ������
�����
��������������
������
���������
������
��������
������
�����������
��������
����
�������
����
�����������
���������� ���
����������
����������
������
����������
����������
�����
��������
��������
������ �������
��
����������
��� �������
�����������
���������
��������
������
���������
���������
������������
��������
��� �����
���������
�������
����������
������
����
�� �����
�����
��������
�������������
�����������
���� �����
�������
����������
����������
��� �����
��������������
��
�����
���������
�������
��������
����
������
�������� �
����
����
�� ����
�������
���
�����
���
��
������������������
���������������
���
������ ������
��������
��������� ������������
�������
���������
��������
�������������������
��������
�������
����������������������
���������������
����������
�����������
������������������
�������������
������������
�������������
�������
������
���
�������������
������������
�����
�����
����������
����������
������ �������
��������
�������
����
���
�������
��
������������
�����������
���������������
�����������
��������
�������� ������
���
�������
����������
������������
������������
����
������
������������
������
����
������
����
����
������
��������
������
�������
�������
���
���
�����
�
���
���
������������
��������
��������
������
������
������
������
���
�
�����������
�������
�
���
�����
��
�
�
����������
���
���
• Serve as the Metropolitan Planning Organization (MPO), with responsibility for comprehensive, cooperative and continuous planning for highways, public transit, and bikeways, as defined in the current transportation law.
• Perform continuous water quality, transportation-related air quality and other environmental planning functions.
• Administer the area clearinghouse function, which includes providing local government with the opportunity to review a wide variety of local or state applications for federal funds.
• Conduct transportation and environmental planning and related demographic, economic and land use research.
• Serve as an information center for transportation and environmental and related planning.
• As directed by the Board, provide transportation and environmental planning assistance to the 172 units of local, general purpose government.
For moreinformation, call (216) 241-2414 or log on at www.noaca.org
The Northeast Ohio Areawide Coordinating Agency (NOACA) is a public organization serving the counties of and municipalities and townships within Cuyahoga, Geauga, Lake, Lorain and Medina (covering an area with 2.1 million people). NOACA is the agency designated or recognized to perform the following functions:
NOACA’s Board of Directors is composed of 46 local public officials. The Board convenes quarterly to provide a forum for members to present, discuss and develop solutions to local and areawide issues and make recommendations regarding implementation strategies. As the area clearinghouse for the region, the Board makes comments and recommendations on applications for state and federal grants, with the purpose of enhancing the region’s social, physical, environmental and land use/transportation fabric. NOACA invites you to take part in its planning process. Feel free to participate, to ask questions and to learn more about areawide planning.

2021 NOACA BOARD OF DIRECTORS
NOACA DIRECTORS
BOARD MEMBERS
BOARD OFFICERS
CUYAHOGA COUNTYSamuel J. Alai,Mayor, City of Broadview HeightsLarry Antoskiewicz, Mayor, City of North RoyaltonAnnette M. Blackwell,Mayor, City of Maple HeightsPamela Bobst, Mayor, City of Rocky RiverMichael Dylan Brennan, Mayor, City of University HeightsArmond Budish, County ExecutiveMary Cierebieg, Executive Director, Cuyahoga County Planning CommissionTimothy J. DeGeeter, Mayor, City of ParmaMichael W. Dever, MPAPublic Works DirectorKirsten Holzheimer Gail, Mayor, City of EuclidMichael D. Gammella, Mayor, City of Brook ParkMeghan George, Mayor, City of LakewoodDale Miller, County CouncilmanSusanna Niermann O’Neil, City Manager, City of Cleveland HeightsDavid H. Roche, Mayor, City of Richmond Heights
CITY OF CLEVELANDPhyllis Cleveland, City Councilwoman
Freddy L. Collier, Jr., Director, City Planning Commission Blaine A. Griffin, City CouncilmanAnthony Hairston, City CouncilmanFrank G. Jackson, MayorValarie J. McCall, Chief of Communications, Government & International AffairsMatthew L. Spronz, P.E., PMP, Capital Projects Director
GEAUGA COUNTYJames W. Dvorak, County CommissionerTimothy C. Lennon, County CommissionerRalph Spidalieri, County Commissioner
LAKE COUNTYBen Capelle, General Manager, Laketran James R. Gills, P.E., P.S., County EngineerJohn R. Hamercheck, County Commissioner John Plecnik County CommissionerRon Young County Commissioner
LORAIN COUNTYJack Bradley, Mayor, City of LorainKenneth P. Carney, Sr., P.E., P.S., County Engineer
Kevin Corcoran, Mayor, City of North Ridgeville Dick Heidecker, Trustee, Columbia TownshipMichelle Hung County CommissionerMatt Lundy, County CommissionerFrank Whitfield Mayor, City of Elyria
MEDINA COUNTYJeff Brandon, Trustee, Montville TownshipAndrew H. Conrad, P.E., P.S. County EngineerWilliam F. Hutson, County Commissioner
Patrick Patton, City EngineerCity of MedinaREGIONAL AND STATEGreater Cleveland Regional Transit Authority (GCRTA)India Birdsong, CEO & General Manager
Northeast Ohio Regional Sewer District (NEORSD)Kyle Dreyfuss-Wells, Chief Executive Officer
Cleveland-Cuyahoga County Port Authority William D. Friedman, President & CEO
Ohio Department of Transportation (ODOT) John Picuri, P.E., Deputy Director, District 12
EX OFFICIO MEMBERSFerzan M. Ahmed, P.E.Executive Director, Ohio Turnpike and Infrastructure CommissionKurt Princic, Chief, Northeast District Office, Ohio Environmental Protection Agency (OEPA)
Grace Gallucci, CEO & Executive Director
Billie Geyer, Comptroller
Randy Lane, Director of Programming
Ali Makarachi, Ph.D, Director of Transportation Planning & Engineering
Joseph MacDonald, Ph.D, Director of Strategic & Environmental Planning
Susanna Merlone, EMBA, Director of Administrative Services
Danielle Render Director of External Engagement & Public Affairs
Kathy Sarli, Associate Director of Operations & Chief Operating Officer
Jonathan Giblin, Associate Director of Compliance
President: Matt Lundy, Commissioner, Lorain CountyFirst Vice President: John R. Hamercheck, Commissioner, Lake CountySecond Vice President: William F. Hutson, Commissioner, Medina CountySecretary: Armond Budish, County Executive, Cuyahoga CountyAssistant Secretary: Kirsten Holzheimer Gail, Mayor, City of Euclid
Assistant Secretary: Annette M. Blackwell, Mayor, City of Maple HeightsTreasurer: Valarie J. McCall, Chief of Communications. Government & International Affairs, City of ClevelandAssistant Treasurer: Andrew Conrad, P.E., P.S. Medina County EngineerAssistant Treasurer: Frank Whitfield, Mayor, City of ElyriaImmediate Past President: Timothy C. Lennon, Commissioner, Geauga County

1) Title & Subtitle Air Quality Trends and Attainment Status for Northeast Ohio: CY2019
2) NOACA Report No. 6618e
3) Author(s) Tim Kovach Contributors: William Kenny, Ohio EPA
4) Report Date March 2021
5) Performing Organization Name & Address Northeast Ohio Areawide Coordinating Agency 1299 Superior Avenue, Cleveland, OH 44114-3204 Phone: (216) 241-2414 Web site: www.noaca.org
6) Project Task No. 1011-03 7) NOACA Contract/Grant No. ODOT/FHWA
8) Sponsoring Agency Name & Address Ohio Department of Transportation 1980 W. Broad St., Box 899 Columbus, OH 43216-0899
9) Type of Report & Period Covered (January 1, 2019 – December 31, 2019) 10) Sponsoring Agency Code
11) Supplementary Notes Federal funding for this project was provided by the Federal Highway Administration and administered by the Ohio Department of Transportation. 12) Abstracts Annual update on criteria pollutant air quality conditions in Northeast Ohio for calendar year 2019 with specific references to current U.S. EPA designated nonattainment areas. 13) Key Words & Document Analysis A. Descriptors: Air Pollution, Monitors, Criteria Pollutants, Air Quality Trends, Ozone, PM2.5, Transportation, Climate Change, Greenhouse Gas Emissions
B. Identifiers/Open Ended Terms 14) Availability Statement NOACA
15) No. Pages 75 16) Price Free of charge
i
Air Quality Trends and Attainment Status for Northeast Ohio: CY2019
March 2021
NORTHEAST OHIO AREAWIDE COORDINATING AGENCY
1299 Superior Avenue E. Cleveland, Ohio 44114
noaca.org
Matt Lundy Grace Gallucci BOARD PRESIDENT EXECUTIVE DIRECTOR
Preparation of this publication was financed by appropriations from the counties of, and municipalities within, Cuyahoga, Geauga, Lake, Lorain and Medina; the U.S. Environmental Protection Agency; and the U.S. Department of Transportation, Federal Transit Administration and Federal Highway Administration, in conjunction with the Ohio Department of Transportation.

ii
ABSTRACT
This report presents information on air quality trends in Ashtabula, Cuyahoga, Geauga, Lake, Lorain, Medina, Portage, and Summit counties for the six criteria pollutants: carbon monoxide, lead, nitrogen dioxide, ozone, particulate matter, and sulfur dioxide. These are the pollutants for which the Clean Air Act requires the United States Environmental Protection Agency (U.S. EPA) to establish National Ambient Air Quality Standards (NAAQS). The NAAQS are the maximum allowable ambient concentrations for each pollutant. The primary NAAQS are intended to protect people by preventing adverse health impacts from excessive pollution concentrations. The report also includes chapters on the link between transportation and air quality, as well as on climate change and greenhouse gas (GHG) emissions. Data are generally reported under some form of nonattainment classification for the pollutant under discussion. The nonattainment areas and the associated U.S. EPA attainment dates are also discussed with updates through calendar year (CY) 2019, as of the time of printing this report.

iii
TABLE OF CONTENTS TABLE OF CONTENTS ............................................................................................................. iii LIST OF TABLES ....................................................................................................................... iv LIST OF FIGURES ..................................................................................................................... v Executive Summary ................................................................................................................... 1 1. Introduction ......................................................................................................................... 2 2. National Ambient Air Quality Standards (NAAQS) Attainment Status in Northeast Ohio ..... 4
2.1 Attainment Status Summary for Northeast Ohio ............................................................... 5 2.2 Air Quality Index (AQI) ...................................................................................................... 6
3. Mobile Emissions and Transportation Conformity ............................................................... 7 4. Air Quality and Public Health............................................................................................... 9 5. Trends for the Six Criteria Air Pollutants in Northeast Ohio ................................................13
5.1 Ground-Level Ozone (O3) ...........................................................................................13 5.2 Particulate Matter (PM) ...............................................................................................25
5.2.1 Coarse Particulate Matter (PM10) .........................................................................26 5.2.2 Fine Particulate Matter (PM2.5) .............................................................................30
5.3 Sulfur Dioxide .............................................................................................................40 5.4 Carbon Monoxide ............................................................................................................45 5.5 Lead ................................................................................................................................49 5.6 Nitrogen Dioxide ..............................................................................................................52
6. Climate Change and Greenhouse Gas Emissions .............................................................58 6.1 Transportation Sector Greenhouse Gas Emissions in Northeast Ohio ........................63 6.2 Impacts of Climate Change on Air Quality in Northeast Ohio ......................................65
7. Conclusion .........................................................................................................................67 Appendix A: O3 Exceedance Days 2000-2019 ..........................................................................68 Appendix B: PM2.5 Exceedance Days 2007-2019 ......................................................................74

iv
LIST OF TABLES
Table 1: Summary of National Ambient Air Quality Standards (2019)…..……………...….…….…..2 Table 2: Attainment Status for NAAQS in Northeast Ohio (2019)………..………………..…….…...4 Table 3: Air Quality Index and Corresponding NAAQS Concentrations....………………..…………6 Table 4: Public Health Impacts of Air Pollutant Emissions in the NOACA Region, 2016…….……9 Table 5: Change in Criteria Air Pollutant Concentrations for USA (1980-2019)………………...…10 Table 6: Change in Criteria Air Pollutant Concentrations for Ohio Metropolitan Areas…..….....…12 Table 7: Locations of Ozone Monitors in Northeast Ohio……………………………………….…..17 Table 8: Three-Year Average Eight-Hour Ozone Readings in Northeast Ohio
(2007-2019)..….…………………………………………………………………………….…23 Table 9: Locations of PM10 Monitors in Northeast Ohio………………………………...…….…..….27 Table 10: Locations of PM2.5 Monitors in Northeast Ohio……………….……………......…..….….33 Table 11: Monitor-by-Monitor Three-Year Rolling Averages for Annual PM2.5 NAAQS……..........36 Table 12: Monitor-by-Monitor Three-Year Rolling Averages for 24-Hour PM2.5 NAAQS.…….......37 Table 13: Locations of SO2 Monitors in Northeast Ohio……………………………...…...…..….….41 Table 14: Locations of CO Monitors in Northeast Ohio...……………………………......…....……..47
Table 15: Locations of Pb Monitors in Cuyahoga County……………………………........…….…..51 Table 16: Locations of NO2 Monitors in Northeast Ohio...………………………………........……..55 Table 17: Global Warming Potential of Transportation Sector GHGs...…………………..………..62 Table 18: Population & On-Road GHG Emissions in Northeast Ohio……………...……..………..63 Table 19: Northeast Ohio On-Road GHG Emissions by Vehicle Type.......………………..…..…..64

v
LIST OF FIGURES Figure 1: 2017 VOC Emissions Inventory for Northeast Ohio……………….………...….…………15 Figure 2: Timeline of Revisions to Ozone NAAQS, 1971-2019……………….….…...………….…16 Figure 3: Northeast Ohio O3 Monitor Locations……………………………………….……………...18 Figure 4: Number of Exceedance Days for the Eight-Hour Ozone NAAQS (2004-2019)..….........20 Figure 5: Number of Exceedance Days of the 70 ppb Ozone NAAQS (2004-2019)………...…….21 Figure 6: May-September Average O3 Levels in Cleveland, Adjusted for Weather (2000-2019)..22 Figure 7: Rolling Three-Year Ozone Averages for Northeast Ohio (2007-2019)..……………..….23 Figure 8: Daily O3 AQI Values for Cleveland & Akron (2019)…………………………………...…...24 Figure 9: Particulate Matter Size…………………………………………………………………….…25 Figure 10: 2017 PM10 Emission Inventory for Northeast Ohio...………………………………..…...26 Figure 11: Northeast Ohio PM10 Monitor Locations………………………………………..…………28 Figure 12: Number of PM10 Exceedance Days (2005-2019)………………………………..……….29 Figure 13: Daily PM10 AQI levels for Cleveland (2019).……………………………………..……….29 Figure 14: Air Monitor Filter Before and After Trapping PM2.5………………..................................30 Figure 15: 2017 Primary PM2.5 Emissions Inventory for Northeast Ohio………………..................31 Figure 16: Timeline of Revisions to PM NAAQS (1971-2019)…..………………………..…………32 Figure 17: Northeast Ohio PM2.5 Monitor Locations……………………………………….…………34 Figure 18: Number of PM2.5 Exceedance Days (2009-2019)…………….………………..………...35 Figure 19: Maximum Three-Year Rolling Averages for Annual PM2.5 NAAQS (2007-2019)…...…38 Figure 20: Maximum Three-Year Rolling Averages for 24-Hour PM2.5 NAAQS (2007-2019)........38 Figure 21: Daily PM2.5 AQI levels in 2019………………………………………………………..…….49 Figure 22: 2017 SO2 Emissions Inventory …………………………………………………...............40 Figure 23: Northeast Ohio SO2 Monitor Locations ……………………………………………..…….42 Figure 24: Three-Year Average of the 99th Percentile of the Daily Maximum One-Hour
Average SO2 (2009-2019) …………………………………………………….…………...43 Figure 25: Second Maximum 24-Hour SO2 Concentration (2009-2019).....……………...………..43 Figure 26: Daily SO2 AQI Levels in 2019………………………………………………………..……..44 Figure 27: 2017 CO Emissions Inventory for Northeast Ohio.……………………………..……......46 Figure 28: Northeast Ohio CO Monitor Locations ……………………………………………..……..47 Figure 29: Second Maximum One-Hour CO Concentrations (2005-2019)..……….......................48 Figure 30: Second Maximum Eight-Hour CO Concentrations (2005-2019)…...………..………....48 Figure 31: Daily CO AQI Levels in 2019…………………………………………………......………..49 Figure 32: Northeast Ohio Pb Monitor Locations……………………………………………....……..51 Figure 33: Highest Three-Month Average Pb Concentrations in Cuyahoga County
(2005-2019).………………………………………………………………………………...52 Figure 34: 2017 NOx Emissions Inventory for Northeast Ohio….………...…………………..…….53 Figure 35: Northeast Ohio NO2 Monitor Locations……………………………….……….………….55 Figure 36: Three-Year Average of the 98th Percentile of the Daily Maximum One-Hour
Average NO2 for Cuyahoga County (2009-2019)..……………...…………….…….......56 Figure 37: Annual Mean NO2 Concentration for Cuyahoga County (2005-2019)…..…..………....56 Figure 38: Daily NO2 AQI Levels in 2019….................................................................................57 Figure 39: Atmospheric CO2 and Earth’s Surface Temperature (1880-2019)…....…..………...…59 Figure 40: Share of GHG Emissions by Sector – United States ………………………..…………..60 Figure 41: Share of GHG Emissions by Sector – Ohio …………………………………..…..……...61 Figure 42: Share of On-Road GHG Emissions in Northeast Ohio in 2019 by County……….........64 Figure 43: Projected Maximum March-October Daily Temperatures by County………........…….65

1
Executive Summary In 1970, the United States Congress amended the federal Clean Air Act (CAA), leading the U.S. Environmental Protection Agency (U.S. EPA) to create and enforce federal limits for six so-called criteria air pollutants—ozone, particulate matter (coarse and fine), carbon monoxide, sulfur dioxide, lead, and nitrogen dioxide. These limits, known as the National Ambient Air Quality Standards (NAAQS), protect human health and public welfare. This document summarizes the most current data on air quality in eight counties in Northeast Ohio (Ashtabula, Cuyahoga, Geauga, Lake, Lorain, Medina, Portage, and Summit), which constitute the NOACA air quality planning area. As the report demonstrates, while air quality has generally improved throughout the region, portions of Northeast Ohio remain in nonattainment for one of the six NAAQS. Additionally, this report examines the links between transportation and air quality (Chapter 3), as well as greenhouse gas emissions and climate change (Chapter 6). NAAQS Attainment Status Summary:
1. Ozone (Section 5.1): On April 30, 2018 U.S. EPA designated Cuyahoga, Geauga, Lake, Lorain, Medina, Portage, and Summit Counties as a marginal nonattainment area for the 2015 Eight-Hour NAAQS of 70 parts per billion (ppb).
2. Particulate Matter (Section 5.2): Cuyahoga County was redesignated as a maintenance
area for PM10 on January 10, 2001. In January 2013, U.S. EPA strengthened the annual PM2.5 NAAQS to 12 micrograms per cubic meter (µg/m3). Cuyahoga and Lorain counties were redesignated as maintenance areas effective April 12, 2019.
3. Carbon Monoxide (Section 5.3): Cuyahoga County remains in maintenance status for
the 1971 carbon monoxide NAAQS, while all other counties are in attainment.
4. Sulfur Dioxide (Section 5.4): On August 5, 2013, U.S. EPA designated Lake County as a nonattainment area for the 2010 One-Hour sulfur dioxide NAAQS of 75 ppb. U.S. EPA redesignated the county as a maintenance are on May 14, 2019 (84 FR 21253).
5. Lead (Section 5.5): On May 31, 2017 (82 FR 24871), U.S. EPA redesignated a portion
of Cuyahoga County as a maintenance area for the 2008 lead NAAQS of 0.15 µg/m3.
6. Nitrogen Dioxide (Section 5.6): All counties in Northeast Ohio are in unclassifiable/attainment for the 2010 One-Hour nitrogen dioxide NAAQS of 100 ppb.
Air Quality Trends: Northeast Ohio’s historic reliance on manufacturing, heavy industry, coal-fired electricity generation, and single-occupancy vehicles has contributed to the region’s legacy air pollution. Air quality has improved significantly in Northeast Ohio in recent years (see Chapter 4); however, as U.S. EPA continues to strengthen the NAAQS to protect public and environmental health, portions of the region remain in nonattainment for one or more of the NAAQS. Despite the region’s history of heavy industry and coal-fired electricity generation, transportation is the primary driver of Northeast Ohio’s air quality issues. On-road vehicles continue to generate a plurality (31.6%) of emissions of criteria pollutants. Additionally, two of the pollutants most closely linked to mobile emissions—ozone (O3) and fine particulate matter (PM2.5)—have declined by smaller margins. Accordingly, transportation infrastructure and mode choice remain intricately linked to regional air quality.

2
1. Introduction In 1970, the United States Congress passed its first round of amendments to the existing federal Clean Air Act (CAA), significantly reforming the way that the United States regulates air quality and pollution. The CAA (40 C.F.R. § 50), which was last amended in 1990, requires the U.S. EPA to set National Ambient Air Quality Standards (NAAQS) for pollutants considered harmful to public health and the environment. The CAA identifies two types of national ambient air quality standards. Primary standards protect public health, including the health of sensitive populations such as asthmatics, children, and the elderly. Secondary standards protect public welfare against decreased visibility and damage to animals, crops, vegetation, and buildings.
Table 1: Summary of National Ambient Air Quality Standards (2019)
Source: U.S. EPA, www.epa.gov/air/criteria.html (accessed February 15, 2021).
Pollutant (final rule cite)
Primary or Secondary Standard
Averaging Time Level Form
Carbon Monoxide (76 FR 54294, August 31, 2011)
Primary Eight-Hour 9 ppm Not to be exceeded more
than once per year One-Hour 35 ppm
Lead (73 FR 66964, November 12, 2008)
Primary & Secondary
Rolling 3-month average
0.15 μg/m3 Not to be exceeded
Nitrogen Dioxide (75 FR 6474, February 9, 2010) (61 FR 52852, October 8, 1996)
Primary One-Hour 100 ppb 98th percentile, average over three years
Primary & Secondary Annual 53 ppb Annual mean
Ozone (80 FR 65291, October 27, 2015)
Primary & Secondary Eight-Hour 70 ppb
Annual fourth-highest daily maximum Eight-Hour concentration, averaged over three years
Particle Pollution (78 FR 3085, January 13, 2013)
PM2.5
Primary Annual 12 μg/m3 Annual mean, averaged over three years
Secondary Annual 15 μg/m3 Annual mean, averaged over three years
Primary & Secondary 24-Hour 35 μg/m3 98th percentile, averaged
over three years
PM10 Primary & Secondary 24-Hour 150
μg/m3
Not to be exceeded more than once per year, on average over three years
Sulfur Dioxide (75 FR 35520, June 22, 2010) (38 FR 25678, September 14, 1973)
Primary One-Hour 75 ppb
99th percentile of One-Hour daily maximum concentrations, averaged over three years
Secondary three-hour 0.5 ppm Not to be exceeded more than once per year

3
In response to the CAA, U.S. EPA created NAAQS for six principal pollutants, called the criteria pollutants because the NAAQS are based on human and environmental health criteria. The current NAAQS are listed in Table 1 above. Units of measure are parts per million (ppm) and parts per billion (ppb) by volume and micrograms per cubic meter of air (µg/m3).
Under the CAA, U.S. EPA must periodically revisit these standards. Section 109(d)(1) states that, effective December 31, 1980, U.S. EPA must complete a thorough review of each NAAQS every five years. If appropriate, U.S. EPA must revise the standards to protect public health and the environment.1 The CAA also called for the creation of an independent scientific review panel—the Clean Air Scientific Advisory Committee (CASAC)—to complete this review and advise the U.S. EPA Administrator.2 Once U.S. EPA, in concert with CASAC and other stakeholder groups, completes its scientific review for a given NAAQS, the agency undertakes a rulemaking process, ultimately setting a new standard for the pollutant. The CAA stipulates that U.S. EPA must set standards that “allowing an adequate margin of safety, are requisite to protect the public health.”3 U.S. EPA most recently completed this process when it strengthened the existing NAAQS for ground-level ozone (O3) to 70 ppb from 75 ppb on October 26, 2015 (80 FR 65291). Within two years of the promulgation of a new NAAQS, U.S. EPA must determine whether regions comply with the standard. Taking input from states and tribes, U.S. EPA designates whether areas meet the standard (attainment areas) or do not meet the standard (nonattainment areas). U.S. EPA typically bases its final area designations on the following five factors:4
1. Air quality data 2. Emissions and emissions-related data 3. Meteorology 4. Geography/Topography 5. Jurisdictional Boundaries
Within 18 to 36 months of the designation, states must submit State Implementation Plans (SIPs) for all nonattainment areas within their borders. The Ohio EPA is responsible for developing SIPs, in coordination with appropriate agencies within the nonattainment area and based upon public input. Once approved by U.S. EPA, these SIPs identify the means by which the nonattainment area will come into compliance with the NAAQS by its specific attainment date.5 For certain pollutants, like O3, the attainment date is based upon the severity of the nonattainment area’s designation. These dates can range from three years for the least severe areas (Marginal) to 20 years for the most severe areas (Extreme).6 Once a nonattainment area has attained the relevant NAAQS, U.S. EPA will redesignate it as a “Maintenance” area.7 For all maintenance areas in Ohio, the Ohio EPA must develop a 10-year Maintenance Plan, which identifies the necessary measures to ensure that the area will remain in attainment of the NAAQS and avoid backsliding.8 Once an area is designated nonattainment for a given NAAQS, it can never be in attainment; it will remain in maintenance status until the NAAQS is rescinded. 1 42 Code of Federal Regulations (C.F.R.) §7409(d)(1). 2 Ibid., (d)(2). 3 Ibid., (b)(1). 4 U.S. EPA, “Area Designations for the 2020 Annual Fine Particle (PM2.5) Standard: Designations Guidance and Data,” https://www3.epa.gov/pmdesignations/2012standards/techinfo.htm (accessed February 15, 2021). 5 42 C.F.R. §7502(a)(2). 6 Ibid., §7511(a)(1). 7 Ibid., §7407(d)(3)(E). 8 U.S. EPA, “Area Designations for the 2012 Annual Fine Particle (PM2.5) Standard.”

4
2. National Ambient Air Quality Standards (NAAQS) Attainment Status in Northeast Ohio
This section summarizes information on air quality within the NOACA air quality planning area (Ashtabula, Cuyahoga, Geauga, Lake, Lorain, Medina, Portage, and Summit counties).
Table 2: Attainment Status for NAAQS in Northeast Ohio (2019)
Source: U.S. EPA, Green Book, https://www.epa.gov/green-book (accessed February 15, 2021).
Pollutant Recent Trend Direction
Designated Attainment Status
Counties in Nonattainment
Major Contributing Sources
Ozone (Eight-Hour)
Stable Nonattainment (Marginal)
Cuyahoga, Geauga, Lake, Lorain, Medina, Portage, Summit
Automobiles, Industry, Utilities, Solvents, Paints, Other Fossil Fueled Engines
Coarse Particulate Matter (24-Hour)
Stable Maintenance None
Automobiles, Industry, Construction Sites, Tilled Fields, Unpaved Roads, Stone Crushing, and Wood Burning
Fine Particulate Matter (24-Hour)
Decreasing Maintenance None
Automobiles, Industry, Construction Equipment, Ships, Trains, Road Salt, Dirt, and Burning of Wood
Fine Particulate Matter (Annual)
Decreasing Maintenance None
Automobiles, Industry, Construction Equipment, Ships, Trains, Road Salt, Dirt, and Burning of Wood
Carbon Monoxide (One-Hour)
Stable Maintenance None
Automobiles, Non-Road Vehicles, Steel Mills, Other Combustion Sources
Carbon Monoxide (Eight-Hour)
Stable Maintenance None
Automobiles, Non-Road Vehicles, Steel Mills, Other Combustion Sources
Sulfur Dioxide (One-Hour)
Decreasing Maintenance Lake Electric Utilities and Other Industrial Combustion Sources
Nitrogen Dioxide Stable Unclassifiable/
Attainment None
Automobiles, Electric Utilities and Other Industrial, Commercial, and Residential Combustion
Lead Stable Maintenance None Metal Processing Plants

5
2.1 Attainment Status Summary for Northeast Ohio
1. Ozone (O3): On May 21, 2012, U.S. EPA designated Ashtabula, Cuyahoga, Geauga, Lake, Lorain, Medina, Portage, and Summit counties as a marginal nonattainment area for the 2008 Eight-Hour ozone NAAQS of 75 ppb (77 Federal Register (FR) 30088). U.S. EPA redesignated the region to maintenance on January 6, 2017, based upon 2013-2015 monitor data (82 FR 1603). On October 26, 2015, U.S. EPA strengthened the Eight-Hour ozone NAAQS to 70 ppb (80 FR 65291), a standard that took effect December 28, 2015. EPA subsequently designated Cuyahoga, Geauga, Lake, Lorain, Medina, Portage, and Summit counties as a marginal nonattainment area on April 30, 2018 (83 FR 25776).9
2. Particulate Matter: • Coarse Particles (PM10): Cuyahoga County was redesignated as a maintenance area
for the 1987 PM10 NAAQS, effective January 10, 2001 (65 FR 77308).
• Fine Particles (PM2.5): In December 2009, U.S. EPA designated Cuyahoga, Lake, Lorain, Medina, Portage and Summit counties as nonattainment areas for the 2006 24-Hour PM2.5 NAAQS of 35 µg/m3 (74 FR 58688). U.S. EPA redesignated Ashtabula Township and Cuyahoga, Lake, Lorain, Medina, Portage, and Summit counties from nonattainment to maintenance on September 18, 2013 (78 FR 57270), based on monitoring data.10 U.S. EPA strengthened the annual PM2.5 NAAQS to 12 µg/m3 on January 15, 2013 (79 FR 3085). Both Cuyahoga and Lorain Counties were designated as nonattainment areas effective April 15, 2015. However, Cuyahoga and Lorain Counties were redesignated as maintenance areas effective April 12, 2019 (84 FR 14881).
3. Carbon Monoxide (CO): Cuyahoga County remains in maintenance status for CO, a
designation promulgated on July 12, 1993 (58 FR 37453). The rest of Northeast Ohio is in unclassifiable/attainment status.
4. Sulfur Dioxide (SO2): On August 5, 2013, U.S. EPA designated Lake County as a nonattainment area for the 2010 One-Hour sulfur dioxide NAAQS of 75 ppb. U.S. EPA redesignated the county as a maintenance are on May 14, 2019 (84 FR 21253).
5. Lead (Pb): On May 31, 2017 (82 FR 24871), U.S. EPA redesignated a small area in
Cuyahoga County as a maintenance area for the 2008 lead NAAQS of 0.15 µg/m3.11 The rest of Northeast Ohio is in unclassifiable/attainment status.
6. Nitrogen Dioxide (NO2): All counties in Northeast Ohio are in unclassifiable/attainment
for the 2010 One-Hour NO2 NAAQS of 100 ppb (77 FR 9532).
9 Based on the recommendations of Ohio EPA, U.S. EPA did not include Ashtabula County as part of the 2015 O3 nonattainment area, as it had in the past. Both agencies agreed that Ashtabula County does not contribute to the formation of O3 pollution at the locations in excess of the NAAQS. 10 In its nonattainment designation for the 2006 PM2.5 NAAQS, U.S. EPA listed Ashtabula County as unclassifiable/attainment. However, when it redesignated Northeast Ohio to maintenance status in 2013, the Agency included Ashtabula Township in the maintenance area. 11 Please refer to page 52 of this report for a description of the lead maintenance area.
6
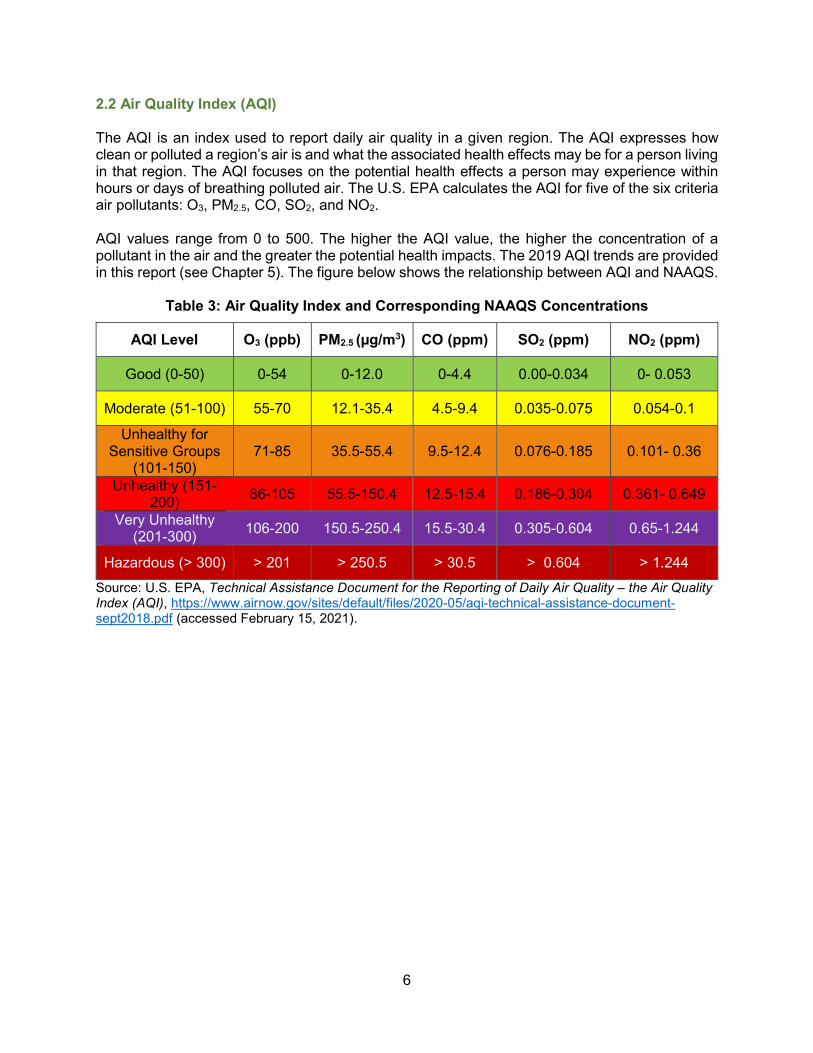
2.2 Air Quality Index (AQI) The AQI is an index used to report daily air quality in a given region. The AQI expresses how clean or polluted a region’s air is and what the associated health effects may be for a person living in that region. The AQI focuses on the potential health effects a person may experience within hours or days of breathing polluted air. The U.S. EPA calculates the AQI for five of the six criteria air pollutants: O3, PM2.5, CO, SO2, and NO2. AQI values range from 0 to 500. The higher the AQI value, the higher the concentration of a pollutant in the air and the greater the potential health impacts. The 2019 AQI trends are provided in this report (see Chapter 5). The figure below shows the relationship between AQI and NAAQS.
Table 3: Air Quality Index and Corresponding NAAQS Concentrations
AQI Level O3 (ppb) PM2.5 (µg/m3) CO (ppm) SO2 (ppm) NO2 (ppm)
Good (0-50) 0-54 0-12.0 0-4.4 0.00-0.034 0- 0.053
Moderate (51-100) 55-70 12.1-35.4 4.5-9.4 0.035-0.075 0.054-0.1
Unhealthy for Sensitive Groups
(101-150) 71-85 35.5-55.4 9.5-12.4 0.076-0.185 0.101- 0.36
Unhealthy (151-200) 86-105 55.5-150.4 12.5-15.4 0.186-0.304 0.361- 0.649
Very Unhealthy (201-300) 106-200 150.5-250.4 15.5-30.4 0.305-0.604 0.65-1.244
Hazardous (> 300) > 201 > 250.5 > 30.5 > 0.604 > 1.244
Source: U.S. EPA, Technical Assistance Document for the Reporting of Daily Air Quality – the Air Quality Index (AQI), https://www.airnow.gov/sites/default/files/2020-05/aqi-technical-assistance-document-sept2018.pdf (accessed February 15, 2021).

7
3. Mobile Emissions and Transportation Conformity Mobile emissions, those that stem from the transportation sector, account for a significant share of air pollution in the United States, particularly in urban areas. According to U.S. EPA, mobile sources make up the majority of nitrogen oxides (NOx) emissions and the largest share of carbon monoxide (CO) emissions nationwide.12 Prior to the U.S. ban on the use of lead in gasoline, mobile sources also accounted for the vast majority of airborne lead.13 Traffic-related air pollution (TRAP) can be particularly harmful for human health for two key reasons. First, TRAP emission sources are in close proximity to where people live. TRAP emissions also occur at a lower height, making them easier to inhale than emissions from smokestacks.14 Second, TRAP can contain certain pollutants that are particularly harmful for human health. Black carbon, which makes up a significant share of particle pollution from vehicles, can be up to 16 times worse for human health than PM2.5 generally.15 U.S. EPA has implemented a number of regulations to reduce mobile emissions since the passage of the CAA. These include restrictions on the amount of pollution vehicles can emit per mile, such as the Tier 3 Motor Vehicle Emissions and Fuel Standards (79 FR 23414), and guidelines for vehicle fuel economy, chiefly the corporate average fuel economy (CAFE) standards. To ensure that federal transportation investments neither worsen air quality, nor interfere with a region’s ability to attain and maintain the NAAQS, the 1977 Clean Air Act Amendments (CAAA) introduced the concept of transportation conformity. Under this provision, a region’s transportation plans, programs, and projects must not create new NAAQS violations, increase the frequency or severity of existing NAAQS violations, or delay a region’s attainment of the NAAQS.16 Under existing law, metropolitan planning organizations (MPOs) such as NOACA, must demonstrate their 20-year long-range transportation plans (LRTPs) and three-year transportation improvement programs (TIPs) conform to the NAAQS. This process is known as a conformity determination.17 When developing SIPs, MPOs work in coordination with state officials to create a motor vehicle emissions budget (MVEB) that details the portion of total allowable emissions allocated to on-road mobile sources, such as cars, trucks, and buses. MVEBs define the total level of on-road emissions that an area can generate while still meeting the goals laid out in the SIP.18 Through its conformity demonstration, NOACA must prove that projected on-road mobile emissions within the region will not exceed the MVEB contained in the SIP. 12 U.S. EPA, “Air Pollutant Emissions Trends Data,” https://www.epa.gov/sites/production/files/2018-04/national_tier1_caps.xlsx (accessed February 15, 2021). 13 U.S. EPA, “Basic Information about Lead Air Pollution,” https://www.epa.gov/lead-air-pollution/basic-information-about-lead-air-pollution#how (accessed February 15, 2021). 14 Transport & Environment, Don’t Breathe Here: Beware the Invisible Killer (London: Transport & Environment, 2015), https://www.transportenvironment.org/sites/te/files/publications/Dont_Breathe_Here_exec_summary_FINAL.pdf (accessed February 15, 2021). 15 World Health Organization (WHO), Reducing global health risks through mitigation of short-lived climate pollutants (Geneva: WHO, 2015), http://www.who.int/phe/publications/climate-reducing-health-risks/en/ (accessed February 15, 2021). 16 42 C.F.R. §7506 (c)(2). 17 Federal Highway Administration (FHWA), Transportation Conformity: A Basic Guide for State and Local Officials (Washington, D.C.: FHWA, 2010), https://www.fhwa.dot.gov/environment/air_quality/conformity/guide/ (accessed February 15, 2021). 18 Ibid.

8
If a region fails to meet this requirement, it may be classified as “in a conformity lapse.” If a region fails to address a conformity lapse, the Federal Highway Administration (FHWA) may impose restrictions on the area. These restrictions can include the freezing of federal transportation funding, in the most extreme cases. To date, NOACA has never experienced a conformity lapse. Both NOACA’s current LRTP, Aim Forward 2040, and its current TIP, which covers state fiscal years (SFY) 2021-2024, conform to the requirements laid out in the region’s SIPs.19
19 NOACA, Aim Forward 2040 (Cleveland: NOACA, 2017), https://www.noaca.org/regional-planning/major-planning-documents/aim-forward-2040 (accessed February 15, 2021). NOACA, SFYs 2021-2024 Transportation Improvement Program (Cleveland, NOACA: 2020), https://www.noaca.org/home/showpublisheddocument?id=25165 (accessed February 15, 2021).

9
4. Air Quality and Public Health As noted earlier, the CAA requires U.S. EPA to set NAAQS that “are requisite to protect the public health.” This statement alludes to the substantial public health burden that air pollution poses. Air pollution is connected to a host of health issues, including respiratory illnesses (e.g. asthma, bronchitis, and emphysema); pre- and neonatal health risks, including low birthweight, premature birth, and infant mortality; stroke; heart disease, including heart attacks; behavioral conditions, such as attention deficit hyperactivity disorder (ADHD); cognitive issues, including IQ decrements and dementia; lung cancer; and premature death.20 According to the World Health Organization (WHO), ambient air pollution is responsible for an annual 4.2 million deaths worldwide.21 While the majority of these premature deaths occur in the developing world, the U.S. bears a major health burden from air pollution. To quantify these impacts for Northeast Ohio, NOACA utilized U.S. EPA’s Co-Benefits Risk Assessment (COBRA) Health Impacts Screening and Mapping Tool. To develop these estimates, staff created a scenario using 2016 as the analysis year and zeroed out emissions from all sources. Table 4, below, details the total costs and certain public health impacts of pollutants emitted in the NOACA region during 2016.
Table 4: Public Health Impacts of Air Pollutant Emissions in the NOACA Region, 2016
Type of Impact Incidence Total Cost (2016 $)
Mortality (low estimate) 639 deaths $6.8 billion
Mortality (high estimate) 1,439 deaths $15.3 billion
Infant Mortality 4 deaths $41.2 million
Nonfatal heart attacks (low estimate) 60 heart attacks $9.9 million
Nonfatal heart attacks (high estimate) 546 heart attacks $89.8 million
Respiratory Hospital Admissions 136 admissions $4.9 million
ER Visits for Asthma 284 visits $159,913
Minor Restricted Activity Days 381,132 days $33.1 million
Lost Work Days 63,606 days $12.7 million
Asthma Exacerbations 12,975 attacks $952,894
Total Health Costs (low estimate)a $6.9 billion
Total Health Costs (high estimate)a $15.5 billion a Total costs do not include all health impacts and are therefore greater than the sum of the individual impacts. Source: NOACA estimates using U.S. EPA’s COBRA model
20 For further information on the public health effects of air pollution, consult the U.S. EPA’s Integrated Science Assessments on the criteria air pollutants at https://www.epa.gov/isa (accessed February 15, 2021). 21 A.J. Cohen, et al, “Estimates and 25-year trends of the global burden of disease attributable to ambient air pollution: an analysis of data from the Global Burden of Diseases Study 2015,” The Lancet, 389 (2017), 1907-1918.
10
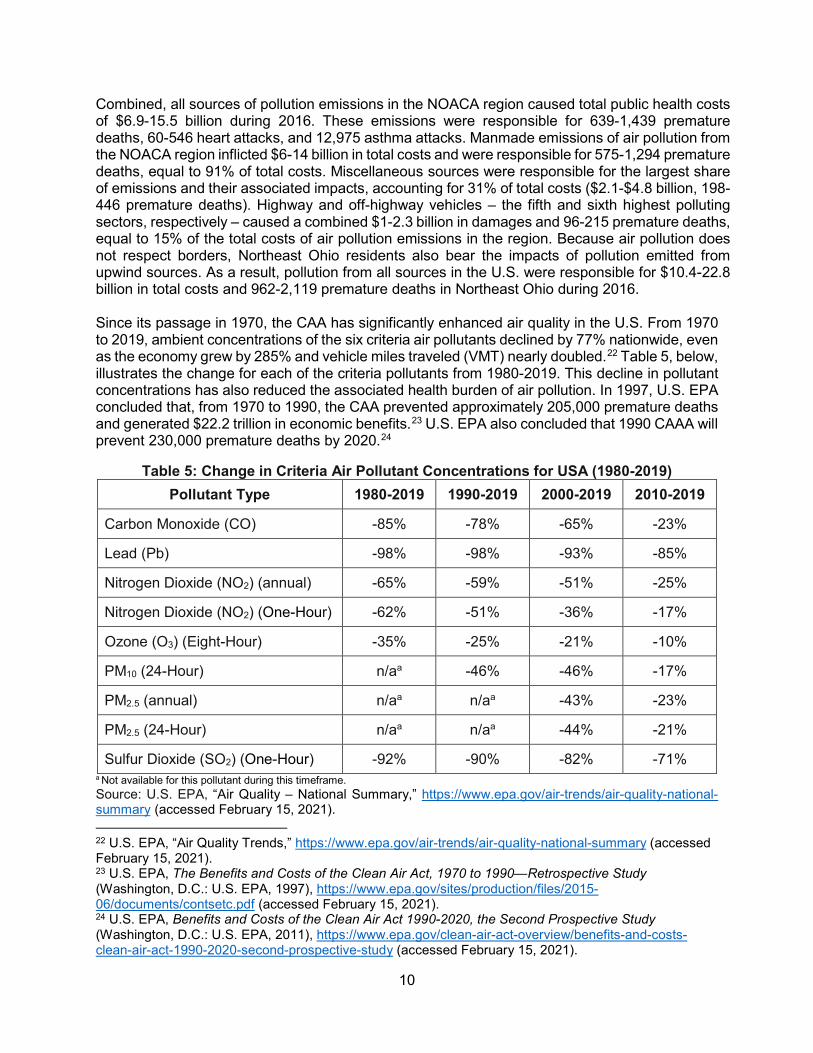
Combined, all sources of pollution emissions in the NOACA region caused total public health costs of $6.9-15.5 billion during 2016. These emissions were responsible for 639-1,439 premature deaths, 60-546 heart attacks, and 12,975 asthma attacks. Manmade emissions of air pollution from the NOACA region inflicted $6-14 billion in total costs and were responsible for 575-1,294 premature deaths, equal to 91% of total costs. Miscellaneous sources were responsible for the largest share of emissions and their associated impacts, accounting for 31% of total costs ($2.1-$4.8 billion, 198-446 premature deaths). Highway and off-highway vehicles – the fifth and sixth highest polluting sectors, respectively – caused a combined $1-2.3 billion in damages and 96-215 premature deaths, equal to 15% of the total costs of air pollution emissions in the region. Because air pollution does not respect borders, Northeast Ohio residents also bear the impacts of pollution emitted from upwind sources. As a result, pollution from all sources in the U.S. were responsible for $10.4-22.8 billion in total costs and 962-2,119 premature deaths in Northeast Ohio during 2016. Since its passage in 1970, the CAA has significantly enhanced air quality in the U.S. From 1970 to 2019, ambient concentrations of the six criteria air pollutants declined by 77% nationwide, even as the economy grew by 285% and vehicle miles traveled (VMT) nearly doubled.22 Table 5, below, illustrates the change for each of the criteria pollutants from 1980-2019. This decline in pollutant concentrations has also reduced the associated health burden of air pollution. In 1997, U.S. EPA concluded that, from 1970 to 1990, the CAA prevented approximately 205,000 premature deaths and generated $22.2 trillion in economic benefits.23 U.S. EPA also concluded that 1990 CAAA will prevent 230,000 premature deaths by 2020.24
Table 5: Change in Criteria Air Pollutant Concentrations for USA (1980-2019)
Pollutant Type 1980-2019 1990-2019 2000-2019 2010-2019
Carbon Monoxide (CO) -85% -78% -65% -23%
Lead (Pb) -98% -98% -93% -85%
Nitrogen Dioxide (NO2) (annual) -65% -59% -51% -25%
Nitrogen Dioxide (NO2) (One-Hour) -62% -51% -36% -17%
Ozone (O3) (Eight-Hour) -35% -25% -21% -10%
PM10 (24-Hour) n/aa -46% -46% -17%
PM2.5 (annual) n/aa n/aa -43% -23%
PM2.5 (24-Hour) n/aa n/aa -44% -21%
Sulfur Dioxide (SO2) (One-Hour) -92% -90% -82% -71% a Not available for this pollutant during this timeframe. Source: U.S. EPA, “Air Quality – National Summary,” https://www.epa.gov/air-trends/air-quality-national-summary (accessed February 15, 2021). 22 U.S. EPA, “Air Quality Trends,” https://www.epa.gov/air-trends/air-quality-national-summary (accessed February 15, 2021). 23 U.S. EPA, The Benefits and Costs of the Clean Air Act, 1970 to 1990—Retrospective Study (Washington, D.C.: U.S. EPA, 1997), https://www.epa.gov/sites/production/files/2015-06/documents/contsetc.pdf (accessed February 15, 2021). 24 U.S. EPA, Benefits and Costs of the Clean Air Act 1990-2020, the Second Prospective Study (Washington, D.C.: U.S. EPA, 2011), https://www.epa.gov/clean-air-act-overview/benefits-and-costs-clean-air-act-1990-2020-second-prospective-study (accessed February 15, 2021).

11
Table 6, below, charts the change in concentrations of the criteria air pollutants from 1990-2019 in the Akron, Cleveland, Columbus, and Cincinnati metropolitan areas. Air quality has improved dramatically in Ohio since 1990; however, this rate of improvement has slowed since 2010, mirroring the national trend.25 While the overall downward trajectory has continued, there are annual variations in the concentrations of various pollutants, including increases in certain pollutants from one year to the next. Northeast Ohio has directly benefited from the long-term decreases in pollutant levels. One recent analysis found that, since 1970, air quality improvements associated with the CAA have extended the average life expectancy of people within the region by 2.3 years.26 More recent reductions in pollution concentrations have also improved public health. According to a study from the Natural Resources Defense Council, air pollution reductions tied to the 1990 CAAA will prevent 2,153-4,308 premature deaths in the NOACA region during 2020. This number will increase to 2,565 -5,132 by 2030.27 These improvements have had other clear benefits, as well. Due largely to regulations on tailpipe emissions, transportation-related NO2 pollution has fallen considerably. As a result, the number of childhood asthma cases in the NOACA region fell by 42.6% from 2000 to 2010.28
25 Z. Jian et al, “Unexpected slowdown of US pollutant emission reduction in the past decade,” Proceedings of the National Academy of Sciences 115, 20 (2018), 5099-5014. 26 M. Greenstone, “The Connection Between Cleaner Air and Longer Lives,” The New York Times, http://www.nytimes.com/2015/09/25/upshot/the-connection-between-cleaner-air-and-longer-lives.html?_r=1 (accessed November 1, 2019). 27 J. Price, S. Gulati, J. Lehr, and S. Penn, The Benefits and Costs of U.S. Air Pollution Regulations (Cambridge, MA: Industrial Economics, Inc., 2020), https://www.nrdc.org/sites/default/files/iec-benefits-costs-us-air-pollution-regulations-report.pdf (accessed February 15, 2021). 28 R. Alotaibi, M. Bechle, J.D. Marshall, T. Ramani, J. Zietsman, M.J. Nieuwenhuijsen, and H. Khreis, “Traffic related air pollution and the burden of childhood asthma in the contiguous United States in 2000 and 2010,” Environment International 127 (2019), 858-867.

12
Table 6: Change in Criteria Air Pollutant Concentrations for Ohio Metropolitan Areas
a Not available for the Akron or Columbus metropolitan areas for this pollutant. b Not available for the Akron metropolitan areas for this pollutant. c Not available for the Columbus metropolitan areas for this pollutant. d Not available for this pollutant during this timeframe. Source: U.S. EPA, “Air Quality Statistics Report,” https://www.epa.gov/outdoor-air-quality-data/air-quality-statistics-report (accessed February 15, 2021).
Pollutant Type Metropolitan Area 1990-2019 2000-2019 2010-2019
Carbon Monoxide (CO)b
Cleveland -65% -71% -34%
Columbus -79% -64% -41%
Cincinnati -67% -33% +78%
Nitrogen Dioxide (NO2) (One-Hour a
Cleveland -48% -26% -22%
Cincinnati -44% -20% -9%
Ozone (O3) (Eight-Hour)
Akron -27% -22% -11%
Cleveland -16% -7% -8%
Columbus -24% -20% -7%
Cincinnati -22% -12% -5%
PM10 (24-Hour)b
Cleveland -5% +33% +70%
Columbus -57% -47% -69%
Cincinnati +31% +84% +130%
PM2.5 (annual)
Akron n/ad -44% -27%
Cleveland n/ad -37% -12%
Columbus n/ad -45% -21%
Cincinnati n/ad -29% -12%
Sulfur Dioxide (SO2) (One-Hour)c
Akron -98% -98% -89%
Cleveland -84% -65% -52%
Cincinnati -5% -25% +35%

13
5. Trends for the Six Criteria Air Pollutants in Northeast Ohio
This chapter details the trends for each of the six criteria air pollutants in Northeast Ohio. It includes information on the properties of the pollutants, their effects on public health, their formation, and their major sources within the region. This section also provides further detail on the region’s attainment status for each pollutant, as well as information on the air quality monitoring network operating within Northeast Ohio. Data on Tier 1 emissions sources and quantities are from U.S. EPA’s 2017 National Emissions Inventory, the most recent year for which data are available. As noted in Chapter 4, air quality has improved dramatically within the NOACA air quality planning region over the past four decades. However, because this rate of improvement has slowed and the U.S. EPA has continued to strengthen several of the NAAQS to reflect new scientific evidence on the impacts of air pollution, portions of the eight-county area remain in nonattainment for O3. Transportation is the primary driver of the region’s air quality issues, with on-road vehicles representing a plurality of total criteria pollutant emissions. Two of the pollutants most closely tied to mobile emissions –O3 and PM2.5—are closely linked to mobile emissions. Ambient levels of these pollutants have fallen by a smaller margin than the other pollutants of concern since 1990, as documented in Table 6. Accordingly, transportation infrastructure and modal choice will continue to be intricately linked to the quality of the region’s air in the coming years. Given the importance of O3 and PM2.5 to air quality in Northeast Ohio, the first two sections of this chapter focus on these two pollutants. The discussion then shifts to the SO2, for which Lake County was recently redesignated to maintenance. The final three sections examine CO, Pb, and NO2. 5.1 Ground-Level Ozone (O3) Properties: Ground-level, or tropospheric, ozone (O3) forms when ultraviolet radiation in the atmosphere splits nitrogen oxide (NOx) into nitric oxide (NO) and an oxygen atom (O). This oxygen atom is then able to join with an oxygen molecule (O2) to form O3. Volatile organic compounds (VOCs) play an important role in this process, as they help facilitate the continual production of O3 in the atmosphere.29 Accordingly, NOx and VOCs are called O3 precursors. Motor vehicle exhaust, industrial emissions, and chemical solvents are the major anthropogenic sources of these precursors. Although they often originate in urban areas, winds can carry these precursor chemicals hundreds of miles. Additionally, O3 production takes several hours, so that maximum O3 concentrations typically occur downwind from primary emissions sources. In Northeast Ohio, the prevailing winds are southwest to northeast, meaning that O3 precursor emissions from Cuyahoga and Summit Counties often form O3 in Lake and Geauga counties. While urban areas are typically VOC-limited (that is, O3 production is more contingent upon the availability of VOC emissions), most rural areas are NOx-limited.30 O3 can irritate the respiratory system, causing coughing, irritation in the throat, or a burning sensation in the airways. It can reduce lung function, with feelings of chest tightness, wheezing, or shortness of breath. O3 can aggravate asthma and trigger asthma attacks. People at greater
29 U.S. EPA, Guideline on Ozone Monitoring Site Selection (Research Triangle Park, NC: U.S. EPA, 1998). 30 U.S. EPA, Final Ozone NAAQS Regulatory Impact Analysis (Research Triangle Park, NC: U.S. EPA, 2008), 2-1, http://www.epa.gov/ttnecas1/regdata/RIAs/452_R_08_003.pdf, (accessed February 15, 2021).

14
risk from ground-level O3 are those with respiratory conditions, such as asthma and emphysema, and children and adults who are active outdoors.31 Ground-level O3 levels are highest in cities with high levels of automobile traffic during daylight hours in the summer months. Decreases in atmospheric NOx and VOCs generally result in decreases of O3 formed under a given set of conditions. Because the actual ambient O3 concentration is strongly dependent upon weather conditions (including maximum daily temperatures, cloud cover, wind speed, and wind direction), reductions in O3 concentrations based on reductions in precursors are difficult to predict until sufficient data have been accumulated to allow for the removal of weather effects. As the O3 NAAQS has tightened, it has become more difficult to forecast O3 formation. Sources: O3 levels can be modulated indirectly by cutting NOx and VOC emissions. Significant NOx sources include cars; trucks; ships; trains; non-road equipment powered by fossil fuels; and industries, such as electric utilities, that combust fossil fuels. Significant sources of VOCs include solvents, such as dry cleaning, degreasing, and surface coatings; cars; non-road vehicles, such as aircraft, boats, lawn care equipment, and railroads; and gasoline distribution facilities. VOCs can also come from natural (biogenic) sources, including trees and other vegetation. Figure 1 breaks down the main sources of VOCs in Northeast Ohio during 2017.32
31 U.S. EPA, Smog—Who Does It Hurt? What You Need to Know About Ozone and Your Health (Washington, D.C.: U.S. EPA, 1999), http://epa.gov/airquality/ozonepollution/pdfs/smog.pdf. 32 For data on the primary sources of NOx, consult Figure 32 on page 60.

15
Figure 1: 2017 VOC Emissions Inventory for Northeast Ohio
Source: U.S. EPA, 2017 National Emissions Inventory, https://www.epa.gov/air-emissions-inventories/2017-national-emissions-inventory-nei-data (accessed February 15, 2021).
Chemical & Allied Product Manufacturing
2.61%
Fuel Combustion -Electric Utility
0.08%
Fuel Combustion -
Industrial0.16%
Fuel Combustion -Other2.77%
Highway Vehicles12.59% Metals
Processing0.23%
Miscellaneous0.33%
Natural Resources
23.47%
Off-Highway9.65%
Other Industrial Processes
0.94%
Petroleum & Related Industries
2.03%
Solvent Utilization35.71%
Storage & Transport8.29%
Waste Disposal & Recycling
1.14%
0 5,000 10,000 15,000 20,000 25,000 30,000 35,000
Ashtabula
Cuyahoga
Geauga
Lake
Lorain
Medina
Portage
Summit
Tons of VOC Emissions

16
NAAQS and Nonattainment Status: The full timeline of O3 NAAQS revisions is shown in Figure 2. On March 12, 2008, U.S. EPA promulgated revised Eight-Hour primary and secondary O3 NAAQS (73 FR 16436). The 2008 Eight-Hour O3 NAAQS was 75 ppb. On April 30, 2012, U.S. EPA issued the final area designations under the 2008 standards using the certified air quality data from 2008 to 2010. U.S. EPA classified Northeast Ohio counties (Ashtabula, Cuyahoga, Geauga, Lake, Lorain, Medina, Portage, and Summit) as a marginal nonattainment area. Because O3 is readily transported throughout a region, U.S. EPA classifies the entire regional airshed as the O3 nonattainment area even if only one monitor in one county registers exceedance concentrations. The region’s attainment date for 2008 area designations was July 20, 2015; however, U.S. EPA granted the region a one-year extension on May 4, 2016 (81 FR 26697). On January 6, 2017 (82 FR 1603), U.S. EPA formally redesignated the region to maintenance for the 2008 NAAQS, based upon 2013-2015 monitor data. On October 26, 2015, U.S. EPA strengthened the existing O3 NAAQS from 75 ppb to 70 ppb (80 FR 65291). U.S. EPA issued nonattainment designations on April 30, 2018 (83 FR 25776). Based upon monitor data from 2014 to 2016, the Agency designated Northeast Ohio (the counties of Cuyahoga, Geauga, Lake, Lorain, Medina, Portage, and Summit) as a marginal nonattainment area, a designation that took effect on August 3, 2018. The attainment date is August 3, 2021.
Figure 2: Timeline of Revisions to Ozone NAAQS, 1971-2019
Control Measures: The Ohio EPA is responsible for submitting SIPs for all regions within the state. Please visit the Ohio EPA website to review the relevant O3 SIPs for Northeast Ohio: http://www.epa.ohio.gov/dapc/SIP/ozone.aspx. In 2005, NOACA convened a public participation process—headed by the NOACA Air Quality Public Advisory Task Force—that generated recommendations to Ohio EPA for inclusion in the SIP for the Eight-Hour O3 NAAQS. The NOACA Board of Directors modified the recommendations and submitted them to the Ohio EPA in 2006.33 To date, Ohio EPA has acted upon more than half of the NOACA recommendations. NOACA also encourages localities to implement those recommendations that do not require a state action, such as municipal anti-idling ordinances. In
33 NOACA, Final Report of the NOACA Air Quality Public Advisory Task Force on the Eight-Hour Ozone SIP Options (Cleveland: NOACA, 2006), http://www.noaca.org/modules/showdocument.aspx?documentid=654 (accessed February 15, 2021).
1971: 1-hr. average 80 ppb
1979: 1-hr. average 120 ppb
1993: 120 ppb retained
1997: 8-hr. average 80 ppb
2008: 8-hr. average 75 ppb
2015: 8-hr. average70 ppb
1965 1970 1975 1980 1985 1990 1995 2000 2005 2010 2015 2020
Time Line of Ozone NAAQS Revisions

17
February 2020, Ohio EPA indicated that Northeast Ohio was unlikely to attain the 2015 O3 NAAQS by the August 3, 2021, attainment date. Accordingly, the Agency suggested it was considering implementing additional emissions control measures (ECMs) to bring the region into compliance. In its capacity as the air quality planning agency for Northeast Ohio, NOACA plays a role in coordinating air quality monitoring, public outreach, and control efforts. Throughout the O3 monitoring season, which lasts 245 days (March 1 to October 31), NOACA forecasts Eight-Hour average O3 concentrations throughout the region. On days when ambient O3 levels are projected to exceed the NAAQS (currently 70 ppb), the agency issues an air quality advisory, encouraging Northeast Ohio residents, particularly those who belong to sensitive groups, to modify certain behaviors (e.g., walk, bike, or ride public transit versus drive alone) and limit their time outdoors. Monitoring: U.S. EPA provides clear guidelines on how regions should develop their monitoring networks for O3.34 Northeast Ohio’s O3 monitoring network was developed to meet these requirements. There are 12 operating O3 monitors in Northeast Ohio (Table 7 and Figure 3).
Table 7: Locations of Ozone Monitors in Northeast Ohio
Monitor County FIPS ID
Site ID Latitude Longitude Address
1 Ashtabula 7 1001 41.95 -80.57 Conneaut Water Plant
2
Cuyahoga 35
0034 41.55 -81.57 891 E. 152 St.
3 0060 41.49 -81.67 GT Craig, E. 14th St. & Orange Ave., Cleveland
4 0064 41.36 -81.86 Board of Education, 390 Fair St., Berea
5 5002 41.53 -81.45 6116 Wilson Road, Mayfield
6 Geauga 55 0004 41.51 -81.24 Notre Dame School, Munson
7 Lake 85
0003 41.67 -81.42 Jefferson School, Eastlake
8 0007 41.72 -81.24 177 Main St., Painesville
9 Lorain 93 0018 41.42 -82.09 Fire Station, Sheffield
10 Medina 103 0004 41.06 -81.92 Ballash Rd., Lafayette Twp.
11 Portage 133 1001 41.18 -81.33 1570 Ravenna Rd., Kent
12 Summit 153 0020 41.10 -81.50 800 Patterson Ave., Akron
Source: Ohio EPA, 2019-2020 Ohio Air Monitoring Network Plan, https://epa.ohio.gov/Portals/27/ams/sites/2019/2019-2020_AMNP_Main_Report_FINAL.pdf (accessed February 15, 2021).
34 U.S. EPA, Guideline on Ozone Monitoring Site Selection.

18
Figure 3: Northeast Ohio O3 Monitor Locations

19
Currently, U.S. EPA oversees three pollution monitoring networks: the State and Local Air Monitoring Stations (SLAMS), the National Air Monitoring Stations (NAMS), and the Photochemical Assessment Monitoring Stations (PAMS). Each network satisfies different monitoring requirements and serves a different purpose.35 SLAMS monitors fulfill four roles:
• Determine the highest concentrations of a given air pollutant expected to occur in the monitored area;
• Determine the representative concentrations of that pollutant in areas of high population density;
• Determine the impact of ambient pollution levels of significant pollutant sources or source categories; and
• Determine the general background concentration levels of the pollutant. NAMS is a broader, national monitoring network that includes a subset of SLAMS monitors in urban areas with populations of at least 200,000 people. NAMS networks must include at least two SLAMS monitors. PAMS, in turn, conduct enhanced, continuous air quality monitoring in nonattainment areas. Under current guidelines, U.S. EPA requires that O3 monitors be placed at the following locations:
• Maximum exposure sites: These are areas where the greatest population is expected to be exposed to high concentrations of O3, typically just downwind of an urbanized area.
• Maximum downwind concentration sites: These are the locations farther downwind of an urbanized area where O3 concentrations are likely to be highest, accounting for the direction of the prevailing wind and the amount of time it takes O3 to form.
• Upwind sites: These are sites located upwind of the air quality monitoring area, which enables officials to track background O3 levels and pollution entering the region.
• Maximum emissions sites: These are sites located immediately downwind of the main sources of O3 precursor emissions in the region, typically near the edge of the central business district.
In its 2015 revision to the O3 NAAQS (80 FR 65291), U.S. EPA revised its rules for both the O3 monitoring network and the O3 monitoring season. Previously, PAMS were required for those nonattainment areas designated as serious, severe, or extreme. U.S. EPA now requires PAMS be distributed across the country at 63 urban and 17 rural sites. Cleveland houses one of these monitors at the GT Craig site (see Table 7). This site will conduct continuous monitoring 365 days per year, though enhanced O3 monitoring will occur only from June through August. Trends: While Northeast Ohio has, at one point or another, been in nonattainment for each of the O3 NAAQS, it is far from the only metropolitan area that fits this description. According to U.S. EPA, there are currently 52 O3 nonattainment areas nationwide for the 2015 NAAQS; these areas include 205 total counties, which are home to more than 122 million people.36 However, as Chapter 4 notes, the region’s O3 levels have declined by only 16% since 1990, compared to a 25% decline nationally.
35 Consult 40 C.F.R. §58 for additional information. 36 U.S. EPA, “8-Hour Ozone (2015) Nonattainment Areas by State/County/Area,” https://www3.epa.gov/airquality/greenbook/jncty.html (accessed February 15, 2021).

20
While O3 concentrations within Northeast Ohio have declined over time, this trend has leveled off in recent years. This slow, long-term decrease is expected to continue into the future, as the U.S. EPA implements new and existing regulations, such as the Cross-State Air Pollution Rule (CSAPR, 76 FR 48208), greenhouse gas emissions standards for heavy-duty trucks (80 FR 40137), and the Tier 3 Motor Vehicle Emissions and Fuel Standards (79 FR 23414). Nevertheless, this downward trend is not guaranteed. O3 concentrations in Northeast Ohio have actually increased somewhat in six of eight counties since 2013-2015, and climate change threatens to exacerbate this trend, as detailed in Section 6. Figure 4 displays the number of days with Eight-Hour O3 exceedances from 2004-2019 in Northeast Ohio, based upon the NAAQS in place at the time. When a monitor records an ambient pollution concentration that exceeds the NAAQS, the event is classified as an exceedance. Red bars indicate years when the NAAQS was 85 ppb; blue bars 75 ppb; and green bars 70 ppb.
Figure 4: Number of Exceedance Days for the Eight-Hour Ozone NAAQS (2004-2019)37
Source: U.S. EPA, “Air Quality System” data, https://www.epa.gov/aqs (accessed February 15, 2021). O3 exceedances range from a low of one (1) day in 2013 to a high of 28 days in 2012. Exceedance days generally decreased prior to 2015, despite significant year-to-year variability. Nevertheless, this trend has reversed since 2016. Part of this reversal is due to U.S. EPA’s tightening of the O3 NAAWS to 70 ppb from 75 ppb. Comparing the number of days on which Northeast Ohio has exceeded the current NAAQS (70 ppb) during this period further demonstrates the long-term downward trend in O3 levels in the region. As Figure 5 shows, while the region experienced an average of 29 days above 70 ppb from 2004 to 2008, that average fell to just 9.8 days from 2015 to 2019. Nevertheless, the stricter NAAQS does not tell the whole story. Warmer weather during the O3 season since 2016, discussed further below, has also played a role in driving the observed increases in O3 levels in Northeast Ohio
37 For a list of the dates when exceedance days occurred, see Appendix A: Ozone Exceedance Days.
6
16
5
13 12
3
15 14
28
13 2
14
6
13
6
0
5
10
15
20
25
30
2004 2005 2006 2007 2008 2009 2010 2011 2012 2013 2014 2015 2016 2017 2018 2019
Num
ber o
f Exc
eeda
nces
Year

21
Figure 5: Number of Exceedance Days of the 70 ppb Ozone NAAQS (2004-2019)
Source: U.S. EPA, “Air Quality System” data, https://www.epa.gov/aqs (accessed February 15, 2021).
Hot, dry weather produces more exceedance days, while cool, rainy weather typically suppresses O3 formation. Northeast Ohio was warmer than normal during 2019. The average annual temperature was 50.8ºF, well above the 1981-2010 average of 49.2ºF. 2019 was tied for the eighth warmest year on record for the region (records date back to 1895).38 Because O3 is contingent on weather, changing weather patterns can obscure the impact of changes in emissions levels. Figure 6 addresses this issue by showing the average daily O3 level in Cleveland from May-September. The dashed red line shows the observed O3 levels, while the blue line shows what O3 levels would have been based only on emissions (i.e. controlling for weather). O3 would have fallen after 2015 if not for higher summertime temperatures during these years, though this effect has declined since that point. Controlling for average wind speed and precipitation, each 1ºC increase in maximum daily temperature is associated with a 1.3 ppb higher daily O3 level (0.7 ppb per 1ºF).39
38 NOAA National Centers for Environmental Information, “Climate at a Glance: Divisional Time Series,” https://www.ncdc.noaa.gov/cag/city/time-series (accessed February 15, 2021). 39 Based on author’s estimates using O3 monitor and meteorological data from 2000-2017.
23
54
21
26
21
12
21 21
36
35
1014
6
13
6
0
10
20
30
40
50
60
2004 2005 2006 2007 2008 2009 2010 2011 2012 2013 2014 2015 2016 2017 2018 2019
Num
ber o
f Exc
eeda
nces
Year

22
Figure 6: May-September Average O3 Levels in Cleveland, Adjusted for Weather (2000-2019)
Source: U.S. EPA, “Trends in Ozone Adjusted for Weather Conditions,” https://www.epa.gov/air-trends/trends-ozone-adjusted-weather-conditions (accessed February 15, 2021). U.S. EPA bases its NAAQS on the three-year average of the fourth highest daily Eight-Hour O3 values, which better accounts for long-term ambient O3 levels to which people are exposed. Table 8, below, captures the three-year average O3 concentrations for each of the eight counties in the NOACA air quality monitoring area from the 2007-2009 period to the 2017-2019 period. Values that exceeded the NAAQS in effect at the time are highlighted in red. Figure 7 displays O3 levels throughout the region during this period. The black dashed lines denote the NAAQS in effect during each period. For 2017-2019, Cuyahoga (71 ppb) and Lake (73 ppb) Counties had O3 values that exceeded the NAAQS. U.S. EPA expects that average O3 concentrations in the region will decline in coming years. According to the Agency, every county in the NOACA air quality monitoring area will have ozone values below 70 ppb by 2025.40
40 U.S. EPA, Counties Projected to Violate the 2015 Primary Ground‐Level Ozone Standard (Washington, D.C.: U.S. EPA, 2015), https://www.epa.gov/sites/production/files/2016-03/documents/20151001datatable2025.pdf (accessed February 15, 2021).

23
Table 8: Three-Year Average Eight-Hour Ozone Readings in Northeast Ohio (2007-2019)41
Source: U.S. EPA, “Air Quality System” data, https://www.epa.gov/aqs (accessed February 15, 2021).
Figure 7: Rolling Three-Year Ozone Averages for Northeast Ohio (2007-2019)42
Source: U.S. EPA, “Air Quality System” data, https://www.epa.gov/aqs (accessed February 15, 2021). As noted in Chapter 2, U.S. EPA uses the AQI to translate the NAAQS for each pollutant into a normalized metric that allows individuals to gauge air quality on a given day. Figure 8 below depicts the daily AQI values for O3 for the Cleveland and Akron metropolitan areas during 2019. Green and yellow squares denote good and moderate air quality levels, respectively, while orange squares show days in which the O3 level exceeded the Eight-Hour NAAQS.
41 The monitor with the highest average in the county was used for each three-year period. The concentrations are the truncated, not rounded, values (i.e., 77.7 is listed as 77 not 78). 42 The dashed black lines indicate the NAAQS in effect during each period.
2007-2009
2008-2010
2009-2011
2010-2012
2011-2013
2012-2014
2013- 2015
2014- 2016
2015- 2017
2016- 2018
2017- 2019
Ashtabula 80 77 78 79 75 72 69 70 70 70 69 Cuyahoga 77 75 75 80 78 75 69 69 69 71 71 Geauga 72 77 73 71 73 70 67 71 73 74 70 Lake 75 76 77 83 80 78 73 75 74 75 73 Lorain 72 70 69 75 71 69 63 66 66 68 64 Medina 70 70 68 72 69 67 64 64 64 65 61 Portage 72 68 67 71 67 64 61 61 63 64 63 Summit 80 75 74 74 68 62 61 61 64 65 67
60
70
80
90
Con
cent
ratio
n (p
pb)
Ashtabula
Cuyahoga
Geauga
Lake
Lorain
Medina
Portage
Summit

24
Figure 8: Daily O3 AQI Levels for Cleveland & Akron (2019)
Source: U.S. EPA, “AirData Tile Plot,” http://www.epa.gov/airquality/airdata/ad_viz_tile.html (accessed February 15, 2021).

25
5.2 Particulate Matter (PM) Properties: Particulate matter (PM) is the term applied to both solid and liquid droplets suspended in the atmosphere. It can be emitted directly from a source (primary) or result from chemical reactions in the atmosphere (secondary). Inhalation of these particles can irritate one’s nose, throat, and lung tissues. This irritation can easily create or exacerbate existing respiratory problems or even cause premature death. U.S. EPA has focused on smaller particles in setting standards. The smaller the particle, the deeper it can travel into one’s respiratory system. A subscript number generally follows references to PM. This number is the largest diameter of the particles covered by the standard or discussion. Thus, PM10 refers to particles less than or equal to 10 micrometers in diameter, while PM2.5 refers to particles less than or equal to 2.5 micrometers in diameter. “Coarse” particulate matter is used to refer to PM10, while “fine” particulate matter is used to refer to PM2.5. Prior to 1987, U.S. EPA focused on total suspended particulates (TSP), which include particles approximately 25 to 45 micrometers in diameter. Particles smaller than one micrometer, known as ultrafine particles (UFP), can also harm human health, but U.S. EPA does not set NAAQS for them. PM10 is one-seventh the diameter of a human hair, while PM2.5 is just 1/28 of a hair’s diameter (see Figure 9).
Figure 9: Particulate Matter Size
Source: U.S. EPA, “Particulate Matter: Basic Information,” https://www.epa.gov/pm-pollution/particulate-matter-pm-basics (accessed February 15, 2021).

26
5.2.1 Coarse Particulate Matter (PM10) Sources: In Northeast Ohio, PM10 largely comes from miscellaneous sources, such as fugitive dust emissions and the agriculture/forestry sector; industries that combust fossil fuels; gasoline and diesel-powered automobiles, trucks, construction equipment, ships, trains, and aircraft; waste disposal and recycling; and wood-burning stoves and fireplaces (see Figure 10).
Figure 10: 2017 PM10 Emission Inventory for Northeast Ohio
Source: U.S. EPA, 2017 National Emissions Inventory, https://www.epa.gov/air-emissions-inventories/2017-national-emissions-inventory-nei-data (accessed February 15, 2021).
Chemical & Allied Product Manufacturing
0.19%
Fuel Combustion - Electric Utility
0.54%
Fuel Combustion -Industrial
4.60%
Fuel Combustion - Other7.47%
Highway Vehicles6.18%
Metals Processing
1.58%
Miscellaneous64.37%
Off-Highway2.90%
Other Industrial Processes
7.90%
Petroleum & Related Industries
0.18%
Solvent Utilization0.03%
Storage & Transport0.17%
Waste Disposal & Recycling
3.89%
0 2,000 4,000 6,000 8,000 10,000 12,000
Ashtabula
Cuyahoga
Geauga
Lake
Lorain
Medina
Portage
Summit
Tons of PM10 Emissions

27
NAAQS and Nonattainment Status: Since 2006, there has been only one PM10 NAAQS, a daily (24-Hour) standard. U.S. EPA revoked its annual standard in December 2006 because there was insufficient health-based evidence to continue it. The 24-Hour PM10 NAAQS is 150 micrograms per cubic meter (µg/m3), not to be exceeded more than once per year, averaged over three years. No county in Northeast Ohio is in nonattainment for the PM10 NAAQS. Cuyahoga County was redesignated as a maintenance area for PM10 effective January 10, 2001 (65 FR 77308). Monitors: There are seven PM10 monitors in Northeast Ohio (see Table 9 and Figure 11).
Table 9: Locations of PM10 Monitors in Northeast Ohio
Monitor County FIPS ID Site ID Latitude Longitude Address 1
Cuyahoga 035
0038 41.47 -81.68 St. Theodosius, St. Tikhon Ave., Cleveland
2 0045 41.47 -81.65 FS 13, 4950 Broadway Ave., Cleveland
3 0060 41.49 -81.67 GT Craig, E.14th St. & Orange Ave.
4 0065 41.44 -81.66 4600 Harvard Ave., Newburgh Heights
5 1002 41.39 -81.81 16900 Holland Road, Brook Park
6 Lake 085 0008 41.75 -81.27 Fairport High School, Fairport
7 Lorain 093 3002 41.46 -82.11 Barr School, Sheffield Source: Ohio EPA, 2019-2020 Ohio Air Monitoring Network Plan, https://epa.ohio.gov/Portals/27/ams/sites/2019/2019-2020_AMNP_Main_Report_FINAL.pdf (accessed February 15, 2021).

28
Figure 11: Northeast Ohio PM10 Monitor Locations

29
Trends: Figure 12 displays the number of PM10 exceedance days from 2005-2019. Northeast Ohio has consistently remained at or near zero exceedance days per year since 1996. While there was a jump to three days in 2012, the region has not registered an exceedance day since then. Figure 13 displays the 2019 daily AQI values for the Cleveland-Elyria area. As it shows, the region had 348 Good AQI Days and just 17 Moderate AQI Days in 2019.
Figure 12: Number of PM10 Exceedance Days (2005-2019)
Source: U.S. EPA, “Air Quality System” data, https://www.epa.gov/aqs (accessed February 15, 2021).
Figure 13: Daily PM10 AQI levels for Cleveland (2019)
Source: U.S. EPA, “AirData Tile Plot,” http://www.epa.gov/airquality/airdata/ad_viz_tile.html (accessed February 15, 2021).
1
0 0 0 0 0
1
3
0 0 0 0 0 0 00
1
2
3
4
5
2005 2006 2007 2008 2009 2010 2011 2012 2013 2014 2015 2016 2017 2018 2019
Num
ber o
f Day
s
Years

30
5.2.2 Fine Particulate Matter (PM2.5)
Properties: PM2.5 is a complex mixture of extremely small particles and liquid droplets. It is so small that it can be inhaled into the lungs and remain there; it may even travel into the bloodstream. Numerous adverse health effects are associated with breathing PM2.5, including lung cancer, heart attack, stroke, and premature death. PM2.5 is the major source of haze that reduces visibility in many parts of the United States, including the national parks. PM2.5 affects vegetation and ecosystems by settling on soil and water, upsetting delicate nutrient and chemical balances. It also causes soil erosion and damage to structures, including culturally important objects such as monuments and statues.
Figure 14: Air Monitor Filter Before and After Trapping PM2.5
Clean and dirty PM2.5 monitor filters, showing six weeks' difference; Lorain County. Source: Ohio EPA, Northeast District Office.
PM2.5 is made up of a number of components, including acids, such as ammonium nitrates and ammonium sulfates; organic chemicals, including various forms of carbon; metals; and soil and crust particles. Water is also a component of PM2.5, which ensures that ambient concentrations increase in Northeast Ohio when humidity levels are high or when fog is present. Secondary formation in the atmosphere accounts for more PM2.5 than does primary formation (such as smoke or industrial emissions). PM2.5 can occur year-round, ordinarily showing a bimodal distribution of high concentrations in winter and summer, with lower concentrations during spring and fall. Sources: Direct sources of PM2.5 include miscellaneous sources, such as fugitive dust emissions and the agriculture/forestry sector; industries that combust fossil fuels; waste disposal and recycling; wood burning; and diesel-powered trucks, construction equipment, ships, trains, and aircraft. Sulfates are more readily formed from SO2 released by power plants from July through September, which may result in spiked PM2.5 levels.43 Indirect sources that contribute through secondary formation in the atmosphere include agriculture (ammonia from fertilizer and manure),
43 U.S. EPA Office of Air Quality Planning and Standards, The Particle Pollution Report: Current Understanding of Air Quality and Emissions through 2003 (Research Triangle Park, NC: U.S. EPA, 2003), https://hero.epa.gov/hero/index.cfm/reference/details/reference_id/190219 (accessed February 15, 2021).
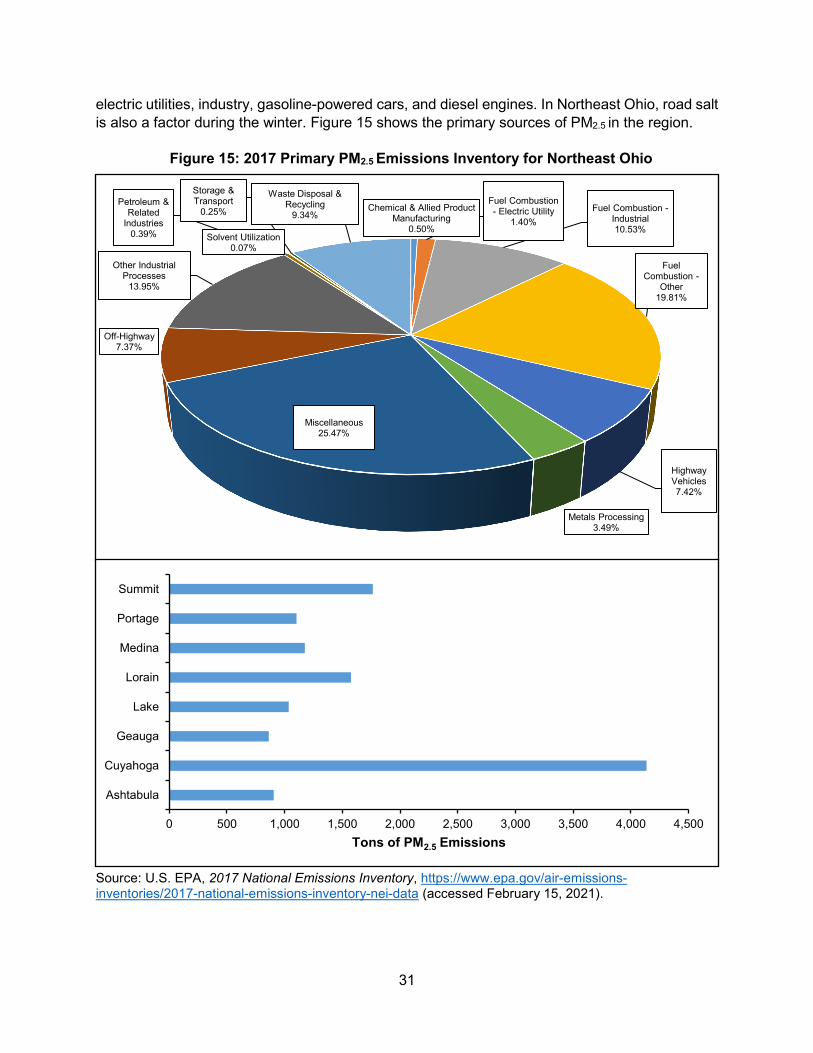
31
electric utilities, industry, gasoline-powered cars, and diesel engines. In Northeast Ohio, road salt is also a factor during the winter. Figure 15 shows the primary sources of PM2.5 in the region.
Figure 15: 2017 Primary PM2.5 Emissions Inventory for Northeast Ohio
Source: U.S. EPA, 2017 National Emissions Inventory, https://www.epa.gov/air-emissions-inventories/2017-national-emissions-inventory-nei-data (accessed February 15, 2021).
Chemical & Allied Product Manufacturing
0.50%
Fuel Combustion - Electric Utility
1.40%Fuel Combustion -
Industrial10.53%
Fuel Combustion -
Other19.81%
Highway Vehicles7.42%
Metals Processing3.49%
Miscellaneous25.47%
Off-Highway7.37%
Other Industrial Processes
13.95%
Petroleum & Related
Industries0.39% Solvent Utilization
0.07%
Storage & Transport
0.25%
Waste Disposal & Recycling
9.34%
0 500 1,000 1,500 2,000 2,500 3,000 3,500 4,000 4,500
Ashtabula
Cuyahoga
Geauga
Lake
Lorain
Medina
Portage
Summit
Tons of PM2.5 Emissions

32
NAAQS and Nonattainment Status: Figure 16, below, traces the changes in PM NAAQS since 1970. Monitoring for PM2.5 began in 1999. In December 2009, U.S. EPA designated Cuyahoga, Lake, Lorain, Medina, Portage and Summit counties as nonattainment areas for the 2006 24-Hour PM2.5 NAAQS of 35 µg/m3 (74 FR 58688). U.S. EPA redesignated Ashtabula Township and Cuyahoga, Lake, Lorain, Medina, Portage, and Summit counties from nonattainment to maintenance on September 18, 2013 (78 FR 57270), based on monitoring data. U.S. EPA completed its 2012 revision to the PM2.5 NAAQS on January 15, 2013 (78 FR 3085), when it issued three new PM2.5 standards. These include two annual standards and a 24-Hour standard. The primary annual NAAQS is 12 μg/m3. The secondary annual NAAQS is 15 μg/m3. The three-year average of the weighted annual mean PM2.5 concentrations from single or multiple community-oriented monitors must not exceed the annual standards. The 24-Hour primary and secondary NAAQS is 35 μg/m3. The three-year average of the 98th percentile of 24-Hour concentrations at each monitor within an area must not exceed 35 μg/m3. U.S. EPA designated Cuyahoga County and Lorain County as moderate nonattainment areas for the annual NAAQS (80 FR 2206), a ruling that took effect on April 15, 2015. Based on 2015-2017 monitor data, the Agency redesignated Cuyahoga and Lorain Counties to maintenance status on April 12, 2019 (84 FR 14881).
Figure 16: Timeline of Revisions to PM NAAQS (1971-2019)
PM2.5 Control Measures: The Ohio EPA is responsible for submitting SIPs for all regions within the state. The agency faced a deadline of October 2016 to submit a new PM2.5 SIP for Cuyahoga and Lorain Counties (80 FR 2206). Please visit the Ohio EPA website to review the relevant PM2.5 SIPs for Northeast Ohio: http://www.epa.ohio.gov/dapc/SIP/pm2_5.aspx. In 2006, NOACA convened a public participation process, headed by the NOACA Air Quality Public Advisory Task Force, which generated recommendations to Ohio EPA in 2007 for inclusion
1971: TSP 24-hr 260µg/m3 &
annual 75µg/m3
(primary), 24-hr 150µg/m3
(secondary)
1987: PM10 24-hr 150µg/m3 & annual
50µg/m3
1997: PM10 24-hr 150µg/m3 & annual 50µg/m3 ; PM2.5 24-
hr 65µg/m3 & annual 15µg/m3
2006: PM10 24-hr 150µg/m3 ; PM2.524-hr 35µg/m3 & annual 15µg/m3
2012: PM10 24-hr 150µg/m3 ; PM2.5annual 12µg/m3
(primary) & 15µg/m3
(secondary) & 24-hr 35µg/m3
1965 1970 1975 1980 1985 1990 1995 2000 2005 2010 2015 2020
Timeline of PM NAAQS
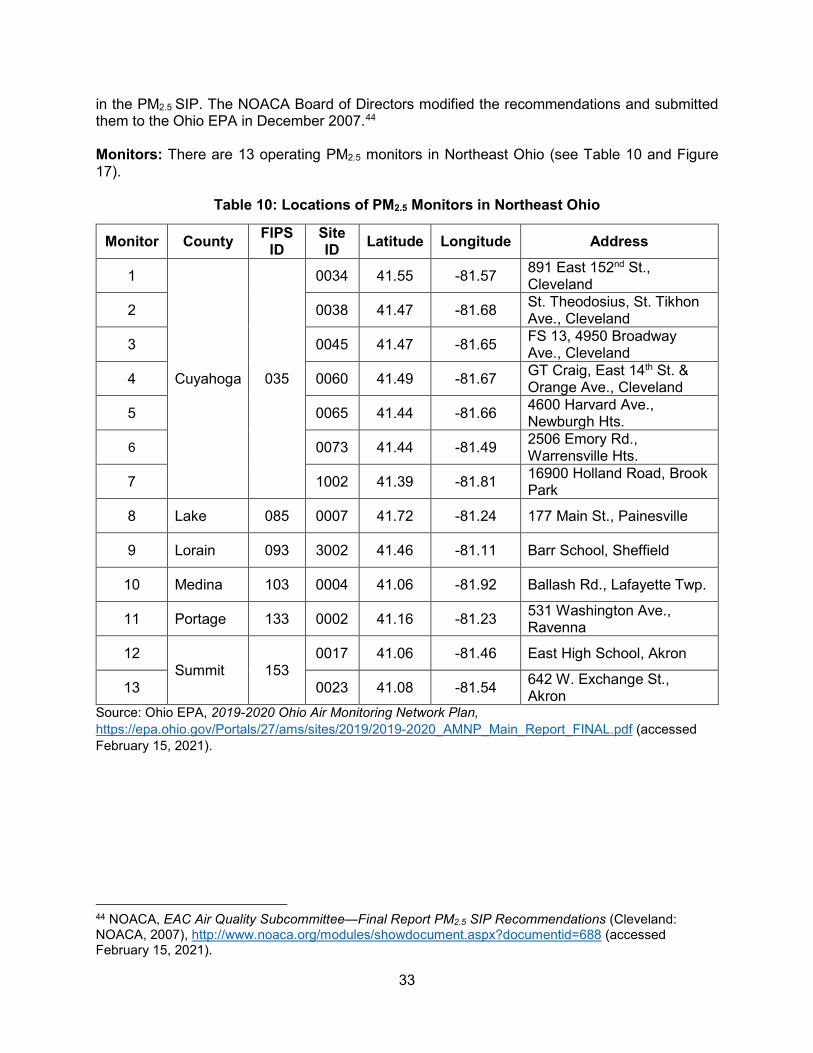
33
in the PM2.5 SIP. The NOACA Board of Directors modified the recommendations and submitted them to the Ohio EPA in December 2007.44 Monitors: There are 13 operating PM2.5 monitors in Northeast Ohio (see Table 10 and Figure 17).
Table 10: Locations of PM2.5 Monitors in Northeast Ohio
Source: Ohio EPA, 2019-2020 Ohio Air Monitoring Network Plan, https://epa.ohio.gov/Portals/27/ams/sites/2019/2019-2020_AMNP_Main_Report_FINAL.pdf (accessed February 15, 2021).
44 NOACA, EAC Air Quality Subcommittee—Final Report PM2.5 SIP Recommendations (Cleveland: NOACA, 2007), http://www.noaca.org/modules/showdocument.aspx?documentid=688 (accessed February 15, 2021).
Monitor County FIPS ID
Site ID Latitude Longitude Address
1
Cuyahoga 035
0034 41.55 -81.57 891 East 152nd St., Cleveland
2 0038 41.47 -81.68 St. Theodosius, St. Tikhon Ave., Cleveland
3 0045 41.47 -81.65 FS 13, 4950 Broadway Ave., Cleveland
4 0060 41.49 -81.67 GT Craig, East 14th St. & Orange Ave., Cleveland
5 0065 41.44 -81.66 4600 Harvard Ave., Newburgh Hts.
6 0073 41.44 -81.49 2506 Emory Rd., Warrensville Hts.
7 1002 41.39 -81.81 16900 Holland Road, Brook Park
8 Lake 085 0007 41.72 -81.24 177 Main St., Painesville
9 Lorain 093 3002 41.46 -81.11 Barr School, Sheffield
10 Medina 103 0004 41.06 -81.92 Ballash Rd., Lafayette Twp.
11 Portage 133 0002 41.16 -81.23 531 Washington Ave., Ravenna
12 Summit 153
0017 41.06 -81.46 East High School, Akron
13 0023 41.08 -81.54 642 W. Exchange St., Akron

34
Figure 17: Northeast Ohio PM2.5 Monitor Locations

35
Trends: Figure 18 shows the number of exceedance days for the PM2.5 24-Hour NAAQS since it was tightened to 35 µg/m3 in 2007. There was one exceedance during 2019, when the 24-Hour average reached 38.3 µg/m3 at monitor 39-035-0073 in Cuyahoga County due to an atmospheric inversion, when a warm front moved into the region and trapped pollution near the ground. For a list of the dates of each exceedance and the number of exceeding monitors, please see Appendix B: PM2.5 Exceedance Days 2009-2019.
Figure 18: Number of PM2.5 Exceedance Days (2009-2019)
Source: U.S. EPA, “Air Quality System” data, https://www.epa.gov/aqs (accessed February 15, 2021). Table 11 shows the three-year rolling averages for annual PM2.5, monitor-by-monitor, from 2007-2019. As the table shows, no monitor has exceeded the NAAQS since 2014-2016. Table 12, in turn, lays out the three-year rolling averages for the daily (24-Hour) PM2.5, monitor by monitor, for this same period. Every monitor has the 24-Hour NAAQS since 2007-2009. Cells marked N/A in either table indicate that the monitor was not operational during that period.
1
8
2
5
1 1 1
0 0 0
1
0
1
2
3
4
5
6
7
8
9
2009 2010 2011 2012 2013 2014 2015 2016 2017 2018 2019
Num
ber o
f Exc
eeda
nces
Year

36
Table 11: Monitor-by-Monitor Three-Year Rolling Averages for Annual PM2.5 NAAQSa
a Values that exceeded the NAAQS in place at the time are highlighted in red. b Monitors numbered N/A are no longer in operation. c Annual values that do not meet Ohio EPA completeness criteria. In order for a monitor to meet completeness criteria, at least 75% of its scheduled sample days must register valid readings for each quarter of each calendar year. Source: U.S. EPA, “Air Quality System” data, https://www.epa.gov/aqs (accessed February 15, 2021).
Monitorb ID Number County 2007-09
2008-10
2009-11
2010-12
2011-13
2012-14
2013-15
2014-16
2015-17
2016-18
2017-19
N/A 39-035-0027
Cuyahoga
12.8 N/A N/A N/A N/A N/A N/A N/A N/A N/A N/A 1 39-035-0034 11.6 10.7 10.4 10.1 9.6 9.5 9.4 8.9 8.2 7.8 7.6 2 39-035-0038 14.4 13.6 13.1 13 12.4 12.2 12.1 11.4 10.6 9.9 9.6 3 39-035-0045 13.6 12.9 12.3 12.2 11.5 11.3 11.2 10.6 10.1 9.5 9.4 4 39-035-0060 14.1 13.4 12.8 13.1 12.5 12.5 12.1c 11.3c 10.1 9.3 10.3 5 39-035-0065 14.3 13.4 12.7 12.7 12.1 12.1 12.4 12.2 11.7 11.0 11.0 6 39-035-0073 N/A N/A N/A N/A N/A N/A N/A N/A 7.3 7.6 9.0 7 39-035-1002 12.1 11.4 10.9 10.5 9.7 9.5 9.3 8.9 8.3 7.9 7.7
N/A 39-085-3002 Lake
N/A N/A N/A N/A N/A N/A N/A N/A N/A N/A N/A 8 39-085-0007 N/A N/A 10.1 9.6 9 8.7 8.5 7.9 7.4 7.0 6.9
N/A 39-093-0016 Lorain
N/A N/A N/A N/A N/A N/A N/A N/A N/A N/A N/A 9 39-093-3002 11.4 10.6 9.9 9.8 9.2 9.1 8.7 8.1 7.6 7.5 7.7
N/A 39-103-0003 Medina
11.8 11.1 10.9 10.3 9.7 N/A N/A N/A N/A N/A N/A 10 39-103-0004 N/A N/A N/A N/A N/A 9 9.3 8.7 8.4 7.6 8.0 11 39-133-0002 Portage 12.3 11.5 10.9 10.3 9.5 8.8 8.9c 8.3c 7.8 9.0 7.4 12 39-153-0017
Summit 13.7 13.3 12.6 N/A N/A 10.6 11.2 11 10.2 9.3 8.9
13 39-153-0023 12.7 12.3 11.7 11.2 10.4 10.2 9.9 9.2 8.5 7.8 7.9
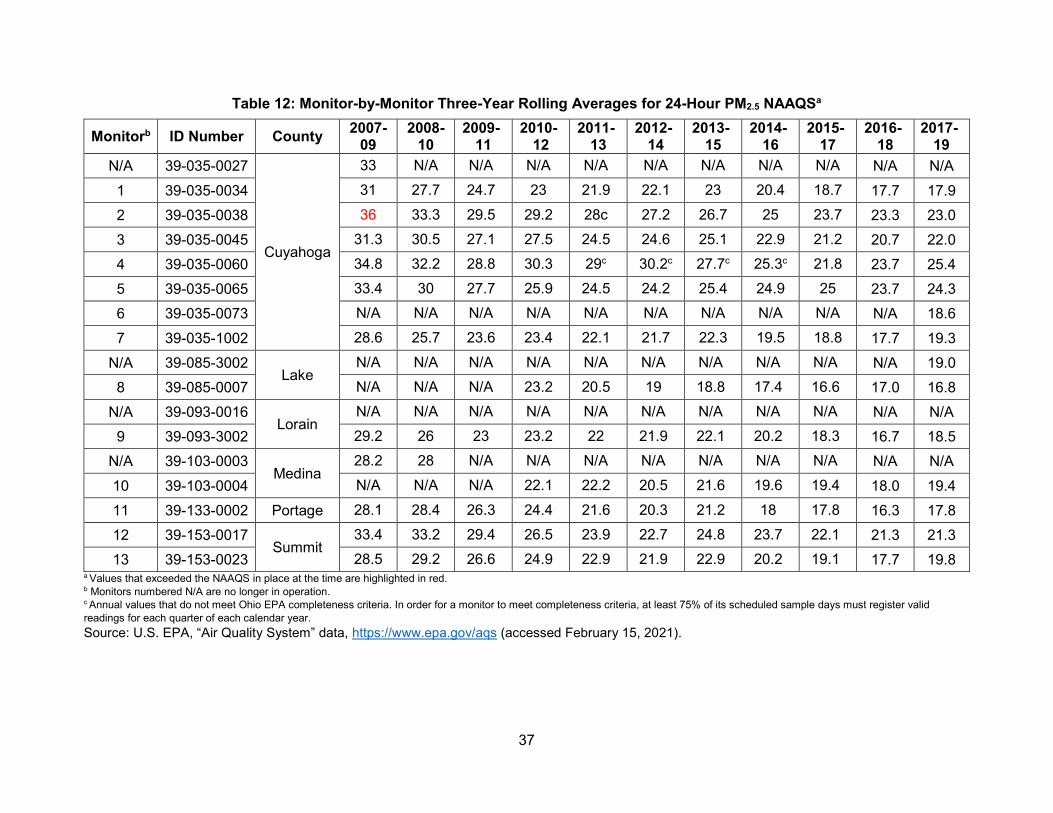
37
Table 12: Monitor-by-Monitor Three-Year Rolling Averages for 24-Hour PM2.5 NAAQSa
a Values that exceeded the NAAQS in place at the time are highlighted in red. b Monitors numbered N/A are no longer in operation. c Annual values that do not meet Ohio EPA completeness criteria. In order for a monitor to meet completeness criteria, at least 75% of its scheduled sample days must register valid readings for each quarter of each calendar year. Source: U.S. EPA, “Air Quality System” data, https://www.epa.gov/aqs (accessed February 15, 2021).
Monitorb ID Number County 2007-09
2008-10
2009-11
2010-12
2011-13
2012-14
2013-15
2014-16
2015-17
2016-18
2017-19
N/A 39-035-0027
Cuyahoga
33 N/A N/A N/A N/A N/A N/A N/A N/A N/A N/A 1 39-035-0034 31 27.7 24.7 23 21.9 22.1 23 20.4 18.7 17.7 17.9 2 39-035-0038 36 33.3 29.5 29.2 28c 27.2 26.7 25 23.7 23.3 23.0 3 39-035-0045 31.3 30.5 27.1 27.5 24.5 24.6 25.1 22.9 21.2 20.7 22.0 4 39-035-0060 34.8 32.2 28.8 30.3 29c 30.2c 27.7c 25.3c 21.8 23.7 25.4 5 39-035-0065 33.4 30 27.7 25.9 24.5 24.2 25.4 24.9 25 23.7 24.3 6 39-035-0073 N/A N/A N/A N/A N/A N/A N/A N/A N/A N/A 18.6 7 39-035-1002 28.6 25.7 23.6 23.4 22.1 21.7 22.3 19.5 18.8 17.7 19.3
N/A 39-085-3002 Lake
N/A N/A N/A N/A N/A N/A N/A N/A N/A N/A 19.0 8 39-085-0007 N/A N/A N/A 23.2 20.5 19 18.8 17.4 16.6 17.0 16.8
N/A 39-093-0016 Lorain
N/A N/A N/A N/A N/A N/A N/A N/A N/A N/A N/A 9 39-093-3002 29.2 26 23 23.2 22 21.9 22.1 20.2 18.3 16.7 18.5
N/A 39-103-0003 Medina
28.2 28 N/A N/A N/A N/A N/A N/A N/A N/A N/A 10 39-103-0004 N/A N/A N/A 22.1 22.2 20.5 21.6 19.6 19.4 18.0 19.4 11 39-133-0002 Portage 28.1 28.4 26.3 24.4 21.6 20.3 21.2 18 17.8 16.3 17.8 12 39-153-0017
Summit 33.4 33.2 29.4 26.5 23.9 22.7 24.8 23.7 22.1 21.3 21.3
13 39-153-0023 28.5 29.2 26.6 24.9 22.9 21.9 22.9 20.2 19.1 17.7 19.8

38
Figures 19 and 20 illustrate the information from Tables 11 and 12. The data show a clear downward trend over the past decade, most likely due to new controls on coal-fired power plants, cleaner fuels (e.g., low sulfur diesel), and alternative vehicle technologies (e.g., vehicle retrofits, repowers, replacements, and anti-idling mechanisms). For the first time, the 2015-2017 three-year annual PM2.5 levels were below 12 µg/m3 for all counties in Northeast Ohio. U.S. EPA moved the region from nonattainment to maintenance status on April 12, 2019, based on these data.
Figure 19: Maximum Three-Year Rolling Averages for Annual PM2.5 NAAQS (2007-2019)45
Source: U.S. EPA, “Air Quality System” data, https://www.epa.gov/aqs (accessed February 15, 2021).
Figure 20: Maximum Three-Year Rolling Averages for 24-Hour PM2.5 NAAQS (2007-2019)
Source: U.S. EPA, “Air Quality System” data, https://www.epa.gov/aqs (accessed February 15, 2021). 45 Figures 18 and 19 depict the data only from the highest value monitor in each county, for each year. The dashed black lines in each chart indicate the NAAQS in effect during each period.
6789
101112131415
Con
cent
ratio
n µg
/m3
Year
Cuyahoga
Lake
Lorain
Medina
Portage
Summit
10
15
20
25
30
35
40
Con
cent
ratio
n µg
/m3
Year
Cuyahoga
Lake
Lorain
Medina
Portage
Summit

39
Figure 21 displays the 2019 daily AQI values for the Akron and Cleveland-Elyria areas. Roughly two-thirds of all days had good AQI values.
Figure 21: Daily PM2.5 AQI levels in 2019
Source: U.S. EPA, “Air Data Tile Plot,” https://www.epa.gov/outdoor-air-quality-data/air-data-tile-plot (accessed February 15, 2021).

40
5.3 Sulfur Dioxide Properties: Sulfur dioxide (SO2) is released primarily by the combustion of fuels that contain sulfur as a contaminant. Like O3, it irritates lung tissue and can exacerbate preexisting respiratory and cardiovascular conditions. It also contributes to acid rain, which deteriorates man-made structures, damages plants, and can alter pH levels sufficiently to destroy ecosystems. Moreover, SO2 is a major source of secondary PM2.5 formation. Sources: Industries that burn fossil fuels and diesel are the primary contributors to sulfur dioxide concentrations. U.S. EPA has eliminated sulfur from diesel fuel, on a phased-in basis. Due to the closures of coal-fired power plants in Northeast Ohio, SO2 emissions from the electricity sector fell 97% from 2014 to 2017, bringing the sector’s share of the pollutant down from 85% to 38%.
Figure 22: 2017 SO2 Emissions Inventory
Source: U.S. EPA, 2017 National Emissions Inventory, https://www.epa.gov/air-emissions-inventories/2017-national-emissions-inventory-nei-data (accessed February 15, 2021).
Chemical & Allied Product Manufacturing
1.04%
Fuel Combustion -Electric Utility
37.74%
Fuel Combustion -Industrial19.56%
Fuel Combustion - Other3.30%
Highway Vehicles3.15%
Metals Processing
9.81%
Miscellaneous0.13%
Off-Highway3.05%
Other Industrial Processes
10.99%
Petroleum & Related Industries
9.54%
Solvent Utilization0.00%
Waste Disposal & Recycling1.68%
0 500 1,000 1,500 2,000 2,500
AshtabulaCuyahoga
GeaugaLake
LorainMedinaPortageSummit
Tons of SO2 Emissions

41
NAAQS and Nonattainment Status: On June 22, 2010, U.S. EPA strengthened the NAAQS for SO2, creating a single One-Hour NAAQS of 75 ppb and revoking the 24-Hour and annual NAAQS. This final rule took effect August 23, 2010 (75 FR 35519). There is also a secondary NAAQS set at a three-hour average concentration of 0.5 ppm, not to be exceeded more than once per year. Most of Northeast Ohio is currently in attainment for SO2. Lake County was designated as a nonattainment area for the One-Hour NAAQS on July 25, 2013 (78 FR 47191). Based upon monitor data from 2015-2017, U.S. EPA redesignated the county to maintenance on May 14, 2019 (84 FR 21253). Monitors: There are nine SO2 monitors in Northeast Ohio (see Table 13 and Figure 23).
Table 13: Locations of SO2 Monitors in Northeast Ohio
Source: Ohio EPA, 2019-2020 Ohio Air Monitoring Network Plan, https://epa.ohio.gov/Portals/27/ams/sites/2019/2019-2020_AMNP_Main_Report_FINAL.pdf (accessed February 15, 2021).
Monitor County FIPS ID Site ID Latitude Longitude Address
1 Ashtabula 007 1001 41.95 -80.57 Conneaut Water Plant
2
Cuyahoga 035
0038 41.47 -81.68 St. Theodosius, St. Tikhon Ave., Cleveland
3 0045 41.47 -81.65 FS 13, 4950 Broadway Ave., Cleveland
4 0060 41.49 -81.67 GT Craig, E. 14th St. & Orange Ave., Cleveland
5 0065 41.44 -81.66 4600 Harvard Ave., Newburgh Hts.
6 Lake 085
0003 41.67 -81.42 Jefferson School, Eastlake
7 0007 41.72 -81.24 177 Main St., Painesville
8 Summit 153
0017 41.06 -81.46 East High School., Akron
9 0025 41.08 -81.51 199 S. Broadway, Akron
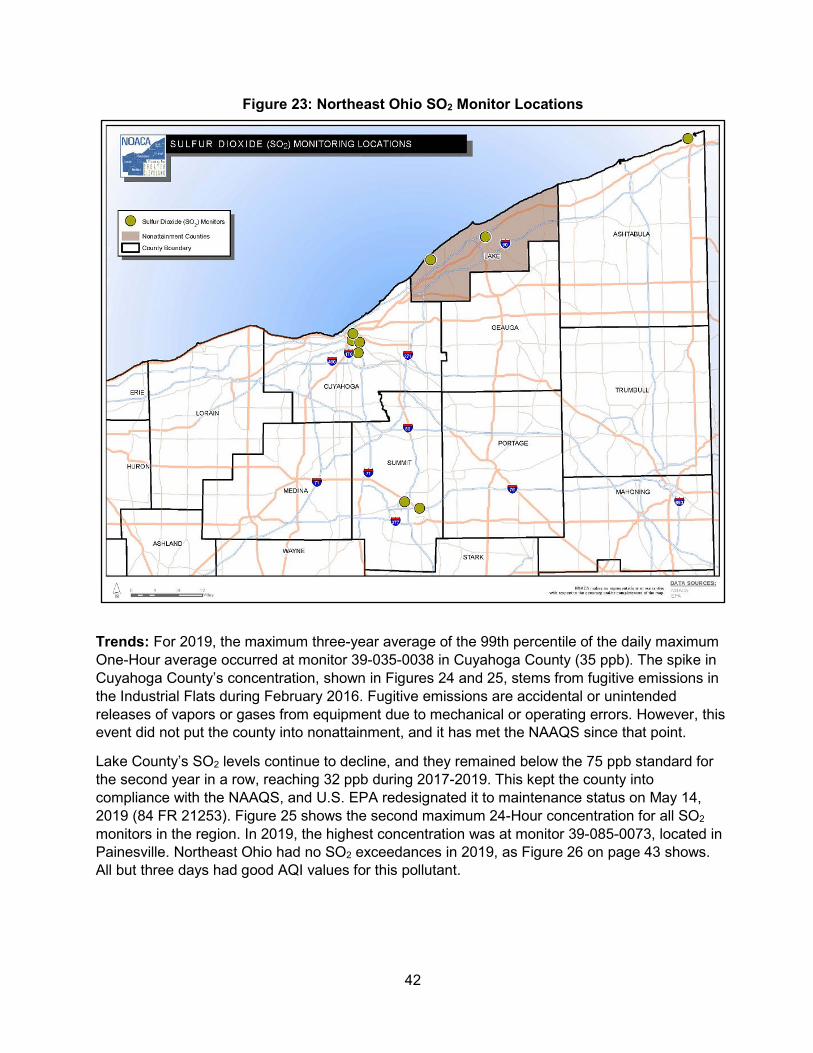
42
Figure 23: Northeast Ohio SO2 Monitor Locations
Trends: For 2019, the maximum three-year average of the 99th percentile of the daily maximum One-Hour average occurred at monitor 39-035-0038 in Cuyahoga County (35 ppb). The spike in Cuyahoga County’s concentration, shown in Figures 24 and 25, stems from fugitive emissions in the Industrial Flats during February 2016. Fugitive emissions are accidental or unintended releases of vapors or gases from equipment due to mechanical or operating errors. However, this event did not put the county into nonattainment, and it has met the NAAQS since that point.
Lake County’s SO2 levels continue to decline, and they remained below the 75 ppb standard for the second year in a row, reaching 32 ppb during 2017-2019. This kept the county into compliance with the NAAQS, and U.S. EPA redesignated it to maintenance status on May 14, 2019 (84 FR 21253). Figure 25 shows the second maximum 24-Hour concentration for all SO2 monitors in the region. In 2019, the highest concentration was at monitor 39-085-0073, located in Painesville. Northeast Ohio had no SO2 exceedances in 2019, as Figure 26 on page 43 shows. All but three days had good AQI values for this pollutant.

43
Figure 24: Three-Year Average of the 99th Percentile of Daily Maximum One-Hour Average SO2 (2009-2019) 46
Source: U.S. EPA, “Air Quality System” data, https://www.epa.gov/aqs (accessed February 15, 2021).
Figure 25: Second Maximum 24-Hour SO2 Concentration (2009-2019)
Source: U.S. EPA, “Air Quality System” data, https://www.epa.gov/aqs (accessed February 15, 2021).
46 The dashed black line indicates the NAAQS in effect during this period.
0
50
100
150
200C
once
ntra
tion
(ppb
)
Year
Ashtabula
Cuyahoga
Lake
Summit
70
48.7 54.5 54.5
30.721.6
31
144.8
13.9 10.6 7.4
0
20
40
60
80
100
120
140
160
2009 2010 2011 2012 2013 2014 2015 2016 2017 2018 2019
Con
cent
ratio
n (p
pb)
Year

44
Figure 26: Daily SO2 AQI Levels in 2019
Source: U.S. EPA, “AirData Tile Plot,” http://www.epa.gov/airquality/airdata/ad_viz_tile.html (accessed February 15, 2021).
45
5.4 Carbon Monoxide Properties: Carbon monoxide (CO) forms whenever a fuel is burned incompletely due to insufficient oxygen. It enters the bloodstream during normal respiration and leads to insufficient oxygen delivery to body tissues. Depending on its concentration, health effects can include increased discomfort for those with cardiovascular ailments, visual impairment, reduced work capacity, and even premature death.47 Sources: Primary sources of CO in Northeast Ohio include motor vehicles and steel mills. Passenger cars produce far less CO per vehicle than they did 40 years ago, due to the widespread adoption of the catalytic converter.48 As Figure 27 shows, in Northeast Ohio, highway and off-highway vehicles are the largest sources of CO in Northeast Ohio. NAAQS and Nonattainment Status: There are two primary NAAQS for carbon monoxide. The One-Hour NAAQS is an average concentration of 35 ppm that cannot be exceeded more than once per year. Additionally, the Eight-Hour NAAQS is an average concentration of 9 ppm that cannot be exceeded more than once per year. No part of Northeast Ohio is in nonattainment for carbon monoxide. Cuyahoga County was designated as nonattainment for carbon monoxide from 1978 to 1994 and is now in maintenance. The Ohio EPA, with NOACA’s assistance, completed a maintenance plan update in 2003. On January 28, 2011, U.S. EPA proposed to retain the existing NAAQS for CO. Hence the rest of the region is expected to remain in attainment under the current NAAQS for the foreseeable future.
47 U.S. EPA, “Carbon Monoxide,” http://www.epa.gov/airquality/carbonmonoxide/index.html (accessed February 15, 2021). 48 U.S. EPA Office of Mobile Sources, “Automobiles and Carbon Monoxide,” http://www.epa.gov/oms/consumer/03-co.pdf (accessed February 15, 2021).

46
Figure 27: 2017 CO Emissions Inventory for Northeast Ohio
Source: U.S. EPA, 2017 National Emissions Inventory, https://www.epa.gov/air-emissions-inventories/2017-national-emissions-inventory-nei-data (accessed February 15, 2021).
Chemical & Allied Product
Manufacturing9.27%
Fuel Combustion -Electric Utility
0.45%
Fuel Combustion -Industrial
5.63%
Fuel Combustion - Other5.72%
Highway Vehicles38.46%
Metals Processing2.06%
Miscellaneous0.21%
Natural Resources
1.12%
Off-Highway33.90%
Other Industrial Processes0.83%
Petroleum & Related Industries
0.08%
Solvent Utilization0.01%
Storage & Transport0.00%
Waste Disposal & Recycling
2.27%
0 20,000 40,000 60,000 80,000 100,000 120,000 140,000 160,000
Ashtabula
Cuyahoga
Geauga
Lake
Lorain
Medina
Portage
Summit
Tons of CO Emissions
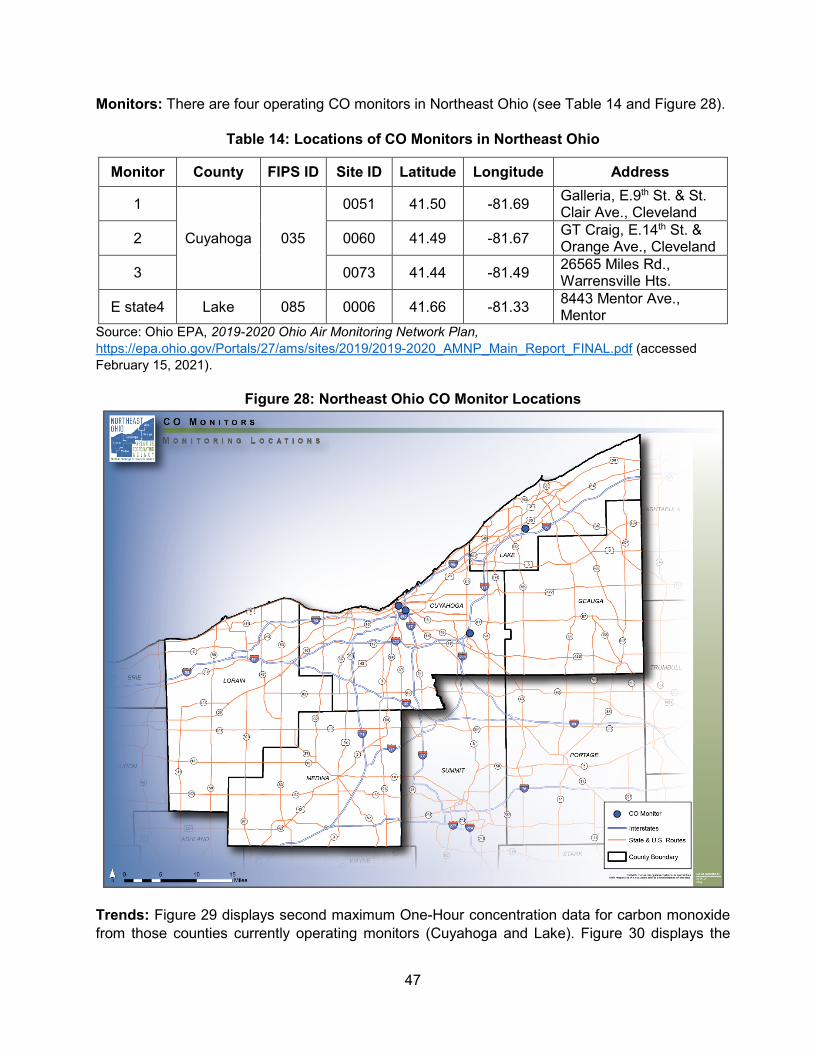
47
Monitors: There are four operating CO monitors in Northeast Ohio (see Table 14 and Figure 28).
Table 14: Locations of CO Monitors in Northeast Ohio
Monitor County FIPS ID Site ID Latitude Longitude Address
1
Cuyahoga 035
0051 41.50 -81.69 Galleria, E.9th St. & St. Clair Ave., Cleveland
2 0060 41.49 -81.67 GT Craig, E.14th St. & Orange Ave., Cleveland
3 0073 41.44 -81.49 26565 Miles Rd., Warrensville Hts.
E state4 Lake 085 0006 41.66 -81.33 8443 Mentor Ave., Mentor
Source: Ohio EPA, 2019-2020 Ohio Air Monitoring Network Plan, https://epa.ohio.gov/Portals/27/ams/sites/2019/2019-2020_AMNP_Main_Report_FINAL.pdf (accessed February 15, 2021).
Figure 28: Northeast Ohio CO Monitor Locations
Trends: Figure 29 displays second maximum One-Hour concentration data for carbon monoxide from those counties currently operating monitors (Cuyahoga and Lake). Figure 30 displays the

48
second maximum Eight-Hour concentration data for these three counties. The dashed black line indicates the NAAQS.
Figure 29: Second Maximum One-Hour CO Concentrations (2005-2019)
Source: U.S. EPA, “Air Quality System” data, https://www.epa.gov/aqs (accessed February 15, 2021).
Figure 30: Second Maximum Eight-Hour CO Concentrations (2005-2019)
Source: U.S. EPA, “Air Quality System” data, https://www.epa.gov/aqs (accessed February 15, 2021).
CO concentrations fluctuate slightly from year to year, but they remain well below both the One-Hour and Eight-Hour NAAQS. As Figure 31 shows, Northeast Ohio registered good AQI values for CO every day during 2019.
0
5
10
15
20
25
30
35
Con
cent
ratio
n (p
pm
Year
Cuyahoga
Lake
Summit
0
1
2
3
4
5
6
7
8
9
Con
cent
ratio
n (p
pm
Year
Cuyahoga
Lake
Summit

49
Figure 31: Daily CO AQI Levels in 201949
Source: U.S. EPA, “Air Data Tile Plot,” http://www.epa.gov/airquality/airdata/ad_viz_tile.html (accessed February 15, 2021).
5.5 Lead Properties: Lead (Pb) exists in its elemental form in the atmosphere and, in Northeast Ohio, in the ground, where particles from leaded gasoline and lead-based paint have settled. Pb accumulates in the body and can damage kidneys, liver, the nervous system, and other organs. Sources: Historically, leaded gasoline was the primary source of Pb emissions, although in Cleveland a single source, Master Metals, was responsible for large amounts of fugitive lead emissions. Master Metals is now defunct, and a comprehensive environmental remediation has been performed at its former site. U.S. EPA began efforts to phase out the use of lead in gasoline in the early 1970s, but it was not until December 31, 1995, that the use of leaded gasoline in on-road vehicles was officially banned. Lead additives are still used in off-road engines. Lead-based paint is also no longer manufactured, but it remains in a large number of older buildings throughout the region. Only metal industries and battery manufacturers remain significant contributors to atmospheric Pb pollution. In Northeast Ohio, the primary source of Pb pollution has been the area surrounding the Ferro Corporation in Cleveland’s Industrial Flats. NAAQS and Nonattaiment Status: On November 12, 2008, U.S. EPA strengthened the primary NAAQS for Pb by lowering it from 1.5 µg/m3—a level set in 1978—to 0.15 µg/m3 (73 FR 66964).
49 U.S. EPA rounds all concentrations to the first decimal place. Accordingly, EPA rounds down all values below 9.5 ppm, while those greater than or equal to 9.5 are rounded up and treated as an exceedance.

50
U.S. EPA designated the portions of Cuyahoga County that surround the Ferro Corporation as a nonattainment area for Pb on November 16, 2010, based on data from 2007-2009 (FR 76 72097). This designation was effective as of November 22, 2011, with an attainment date set for December 31, 2015. U.S. EPA defined the nonattainment area as the “portions of Cuyahoga County that are bounded on the west by Washington Park Boulevard/Crete Avenue/East 49th Street, on the east by East 71st Street, on the north by Fleet Avenue, and on the south by Grant Avenue.”50 The rest of Cuyahoga County, and all other counties in Northeast Ohio, are unclassified/attainment areas.51 Based upon 2012-2015 monitoring data, U.S. EPA determined that Cleveland had attained the 2008 Pb NAAQS. U.S. EPA formally redesignated Cleveland as a maintenance area for the 2008 Pb NAAQS on May 31, 2017 (82 FR 24871), and this action took effect on July 31, 2017. Monitors: There are four operating Pb monitors in Northeast Ohio, all in Cuyahoga County (see Table 15 and Figure 32).
50 40 C.F.R. § 81.336 (2010). 51 Ohio EPA Division of Air Pollution Control, Ohio’s 2008 Lead Standard: Second Round of Recommended Designations (Columbus, OH: Ohio EPA, 2010), http://www.epa.ohio.gov/portals/27/SIP/lead/2008_Lead_Standard_Updated_Recommendated_NA_Areas-FINAL.pdf (accessed February 15, 2021).

51
Table 15: Locations of Pb Monitors in Cuyahoga County
Monitor County FIPS ID Site ID Latitude Longitude Address
1
Cuyahoga 035
0038 41.47 -81.68 St. Theodosius, St. Tikhon Ave., Cleveland
2 0042 41.48 -81.70 Fire Station 4, 3136 Lorain Ave., Cleveland
3 0049 41.44 -81.65 Ferro Corp., East 56th St., Cleveland
4 0061 41.44 -81.66 South Side West 3rd St., Cleveland
Source: Ohio EPA, 2019-2020 Ohio Air Monitoring Network Plan, https://epa.ohio.gov/Portals/27/ams/sites/2019/2019-2020_AMNP_Main_Report_FINAL.pdf (accessed February 15, 2021).
Figure 32: Northeast Ohio Pb Monitor Locations
Trends: Figure 33 displays three-month average Pb concentrations. The highest average in 2019, a three-month concentration of 0.02 µg/m3, was reported at monitor 39-035-0061 on West 3rd Street in Cleveland. This concentration remains well below the NAAQS levels.
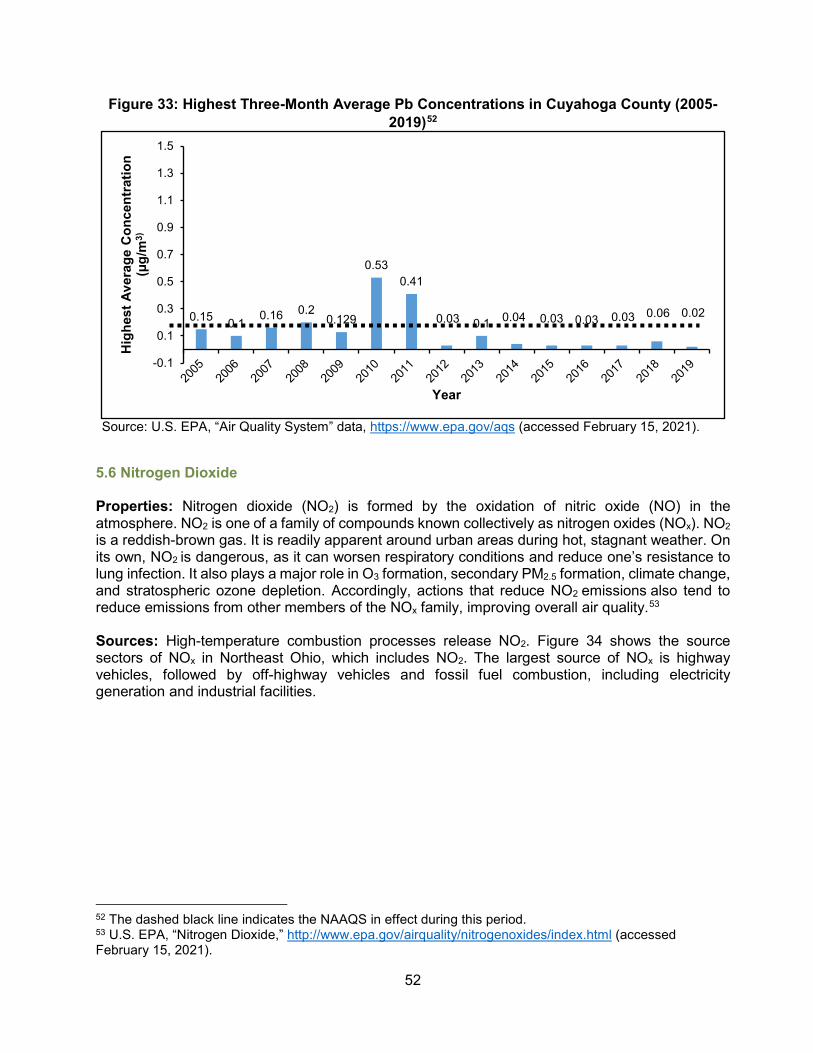
52
Figure 33: Highest Three-Month Average Pb Concentrations in Cuyahoga County (2005-2019)52
Source: U.S. EPA, “Air Quality System” data, https://www.epa.gov/aqs (accessed February 15, 2021).
5.6 Nitrogen Dioxide Properties: Nitrogen dioxide (NO2) is formed by the oxidation of nitric oxide (NO) in the atmosphere. NO2 is one of a family of compounds known collectively as nitrogen oxides (NOx). NO2 is a reddish-brown gas. It is readily apparent around urban areas during hot, stagnant weather. On its own, NO2 is dangerous, as it can worsen respiratory conditions and reduce one’s resistance to lung infection. It also plays a major role in O3 formation, secondary PM2.5 formation, climate change, and stratospheric ozone depletion. Accordingly, actions that reduce NO2 emissions also tend to reduce emissions from other members of the NOx family, improving overall air quality.53 Sources: High-temperature combustion processes release NO2. Figure 34 shows the source sectors of NOx in Northeast Ohio, which includes NO2. The largest source of NOx is highway vehicles, followed by off-highway vehicles and fossil fuel combustion, including electricity generation and industrial facilities.
52 The dashed black line indicates the NAAQS in effect during this period. 53 U.S. EPA, “Nitrogen Dioxide,” http://www.epa.gov/airquality/nitrogenoxides/index.html (accessed February 15, 2021).
0.15 0.1 0.16 0.20.129
0.530.41
0.03 0.1 0.04 0.03 0.03 0.03 0.06 0.02
-0.1
0.1
0.3
0.5
0.7
0.9
1.1
1.3
1.5H
ighe
st A
vera
ge C
once
ntra
tion
(µg/
m3)
Year

53
Figure 34: 2017 NOx Emissions Inventory for Northeast Ohio
Source: U.S. EPA, 2017 National Emissions Inventory, https://www.epa.gov/air-emissions-inventories/2017-national-emissions-inventory-nei-data (accessed February 15, 2021).
Chemical & Allied Product Manufacturing
0.16%
Fuel Combustion - Electric Utility
2.81%
Fuel Combustion -Industrial
4.49%
Fuel Combustion -
Other10.23%
Highway Vehicles48.25%
Metals Processing
0.99%
Miscellaneous0.02%
Natural Resources
3.02%
Off-Highway27.29%
Other Industrial Processes
1.48%
Petroleum & Related Industries
0.32%
Solvent Utilization0.03%
Waste Disposal & Recycling0.90%
0 2,000 4,000 6,000 8,000 10,000 12,000 14,000 16,000 18,000 20,000
Ashtabula
Cuyahoga
Geauga
Lake
Lorain
Medina
Portage
Summit
Tons of NOx Emissions

54
NAAQS and Nonattainment Status: Effective January 22, 2010, there are two primary NAAQS for NO2: an annual arithmetic mean of 53 ppb and a One-Hour standard of 100 ppb. To attain the NAAQS, the three-year average of the 98th percentile of the daily maximum One-Hour average at each monitor within an area must not exceed 100 ppb. No portion of Northeast Ohio is designated as in nonattainment for NO2. Cuyahoga County is the only county monitoring for this pollutant within the region. U.S. EPA designated all areas as unclassifiable/attainment for the new standard on February 12, 2012 (77 FR 9532).
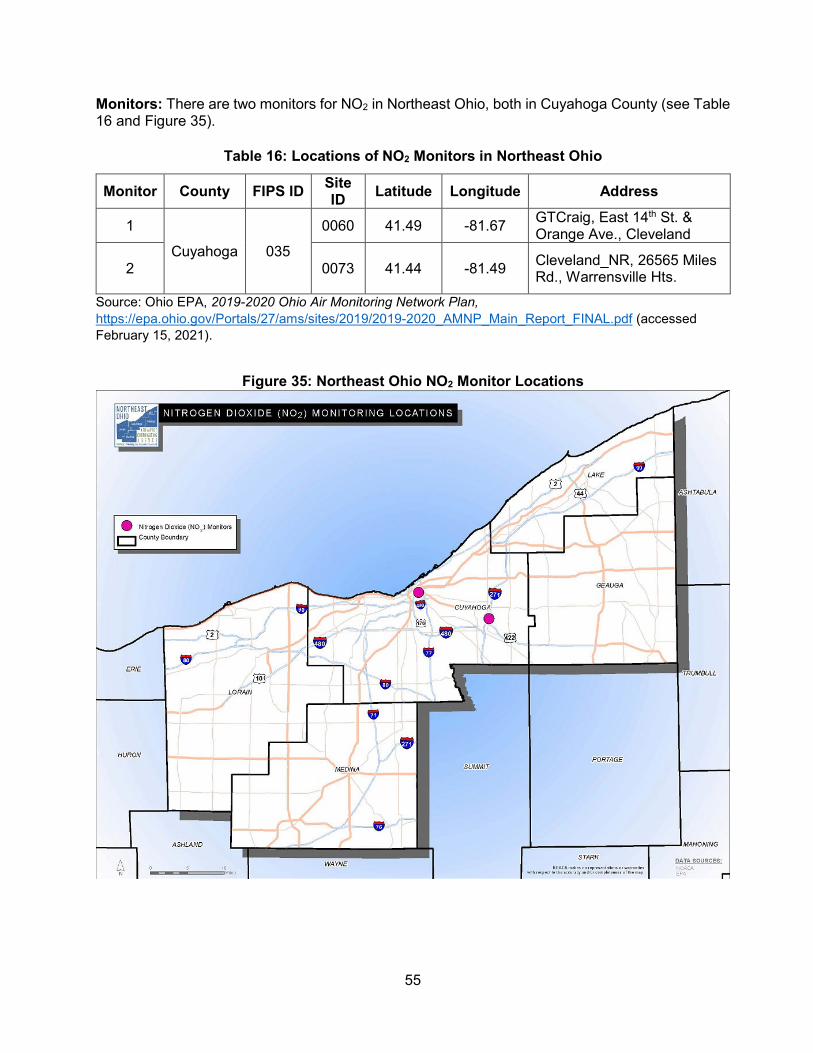
55
Monitors: There are two monitors for NO2 in Northeast Ohio, both in Cuyahoga County (see Table 16 and Figure 35).
Table 16: Locations of NO2 Monitors in Northeast Ohio
Monitor County FIPS ID Site ID Latitude Longitude Address
1
Cuyahoga 035
0060 41.49 -81.67 GTCraig, East 14th St. & Orange Ave., Cleveland
2 0073 41.44 -81.49 Cleveland_NR, 26565 Miles Rd., Warrensville Hts.
Source: Ohio EPA, 2019-2020 Ohio Air Monitoring Network Plan, https://epa.ohio.gov/Portals/27/ams/sites/2019/2019-2020_AMNP_Main_Report_FINAL.pdf (accessed February 15, 2021).
Figure 35: Northeast Ohio NO2 Monitor Locations

56
Trends: Figure 36 displays the three-year average of the 98th percentile of the daily maximum One-Hour average (100 ppb NAAQS). Figure 37, in turn, shows the annual mean concentrations for NO2 in Cuyahoga County (53 ppb NAAQS). NO2 levels decreased over the past 15 years, though that progress has largely stalled in recent years.
Figure 36: Three-Year Average of the 98th Percentile of the Daily Maximum One-Hour Average NO2 for Cuyahoga County (2009-2019)
Source: U.S. EPA, “Air Quality System” data, https://www.epa.gov/aqs (accessed February 15, 2021).
Figure 37: Annual Mean NO2 Concentration for Cuyahoga County (2005-2019)
Source: U.S. EPA, “Air Quality System” data, https://www.epa.gov/aqs (accessed February 15, 2021).
54.0 52.0 50.3 49.7 50.3 49.3 48.7 48.3 46.7
- 10.00 20.00 30.00 40.00 50.00 60.00 70.00 80.00 90.00
100.00
Con
cent
ratio
n (p
pb)
Year
2218 20
17 17 16 15 14 13 12 13 11 11 11 10
0
10
20
30
40
50
60
Con
cent
ratio
n (p
pb)
Year

57
Figure 38 shows the daily AQI values for NO2 in Northeast Ohio during 2019. As it illustrates, the region had 361 Good AQI days and just one Moderate AQI day for NO2.
Figure 38: Daily NO2 AQI Levels in 201954
Source: U.S. EPA, “Air Data Tile Plot,” https://www.epa.gov/outdoor-air-quality-data/air-data-tile-plot (accessed February 15, 2021).
54 Gray boxes in the tile plot indicate that no data are available for that day.

58
6. Climate Change and Greenhouse Gas Emissions Climate change is a global phenomenon that includes any significant change in the climate that lasts for extended periods of time. Global warming, which refers to the observed increase in average global surface temperatures over the past several decades, is one facet of climate change.55 Other components include changes in precipitation, wind patterns, the cryosphere, and extreme weather events. Over the past century, humans have released large amounts of CO2 and other greenhouse gases (GHGs) into the atmosphere. Most of these emissions have come from the combustion of fossil fuels, such as coal, natural gas, and oil; however, land-use changes, such as deforestation and agriculture, are also major contributors, both due to direct emissions and the elimination of carbon sinks (which pull carbon out of the atmosphere and sequester it) such as forests. According to the Intergovernmental Panel on Climate Change (IPCC), human activities have increased atmospheric concentrations of GHGs to their highest levels in at least 800,000 years, and humans are the dominant cause of changes to the global climate since the mid-20th century.56 GHGs act like a form of atmospheric insulation, trapping energy in the atmosphere and increasing global temperatures. GHGs allow ultraviolet radiation from the sun to enter the atmosphere; however, because they trap infrared radiation, they prevent a portion of that energy from escaping back into space. Though GHGs make up a tiny fraction of the composition of the atmosphere (0.04%), they can significantly affect the global climate. As a result, global average surface temperatures have increased by approximately 1ºC since 1880.57 Figure 39, below, shows the strong correlation between the increase in CO2 concentrations and global temperatures.
55 U.S. EPA, “Climate Change: Basic Information,” https://19january2017snapshot.epa.gov/climatechange/climate-change-basic-information_.html (accessed February 15, 2021). 56 Intergovernmental Panel on Climate Change, Climate Change 2014: Synthesis Report. Contribution of Working Groups I, II and III to the Fifth Assessment Report of the Intergovernmental Panel on Climate Change (Geneva: IPCC, 2014), http://www.ipcc.ch/report/ar5/syr/ (accessed February 15, 2021). 57 Ibid.

59
Figure 39: Atmospheric CO2 and Earth’s Surface Temperature (1880-2019)
Source: R. Lindsey, “If carbon dioxide hits a new high every year, why isn’t every year hotter than the last?” https://www.climate.gov/news-features/climate-qa/if-carbon-dioxide-hits-new-high-every-year-why-isn%E2%80%99t-every-year-hotter-last (accessed February 15, 2021).
GHG Control Measures: Although CO2 is not a criteria air pollutant, U.S. EPA has taken steps to regulate GHG emissions under the Clean Air Act. In its 2007 ruling in Massachusetts v. EPA, the U.S. Supreme Court ruled that GHGs, including CO2, are pollutants covered by the Act.58 The Court ordered the U.S. EPA to determine whether GHGs contribute to air pollution and pose a threat to human health. U.S. EPA issued its “endangerment finding” on December 7, 2009, ruling that GHGs exacerbate air pollution and threaten human health and welfare (74 FR 66496). Research demonstrates that taking steps to mitigate GHG emissions can help improve air quality and public health. One study found that the air quality benefits associated with cutting GHG emissions can offset the costs of implementing these regulations by orders of magnitude.59 In December 2015, leaders of 196 countries adopted the Paris Agreement, which commits the international community to hold the increase in global temperatures “to well below 2°C above pre-industrial levels and pursue efforts to limit the temperature increase to 1.5°C.”60 To remain below 2°C, global GHG emissions must peak by 2030, decline approximately 40-70% by 2050 (compared to 2010 levels), and reach near-zero levels by 2100.61 To meet these benchmarks, emissions will need to decline by approximately 2.7% and 7.6% per year to keep warming below 2°C and 1.5°C, respectively.62
58 Massachusetts v. EPA, 127 S. Ct. 1438 (2007). 59 T.M. Thompson, S. Rausch, R.K. Saari, and N.E. Selin, “A systems approach to evaluating the air quality co-benefits of US carbon policies,” Nature Climate Change 4 (2014), 917-923. 60 Paris Agreement, United Nations Framework Convention on Climate Change (UNFCCC), Dec., 12, 2015, FCCC/CP/2015/10/Add.1. 61 IPCC, 20. 62 United Nations Environment Programme (UNEP), Emissions Gap Report 2019 (Nairobi: UNEP, 2019), https://wedocs.unep.org/bitstream/handle/20.500.11822/30797/EGR2019.pdf?sequence=1&isAllowed=y (accessed February 15, 2021).

60
Sources: GHG emissions have increased dramatically in recent years. Nearly half of all manmade GHG emissions generated since 1750 were released over just the past four decades.63 Global GHG emissions from fossil fuels reached 49.4 gigatons of CO2 equivalent (GtCO2e) in 2016, up from less than 35 GtCO2e in 1990.64 Electricity generation and heat accounted for the largest share (30.5%) of emissions, followed by transportation (15.9%), manufacturing (12.4%), and agriculture (11.7%). Emissions from electricity/heat and transportation rose by 74.4% and 71.2% from 1990-2016, respectively. In the U.S., the electric power sector released 1,798.9 million metric tons of CO2 equivalent (MMTCO2e) in 2018, accounting for 27.1% of total emissions (see Figure 40).65 But transportation makes up a larger share of GHG emissions in the U.S. than it does globally—the sector generated 1,882.6 MMTCO2e, equal to 28.4% of emissions. Transportation sector emissions rose by 23.3% from 1990 to 2018; however, this increase in emissions was smaller than the 46.1% increase in VMT, as a result of the improving vehicle fuel economy during that period.66
Figure 40: Share of GHG Emissions by Sector – United States
Source: U.S. EPA, Inventory of U.S. Greenhouse Gas Emissions and Sinks: 1990–2018 (Washington, D.C.: U.S. EPA, 2020), https://www.epa.gov/sites/production/files/2020-04/documents/us-ghg-inventory-2020-main-text.pdf (accessed February 15, 2021).
63 IPCC, 4. 64 World Resources Institute (WRI), CAIT Country Greenhouse Gas Emissions Data (1990-2016), (Washington, DC: WRI, 2019), https://www.climatewatchdata.org/ghg-emissions (accessed February 15, 2021). 65 U.S. EPA, Inventory of U.S. Greenhouse Gas Emissions and Sinks: 1990–2018 (Washington, D.C.: U.S. EPA, 2020), https://www.epa.gov/sites/production/files/2020-04/documents/us-ghg-inventory-2020-main-text.pdf (accessed February 15, 2021). 66 Ibid., 2-32.
Transportation28.4%
Electric Power27.1%
Industrial22.2%
Agricultural9.9%
Commercial6.7%
Residential5.7%

61
According to the U.S. Energy Information Agency (EIA), the transportation sector made up 30.5% of total GHGs in Ohio, second only to the electric power industry.67 Due in large part to Ohio’s reliance on coal-fired power plants, this sector makes up a greater share of total GHGs in the state (38.8%) than it does nationally (29.7%).68 Nevertheless, while GHG emissions from electricity generation fell by 5.2% nationally and 28.1% in Ohio from 1990 to 2017, transportation sector emissions actually increased by 22.2% and 12.8%, respectively. Figure 41 breaks down GHG emissions in Ohio by economic sector.
Figure 41: Share of GHG Emissions by Sector – Ohio
EIA, “State Carbon Dioxide Emissions 2017,” http://www.eia.gov/environment/emissions/state/ (accessed February 15, 2021).
67 Energy Information Agency, “State CO2 Emissions 2017,” http://www.eia.gov/environment/emissions/state/ (accessed February 15, 2021). 2018 estimates will not be available until May 2021. 68 Ibid.
Electric Power38.8%
Transportation30.5%
Industrial17.3%
Commerical5.4%
Residential8.0%
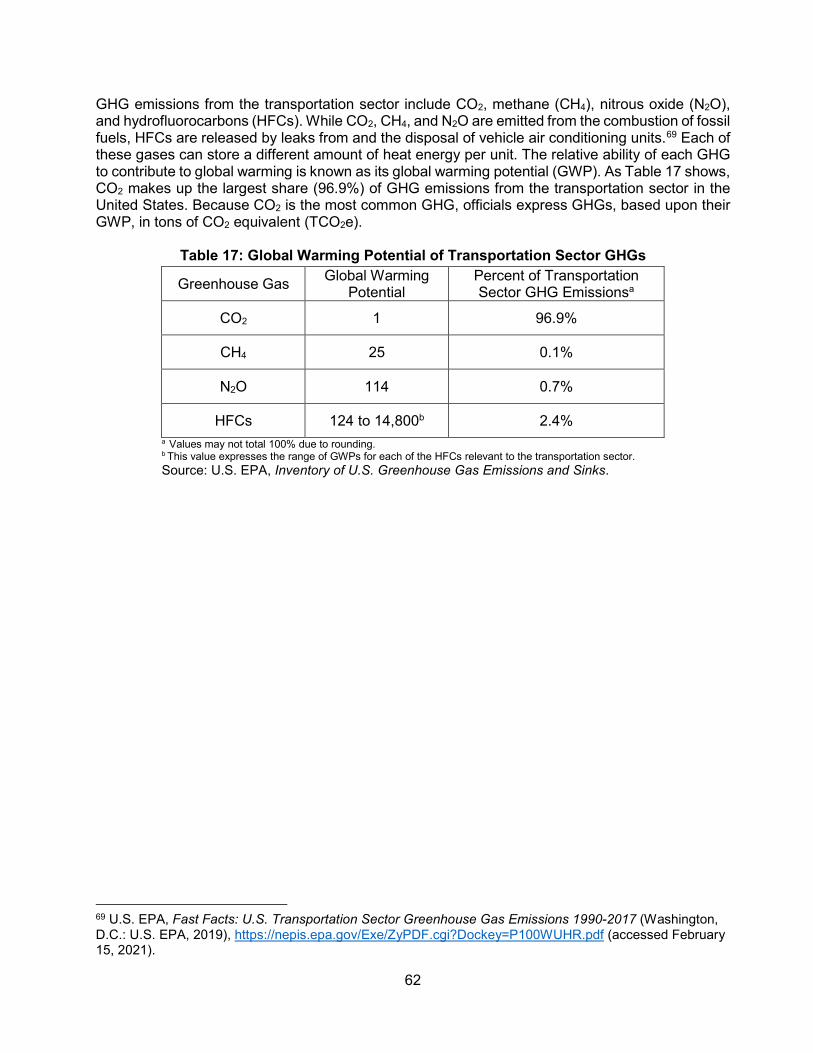
62
GHG emissions from the transportation sector include CO2, methane (CH4), nitrous oxide (N2O), and hydrofluorocarbons (HFCs). While CO2, CH4, and N2O are emitted from the combustion of fossil fuels, HFCs are released by leaks from and the disposal of vehicle air conditioning units.69 Each of these gases can store a different amount of heat energy per unit. The relative ability of each GHG to contribute to global warming is known as its global warming potential (GWP). As Table 17 shows, CO2 makes up the largest share (96.9%) of GHG emissions from the transportation sector in the United States. Because CO2 is the most common GHG, officials express GHGs, based upon their GWP, in tons of CO2 equivalent (TCO2e).
Table 17: Global Warming Potential of Transportation Sector GHGs
Greenhouse Gas Global Warming Potential
Percent of Transportation Sector GHG Emissionsa
CO2 1 96.9%
CH4 25 0.1%
N2O 114 0.7%
HFCs 124 to 14,800b 2.4% a Values may not total 100% due to rounding. b This value expresses the range of GWPs for each of the HFCs relevant to the transportation sector.
Source: U.S. EPA, Inventory of U.S. Greenhouse Gas Emissions and Sinks.
69 U.S. EPA, Fast Facts: U.S. Transportation Sector Greenhouse Gas Emissions 1990-2017 (Washington, D.C.: U.S. EPA, 2019), https://nepis.epa.gov/Exe/ZyPDF.cgi?Dockey=P100WUHR.pdf (accessed February 15, 2021).

63
6.1 Transportation Sector Greenhouse Gas Emissions in Northeast Ohio As for both Ohio and the United States, transportation accounts for around one-quarter of total GHG emissions in Northeast Ohio.70 Transportation sector GHG emissions vary by county. NOACA used U.S. EPA’s Motor Vehicle Emissions Simulator (MOVES), version 2014a, in emissions rates mode to model on-road GHG emissions during 2019 for the five-county NOACA region. Table 18 displays each county’s relative share of emissions, along with its percentage of the region’s total population. Regionally, transportation accounted for more than 8.7 MMTCO2e last year. Unsurprisingly, Cuyahoga County, which has the largest population, has consistently generated more GHGs than any of the four other counties in the area. In 2019, Cuyahoga County accounted for 57.2% of total emissions, lower than its share of the regional population (60.3%). Two of the four other counties generated a larger share of GHGs than their share of regional population; the largest disparity occurred in Medina County, which generated 11.6% of GHGs but is home to just 8.8% of the population. Lake County’s GHG share was equal to its population share. Figure 42 illustrates the breakdown of GHG emissions by county. Based upon these estimates, Northeast Ohio residents produced 4.3 tons of on-road CO2e per capita during 2019, below the national average of 4.8. The per capita totals ranged from a low of 4 tons per capita in Cuyahoga County to a high of 5.6 tons per capita in Medina County.
Table 18: Population & On-Road GHG Emissions in Northeast Ohio
a U.S. Census Bureau, “2019 American Community Survey 1-Year Population Estimates.” b GHG totals are depicted in metric tons of CO2e. One metric ton is equal to 1.102 US tons. Source: NOACA estimates using MOVES2014a.
70 GreenCityBlueLake Institute (GCBL), Inventory: Northeast Ohio greenhouse gas emissions (Cleveland: GreenCityBlueLake, 2012), http://www.gcbl.org/files/resources/ghgfinal2.pdf (accessed February 15, 2021).
County 2019 Populationa
% 2019 NOACA
Population
2019 GHG Emissions (MTCO2e)b
% 2019 NOACA
GHG Emissions
GHG Tons Per Capitab
Cuyahoga 1,235,072 60.3% 4,979,455 57.2% 4.0
Geauga 93,649 4.6% 437,143 5.0% 4.7
Lake 230,149 11.2% 976,097 11.2% 4.2
Lorain 309,833 15.1% 1,308,449 15.0% 4.2
Medina 179,746 8.8% 1,010,239 11.6% 5.6
Totals 2,048,449 8,711,383 4.3

64
Figure 42: Share of On-Road GHG Emissions in Northeast Ohio in 2019 by County
Source: NOACA estimates using MOVES2014a. Within Northeast Ohio, light-duty vehicles, which include passenger cars and light-duty trucks, such as sport utility vehicles (SUVs), account for the vast majority of transportation sector GHGs (76.6%) and the largest share of vehicles (93.3%) (see Table 19). While medium- and heavy-duty trucks make up just 3.6% of total vehicles, they generate 21.7% of total GHGs. Combined, motorcycles and buses account for 1.7% of total on-road GHG emissions.
Table 19: Northeast Ohio On-Road GHG Emissions by Vehicle Type
a GHG totals are depicted in metric tons of CO2e. a Values may not total 100% due to rounding. Source: NOACA estimates using MOVES2014a.
Vehicle Type 2019 GHG Emissions (MTCO2e)a
% 2019 GHG Emissionsb
% 2019 Vehicle Population
Light-Duty Vehicles 6,676,203 76.6% 93.3%
Passenger Cars 2,689,175 30.9% 49.5%
Light-Duty Trucks 3,987,029 45.8% 43.8%
Motorcycles 567 0.01% 2.9%
Buses 147,083 1.7% 0.2%
Medium- and Heavy-Duty Trucks 1,887,530 21.7% 3.6%
Cuyahoga57.2%
Geauga5.0%
Lake11.2%
Lorain15.0%
Medina11.6%

65
6.2 Impacts of Climate Change on Air Quality in Northeast Ohio Air pollution can contribute directly to climate change. Multiple criteria air pollutants are also GHGs. Both O3 and PM2.5, which are highly potent GHGs, are known as short-lived climate pollutants, which drive both poor local air quality and global warming. Black carbon (a species of PM2.5), for instance, has a GWP of approximately 3,200 over a 20-year period.71 According to the United Nations Environment Programme (UNEP) and the World Meteorological Organization (WMO), mitigating these short-lived climate pollutants could reduce future global warming by 0.5°C.72 Climate change may, in turn, degrade air quality in Northeast Ohio. Ground-level O3 forms most readily on calm, warm summer days. Climate change appears to be making these stagnant air days more common, as Cleveland experienced eight more stagnant summer days per year, on average, since 1973.73 This trend will continue to do so in the coming decades. From 1980-2010, Northeast Ohio experienced roughly nine days per year when ambient air temperatures exceeded 90°F.74 This number will increase significantly over the next several decades, as the region’s maximum annual daily temperature is projected to rise 2.8-4.4°F by 2050 and 5.8-9.7°F by 2099.
Figure 43: Projected Maximum Daily Temperatures (March-October) by County
Source: USGS, “National Climate Change Viewer,” https://www2.usgs.gov/landresources/lcs/nccv.asp (accessed February 15, 2021).
71 WHO, Reducing global health risks, 29. 72 UNEP & WMO, Integrated Assessment of Black Carbon and Tropospheric Ozone (Nairobi: UNEP & WMO, 2011), https://wedocs.unep.org/rest/bitstreams/12809/retrieve (accessed February 15, 2021). 73 Climate Central, “Stagnant Summer Days on the Rise in U.S.,” http://www.climatecentral.org/news/stagnant-summer-days-on-rise-19280 (accessed February 15, 2021). 74 National Oceanic and Atmospheric Administration (NOAA), “NOAA's 1981-2010 Climate Normals,” https://www.ncdc.noaa.gov/data-access/land-based-station-data/land-based-datasets/climate-normals/1981-2010-normals-data l (accessed February 15, 2021).
62.0°F
64.0°F
66.0°F
68.0°F
70.0°F
72.0°F
74.0°F
76.0°F
78.0°F
80.0°F
82.0°F
Ashtabula Cuyahoga Geauga Lake Lorain Medina Portage Summit
1980-2010 2050-2074 (Low) 2050-2074 (High) 2075-2099 (Low) 2075-2099 (High)

66
As Figure 43 shows, maximum daily temperatures during the ozone season (March-October) in the eight-county air quality planning area may increase 4.4-5.2°F by 2050-2074 and 5.2-9.8°F by 2075-2099, compared to the 1981-2010 baseline. In the latter, most extreme case, summer temperatures would exceed 92°F on a daily basis.75 Northeast Ohio may experience 29 to 34 days over 90°F per year by 2050, a number that may jump to 40-85 by the end of the century.76 Such increases in ambient temperatures would make it more likely for ground-level O3 to form, effectively offsetting some of the benefits of continued emissions reductions. However, this relationship is not necessarily linear; some research suggests that temperatures above 95°F can actually suppress further ozone formation.77 U.S. EPA estimates that climate change may increase daily Eight-Hour maximum ozone levels by 1-5 ppb in 2030.78 As noted earlier, each 1°C increase in daily maximum temperatures in Northeast Ohio is associated with a 1.3 ppb (0.71 per 1°F) increase in daily O3 concentrations. From 2000-2019, there were 274 days when maximum daily Eight-Hour O3 concentrations were 66-70 ppb in the region, an average of nearly 14 per year. If the O3 level increases by 5 ppb – which seems possible, given projected temperature increases – that could lead to a significant increase in exceedance days in Northeast Ohio this century. The public health impacts of this increase could be substantial; according to one study, a long-term, 3 ppb increase in O3 levels is equivalent to smoking for 29 years or aging three years.79 The effect of climate change on PM2.5 in Northeast Ohio remains more ambiguous. Change in temperature and precipitation patterns will likely contribute to an increase in the frequency and intensity of wildfires in the western U.S., but this outcome is unlikely to affect air quality in Northeast Ohio.80 The region may see a significant increase in the number of hot summer days, which are conducive to PM2.5 formation.81 Yet, there is currently no consensus on whether climate change will necessarily increase PM2.5 levels in the U.S. in the coming decades.
75 Projections are drawn from the U.S. Geological Survey’s “National Climate Change Viewer,” which produces downscaled climate projections based on global climate models from the IPCC. 76 U.S. Federal Government, “U.S. Climate Resilience Toolkit,” http://toolkit.climate.gov (accessed February 15, 2021). 77 L. Shen, L.J. Mickley, and E. Gilleland, “Impact of increasing heat waves on U.S. ozone episodes in the 2050s: Results from a multimodal analysis using extreme value theory,” Geophysical Research Letters 43, no. 8 (2016), 4017-4025. 78 U.S. Global Change Research Program (USGCRP), The Impacts of Climate Change on Human Health in the United States: A Scientific Assessment (Washington, D.C.: USGCRP, 2016), 74-75, https://s3.amazonaws.com/climatehealth2016/low/ClimateHealth2016_FullReport_small.pdf (accessed February 15, 2021). 79 M. Wang, et al, “Association Between Long-Term Exposure to Ambient Air Pollution and Change in Quantitatively Assessed Emphysema and Lung Function,” JAMA 322, no. 6 (2019), 546-556. 80 J.S. Melillo, T.C. Richmond, and G.W. Yohe, eds., Climate Change Impacts in the United States: The Third National Climate Assessment (Washington, D.C.: U.S. Global Change Research Program, 2014), 177-178, http://nca2014.globalchange.gov/ (accessed February 15, 2021). 81 Risky Business Project, 13.

67
7. Conclusion As this report demonstrates, air quality remains an important issue in Northeast Ohio. While the region’s air quality has improved considerably since the passage of the 1970 CAA, with criteria pollutant levels falling by anywhere from 16-84%, portions of the eight-county NOACA air quality planning area remained in nonattainment for one or more of the NAAQS during 2019. Additionally, transportation is a leading source of GHG emissions throughout the region, and its share may become even larger as the region continues to shift away from coal for electricity generation. In its capacity as both the regional air quality and transportation planning agency, NOACA continues to collect information on regional air quality, educate the public on air quality and its linkages to transportation, and strive to increase transportation choice within the region (i.e., reduce single-occupancy vehicle trips). The agency operates or implements a number of programs to serve these goals, such as Gohio Commute, the Commuter Choice Awards, air quality advisories, the Congestion Mitigation for Air Quality Improvement (CMAQ) Program, the Signal Timing and Optimization Program (STOP), and the Transportation for Livable Communities Initiative (TLCI). These programs further the agency’s vision to build a multimodal transportation system that enhances quality of life in Northeast Ohio. For more information on these programs, visit noaca.org.
For More Information More criteria pollutant data is available from the following agencies:
• U.S. EPA: https://www.epa.gov/outdoor-air-quality-data • Ohio EPA: www.epa.ohio.gov/dapc/airohio/index.aspx • Cleveland Division of Air Quality:
http://www.clevelandhealth.org/network/air_quality/air_quality.php • Akron Regional Air Quality Management District: http://www.araqmd.org/ • Lake County General Health District: https://www.lcghd.org/
NOACA thanks the above agencies for their assistance with this report, as well as for their tireless efforts to collect meaningful, accurate air quality data for Northeast Ohio.

68
Appendix A: O3 Exceedance Days 2000-2019
Year Eight-Hour
Ozone NAAQS
Exceedance Date No. of Monitors Exceeding the
NAAQS Highest Monitor
2000 85 ppb May 31, 2000 1 93 ppb (Ashtabula) June 1, 2000 1 89 ppb (Geauga) June 9, 2000 10 106 ppb (Ashtabula) June 10, 2000 9 101 ppb (Ashtabula) July 13, 2000 2 94 ppb (Summit) July 28, 2000 1 87 ppb (Lake) Total 6 days 2001 85 ppb May 3, 2001 5 99 ppb (Geauga) May 4, 2001 5 92 ppb (Geauga) June 13, 2001 5 91 ppb (Cuyahoga) June 14, 2001 7 100 ppb (Lake) June 15, 2001 1 87 ppb (Geauga) June 19, 2001 10 105 ppb (Ashtabula) June 26, 2001 1 86 ppb (Ashtabula) June 27, 2001 3 102 ppb (Ashtabula) June 28, 2001 6 103 ppb (Portage) June 29, 2001 4 105 ppb (Ashtabula) July 15, 2001 1 94 ppb (Ashtabula) July 16, 2001 1 89 ppb (Geauga) July 17, 2001 6 101 ppb (Geauga) July 18, 2001 4 108 ppb (Summit) July 19, 2001 2 87 ppb (Lorain) July 20, 2001 2 96 ppb (Geauga) July 22, 2001 1 87 ppb (Geauga) July 24, 2001 1 87 ppb (Geauga) July 31, 2001 3 100 ppb (Summit) August 1, 2001 9 102 ppb (Geauga) August 2, 2001 2 97 ppb (Geauga) August 6, 2001 1 90 ppb (Geauga) August 7, 2001 1 92 ppb (Geauga) August 9, 2001 1 91 ppb (Lake) Total 24 days 2002 85 ppb June 9, 2002 7 99 ppb (Summit) June 10, 2002 5 100 ppb (Portage) June 11, 2002 3 92 ppb (Ashtabula) June 20, 2002 7 104 ppb (Lake) June 21, 2002 6 108 ppb (Ashtabula) June 22, 2002 9 103 ppb (Lake) June 23, 2002 8 107 ppb (Ashtabula)

69
Year Eight-Hour
Ozone NAAQS
Exceedance Date No. of Monitors Exceeding the
NAAQS Highest Monitor
June 24, 2002 6 105 ppb (Summit) June 25, 2002 8 114 ppb (Geauga) June 30, 2002 4 96 ppb (Ashtabula) July 1, 2002 5 100 ppb (Summit) July 4, 2002 1 92 ppb (Ashtabula) July 8, 2002 7 117 ppb (Geauga) July 13, 2002 3 101 ppb (Summit) July 14, 2002 9 103 ppb (Summit) July 15, 2002 9 112 ppb (Summit) July 17, 2002 10 115 ppb (Lake) July 18, 2002 7 103 ppb (Lake) July 21, 2002 2 101 ppb (Geauga) July 26, 2002 1 87 ppb (Geauga) July 31, 2002 3 94 ppb (Lake) August 1, 2002 7 115 ppb (Geauga) August 4, 2002 5 100 ppb (Lake) August 10, 2002 11 115 ppb (Geauga) August 11, 2002 9 122 ppb (Geauga) August 13, 2002 7 107 ppb (Geauga) August 21, 2002 1 90 ppb (Geauga) September 7, 2002 3 93 ppb (Lake) September 8, 2002 10 110 ppb (Geauga) September 9, 2002 9 113 ppb (Lake) September 10, 2002 8 104 ppb (Lake) Total 31 days 2003 85 ppb June 23, 2003 10 120 ppb (Geauga) June 24, 2003 7 123 ppb (Portage) June 25, 2003 9 112 ppb (Lake) July 3, 2003 8 99 ppb (Ashtabula) August 15, 2003 1 93 ppb (Geauga) August 20, 2003 1 95 ppb (Geauga) August 21, 2003 1 89 ppb (Ashtabula) August 25, 2003 1 91 ppb (Geauga) Total 8 days 2004 85 ppb May 12, 2004 1 88 ppb (Ashtabula) May 13, 2004 1 88 ppb (Ashtabula) July 2, 2004 1 87 ppb (Summit) July 3, 2004 1 87 ppb (Summit) August 2, 2004 2 87 ppb (Geauga) August 3, 2004 1 86 ppb (Portage) Total 6 days 2005 85 ppb June 7, 2005 2 89 ppb (Ashtabula)

70
Year Eight-Hour
Ozone NAAQS
Exceedance Date No. of Monitors Exceeding the
NAAQS Highest Monitor
June 8, 2005 3 103 ppb (Lake) June 9, 2005 1 95 ppb (Lake) June 21, 2005 2 86 ppb (Geauga) June 24, 2005 5 94 ppb (Lake) June 25, 2005 2 104 ppb (Ashtabula) June 26, 2005 3 94 ppb (Medina) June 27, 2005 10 118 ppb (Lake) June 29, 2005 1 86 ppb (Portage) July 10, 2005 6 95 ppb (Ashtabula) July 11, 2005 5 101 ppb (Medina) July 12, 2005 3 95 ppb (Lake) July 20, 2005 2 90 ppb (Geauga) August 1, 2005 1 91 ppb (Lake) August 2, 2005 2 93 ppb (Portage) August 3, 2005 3 89 ppb (Geauga) Total 16 days 2006 85 ppb May 29, 2006 1 86 ppb (Ashtabula) May 30, 2006 2 99 ppb (Ashtabula) June 16, 2006 1 90 ppb (Cuyahoga) June 17, 2006 1 99 ppb (Ashtabula) July 16, 2006 1 90 ppb (Ashtabula) Total 5 days 2007 85 ppb April 22, 2007 1 87 ppb (Cuyahoga) May 23, 2007 1 103 ppb (Cuyahoga) May 24, 2007 4 95 ppb (Ashtabula) May 30, 2007 1 89 ppb (Summit) May 31, 2007 3 98 ppb (Ashtabula) June 17, 2007 1 90 ppb (Summit) June 18, 2007 1 89 ppb (Summit) July 10, 2007 1 90 ppb (Ashtabula) August 1, 2007 2 92 ppb (Summit) August 2, 2007 1 89 ppb (Summit) August 28, 2007 1 86 ppb (Summit) August 29, 2007 2 92 ppb (Ashtabula) September 6, 2007 1 92 ppb (Ashtabula) Total 13 days 2008 75 ppb April 18, 2008 5 82 ppb (Geauga) New April 19, 2008 1 78 ppb (Ashtabula) NAAQS May 30, 2008 2 83 ppb (Geauga) June 12, 2008 5 83 ppb (Cuyahoga) July 7, 2008 1 76 ppb (Lake) July 18, 2008 2 81 ppb (Ashtabula)

71
Year Eight-Hour
Ozone NAAQS
Exceedance Date No. of Monitors Exceeding the
NAAQS Highest Monitor
July 28, 2008 3 81 ppb (Ashtabula) July 29, 2008 5 88 ppb (Cuyahoga) August 21, 2008 5 85 ppb (Cuyahoga) September 2, 2008 4 80 ppb (Medina) September 3, 2008 8 92 ppb (Summit) September 4, 2008 7 85 ppb (Cuyahoga) Total 12 days 2009 75 ppb May 20, 2009 2 79 ppb (Lake) May 21, 2009 4 86 ppb (Lake) June 25, 2009 3 88 ppb (Lake) Total 3 days 2010 75 ppb April 15, 2010 6 87 ppb (Geauga) May 27, 2010 3 82 ppb (Summit) June 18, 2010 1 79 ppb (Lake) July 3, 2010 1 80 ppb (Lake) July 4, 2010 2 85 ppb (Ashtabula) July 6, 2010 4 88 ppb (Ashtabula) July 7, 2010 4 83 ppb (Ashtabula) July 8, 2010 6 89 ppb (Lake) August 2, 2010 2 81 ppb (Geauga) August 9, 2010 2 85 ppb (Lake) August 10, 2010 1 77 ppb (Lake) August 29, 2010 3 78 ppb (Lake) August 30, 2010 4 80 ppb (Lake) August 31, 2010 1 78 ppb (Ashtabula) October 10, 2010 1 80 ppb (Geauga) Total 15 days 2011 75 ppb June 4, 2011 4 86 ppb (Cuyahoga) June 6, 2011 2 78 ppb (Cuyahoga June 8, 2011 4 87 ppb (Ashtabula) June 30, 2011 1 76 ppb (Summit) July 1, 2011 5 85 ppb (Summit) July 6, 2011 7 90 ppb (Lake) July 10, 2011 2 78 ppb (Cuyahoga) July 12, 2011 2 78 ppb (Lake) July 20, 2011 4 88 ppb (Lake) July 21, 2011 1 78 ppb (Lake) July 22, 2011 1 82 ppb (Cuyahoga) September 1, 2011 1 79 ppb (Lake) September 2, 2011 2 80 ppb (Lake) September 3, 2011 3 77 ppb (Cuyahoga) Total 14 days

72
Year Eight-Hour
Ozone NAAQS
Exceedance Date No. of Monitors Exceeding the
NAAQS Highest Monitor
2012 75 ppb May 15, 2012 1 76 ppb (Cuyahoga) May 19, 2012 5 88 ppb (Cuyahoga) May 20, 2012 3 83 ppb (Cuyahoga) May 21, 2012 3 83 ppb (Cuyahoga) May 25, 2012 3 82 ppb (Lake) May 28, 2012 1 76 ppb (Cuyahoga) June 9, 2012 6 84 ppb (Cuyahoga) June 10, 2012 6 93 ppb (Ashtabula) June 15, 2012 2 79 ppb (Cuyahoga) June 16, 2012 1 76 ppb (Cuyahoga) June 20, 2012 3 83 ppb (Cuyahoga) June 21, 2012 2 81 ppb (Ashtabula) June 28, 2012 11 108 ppb (Lake) June 29, 2012 3 82 ppb (Lake) July 6, 2012 2 88 ppb (Lake) July 7, 2012 7 94 ppb (Cuyahoga) July 12, 2012 5 89 ppb (Cuyahoga) July 13, 2012 2 76 ppb (Cuyahoga, Lake) July 22, 2012 2 77 ppb (Lake) July 26, 2012 1 77 ppb (Lake) July 31, 2012 1 77 ppb (Lake) August 2, 2012 3 87 ppb (Cuyahoga) August 3, 2012 5 92 ppb (Lake) August 8, 2012 2 76 ppb (Cuyahoga) August 24, 2012 5 89 ppb (Lake) August 25, 2012 1 78 ppb (Lorain) Total 26 days 2013 75 ppb June 21, 2013 4 127 ppb (Cuyahoga) Total 1 day 2014 75 ppb April 21, 2014 2 78 ppb (Lake) May 26, 2014 2 76 ppb (Lake) June 28, 2014 1 79 ppb (Lake) Total 3 days 2015 75 ppb May 8, 2015 4 79 ppb (Ashtabula) July 29, 2015 1 80 ppb (Geauga) Total 2 days 2016 70 ppb April 18, 2016 3 77 ppb (Geauga) May 24, 2016 6 82 ppb (Geauga) May 25, 2016 5 83 ppb (Lake) June 2, 2016 1 72 ppb (Geauga)

73
Year Eight-Hour
Ozone NAAQS
Exceedance Date No. of Monitors Exceeding the
NAAQS Highest Monitor
June 10, 2016 2 74 ppb (Cuyahoga) June 11, 2016 6 80 ppb (Lake) June 19, 2016 1 72 ppb (Lake) June 22, 2016 2 73 ppb (Geauga) July 7, 2016 2 74 ppb (Lake) July 12, 2016 1 71 ppb (Lake) July 21, 2016 1 74 ppb (Lake) July 23, 2016 1 76 ppb (Lake) September 22, 2016 1 76 ppb (Geauga) September 23, 2016 2 74 ppb (Geauga) Total 14 days 2017 70 ppb May 16, 2017 3 72 ppb (Lake) June 10, 2017 5 75 ppb (Lake) June 11, 2017 1 72 ppb (Lake) June 13, 2017 6 83 ppb (Lake) July 19, 2017 4 84 ppb (Lake) July 27, 2017 2 73 ppb (Lake) Total 6 days 2018 70 ppb May 17, 2018 2 72 ppb (Lake) May 25, 2018 5 80 ppb (Cuyahoga)
May 28, 2018 4 73 ppb (Cuyahoga, Geauga)
May 29, 2018 2 73 ppb (Cuyahoga, Geauga)
June 16, 2018 2 75 ppb (Cuyahoga) June 17, 2018 2 76 ppb (Lake) June 29, 2018 4 78 ppb (Cuyahoga, Lake) June 30, 2018 1 73 ppb (Lake) July 9, 2018 2 72 ppb (Geauga) July 10, 2018 2 72 ppb (Geauga) July 13, 2018 1 71 ppb (Cuyahoga) July 14, 2018 4 76 ppb (Lake) July 15, 2018 6 80 ppb (Cuyahoga) Total 13 days 2019 70 ppb June 27, 2019 2 72 ppb (Cuyahoga) June 28, 2019 3 75 ppb (Lake) June 29, 2019 1 71 ppb (Lake) July 10, 2019 4 76 ppb (Geauga) July 13, 2019 3 73 ppb (Summit) August 4, 2019 1 72 ppb (Lake) Total 6 days
Source: U.S. EPA, “Air Quality System” data, https://www.epa.gov/aqs (accessed February 15, 2021).

74
Appendix B: PM2.5 Exceedance Days 2007-2019
Year 24-Hour
PM2.5 NAAQS1
Exceedance Date Number of Monitors
Exceeding NAAQS
Highest Monitor (Readings in µg/m3)
2007 35 µg/m3 May 24, 2007 7 42 (Cuyahoga) September 6, 2007 9 43 (Lake) September 21, 2007 5 41 (Lake) December 26, 2007 1 37 (Cuyahoga) Total 4 days 2008 35 µg/m3 January 28, 2008 5 41 (Cuyahoga) February 24, 2008 7 44 (Summit) March 10, 2008 2 39 (Cuyahoga) July 29, 2008 7 40 (Cuyahoga) September 3, 2008 1 37 (Cuyahoga) September 21, 2008 1 40 (Summit) Total 6 days 2009 35 µg/m3 February 9, 2009 1 37 (Cuyahoga) Total 1 day 2010 35 µg/m3 February 2, 2010 1 35.3 (Summit) February 3, 2010 1 36.6 (Summit) March 8, 2010 1 35.8 (Summit) March 9, 2010 10 52.6 (Cuyahoga) July 7, 2010 1 36.9 (Summit) August 3, 2010 1 38.9 (Summit) October 11, 2010 1 35.1 (Summit) November 20, 2010 1 36.3 (Summit) Total 8 days 2011 35 µg/m3 January 6, 2011 1 38 (Cuyahoga) September 2, 2011 1 36 (Cuyahoga) Total 2 days 2012 35 µg/m3 May 25, 2012 1 49 (Cuyahoga) May 27, 2012 1 37 (Cuyahoga) November 9, 2012 1 37 (Cuyahoga) November 17, 2012 2 37 (Cuyahoga) November 21, 2012 2 46 (Cuyahoga) Total 5 days 2013 35 µg/m3 June 21, 2013 1 43 (Cuyahoga) Total 1 day

75
Source: U.S. EPA, “Air Quality System” data, https://www.epa.gov/aqs (accessed February 15, 2021).
Year 24-Hour
PM2.5 NAAQS1
Exceedance Date
Number of Monitors
Exceeding NAAQS
Highest Monitor (Readings in µg/m3)
2014 35 µg/m3 February 13, 2014 1 37 (Cuyahoga) Total 1 day 2015 35 µg/m3 March 10, 2015 2 39 (Cuyahoga) Total 1 day 2016 35 µg/m3 N/A 0 N/A Total 0 days 2017 35 µg/m3 N/A 0 N/A 0 days 2018 35 µg/m3 N/A 0 N/A 0 days 2019 35 µg/m3 November 19, 2019 1 38 (Cuyahoga) 1 day