Embed Size (px)
Citation preview


FRANKLIN BOULEVARDTRAFFIC CALMING STUDY
Public Meeting #3November 13th, 2018

• Project overview
• Diverter demonstration results
• Recommendations
• Brief Q & A
• Breakout to view posters, talk with City, NOACA, CDC staff
MEETING AGENDA

• TLCI Planning process
• Not a monetary award
• Led by NOACA staff
• Jurisdiction provides staff support
NOACA TRANSPORTATION FOR LIVABLE COMMUNITIES INITIATIVE
(TLCI)

• City of Cleveland Planning applied to NOACA for study of Franklin Blvd.
• Through competitive process, NOACA awarded the city a TLCI planning study
• Study began in Fall 2017
HOW IT STARTED

Governmental: NOACA, Councilmembers Matt Zone and Kerry McCormack, City Planning, City Traffic
Orgs. and Groups: Residents and stakeholders,
Ohio City, Inc., Detroit-Shoreway Community Development Corporation, Safe Routes to School, Bike Cleveland
WHO IS INVOLVED?

Identify ways to make Franklin Blvd. safer, more desirable for all road users, particularly pedestrians and bicyclists
Evaluate and prioritize potential traffic calming measures
GOALS OF THIS STUDY

September 2017 – Stakeholder Committee
October 2017 – Public Meeting #1
January 2018 – Stakeholder Committee
March – Public Meeting #2
May – Stakeholder Committee
July-August – City-led diverter demonstration
October – Stakeholder Committee
November – Public Meeting #3: Recommendations
STUDY SCHEDULE

STUDY CORRIDORW
. 8
5th

Street Total Crash Rate
Franklin 17.01
48th to 57th 32.49
Bridge 19.27
44th to 50th, 50th to 58th 27.81
Madison 16.96
100th to 104th 26.62
Western 14.89
101st to 105th, 105th to 111th 20.57
Fulton 8.34
I-90 to Walton 16.40
Scranton 11.87
Agnes to Holmden 17.53
CRASH RATE COMPARISONCrash Rate:
crashes per
million vehicle miles
(2011-2015)
1
2
3
1

CRASH RATE COMPARISONStreet Injury/Fatal Crash Rate
Franklin 4.60
48th to 57th 10.83
Bridge 3.05
44th to 50th, 50th to 58th 6.59
Madison 4.48
100th to 104th 8.28
Western 4.31
101st to 105th, 105th to 111th 6.46
Fulton 1.94
I-90 to Walton 5.11
Scranton 3.10
Agnes to Holmden 4.78
Crash Rate:
crashes per
million vehicle miles
(2011-2015)

CRASH RATE COMPARISONStreet Injury/Fatal Crash Rate
Franklin 4.60
48th to 57th 10.83
Bridge 3.05
44th to 50th, 50th to 58th 6.59
Madison 4.48
100th to 104th 8.28
Western 4.31
101st to 105th, 105th to 111th 6.46
Fulton 1.94
I-90 to Walton 5.11
Scranton 3.10
Agnes to Holmden 4.78
1
2
3
1
Crash Rate:
crashes per
million vehicle miles
(2011-2015)

Among similar area streets:
• Franklin has one of highest crash rates
• Franklin has the highest segment crash rate & highest injury crash rate
• Other area streets may be candidates for traffic calming
CRASH RATE COMPARISON
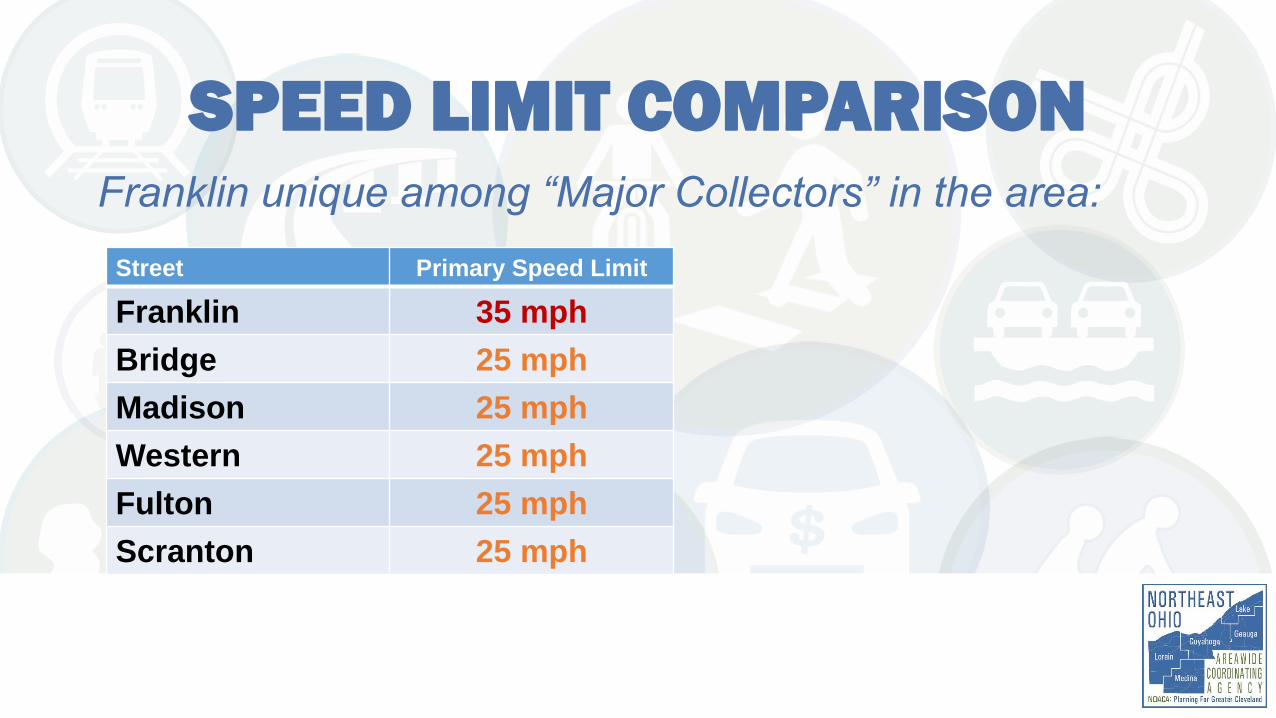
SPEED LIMIT COMPARISON
Street Primary Speed Limit
Franklin 35 mph
Bridge 25 mph
Madison 25 mph
Western 25 mph
Fulton 25 mph
Scranton 25 mph
Franklin unique among “Major Collectors” in the area:

PUBLIC MEETING #1

PUBLIC MEETING #1

SURVEY RESULTSWhy do you travel along or across Franklin?
1. Recreation
2. Commute
3. Exercise
4. Live on
Franklin
School
Commute
Recreation
Exercise
Work-related
Live on
Franklin
Other

SURVEY RESULTSBiggest trouble spots along Franklin Blvd?
1. W. 54th to W. 65th
2. W. 65th to W. 74th
3. W. 38th to W. 48th

SURVEY RESULTSMost important changes you’d like to see along Franklin?
1. Safer to bike on Franklin
2. Slow down traffic
3. Reduce number of crashes
4. Safer to walk across Franklin

EXISTING CONDITIONS SUMMARY
• Cars drive fast
• Street parking is
under-utilized
Higher crash rate
Low visibility
Concerns about traffic
S
S
S
S
S
S
Crossing
concerns
Crossing
concerns
S = School

Two traffic calming Alternatives were presented:
Alternative 1:
Neighborhood Traffic Circles, Curb Extensions, New and Enhanced Pedestrian Crossings
Alternative 2:
Alternative 1 + Traffic Diverters
PUBLIC MEETING #2

PUBLIC MEETING #2

Franklin Blvd. Traffic Calming
Temporary Diverter Demonstration Findings
13 November 2018 1

Diversion: One Potential Solution
• Traffic diversion was shared along with other alternatives at March 6 public meeting
• Diversion was thought to have potential to address quality-of-life concerns in an easily implemented and cost effective manner
• Community concerns were raised about resident access and impact on surrounding neighborhood
13 November 2018
2
13 November 2018
3
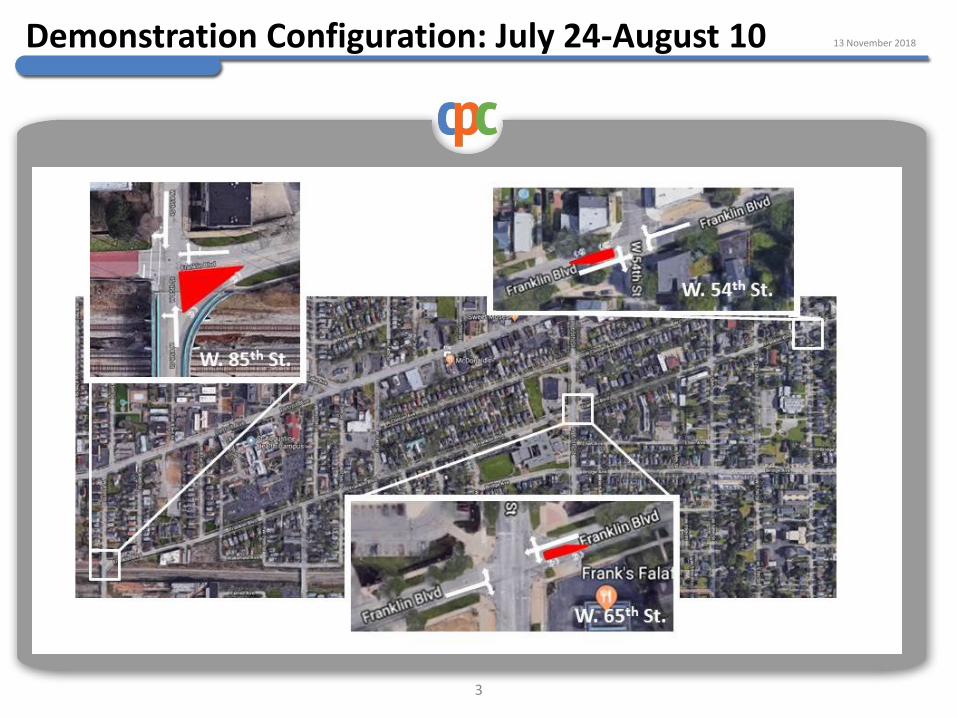
Demonstration Configuration: July 24-August 10

Diversion: One Potential Solution
• Key questions:
• Do traffic diverters achieve the desired effects along the corridor in terms of volume and speed?
• Do any safety or quality-of-life benefits of traffic diversion outweigh the inconvenience for residents?
13 November 2018
4

Temporary Demonstration Goals
To assess the effectiveness of traffic diversion in addressing issues of traffic safety, walkability, and bikeability by discouraging the use of Franklin Boulevard for through-traffic by:
• Expanding familiarity with traffic diversion and engaging the community
• Collecting road user feedback
• Measuring traffic impacts on adjacent streets
• Measuring impact on corridor speed
13 November 2018
5

Conclusion
Due to community feedback, the City of Cleveland recommends that traffic diverters not be included in the final recommendations to calm traffic along the
Franklin Boulevard corridor.
13 November 2018
6

Temporary Demonstration Results Overview
• Expand familiarity with intervention & engage community • Over 500 ‘official’ community responses collected (survey, phone line,
in person meetings)
• Robust social media conversation
13 November 2018
7
Engagement Strategy Count
Attendance at On-Site Q & A Sessions 34
Messages on Recorded Phone Line 42
Survey Participation 430
TOTAL 506

336 completed surveys (430 partial responses)
13 November 2018
8
Survey Responses—Near West

336 completed surveys (430 partial responses)
13 November 2018
9
Survey Responses—Complete

Temporary Demonstration Results Overview
• Collect road user feedback • High attachment to Franklin as intra-neighborhood
connector
• Overall reactions of frustration, annoyance, and inconvenience
• Majority of qualitative feedback from people who regularly walk and bike on Franklin was positive
• 69% to 75% “not at all interested” in permanent installation (variation by intersection)
13 November 2018
10

Temporary Demonstration Results Overview
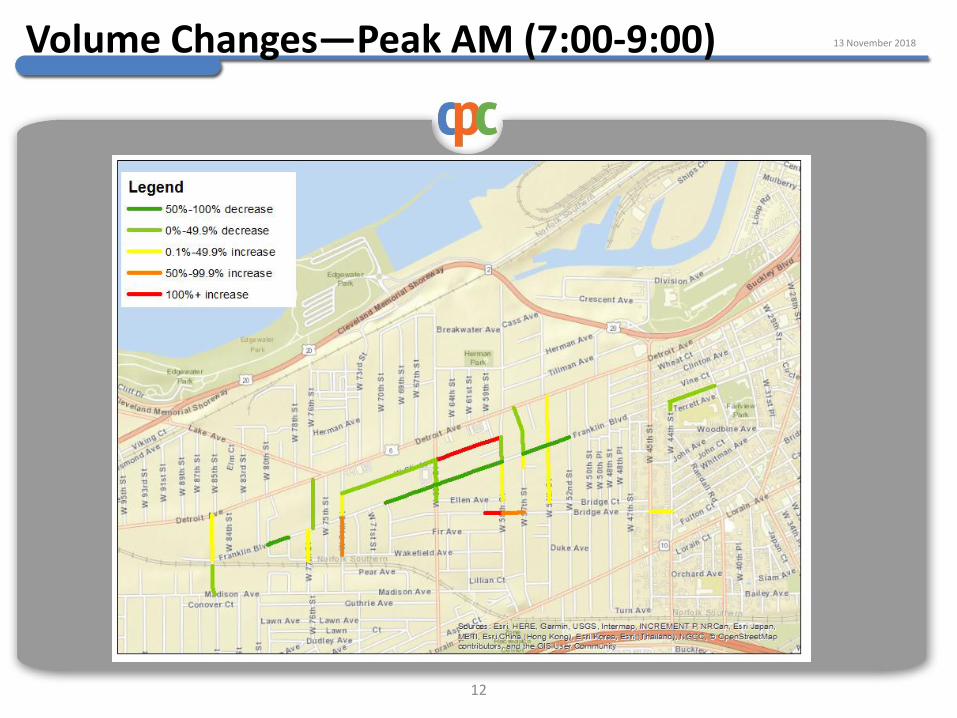
• Measure traffic impact on adjacent streets • 26 street segments monitored for changes
• 18 peak hour screenline volunteer counts, before and during demonstration
• Two 12-hour intersection video counts, before and during demonstration
• Volumes decreased on many neighborhood streets, but increased markedly on segments of W. 54th, W. Clinton, W. 74th, and Bridge
• If there were more community interest, different diverter placements could be explored to mitigate impacts
13 November 2018
11
13 November 2018
12
Volume Changes—Peak AM (7:00-9:00)

13 November 2018
13
Volume Changes—Peak PM (4:00-6:00)

Temporary Demonstration Results Overview
• Measure impact on corridor speed • Low volumes on key corridor segments
• No observed change in 85th percentile speeds
• Lessons learned for temporary installations • Engagement with community, public safety, waste,
maintenance, schools
• Technical aspects: diverter placement and data collection
13 November 2018
14

For additional information:
• Full report posted online: www.noaca.org/franklin
• Calley Mersmann, Bicycle/Pedestrian Coordinator [email protected], 216-664-2952
Interested in diving deeper? Sign up after the meeting.
13 November 2018
15

TRAFFIC CALMING OPTIONS
Neighborhood Traffic Circles
• Discourage speeding
• Reduce crashes
• Reduce delay for all users
• Replace unwarranted traffic signals
with 4-way yield control

TRAFFIC CALMING OPTIONS
Rendering, not a final design
Neighborhood Traffic Circles

TRAFFIC CALMING OPTIONS
Curb Extensions
Cedar and Lee, Cleveland Heights
• Improve pedestrian and
vehicle visibility
• Reduce crossing distance
• Encourage slower turning
speeds
• Give drivers the sense
they are entering a
neighborhood area
TRAFFIC CALMING OPTIONS
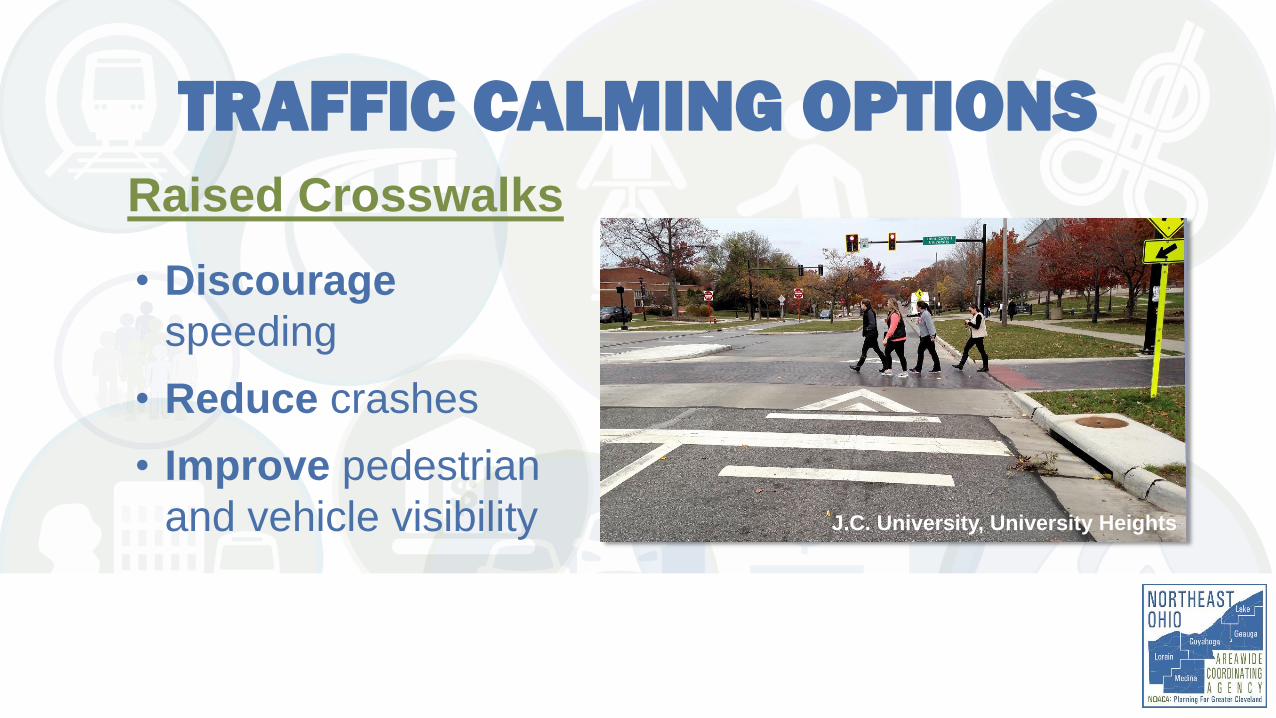
Raised Crosswalks
• Discourage
speeding
• Reduce crashes
• Improve pedestrian
and vehicle visibility J.C. University, University Heights

• Consistently calm traffic along entire Franklin Blvd. corridor
• Remove some traffic signals
• Increase and improvepedestrian crossings, particularly near schools
RECOMMENDATIONS

• 8 traffic signals removed and replaced with calming countermeasures
• 7 Neighborhood Traffic Circles
• Curb extensions at 10 intersections
• 10 new or enhanced pedestrian crossings
• Street parking shift between W. 80th and W. 77th St.
• Lower speed limit to 25 mph
RECOMMENDATIONS

RECOMMENDATIONS
* Raised crosswalk

Traffic Circles: $200,200
Curb Extensions: $414,700
Crossing Improvements: $323,180
Other: $4,290
CONCEPTUAL COST ESTIMATES
TOTAL: $942,370

NOACA’s TLCI Implementation Grants
• Apply in Fall 2019
• Minimum $100,000 funding request
Safe Routes to School Program
ODOT’s Highway Safety Improvement Program
POTENTIAL FUNDING EXAMPLES

• Finalize recommendations
• Move toward implementation
• Consider interim installations
Contacts:• Calley Mersmann (City Planning):[email protected]• Ashley Shaw (Ohio City, Inc.): [email protected]• Ashley Wilson (Detroit-Shoreway): [email protected]• Andrew Stahlke (NOACA): [email protected]
View recommendations and meeting materials:
www.noaca.org/franklin
NEXT STEPS

NOACA will STRENGTHEN regional
cohesion, PRESERVE existing
infrastructure, and BUILD a
sustainable multimodal transportation
system to SUPPORT economic
development and ENHANCE quality
of life in Northeast Ohio.