Embed Size (px)
Citation preview

2018-2022 Financial Plan METRO VANCOUVERBoard Budget Workshop – October 20, 201723502824
2
LONG TERM FINANCIAL PLANNINGProcess – The Driver for Change
• Board Strategic Planning Workshop – February 25, 2017
• Need for a long-term financial framework• Statutory required 5 year plans – members, MVRD• Financial stability / sustainability
• Significant capital requirements• Population growth• Regulatory mandated upgrades• Aging infrastructure• Financial and resource constraints

3
Regional Management Plans
Supplemental Plans
4
LONG TERM FINANCIAL PLANNINGProcess – Thinking Long Term
• Thinking longer term• Proactive vs reactive
• Think strategically• Management plans aligned• Asset Management – maintain vs replace• Operational impacts
• Financial planning evolution• One year• Five year• Long-term
5
LONG TERM FINANCIAL PLANNINGShaping the Plan – Two Scenarios
Developed two scenarios:
Steady as we go Moderate level of risk Service levels maintained Generally consistent with annual budget process
Slowing things down Increased level of risk Service levels tempered - growth Fiscally driven

Themes
Addressing regional growth
System stewardship
Environmental protection & climate action
Opportunities for new & enhanced services
7
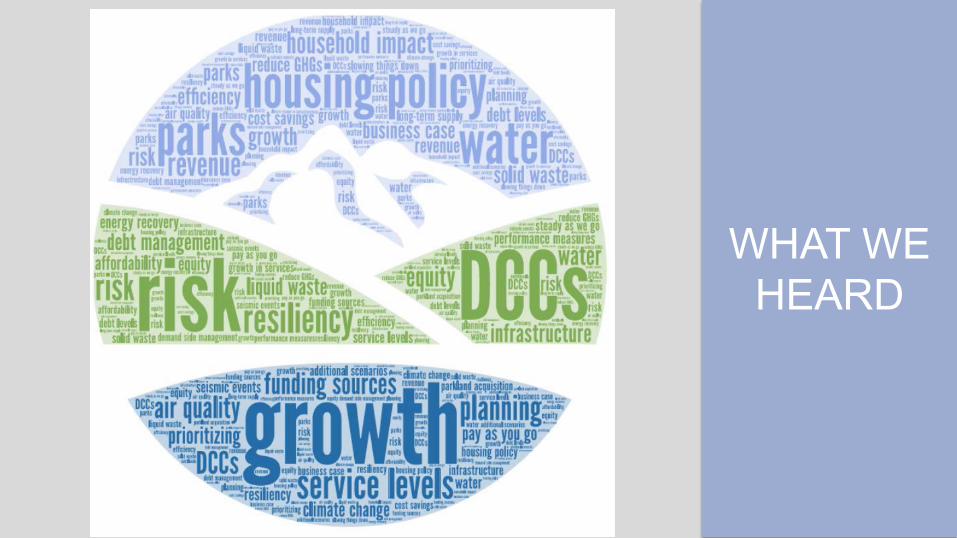
WHAT WE HEARD
8
Next steps – March to October
2018 Annual Budget
2018 to 2022 Five Year Financial Plan
Development of Long Term Plans

9
2 0 1 8 B U D G E T O V E R V I E W
10
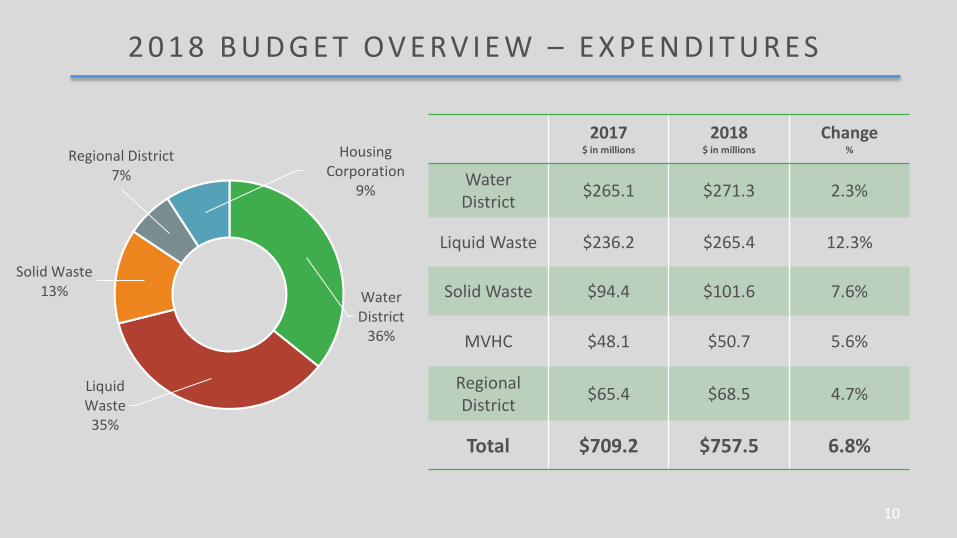
2 0 1 8 B U D G E T OV E RV I E W – E X P E N D I T U R E S
Water District
36%
Liquid Waste35%
Solid Waste13%
Regional District7%
Housing Corporation
9%
2017$ in millions
2018$ in millions
Change%
WaterDistrict $265.1 $271.3 2.3%
Liquid Waste $236.2 $265.4 12.3%
Solid Waste $94.4 $101.6 7.6%
MVHC $48.1 $50.7 5.6%
Regional District $65.4 $68.5 4.7%
Total $709.2 $757.5 6.8%
11
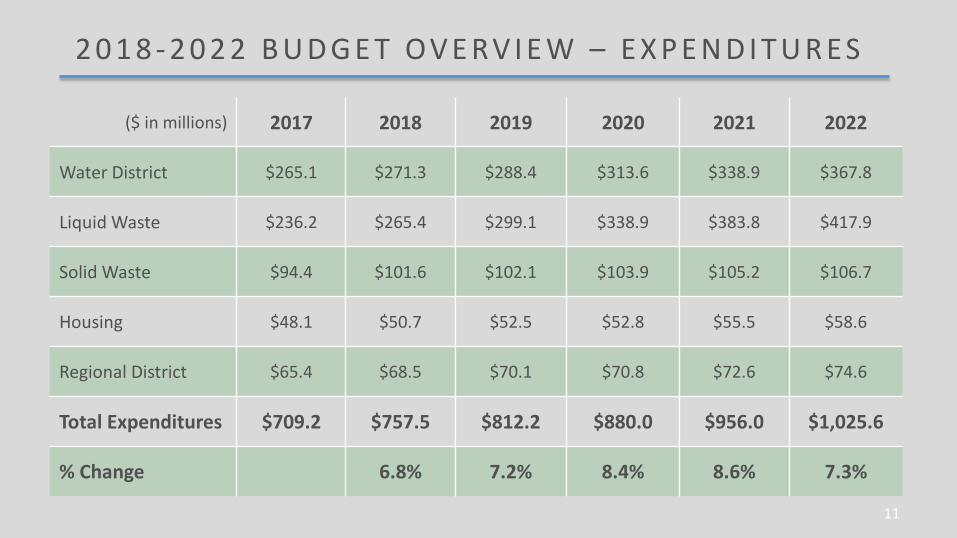
2 0 1 8 - 2 0 2 2 B U D G E T OV E RV I E W – E X P E N D I T U R E S
($ in millions) 2017 2018 2019 2020 2021 2022
Water District $265.1 $271.3 $288.4 $313.6 $338.9 $367.8
Liquid Waste $236.2 $265.4 $299.1 $338.9 $383.8 $417.9
Solid Waste $94.4 $101.6 $102.1 $103.9 $105.2 $106.7
Housing $48.1 $50.7 $52.5 $52.8 $55.5 $58.6
Regional District $65.4 $68.5 $70.1 $70.8 $72.6 $74.6
Total Expenditures $709.2 $757.5 $812.2 $880.0 $956.0 $1,025.6
% Change 6.8% 7.2% 8.4% 8.6% 7.3%
12
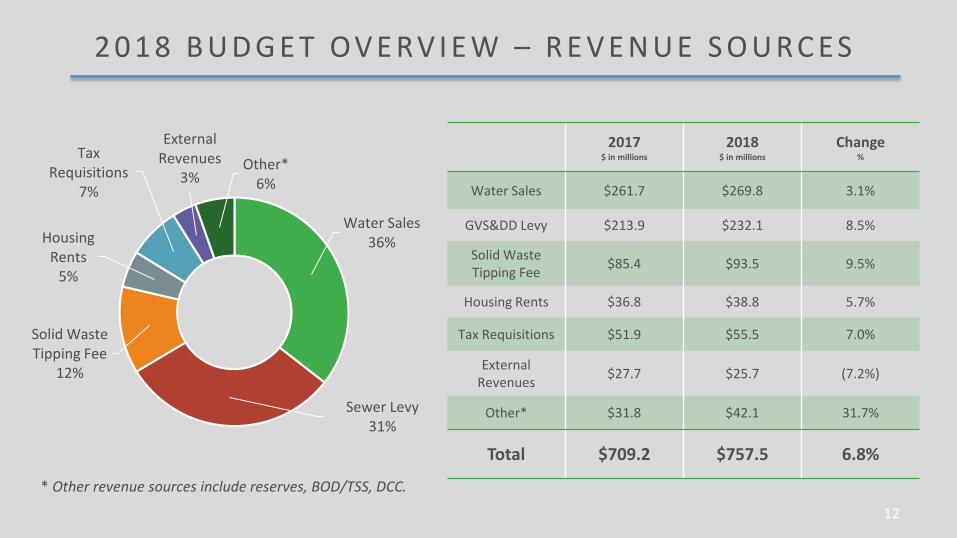
2 0 1 8 B U D G E T OV E RV I E W – R E V E N U E S O U R C E S
2017$ in millions
2018$ in millions
Change%
Water Sales $261.7 $269.8 3.1%
GVS&DD Levy $213.9 $232.1 8.5%
Solid Waste Tipping Fee $85.4 $93.5 9.5%
Housing Rents $36.8 $38.8 5.7%
Tax Requisitions $51.9 $55.5 7.0%
External Revenues $27.7 $25.7 (7.2%)
Other* $31.8 $42.1 31.7%
Total $709.2 $757.5 6.8%
Water Sales36%
Sewer Levy31%
Solid Waste Tipping Fee
12%
Housing Rents
5%
Tax Requisitions
7%
External Revenues
3%Other*
6%
* Other revenue sources include reserves, BOD/TSS, DCC.
13
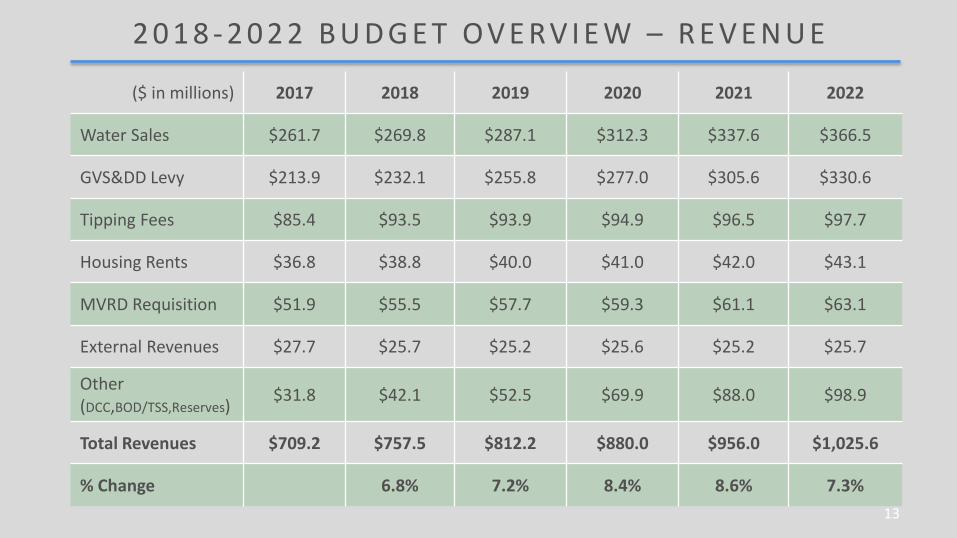
2 0 1 8 - 2 0 2 2 B U D G E T OV E RV I E W – R E V E N U E
($ in millions) 2017 2018 2019 2020 2021 2022
Water Sales $261.7 $269.8 $287.1 $312.3 $337.6 $366.5
GVS&DD Levy $213.9 $232.1 $255.8 $277.0 $305.6 $330.6
Tipping Fees $85.4 $93.5 $93.9 $94.9 $96.5 $97.7
Housing Rents $36.8 $38.8 $40.0 $41.0 $42.0 $43.1
MVRD Requisition $51.9 $55.5 $57.7 $59.3 $61.1 $63.1
External Revenues $27.7 $25.7 $25.2 $25.6 $25.2 $25.7
Other (DCC,BOD/TSS,Reserves) $31.8 $42.1 $52.5 $69.9 $88.0 $98.9
Total Revenues $709.2 $757.5 $812.2 $880.0 $956.0 $1,025.6
% Change 6.8% 7.2% 8.4% 8.6% 7.3%

14
2017 2018 2019 2020 2021 2022
Water District $162 $165 $172 $184 $196 $209
Liquid Waste $188 $201 $218 $231 $250 $266
Solid Waste $56 $56 $55 $55 $55 $55
Regional District $46 $48 $49 $50 $50 $51
Total Household Impact $452 $470 $494 $520 $551 $581
% Change 4.1% 5.1% 5.1% 6.0% 5.3%
2 0 1 8 - 2 0 2 2 B U D G E T OV E RV I E W – H O U S E H O L D I M PA C T 1
1 Average based on $1.14 Million assessed home value.
15
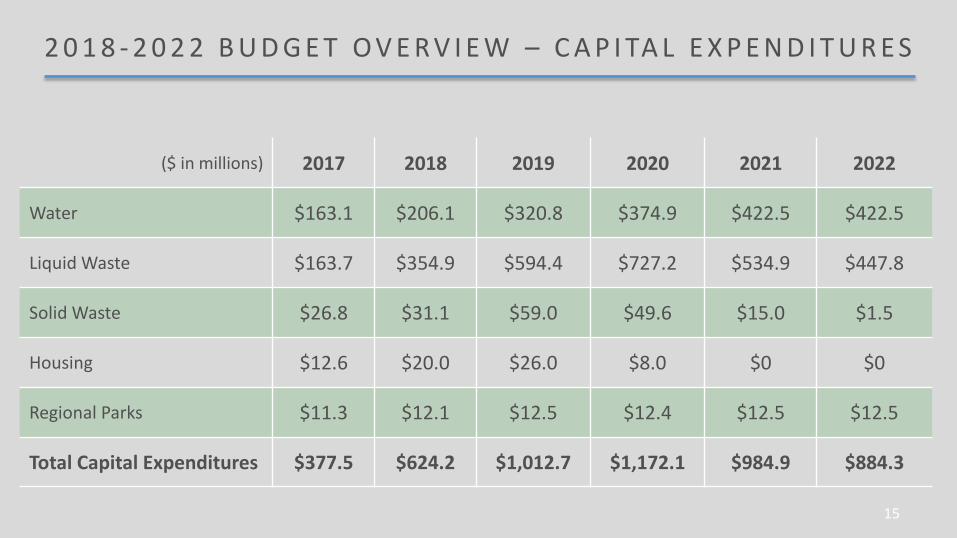
2 0 1 8 - 2 0 2 2 B U D G E T O V E R V I E W – C A P I TA L E X P E N D I T U R E S
($ in millions) 2017 2018 2019 2020 2021 2022
Water $163.1 $206.1 $320.8 $374.9 $422.5 $422.5
Liquid Waste $163.7 $354.9 $594.4 $727.2 $534.9 $447.8
Solid Waste $26.8 $31.1 $59.0 $49.6 $15.0 $1.5
Housing $12.6 $20.0 $26.0 $8.0 $0 $0
Regional Parks $11.3 $12.1 $12.5 $12.4 $12.5 $12.5
Total Capital Expenditures $377.5 $624.2 $1,012.7 $1,172.1 $984.9 $884.3

16
B U D G E T OV E RV I E W D e b t M a n a g e m e n t 2 0 0 8 - 2 0 1 7
Funding provided by: ($ in millions)
15 Year Debt Financing $1,081.0 48%
Pay As You Go Financing
Contributions from Operations $791.0
Reserves (Housing & Regional Parks) $127.8
Applied Surplus $251.6
$1,170.4 52%
Total 2008-2017 Capital Expenditures $2,251.4

17
B U D G E T OV E RV I E W D e b t M a n a g e m e n t 2 0 1 8 - 2 0 2 2
Funding provided by: ($ in millions)
15 Year Debt Financing $3,194.4 68%
Pay As You Go Financing
Senior Government Contributions $405.3
Contributions from Operations $898.3
Reserves (Housing & Regional Parks) $104.0
Applied Surplus $76.2
$1,483.8 32%
Total 2018-2022 Capital Expenditures $4,678.2
18
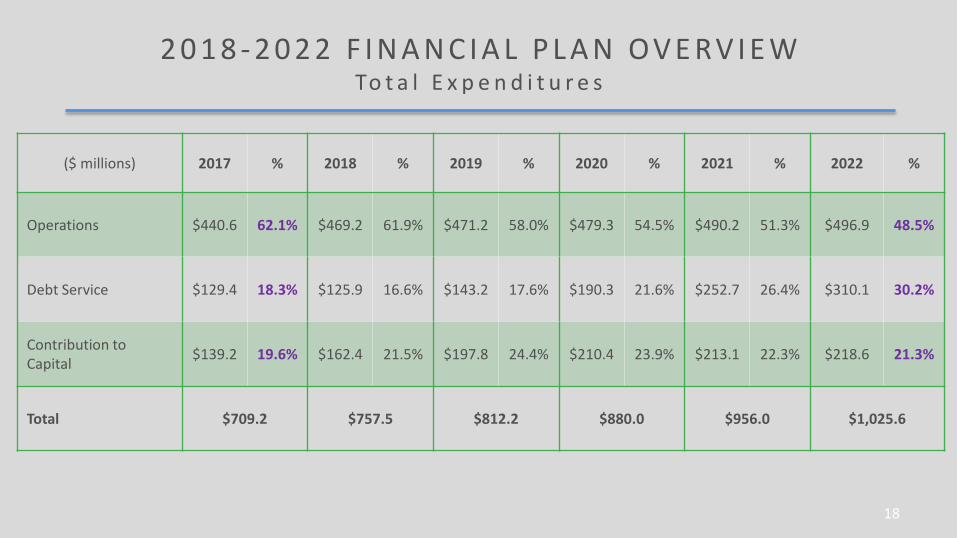
2 0 1 8 - 2 0 2 2 F I N A N C I A L P L A N OV E RV I E WTo t a l E x p e n d i t u r e s
($ millions) 2017 % 2018 % 2019 % 2020 % 2021 % 2022 %
Operations $440.6 62.1% $469.2 61.9% $471.2 58.0% $479.3 54.5% $490.2 51.3% $496.9 48.5%
Debt Service $129.4 18.3% $125.9 16.6% $143.2 17.6% $190.3 21.6% $252.7 26.4% $310.1 30.2%
Contribution to Capital $139.2 19.6% $162.4 21.5% $197.8 24.4% $210.4 23.9% $213.1 22.3% $218.6 21.3%
Total $709.2 $757.5 $812.2 $880.0 $956.0 $1,025.6
19
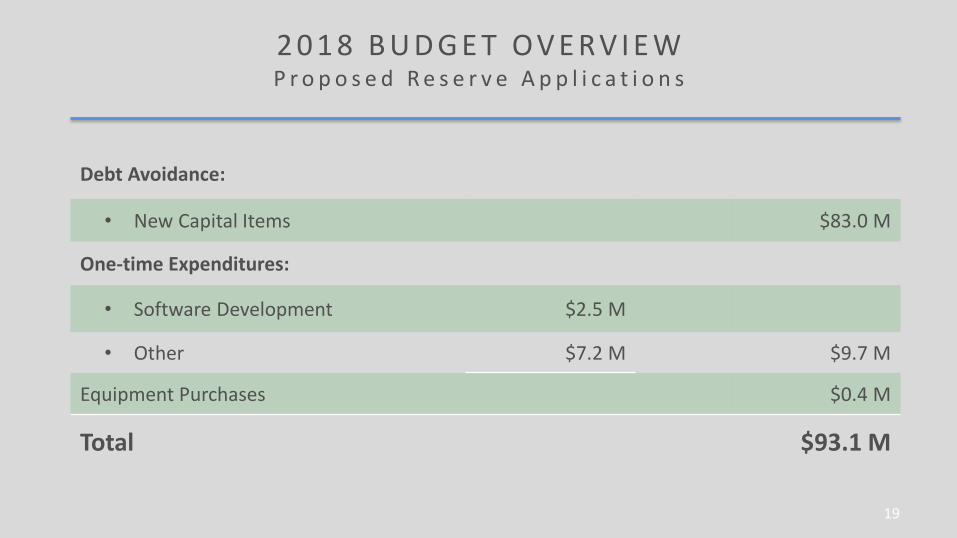
2 0 1 8 B U D G E T OV E RV I E W P r o p o s e d R e s e r v e A p p l i c a t i o n s
Debt Avoidance:
• New Capital Items $83.0 M
One-time Expenditures:
• Software Development $2.5 M
• Other $7.2 M $9.7 M
Equipment Purchases $0.4 M
Total $93.1 M
20
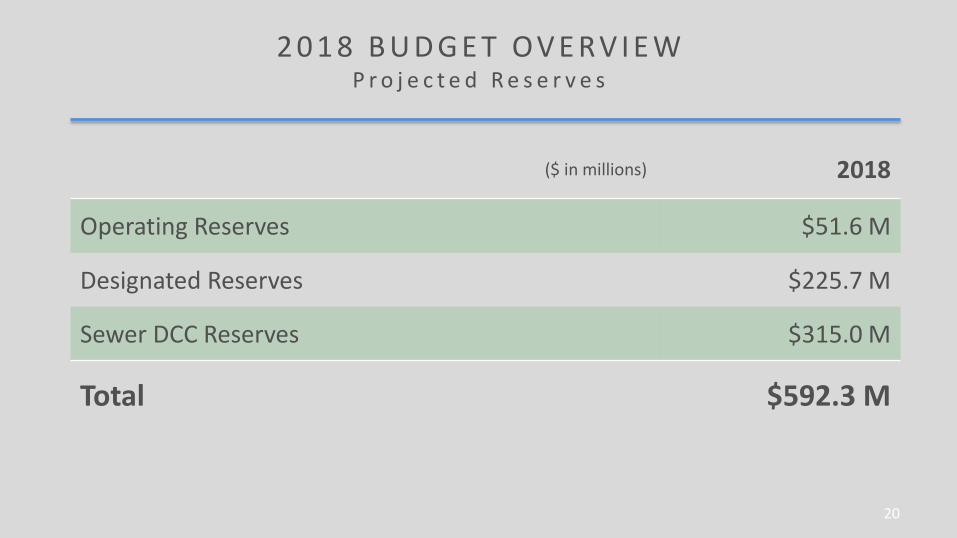
2 0 1 8 B U D G E T OV E RV I E W P r o j e c t e d R e s e r v e s
($ in millions) 2018
Operating Reserves $51.6 M
Designated Reserves $225.7 M
Sewer DCC Reserves $315.0 M
Total $592.3 M

21
WATER SERVICESGREATER VANCOUVER WATER DISTRICT
22
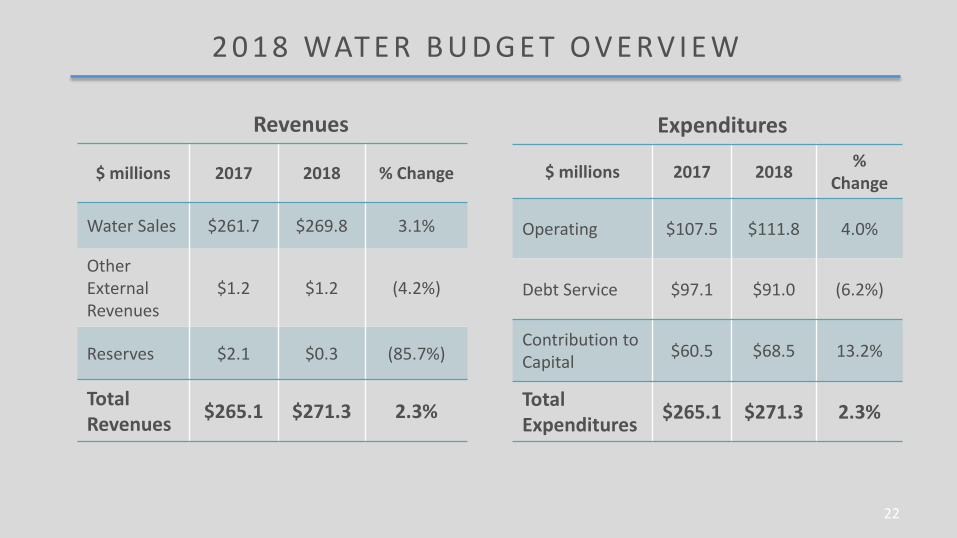
$ millions 2017 2018 % Change
Water Sales $261.7 $269.8 3.1%
Other External Revenues
$1.2 $1.2 (4.2%)
Reserves $2.1 $0.3 (85.7%)
Total Revenues $265.1 $271.3 2.3%
2 0 1 8 WAT E R B U D G E T OV E RV I E W
Revenues Expenditures
$ millions 2017 2018 % Change
Operating $107.5 $111.8 4.0%
Debt Service $97.1 $91.0 (6.2%)
Contribution to Capital $60.5 $68.5 13.2%
Total Expenditures $265.1 $271.3 2.3%
23
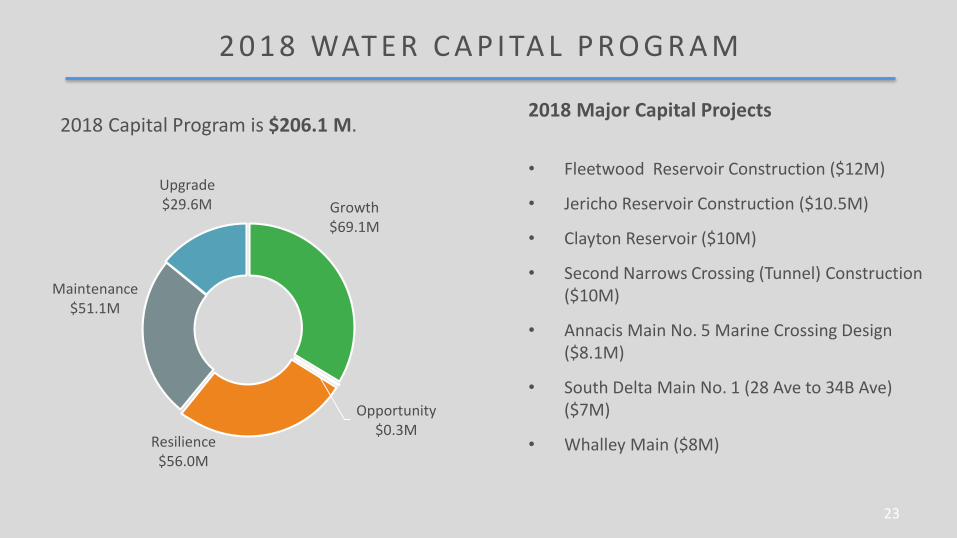
2 0 1 8 WAT E R C A P I TA L P R O G R A M
2018 Capital Program is $206.1 M.2018 Major Capital Projects
• Fleetwood Reservoir Construction ($12M)
• Jericho Reservoir Construction ($10.5M)
• Clayton Reservoir ($10M)
• Second Narrows Crossing (Tunnel) Construction ($10M)
• Annacis Main No. 5 Marine Crossing Design ($8.1M)
• South Delta Main No. 1 (28 Ave to 34B Ave) ($7M)
• Whalley Main ($8M)
Growth$69.1M
Opportunity$0.3M
Resilience$56.0M
Maintenance$51.1M
Upgrade$29.6M
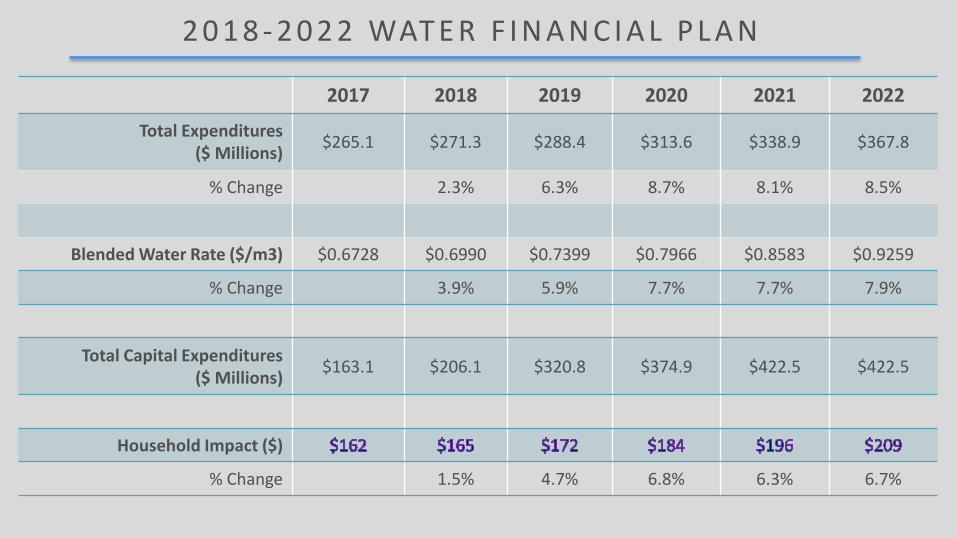
2017 2018 2019 2020 2021 2022
Total Expenditures($ Millions) $265.1 $271.3 $288.4 $313.6 $338.9 $367.8
% Change 2.3% 6.3% 8.7% 8.1% 8.5%
Blended Water Rate ($/m3) $0.6728 $0.6990 $0.7399 $0.7966 $0.8583 $0.9259
% Change 3.9% 5.9% 7.7% 7.7% 7.9%
Total Capital Expenditures ($ Millions) $163.1 $206.1 $320.8 $374.9 $422.5 $422.5
Household Impact ($)
% Change 1.5% 4.7% 6.8% 6.3% 6.7%
2 0 1 8 - 2 0 2 2 WAT E R F I N A N C I A L P L A N

2018 - 2022 Capital Program is $1.75B2018 – 2022 Major Capital Projects• Second Narrows Crossing (Tunnel) ($282.5M)
• Annacis Main No. 5 (Marine Crossing) ($165.1M)
• Coquitlam Main No. 4 ($164.3M)
• Coquitlam Intake No. 2 (Tunnel and Treatment) ($67.5M)
• Kennedy Newton Main ($113.1M)
• Capilano Main No. 5 (South Shaft to Lost Lagoon) ($76.1M)
• Central Park Main Replacement ($59.1M)
• Douglas Road Main No. 2 Still Creek ($52.1M)
25
2 0 1 8 - 2 0 2 2 WAT E R C A P I TA L P R O G R A M
Growth$823.3M
Opportunity$300,000
Resilience$510.5M
Maintenance$347.4M
Upgrade$65.1M

26
2 0 1 8 WAT E R B U D G E T H I G H L I G H T S
2018 Budget Key Actions:• Implement new Drinking Water Conservation Plan• Secure additional water allocation for the Coquitlam source• Commence development of an updated Drinking Water Management Plan• Complete regional assessment of residential water metering and recommended strategy for
Board consideration• Complete the development of an Environmental Management System for Water Services• Complete erosion control works on Sisters Creek in the Capilano Watershed• Commission the new sodium hypochlorite system at the Coquitlam Water Treatment Plant• Optimize operations at the Capilano Raw Water Pump Station and Energy Recovery Facility
Proposed Staffing Changes:• Project Engineer - to support water planning initiatives related to the Joint Water Use Plan
and enhanced Demand by Sector reporting• Utilities System Controller - to provide increased coverage in the Utility Systems Control
Room
27
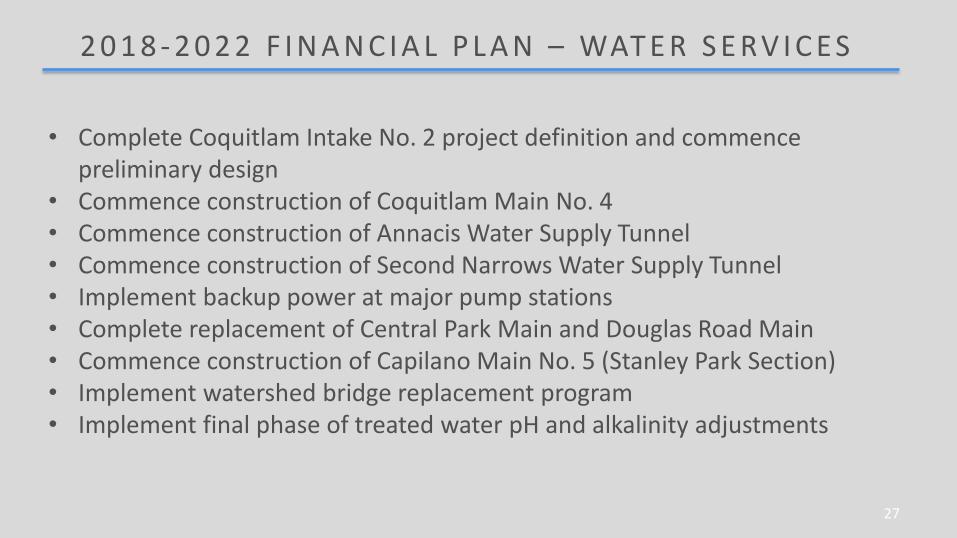
2 0 1 8 - 2 0 2 2 F I N A N C I A L P L A N – WAT E R S E RV I C E S
• Complete Coquitlam Intake No. 2 project definition and commence preliminary design
• Commence construction of Coquitlam Main No. 4• Commence construction of Annacis Water Supply Tunnel• Commence construction of Second Narrows Water Supply Tunnel• Implement backup power at major pump stations• Complete replacement of Central Park Main and Douglas Road Main• Commence construction of Capilano Main No. 5 (Stanley Park Section)• Implement watershed bridge replacement program• Implement final phase of treated water pH and alkalinity adjustments
28
LIQUID WASTE SERVICESGREATER VANCOUVER SEWERAGE & DRAINAGE DISTRICT
29
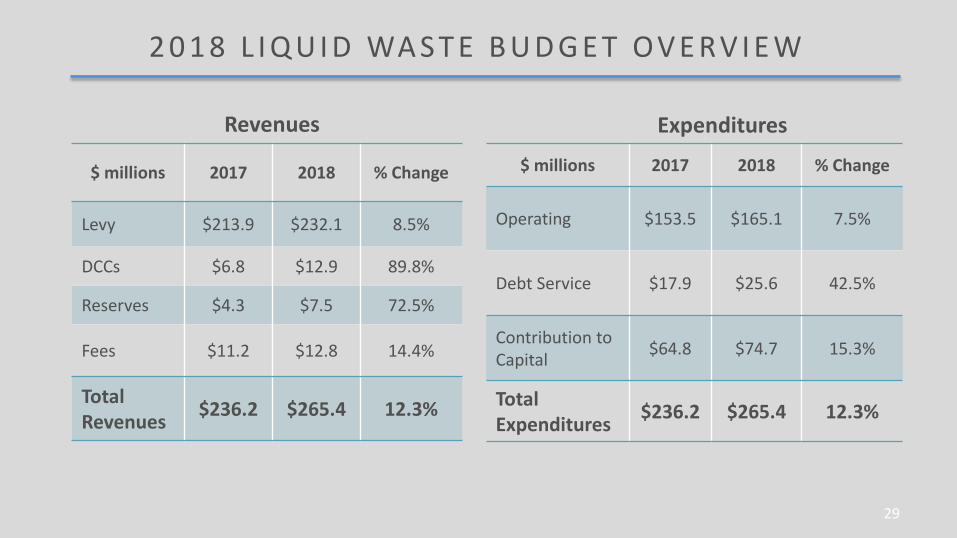
$ millions 2017 2018 % Change
Levy $213.9 $232.1 8.5%
DCCs $6.8 $12.9 89.8%
Reserves $4.3 $7.5 72.5%
Fees $11.2 $12.8 14.4%
Total Revenues $236.2 $265.4 12.3%
2 0 1 8 L I Q U I D WA S T E B U D G E T OV E RV I E W
Revenues Expenditures
$ millions 2017 2018 % Change
Operating $153.5 $165.1 7.5%
Debt Service $17.9 $25.6 42.5%
Contribution to Capital $64.8 $74.7 15.3%
Total Expenditures $236.2 $265.4 12.3%

30
2 0 1 8 L I Q U I D WA S T E C A P I TA L P R O G R A M
2018 Capital Program is $354.9 M.
2018 Major Capital Projects
• Sapperton Pump Station ($19.0M)
• Annacis Stage 5 Expansion ($131.1M)
• South Surrey Intercepter Johnston Section ($11.4M)
• AIWWTP Cogeneration Backup Power ($30.6M)
• NSWWTP Secondary Upgrade and Conveyance ($12.3M)
• Iona Secondary Treatment Upgrade Project Definition ($5.2M)
Growth$220.6M
Opportunity$13.8M
Resilience$45.7M
Maintenance$44.0M
Upgrade$30.8M
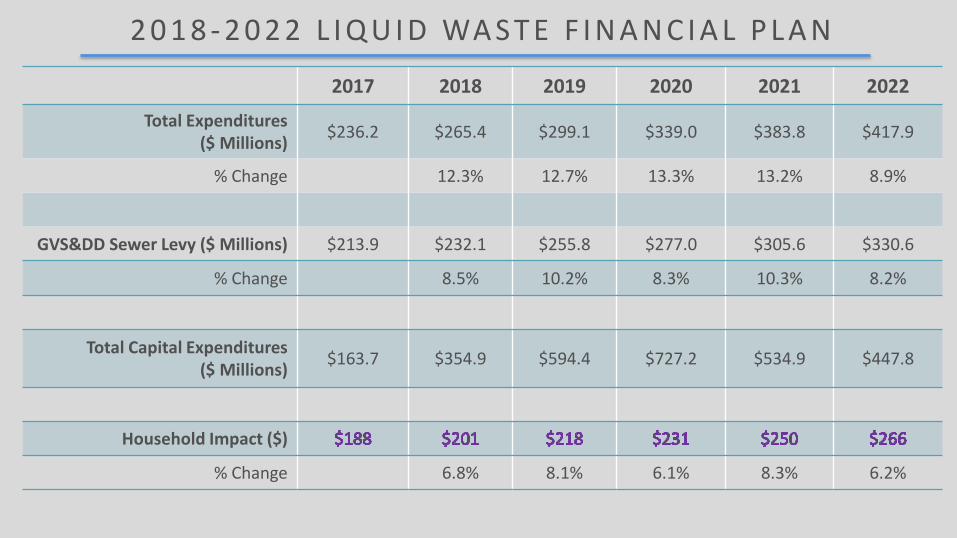
2017 2018 2019 2020 2021 2022
Total Expenditures ($ Millions) $236.2 $265.4 $299.1 $339.0 $383.8 $417.9
% Change 12.3% 12.7% 13.3% 13.2% 8.9%
GVS&DD Sewer Levy ($ Millions) $213.9 $232.1 $255.8 $277.0 $305.6 $330.6
% Change 8.5% 10.2% 8.3% 10.3% 8.2%
Total Capital Expenditures ($ Millions) $163.7 $354.9 $594.4 $727.2 $534.9 $447.8
Household Impact ($)
% Change 6.8% 8.1% 6.1% 8.3% 6.2%
2 0 1 8 - 2 0 2 2 L I Q U I D WA S T E F I N A N C I A L P L A N
32
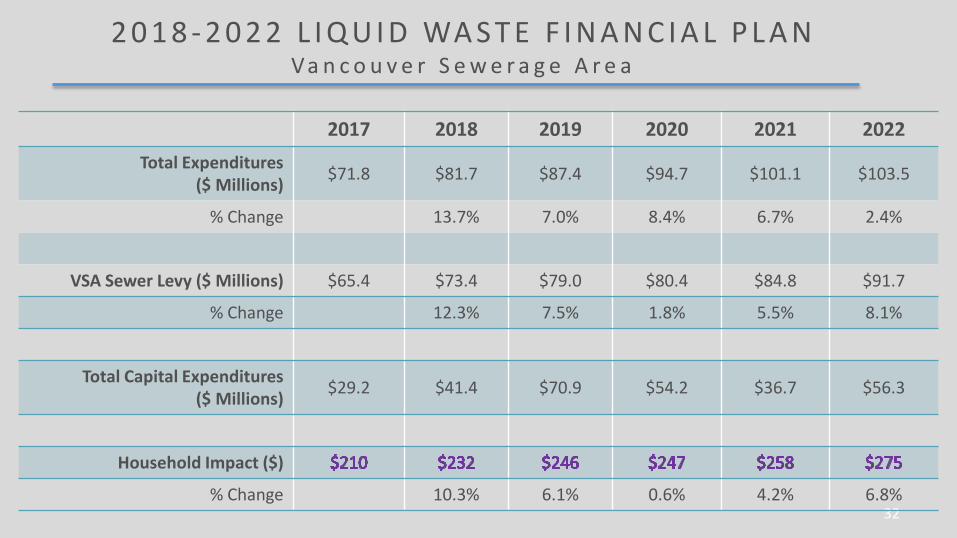
2 0 1 8 - 2 0 2 2 L I Q U I D WA S T E F I N A N C I A L P L A NVa n c o u v e r S e w e r a g e A r e a
2017 2018 2019 2020 2021 2022Total Expenditures
($ Millions) $71.8 $81.7 $87.4 $94.7 $101.1 $103.5
% Change 13.7% 7.0% 8.4% 6.7% 2.4%
VSA Sewer Levy ($ Millions) $65.4 $73.4 $79.0 $80.4 $84.8 $91.7
% Change 12.3% 7.5% 1.8% 5.5% 8.1%
Total Capital Expenditures ($ Millions) $29.2 $41.4 $70.9 $54.2 $36.7 $56.3
Household Impact ($)
% Change 10.3% 6.1% 0.6% 4.2% 6.8%
33
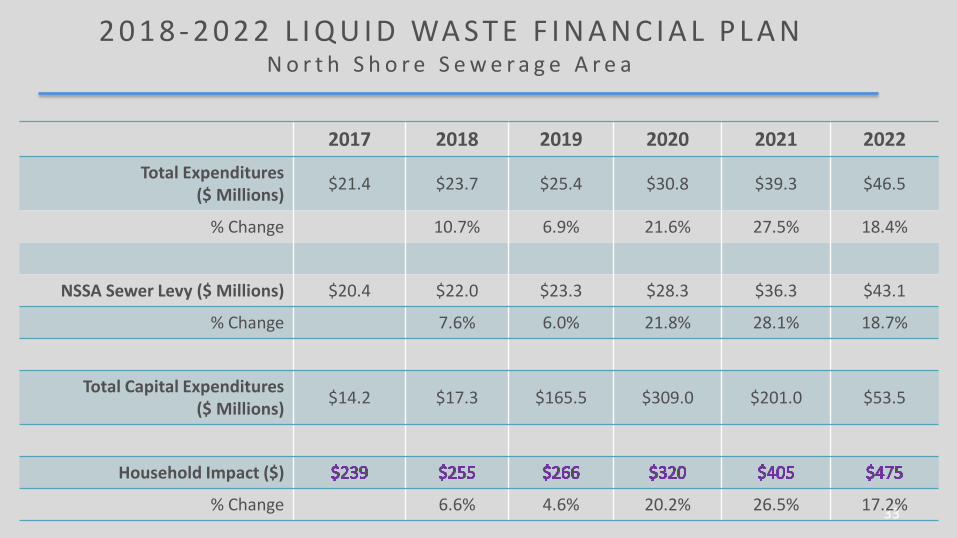
2 0 1 8 - 2 0 2 2 L I Q U I D WA S T E F I N A N C I A L P L A NN o r t h S h o r e S e w e r a g e A r e a
2017 2018 2019 2020 2021 2022Total Expenditures
($ Millions) $21.4 $23.7 $25.4 $30.8 $39.3 $46.5
% Change 10.7% 6.9% 21.6% 27.5% 18.4%
NSSA Sewer Levy ($ Millions) $20.4 $22.0 $23.3 $28.3 $36.3 $43.1
% Change 7.6% 6.0% 21.8% 28.1% 18.7%
Total Capital Expenditures ($ Millions) $14.2 $17.3 $165.5 $309.0 $201.0 $53.5
Household Impact ($)
% Change 6.6% 4.6% 20.2% 26.5% 17.2%
34
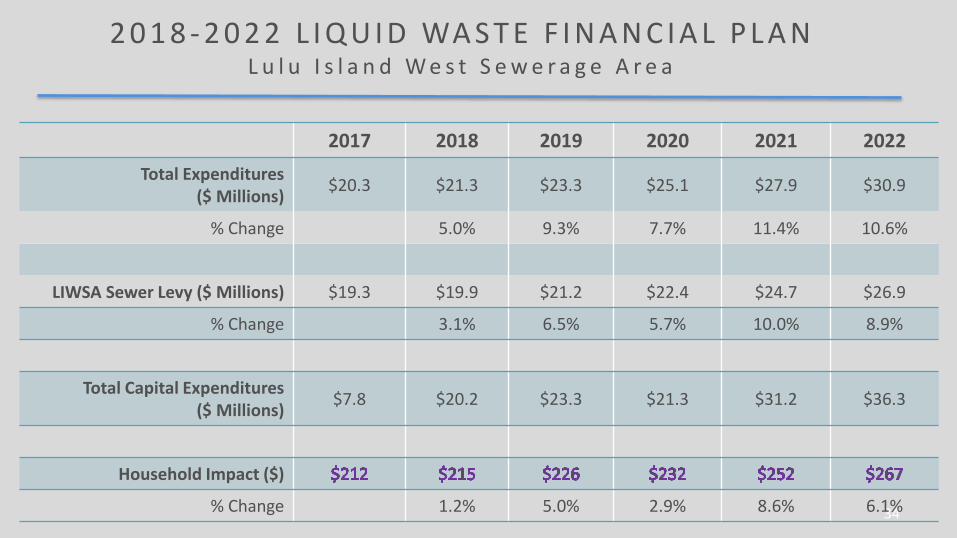
2 0 1 8 - 2 0 2 2 L I Q U I D WA S T E F I N A N C I A L P L A NL u l u I s l a n d W e s t S e w e r a g e A r e a
2017 2018 2019 2020 2021 2022Total Expenditures
($ Millions) $20.3 $21.3 $23.3 $25.1 $27.9 $30.9
% Change 5.0% 9.3% 7.7% 11.4% 10.6%
LIWSA Sewer Levy ($ Millions) $19.3 $19.9 $21.2 $22.4 $24.7 $26.9
% Change 3.1% 6.5% 5.7% 10.0% 8.9%
Total Capital Expenditures ($ Millions) $7.8 $20.2 $23.3 $21.3 $31.2 $36.3
Household Impact ($)
% Change 1.2% 5.0% 2.9% 8.6% 6.1%
35
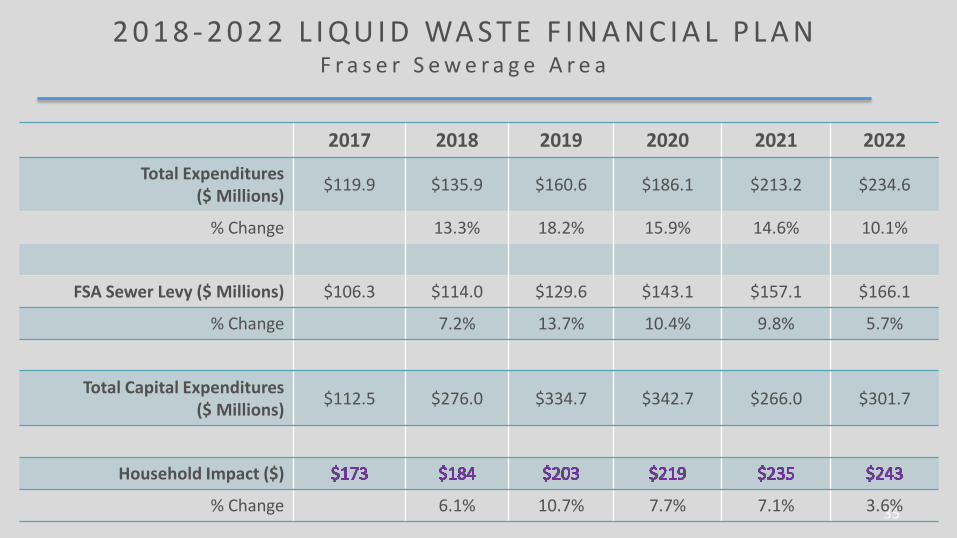
2 0 1 8 - 2 0 2 2 L I Q U I D WA S T E F I N A N C I A L P L A NF r a s e r S e w e r a g e A r e a
2017 2018 2019 2020 2021 2022Total Expenditures
($ Millions) $119.9 $135.9 $160.6 $186.1 $213.2 $234.6
% Change 13.3% 18.2% 15.9% 14.6% 10.1%
FSA Sewer Levy ($ Millions) $106.3 $114.0 $129.6 $143.1 $157.1 $166.1
% Change 7.2% 13.7% 10.4% 9.8% 5.7%
Total Capital Expenditures ($ Millions) $112.5 $276.0 $334.7 $342.7 $266.0 $301.7
Household Impact ($)
% Change 6.1% 10.7% 7.7% 7.1% 3.6%
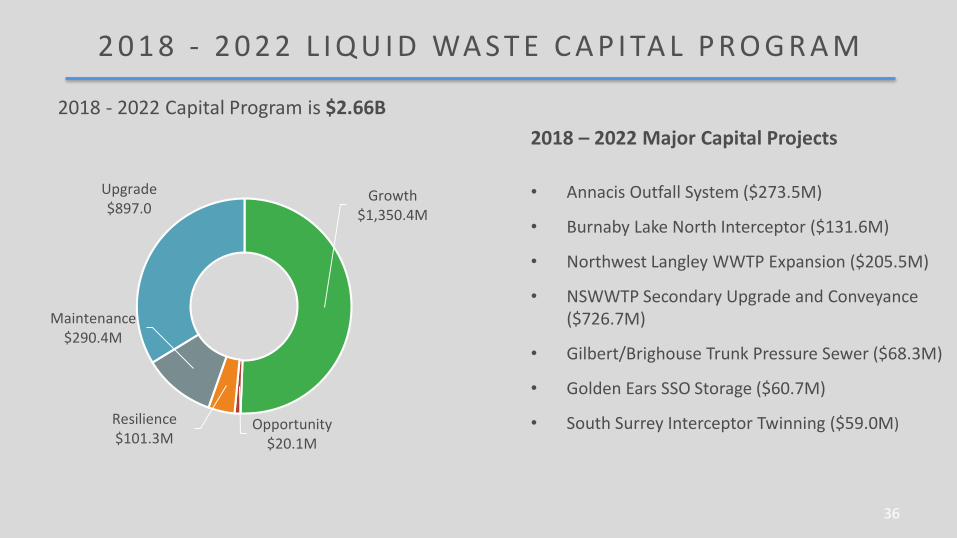
2018 - 2022 Capital Program is $2.66B2018 – 2022 Major Capital Projects
• Annacis Outfall System ($273.5M)
• Burnaby Lake North Interceptor ($131.6M)
• Northwest Langley WWTP Expansion ($205.5M)
• NSWWTP Secondary Upgrade and Conveyance ($726.7M)
• Gilbert/Brighouse Trunk Pressure Sewer ($68.3M)
• Golden Ears SSO Storage ($60.7M)
• South Surrey Interceptor Twinning ($59.0M)
36
2 0 1 8 - 2 0 2 2 L I Q U I D WA S T E C A P I TA L P R O G R A M
Growth$1,350.4M
Opportunity$20.1M
Resilience$101.3M
Maintenance$290.4M
Upgrade$897.0

37
2 0 1 8 L I Q U I D WA S T E B U D G E T H I G H L I G H T S
2018 Budget Key Actions:• Biosolids stockpile management• One time energy costs - Annacis Cogeneration project • Combined sewer separation plans for Cambie-Heather and Canoe Creek • Still Creek–Brunette River Drainage Area - flood plain mapping• Hydrodynamic model for Burrard Inlet• Co-Digestion and Trucked Liquid Waste Program Review• Commencing testing for contaminants of emerging concern
Proposed Staffing Changes:• Chemist/Analyst - to analyze contaminants of emerging concern• Policy Analyst - to assess and analyze Source Control issues • WWTP Operator - to operate the Solids Handling Facility at Iona Island WWTP• Maintenance Mechanic - to maintain the Northwest Langley WWTP
38
2 0 1 8 - 2 0 2 2 F I N A N C I A L P L A N - L I Q U I D WA S T E
• Clearing stockpiled biosolids at Iona and Northwest Langley WWTP• Update the Integrated Liquid Waste and Resource Management Plan• Asset Management Plan• Review of Food Sector Grease Interceptor Bylaw• Biosolids Drying Facility study• Hydrothermal Liquefaction pilot • Develop combined sewer separation plans for Metro Vancouver trunk sewers

39
SOLID WASTE SERVICESGREATER VANCOUVER SEWERAGE & DRAINAGE DISTRICT
40
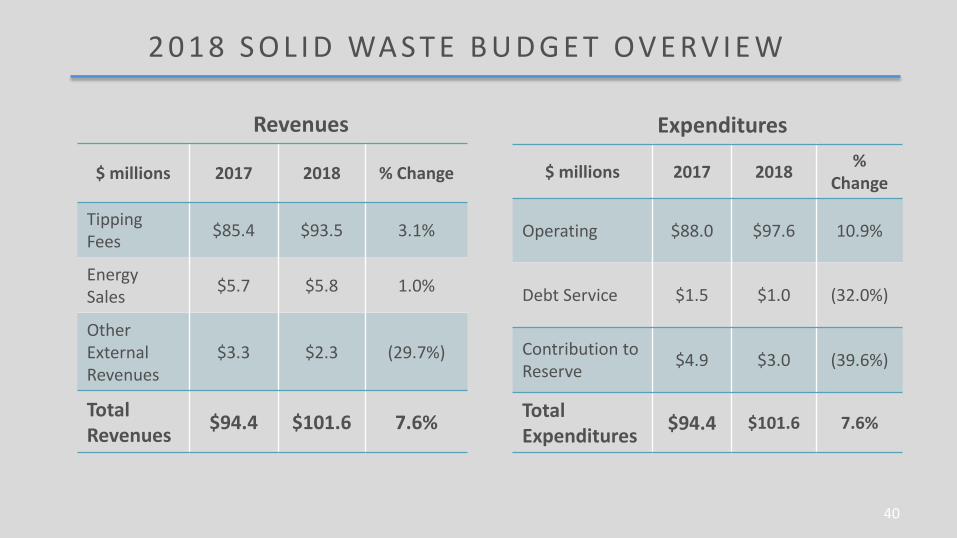
$ millions 2017 2018 % Change
Tipping Fees $85.4 $93.5 3.1%
Energy Sales $5.7 $5.8 1.0%
Other External Revenues
$3.3 $2.3 (29.7%)
Total Revenues $94.4 $101.6 7.6%
2 0 1 8 S O L I D WA S T E B U D G E T OV E RV I E W
Revenues Expenditures
$ millions 2017 2018 % Change
Operating $88.0 $97.6 10.9%
Debt Service $1.5 $1.0 (32.0%)
Contribution to Reserve $4.9 $3.0 (39.6%)
Total Expenditures $94.4 $101.6 7.6%
41
2 0 1 8 S O L I D WA S T E C A P I TA L P R O G R A M
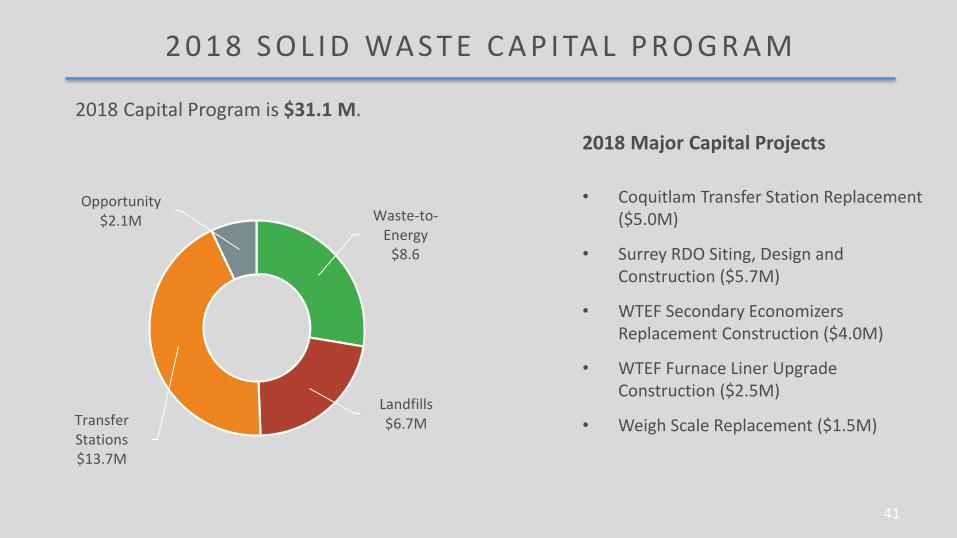
2018 Capital Program is $31.1 M.2018 Major Capital Projects
• Coquitlam Transfer Station Replacement ($5.0M)
• Surrey RDO Siting, Design and Construction ($5.7M)
• WTEF Secondary Economizers Replacement Construction ($4.0M)
• WTEF Furnace Liner Upgrade Construction ($2.5M)
• Weigh Scale Replacement ($1.5M)
Waste-to-Energy
$8.6
Landfills$6.7MTransfer
Stations$13.7M
Opportunity$2.1M
42
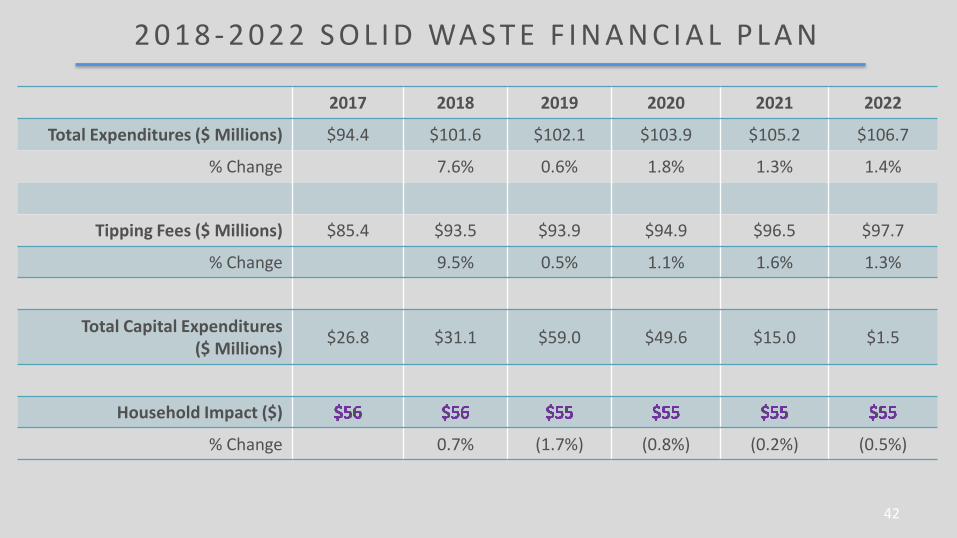
2 0 1 8 - 2 0 2 2 S O L I D WA S T E F I N A N C I A L P L A N
2017 2018 2019 2020 2021 2022
Total Expenditures ($ Millions) $94.4 $101.6 $102.1 $103.9 $105.2 $106.7
% Change 7.6% 0.6% 1.8% 1.3% 1.4%
Tipping Fees ($ Millions) $85.4 $93.5 $93.9 $94.9 $96.5 $97.7
% Change 9.5% 0.5% 1.1% 1.6% 1.3%
Total Capital Expenditures ($ Millions) $26.8 $31.1 $59.0 $49.6 $15.0 $1.5
Household Impact ($)
% Change 0.7% (1.7%) (0.8%) (0.2%) (0.5%)

43
2 0 1 8 - 2 0 2 2 S O L I D WA S T E F I N A N C I A L P L A N
2017 2018 2019 2020 2021 2022
Tipping Fees
Up to 1 tonne $133 $137 $141 $145 $150 $155
1 to 9 tonnes $112 $115 $119 $122 $126 $130
Over 9 tonnes $80 $82 $85 $87 $90 $93
Municipal $100 $103 $106 $109 $113 $116
Proposed Tonnage 804,000 850,000 825,000 800,000 787,000 775,000
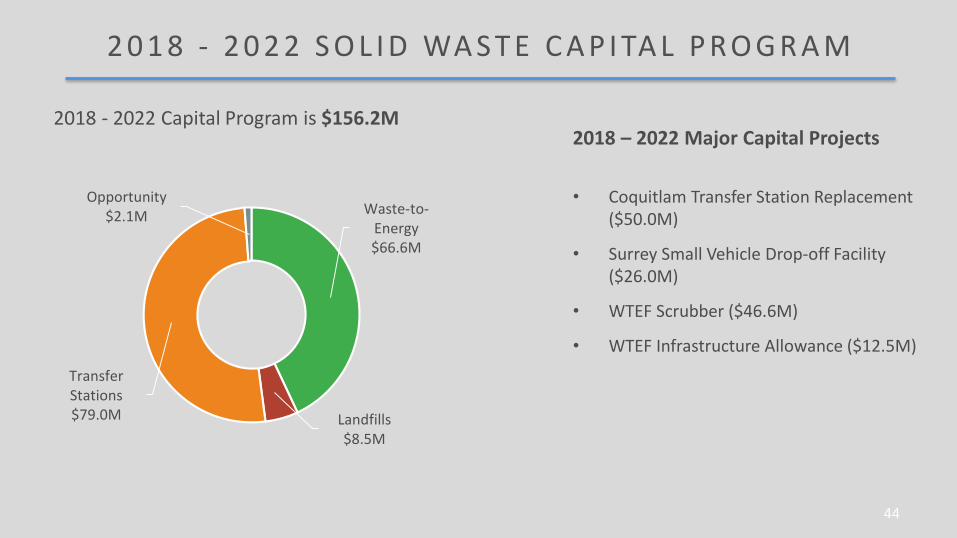
2018 - 2022 Capital Program is $156.2M2018 – 2022 Major Capital Projects
• Coquitlam Transfer Station Replacement ($50.0M)
• Surrey Small Vehicle Drop-off Facility ($26.0M)
• WTEF Scrubber ($46.6M)
• WTEF Infrastructure Allowance ($12.5M)
44
2 0 1 8 - 2 0 2 2 S O L I D WA S T E C A P I TA L P R O G R A M
Waste-to-Energy$66.6M
Landfills$8.5M
Transfer Stations$79.0M
Opportunity$2.1M

45
2 0 1 8 S O L I D WA S T E B U D G E T H I G H L I G H T S
2018 Budget Key Actions:• Main budget drivers are amount of waste and cost of contingency disposal• Support for regional waste prevention, including the National Zero Waste Council• New regulatory framework for Generator Levy, Hauler Licensing, and Bylaw 181 update• New resources and programs for increased waste diversion• WTEF upgrades, and commissioning of non-ferrous metal recovery• Development of new Coquitlam Transfer Station, and Surrey Small Vehicle facility
46
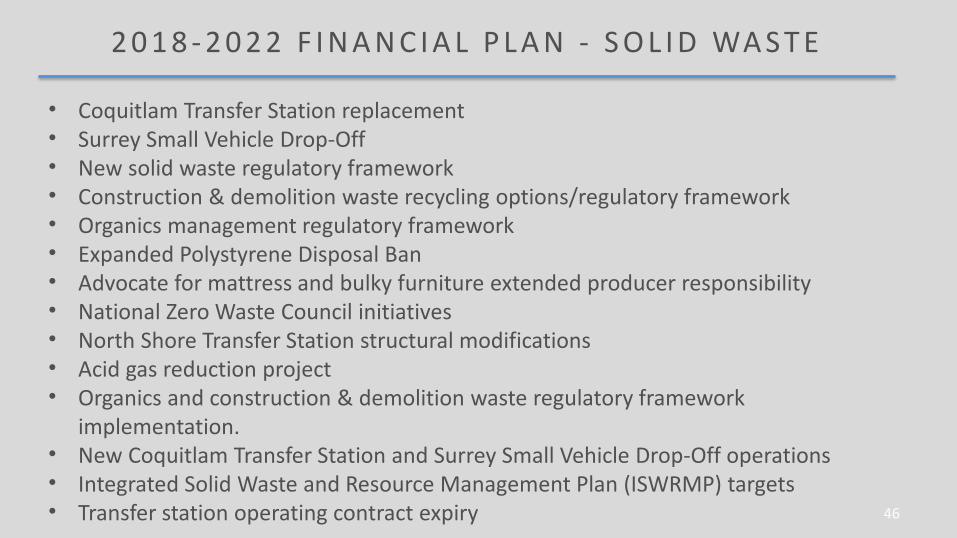
2 0 1 8 - 2 0 2 2 F I N A N C I A L P L A N - S O L I D WA S T E
• Coquitlam Transfer Station replacement• Surrey Small Vehicle Drop-Off• New solid waste regulatory framework• Construction & demolition waste recycling options/regulatory framework• Organics management regulatory framework• Expanded Polystyrene Disposal Ban• Advocate for mattress and bulky furniture extended producer responsibility• National Zero Waste Council initiatives• North Shore Transfer Station structural modifications• Acid gas reduction project• Organics and construction & demolition waste regulatory framework
implementation.• New Coquitlam Transfer Station and Surrey Small Vehicle Drop-Off operations• Integrated Solid Waste and Resource Management Plan (ISWRMP) targets • Transfer station operating contract expiry
47
METRO VANCOUVER HOUSING CORPORATION
48
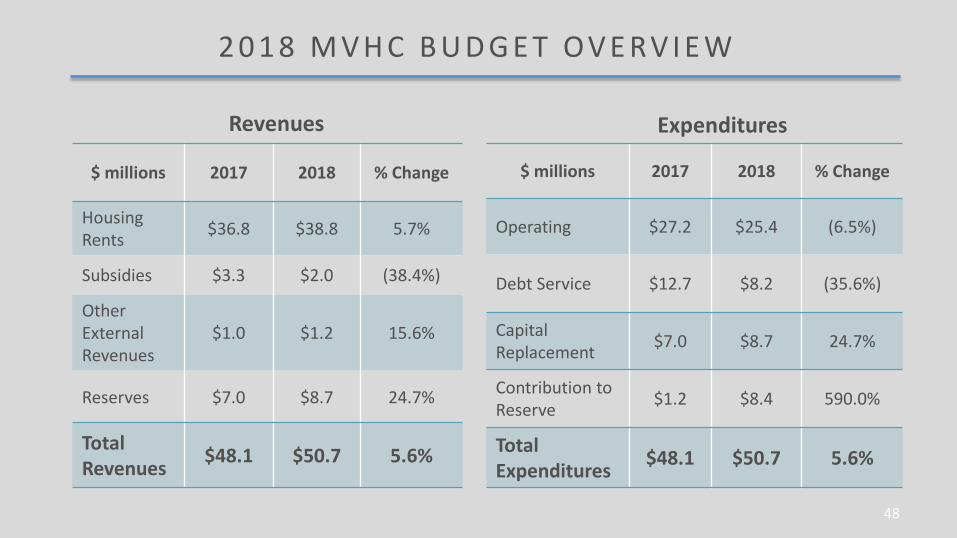
$ millions 2017 2018 % Change
Housing Rents $36.8 $38.8 5.7%
Subsidies $3.3 $2.0 (38.4%)
Other External Revenues
$1.0 $1.2 15.6%
Reserves $7.0 $8.7 24.7%
Total Revenues $48.1 $50.7 5.6%
2 0 1 8 M V H C B U D G E T OV E RV I E W
Revenues Expenditures
$ millions 2017 2018 % Change
Operating $27.2 $25.4 (6.5%)
Debt Service $12.7 $8.2 (35.6%)
Capital Replacement $7.0 $8.7 24.7%
Contribution to Reserve $1.2 $8.4 590.0%
Total Expenditures $48.1 $50.7 5.6%
49
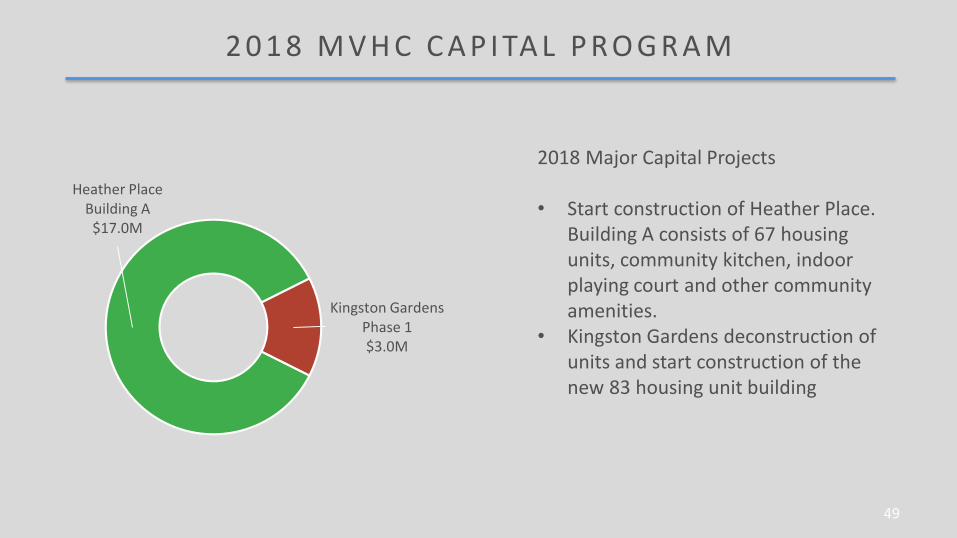
2 0 1 8 M V H C C A P I TA L P R O G R A M
Heather Place Building A
$17.0M
Kingston Gardens Phase 1$3.0M
2018 Major Capital Projects
• Start construction of Heather Place. Building A consists of 67 housing units, community kitchen, indoor playing court and other community amenities.
• Kingston Gardens deconstruction of units and start construction of the new 83 housing unit building
50
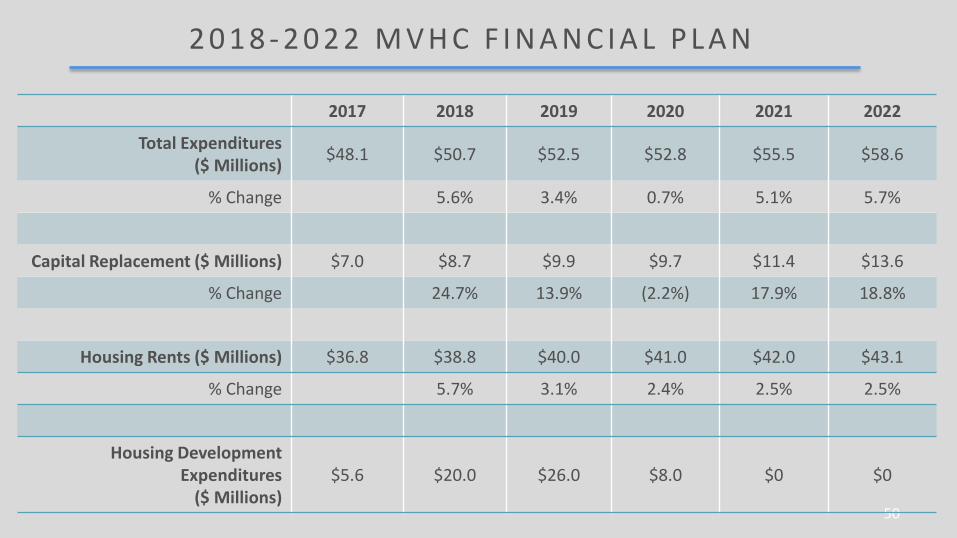
2 0 1 8 - 2 0 2 2 M V H C F I N A N C I A L P L A N
2017 2018 2019 2020 2021 2022
Total Expenditures ($ Millions) $48.1 $50.7 $52.5 $52.8 $55.5 $58.6
% Change 5.6% 3.4% 0.7% 5.1% 5.7%
Capital Replacement ($ Millions) $7.0 $8.7 $9.9 $9.7 $11.4 $13.6
% Change 24.7% 13.9% (2.2%) 17.9% 18.8%
Housing Rents ($ Millions) $36.8 $38.8 $40.0 $41.0 $42.0 $43.1
% Change 5.7% 3.1% 2.4% 2.5% 2.5%
Housing Development Expenditures
($ Millions)$5.6 $20.0 $26.0 $8.0 $0 $0
51
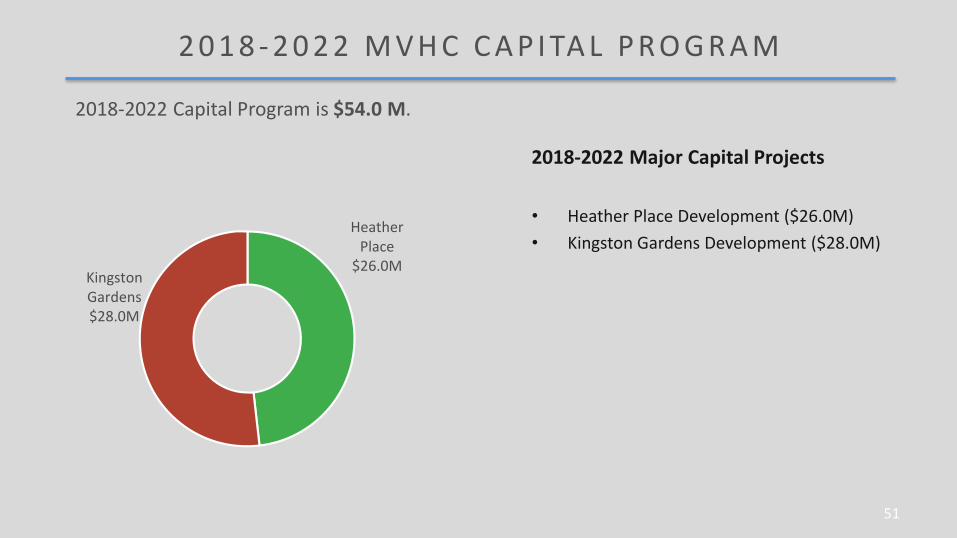
2 0 1 8 - 2 0 2 2 M V H C C A P I TA L P R O G R A M
Heather Place
$26.0MKingston Gardens$28.0M
2018-2022 Capital Program is $54.0 M.
2018-2022 Major Capital Projects
• Heather Place Development ($26.0M)• Kingston Gardens Development ($28.0M)
52
2 0 1 8 M V H C B U D G E T H I G H L I G H T S
2018 Budget Key Actions:• Redevelopment of Heather Place and Kingston Gardens • Tenant relocation driven by redevelopment• Implementation of new asset management plan • Increase the number of tenant associations and community gardens• Building envelope projects at Evergreen Downs and Eastburn Square
complexes• Communications Program
53
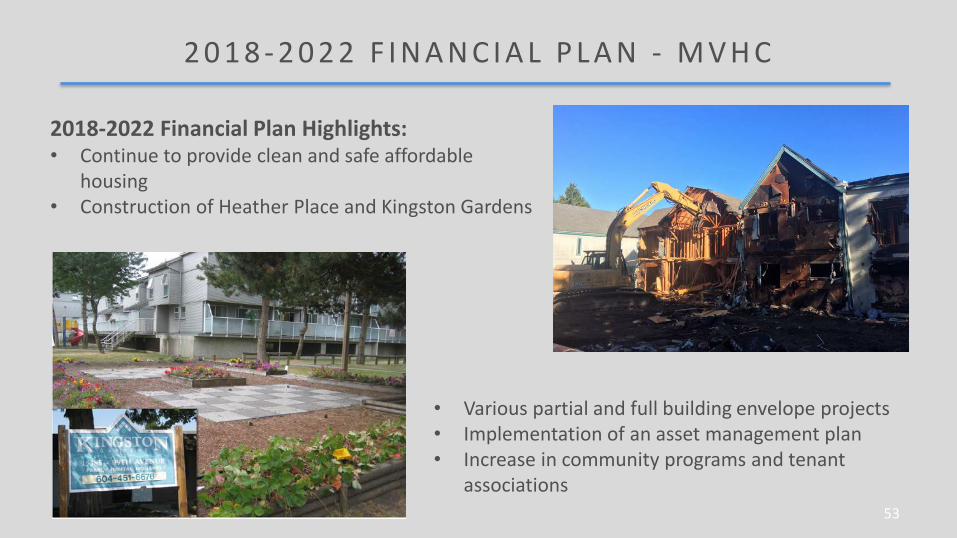
2 0 1 8 - 2 0 2 2 F I N A N C I A L P L A N - M V H C
2018-2022 Financial Plan Highlights:• Continue to provide clean and safe affordable
housing• Construction of Heather Place and Kingston Gardens
• Various partial and full building envelope projects• Implementation of an asset management plan• Increase in community programs and tenant
associations

54
METRO VANCOUVER REGIONAL DISTRICT
55
PARKS PLANNING AND ENVIRONMENT
AFFORDABLE HOUSING, AIR QUALITY, ELECTORAL AREA, REGIONAL PLANNING & REGIONAL PARKS

56
2 0 1 8 R E G I O N A L D I S T R I C T B U D G E T O V E RV I E WP a r k s , P l a n n i n g a n d E n v i r o n m e n t
$ millions 2017 2018 %Change
Affordable Housing $0.7 $2.0 170.5%
Air Quality $10.3 $10.5 1.9%
Electoral Area Service $0.6 $0.7 20.3%
Regional Planning $3.0 $3.1 3.2%
Regional Parks $36.2 $37.5 3.5%
Expenditures

57
2 0 1 8 R EG I O N A L PA R KS C A P I TAL P RO G R A M
Regional Parks Land Acquisition
$4.0M
Capital Maintenance
$4.0M
Capital Development
$4.1M
2018 Capital Program is $12.1 M. 2018 Major Capital Projects
• Colony Farm Sheep Paddocks Trail($1.5 M)
• Aldergrove Day Use Area & Trails ($0.5M)
• Belcarra – Connection to Water ($0.4M)

$ millions 2017 2018 %Change 2019 %
Change 2020 %Change 2021 %
Change 2022 % Change
Affordable Housing $0.7 $2.0 170.5% $2.1 2.8% $2.1 1.2% $2.2 1.3% $2.2 1.6%
Air Quality $10.3 $10.5 1.9% $10.5 0.4% $10.5 (0.5%) $10.6 1.8% $10.8 1.8%
Electoral Area Service $0.6 $0.7 20.3% $0.6 (11.7%) $0.7 5.2% $0.6 (1.9%) $0.7 15.4%
Regional Planning $3.0 $3.1 3.2% $3.2 3.2% $3.3 3.3% $3.4 2.8% $3.4 0.6%
Regional Parks $36.2 $37.5 3.5% $38.6 2.9% $39.4 2.0% $40.8 3.8% $42.3 3.5%
2 0 1 8 - 2 0 2 2 R E G I O N A L D I S T R I C T F I N A N C I A L P L A NP a r k s , P l a n n i n g a n d E n v i r o n m e n t
59
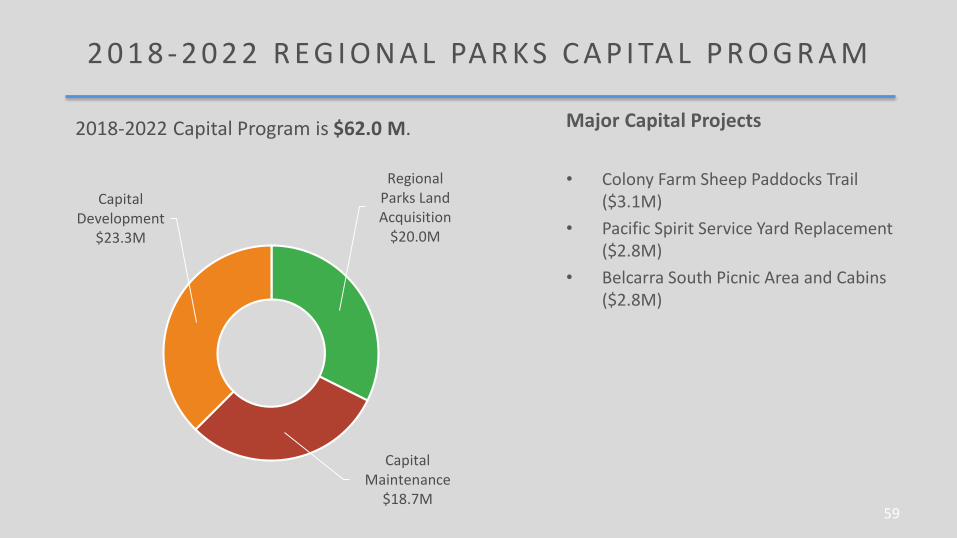
2 0 1 8 - 2 0 2 2 R E G I O N A L PA R K S C A P I TA L P R O G R A M
Regional Parks Land Acquisition
$20.0M
Capital Maintenance
$18.7M
Capital Development
$23.3M
2018-2022 Capital Program is $62.0 M. Major Capital Projects
• Colony Farm Sheep Paddocks Trail($3.1M)
• Pacific Spirit Service Yard Replacement ($2.8M)
• Belcarra South Picnic Area and Cabins ($2.8M)
60
2018 Budget Key Actions:• Develop a ‘Metro Vancouver Affordable Rental Housing 10-Year Action Plan’• Implementation plan for the Regional Affordable Housing Strategy• Climate 2050 – integrated framework for regional climate action• Air Quality regulatory and permit fee review• Adopt and implement Electoral Area A Official Community Plan• Complete an Agricultural Viability Study for Barnston Island• Complete the 2018 local election
2 0 1 8 R E G I O N A L D I S T R I C T B U D G E T O V E RV I E WP a r k s , P l a n n i n g a n d E n v i r o n m e n t
61
2018 Budget Key Actions (continued):• Develop 100 year growth scenarios• Develop Regional Industrial Lands Strategy• Completion and adoption of Parks Land Acquisition Strategy• Colony Farm Sheep Paddocks Trail
Proposed Staffing Changes:• Policy Coordinator – to lead consultation activities on Air quality bylaws and regulations• Policy Analyst – to undertake policy development and climate change related projects• Special Events Assistant – to support park event throughout the region• Policy Analyst – to develop long-range data forecasts
2 0 1 8 R E G I O N A L D I S T R I C T B U D G E T O V E RV I E WP a r k s , P l a n n i n g a n d E n v i r o n m e n t
62
2018-2022 Financial Plan Highlights:• Implement a ‘Metro Vancouver Affordable Rental Housing 10-Year Action Plan’• New Air Quality Management Plan• Implementation of Climate 2050• Adopt and implement Electoral Area A Official Community Plan• Complete an Agricultural Viability Study for Barnston Island• Implement Regional Industrial Lands Strategy• Regional Growth Strategy Update• Colony Farm Sheep Paddocks Trail• Crippen Park Davies Orchard – Phase 1• Derby Reach day-use improvements• Belcarra south picnic area construction
2 0 1 8 - 2 0 2 2 F I N A N C I A L P L A N - R E G I O N A L D I S T R I C TP a r k s , P l a n n i n g a n d E n v i r o n m e n t
63
METRO VANCOUVER REGIONAL DISTRICTOTHER REGIONAL DISTRICT SERVICES

64
2 0 1 8 R E G I O N A L D I S T R I C T B U D G E T O V E RV I E WO t h e r R e g i o n a l S e r v i c e s
$ millions 2017 2018 %Change
E911 Emergency Telephone Service $4.2 $4.3 2.8%
General Government $6.2 $6.8 10.2%
Labour Relations $2.7 $2.7 (1.4%)
Regional Emergency Management $0.2 $0.2 (18.1%)
Regional Global Positioning System $0.4 $0.3 (6.8%)
Sasamat Fire Protection Service $0.9 $0.4 (58.6%)
Expenditures
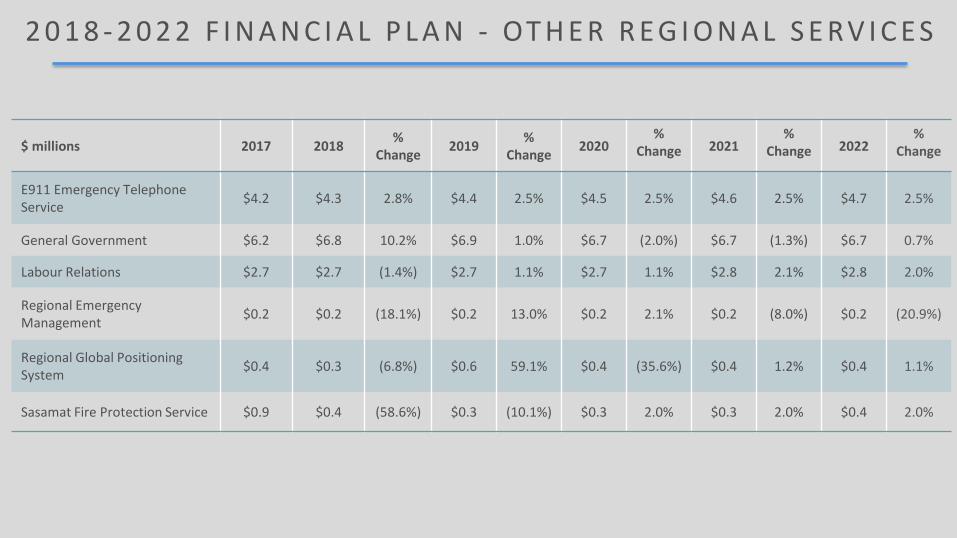
$ millions 2017 2018 %Change 2019 %
Change 2020%
Change 2021%
Change 2022%
Change
E911 Emergency TelephoneService $4.2 $4.3 2.8% $4.4 2.5% $4.5 2.5% $4.6 2.5% $4.7 2.5%
General Government $6.2 $6.8 10.2% $6.9 1.0% $6.7 (2.0%) $6.7 (1.3%) $6.7 0.7%
Labour Relations $2.7 $2.7 (1.4%) $2.7 1.1% $2.7 1.1% $2.8 2.1% $2.8 2.0%
Regional Emergency Management $0.2 $0.2 (18.1%) $0.2 13.0% $0.2 2.1% $0.2 (8.0%) $0.2 (20.9%)
Regional Global Positioning System $0.4 $0.3 (6.8%) $0.6 59.1% $0.4 (35.6%) $0.4 1.2% $0.4 1.1%
Sasamat Fire Protection Service $0.9 $0.4 (58.6%) $0.3 (10.1%) $0.3 2.0% $0.3 2.0% $0.4 2.0%
2 0 1 8 - 2 0 2 2 F I N A N C I A L P L A N - OT H E R R E G I O N A L S E R V I C E S
66
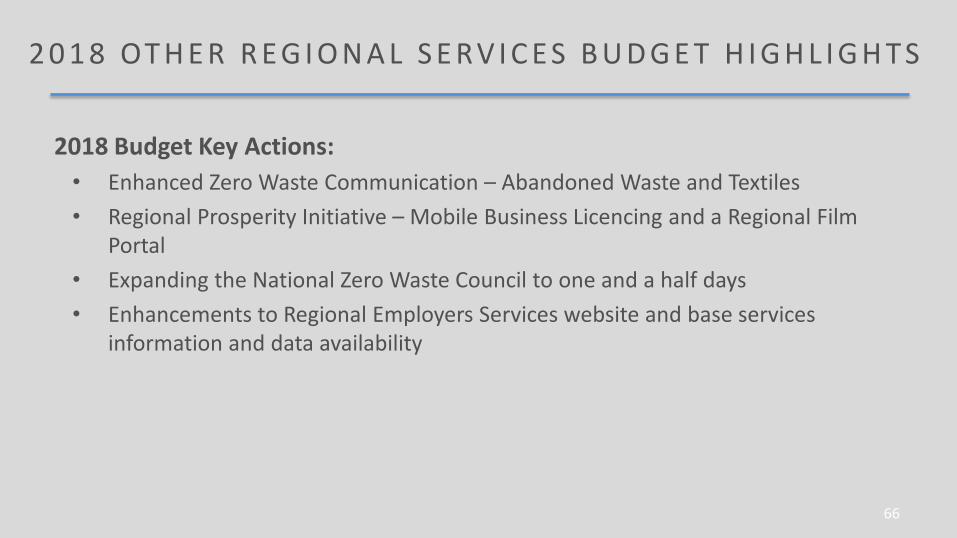
2018 Budget Key Actions:• Enhanced Zero Waste Communication – Abandoned Waste and Textiles• Regional Prosperity Initiative – Mobile Business Licencing and a Regional Film
Portal• Expanding the National Zero Waste Council to one and a half days• Enhancements to Regional Employers Services website and base services
information and data availability
2 0 1 8 OT H E R R E G I O N A L S E RV I C E S B U D G E T H I G H L I G H T S

67
2018-2022 Financial Plan Highlights:• Continuation of Zero Waste Campaigns including: Abandoned Waste, Create Memories
Not Garbage, Love Food Hate Waste, Food Scraps, Textile Awareness• Implementation of Annual RPI Contribution – subject to creation of independent entity
with cost sharing from Federal, Provincial and local partners• Coordination and implementation of IPREM Regional Exercise Program, Regional
Recovery Framework, Disaster Debris Management Plan and Regional Risk Assessment• Review and phase in implementation of Sasamat Fire Protection Service seismic
improvement program
2 0 1 8 - 2 0 2 2 F I N A N C I A L P L A N - OT H E R R E G I O N A L S E R V I C E S
68
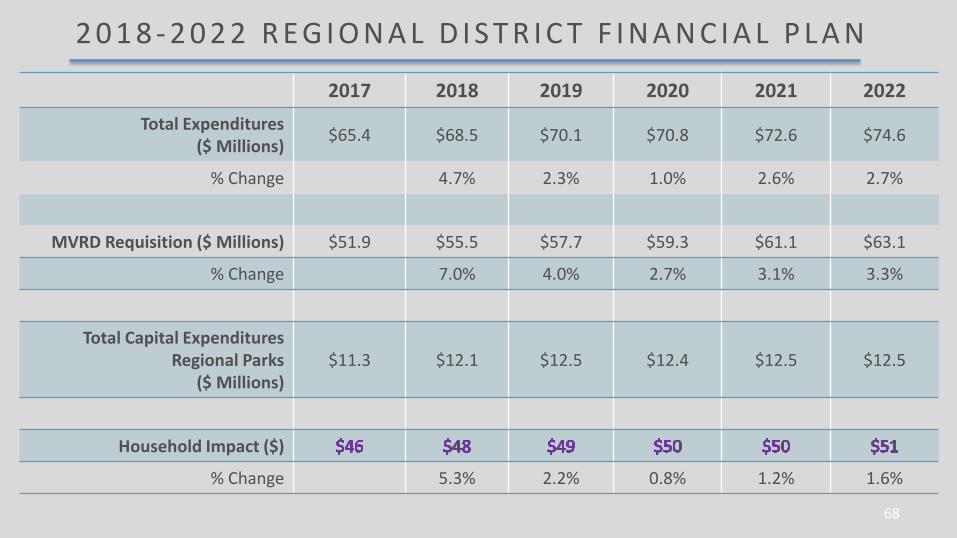
2 0 1 8 - 2 0 2 2 R E G I O N A L D I S T R I C T F I N A N C I A L P L A N
2017 2018 2019 2020 2021 2022Total Expenditures
($ Millions) $65.4 $68.5 $70.1 $70.8 $72.6 $74.6
% Change 4.7% 2.3% 1.0% 2.6% 2.7%
MVRD Requisition ($ Millions) $51.9 $55.5 $57.7 $59.3 $61.1 $63.1
% Change 7.0% 4.0% 2.7% 3.1% 3.3%
Total Capital ExpendituresRegional Parks
($ Millions)$11.3 $12.1 $12.5 $12.4 $12.5 $12.5
Household Impact ($)
% Change 5.3% 2.2% 0.8% 1.2% 1.6%

69
STANDING COMMITTEE FEEDBACK & SUMMARY
70
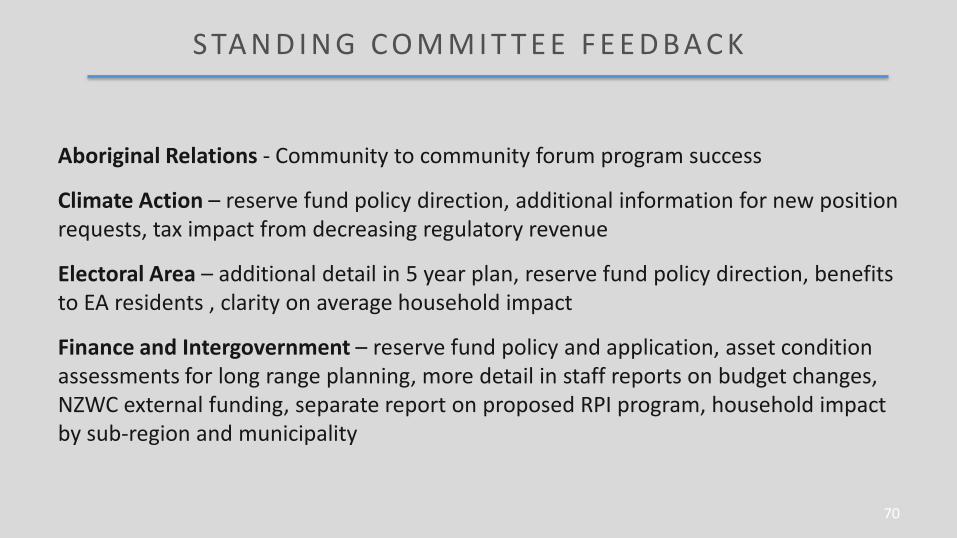
Aboriginal Relations - Community to community forum program success
Climate Action – reserve fund policy direction, additional information for new position requests, tax impact from decreasing regulatory revenue
Electoral Area – additional detail in 5 year plan, reserve fund policy direction, benefits to EA residents , clarity on average household impact
Finance and Intergovernment – reserve fund policy and application, asset condition assessments for long range planning, more detail in staff reports on budget changes, NZWC external funding, separate report on proposed RPI program, household impact by sub-region and municipality
S TA N D I N G C O M M I T T E E F E E D B A C K
71
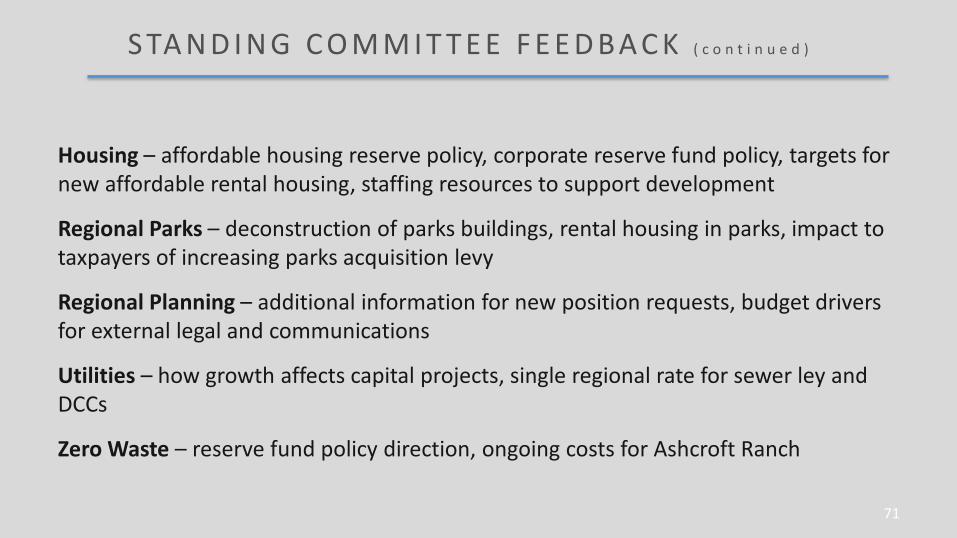
Housing – affordable housing reserve policy, corporate reserve fund policy, targets for new affordable rental housing, staffing resources to support development
Regional Parks – deconstruction of parks buildings, rental housing in parks, impact to taxpayers of increasing parks acquisition levy
Regional Planning – additional information for new position requests, budget drivers for external legal and communications
Utilities – how growth affects capital projects, single regional rate for sewer ley and DCCs
Zero Waste – reserve fund policy direction, ongoing costs for Ashcroft Ranch
S TA N D I N G C O M M I T T E E F E E D B A C K ( c o n t i n u e d )
72
That the MVRD Board approve an increase to the 2018Contribution to the Regional Park Land Acquisition Fund by $3.8Million to bring the total contribution to $7.57 million, providedannually from the MVRD Regional Parks tax requisition.
R EG I O N A L PA R KS CO M M I T T E E R ES O LU T I O N

Average Assessed
Value(Millions)
2017 2018 % 2019 % 2020 % 2021 % 2022 %
Vancouver Sewer Area $1.682 $474 $501 5.6% $522 4.4% $536 2.5% $559 4.2% $590 5.6%
North Shore Sewer Area $1.824 $503 $524 4.2% $542 3.8% $609 12 % $706 15.9% $790 11.8%
Lulu Island West Sewer Area $1.035 $476 $484 1.6% $502 3.8% $521 3.6% $553 6.2% $582 5.2%
Fraser Sewer Area $0.846 $437 $453 3.6% $479 6.1% $508 5.7% $536 5.5% $558 4.1%
Regional Average $1.140 $452 $470 4.1% $494 5.1% $520 5.1% $551 6.0% $581 5.3%
H O U S E H O L D I M PA C T S U M M A R Y (1)
(1) Details can be referenced – Page 1 of 2018-2022 Financial Plan

Thank you