Embed Size (px)
Citation preview
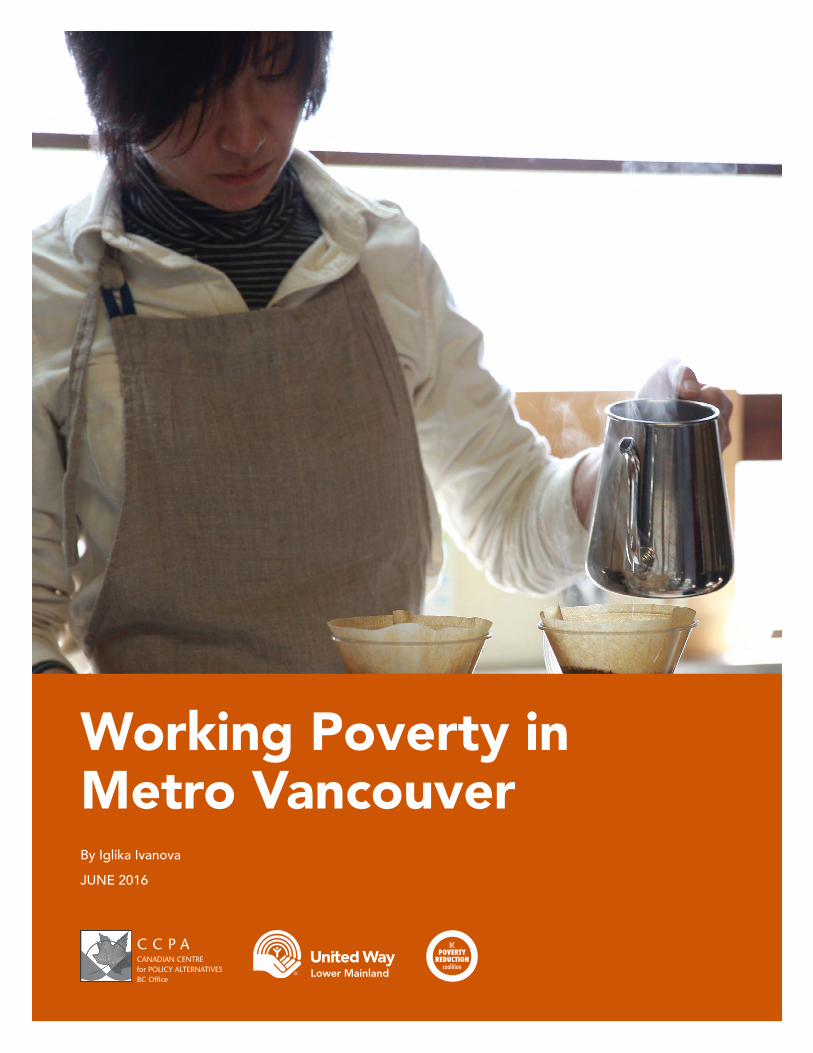
Working Poverty in Metro Vancouver By Iglika IvanovaJUNE 2016
1400 – 207 West Hastings StreetVancouver BC V6B 1H7604.801.5121 | [email protected]
www.policyalternatives.ca
WORKING POVERTY IN METRO VANCOUVER
By Iglika Ivanova
June 2016
ABOUT THE AUTHOR
IGLIKA IVANOVA is a senior economist and the Public Interest Researcher at the CCPA–BC. She researches and writes on issues of government finance and how budget decisions relate to the accessibility and quality of public services. She also studies labour market developments and in par-ticular, trends in income inequality and low wage work. Her recent CCPA–BC publications include Working for a Living Wage 2016 and Solving BC’s Affordability Crisis in Child Care: Financing the $10
a Day Plan.
ACKNOWLEDGEMENTS
The author would like to thank David Hulchanski and the entire team of the Neighbourhood Change Research Partnership for sharing the working poverty data for Metro Vancouver. I also thank Richard Maaranen for producing the Metro Vancouver maps and Brian Murphy for providing additional data for this research and kindly answering all my questions about the dataset. Thanks to the Metcalf Foundation for providing the inspiration for this report, and to John Stapleton for pointing me in the right direction, assisting with obtaining the data, and providing encouragement, suggestions and comments on earlier drafts along the way. This report would not have been possible without you! I am also grateful to Shannon Daub, Trish Garner, Scott Graham, Craig Jones, Seth Klein, Deanna Ogle, Mary Ellen Schaafsma and two anonymous reviewers for their comments on earlier drafts of this report. Thanks also to my dedicated colleagues at the Canadian Centre for Policy Alternatives whose enthusiasm, generosity and good humour made this report what it is: Shannon Daub, Sarah Leavitt and Terra Poirier.
Thanks to the United Way of the Lower Mainland for their financial support of this research project.
The opinions and recommendations in this report, and any errors, are the author’s and do not necessarily reflect the views of the publishers and funders of this report. This report is available under limited copyright protection. You may download, distribute, photocopy, cite, or excerpt this document provided it is properly and fully credited and not used for commercial purposes.
Copyedit: Lucy KenwardLayout: Paula Grasdal
ISBN: 978-1-77125-293-5

Contents
Summary ..................................................................................................................... 4
Part 1: Introduction ...................................................................................................... 9
Part 2: What is working poverty? .............................................................................. 11
Part 3: The state of working poverty in Metro Vancouver ........................................... 14
Part 4: Who are the working poor? ............................................................................ 16
Part 5: Working poverty reaches all municipalities .................................................... 18
Part 6: Working poverty by neighbourhood in Metro Vancouver ............................. 20
Part 7: Economic and public policy changes contributing to working poverty ............ 24
Inadequate minimum wage ............................................................................. 24
Increased precarity in the labour market .......................................................... 25
Weaker redistributive role of taxes and transfers ............................................. 26
Weakened public services and supports ........................................................... 28
Part 8: Policy recommendations................................................................................. 30
Provincial recommendations ............................................................................. 30
Federal recommendations ................................................................................. 32
Municipal recommendations ............................................................................. 32
Working together to end working poverty ....................................................... 33
Appendix: The data ................................................................................................... 34

What is working poverty?
This study uses the Metcalf Foundation’s definition of working poverty which identifies an individual as a member of the working poor if they:
• are between the ages of 18 and 64 (working age),
• live in a family with after-tax income below Statistics Canada’s Low Income Measure (LIM),
• earn at least $3,000 per year (the minimum working income required to qualify for the federal Working Income Tax Benefit),
• are not a student and
• live independently (alone or with a spouse and/or dependent children but not with parents or other relatives).
The working poverty rate is defined as the share of all working-age individuals who are working poor.
4 WORKING POVERTY IN METRO VANCOUVER
The majority of British Columbians
living in poverty do not rely on welfare.
Summary
IN A PROVINCE AS RICH AS BC, and in an area as economically diverse as Metro Vancouver, the contradiction between massive wealth and rising economic insecurity is particularly stark.
Not only are deep poverty and homelessness highly visible on the streets of Vancouver, hidden poverty and economic insecurity are serious problems across the region. Deep poverty is primarily a story of inadequate welfare rates, which remain stuck at levels far below what people need to survive. But the majority of British Columbians living in poverty do not rely on welfare. Fewer
than 4 per cent of British Columbians receive social assistance at any given time, a small share of the more than 14 per cent of people living in poverty.
We are often told that the solution to poverty is for the poor to “get a job” or for various sectors to create more jobs, but the reality is that having a job is not a guaranteed path out of poverty. Increasingly, the story of poverty in BC is becoming a story of low-paid and precarious jobs. Many of the new jobs created since the 2008 recession have been part-time, temporary and low paid. Metro Vancouver’s booming economy relies on a large group of low-paid workers to provide security, catering, cleaning, administration and other services.
A recent study published by the Metcalf Foundation found that Metro Vancouver had the second-highest rate of working poverty of any major city in Canada in 2012, with a rate only slightly lower than Greater Toronto. This report digs deeper into the data from the Metcalf Foundation study, maps the extent of working poverty in Vancouver and its growth by neighbour-hood, and puts forward recommendations for change.

WORKING POVERTY IN METRO VANCOUVER 5
Working poverty is a serious issue in Metro Vancouver.
Canada’s two richest cities, Greater Toronto and Metro Vancouver, have the highest working poverty rates in the country. They are outliers among other large urban areas, where working poverty rates that are considerably lower. Worse still, Metro Vancouver and Greater Toronto’s working poor face extremely high housing costs, which are not captured in these comparisons because this measure of poverty does not account for vastly different costs of living across the country.
Though this study focuses on Metro Vancouver, working poverty exists elsewhere in BC as well. Our analysis shows that 7.2 per cent of working-age British Columbians living outside of Metro Vancouver are working poor.
Who are the working poor?
In Metro Vancouver in 2012:
• Just over half (54 per cent) of the working poor were married or living common law.
• 42 per cent had dependent children (32 per cent were living in couple families with children and 9 per cent were single parents).
• One in four (24 per cent) was between the ages of 18 and 29.
• The majority (61 per cent) were between the ages of 30 and 54, or what economists consider prime working age.
• 9 per cent received employment insurance (EI) benefits at some point during the year.
A recent study published by the Metcalf Foundation found that Metro Vancouver had the second-highest rate of working poverty of any major city in Canada in 2012.
Note: These are Canada’s nine largest census metropolitan areas (CMAs) plus Halifax (12th largest).
Source: Statistics Canada, custom tabulation, T1FF tax filer data.
Working poverty in Canada’s largest cities, 2006 and 2012. Percentage of working poor individuals among the working-age population.
0% 2% 4% 6% 8% 10%
Quebec City
Ottawa
Edmonton
Calgary
Hamilton
Halifax
Montreal
Canada
Winnipeg
Vancouver
Toronto
2006
2012

6 WORKING POVERTY IN METRO VANCOUVER
Working poverty is not confined to a
few municipalities; it is a regional problem in Metro Vancouver.
These numbers are similar across the entire province of BC.
In Metro Vancouver, single parents are the most likely to experience working poverty, followed closely by individuals living alone. A recent Statistics Canada study shows that the poverty rate among Vancouver immigrants who have been in Canada for fewer than 15 years continues to be double the rate of long-term immigrants and Canadian-born citizens. Poverty rates are even higher for very recent immigrants.
Working poverty is a growing problem for all Metro Vancouver municipalities.
Working poverty is not confined to a few municipalities; it is a regional problem in Metro Vancouver. While the cities of Vancouver, Surrey, Burnaby, Richmond and Coquitlam have some of the highest working poverty rates, a number of smaller municipalities like Bowen Island and North Vancouver also have high levels of working poverty. (Data are not available for the Musqueam and Squamish reserve lands.)
Worse still, working poverty has grown in most municipalities since 2006, with the largest increases occurring in suburban neighbourhoods in West Vancouver (15 per cent increase), Coquitlam (13 per cent), White Rock (15 per cent), Lions Bay (17 per cent) and District of North Vancouver (13 per cent). Even municipalities generally seen as wealthy have experienced increases in working poverty.
A look at working poverty by neighbourhood further underlines how widespread it is across Metro Vancouver. By 2012, fewer neighbourhoods had low working poverty rates (less than 5 per cent) than in 2006, and many more neighbourhoods saw rates rise above 10 per cent. The concentration of neighbourhoods with high levels of working poverty increased most notably in Surrey and downtown Vancouver. In addition, Langley, Coquitlam and West Vancouver — which had previously had lower working poverty rates — had neighbourhoods with rates higher than 10 per cent by 2012.
Working poverty can be eliminated.
Working poverty can be reduced and eventually eliminated with a combination of labour market reforms, more generous income supports, and better public services. The report makes detailed policy recommendations for how this can be achieved, including action to:
• increase the minimum wage;
• strengthen employment standards;
• make sure all British Columbians have access to safe, affordable housing;
• provide access to high quality, public child care;
• make training and education more accessible to low-income earners;
• reform employment insurance;
• enhance the Working Income Tax Benefit;
• make all levels of government living wage employers.

WORKING POVERTY IN METRO VANCOUVER 7
Source: Statistics Canada, custom tabulation, T1FF tax filer data.
Note: Greater Vancouver A, also known as Electoral Area A, is an unincorporated area that includes UBC, the University Endowment Lands and several sparsely populated areas of Metro Vancouver.
Working poverty by municipality in Metro Vancouver, 2006 and 2012.Percentage of working poor individuals among the working-age population.
0% 2% 4% 6% 8% 10% 12%
Anmore
Pitt Meadows
Port Moody
Delta
Maple Ridge
North Vancouver District
Langley District
Port Coquitlam
Lions Bay
White Rock
Langley
West Vancouver
New Westminster
Coquitlam
Bowen Island
North Vancouver
Surrey
Burnaby
Vancouver
Greater Vancouver A
Richmond
2006
2012
Working poverty rate by neighbourhood, Metro Vancouver, 2012.
.
November 2015
Percentage of working poor individuals among the working-age population after-tax, Vancouver census metropolitan area, 2012
Source: Statistics Canada, custom tabulation, T1FF tax filer data, 2012
Note: Data are mapped to 2006 boundaries. Working age population defined as individuals who are between 18 and 64, non-students and living on their own. Working status refers to persons having earnings no less than $3,000. Poor status refers to individuals with census family income below the Low Income Measure (50% of adjusted after-tax medianincome of all Canadians) determined from taxfiler data (T1FF).
Percentage by Census Tracts0% to 5%
5% to 10%
10% to 15%
15% to 20%
Not Available
Municipalities (2006)
Rapid Transit (2011)
Highways and Major Roads (2011)
Major Rivers and Lakes
Richmond Name of Municipality or Equivalent (2006)
3 0 31.5
Kilometres
Vancouver
BurnabyMusqueam 2
Greater Vancouver A
Richmond
Delta Surrey
Coquitlam
Port Moody
AnmoreNorth Vancouver District
North Vancouver
West Vancouver
Capilano 5
Burrard Inlet
Boundary Bay
G u l f O fG e o r g i a
New Westminster
Belcarra
Fraser River
Trans-Canada Hwy
Hastings St
4th AveBroadway
49th Ave Kingsway
Gran
ville
St
Knigh
t St
Marine Dr
Boun
dary
Rd
Westminster Hwy
Steveston Hwy
99 H
wy
99 Hwy
120 S
t
King
Geo
rge H
wy
58 Ave
88 Ave
104 Ave
River Rd
Lougheed Hwy
Marine Dr
17 H
wy
Fraser Hwy
Camb
ie St
Lougheed Hwy
91 H
wy
No. 2
Rd
North
Rd
Sea Island
Port Coquitlam
White Rock
56 Ave
Trans-Canada Hwy
Pitt MeadowsMaple Ridge
Langley DistrictLangley
Greater Vancouver A
Tsawwassen

8 WORKING POVERTY IN METRO VANCOUVER
Every level of government has a role to play, but the provincial government is uniquely positioned to take the lead. In the end, working poverty is only a part of the complex story of poverty in BC. To improve the lives of all poor British Columbians, we need a comprehensive poverty reduction plan with targets and timelines.
Reducing poverty will help not just those who are poor. Better public services and income supports enhance quality of life for all British Columbians and build more inclusive, vibrant and healthy communities — communities we can all be proud to live in.

WORKING POVERTY IN METRO VANCOUVER 9
We are often told that the solution to poverty is for the poor to get a job or for various sectors to create more jobs, but the reality is that having a job is not a guaranteed path out of poverty.
P A R T 1
Introduction
METRO VANCOUVER IS ONE OF CANADA’S LARGEST AND RICHEST URBAN AREAS, a region with a dynamic and diverse economy. Home to Canada’s largest port, Metro Vancouver has long played an important role in trade. It’s also a major tourist destination, a booming film production centre and a growing high-tech hub.
This makes the contradiction between massive wealth and rising economic insecurity in the region particularly stark. Just steps away from high-end luxury shops and hotels downtown lies Canada’s poorest postal code, where street homelessness and abject poverty reveal another side of the city, a city that fails to share its enormous wealth. Street homelessness is the most acute and obvious face of poverty but it’s only the tip of the iceberg. Hidden poverty and economic insecurity are serious problems in British Columbia, and research suggests that poverty is costing the province between $8.1 and $9.2 billion per year.1
We are often told that the solution to poverty is for the poor to get a job or for various sectors to create more jobs, but the reality is that having a job is not a guaranteed path out of poverty. One in nine British Columbians assisted by food banks last year was working (11 per cent).2 Many of the new jobs created since the 2008–2009 recession have been part-time, temporary and low paid. Notably, BC currently has the lowest minimum wage in Canada. The region’s booming economy relies on low-paid workers to provide security, catering, cleaning, administration and other services.
Low-wage workers face heightened challenges in Metro Vancouver, which has a high cost of living and some of the most expensive housing in Canada. However, when two-thirds of job
1 Iglika Ivanova, The Cost of Poverty in BC (Vancouver: Canadian Centre for Policy Alternatives, 2011).2 Food Banks Canada, HungerCount 2015: A comprehensive report on hunger and food bank use in Canada, and
recommendations for change (Mississauga, ON: Food Banks Canada, 2015).
10 WORKING POVERTY IN METRO VANCOUVER
vacancies in the province are in the Lower Mainland/Southwest region of BC, leaving the city is not a realistic option for many.3
A recent study published by the Metcalf Foundation found that Metro Vancouver had the second-highest rate of working poverty in Canada in 2012, a rate only slightly lower than Greater Toronto.4 This report digs deeper into the data, maps the extent of working poverty in Vancouver and its growth since 2006, and puts forward recommendations for change.5
3 Data for the first three quarters of 2015 from Statistics Canada, Job Vacancy and Wage Survey (CANSIM Table 285-0001).
4 The Vancouver census metropolitan area (CMA) had the second-highest rate of working poverty of 17 large urban areas (CMAs) included in the research. John Stapleton with Jasmin Kay, The Working Poor in the Toronto Region: Mapping working poverty in Canada’s richest city (Toronto: Metcalf Foundation, 2015). Due to the time lag for income data to become available, researchers always work with data that is at least two years old. The study by the Metcalf Foundation is based on data from 2012.
5 Many thanks to David Hulchanski and the entire team of the Neighbourhood Change Research Partnership for providing the data used in this report.
WORKING POVERTY IN METRO VANCOUVER 11
P A R T 2
What is working poverty?
CANADA HAS NO OFFICIAL DEFINITION OF WORKING POVERTY, which is undoubtedly one of the reasons that so few researchers have investigated this important issue.6
In this report, we adopt the Metcalf Foundation definition of working poverty. An individual is considered to be a member of the working poor if they:
• are between the ages of 18 and 64 (working age),
• live in a family with after-tax income below Statistics Canada’s Low Income Measure (LIM),7
• earn at least $3,000 per year (the minimum working income required to qualify for the federal Working Income Tax Benefit),
• are not a student8 and
• live independently (alone or with a spouse and/or dependent children but not with parents or other relatives).
6 For an overview of the definitions proposed in Canada over the years, see Chapter 2 of Dominique Fleury and Myriam Fortin, When Working is Not Enough to Escape Poverty: An Analysis of Canada’s Working Poor (Ottawa: Human Resources and Social Development Canada [HRSDC], 2006). This is the most recent major Canada-wide study of working poverty and it relies on data from the 2001 census. The Metcalf Foundation’s working poverty reports in 2012 and 2015 are the other major recent pieces, but they focus largely on Toronto. Note the HRSDC study uses a different definition of working poverty than the Metcalf Foundation reports do.
7 Canada does not have an official poverty measure. Statistics Canada produces several measures of low income, including the LIM, Low-Income Cut-Offs (LICO) and Market Basket Measure (MBM). The LIM is the only one included in the T1 Family File (T1FF) data. In 2012, the after-tax LIM in the T1FF was $16,968 for a single person and $33,936 for a family of two adults and two children. This is below the LICO after-tax thresholds for an urban area with a population larger than 500,000 people ($19,774 and $37,387 respectively) but slightly above the LICO after-tax thresholds for smaller communities. The LIM thresholds are also lower than the MBM thresholds for all community sizes in BC. The MBM thresholds are very similar to the LICO after-tax amounts but reflect disposable income (income after tax minus child care expenses, health care expenses and all mandatory payroll deductions).
8 These data are drawn from tax filers. Students are individuals claiming own tuition and education deductions on their tax return (amounts transferred from a spouse or a child are not included).
12 WORKING POVERTY IN METRO VANCOUVER
The definition of working poverty is
designed to capture individuals who rely on working
income to support themselves and
their families.
This definition is designed to capture individuals who rely on working income to support them-selves and their families. It excludes age groups with relatively low labour force participation rates (children under 18 and seniors over 65), even though some people in these groups are working to support themselves because they do not have sufficient income from other sources; for example, teenage children in poor families or seniors with inadequate pensions.
This definition of working poverty excludes students because many of them are either not in the workforce (employed or looking for work) or not fully available to work and are thus likely to work fewer hours and earn lower incomes. Pursuing education (especially post-secondary education) can be seen as an investment in future earning capacity that requires students to temporarily forego employment earnings. Excluding all students makes this definition a conservative measure of working poverty because some students struggle to cover their expenses and consequently amass large student loans that can impact their financial stability upon graduation9 (especially students with dependent children or those dealing with illness and disability).
This definition also excludes adult children living with their parents, grandparents or other rela-tives so as to avoid counting people who receive significant financial support or in-kind gifts from their families (e.g., free or low-cost housing or meals). Even though some adult children live with relatives because they aren’t able to support themselves on their employment earnings alone, they do not face the same challenges as adults who are working poor and have no access to extra family support.
9 May Luong, “The Financial Impact of Student Loans,” Perspectives on Labour and Income, vol. 11, no. 1 (2011): 5–18, www.statcan.gc.ca/pub/75-001-x/2010101/pdf/11073-eng.pdf.
Source: Statistics Canada, custom tabulation, T1FF tax filer data.
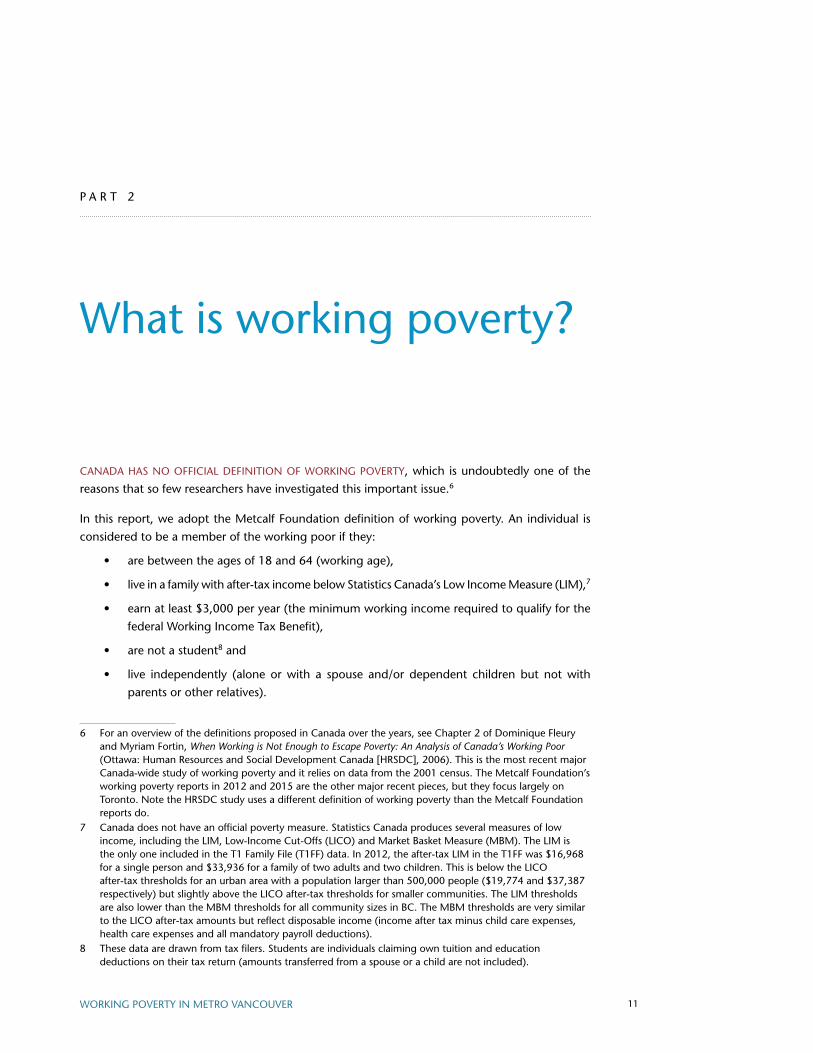
Figure1: Composition of the working-age population in Metro Vancouver, 2012.
Working-age population
Working status
Working poorWorking non-poor
Poverty status
1,217,200Individuals aged 18 to 64
(non-students, living independently)
Working
909,500
Not working
307,700
803,900 105,600
Non-working poorNon-working non-poor
Poverty status
140,200 167,500
WORKING POVERTY IN METRO VANCOUVER 13
The working poverty rate is defined as the share of all working-age individuals (regardless of their work status) who are working poor.10 The data used in this report are derived from Statistics Canada’s T1 Family File, based on annual income tax files (more details in the Appendix).
While the threshold to be considered “working” is only $3,000, most working poor earned considerably more than that. The median individual income (before tax) of Metro Vancouver’s working poor was $15,040 in 2012.
Figure 1 shows the composition of the working-age population in Metro Vancouver.
In 2012, 1.2 million working-age residents of Metro Vancouver were not students or adult chil-dren living with relatives.11 Of those 1.2 million, 74.7 per cent were working. While most of those who were working were not poor, a significant minority (11.6 per cent) lived in poverty. Those 105,600 people made up 8.7 per cent of the entire working-age population in Metro Vancouver (defined as the working poverty rate).
Another 167,500 people (13.8 per cent of Metro Vancouver’s working-age population) were poor but not working. This number includes people receiving welfare and disability assistance, as well as people who were unemployed or out of the labour force but did not receive social assistance. The remaining 140,200 non-working individuals of working age in Metro Vancouver were not poor. This category includes stay-at-home spouses as well as people living off investment earnings, rents or other non-wage sources of income.
10 Alternative definitions of the working poverty rate exist. For example, some researchers define it as the share of working individuals (or families) that is poor, rather than the share of all individuals (or families). Researchers also draw the line differently on what constitutes “working,” either as a certain number of hours worked or as a specific earning threshold.
11 For reference, Statistics Canada’s population estimates put Metro Vancouver’s entire population aged 18 to 64 at 1,636,516 people for 2012 (CANSIM Table 051-0056).
14 WORKING POVERTY IN METRO VANCOUVER
P A R T 3
The state of working poverty in Metro Vancouver
CANADA’S TWO RICHEST CITIES, Greater Toronto and Metro Vancouver, are outliers among all other large urban areas, where working poverty rates are considerably lower.
As Figure 2 demonstrates, this disparity is not a new development: Greater Toronto and Metro Vancouver had higher-than-average working poverty rates in 2006 as well. Notably, working poverty has grown across Canada between 2006 and 2012, with the largest increase observed in Toronto (11 per cent). By 2012, more than a million Canadians were working yet living in poverty (1,130,000 people) of whom 179,100 lived in British Columbia.
The reality of economic insecurity in both Vancouver and Toronto is likely worse than these sta-tistics suggest because of high housing costs. In the data available, working poverty is defined according to a national income threshold (the Low Income Measure after tax), which does not account for widely different costs of living across the country. Regardless of where in Canada they live, a family of four are considered poor if their 2012 after-tax income is below $33,936. However, the median rent for a two-bedroom apartment in Metro Vancouver or Toronto was al-most double the median rent in Montreal ($1,150 and $1,111 per month, respectively, compared to $660 per month).12
Although this report focuses on working poverty in large cities, working poverty exists elsewhere in Canada as well. Both BC and Ontario have a larger-than-average share of working poverty (see Figure 3). Outside Metro Vancouver, 7.2 per cent of working-age British Columbians are working poor. In contrast, only 5.8 per cent of Ontarians outside Toronto are working poor. So though Toronto had a higher rate of working poverty than Vancouver in 2012, the working poverty rate was considerably higher in BC (8 per cent) than it was in Ontario (7.3 per cent). Working poverty is concentrated in the big city in Ontario, but it seems to be a province-wide problem in BC.
12 Statistics for October 2012. Canada Mortgage and Housing Corporation, Housing Market Information Portal (accessed January 15, 2016).
Working poverty has grown across Canada between 2006 and 2012.

WORKING POVERTY IN METRO VANCOUVER 15
Source: Statistics Canada, custom tabulation, T1FF tax filer data.
Figure 3: Working poverty in Canada, 2006 and 2012. Percentage of working poor individuals among the working-age population.
0%
1%
2%
3%
4%
5%
6%
7%
8%
9%
BC Ontario Canada
2006
2012
Note: These are Canada’s nine largest census metropolitan areas (CMAs) plus Halifax (12th largest).
Source: Statistics Canada, custom tabulation, T1FF tax filer data.
Figure 2: Working poverty in Canada’s largest cities, 2006 and 2012. Percentage of working poor individuals among the working-age population.
0% 2% 4% 6% 8% 10%
Quebec City
Ottawa
Edmonton
Calgary
Hamilton
Halifax
Montreal
Canada
Winnipeg
Vancouver
Toronto
2006
2012

16 WORKING POVERTY IN METRO VANCOUVER
P A R T 4
Who are the working poor?
IN METRO VANCOUVER IN 2012,
• just over half (54 per cent) of the working poor were married or living common law.
• 42 per cent had dependent children (32 per cent were living in couple families with children and 9 per cent were single parents).
• one in four (24 per cent) was between the ages of 18 and 29.
• 61 per cent were between the ages of 30 and 54, or what economists consider prime working age.
• 9 per cent received employment insurance (EI) benefits at some point during the year.
The numbers are broadly similar when we look across the entire province of BC.
In Metro Vancouver, single parents are most at risk of working poverty followed closely by indi-viduals living alone. About 15.7 per cent of all working-age single parents were working poor in 2012, as were 15.5 per cent of all working-age British Columbians living on their own. In total, 39,000 adults living on their own in Metro Vancouver were working poor. Couples with children are the least likely to experience working poverty (only 6 per cent of all couples with children were working poor). However, because there are a lot more British Columbian parents living in two-parent families, many more working poor adults live in two-parent families (34,000) than as single parents (10,000).
Earlier research on working poverty in Toronto, using data from the 2006 census, found that immigrants were much more likely to experience working poverty. In Toronto, 73 per cent of the
In Metro Vancouver, single
parents are most at risk of
working poverty followed closely
by individuals living alone.

WORKING POVERTY IN METRO VANCOUVER 17
A recent study based on LAD data shows that despite small declines, the poverty rate among Vancouver immigrants who have been in Canada for fewer than 15 years continues to be double the rate of long-term immigrants and the Canadian-born citizens.
working poor were immigrants, compared to 57 per cent of the working-age population.13 The study also found the working poor in Toronto had comparable levels of education to those of the general working-age population and worked a similar number of hours per week and weeks per year. They were a lot more likely to work in sales and service occupations, and often had more than one job.
Unfortunately, the federal government’s decision to cancel the long-form census in 2011 and replace it with the voluntary National Household Survey has made it impossible to know if these characteristics are true of Metro Vancouver’s working poor and if trends have changed since the 2008–2009 recession. Statistics Canada’s Longitudinal Administrative Databank (LAD), which is based on tax files, fills in some (not all) of the gaps, but it is much more expensive to work with than census data were.14 A recent study based on LAD data shows that despite small declines, the poverty rate among Metro Vancouver immigrants who have been in Canada for fewer than 15 years continues to be double the rate of long-term immigrants and the Canadian-born citizens. Poverty rates are even higher for very recent immigrants.15
The data used for this analysis have been sourced from tax files (T1FF). The advantage of tax filer data is the large sample size covering 95 per cent of the Canadian population, but the data tell us little about who the working poor are and nothing about where they work.
13 John Stapleton, Brian Murphy and Yue Xing, “Working Poor” in the Toronto Region: Who they are, where they live, and how trends are changing (Toronto: The Metcalf Foundation, 2012), http://metcalffoundation.com/wp-content/uploads/2012/02/Working-Poor-in-Toronto-Region.pdf.
14 Fortunately, the long-form census questionnaire has been restored in time for the 2016 census. 15 Garnett Picot and Feng Hou, Immigration, Low Income and Income Inequality in Canada: What’s New in the
2000s? Analytical Studies Branch Research Paper Series, no. 364. Statistics Canada, 2014, Table A.1-2, http://www.statcan.gc.ca/pub/11f0019m/11f0019m2014364-eng.htm.

18 WORKING POVERTY IN METRO VANCOUVER
P A R T 5
Working poverty reaches all municipalities
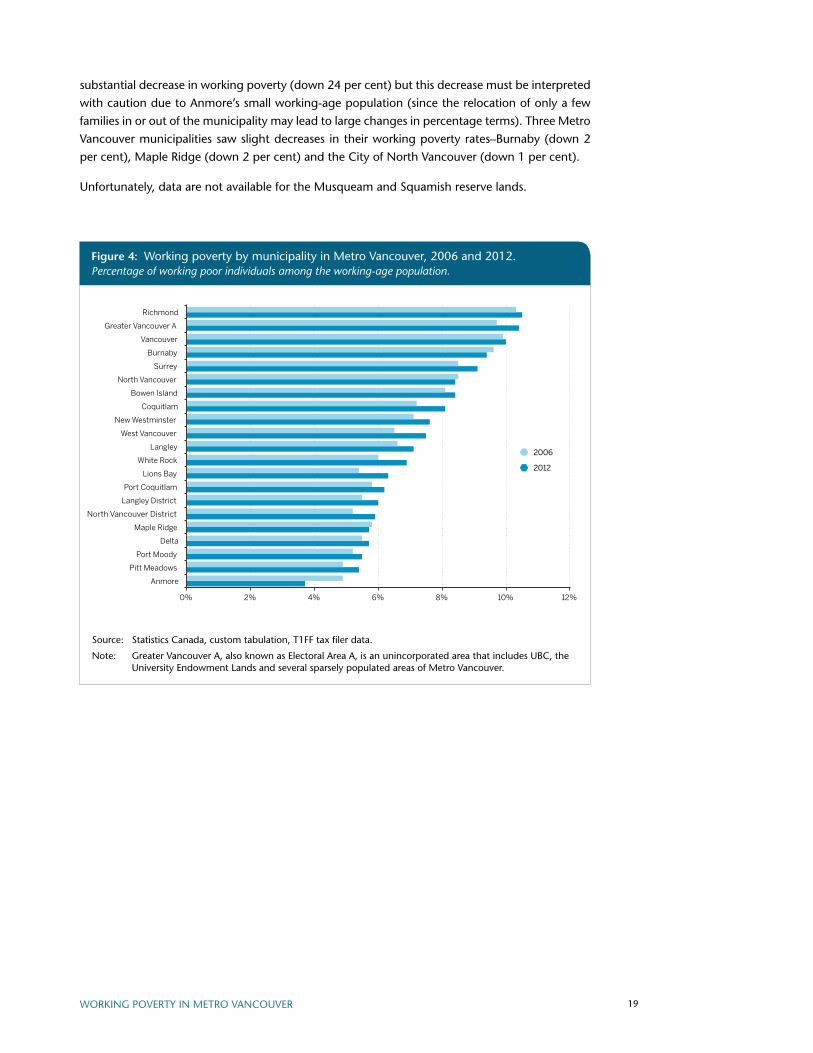
WORKING POVERTY IS NOT RESTRICTED TO A SMALL HANDFUL of municipalities, as Figure 4 shows. Metro Vancouver’s largest municipalities — Vancouver, Surrey, Burnaby, Richmond and Coquitlam — have some of the highest working poverty rates, but a number of smaller municipal-ities like Greater Vancouver Electoral Area A,16 Bowen Island and North Vancouver also see very high levels of working poverty.
In 2012, working poverty rates were highest in Richmond (10.5 per cent), Greater Vancouver Electoral Area A (10.4 per cent) and the City of Vancouver (10 per cent). Burnaby and Surrey also had above-average working poverty rates, with 9.4 per cent and 9.1 per cent respectively. Anmore, home of just over 1,000 working-age individuals in 2012, had the lowest working poverty rate in the Metro area and was the only municipality where the working poverty rate was less than 5 per cent. Municipalities with the lowest working poverty rates in 2012 include Pitt Meadows (5.4 per cent), Port Moody (5.5 per cent), Delta (5.7 per cent) and Maple Ridge (5.7 per cent).
Working poverty has risen slightly in Metro Vancouver since 2006, up from 8.4 per cent to 8.7 per cent of the working-age population in 2012 (an increase of 4 per cent). Most municipalities in the region saw increases in working poverty, with the largest increases being in West Vancouver (15 per cent), Coquitlam (13 per cent), White Rock (15 per cent), Lions Bay (17 per cent) and the District of North Vancouver (13 per cent). Anmore was the only municipality that saw a
16 Greater Vancouver Electoral Area A is made up of several unincorporated areas of Metro Vancouver, including the University of British Columbia and the University Endowment Lands; Bowyer and Passage Islands in Howe Sound; Barnston Island on the Fraser River (excluding the First Nations reserve there); the west side of Pitt Lake; the northern portion of Indian Arm; and a large and sparsely populated area to the north of the North Shore (north of Coquitlam, Anmore, North Vancouver and West Vancouver). Its total working-age population in 2012 was 6,130, making it the fourth smallest in Metro Vancouver (after Lions Bay, Anmore and Bowen Island).
Working poverty has risen or remained
unchanged in most municipalities
since 2006.
WORKING POVERTY IN METRO VANCOUVER 19
substantial decrease in working poverty (down 24 per cent) but this decrease must be interpreted with caution due to Anmore’s small working-age population (since the relocation of only a few families in or out of the municipality may lead to large changes in percentage terms). Three Metro Vancouver municipalities saw slight decreases in their working poverty rates–Burnaby (down 2 per cent), Maple Ridge (down 2 per cent) and the City of North Vancouver (down 1 per cent).
Unfortunately, data are not available for the Musqueam and Squamish reserve lands.
Source: Statistics Canada, custom tabulation, T1FF tax filer data.
Note: Greater Vancouver A, also known as Electoral Area A, is an unincorporated area that includes UBC, the University Endowment Lands and several sparsely populated areas of Metro Vancouver.
Figure 4: Working poverty by municipality in Metro Vancouver, 2006 and 2012.Percentage of working poor individuals among the working-age population.
0% 2% 4% 6% 8% 10% 12%
Anmore
Pitt Meadows
Port Moody
Delta
Maple Ridge
North Vancouver District
Langley District
Port Coquitlam
Lions Bay
White Rock
Langley
West Vancouver
New Westminster
Coquitlam
Bowen Island
North Vancouver
Surrey
Burnaby
Vancouver
Greater Vancouver A
Richmond
2006
2012
20 WORKING POVERTY IN METRO VANCOUVER
In 2006, working poverty was
concentrated in East Vancouver, South Vancouver, South
Burnaby, and parts of Richmond and Surrey. By 2012, it became more
widespread.
P A R T 6
Working poverty by neighbourhood in Metro Vancouver
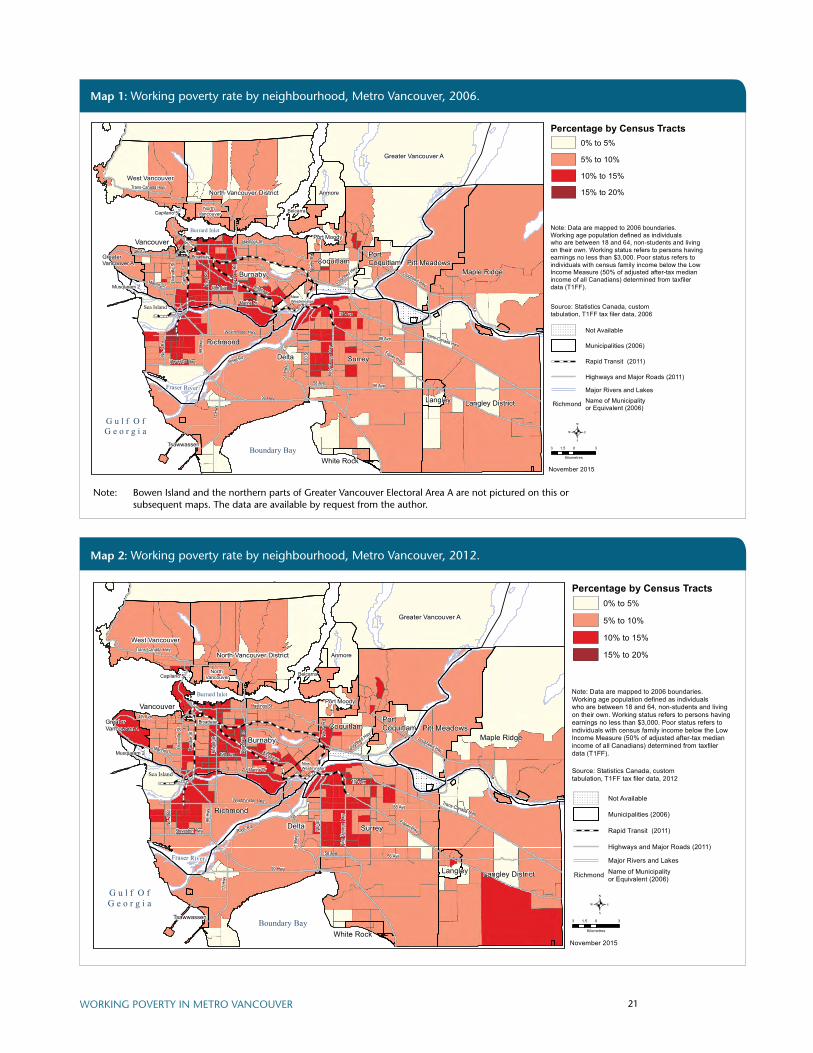
MAPS 1 AND 2 SHOW THE DISTRIBUTION OF WORKING POVERTY in Metro Vancouver by neighbour-hood in 2006 and 2012.
In 2006, working poverty was concentrated in East Vancouver, South Vancouver, South Burnaby, and parts of Richmond and Surrey.
By 2012, working poverty became more widespread. Fewer neighbourhoods had low working poverty rates (less than 5 per cent working poverty), and many more neighbourhoods saw rates rise above 10 per cent. The concentration of neighbourhoods with high rates of working poverty increased most notably in Surrey and downtown Vancouver. In addition, several municipalities that previously had lower working poverty rates, including Langley, Coquitlam and West Vancouver, saw neighbourhoods with working poverty rates in excess of 10 per cent in 2012.
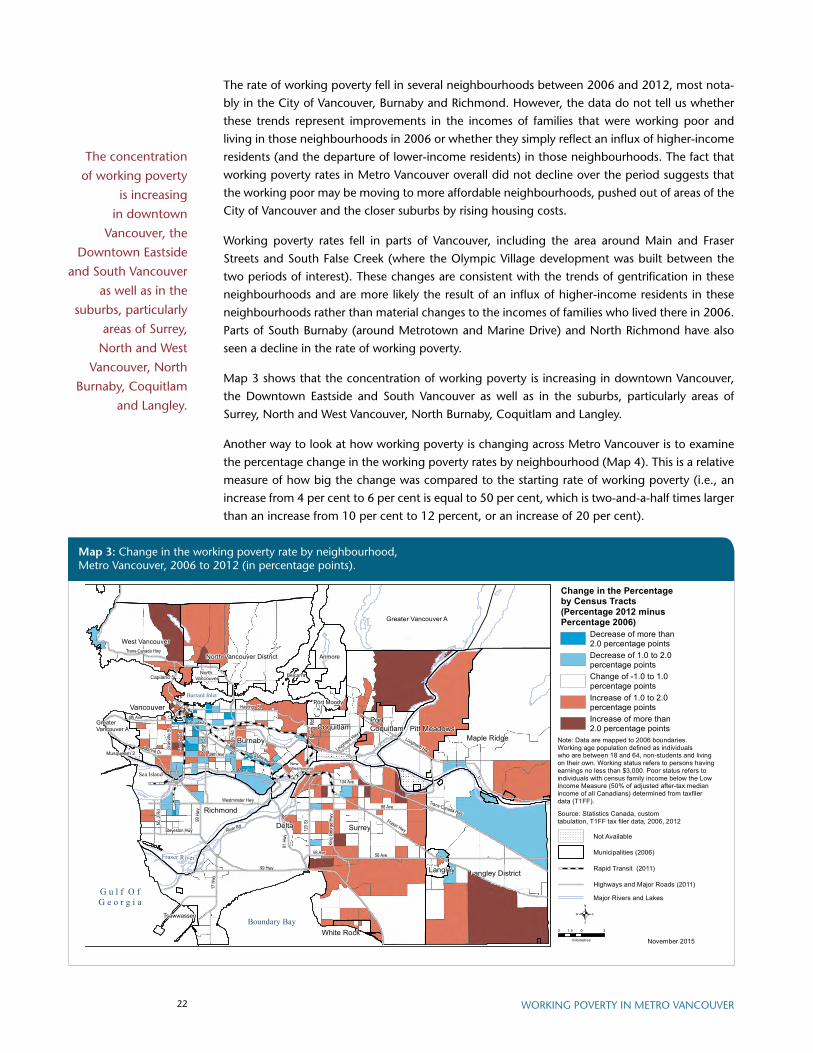
Map 3 shows the difference in working poverty rates across Metro Vancouver between 2006 and 2012 (expressed in percentage points). This is an absolute measure of the change, regardless of the working poverty rate in the neighbourhood (i.e., an increase from 4 per cent to 6 per cent is equal to two percentage points, as is an increase from 10 per cent to 12 per cent). Most neighbourhoods in the city did not experience a big change in the concentration of working poverty over this period (seeing an increase or decrease of less than 1 percentage point in the rate of working poverty).17 However, the neighbourhoods where working poverty levels rose by more than 1 percentage point far outnumbered those where working poverty saw a significant decline (3:1).
17 Of these neighbourhoods, 56 per cent saw a change between –0.5 and +0.5 percentage points, another 14 per cent saw a decrease between 0.5 and 1 percentage points and 29 per cent saw an increase between 0.5 and 1 percentage points.
WORKING POVERTY IN METRO VANCOUVER 21
Note: Bowen Island and the northern parts of Greater Vancouver Electoral Area A are not pictured on this or subsequent maps. The data are available by request from the author.
Map 1: Working poverty rate by neighbourhood, Metro Vancouver, 2006.
.
November 2015
Percentage of working poor individuals among the working-age population after-tax, Vancouver census metropolitan area, 2006
Source: Statistics Canada, custom tabulation, T1FF tax filer data, 2006
Note: Data are mapped to 2006 boundaries. Working age population defined as individuals who are between 18 and 64, non-students and living on their own. Working status refers to persons having earnings no less than $3,000. Poor status refers to individuals with census family income below the Low Income Measure (50% of adjusted after-tax medianincome of all Canadians) determined from taxfiler data (T1FF).
Percentage by Census Tracts0% to 5%
5% to 10%
10% to 15%
15% to 20%
Not Available
Municipalities (2006)
Rapid Transit (2011)
Highways and Major Roads (2011)
Major Rivers and Lakes
Richmond Name of Municipality or Equivalent (2006)
3 0 31.5
Kilometres
Vancouver
BurnabyMusqueam 2
Greater Vancouver A
Richmond
Delta Surrey
Coquitlam
Port Moody
AnmoreNorth Vancouver District
North Vancouver
West Vancouver
Capilano 5
Burrard Inlet
Boundary Bay
G u l f O fG e o r g i a
New Westminster
Belcarra
Fraser River
Trans-Canada Hwy
Hastings St
4th AveBroadway
49th Ave Kingsway
Gran
ville
St
Knigh
t St
Marine Dr
Boun
dary
Rd
Westminster Hwy
Steveston Hwy
99 H
wy
99 Hwy
120 S
t
King
Geo
rge H
wy
58 Ave
88 Ave
104 Ave
River Rd
Lougheed Hwy
Marine Dr
17 H
wy
Fraser Hwy
Camb
ie St
Lougheed Hwy91
Hwy
No. 2
Rd
North
Rd
Sea Island
Port Coquitlam
White Rock
56 Ave
Trans-Canada Hwy
Pitt MeadowsMaple Ridge
Langley DistrictLangley
Greater Vancouver A
Tsawwassen
Map 2: Working poverty rate by neighbourhood, Metro Vancouver, 2012.
.
November 2015
Percentage of working poor individuals among the working-age population after-tax, Vancouver census metropolitan area, 2012
Source: Statistics Canada, custom tabulation, T1FF tax filer data, 2012
Note: Data are mapped to 2006 boundaries. Working age population defined as individuals who are between 18 and 64, non-students and living on their own. Working status refers to persons having earnings no less than $3,000. Poor status refers to individuals with census family income below the Low Income Measure (50% of adjusted after-tax medianincome of all Canadians) determined from taxfiler data (T1FF).
Percentage by Census Tracts0% to 5%
5% to 10%
10% to 15%
15% to 20%
Not Available
Municipalities (2006)
Rapid Transit (2011)
Highways and Major Roads (2011)
Major Rivers and Lakes
Richmond Name of Municipality or Equivalent (2006)
3 0 31.5
Kilometres
Vancouver
BurnabyMusqueam 2
Greater Vancouver A
Richmond
Delta Surrey
Coquitlam
Port Moody
AnmoreNorth Vancouver District
North Vancouver
West Vancouver
Capilano 5
Burrard Inlet
Boundary Bay
G u l f O fG e o r g i a
New Westminster
Belcarra
Fraser River
Trans-Canada Hwy
Hastings St
4th AveBroadway
49th Ave Kingsway
Gran
ville
St
Knigh
t St
Marine Dr
Boun
dary
Rd
Westminster Hwy
Steveston Hwy
99 H
wy
99 Hwy
120 S
t
King
Geo
rge H
wy
58 Ave
88 Ave
104 Ave
River Rd
Lougheed Hwy
Marine Dr
17 H
wy
Fraser Hwy
Camb
ie St
Lougheed Hwy
91 H
wy
No. 2
Rd
North
Rd
Sea Island
Port Coquitlam
White Rock
56 Ave
Trans-Canada Hwy
Pitt MeadowsMaple Ridge
Langley DistrictLangley
Greater Vancouver A
Tsawwassen
22 WORKING POVERTY IN METRO VANCOUVER
The concentration of working poverty
is increasing in downtown
Vancouver, the Downtown Eastside
and South Vancouver as well as in the
suburbs, particularly areas of Surrey,
North and West Vancouver, North
Burnaby, Coquitlam and Langley.
The rate of working poverty fell in several neighbourhoods between 2006 and 2012, most nota-bly in the City of Vancouver, Burnaby and Richmond. However, the data do not tell us whether these trends represent improvements in the incomes of families that were working poor and living in those neighbourhoods in 2006 or whether they simply reflect an influx of higher-income residents (and the departure of lower-income residents) in those neighbourhoods. The fact that working poverty rates in Metro Vancouver overall did not decline over the period suggests that the working poor may be moving to more affordable neighbourhoods, pushed out of areas of the City of Vancouver and the closer suburbs by rising housing costs.
Working poverty rates fell in parts of Vancouver, including the area around Main and Fraser Streets and South False Creek (where the Olympic Village development was built between the two periods of interest). These changes are consistent with the trends of gentrification in these neighbourhoods and are more likely the result of an influx of higher-income residents in these neighbourhoods rather than material changes to the incomes of families who lived there in 2006. Parts of South Burnaby (around Metrotown and Marine Drive) and North Richmond have also seen a decline in the rate of working poverty.
Map 3 shows that the concentration of working poverty is increasing in downtown Vancouver, the Downtown Eastside and South Vancouver as well as in the suburbs, particularly areas of Surrey, North and West Vancouver, North Burnaby, Coquitlam and Langley.
Another way to look at how working poverty is changing across Metro Vancouver is to examine the percentage change in the working poverty rates by neighbourhood (Map 4). This is a relative measure of how big the change was compared to the starting rate of working poverty (i.e., an increase from 4 per cent to 6 per cent is equal to 50 per cent, which is two-and-a-half times larger than an increase from 10 per cent to 12 percent, or an increase of 20 per cent).
.November 2015
Change in the percentage of working poor individuals among the working-age population after-tax, Vancouver census metropolitan area, 2006–2012
Source: Statistics Canada, custom tabulation, T1FF tax filer data, 2006, 2012
Note: Data are mapped to 2006 boundaries. Working age population defined as individuals who are between 18 and 64, non-students and living on their own. Working status refers to persons having earnings no less than $3,000. Poor status refers to individuals with census family income below the Low Income Measure (50% of adjusted after-tax medianincome of all Canadians) determined from taxfiler data (T1FF).
3 0 31.5
Kilometres
Vancouver
BurnabyMusqueam 2
Greater Vancouver A
Richmond
Delta Surrey
Coquitlam
Port Moody
AnmoreNorth Vancouver District
North Vancouver
West Vancouver
Capilano 5
Burrard Inlet
Boundary Bay
G u l f O fG e o r g i a
New Westminster
Belcarra
Fraser River
Trans-Canada Hwy
Hastings St
4th AveBroadway
49th Ave Kingsway
Gran
ville
St
Knigh
t St
Marine Dr
Boun
dary
Rd
Westminster Hwy
Steveston Hwy
99 H
wy
99 Hwy
120 S
t
King
Geo
rge H
wy
58 Ave
88 Ave
104 Ave
River Rd
Lougheed Hwy
Marine Dr
17 H
wy
Fraser Hwy
Camb
ie St
Lougheed Hwy
91 H
wy
No. 2
Rd
North
Rd
Sea Island
Port Coquitlam
White Rock
56 Ave
Trans-Canada Hwy
Pitt MeadowsMaple Ridge
Langley DistrictLangley
Greater Vancouver A
Tsawwassen
Change in the Percentage by Census Tracts(Percentage 2012 minus Percentage 2006)
Not Available
Municipalities (2006)
Rapid Transit (2011)
Highways and Major Roads (2011)
Major Rivers and Lakes
Increase of more than 2.0 percentage points
Increase of 1.0 to 2.0 percentage points
Change of -1.0 to 1.0percentage points
Decrease of 1.0 to 2.0percentage points
Decrease of more than 2.0 percentage points
Map 3: Change in the working poverty rate by neighbourhood, Metro Vancouver, 2006 to 2012 (in percentage points).

WORKING POVERTY IN METRO VANCOUVER 23
Map 4 reveals very large increases in working poverty (more than 30 per cent) in suburban neighbourhoods in Maple Ridge, Langley, Surrey, Coquitlam, Port Moody and Pitt Meadows. Even West Vancouver and White Rock, municipalities generally seen as wealthy, have pockets where working poverty rates grew fast (more than 30 per cent over the six-year period).
Working poverty also grew noticeably in downtown Vancouver, the Downtown Eastside and the University of British Columbia Endowment Lands (even though students are excluded from the definition of working poverty).18 Just over half of Metro Vancouver neighbourhoods saw no significant change (+/- 10 per cent). Of those, half saw an increase and half saw a decrease in working poverty.
18 This is a puzzling result that needs further exploration. A similarly high increase in working poverty is seen in the wealthy area around the University of Toronto in downtown Toronto.
.November 2015
Percentage change in working poor individuals after-tax, Vancouver census metropolitan area, 2006–2012
Source: Statistics Canada, custom tabulation, T1FF tax filer data, 2006, 2012
Note: Data are mapped to 2006 boundaries. Working age population defined as individuals who are between 18 and 64, non-students and living on their own. Working status refers to persons having earnings no less than $3,000. Poor status refers to individuals with census family income below the Low Income Measure (50% of adjusted after-tax medianincome of all Canadians) determined from taxfiler data (T1FF).
3 0 31.5
Kilometres
Vancouver
BurnabyMusqueam 2
Greater Vancouver A
Richmond
Delta Surrey
Coquitlam
Port Moody
AnmoreNorth Vancouver District
North Vancouver
West Vancouver
Capilano 5
Burrard Inlet
Boundary Bay
G u l f O fG e o r g i a
New Westminster
Belcarra
Fraser River
Trans-Canada Hwy
Hastings St
4th AveBroadway
49th Ave Kingsway
Gran
ville
St
Knigh
t St
Marine Dr
Boun
dary
Rd
Westminster Hwy
Steveston Hwy
99 H
wy
99 Hwy
120 S
t
King
Geo
rge H
wy
58 Ave
88 Ave
104 Ave
River Rd
Lougheed Hwy
Marine Dr
17 H
wy
Fraser Hwy
Camb
ie St
Lougheed Hwy91
Hwy
No. 2
Rd
North
Rd
Sea Island
Port Coquitlam
White Rock
56 Ave
Trans-Canada Hwy
Pitt MeadowsMaple Ridge
Langley DistrictLangley
Greater Vancouver A
Tsawwassen
Percentage Changeby Census Tracts(WP 2012 - WP 2006 / WP 2006)
Not Available
Municipalities (2006)
Rapid Transit (2011)
Highways and Major Roads (2011)
Major Rivers and Lakes
Decrease of more than 10 percent
Change of -10 to 10 percent
Increase of 10 to 20 percent
Increase of 20 to 30 percent
Increase of over 30 percent
Map 4: Percentage change in the working poverty rate by neighbourhood, Metro Vancouver, 2006 to 2012.
24 WORKING POVERTY IN METRO VANCOUVER
P A R T 7
Economic and public policy changes contributing to working poverty
UNFORTUNATELY, OUR DATA (DERIVED FROM TAX FILES) do not provide information on the hour-ly wage earned and the hours worked, as only the total employment earnings are reported. Therefore, we do not know whether the working poor in Metro Vancouver were poor because they earned low wages, because they weren’t able to secure sufficient hours or some combination of the two. However, it’s worth considering how trends in low-wage work and in the general labour market may have affected the working poor in Metro Vancouver.
Inadequate minimum wage
The minimum wage in BC was a lot higher in 2012 than in 2006. After a decade-long freeze at $8 an hour, where it was in 2006, the minimum wage had risen to $9.50 at the start of 2012 and further increased to $10.25 as of May 1, 2012 — an increase of 18 per cent in real purchasing power (after accounting for inflation). This increase likely moderated the growth of working poverty in BC over the period, but it was not sufficient to reverse the trend.
Despite a series of increases since 2012, at the current rate of $10.45 (in effect as of September 15, 2015) a minimum-wage worker with no dependents working full-time earns less than the poverty line both before and after tax. At the time of writing, BC’s minimum wage is the lowest in Canada. Although recently announced increases would put BC’s minimum wage in the middle of the pack by the end of 2016, minimum-wage workers in BC will continue to earn less than
Low minimum wages likely
contribute to increases in working
poverty in Metro Vancouver.
WORKING POVERTY IN METRO VANCOUVER 25
In 2012, more than one-third of unemployed workers had been without work for more than three months, compared to less than one-quarter in 2006.
the poverty line even if they work full-year, full-time.19 Low minimum wages likely contribute to increases in working poverty in Metro Vancouver.
Increased precarity in the labour market
BC’s economy looked very different in 2006 and 2012. While 2006 was a year of economic boom, 2012 was a year of slow recovery after the Great Recession of 2008 — 2009. The labour market recovery has been particularly sluggish, and as a result BC’s labour market was much weaker in 2012 than in 2006. The working-age unemployment rate, for example, rose from 4.8 per cent in 2006 to 6.9 per cent in 2012.20 The average duration of unemployment in BC was a full month longer in 2012 than in 2006 (19.4 weeks compared to 14.7 weeks).21 It was even longer in 2015 at 20.3 weeks.22 In 2012, more than one-third of unemployed workers had been without work for more than three months (35 per cent), compared to less than one-quarter in 2006 (23 per cent).23
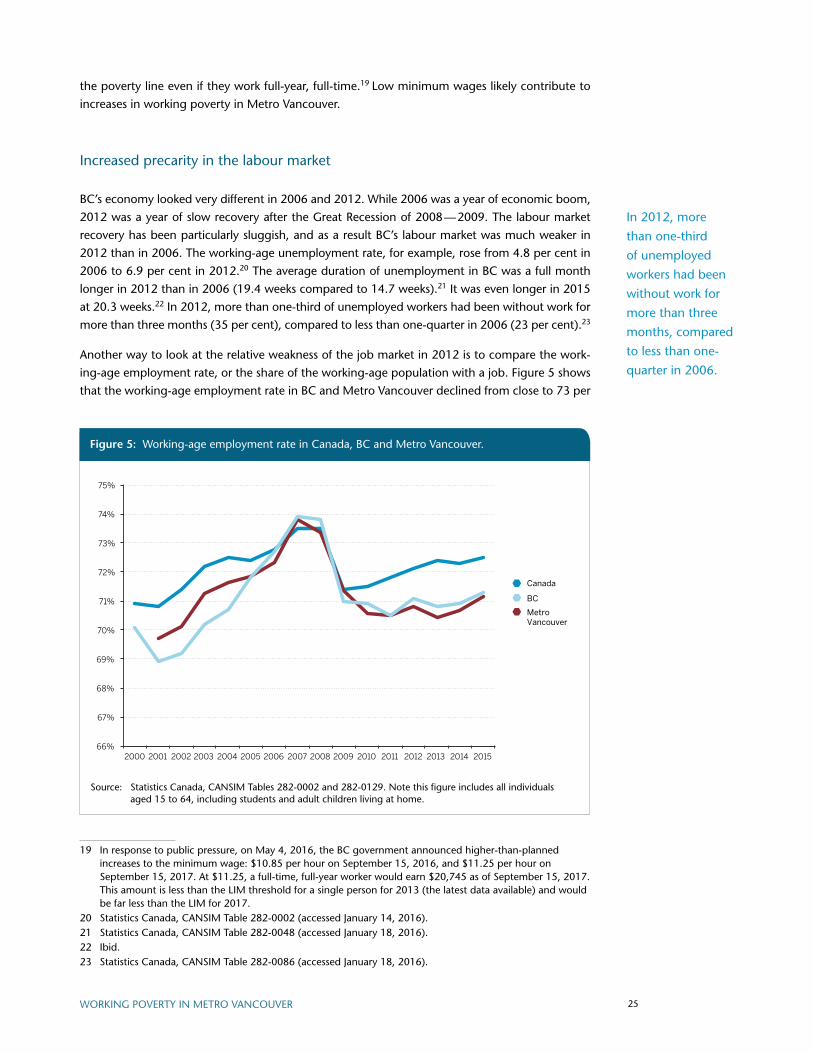
Another way to look at the relative weakness of the job market in 2012 is to compare the work-ing-age employment rate, or the share of the working-age population with a job. Figure 5 shows that the working-age employment rate in BC and Metro Vancouver declined from close to 73 per
19 In response to public pressure, on May 4, 2016, the BC government announced higher-than-planned increases to the minimum wage: $10.85 per hour on September 15, 2016, and $11.25 per hour on September 15, 2017. At $11.25, a full-time, full-year worker would earn $20,745 as of September 15, 2017. This amount is less than the LIM threshold for a single person for 2013 (the latest data available) and would be far less than the LIM for 2017.
20 Statistics Canada, CANSIM Table 282-0002 (accessed January 14, 2016).21 Statistics Canada, CANSIM Table 282-0048 (accessed January 18, 2016).22 Ibid.23 Statistics Canada, CANSIM Table 282-0086 (accessed January 18, 2016).
Source: Statistics Canada, CANSIM Tables 282-0002 and 282-0129. Note this figure includes all individuals aged 15 to 64, including students and adult children living at home.
Figure 5: Working-age employment rate in Canada, BC and Metro Vancouver.
66%
67%
68%
69%
70%
71%
72%
73%
74%
75%
2000 2001 2002 2003 2004 2005 2006 2007 2008 2009 2010 2011 2012 2013 2014 2015
Canada
Metro Vancouver
BC

26 WORKING POVERTY IN METRO VANCOUVER
cent in 2006 (on par with the Canadian average) to about 71 per cent in 2012 (considerably less than in the rest of Canada).
The fact that working poverty in BC and Metro Vancouver is rising at the same time as overall employment rates are declining is significant. An increase in working poverty may mean that workers’ incomes are falling or that more poor people — previously unemployed — are joining the workforce and earning some income (but not enough to lift them out of poverty). However, seeing an increase in working poverty during times of higher unemployment (as we do between 2006 and 2012) suggests that not just the quantity but the quality of jobs available may be deteriorating.
A number of indicators point to poorer job quality and more precarious jobs in BC in 2012:
• the share of part-time workers that wanted a full-time job (involuntary part-time) in-creased from 22 per cent to 27.4 per cent;24
• the share of temporary jobs increased from 11.8 per cent to 13.6 per cent, with more term or contract and casual jobs being created;25
• the share of jobs that pay by the hour rose from 55 per cent to 59 per cent26 (these jobs pay less on average and are less likely to provide benefits than salaried positions).
Unfortunately, we simply do not have data on many other important characteristics of the jobs available, including how many provide non-wage benefits (such as dental coverage, extended health or drug coverage), how many provide paid sick leave (employers are not required to give paid sick leave in BC), how many have irregular work schedules and earnings, or whether companies are promoting their employees from within the organization or whether entry-level jobs are in fact dead-end jobs.
Qualitative research conducted by McMaster University and United Way Toronto finds that workplace disadvantages tend to compound each other. That is to say, workers in temporary or limited-term contracts were found to also earn lower wages and receive fewer (if any) non-wage benefits, and to report fewer hours of work, and more frequent periods of unemployment, than those in permanent, full-time positions.27 There is no reason to believe the labour market in BC is any more generous, but more research is needed to document the extent of vulnerability and insecurity in the job market in BC.
Weaker redistributive role of taxes and transfers
We use after-tax income to define working poverty in this analysis, so it is important to consider the role that government supports (over and above earnings) have played in reducing poverty. A number of new government transfers were available in 2012 that did not exist in 2006, which increased the after-tax incomes of those at the lower end of the income ladder. These included the federal Working Income Tax Benefit (introduced in 2007 with the specific aim to supplement the earnings of the working poor), the BC Low Income Climate Action Tax Credit (introduced in 2008 with the carbon tax) and the BC HST tax credit (introduced in 2010 with the Harmonized
24 Statistics Canada, CANSIM Table 282-0014 (accessed January 18, 2016).25 Statistics Canada, CANSIM Table 282-0080 (accessed January 18, 2016).26 Statistics Canada, CANSIM Table 282-0024 (accessed February 1, 2016).27 Wayne Lewchuk et al., It’s More than Poverty: Employment Precarity and Household Well-Being (Toronto:
Poverty and Employment Precarity in Southern Ontario, 2013).
The fact that working poverty in BC and Metro
Vancouver is rising at the same time as overall employment
rates are declining is significant.
WORKING POVERTY IN METRO VANCOUVER 27
Reforms to employment insurance (EI) requiring more insurable hours of work made it harder for some workers to qualify for benefits.
Sales Tax [HST], which has since been repealed but was still in effect in 2012). Families with young children benefitted from the introduction of the federal Universal Child Care Benefit as of July 2006 (although the monthly amount was frozen over the period, families in 2012 received a full year of payments compared to only six months in 2006). All of these government transfers have mitigated the increases in the number of working poor and likely reduced the severity of that poverty.
Other government transfers, however, became less generous over the period. For example, reforms to employment insurance (EI) requiring more insurable hours of work made it harder for some workers to qualify for benefits (especially those who only worked part-time). In BC, only 35 per cent of the unemployed (aged 15 to 64) received EI in 2012, compared to 42 per cent in 2006.28 In Metro Vancouver, the likelihood of receiving EI was even lower: 26 per cent of the unemployed in 2012 received EI compared to 32 per cent in 2006.
In addition, our data show that 15 per cent of working-age Metro Vancouver residents who reported receiving EI in 2012 lived in poverty. This suggests that EI does not provide adequate replacement income for many workers even when they qualify for benefits. This is hardly surpris-ing: EI benefits pay 55 per cent of average weekly earnings, up to a maximum, and 55 per cent of a low wage amounts to below-poverty income. For example, a full-time minimum-wage worker earning $9.75 who got laid off would have received weekly benefits of $188 (55% × $9.75/hour × 35 hours), if he or she qualified for EI. That income is barely above the social assistance rate for a single person ($610/month, or $140.80/week).
The EI program is designed to automatically respond to economic downturns, as eligibility requirements and the duration of benefits depend on local unemployment rates (based on a three-month moving average). However, the fact that a significant share of people receiving EI exhaust their benefits before they are able to find work indicates that the duration of EI benefits is too short.
Thirty-three percent of unemployed Canadian workers receiving EI ran out of benefits in 2012/13, which is significantly higher than the number pre-recession (28 per cent in 2006/07).29
Employment and Social Development Canada (ESDC) reports reveal that unemployed workers in BC are significantly more likely to exhaust their benefits than the Canadian average, with 37 per cent running out of benefits in 2012/13.30 These statistics shows that the EI system did not ad-equately respond to the weakness in the labour market post-recession and may have contributed to the higher rate of working poverty in Metro Vancouver in 2012.
Overall, taxes and transfers can play an important role in reducing poverty and income inequality in Canada but the increase in working poverty between 2006 and 2012 (which is measured after tax) demonstrates that they have not been sufficient to counterbalance changes in the labour market that have resulted in more precarious employment conditions.
28 Author’s calculations based on data from Statistics Canada, CANSIM Tables 276-0033 and 282-0129 (accessed February 2, 2016).
29 The share of EI recipients that exhausted their benefits rose to 35 per cent in 2014/15, the last year for which data are available. See Canada Employment Insurance Commission, 2014/15 EI Monitoring and Assessment Report (Ottawa: Employment and Social Development Canada, 2016), http://www.esdc.gc.ca/en/reports/ei/monitoring2015/index.page. Data for 2006/07 are from EI Monitoring and Assessment Report 2008 (Ottawa: Human Resources and Social Development Canada [HRSDC, now ESDC], 2009), http://publications.gc.ca/collections/collection_2015/edsc-esdc/EM13-1-2008-eng.pdf.
30 The earliest year for which EI benefit exhaustion data is available by province in the annual EI Monitoring and Assessment reports is 2008/09 (EI Monitoring and Assessment Report 2012/13 [Ottawa: ESDC, 2013].) The numbers show that BC has consistently had one of the highest rates of benefit exhaustion in Canada. In 2014/15, the rate was 37 per cent.
28 WORKING POVERTY IN METRO VANCOUVER
Weakened public services and supports
In addition to direct income transfers, the BC government provides certain income-tested sub-sidies and assistance programs to reduce out-of-pocket costs for essentials such as housing and child care for low-income families. These programs do not increase family income (the family would still be counted as poor) but they can greatly improve the family’s quality of life.
The BC government’s Rental Assistance Program is a good example. The program, introduced in October 2006, provides a monthly payment to working families with children who qualify based on their income and the amount of rent they pay in the private market. The maximum subsidy level for a family of four or more in Metro Vancouver in 2012 was $765 per month (far short of actual housing costs in the area) and was payable to families with gross income less than $10,000 — a threshold that has remained frozen since 2006.31 Families are eligible for a partial subsidy if their gross household income is less than $35,000, regardless of family size. According to reports by BC Housing, across BC 19,662 low-income families with children received at least a partial subsidy in 2012/13. However, our statistics suggest that the number of working poor families with children was much higher. In 2012, 72,200 British Columbians with children were working yet lived in poverty (22,300 single parents and 49,900 in two-parent families).
The other major subsidy program for working poor families with children is the BC child care sub-sidy. The maximum subsidy level and the income thresholds required to qualify vary with the age of the child, the number of children in the family and the type of child care used. The maximum subsidy amounts have remained frozen since 2005,32 despite steep increases in child care fees. The income thresholds below which parents qualify for subsidies have not increased since 2005 either. That is to say, families in 2012 received the same subsidy amounts as were available in 2006, while median group child care fees in Vancouver increased by 24 per cent for toddlers and 28 per cent for preschoolers.33 The subsidy freeze has meant that low-income families are left with larger and larger out-of-pocket bills every year, over and above the maximum subsidy amount. The high cost of child care is a barrier to work for many parents, particularly single mothers who must rely on a single earner to cover both child care fees and family expenses.
Although these subsidies have the potential to significantly increase the quality of life of working poor families, the qualifying incomes are extremely low and leave out many families who are struggling to make ends meet. In addition, keeping income thresholds and maximum benefit amounts frozen for long periods of time eroded the real value of these subsidies between 2006 and 2012.
Insufficient public services and supports, such as social housing, child care and accessible post-sec-ondary education, compound the problem.
31 The maximum rental assistance payment was frozen between 2006 and 2012 but increased as of April 1, 2014, to $846/month, which is still vastly below actual rent costs for a family of four or more in Metro Vancouver.
32 With the exception of subsidies for school-aged children, which increased in 2007 and 2012.33 Westcoast Child Care Resource Centre, “Child Care Fee Surveys” (2006 and 2012), http://www.wstcoast.
org/parents/fees.html. The child care fees were (and still are) much higher in Vancouver than in the rest of the province, but between 2006 and 2012 the fee increases were higher for BC than for Vancouver (33 per cent for toddlers and 38 per cent for preschoolers, according to the Childcare Resource and Research Unit reports for 2006 (7th edition) and 2012 (9th edition). See Martha Friendly, Jane Beach, Carolyn Ferns, Michelle Turiano, Early Childhood Education and Care in Canada 2006 (Toronto: Childcare Resource and Research Unit, 2007) and Martha Friendly, Shani Halfon, Jane Beach, Barry Forer, Early Childhood Education and Care in Canada 2012 (Toronto: Childcare Resource and Research Unit, 2013), http://www.childcarecanada.org/publications/ecec-in-canada.
Although housing and child care subsidies have
the potential to significantly
increase the quality of life of working poor families, the
qualifying incomes are extremely
low and leave out many families who
are struggling to make ends meet.

WORKING POVERTY IN METRO VANCOUVER 29
For example, the Rental Assistance Program does not reach most working poor adults in Metro Vancouver, or BC for that matter, who live alone or in families without children (61,600 in Metro Vancouver and another 45,000 elsewhere in BC in 2012). The only assistance available for them is subsidized social housing. However, the supply of independent social housing in BC — housing that is available to both working and non-working poor British Columbians — has increased by only 316 units between 2006 and 2012 (for non-senior families),34 compared to an increase of 33,500 poor working-age adults in the province (15,500 working poor and 18,000 non-working poor).
34 Data from BC Housing annual reports for 2006/07 and 2012/13. These data exclude housing for seniors, assisted living, homeless shelters, and housing for women and children fleeing domestic violence — types of housing that are not generally available to low-income working families. See Housing Matters: BC Housing Annual Report (Burnaby: BC Housing, 2007 and 2013), http://www.bchousing.org/aboutus/Reports/AR.
30 WORKING POVERTY IN METRO VANCOUVER
Every level of government has
a role to play, but the provincial
government is uniquely positioned
to take the lead as it has jurisdiction
over the labour market and many
social policy areas.
P A R T 8
Policy recommendations
WORKING POVERTY CAN BE ELIMINATED with a combination of labour market reforms to increase earnings and improve working conditions for vulnerable workers, more generous income sup-ports for low-income British Columbians and better public services that improve quality of life for all families, especially those living in poverty.
Recognizing the extent of the problem is the first step to any solution. The lack of Canada-wide data and analysis of working poverty has been a significant barrier to government action. The last federal government report on the topic was a Human Resources and Social Development Canada (HRSDC) working paper using data from the 2001 census.35 Now that the federal government has restored the long-form census for 2016, Statistics Canada should be tasked with analyzing the census data on working poverty across Canada and reporting on it publicly so that governments at all levels can make informed decisions about their labour market policies.
Provincial recommendations
Every level of government has a role to play, but the provincial government is uniquely positioned to take the lead as it has jurisdiction over the labour market and many social policy areas. There are five main areas in which the provincial government can take action, based on the analysis of working poverty trends presented in this report and earlier research by the Canadian Centre for Policy Alternatives through the Economic Security Project.36
35 Fleury and Fortin, When Working is Not Enough to Escape Poverty.36 The Economic Security Project was a research alliance led by the Canadian Centre for Policy Alternatives–BC
and Simon Fraser University that ran from 2004 to 2009. The project was funded primarily by a grant from the Social Science and Humanities Research Council of Canada through its Community University Research Alliance program.

WORKING POVERTY IN METRO VANCOUVER 31
Recent research suggests that higher minimum wages create incentives for employers to offer better, more stable jobs by making business models that rely on low wages and high turnover rates more expensive.
INCREASE THE MINIMUM WAGE TO $15 and index it to inflation, so that a full-time, full-year, min-imum-wage worker can escape poverty. Recent research suggests that higher minimum wages create incentives for employers to offer better, more stable jobs by making business models that rely on low wages and high turnover rates more expensive.37
STRENGTHEN EMPLOYMENT STANDARDS — the rules that govern hours of work, rights to paid and unpaid time off, scheduling practices — and proactively enforce them. A recent wave of in-spections on precarious workplaces (targeting sectors such as security services, gyms and cleaning services) by the Ministry of Labour in Ontario found that 78 per cent of employers were violating provincial employment standards.38 No similar inspections have been conducted in BC over the last decade, after routine inspections were eliminated in 2002. Replacing inspections with a “self-help kit” (which requires workers to approach their employer directly with any complaints) has resulted in a staggering drop in complaints, by 61 per cent in the three years after the change was made.39 BC also needs a strategy to educate workers about their workplace rights, including the right to collectively bargain through a union and to have workplaces free of sexual harass-ment and other forms of discrimination. Many of these provisions are essentially inaccessible to low-wage workers, as imbalances of power in the workplace make it impossible for them to exercise their rights. Reforms to BC’s employment standards to improve working conditions for low-wage and other vulnerable workers are particularly important given the growth of precarious, contract-based work, as many of the rules are written assuming a standard full-time, permanent employment relationship.
INVEST IN NEW SOCIAL HOUSING units for low-income British Columbians. Minimally, this means matching all of the new federal funding with provincial funds. In previous years, some of the money set aside under the federal government’s Investment in Affordable Housing initiative remained unspent as the provinces did not come up with matching investments. As it stands now, the BC government’s five-year plan for affordable housing investment announced in the February 2016 budget falls short of matching the new federal funds available over the next two years. In addition, the BC government should support housing co-operatives and other affordable alternatives to market housing. Rental subsidies should be reviewed regularly to ensure they keep up with the actual costs of market housing, and the program should be extended to British Columbians who are working poor but do not have children.
IMPLEMENT THE WIDELY ENDORSED $10 A DAY CHILD CARE PLAN to make quality child care accessible to all BC families who need it. Doing so would remove a huge financial burden from many lower-income families (who are left with high out-of-pocket costs even with the maximum child care subsidy) and would allow more parents (primarily mothers) the opportunity to return to work, boosting the provincial economy.40 A federal-provincial partnership makes sense in this area.
ADEQUATELY FUND TRAINING AND EDUCATION, and restore funding for tuition-free adult basic education so that the working poor can access more stable and better-paying jobs.
37 See David A. Green, The Case for Increasing the Minimum Wage: What Does the Academic Literature Tell Us? (Vancouver: Canadian Centre for Policy Alternatives, 2015).
38 Sara Mojtehedzadeh, “Inspection blitz finds three-quarters of bosses breaking law,” Toronto Star, January 20, 2016, http://www.thestar.com/news/gta/2016/01/20/inspection-blitz-finds-three-quarters-of-bosses-breaking-law.html.
39 David Fairey, Eroding Worker Protections: British Columbia’s New “Flexible” Employment Standards (Vancouver: Canadian Centre for Policy Alternatives, 2005).
40 Iglika Ivanova, Solving BC’s Affordability Crisis in Child Care: Financing the $10 a Day Plan (Vancouver: Canadian Centre for Policy Alternatives, 2015).

32 WORKING POVERTY IN METRO VANCOUVER
Federal recommendations
The federal government also has an important role to play in reducing working poverty. Reforms to EI are necessary to make the program accessible, and ensure it is available to a majority of workers transitioning between jobs.41 Eligibility criteria must change to reflect the realities of a job market providing more temporary and casual jobs. The benefit rate must be reviewed, as the current rate set at 55 per cent of earnings over the last six months does not provide adequate in-come replacement for low-wage workers who lose their jobs. The duration of the benefits should also be reviewed, considering how many unemployed workers run out of benefits before they are able to find a new job.
A national housing strategy led by the federal government would also make a big impact on working poverty. The 2016 federal budget provides significant new funding for social housing af-ter years of federal inaction on that front. However, the funding budgeted for affordable housing over the next two years falls short of what was promised in the government’s election platform (the rest of the funding is projected to flow after 2018, and is concentrated in the last few years of its 10-year infrastructure plan). Increasing funding for affordable housing across Canada should be a priority.
Another tool the federal government could use to reduce working poverty is the Working Income Tax Benefit, which essentially provides a (small) top-up to the wages of the working poor. However, overly generous wage subsidies would be an incentive for employers to increase their reliance on low-wage practices, especially in provinces where minimum wages are low. It’s important to acknowledge the reality of low-paid and precarious work and boost family incomes through tax benefits and credits, but not at the expense of labour market reforms that ensure all jobs provide a minimum level of economic security. Pursuing both approaches at the same time is particularly important considering the evidence that higher minimum wages reduce the incentives for firms to offer low-wage, high-turnover jobs and increase the incentives to invest in better employee training, which leads to job stability.42
Municipal recommendations
Municipal governments can play an important role as employers, by paying the living wage and ensuring that none of their direct or contract employees enter the ranks of the working poor. (In fact, all levels of government should be model employers paying a living wage.) Municipal governments are also responsible for recreation programs and services. In this capacity, they must ensure that all residents in their municipality have access to well-maintained playgrounds, parks, community centres and other recreation facilities, and that the fees for entry are not a barrier for low-income residents.
41 In 2015, about 60 per cent of unemployed workers in Canada and 65 per cent of those in BC were ineligible for EI. The numbers were about the same in 2012, but, back in 2006, a larger share of unemployed people qualified for EI (53 per cent in Canada and 58 per cent in BC were ineligible). Based on data from Statistics Canada, CANSIM Tables 276-0020 and 282-0002.
42 Pierre Brochu and David A. Green, “The Impact of Minimum Wages on Labour Market Transitions,” The Economic Journal, vol. 123, issue 573 (2013): 1203–35, doi: 10.1111/ecoj.12032.
It’s important to acknowledge the
reality of low-paid and precarious work
and boost family incomes through tax benefits and credits, but not at the expense
of labour market reforms that ensure
all jobs provide a minimum level of
economic security.

WORKING POVERTY IN METRO VANCOUVER 33
Working together to end working poverty
Municipalities are increasingly taking a role in poverty reduction, filling in the leadership vacuum left by the inaction of higher levels of government, but they have many fewer resources (and less ability to raise revenues) than the federal and provincial governments do. Municipalities, espe-cially those with high concentrations of working poverty, must therefore work with these higher levels of government to ensure that affordable housing and transit — programs that municipal governments cannot provide on their own — are put in place. Convenient and affordable transit is particularly important in Metro Vancouver, where high housing costs are pushing families to commute longer distances for work.
It is encouraging to see that the federal government is prepared to invest more in social housing and public transit. However, much of the funding offered in the 2016 federal budget requires provinces to match federal investment dollars for the funding to flow. In the past, that requirement has meant that not all federal funds promised have been spent. As it stands, the BC government’s promised investment in affordable housing over the next two years is less than what’s available federally. The provincial government must step up its own investment in affordable housing to leverage all of the federal funds available.
In the end, working poverty is only a part of the complex story of poverty in BC. To improve the lives of all poor British Columbians, we need a comprehensive poverty reduction plan with targets and timelines. That plan must include the recommendations above to eliminate working poverty. It must also include measures to specifically address the particular needs of British Columbians who are temporarily or permanently unable to support themselves through employment, includ-ing children, the elderly and those dealing with illness or disability.
Reducing poverty will help not just those who are poor. Better public services and income sup-ports will enhance the quality of life for all British Columbians and build more cohesive, vibrant and healthy communities, communities we can all be proud to live in.
To improve the lives of all poor British Columbians, we need a comprehensive poverty reduction plan with targets and timelines.

34 WORKING POVERTY IN METRO VANCOUVER
A P P E N D I X : T H E D A T A
The data on working poverty used in this report are derived from Statistics Canada’s T1 Family File, based on annual income tax files.
The large sample size and wide coverage (95 per cent of the Canadian population) allow very small geographies or neighbourhoods to be analyzed. The biggest limitation of this data is that they lack socioeconomic characteristics aside from very basic demographic variables (age and family status). They also lack information about the number of hours worked per week, weeks worked per year, industries or sectors of employment and other employment characteristics.
Unfortunately, with the federal government’s decision to cancel the long-form census in 2011 and replace it with a voluntary survey, this is the only dataset that can be used for neighbourhood-level analysis until data from the 2016 census become available (income data would not be released until at least 2018).
The tables below provide some additional data that may be of interest to readers. Table A1 shows that while the threshold to be considered “working” in this report is only $3,000, most working poor earned considerably more than that.
Table A1: Median incomes by category, working-age population (non-students, living independently) in Metro Vancouver, 2012.
AllWorking
poor
Non-working
poor
Non-working non-poor
Working non-poor
Before-tax personal income $33,800 $15,040 $3,290 $6,980 $49,090
Before-tax census family income $65,610 $18,550 $11,240 $68,270 $87,890
After-tax personal income $30,990 $14,840 $3,200 $6,730 $43,360
After-tax census family income $58,730 $18,060 $11,140 $61,410 $76,730
Source: Statistics Canada, custom tabulation, T1FF tax filer data.

WORKING POVERTY IN METRO VANCOUVER 35
Table A2 lists the income thresholds used to define poverty in the report for different family sizes.
Table A2: 2012 Low income measures after tax, by family size
Number of adults*
Number of children younger than 16
0 1 2 ..... 10
1 $16,968 $23,755 $28,846 ..... $69,569
2 $23,755 $28,846 $33,936 ..... $74,659
3 $30,542 $35,633 $40,723 ..... $81,446
4 $37,330 $42,420 $47,510 ..... $88,234
*Includes parents/spouses, children 16 years of age and over, and the first child in single-parent families regardless of age.
Source: Statistics Canada, Annual Income Estimates for Census Families and Individuals (T1 Family File), Family Data User’s Guide. July 2014.

The Canadian Centre for Policy Alternatives is an independent, non-partisan research institute concerned with issues of social, economic and environmental justice. Founded in 1980, it is one of Canada’s leading progressive voices in public policy debates.
CCPA-BC Office
1400 – 207 West Hastings StreetVancouver, BC V6B [email protected]
www.policyalternatives.ca
United Way of the Lower Mainland is dedicated to creating healthy, caring and inclusive communities by helping families move from poverty to possibility, kids be all that they can be and building stronger communities for all. We are leaders in our field developing partnerships, tracking progress, and bringing the right people together to initiate change. UWLM serves 26 communities.
www.uwlm.ca
The BC Poverty Reduction Coalition is a broad-based network that includes community and non-profit groups, faith groups, health organizations, First Nations and Aboriginal organizations, businesses, labour unions, and social policy groups. We have come together around a campaign aimed at seeing the introduction of a bold and comprehensive poverty reduction plan from the government of British Columbia that would include legislated targets and timelines to significantly reduce poverty and homelessness. We seek to improve the health and well-being of all British Columbians. We have over 50 Coalition Members and almost 400 supporting organizations that have joined the call for a poverty reduction plan.
www.bcpovertyreduction.ca