Embed Size (px)
Citation preview

2017 Annual Report Stretching our wings

Table of Contents
President’s message to shareholders 2
Management’s discussion and analysis of financial results 5
Management’s report to the shareholders 64
Independent auditors’ report 65
Consolidated financial statements 66
Notes to consolidated financial statements 71
Corporate information Inside back cover

WestJet Annual Report 2017 | 1
Financial Overview (i)
($ in thousands, except per share data) 2017 2016 2015 2014 2013
Consolidated financialinformation
Revenue 4,502,320$ 4,122,859$ 4,029,265$ 3,976,552$ 3,662,197$
Earnings beforeincome taxes 404,135$ 416,233$ 520,258$ 390,307$ 372,085$
Net earnings 283,578$ 295,458$ 367,530$ 283,957$ 268,722$
Adjusted net earnings 283,578$ 295,458$ 367,530$ 317,188$ 268,722$
Cash and cash equivalents 1,373,166$ 1,520,822$ 1,183,797$ 1,358,071$ 1,256,005$
Earnings per share
Basic 2.44$ 2.46$ 2.94$ 2.22$ 2.05$
Diluted 2.42$ 2.45$ 2.92$ 2.20$ 2.03$
Adjusted diluted earningsper share 2.42$ 2.45$ 2.92$ 2.46$ 2.03$
Operational highlights*
Available seat miles (ASM) 30,998,306,475 29,298,340,363 26,902,227,359 25,584,033,077 23,970,921,260
Revenue passengermiles (RPM) 25,903,948,781 23,967,614,295 21,525,979,116 20,828,992,613 19,591,173,039
Load factor 83.6% 81.8% 80.0% 81.4% 81.7%
Yield (cents) 17.38 17.20 18.72 19.09 18.69
Revenue per ASM (cents) 14.52 14.07 14.98 15.54 15.28
Cost per ASM (cents) 13.11 12.57 12.86 13.68 13.61
Cost per ASM, excludingfuel and employee profit share (cents) 9.89 9.75 9.46 9.15 9.06
(i) Please refer to page 8 of this Annual Report
3,662
3,977 4,029 4,123
4,502
2013 2014 2015 2016 2017
(millions of dollars)Revenue
23,97125,584
26,902
29,29830,998
2013 2014 2015 2016 2017
(millions)Available seat miles
18,48519,652 20,281
21,951
24,137
2013 2014 2015 2016 2017
(thousands)Segment guests

WestJet Annual Report 2017 | 2
President’s message to shareholders
In 2017, we celebrated 21 years of offering Canadians a lower-cost alternative for air travel and made it possible for a record 24 million guests to fly to destinations across our growing global network. At our Investor Day we unveiled our vision for the next five years, a plan co-created by WestJetters that will guide and underpin our actions as we grow into a global carrier.
As we begin stretching our wings to bring the WestJet brand around the world, we will do so in a way that is authentically Canadian, but uniquely WestJet.
In 2017, we continued to achieve top-line revenue growth, delivered strong and consistent year-over-year traffic growth, flew a record number of guests and achieved the highest annual load factor in our history at 83.6 per cent. This speaks to the continued strength of our time-tested business model and our ability to execute on our strategy.
We reported net earnings of $283.6 million or $2.42 cents per diluted share. Total revenue increased by 9.2 per cent year over year, driven by increased guest revenue as well as higher ancillary and charter revenues. In the fourth quarter of 2017, we achieved our 51st consecutive profitable quarter by reporting net earnings of $48.5 million or $0.42 cents per diluted share.
As part of our five-year vision, we are committed to enhancing our inflight and ground services to improve guest experience, increase connectivity and reliability in our schedule and extend our network to new global destinations.
Throughout 2017, we continued to add benefits to simplify our WestJet Rewards program, enhancing the attractiveness for both leisure and premium travelling guests. We continued to see very positive trends in terms of growth in our rewards program, managed corporate business revenues and the number of guests who hold our WestJet RBC MasterCard.
Specifically, in terms of year-over-year growth:
• active Rewards members were up more than 18 per cent, • managed corporate business revenues were up more than 11 per cent and • credit card holders were up by more than 34 per cent.
Through our expanding airline partnership program, we were able to enhance our reciprocal frequent flyer program with Delta Air Lines, Air France-KLM and Qantas to permit the redemption of WestJet dollars to new select international destinations through WestJet Rewards Member Exclusive fares. Additionally, On December 6, 2017, we announced a memorandum of understanding to negotiate and implement a comprehensive transborder joint-venture with Delta Air Lines. We expect this partnership will allow us to provide our guests with access to an extensive transborder network, better flight connections, enhanced frequent flier benefits and provide us with new opportunities in this market.
Our mainline network continues to extend to provide our guests with new and increased service to WestJet destinations around the globe. In 2017, we focused on further developing our three key airport hubs, Calgary International Airport, Toronto Pearson International Airport (Toronto Pearson) and Vancouver International Airport, while improving schedule utility and enhancing our network connectivity.
During the year, we announced new service between Calgary and Denver, services to Mexico City and we announced the start of service to our fourth destination in Europe, Paris, France, from Halifax on our new Boeing MAX aircraft starting May 2018, in addition to new service to London Gatwick also from Halifax in April 2018.
To help maximize connectivity and feed guests through our network, on November 24, 2017, we announced WestJet Link, our new regional air service under WestJet’s first capacity-purchase agreement with Pacific Coastal Airlines. The initial flight schedule will offer new service from five destinations, Cranbrook, Lethbridge, Lloydminster, Medicine Hat, and Prince George, starting in June 2018.
2017 also saw the introduction of WestJet’s wholly owned subsidiary Swoop, Canada’s first true ultra-low-cost carrier (ULCC). Through Swoop, we are committed to providing Canadians a true ULCC experience with airfares that are up to 40 per cent lower than traditional airlines. Swoop’s initial network focuses on select domestic regions and includes five Canadian cities: Abbottsford, Edmonton, Halifax, Hamilton and Winnipeg.
We also continue to position our airline for global expansion. On May 1, 2017, we entered into a definitive purchase agreement with the Boeing Company for up to 20 Boeing 787 aircraft. The purchase agreement includes commitments for 10 Boeing 787 aircraft to be delivered between the first quarter of 2019 and December 2021, with options for an additional 10 aircraft to be
WestJet Annual Report 2017 | 3
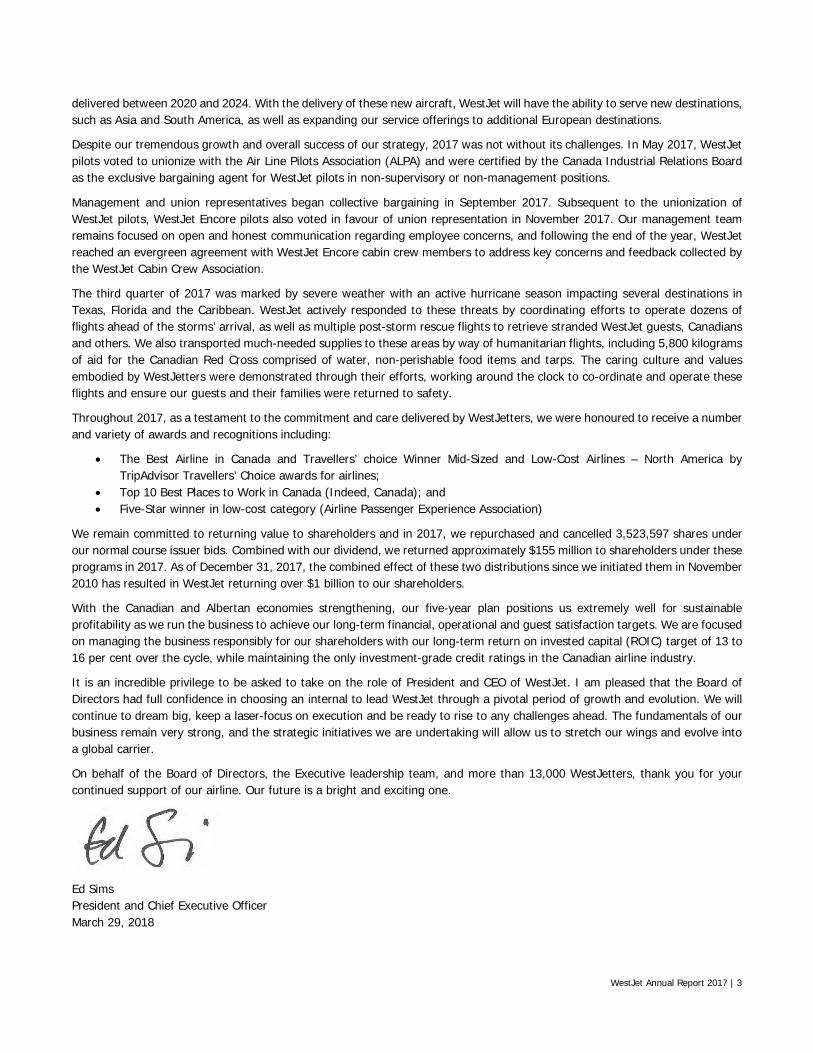
delivered between 2020 and 2024. With the delivery of these new aircraft, WestJet will have the ability to serve new destinations, such as Asia and South America, as well as expanding our service offerings to additional European destinations.
Despite our tremendous growth and overall success of our strategy, 2017 was not without its challenges. In May 2017, WestJet pilots voted to unionize with the Air Line Pilots Association (ALPA) and were certified by the Canada Industrial Relations Board as the exclusive bargaining agent for WestJet pilots in non-supervisory or non-management positions.
Management and union representatives began collective bargaining in September 2017. Subsequent to the unionization of WestJet pilots, WestJet Encore pilots also voted in favour of union representation in November 2017. Our management team remains focused on open and honest communication regarding employee concerns, and following the end of the year, WestJet reached an evergreen agreement with WestJet Encore cabin crew members to address key concerns and feedback collected by the WestJet Cabin Crew Association.
The third quarter of 2017 was marked by severe weather with an active hurricane season impacting several destinations in Texas, Florida and the Caribbean. WestJet actively responded to these threats by coordinating efforts to operate dozens of flights ahead of the storms’ arrival, as well as multiple post-storm rescue flights to retrieve stranded WestJet guests, Canadians and others. We also transported much-needed supplies to these areas by way of humanitarian flights, including 5,800 kilograms of aid for the Canadian Red Cross comprised of water, non-perishable food items and tarps. The caring culture and values embodied by WestJetters were demonstrated through their efforts, working around the clock to co-ordinate and operate these flights and ensure our guests and their families were returned to safety.
Throughout 2017, as a testament to the commitment and care delivered by WestJetters, we were honoured to receive a number and variety of awards and recognitions including:
• The Best Airline in Canada and Travellers’ choice Winner Mid-Sized and Low-Cost Airlines – North America by TripAdvisor Travellers’ Choice awards for airlines;
• Top 10 Best Places to Work in Canada (Indeed, Canada); and • Five-Star winner in low-cost category (Airline Passenger Experience Association)
We remain committed to returning value to shareholders and in 2017, we repurchased and cancelled 3,523,597 shares under our normal course issuer bids. Combined with our dividend, we returned approximately $155 million to shareholders under these programs in 2017. As of December 31, 2017, the combined effect of these two distributions since we initiated them in November 2010 has resulted in WestJet returning over $1 billion to our shareholders.
With the Canadian and Albertan economies strengthening, our five-year plan positions us extremely well for sustainable profitability as we run the business to achieve our long-term financial, operational and guest satisfaction targets. We are focused on managing the business responsibly for our shareholders with our long-term return on invested capital (ROIC) target of 13 to 16 per cent over the cycle, while maintaining the only investment-grade credit ratings in the Canadian airline industry.
It is an incredible privilege to be asked to take on the role of President and CEO of WestJet. I am pleased that the Board of Directors had full confidence in choosing an internal to lead WestJet through a pivotal period of growth and evolution. We will continue to dream big, keep a laser-focus on execution and be ready to rise to any challenges ahead. The fundamentals of our business remain very strong, and the strategic initiatives we are undertaking will allow us to stretch our wings and evolve into a global carrier.
On behalf of the Board of Directors, the Executive leadership team, and more than 13,000 WestJetters, thank you for your continued support of our airline. Our future is a bright and exciting one.
Ed Sims President and Chief Executive Officer March 29, 2018

WestJet Annual Report 2017 | 4
Caution regarding forward-looking statements
This president’s message to shareholders contains forward-looking information, as defined under applicable securities legislation, including without limitation, relating to the following: our expectations regarding the timing and impact of introducing new, and building upon existing, aircraft, destinations, technologies and initiatives; our long-term ROIC target of 13 to 16 per cent; our expectations regarding expansion into new markets and our ability to create demand in those markets; our expectations regarding the success of our competitive strategy; our expectations regarding the launch, operation and impact of our ultra-low-cost carrier; our expectations regarding the operation and impact of our capacity purchase agreement; our expectations regarding the consummation and impact of the joint venture; our expectations regarding our airline and strategic partnerships; our expectations regarding aircraft deliveries including of the Boeing 787 aircraft; our expectations regarding long term financial and performance targets; our expectations regarding the opening of new facilities and infrastructure; our expectations regarding financial and operating performance; our expectations regarding the value of the Canadian dollar; our expectations regarding our discussions with contractual counterparties, our expectations regarding the receipt of governmental certifications and the absence of material adverse regulatory changes; our expectations regarding the outcome and impact of ongoing legal proceedings and other factors described in WestJet’s public reports and filings, which are available on WestJet’s profile at sedar.com. Readers are cautioned that undue reliance should not be placed on forward-looking information as actual results may vary materially from the forward-looking information. WestJet does not undertake to update, correct or revise any forward-looking information as a result of any new information, future events or otherwise, except as may be required by applicable law.
Non-GAAP measures
This president’s message to shareholders contains disclosure respecting non-GAAP measures including, without limitation, adjusted net earnings, adjusted diluted earnings per share, cost per ASM (excluding fuel and employee profit share), and ROIC. Non-GAAP measures are included to enhance the overall understanding of our financial performance or current financial condition. They are included to provide investors and management with an alternative method for assessing our operating results in a manner that is focused on the performance of our ongoing operations, and to provide a more consistent basis for comparison between reporting periods. These measures are not calculated in accordance with, or an alternative to, GAAP and do not have standardized meanings. Therefore, they may not be comparable to similar measures provided by other entities. Readers are urged to review the section entitled “Reconciliation of non-GAAP and additional GAAP measures” in WestJet’s management’s discussion and analysis of financial condition and operating results for the years ended December 31, 2017 and 2016.

WestJet Annual Report 2017│ 5
Management’s Discussion and Analysis
Management’s Discussion and Analysis of Financial Condition and Operating Results For the years ended December 31, 2017 and 2016
WestJet Airlines Ltd. Annual 2017 MD&A February 5, 2018

WestJet Annual Report 2017 | 6
Contents About WestJet ............................................................. 7 2017 Financial and operational highlights ....................... 8 Annual overview .......................................................... 9 Outlook ..................................................................... 14 2017 Results of operations .......................................... 15 2017 Fourth quarter results of operations ..................... 22 Summary of quarterly results ...................................... 28 Guest experience ....................................................... 28 Liquidity and capital resources .................................... 29 Fleet ......................................................................... 33
Off-balance sheet arrangements and related party transactions ............................................................... 35 Share capital .............................................................. 36 Financial instruments and risk management .................. 37 Risks and uncertainties ................................................ 40 Accounting ................................................................. 49 Controls and procedures .............................................. 53 Forward-looking information ........................................ 54 Definition of key operating indicators ............................ 57 Non-GAAP and Additional GAAP Measures ..................... 57
Advisories The following Management’s Discussion and Analysis of Financial Condition and Operating Results (MD&A), dated February 5, 2018, should be read in conjunction with the cautionary statement regarding forward-looking information below, as well as our audited consolidated financial statements and notes thereto, for the years ended December 31, 2017 and 2016. Except as otherwise noted, all financial information has been prepared in accordance with International Financial Reporting Standards (IFRS). All amounts in the following MD&A are in Canadian dollars unless otherwise stated. References to “WestJet,” “the Corporation,” “the Company”, “we,” “us” or “our” mean WestJet Airlines Ltd. and its consolidated subsidiaries and structured entities, unless the context otherwise requires. Additional information relating to WestJet, including periodic quarterly and annual reports and Annual Information Forms (AIF), filed with Canadian securities regulatory authorities, is available on SEDAR at sedar.com and our website at westjet.com.
Cautionary statement regarding forward-looking information This MD&A contains “forward-looking information” as defined under applicable Canadian securities legislation. This forward-looking information typically contains the words “anticipate,” “believe,” “estimate,” “intend,” “expect,” “forecast,” “may,” “will,” “should,” “potential,” “plan,” “project” or other similar terms. Our actual results, performance or achievements could differ materially from those expressed in, or implied by, this forward-looking information. We can give no assurance that any of the events anticipated will transpire or occur or, if any of them do, what benefits or costs we will derive from them. By its nature, forward-looking information is subject to numerous risks and uncertainties including, but not limited to, the impact of general economic conditions, changing domestic and international airline industry conditions, volatility of fuel prices, terrorism, pandemics, currency fluctuations, interest rates, competition from other airline industry participants (including new entrants, capacity fluctuations and changes to the pricing environment), labour matters, government regulations, stock market volatility, the ability to access sufficient capital from internal and external sources, and additional risk factors discussed in the documents we file from time to time with Canadian securities regulatory authorities, which are available on SEDAR at sedar.com or, upon request, without charge from us. Readers are urged to consult the disclosures provided below for important information respecting material risks and uncertainties applicable to our forward-looking information.
The disclosure found under the heading Outlook in this MD&A, including the guidance summary for the three months ended March 31, 2018 and the year ended December 31, 2018 may contain forward-looking information that constitutes a financial outlook. The forward-looking information, including any financial outlook, contained in this MD&A, is provided to assist investors in understanding our assessment of WestJet’s future plans, operations and expected results. The forward-looking information, including without limitation, the disclosure found under the heading “Outlook”, contained in this MD&A may not be appropriate for other purposes and is expressly qualified by this cautionary statement. Please refer to page 54 of this MD&A for further information on our forward-looking information including assumptions and estimates used in its development. Our assumptions and estimates relating to the forward-looking information referred to above are updated in conjunction with filing our quarterly and annual MD&A and, except as required by law, we do not undertake to otherwise update forward-looking information.
Non-GAAP and additional GAAP measures Certain measures in this MD&A do not have any standardized meaning as prescribed by Generally Accepted Accounting Principles (GAAP) and, therefore, are considered non-GAAP measures. These measures are provided to enhance the reader’s overall understanding of our financial performance or current financial condition. They are included to provide investors and management with an alternative method for assessing our operating results in a manner that is focused on the performance of our ongoing operations and to provide a more consistent basis for comparison between periods. These measures are not in accordance with, or an alternative to, GAAP and do not have standardized meanings. Therefore, they may not be comparable to similar measures presented by other entities.
Please refer to pages 57 and 59 of this MD&A for definitions of the non-GAAP measures and a reconciliation of non-GAAP measures, including cost per available seat mile (CASM), excluding fuel and employee profit share; return on invested capital (ROIC); free cash flow; diluted free cash flow per share; diluted operating cash flow per share; adjusted net earnings, adjusted diluted earnings per share, and adjusted earnings before income tax (EBT) margin, and for a reconciliation of additional GAAP measures, including adjusted debt-to-equity; adjusted net debt to earnings before interest, taxes, depreciation and aircraft rent (EBITDAR), adjusted net debt to adjusted EBITDAR and the cash to trailing twelve months revenue ratio.
Included in net income for the year ended December 31, 2014, is an after-tax $33.2 million non-cash loss associated with the sale of 10 aircraft to Southwest Airlines being classified to assets held for sale. As this non-cash loss is a non-recurring item we have adjusted certain non-GAAP measures to remove this item so as to improve comparability of such measures between periods. In the fourth quarter of 2014, this resulted in the presentation of new non-GAAP measures or a change in composition of certain non-GAAP measures including: adjusted net debt to adjusted EBITDAR, adjusted EBT margin, adjusted net earnings, and adjusted diluted earnings per share, all of which exclude this non-cash loss (pre-tax or after-tax depending on the measure).
Definitions Various terms used throughout this MD&A are defined at page 57 under the title Definition of key operating indicators.

WestJet Annual Report 2017│ 7
About WestJet
WestJet is a Canadian airline based in Calgary, Alberta. Through scheduled flights across a growing network, WestJet also operates WestJet Vacations, which provides air, hotel, car and excursion packages, and WestJet Encore, a regional airline which operates a fleet of turboprop aircraft in a network of destinations in Canada and the United States.
As of December 31, 2017, our airline offered scheduled service to 107 destinations in North America, Central America, the Caribbean and Europe with our fleet of 117 Boeing 737 Next Generation (Boeing 737 NG) aircraft, four Boeing MAX 737 (Boeing Max) aircraft, 43 Bombardier Q400 (Q400) aircraft and four wide-body, Boeing 767-300 ERW (Boeing 767) aircraft. When including connectivity provided through our airline partners, we serve over 170 destinations. We plan to continue adding new destinations and additional frequencies to our existing markets through the growth of our Boeing MAX fleet, future deliveries of Boeing 787-9 Dreamliner (Boeing 787) aircraft and service offered by our ultra-low-cost carrier (ULCC), Swoop, starting in 2018.
WestJet’s mission is to enrich the lives of everyone in WestJet’s world. We believe that focusing on metrics such as safety, on-time performance, profitability, guest satisfaction and employee engagement will lead us toward this goal.
On February 28, 2017, we unveiled our 2022 vision to all WestJetters which focuses on three bold claims: we are team WestJet, we are caring at our core, and we are a global airline. This vision was co-created with all WestJetters and reflects our shared beliefs and values across the organization.
Guiding us every day towards accomplishing our mission are our core values:
• commitment to safety;
• positive and passionate in everything we do;
• appreciative of our people and guests;
• fun, friendly and caring;
• aligning the interests of WestJetters with the interests of the Company; and
• honest, open and keeping our commitments.
WestJet’s focus on our people has always been fundamental to the success of our airline. In an industry that has become largely commoditized, we recognize that WestJetters are an essential part of our business and that their commitment to caring for our guests supports our profitable results. Our goal remains to attract, train, motivate, develop and retain the right people.

WestJet Annual Report 2017 | 8
Financial and Operational Highlights
Select annual financial information and operational highlights for WestJet for the past five years are as follows:
($ in thousands, except per share amounts and unless otherwise noted)
2017 2016 2015 2014 2013
Fina
ncia
l hig
hlig
hts
Revenue 4,502,320 4,122,859 4,029,265 3,976,552 3,662,197
Operating expenses 4,063,360 3,682,762 3,459,512 3,501,081 3,262,687
Earnings from operations 438,960 440,097 569,752 475,471 399,510
Operating margin 9.7% 10.7% 14.1% 12.0% 10.9%
Earnings before income taxes (EBT) 404,135 416,233 520,258 390,307 372,085
Adjusted EBT(i) 404,135 416,233 520,258 435,766 372,085
EBT margin(i) 9.0% 10.1% 12.9% 9.8% 10.2%
Adjusted EBT margin(i) 9.0% 10.1% 12.9% 11.0% 10.2%
Net earnings 283,578 295,458 367,530 283,957 268,722
Adjusted net earnings(i) 283,578 295,458 367,530 317,188 268,722
Earnings per share:
Basic 2.44 2.46 2.94 2.22 2.05
Diluted 2.42 2.45 2.92 2.20 2.03
Adjusted diluted(i) 2.42 2.45 2.92 2.46 2.03
ROIC(i) 10.0% 11.3% 15.3% 14.3% 13.9%
Cash, cash equivalents and marketable securities 1,373,166 1,520,822 1,183,797 1,358,071 1,256,005
Total assets 6,499,840 6,164,296 5,129,024 4,646,433 4,143,463
Total long-term liabilities 2,560,362 2,482,261 1,617,106 1,530,630 1,147,163
Cash dividends declared per share(ii) 0.56 0.56 0.56 0.48 0.40
2017 2016 2015 2014 2013
Ope
rati
onal
hig
hlig
hts
ASMs 30,998,306,475 29,298,340,363 26,902,227,359 25,584,033,077 23,970,921,260
RPMs 25,903,948,781 23,967,614,295 21,525,979,116 20,828,992,613 19,591,173,039
Load factor 83.6% 81.8% 80.0% 81.4% 81.7%
Yield (cents) 17.38 17.20 18.72 19.09 18.69
RASM (cents) 14.52 14.07 14.98 15.54 15.28
CASM (cents) 13.11 12.57 12.86 13.68 13.61
CASM, excluding fuel and employee profit share (cents)(i) 9.89 9.75 9.46 9.15 9.06
Fuel consumption (litres) 1,482,849,838 1,405,488,934 1,278,079,174 1,214,001,002 1,144,937,872
Fuel costs per litre (cents) 64 54 64 90 91
Segment guests 24,137,477 21,951,463 20,281,376 19,651,977 18,485,144
Average stage length (miles) 894 911 910 936 976
Departures 249,709 227,866 209,770 192,858 171,436
Utilization (hours) 11.2 11.2 11.6 11.8 12.0
Full-time equivalent employees at period end 11,089 9,988 9,211 8,698 8,000
Fleet size at period end 168 153 140 122 113
(i) Please refer to page 59 of this MD&A for a reconciliation of non-GAAP measures and additional GAAP measures. (ii) Identical dividends are paid on our common and variable voting shares.

WestJet Annual Report 2017│ 9
Annual Overview
Our 2017 financial results represent our 13th consecutive year of reported profitability with net earnings of $283.6 million and annual diluted earnings per share of $2.42. During 2017, our operating margin was 9.7 per cent. Total revenue increased by 9.2 per cent year over year, driven by increased guest revenue as well as higher ancillary and charter revenues.
We returned approximately $155.2 million to our shareholders through our dividend and share buy-back programs in 2017. Since these programs began in 2010, we have returned over $1,097.7 million to our shareholders. At December 31, 2017, our annual ROIC was 10.0 per cent, which represents a decrease of 1.3 percentage points compared to our 2016 annual ROIC of 11.3 per cent. We remain committed to returning to our targeted long-term ROIC range of 13.0 to 16.0 per cent by growing revenues and reducing costs to improve our earnings, and expect to return to within our targeted range in the year 2020.
2017 Summary
• Earned total revenue of $4,502.3 million, an increase of 9.2 per cent from $4,122.9 million in 2016.
• Increased capacity, measured in available seat miles (ASMs), by 5.8 per cent over 2016.
• Increased traffic, measured in revenue passenger miles (RPMs), by 8.1 per cent over 2016.
• Realized yield of 17.38 cents, up 1.0 per cent from 17.20 cents 2016.
• Realized RASM of 14.52 cents, up 3.2 per cent from 14.07 cents in 2016.
• Realized CASM of 13.11 cents, up 4.3 per cent from 12.57 cents in 2016.
• Realized CASM, excluding fuel and employee profit share, of 9.89 cents, up 1.4 per cent from 9.75 cents in 2016.
• Recorded an operating margin of 9.7 per cent, down 1.0 percentage point from 10.7 per cent in 2016.
• Recorded EBT margin of 9.0 per cent, down 1.1 percentage points from 10.1 per cent in 2016.
• Reported net earnings of $283.6 million, a decrease of 4.0 per cent from $295.5 million in 2016.
• Reported diluted earnings per share of $2.42, a decrease of 1.2 per cent from $2.45 per share in 2016.
Please refer to page 59 of this MD&A for a reconciliation of non-GAAP measures and additional GAAP measures.

WestJet Annual Report 2017 | 10
WestJetters
Throughout 2017 we have taken steps towards the achievement of our 2022 vision and the transition of WestJet from a low-cost point-to-point model into a high value-based network airline with a global footprint with growth in both the leisure and premium traveller markets. In addition to the numerous strategic initiatives that have been implemented during the year with the support of our WestJetters, we successfully navigated the challenges of a record-breaking holiday season, comprised of record load-factors despite severe weather resulting in numerous operational challenges. We believe our strong caring culture, demonstrated by the dedication of over 13,000 WestJetters across Canada, is key to our airline’s success, and we sincerely thank our WestJetters’ exceptional efforts in working with our guests and each other to fulfill our guests’ travel needs.
As part of our efforts to provide effective support and leadership in an increasingly complex business, throughout the year we filled numerous key executive positions:
• Craig Maccubbin – Executive Vice President (EVP) and Chief Information Officer, effective April 24, 2017; • Bob Cummings – EVP, Strategy, formerly EVP, Commercial; • Ed Sims – EVP, Commercial, effective May 29, 2017; and • Charles Duncan – EVP, President-WestJet Encore, effective June 6, 2017.
We celebrated the efforts of our WestJetters in 2017 with the launch of our President’s Circle award, which recognizes the impact of WestJetters who consistently go above and beyond to create a remarkable guest experience and help fulfill WestJet’s mission. This year’s twelve recipients were announced at a teal carpet awards gala on October 28, 2017, and were selected based on their ability to consistently create positive and memorable connections with guests that are stress free, safe, caring and that leave our guests smiling. Each recipient will also be featured in one month of our inflight magazine. This award recognizes the significant importance that guest experience has on our current and future success.
During the first quarter of 2017, we celebrated the 10-year anniversary of the WestJet Cares for Kids program, which has donated over 65,000 flights to our eight national WestJet Cares for Kids charitable partners. WestJetters are passionate about helping people in the best way we know how; by providing a caring experience through the gift of flight. Donations of these flights help our charitable partners deliver essential programs to the children and youth they serve, reduce the cost of their business travel and raise funds.
In the second quarter of 2017, we announced that WestJet is partnering with the aviation program at Mount Royal University, providing students access to WestJet’s leading technology and training manuals, flight simulators, as well as providing industry expertise through mentorship by WestJet pilots. WestJet’s commitment to supporting the aviation program and the next generation of aviation professionals is a further example of our longstanding focus on supporting the communities we serve. WestJet has since partnered with a number of additional aviation programs across Canada in our effort to support the industry and introduce aviation students to our unique, award-winning culture.
The third quarter of 2017 was marked by severe weather with an active hurricane season impacting several destinations in Texas, Florida and the Caribbean. WestJet actively responded to these threats by coordinating efforts to operate approximately 25 flights ahead of the storms’ arrival, as well as multiple post-storm rescue flights to retrieve stranded WestJet guests, Canadians, and others. We also transported much needed supplies to these areas by way of humanitarian flights, including 5,800 kilograms of humanitarian aid for the Canadian Red Cross comprised of water, non-perishable food items and tarps. The caring culture and values embodied by WestJetters were demonstrated through their efforts, working around the clock to coordinate and operate these flights and ensure our guests and their families were returned to safety.
Throughout 2017, we were honoured to receive a number of awards and recognitions, which would not have been possible without the commitment and care delivered by our over 13,000 WestJetters:
• 2017 Best Airline in Canada and Travellers’ choice Winner Mid-Sized and Low-Cost Airlines – North America by TripAdvisor Travellers’ Choice awards for airlines;
• Canada’s Most Trusted Airline (Peter B. Gustavson School of Business at the University of Victoria); • Top 10 Best Places to Work in Canada (Indeed, Canada); • Five-Star winner in low-cost category (Airline Passenger Experience Association); and • Best Low-Cost Airline – The Americas (AirlineRatings.com).
WestJet Annual Report 2017│ 11
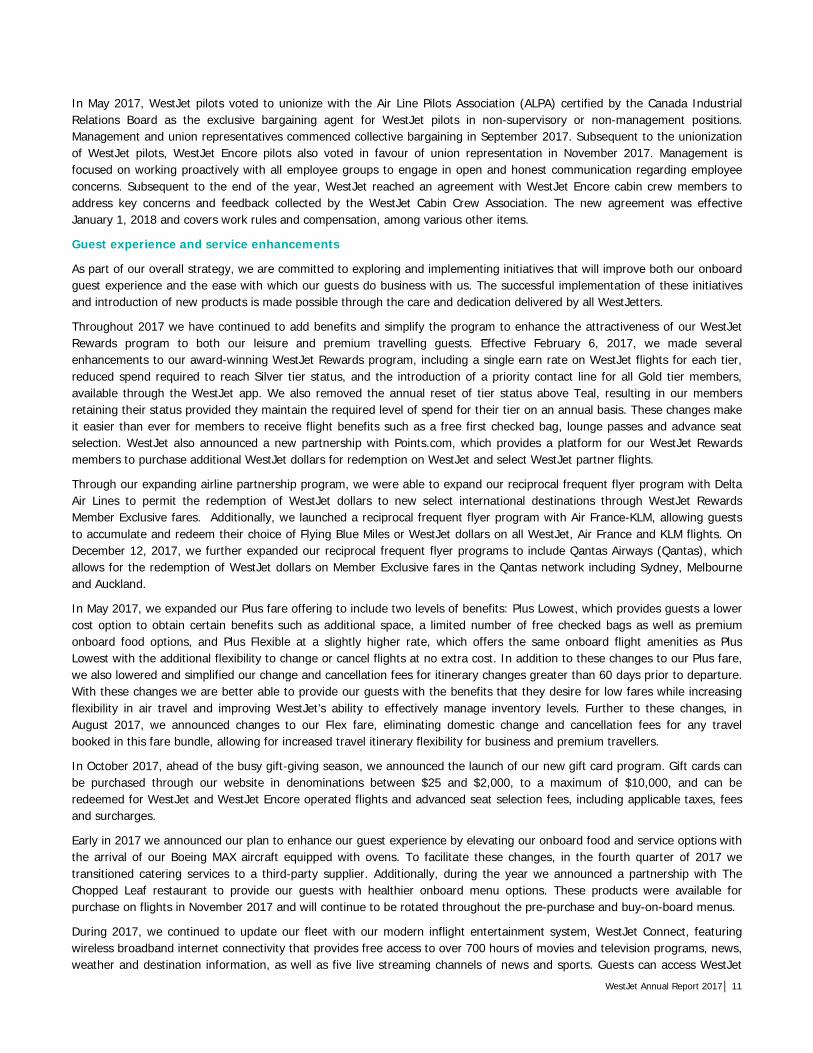
In May 2017, WestJet pilots voted to unionize with the Air Line Pilots Association (ALPA) certified by the Canada Industrial Relations Board as the exclusive bargaining agent for WestJet pilots in non-supervisory or non-management positions. Management and union representatives commenced collective bargaining in September 2017. Subsequent to the unionization of WestJet pilots, WestJet Encore pilots also voted in favour of union representation in November 2017. Management is focused on working proactively with all employee groups to engage in open and honest communication regarding employee concerns. Subsequent to the end of the year, WestJet reached an agreement with WestJet Encore cabin crew members to address key concerns and feedback collected by the WestJet Cabin Crew Association. The new agreement was effective January 1, 2018 and covers work rules and compensation, among various other items.
Guest experience and service enhancements
As part of our overall strategy, we are committed to exploring and implementing initiatives that will improve both our onboard guest experience and the ease with which our guests do business with us. The successful implementation of these initiatives and introduction of new products is made possible through the care and dedication delivered by all WestJetters.
Throughout 2017 we have continued to add benefits and simplify the program to enhance the attractiveness of our WestJet Rewards program to both our leisure and premium travelling guests. Effective February 6, 2017, we made several enhancements to our award-winning WestJet Rewards program, including a single earn rate on WestJet flights for each tier, reduced spend required to reach Silver tier status, and the introduction of a priority contact line for all Gold tier members, available through the WestJet app. We also removed the annual reset of tier status above Teal, resulting in our members retaining their status provided they maintain the required level of spend for their tier on an annual basis. These changes make it easier than ever for members to receive flight benefits such as a free first checked bag, lounge passes and advance seat selection. WestJet also announced a new partnership with Points.com, which provides a platform for our WestJet Rewards members to purchase additional WestJet dollars for redemption on WestJet and select WestJet partner flights.
Through our expanding airline partnership program, we were able to expand our reciprocal frequent flyer program with Delta Air Lines to permit the redemption of WestJet dollars to new select international destinations through WestJet Rewards Member Exclusive fares. Additionally, we launched a reciprocal frequent flyer program with Air France-KLM, allowing guests to accumulate and redeem their choice of Flying Blue Miles or WestJet dollars on all WestJet, Air France and KLM flights. On December 12, 2017, we further expanded our reciprocal frequent flyer programs to include Qantas Airways (Qantas), which allows for the redemption of WestJet dollars on Member Exclusive fares in the Qantas network including Sydney, Melbourne and Auckland.
In May 2017, we expanded our Plus fare offering to include two levels of benefits: Plus Lowest, which provides guests a lower cost option to obtain certain benefits such as additional space, a limited number of free checked bags as well as premium onboard food options, and Plus Flexible at a slightly higher rate, which offers the same onboard flight amenities as Plus Lowest with the additional flexibility to change or cancel flights at no extra cost. In addition to these changes to our Plus fare, we also lowered and simplified our change and cancellation fees for itinerary changes greater than 60 days prior to departure. With these changes we are better able to provide our guests with the benefits that they desire for low fares while increasing flexibility in air travel and improving WestJet’s ability to effectively manage inventory levels. Further to these changes, in August 2017, we announced changes to our Flex fare, eliminating domestic change and cancellation fees for any travel booked in this fare bundle, allowing for increased travel itinerary flexibility for business and premium travellers.
In October 2017, ahead of the busy gift-giving season, we announced the launch of our new gift card program. Gift cards can be purchased through our website in denominations between $25 and $2,000, to a maximum of $10,000, and can be redeemed for WestJet and WestJet Encore operated flights and advanced seat selection fees, including applicable taxes, fees and surcharges.
Early in 2017 we announced our plan to enhance our guest experience by elevating our onboard food and service options with the arrival of our Boeing MAX aircraft equipped with ovens. To facilitate these changes, in the fourth quarter of 2017 we transitioned catering services to a third-party supplier. Additionally, during the year we announced a partnership with The Chopped Leaf restaurant to provide our guests with healthier onboard menu options. These products were available for purchase on flights in November 2017 and will continue to be rotated throughout the pre-purchase and buy-on-board menus.
During 2017, we continued to update our fleet with our modern inflight entertainment system, WestJet Connect, featuring wireless broadband internet connectivity that provides free access to over 700 hours of movies and television programs, news, weather and destination information, as well as five live streaming channels of news and sports. Guests can access WestJet

WestJet Annual Report 2017 | 12
Connect using their laptops or via the WestJet app downloaded onto their mobile devices. As at the end of 2017, we have installed WestJet Connect on 92 of our Boeing 737 NGs, all four of our Boeing 767s and our first four Boeing MAX aircraft. Certain installations that were previously scheduled to be completed within 2017 were rescheduled to 2018 to allow for the completion of seat reconfigurations on our Boeing 737-700 fleet. The majority of the remaining installations of WestJet Connect, as well as software upgrades on previous installations, are scheduled to be completed in 2018. Future Boeing aircraft deliveries will include WestJet Connect as their default configuration.
Network expansion and fleet
We continue to strategically grow our airline through new and increased service across our scheduled network. In 2017, we focused on further developing our three key airport hubs, Calgary International Airport, Toronto Pearson International Airport (Toronto Pearson) and Vancouver International Airport, while improving schedule utility, enhancing our network connectivity and continuing to develop and expand our airline partnerships.
During the year we announced new, daily non-stop service between Calgary and Denver, commencing March 2018, as well as new, year-round non-stop service to Mexico City from our Calgary and Vancouver hubs, also starting in March 2018. In addition to the new destinations above, in early 2017 we increased capacity in Quebec through new and expanded service to and from Montreal and Quebec City. Our 2017-2018 winter season schedule was comprised of significant increases in capacity from our Toronto and Calgary hubs to a variety of domestic business destinations, as well as increased transborder and international sun destinations. We also added capacity from our Vancouver hub to Nanaimo and Comox, providing these communities with increased connectivity to the broader WestJet network. We announced our 2018 summer schedule on January 29, 2018, with further enhancements to our schedule and connectivity from our primary domestic hubs, including new routes and increased frequency to a number of Canadian, transborder and international sun destinations. We also announced the commencement of service to our fourth destination in Europe, Paris, France, from Halifax on our new Boeing MAX aircraft starting May 2018, in addition to new service to London Gatwick also from Halifax in April 2018.
On November 24, 2017, we announced WestJet Link, our new regional air service operated by Pacific Coastal Airlines under WestJet’s first capacity purchase agreement. WestJet Link flights will be operated by Pacific Coastal Airlines on their fleet of 34-seat Saab 340B aircraft, which will be painted in WestJet colours and include six seats available in WestJet Plus, offering guests advanced boarding and up to two free checked bags. The initial flight schedule offers new, year-round non-stop service from Calgary to five destinations, including Lethbridge, Lloydminster, Medicine Hat, Cranbrook and Prince George with flights starting in June 2018. Original service was scheduled for March 2018. The delay is due to continued work being done by Pacific Coastal Airlines to meet WestJet’s operational requirements.
To further strengthen our competitive position in our transborder markets and enable future continued growth in these markets, WestJet has focused on establishing and developing strong strategic partnerships with certain airline partners. On December 6, 2017, we announced the signing of a memorandum of understanding with Delta Air Lines to negotiate and implement a joint venture, subject to the approval of WestJet’s Board of Directors and regulatory approvals. This joint venture is expected to provide our guests with access to an extensive transborder route network, better flight connections, enhanced frequent flyer benefits and shared airport facilities and amenities. As a result of the strengthening of our partnership with Delta Air Lines, our codeshare and reciprocal frequent flyer programs with American Airlines will end in 2018.
During 2017 we announced a new codeshare partnership with Hong Kong Airlines. We also announced our partnership with easyJet, Norwegian Air and Loganair under the Worldwide by easyJet program, to offer multi-airline bookings with connecting flights through London Gatwick Airport (London Gatwick) to destinations throughout North and South America and Europe. This partnership will allow our guests to connect with ease to over one hundred destinations serviced by the partner airlines through London Gatwick, with flight itineraries included in a single booking and streamlined baggage transfer using the Gatwick Connects service. The success of our expanding airline partnership program contributes to our ability to market our flights to an increasingly global audience and enables our guests to access over 170 destinations through WestJet. As of the date of this MD&A we have a total of 46 airline partnership agreements.
During the year, we took delivery of a total of nine Q400 aircraft to end the year with a total of 43 Q400s. We also added two Boeing 737-800 series aircraft and four Boeing MAX aircraft to end the year with a total of 120 Boeing narrow-body aircraft. Additionally, we executed lease extensions on a total of 11 aircraft leases scheduled to expire in 2017 and 2018, for periods ranging from an additional 14 months to six years. Subsequent to the end of the year, we executed a lease extension for one

WestJet Annual Report 2017│ 13
Boeing 737-700 aircraft for an additional four years, returned one leased Boeing 737-700 aircraft and signed a letter of intent to lease two Q400 aircraft, with expected delivery in 2018, for terms of eight years each.
As our fleet, including our future deliveries of Boeing MAX and Boeing 787 aircraft, continues to expand, we expect to establish additional profitable routes in Canada, the US and internationally. Our evolving aircraft mix allows us to provide increased route frequency, increased non-stop routes and improved scheduling times and connectivity to our guests.
Business development plans
On May 1, 2017, we entered into a definitive purchase agreement with the Boeing Company for up to 20 Boeing 787 aircraft. The purchase agreement includes commitments for 10 Boeing 787 aircraft to be delivered between the first quarter of 2019 and December 2021, with options for an additional 10 aircraft to be delivered between 2020 and 2024. With the delivery of these new aircraft, WestJet will have the ability to serve new destinations, such as Asia and South America, as well as expanding our service offerings to additional European destinations.
In preparation for the delivery of our Boeing 787 aircraft, WestJet has commenced the construction of a 125,000 square foot, eight story hangar in Calgary which will accommodate up to four Boeing 737 NG aircraft, or one Boeing 787 aircraft, in addition to our current Calgary hangar capacity. Construction is expected to be completed in the spring of 2019.
We continue to position our airline for future growth with the implementation of initiatives to attract and retain premium travellers, broaden our fare products and grow our ancillary products and services, representing annual revenue opportunities amounting to between $300 million to $500 million through to 2022. While we plan and execute our growth strategies, we remain committed to maintaining our low-cost operating structure and have identified annual cost savings opportunities of $140 million to $200 million through 2022, through various initiatives including fleet reconfigurations, airport operations cost savings, optimized maintenance plan, increased digital self-service and sales and distribution channel efficiencies.
On February 1, 2018, WestJet’s wholly owned subsidiary, Swoop, began selling air services for travel dates starting June 2018. Swoop is a ULCC that will compete in the price-sensitive, leisure segment while being branded and operated separate from WestJet, which includes the use of separate distribution channels for flight bookings, consisting of a website (www.flyswoop.com) and contact centre, as well as a different flight reservation system. Through sales of air travel operated by Swoop, we are committed to providing Canadians a true ULCC experience which targets airfares that are approximately 40 per cent lower than traditional airlines and gives travellers the option to select additional services, such as carry-on baggage and contact centre support, to the extent desired based upon on a fee-per-use model. Swoop seeks to capture market share from airlines currently servicing guests that are travelling to US airports in close proximity to the Canadian border to fly with low-cost US airlines.
Swoop’s initial network focuses on select domestic regions and includes five Canadian cities: Hamilton, Abbottsford, Edmonton, Halifax and Winnipeg. This represents the capacity requirements for approximately three aircraft and as the network continues to expand, Swoop’s fleet is expected to increase to at least 10 aircraft by mid-2019. These aircraft are scheduled to be transferred from WestJet’s current aircraft fleet.
Swoop continues to progress towards operational readiness in anticipation of the first flight in June 2018. We have undertaken numerous steps in our action plan to prepare for the launch, including establishing the core leadership team, applying for an air operator’s certificate, and hiring and training front line employees. Maintaining a low-cost structure will be a key success factor for Swoop, and the airline remains on track to deliver a CASM excluding fuel of 6.0 cents by 2019, a target which is in line with other leading North American ULCCs. This cost structure will be achieved by selling seats primarily through our direct-only web channel, operating a single fleet-type of Boeing 737-800s with high utilization, high density seating, and a highly efficient and productive workforce. Swoop will be well-positioned to compete effectively and generate accretive results for WestJet.

WestJet Annual Report 2017 | 14
Outlook
For the first quarter of 2018, we expect system-wide capacity to grow between 4.0 and 5.0 per cent year over year, and domestic capacity to grow between 7.5 and 8.5 per cent year over year. In terms of the full-year 2018, we anticipate both system-wide and domestic capacity growth between 6.5 and 8.5 per cent year over year. A majority of the capacity growth is attributable to densification related to the seat reconfiguration program on our narrow-body aircraft, shift in fleet mix to larger narrow-body aircraft, the initiation of WestJet Link and the launch of our new ultra low-cost carrier, Swoop.
For the first quarter of 2018, we expect strong traffic and revenue growth to continue and anticipate a strong positive year over year RASM growth of up 4.5 to 5.5 per cent driven by the macroeconomic strengthening of the Alberta economy, strategic pricing and improvements in inventory management, the shift of Easter, and the timing of Christmas driving increased traffic into the first quarter.
For the first quarter of 2018, we expect CASM, excluding fuel and employee profit share to be up 2.0 to 3.0 per cent year over year. For the full-year 2018, we continue to expect CASM excluding fuel and employee profit share to be up 1.0 to 2.0 per cent.
For the first quarter of 2018, we expect fuel costs to range between 72 and 74 cents per litre, representing a year-over-year increase of approximately 13 to 16 per cent. The first quarter 2018 expected fuel costs are based on current forecasted jet fuel prices of US $81 per barrel and an average foreign exchange rate of approximately 1.29 Canadian dollars to one US dollar.
For the full-year 2018, we forecast capital expenditures between $770 million and $790 million, with spending related primarily to aircraft deliveries, deposits on future aircraft and overhauls on owned engines. For the first quarter of 2018, we expect our capital expenditures to be between $200 million and $220 million.
We anticipate our annual effective consolidated income tax rate for the full year 2018 to be in the range of 28.5 to 30.5 per cent.
The first quarter and full-year 2018 expected CASM, excluding fuel and employee profit share and capital expenditures are based on an average forecasted foreign exchange rate of approximately 1.29 Canadian dollars to one US dollar.
Guidance summary
Three months ended March 31, 2018
Year ended December 31, 2018
Gui
danc
e su
mm
ary RASM Up 4.5% to 5.5%
Fuel cost per litre 72 to 74 cents
CASM, excluding fuel and employee profit share Up 2.0% to 3.0% Up 1.0% to 2.0%
System capacity Up 4.0% to 5.0% Up 6.5% to 8.5%
Domestic capacity Up 7.5% to 8.5% Up 6.5% to 8.5%
Effective tax rate 28.5% to 30.5%
Capital expenditures $200 to $220 million $770 to $790 million
WestJet Annual Report 2017│ 15
2017 Results of Operations
Capacity
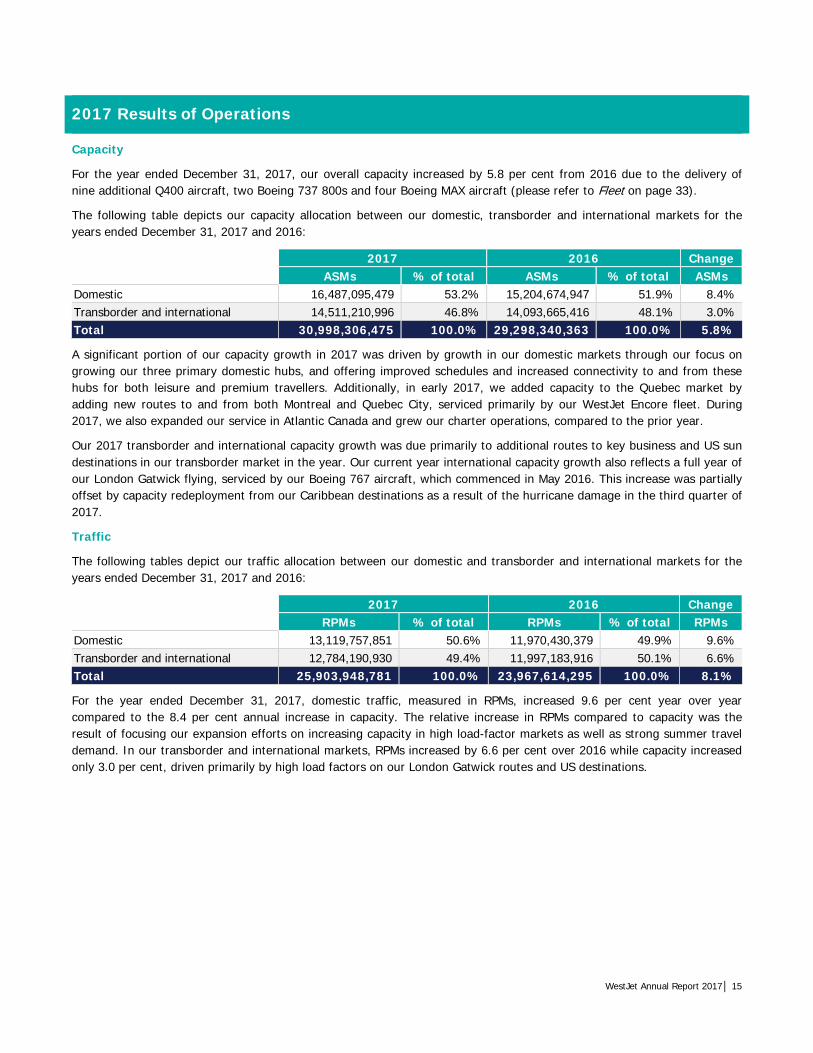
For the year ended December 31, 2017, our overall capacity increased by 5.8 per cent from 2016 due to the delivery of nine additional Q400 aircraft, two Boeing 737 800s and four Boeing MAX aircraft (please refer to Fleet on page 33).
The following table depicts our capacity allocation between our domestic, transborder and international markets for the years ended December 31, 2017 and 2016:
2017 2016 Change ASMs % of total ASMs % of total ASMs Domestic 16,487,095,479 53.2% 15,204,674,947 51.9% 8.4% Transborder and international 14,511,210,996 46.8% 14,093,665,416 48.1% 3.0% Total 30,998,306,475 100.0% 29,298,340,363 100.0% 5.8%
A significant portion of our capacity growth in 2017 was driven by growth in our domestic markets through our focus on growing our three primary domestic hubs, and offering improved schedules and increased connectivity to and from these hubs for both leisure and premium travellers. Additionally, in early 2017, we added capacity to the Quebec market by adding new routes to and from both Montreal and Quebec City, serviced primarily by our WestJet Encore fleet. During 2017, we also expanded our service in Atlantic Canada and grew our charter operations, compared to the prior year.
Our 2017 transborder and international capacity growth was due primarily to additional routes to key business and US sun destinations in our transborder market in the year. Our current year international capacity growth also reflects a full year of our London Gatwick flying, serviced by our Boeing 767 aircraft, which commenced in May 2016. This increase was partially offset by capacity redeployment from our Caribbean destinations as a result of the hurricane damage in the third quarter of 2017.
Traffic
The following tables depict our traffic allocation between our domestic and transborder and international markets for the years ended December 31, 2017 and 2016:
2017 2016 Change RPMs % of total RPMs % of total RPMs
Domestic 13,119,757,851 50.6% 11,970,430,379 49.9% 9.6% Transborder and international 12,784,190,930 49.4% 11,997,183,916 50.1% 6.6% Total 25,903,948,781 100.0% 23,967,614,295 100.0% 8.1%
For the year ended December 31, 2017, domestic traffic, measured in RPMs, increased 9.6 per cent year over year compared to the 8.4 per cent annual increase in capacity. The relative increase in RPMs compared to capacity was the result of focusing our expansion efforts on increasing capacity in high load-factor markets as well as strong summer travel demand. In our transborder and international markets, RPMs increased by 6.6 per cent over 2016 while capacity increased only 3.0 per cent, driven primarily by high load factors on our London Gatwick routes and US destinations.

WestJet Annual Report 2017 | 16
Revenue
($ in thousands, unless otherwise noted) 2017 2016 Change Guest 3,822,045 3,556,941 7.5% Other 680,275 565,918 20.2% Total revenue 4,502,320 4,122,859 9.2% Load factor 83.6% 81.8% 1.8 pts. Yield (cents) 17.38 17.20 1.0% RASM (cents) 14.52 14.07 3.2%
For the year ended December 31, 2017 total revenue increased by 9.2 per cent to $4,502.3 million compared to $4,122.9 million in 2016. The overall increase in total revenue was driven by increases in Guest revenue as well as ancillary and charter revenues, included in Other revenue. On an ASM basis, total revenue increased by 3.2 per cent to 14.52 cents, from 14.07 cents in the prior year, due to a higher load factor combined with the improved yield in 2017.
Guest revenue
Guest revenue increased $265.1 million, or 7.5 per cent during the year ended December 31, 2017 compared to the prior year, to $3,822.0 million in 2017, from $3,556.9 million in 2016, as a result of an 1.8 per cent improvement in load factors compared to the prior year, predominantly due to the London Gatwick routes, combined with a 1.0 per cent improvement in yield due to the slight recovery in fares alongside the improvement of economic conditions in Alberta as well as the strong demand in our international sun markets.
Other revenue
Included in Other revenue are amounts related to ancillary revenue, WestJet Vacations’ non-air revenue, and our cargo and our charter operations revenues. For 2017, other revenue increased by 20.2 per cent to $680.3 million from $565.9 million in 2016. This increase was driven primarily by increases in ancillary and charter revenues.
Ancillary revenue, which includes service fees, our WestJet RBC® MasterCard± program revenue and onboard sales, provides an opportunity to sell higher-margin goods and services while enhancing our overall guest experience by providing guests with additional products and services to meet their needs. The following table presents ancillary revenue and ancillary revenue on a per guest basis for the years ended December 31, 2017 and 2016:
2017 2016 Change Ancillary revenue ($ in thousands) 439,807 389,888 12.8% Ancillary revenue per guest ($) 18.99 18.01 5.4%
For the year ended December 31, 2017, ancillary revenue was $439.8 million, an increase of 12.8 per cent from $389.9 million in the same period of the prior year. This increase was the result of a seven per cent increase in scheduled guests during the year, increased fees on certain services and the continued success of our WestJet RBC® MasterCard± program.
On a per guest basis, ancillary fees for the year increased by 5.4 per cent to $18.99 per guest, from $18.01 per guest in 2016. This increase is mainly attributable to an increase in pre-reserved seating sales, increased change and cancel fees and the growth of our WestJet RBC® MasterCard± program.
WestJet Vacations continues to generate revenue, which supports WestJet’s overall network. The non-air component of this revenue, which includes hotels, attractions and car rentals, is reported on the consolidated statement of earnings at the net amount received. For the year ended December 31, 2017, WestJet Vacations’ non-air revenue component increased due to higher margins on our vacation packages. The valuation of the Canadian dollar compared to the US dollar impacts the margin of our vacation packages as the majority of the land components are paid in US dollars, which is netted against the gross revenue collected in Canadian dollars.

WestJet Annual Report 2017│ 17
Expenses
Expense ($ in thousands) CASM (cents) 2017 2016 Change 2017 2016 Change Aircraft fuel 950,043 765,867 24.0% 3.06 2.61 17.2% Salaries and benefits 935,145 854,056 9.5% 3.02 2.92 3.4% Rates and fees 644,763 617,573 4.4% 2.08 2.11 (1.4%) Depreciation and amortization 403,021 350,484 15.0% 1.30 1.20 8.3% Sales and marketing 384,452 356,745 7.8% 1.24 1.22 1.6% Maintenance 203,227 209,226 (2.9%) 0.66 0.71 (7.0%) Aircraft leasing 165,902 178,445 (7.0%) 0.54 0.61 (11.5%) Other 330,014 291,024 13.4% 1.05 0.98 7.1% Employee profit share 46,793 59,342 (21.1%) 0.16 0.21 (23.8%) Total operating expenses 4,063,360 3,682,762 10.3% 13.11 12.57 4.3% Total, excluding fuel and employee profit share 3,066,524 2,857,553 7.3% 9.89 9.75 1.4%
During the year ended December 31, 2017, operating expenses increased by 10.3 per cent to $4,063.4 million as compared to $3,682.8 million in 2016, driven by the year over year ASM growth of 5.8 per cent, as well as increased aircraft fuel expense, depreciation and amortization and other operating expenses.
On an ASM basis, operating expenses for the year ended December 31, 2017 increased by 4.3 per cent to 13.11 cents from 12.57 cents in 2016 due primarily to the increase in aircraft fuel expense.
Aircraft fuel
2017 2016 Change Aircraft fuel expense ($ in thousands) 950,043 765,867 24.0% Aircraft fuel expense as a per cent of operating expenses 23.4% 20.8% 2.6 pts. Fuel consumption (litres) 1,482,849,838 1,405,488,934 5.5% Fuel cost per litre (cents) 64 54 18.5% Average market price for jet fuel in US dollars (per barrel) 67 54 24.1% Average market price for jet fuel in Canadian dollars (per barrel) 88 72 22.2%
Fuel remains a significant cost representing 23.4 per cent of total operating expenses for the year ended December 31, 2017 (2016 – 20.8 per cent). Fuel prices continue to be volatile due to global economic and geopolitical factors which we can neither control nor accurately predict. For the year ended December 31, 2017, aircraft fuel expense increased by 24.0 per cent to $950.0 million from $765.9 million. This increase was primarily due to a year over year increase in the Canadian market price of jet fuel and a 5.5 per cent increased fuel consumption resulting from ASM growth of 5.8 per cent in the year.
Our fuel costs per litre for the year ended December 31, 2017 increased by 18.5 per cent to 64 cents per litre, from 54 cents per litre in the prior year. The average market price for jet fuel was US $67 per barrel for the year ended December 31, 2017 compared to US $54 per barrel in the same period of the prior year, an increase of approximately 24.1 per cent. The negative impact of the higher average market price of US-dollar jet fuel on a year over year basis was partially offset by the strengthening Canadian dollar as the average market price for jet fuel in Canadian dollars increased by 22.2 per cent to $88 per barrel from $72 per barrel in 2016.
For 2018, we estimate our sensitivity of fuel costs to changes in crude oil to be approximately US $9.7 million annually for every one US-dollar change per barrel of West Texas Intermediate (WTI) crude oil. Additionally, we estimate our sensitivity of fuel costs to changes in fuel pricing to be approximately $15.4 million for every one-cent change per litre of fuel. We estimate that every one-cent change in the value of the Canadian dollar versus the US dollar will have an approximate impact of $7.4 million on fuel costs.
As at December 31, 2017, we had no fuel derivative contracts outstanding. We will continue to monitor and adjust to movements in fuel prices and may re-visit our hedging strategy as changing markets and competitive conditions warrant.

WestJet Annual Report 2017 | 18
Salaries and benefits
Our compensation philosophy is designed to align corporate and personal success. We have created a compensation program whereby a portion of our expenses are variable and are tied to our financial results. Our compensation strategy encourages employees to become owners in WestJet, which creates a personal vested interest in our financial results and operational accomplishments.
($ in thousands) 2017 2016 Change
Salaries and benefits plans 819,150 743,340 10.2%
Employee share purchase plan 96,945 92,284 5.1%
Share-based payment plans 19,050 18,432 3.4%
Total salaries and benefits 935,145 854,056 9.5%
Full-time equivalent employees (FTE) 11,089 9,988 11.0%
Salaries and benefits expense for the year ended December 31, 2017 was $935.1 million, an $81.1 million or 9.5 per cent increase from $854.1 million in 2016.
Salaries and benefits plans
Compensation, including salary levels and participation in benefits plans, are determined via a framework of job levels based on internal experience and external market data. During the year ended December 31, 2017, salaries and benefits plans increased by 10.2 per cent to $819.2 million, from $743.3 million in 2016. This increase is primarily due to the 11.0 per cent increase in our total number of full-time equivalent employees to 11,089 at December 31, 2017 (December 31, 2016 – 9,988) resulting from our expanded WestJet Encore operations and additional staffing required for the new terminal at the Calgary International Airport, which opened in October 2016. In 2017, we recognized a non-recurring cumulative adjustment of approximately $6.1 million increase to expense related to the true-up of our long-term disability provision. Additionally, we also recognized a cumulative adjustment of $6.7 million relating to unaccrued statutory holiday pay for flight crew members. Of this adjustment, $2.2 million related to the prior year. In the comparative period there was also a $2.1 million one-time payment in 2016 to realign the contact centre compensation model.
Employee share purchase plan (ESPP)
The ESPP encourages employees to become owners of WestJet and provides employees with the opportunity to significantly enhance their earnings. Under the terms of the ESPP, WestJetters may, dependent on their employment agreement, contribute up to a maximum of 10 per cent, 15 per cent or 20 per cent of their gross salary to acquire voting shares of WestJet at the current fair market value. The contributions are matched by WestJet and are required to be held within the ESPP for a period of one year. At December 31, 2017, approximately 81.7 per cent of our eligible active employees participated in the ESPP, contributing an average of 14.6 per cent of their gross salaries, which remains relatively unchanged from the prior year. Under the terms of the ESPP, we acquire voting shares on behalf of employees through open market purchases. For the year ended December 31, 2017, our matching expense was $96.9 million, a 5.1 per cent increase from $92.3 million in 2016, driven largely by the 7.1 per cent increase in the number of participating employees compared to the prior year.
Share-based payment plans
We have three equity-settled share-based payment plans whereby either stock options, restricted share units (RSUs) or performance share units (PSUs) may be awarded to pilots, senior executives and certain non-executive employees. Our equity-settled share-based payments are measured at the fair value of the instrument granted and recognized as compensation expense with a corresponding increase in equity reserves on a straight-line basis over the related service period based on the number of awards expected to vest. For the year ended December 31, 2017, share-based payment expense totalled $19.1 million, representing an increase of 3.4 per cent over the $18.4 million recognized in the prior year. This increase relates primarily to an overall increased number of eligible executives receiving grants in the current year due to vacancies filled in 2017, as well as the recapture of expense in 2016, compared to 2017, related to equity forfeitures for senior employees who left WestJet in 2016. This was slightly offset by a decrease made to the estimate of the number of PSU’s that vested in 2017.

WestJet Annual Report 2017│ 19
Depreciation and amortization 2017 2016 Change
Depreciation and amortization ($ in thousands) 403,021 350,484 15.0% CASM (cents) 1.30 1.20 8.3% Total number of owned aircraft 127 112 13.4%
Depreciation and amortization expense for the year ended December 31, 2017 was $403.0 million, a $52.5 million or 15.0 per cent increase from $350.5 million in 2016. Depreciation and amortization expense per ASM was 1.30 cents in 2017, representing an 8.3 per cent increase from 1.20 cents in the prior year. This year over year increase was driven by the overall growth in our fleet, the changing fleet mix resulting from the acquisition of Boeing 737-800 NG and Boeing MAX aircraft.
Maintenance
Maintenance expense is comprised of technical maintenance which represents costs incurred for maintenance on our aircraft fleet and a maintenance provision which represents our estimate of future obligations to meet the lease return conditions specified in our lease agreements.
Expense ($ in thousands) CASM (cents) 2017 2016 Change 2017 2016 Change Technical maintenance 141,561 128,766 9.9% 0.46 0.44 4.5% Maintenance provision 61,666 80,460 (23.4%) 0.20 0.27 (25.9%) Total maintenance 203,227 209,226 (2.9%) 0.66 0.71 (7.0%)
Maintenance expense for the year ended December 31, 2017 was $203.2 million, which represents a $6.0 million or 2.9 per cent decrease from $209.2 million in 2016. Our maintenance cost per ASM was 0.66 cents in 2017, representing a decrease of 7.0 per cent from 0.71 cents in the prior year.
Technical maintenance expense for the year ended December 31, 2017 was $141.6 million, a $12.8 million or 9.9 per cent increase from $128.8 million in 2016. This translated to an increase of 4.5 per cent on a per ASM basis, increasing to 0.46 cents per ASM in 2017, compared to 0.44 cents in 2016. These year over year increases are attributable to our diversified, aging and growing fleet where we have performed more maintenance events compared to the prior year.
Maintenance provision expense for the year ended December 31, 2017 was $61.7 million, an $18.8 million or 23.4 per cent decrease from $80.5 million in 2016. Maintenance provision expense on a per ASM basis was 0.20 cents in 2017, a decrease of 25.9 per cent from 0.27 cents in 2016. These year over year decreases were driven by our updated assumptions regarding the anticipated timing of lease returns and changes in the timing and scope of maintenance activities on leased aircraft, resulting in a lower maintenance rate per cycle relative to the prior year. Additionally, we recognized a recovery in the fourth quarter of 2017 related to previously written-off maintenance reserve assets totaling $3.3 million, further reducing the current period maintenance provision expense. The impact of these adjustments was partially offset by a cumulative catch-up entry of $18.5 million recorded in the first quarter of 2017 to adjust our maintenance provision liability for changes in the estimated timing and scope of maintenance activities for our leased aircraft. Our provision is calculated based on the best information available to us and includes estimates of the cost and timing of future maintenance activities on leased aircraft.
Other operating expenses
The following table provides a breakdown of the more significant items included in other operating expenses:
Expense ($ in thousands) CASM (cents) 2017 2016 Change 2017 2016 Change Travel and training 120,021 103,670 15.8% 0.39 0.35 11.4% Technical support 51,572 45,152 14.2% 0.16 0.15 6.7% General and administrative 88,380 83,092 6.4% 0.28 0.28 0% Remaining other operating expenses 70,041 59,110 18.5% 0.22 0.20 10.0% Total other operating expenses 330,014 291,024 13.4% 1.05 0.98 7.1%
Other operating expenses for the year ended December 31, 2017 was $330.0 million, a $39.0 million or 13.4 per cent increase from $291.0 million for the same period in 2016. Other operating expenses per ASM was 1.05 cents for the year ended

WestJet Annual Report 2017 | 20
December 31, 2017, an increase of 7.1 per cent from 0.98 cents in the same period of 2016. These increases were primarily driven by higher travel and training expenses and costs incurred in relation to irregular flight operations.
For the year ended December 31, 2017, travel and training expense was $120.0 million, a $16.4 million or 15.8 per cent increase from $103.7 million in the prior year, due to an increase in crew travel costs resulting from increased transborder flying, increased training expenses related to our expanded WestJet Encore operations and transborder flying.
Remaining other operating expenses were $70.0 million, a $10.9 million or 18.5 per cent increase from $59.1 million in the prior year, primarily due to the increase in costs associated with irregular flight operations of $7.2 million or 33.5 percent, resulting from an increased number of flight delays and cancellations related to severe weather events during the the third and fourth quarters of 2017 which were impacted by the hurricane activity throughout the Caribbean region and severe winter storms across Canada during the holiday travel period.
Employee profit share
All employees are eligible to participate in the employee profit sharing plan. As the profit share system is a variable cost, employees receive larger awards when we are more profitable. Conversely, the amount distributed to employees is reduced in less profitable periods. Our employee profit share expense for the year ended December 31, 2017, was $46.8 million, representing a 21.1 per cent decrease from $59.3 million in the prior year. This year-over-year decrease is directly attributable to lower earnings eligible for profit share and operating margin percentage in 2017.
Foreign exchange
The gain or loss on foreign exchange included in our consolidated statement of earnings is mainly attributable to the effect of the changes in the value of our US-dollar-denominated net monetary assets and liabilities. Monetary assets consist mainly of US dollar cash and cash equivalents and marketable securities, accounts receivable, security deposits on leased aircraft, and maintenance reserves paid to lessors, offset by monetary liabilities of US dollar accounts payable and accrued liabilities and maintenance provisions. As part of our Foreign Currency Risk Management Policy we hold US-dollar-denominated cash and short-term investments and enter into US dollar foreign exchange forward contracts to mitigate a portion of the foreign currency exposure risk we experience on our balance sheet, operating margins and cash flows.
At December 31, 2017, US-dollar-denominated net monetary assets totalled approximately US $61.6 million compared to monetary liabilities of US $19.4 million at December 31, 2016. The movement to a net US-dollar-denominated monetary asset position from the net US-dollar-denominated monetary liability position in the prior year is largely due to an increase in US dollar short-term investments and marketable securities and a decrease in our US-dollar-denominated accounts payable balances. We reported a foreign exchange loss of $4.9 million for the year ended December 31, 2017 on the revaluation of our US-dollar-denominated monetary assets and liabilities (December 31, 2016 – gain of $7.4 million).
We periodically use financial derivatives to manage our exposure to foreign exchange risk. At December 31, 2017, to fix the exchange rate on a portion of our US-dollar-denominated hotel costs and aircraft lease payments, we have foreign exchange forward contracts for an average of US $19.0 million per month for the period of January 2018 to December 2018, for a total of US $228.2 million, at a weighted average contract price of 1.2745 Canadian dollars to one US dollar.
We have designated certain contracts under our foreign exchange hedging program for cash flow hedge accounting, while other contracts do not qualify for hedge accounting. Under cash flow hedge accounting, the effective portion of the change in the fair value of the hedging instrument is recognized in hedge reserves, while any ineffective portion is recorded directly to net earnings as a non-operating gain or loss. Upon maturity of the derivative instrument, the effective gains and losses previously recognized in hedge reserves are recorded in net earnings as a component of the expenditure to which they relate. Those contracts not designated under cash flow hedge accounting have the change in fair value recorded directly in net earnings as a non-operating gain or loss. The fair value of the foreign exchange forward contracts presented on the consolidated statement of financial position is measured based on the difference between the contracted rate and the current forward price obtained from the counterparty, which can be observed and corroborated in the marketplace.
The following table presents the financial impact and statement presentation of our foreign exchange derivatives related to our US-dollar-denominated hotel costs and aircraft lease payments on the consolidated statement of financial position at December 31, 2017 and December 31, 2016 and on the consolidated statement of earnings for the years ended December 31, 2017 and 2016.

WestJet Annual Report 2017│ 21
($ in thousands) Statement presentation 2017 2016 Statement of Financial Position:
Fair value Prepaid expenses, deposits and other 820 7,725 Fair value Accounts payable and accrued liabilities (5,345) (1,191) Unrealized gain/(loss) Hedge reserves (before tax) (4,305) 2,476
($ in thousands) Statement presentation 2017 2016 Statement of Earnings:
Realized gain/(loss) Aircraft leasing (2,182) 5,534 Realized loss Other revenue (5,816) (500) Realized and unrealized gain/(loss) Gain (loss) on derivatives (2,426) 4,504
Additionally, we entered into fixed US dollar to fixed Canadian dollar uncollateralized cross-currency interest rate swap agreements (the cross-currency swaps) to mitigate our exposure to fluctuations in the Canadian to US dollar exchange rate on interest payments on the US-dollar-denominated notes (please refer to the section called Capital Resources found on page 31 of this MD&A). The cross-currency swap terms are from June 16, 2016 to June 16, 2021, which matches the 5-year maturity of the US-Dollar Notes. We designated the cross-currency swap contracts as effective cash flow hedges for accounting purposes. The fair values of the cross-currency swap contracts were determined by discounting future cash flows over the remaining term of the swaps at market rates of interest and quoted foreign exchange rates.
The following table presents the financial impact and statement presentation of the cross-currency swaps on the consolidated statement of financial position at December 31, 2017 and December 31, 2016 and on the consolidated statement of earnings for the years ended December 31, 2017 and 2016.
($ in thousands) Statement presentation 2017 2016 Statement of Financial Position:
Fair value Prepaid expenses, deposits and other - 601 Fair value Accounts payable and accrued liabilities (560) - Fair value Other assets - 14,557 Fair value Other liabilities (8,749) - Unrealized gain/(loss) Hedge reserves (before tax) (9,309) 15,158
($ in thousands) Statement presentation 2017 2016 Statement of Earnings:
Realized gain Finance costs 56 234
For 2018, we estimate that every one-cent change in the value of the Canadian dollar versus the US dollar would have an approximate impact of $11.1 million on our annual unhedged operating costs (approximately $7.4 million for fuel expense and $3.7 million related to other US-dollar-denominated operating expenses).
We also have a significant amount of our future purchase obligations, including certain aircraft, exposed to foreign exchange risk. At December 31, 2017, we estimate that every one-cent change in the value of the Canadian dollar versus the US dollar would have an approximate impact of $37.6 million on our future US-dollar-denominated purchase obligations.
Income taxes
Our effective consolidated income tax rate for the three and twelve months ended December 31, 2017 was 34.0 per cent and 29.8 per cent respectively, as compared to 29.0 per cent for the same periods in 2016. The year over year increase in our effective rate for both the three and twelve months ended December 31, 2017, was primarily due to a one per cent increase to the general corporate income tax rate in British Columbia to 12 per cent, from 11 per cent. The rate change, effective January 1, 2018, resulted in an increase to deferred income taxes of $2.1 million in 2017. Additionally, year over year increases in 2017, compared to 2016, were also due to an increase in non-deductible expenses recognized in the year.
For 2018, we anticipate that our annual effective tax rate will fall within in the range of 28.5 to 30.5 per cent.

WestJet Annual Report 2017 | 22
2017 Fourth Quarter Results of Operations
Our 2017 fourth quarter financial results represent our 51st consecutive quarter of reported profitability with net earnings of $48.5 million and diluted earnings per share of $0.42 representing year over year declines of 12.2 per cent and 10.6 per cent, respectively. During the quarter, our revenue increased by 9.8 per cent, as compared to the fourth quarter of 2016, driven by increases to both guest revenue, ancillary and charter revenues. RASM increased 4.0 per cent year over year, due to the deployment of increased capacity to high load factor markets.
Fourth quarter overview
• Recognized total revenue of $1,117.4 million, an increase of 9.8 per cent from $1,017.8 million in the fourth quarter of 2016.
• Increased capacity, measured in ASMs, by 5.6 per cent over the fourth quarter of 2016.
• Increased traffic, measured in RPMs, by 8.8 per cent over the fourth quarter of 2016.
• Realized yield of 17.66 cents, up 0.9 per cent from 17.50 cents in the fourth quarter of 2016.
• Realized RASM of 14.59 cents, up 4.0 per cent from 14.03 cents in the fourth quarter of 2016.
• Realized CASM of 13.57 cents, up 5.5 per cent from 12.86 cents in the fourth quarter of 2016.
• Realized CASM, excluding fuel and employee profit share, of 10.23 cents, up 3.6 per cent from 9.87 cents in the fourth quarter of 2016.
• Recorded an operating margin of 7.0 per cent, down 1.4 percentage points from 8.4 per cent in the fourth quarter of 2016.
• Recorded an EBT margin of 6.6 per cent, down 1.0 percentage points from 7.6 per cent in the fourth quarter of 2016.
• Realized net earnings of $48.5 million, a decrease of 12.2 per cent from $55.2 million in the fourth quarter of 2016.
• Reported diluted earnings per share of $0.42, down 10.6 per cent from $0.47 in the fourth quarter of 2016.
Please refer to page 59 of this MD&A for a reconciliation of non-GAAP measures and additional GAAP measures.

WestJet Annual Report 2017│ 23
The following table presents our fourth quarter 2017 and 2016 financial and operational summary:
Three months ended December 31 ($ in thousands, unless otherwise noted) 2017 2016 Change
Fina
ncia
l hig
hlig
hts
Revenue 1,117,435 1,017,759 9.8% Operating expenses 1,039,391 932,492 11.5% Earnings from operations 78,044 85,267 (8.5%) Operating margin (per cent)(i) 7.0% 8.4% (1.4 pts.) Earnings before tax 73,478 77,762 (5.5%) EBT margin (per cent)(i) 6.6% 7.6% (1.0 pts.) Net earnings 48,474 55,189 (12.2%) Earnings per share: Basic 0.42 0.47 (10.6%) Diluted 0.42 0.47 (10.6%) Cash dividends declared per share 0.14 0.14 -
Ope
rati
onal
hig
hlig
hts
ASMs 7,658,815,460 7,253,281,603 5.6% RPMs 6,329,077,433 5,815,978,702 8.8% Load factor 82.6% 80.2% 2.4 pts. Yield (cents) 17.66 17.50 0.9% RASM (cents) 14.59 14.03 4.0% CASM (cents) 13.57 12.86 5.5% CASM, excluding fuel and employee profit share (cents)(i) 10.23 9.87 3.6%
Fuel consumption (litres) 366,078,926 348,899,256 4.9% Fuel costs per litre (cents) 69 60 15.0% Segment guests 6,010,069 5,424,052 10.8% Average stage length (miles) 880 895 (1.7%) Departures 63,111 57,658 9.5% Utilization (hours) 10.9 11.2 (2.7%) Full-time equivalent employees at period end 11,089 9,988 11.0%
(i) Please refer to page 57 and 59 of this MD&A for definitions of key operating indicators and a reconciliation of the non-GAAP measures and additional GAAP measures.

WestJet Annual Report 2017 | 24
Capacity
For the three months ended December 31, 2017, our overall capacity increased by 5.6 per cent over the same period in 2016, due primarily to the delivery of two Boeing 737-800 NG aircraft, two Boeing Max aircraft and a single Q400 in the final quarter of 2017.
The following tables depict our capacity allocation between our domestic, transborder and international markets for the three months ended December 31, 2017:
Three months ended December 31 2017 2016 Change ASMs % of total ASMs % of total ASMs Domestic 3,746,812,395 48.9% 3,476,092,824 47.9% 7.8% Transborder and international 3,912,003,065 51.1% 3,777,188,779 52.1% 3.6%
Total 7,658,815,460 100.0% 7,253,281,603 100.0% 5.6%
Consistent with the annual capacity growth trends, the majority of system growth in the fourth quarter of 2017 is the result of capacity growth in our domestic markets as a result of increased frequency of flights from our main domestic hubs to improve schedule flexibility and connectivity across the network.
For the three months ended December 31, 2017, transborder and international capacity growth was due to additional capacity added to key transborder business routes, as well as the addition of certain new transborder routes, offset slightly by capacity reductions in certain Caribbean destinations as a result of damage to infrastructure caused by hurricane activity at the end of the third quarter of 2017.
Traffic
The following tables depict our traffic allocation between our domestic and transborder and international markets for the three months ended December 31, 2017:
Three months ended December 31 2017 2016 Change RPMs % of total RPMs % of total RPMs
Domestic 2,949,514,694 46.6% 2,658,583,900 45.7% 10.9% Transborder and international 3,379,562,739 53.4% 3,157,394,802 54.3% 7.0% Total 6,329,077,433 100.0% 5,815,978,702 100.0% 8.8%
For the three months ended December 31, 2017, demand outpaced capacity growth across our network, with WestJet flying record numbers of guests in each month of the quarter, resulting in improved load factors in both our domestic and transborder and international markets above the prior year. Notable improvements in load factors were observed in both the transborder business and transborder sun destinations, as well as maintaining load factor growth in our international markets, despite capacity reductions throughout the Caribbean, including on our London Gatwick routes which have continued to experience increased demand.
Revenue
Three months ended December 31 ($ in thousands) 2017 2016 Change Guest 941,602 867,990 8.5% Other 175,833 149,769 17.4% Total revenue 1,117,435 1,017,759 9.8% Load factor 82.6% 80.2% 2.4 pts. Yield (cents) 17.66 17.50 0.9% RASM (cents) 14.59 14.03 4.0%

WestJet Annual Report 2017│ 25
During the fourth quarter of 2017, total revenue increased by 9.8 per cent to $1,117.4 million compared to $1,017.8 million in the same quarter of 2016. The year over year increase in revenue is due to an increase in guest revenue resulting from an improved load factor across our network and increased ancillary and charter revenues. For the three months ended December 31, 2017, revenue on an ASM basis increased by 4.0 per cent to 14.59 cents from 14.03 cents in the same quarter of 2016 due to an increase in load factor combined with a slight improvement in yield as fares have risen in line with the strengthening of economic conditions in certain markets.
Guest revenue
Guest revenue increased by 8.5 per cent to $941.6 million in the fourth quarter of 2017, from $868.0 million in the same period of the prior year as a result of an improved load factor combined with the higher yield observed throughout the period.
Other revenue
Other revenue increased by 17.4 per cent to $175.8 million for the fourth quarter of 2017, from $149.8 million in the same period of the prior year. This increase was driven mainly by an increase in ancillary revenue and expansion of our charter program. The following table presents ancillary revenue and ancillary revenue on a per guest basis for the three months ended December 31, 2017:
Three months ended December 31 2017 2016 Change Ancillary revenue ($ in thousands) 110,286 95,003 16.1% Ancillary revenue per guest ($) 19.11 18.04 5.9%
For the three months ended December 31, 2017 ancillary revenue was $110.3 million, an increase of 16.1 per cent from $95.0 million in the same quarter of 2016. This increase was driven by an increase in scheduled guests flown in the period and increased fees for certain services, such as change and cancellation fees.
On a per guest basis, ancillary fees for the quarter increased by 5.9 per cent to $19.11 per guest, from $18.04 per guest during the fourth quarter of 2016. The increase to ancillary revenue was primarily due the increased change and cancellation fees, pre-reserved seating, sales of Plus upgrades and the continued growth of our WestJet RBC® MasterCard± program.
Expenses
Expense ($ in thousands) CASM (cents) Three months ended Dec 31 Three months ended Dec 31 2017 2016 Change 2017 2016 Change Aircraft fuel 251,619 210,489 19.5% 3.29 2.90 13.4% Salaries and benefits 244,324 204,679 19.4% 3.19 2.82 13.1% Rates and fees 156,214 150,770 3.6% 2.04 2.08 (1.9%) Depreciation and amortization 105,537 93,722 12.6% 1.38 1.29 7.0% Sales and marketing 100,121 91,521 9.4% 1.31 1.26 4.0% Maintenance 42,440 54,985 (22.8%) 0.55 0.76 (27.6%) Aircraft leasing 40,925 41,987 (2.5%) 0.53 0.58 (8.6%) Other 93,810 77,885 20.4% 1.23 1.08 13.9% Employee profit share 4,401 6,454 (31.8%) 0.05 0.09 (44.4%) Total operating expenses 1,039,391 932,492 11.5% 13.57 12.86 5.5% Total, excluding fuel and employee profit share 783,371 715,549 9.5% 10.23 9.87 3.6%
During the three months ended December 31, 2017, operating expenses increased by 11.5 per cent compared to the same period in 2016, driven by our ASM growth of 5.6 per cent and increased aircraft fuel expense, salaries and benefits expense, depreciation and amortization expense and other operating expenses, partially offset by lower maintenance expense.
On an ASM basis, operating expenses increased by 5.5 per cent to 13.57 cents from 12.86 cents in the same period in 2016. This increase was primarily driven by increased aircraft fuel expense, salaries and benefits expense and depreciation and amortization expense, partially offset by the decrease in maintenance expense.

WestJet Annual Report 2017 | 26
Aircraft fuel
Three months ended December 31 2017 2016 Change Aircraft fuel expense ($ in thousands) 251,619 210,489 19.5% Aircraft fuel expense as a per cent of operating expenses 24.2 22.6% 1.6 pts. Fuel consumption (litres) 366,078,926 348,899,256 4.9% Fuel cost per litre (cents) 69 60 15.0% Average market price for jet fuel in US dollars (per barrel) 76 60 26.7% Average market price for jet fuel in Canadian dollars (per barrel) 96 81 18.5%
Fuel remains a significant cost representing 24.2 per cent of total operating expenses for the three months ended December 31, 2017 (three months ended December 31, 2016 – 22.6 per cent). For the three months ended December 31, 2017, aircraft fuel expense increased by 19.5 per cent to $251.6 million from $210.5 million primarily due to increased fuel consumption combined with an increase in the Canadian dollar market price for jet fuel.
Our fuel costs per litre for the three months ended December 31, 2017 increased by 15.0 per cent to 69 cents per litre, which was outside of our previously disclosed guidance of between 64 and 66 cents per litre, which was based on a forecasted jet fuel price of US $71 per barrel. On average, the market price for jet fuel was US $76 per barrel in the fourth quarter of 2017 versus US $60 per barrel in the fourth quarter of 2016, an increase of approximately 26.7 per cent. In Canadian dollars, the market price for jet fuel was $96 per barrel in the fourth quarter of 2017 as compared to $81 per barrel in 2016. The additional fuel costs were the result of the increased market price of Canadian dollar jet fuel on a year over year basis.
Salaries and benefits
2017 2016 Change Salaries and benefits ($ in thousands) 244,324 204,679 19.4% CASM (cents) 3.19 2.82 13.1%
For the three months ended December 31, 2017, salaries and benefits expense increased by 19.4 per cent to $244.3 million, from $204.7 million in 2016. Salaries and benefits expense per ASM was 3.19 cents in the fourth quarter of 2017, representing a 13.1 per cent increase from 2.82 cents in the same period of the prior year. The increase is primarily due to the increase in the number of full-time equivalent employees relative to the prior year period. Additionally, in the fourth quarter of 2017, we recognized a non-recurring cumulative adjustment of approximately $6.1 million increase to expense related to the true-up of our long-term disability provision and a $6.7 million cumulative adjustment for unaccrued statutory holiday pay for flight crew members. Of this adjustment, $2.2 million related to the prior year.
Depreciation and amortization
Three months ended December 31 2017 2016 Change Depreciation and amortization ($ in thousands) 105,537 93,722 12.6% CASM (cents) 1.38 1.29 7.0% Total number of owned aircraft 127 112 13.4%
Depreciation and amortization expense for the three months ended December 31, 2017 was $105.5 million, an $11.8 million or 12.6 per cent increase from $93.7 million in the comparable period of 2016. Depreciation and amortization expense per ASM was 1.38 cents in the fourth quarter of 2017, representing a 7.0 per cent increase from 1.29 cents in the same period of the prior year. These year over year increases are due to the overall growth in our fleet and the changing fleet mix.

WestJet Annual Report 2017│ 27
Maintenance
Maintenance expense is comprised of technical maintenance which represents costs incurred for maintenance on our aircraft fleet and a maintenance provision which represents our estimate of future obligations to meet the lease return conditions specified in our lease agreements.
Expense ($ in thousands) CASM (cents) 2017 2016 Change 2017 2016 Change Technical maintenance 36,679 33,315 10.1% 0.48 0.46 4.3% Maintenance provision 5,761 21,670 (73.4%) 0.07 0.30 (76.7%) Total maintenance 42,440 54,985 (22.8%) 0.55 0.76 (27.6%)
Maintenance expense for the three months ended December 31, 2017 was $42.4 million, which represents a $12.5 million or 22.8 per cent decrease from $55.0 million in 2016. Our maintenance cost per ASM was 0.55 cents in 2017, representing a decrease of 27.6 per cent from 0.76 cents in the prior year. The year over year decrease in total maintenance expense was driven by the $15.9 million or 73.4 per cent decrease in maintenance provision expense, from $21.7 million in the 2016 period, to $5.8 million in 2017. The decrease in maintenance provision expense compared to the fourth quarter of the prior year was driven by our updated assumptions regarding the anticipated timing of lease returns and changes in the timing and scope of maintenance activities resulting in a lower maintenance rate per cycle relative to the prior year. Additionally, we recognized a recovery in the fourth quarter of 2017 related to previously written-off maintenance reserve assets totaling $3.3 million, further reducing the current period maintenance provision expense.
Other operating expenses
The following table provides a breakdown of the more significant items included in other operating expenses:
Expense ($ in thousands) CASM (cents) 2017 2016 Change 2017 2016 Change Travel and training 30,123 27,090 11.2% 0.39 0.38 2.6% Technical support 14,917 12,644 18.0% 0.19 0.17 11.8% General and administrative 28,109 21,026 33.7% 0.37 0.29 27.6% Remaining other operating expenses 20,661 17,125 20.6% 0.28 0.24 16.7% Total other operating expenses 93,810 77,885 20.4% 1.23 1.08 13.9%
For the three months ended December 31, 2017, other operating expense was $93.8 million, a $15.9 million or 20.4 per cent increase from $77.9 million for the same period in 2016. Other operating expense per ASM was 1.23 cents for the three months ended December 31, 2017, an increase of 13.9 per cent from 1.08 cents in the same period of 2016. These increases were primarily driven by higher general and administrative expenses and costs incurred in relation to irregular flight operations during the period.
For the three months ended December 31, 2017, general and administrative expense was $28.1 million, a $7.1 million or 33.7 per cent increase from $21.0 million in the prior year, primarily due to an increase in expenses related to the formation of Swoop and other ongoing projects.

WestJet Annual Report 2017 | 28
Summary of Quarterly Results
Three months ended
($ in thousands, except per share data) Dec. 31
2017 Sep. 30
2017 Jun. 30 2017
Mar. 31 2017
Total revenue 1,117,435 1,215,586 1,055,026 1,114,272 Net earnings 48,474 138,427 48,367 48,310 Basic earnings per share 0.42 1.19 0.41 0.41 Diluted earnings per share 0.42 1.18 0.41 0.41
Three months ended
($ in thousands, except per share data) Dec. 31
2016 Sep. 30
2016 Jun. 30 2016
Mar. 31 2016
Total revenue 1,017,759 1,124,342 949,313 1,031,444 Net earnings 55,189 115,971 36,654 87,644 Basic earnings per share 0.47 0.97 0.30 0.71 Diluted earnings per share 0.47 0.97 0.30 0.71
Our business is seasonal in nature with varying levels of activity throughout the year. We experience increased domestic travel in the summer months (second and third quarters) and more demand for transborder and international sun destinations over the winter period (fourth and first quarters). Our operating results could also vary from this trend as a result of changes in general economic conditions and consumer behaviour, among other things.
With our transborder and international destinations, we have been able to partially alleviate the effects of seasonality on our net earnings.
Compared to our historic earnings trends, net earnings and earnings per share amounts were impacted in the first quarter of 2017 by a cumulative catch-up adjustment to maintenance expense of $18.5 million as well as $7.0 million in costs relating to irregular operations due to severe weather conditions throughout that quarter.
Additionally, the 2017 fourth quarter results were impacted by a non-recurring cumulative adjustment to salaries and benefits expense of $6.1 million related to the true-up of our long-term disability provision, increased consulting and professional fees, costs incurred for irregular operations during the peak holiday travel period and the increase in the price of aircraft fuel.
Guest Experience
At WestJet, we are focused on meeting the needs of our guests while maintaining the highest safety standards. We are committed to delivering a positive guest experience at every stage of our service, from the time the flight is booked to its completion. Key performance indicators
On-time performance, indicating the percentage of flights that arrive within 15 minutes of their scheduled time, is a key factor in measuring the quality of our guest experience. The completion rate indicator represents the percentage of flights completed of the flights originally scheduled. Our bag ratio represents the number of delayed, lost, damaged or pilfered baggage claims made per 1,000 guests.
Three months ended December 31 Twelve months ended December 31 2017 2016 Change 2017 2016 Change
On-time performance 73.5% 77.2% (3.7 pts.) 77.6% 82.7% (5.1 pts.) Completion rate 98.3% 98.0% 0.3 pts. 98.0% 98.2% (0.2 pts.) Bag ratio 5.14 4.54 13.2% 4.59 4.06 13.1%

WestJet Annual Report 2017│ 29
For the three and twelve months ended December 31, 2017, our on-time performance decreased by 3.7 and 5.1 percentage points, respectively, compared to the same periods of 2016. These decreases were the direct result of operational issues, such as an increased number of departure delays and cancellations, resulting from severe weather conditions within each quarter of the year, namely the increased hurricane activity within the third quarter of 2017, as well as the winter storms across Canada during the peak holiday travel period in the fourth quarter. On-time performance in the year was also impacted by the delays caused by runway construction at Toronto Pearson during May 2017. Additionally, in November 2017 we transitioned to our new catering service provider and flight delays were encountered during the period of transition.
Our completion rate for the three months ended December 31, 2017 of 98.3 per cent remained relatively consistent with the prior year period. The slight improvement in completion rate was due to our 99.5% completion rate in October 2017, which represents our strongest monthly completion rate in over two years. The impact of this improvement was largely offset by the increased number of cancellations caused by winter storms during the peak holiday travelling period in the final month of 2017. The completion rate for full year 2017 of 98.0 per cent decreased slightly, from 98.2 per cent for the full year 2016, primarily as a result the severe weather conditions throughout the year.
The deterioration of our bag ratio of slightly more than 13.0 per cent, year over year, for both the three and twelve months ended December 31, 2017 compared to the same periods of 2016, was primarily due to technical problems with the baggage system at Toronto Pearson which resulted in significant baggage loading delays. As a result of ongoing operational issues, in November 2017, WestJet assumed certain aspects of ground handling services at Toronto Pearson from our existing contractor to improve guest satisfaction with baggage delivery times, reduce the number of mishandled bags and reduce flight delays caused by issues with connecting luggage. A baggage system malfunction at Calgary International Airport in December 2017 also resulted in a notable impact to the bag ratio for the three months ended December 31, 2017 compared to the same period in 2016.
Liquidity and Capital Resources
Liquidity The airline industry is highly sensitive to unpredictable circumstances and, as such, maintaining a strong financial position is imperative to an airline’s success. Our consistent and strong financial results enable us to maintain a strong financial position. We completed the fourth quarter of 2017 with a cash, cash equivalents and marketable securities balance of $1,373.2 million, compared to $1,520.8 million at December 31, 2016. The decrease in our cash position was the result of drawing on the proceeds of financing obtained in the prior year for current year capital spending programs. Through our revenue generating and cost saving initiatives, we expect to be able to generate sufficient cash in both the short and long-term to maintain our current capacity and fund our future planned growth.
We use our working capital to settle our operating expenses and settlements of the current portion of long-term debt. Our current ratio, defined as current assets over current liabilities, was 1.04 at December 31, 2017 as compared to 1.21 at December 31, 2016, a decrease of 14 per cent due primarily to decreases in our cash, cash equivalents and marketable securities, and increased liabilities related to advanced ticket sales and our deferred rewards program. Part of our cash, cash equivalents and marketable securities balance relates to cash collected with respect to advance ticket sales, for which the balance at December 31, 2017, was $695.1 million, an increase of 10.9 per cent from $626.6 million at December 31, 2016. We have cash, cash equivalents and marketable securities on hand to have sufficient liquidity to meet our liabilities, when due, under both normal and stressed conditions. At December 31, 2017, we had cash on hand of 1.98 (December 31, 2016 – 2.43) times our advance ticket sales balance.

WestJet Annual Report 2017 | 30
We monitor capital on a number of measures, including the following ratios:
December 31
2017 December 31
2016 Change
Cash to trailing 12 months revenue (TTM)(i)(ii) 30.5% 36.9% (6.4 pts.) Adjusted debt-to-equity(i) 1.49 1.63 (8.6%) Adjusted net debt to EBITDAR(i) 1.89 1.93 (2.1%)
(i) Please refer to page 59 of this MD&A for a reconciliation of non-GAAP and additional GAAP measures. (ii) In addition to our cash, cash equivalents and marketable securities, as of December 31, 2017, we have available our entire $300.0 million revolving credit
facility that expires in June 2020 (please refer to the section Capital Resources found on page 31 of this MD&A).
As of December 31, 2017, our cash to TTM revenue ratio was 30.5 per cent, compared to 36.9 per cent at December 31, 2016, which is within our internal guideline of approximately 30 per cent. The decrease of 6.4 percentage points is due to the continued drawdown of available cash, cash equivalents and marketable securities balances to finance aircraft deliveries in the year. Additionally, in 2016 we received the proceeds of borrowings from the non-revolving, unsecured credit facility in January 2016 and the US-Dollar Notes issuance in June 2016, which resulted in an increase to the available cash balance as at December 31, 2016. In addition to our cash, cash equivalents and marketable securities, as of December 31, 2017 we have available $300.0 million as the undrawn portion of our revolving credit facility (please refer to the section called Capital Resources found on page 31 of this MD&A).
At December 31, 2017 our adjusted debt-to-equity ratio of 1.49 and our adjusted net debt to EBITDAR ratio of 1.89 both decreased from 1.63 and 1.93, respectively, at December 31, 2016, as a result of the 2016 borrowings discussed above. These ratios are well below our internal guideline of no more than 2.5.
Select cash flow information
($ in thousands) 2017 2016 Change Cash provided by operating activities 1,012,073 704,587 307,486 Less:
Cash used by investing activities (1,167,715) (942,342) (225,373) Cash provided (used) by financing activities (200,441) 578,331 (778,772)
Cash flow from operating, investing and financing activities (356,083) 340,576 (696,659) Effect of foreign exchange on cash and cash equivalents (17,663) (3,551) (14,112) Net change in cash and cash equivalents (373,746) 337,025 (710,771) Cash and cash equivalents, beginning of period 1,520,822 1,183,797 337,025 Cash and cash equivalents, end of period 1,147,076 1,520,822 (373,746)
Operating cash flows
For the year ended December 31, 2017, our cash provided by operating activities increased 43.6 per cent to $1,012.1 million compared to $704.6 million in the prior year. Similarly, on a diluted per share basis, for the year ended December 31, 2017, our cash flow from operations increased 47.6 per cent to $8.62 per diluted share compared to $5.84 per diluted share in the prior year (please refer to page 59 of this MD&A for a reconciliation of non-GAAP and additional GAAP measures). These year over year increases were primarily the result of higher earnings after adjustment for non-cash items and positive contributions from working capital.
At December 31, 2017, restricted cash consisted of $76.4 million (December 31, 2016 – $70.1 million) for cash held in trust by WestJet Vacations; $32.2 million (December 31, 2016 – $31.0 million) for security on letters of guarantee; and, in accordance with US regulatory requirements, $1.1 million (December 31, 2016 – $1.6 million) for cash not yet remitted for passenger facility charges. Restricted cash related to WestJet Vacations increased during the year due to increased vacation package sales to guests in Ontario, whereby regulations require us to hold the cost of the vacation package in trust until the guest departs. Additionally, for certain foreign jurisdictions, we are required to hold letters of guarantee for certain guest ticket taxes, which have increased significantly in the year due to our expanded international operations. The letters of guarantee were issued under our revolving letter of credit facility by assigning restricted cash.

WestJet Annual Report 2017│ 31
Investing cash flows
For the year ended December 31, 2017, cash flow used by investing activities totalled $1,167.8 million compared to $942.3 million in the prior year. Our investing activities during 2017 related primarily to the delivery of two Boeing 737 NG aircraft, nine Q400 aircraft, four Boeing MAX aircraft, additional deposits for future Boeing MAX aircraft and Boeing 787-9, overhauls of owned engines, as well as the Boeing 737-700 seat reconfiguration project. Additionally, a portion of our available cash was used to purchase $231.3 million in short-term marketable securities that mature within the next 12 months.
Financing cash flows
For the year ended December 31, 2017, our cash used by financing activities totalled $200.4 million, as compared to cash provided by financing activities of $578.3 million in the prior year. Our financing cash inflows in the prior year resulted primarily from the receipt of proceeds from our unsecured, non-revolving credit facility in January 2016 and the issuance of our US-Dollar Notes in June 2016.
For the year ended December 31, 2017, net cash outflow relating to financing activities was comprised of debt repayments of principal and interest of $217.4 million, share repurchases pursuant to our normal course issuer bid of $90.3 million and dividends paid of $64.9 million, partially offset by additional debt related to the financing of new aircraft of $186.8 million.
Free cash flow
Free cash flow is a non-GAAP measure that represents the cash that a company is able to generate after meeting its requirements to maintain or expand its asset base. It is a calculation of operating cash flow, less the amount of cash used in investing activities related to property and equipment. Our free cash flow for the year ended December 31, 2017, was positive $77.0 million compared to negative $237.8 million in the prior year. On a per share basis, this equated to positive $0.66 per share for the year ended December 31, 2017, compared to negative $1.97 per share in the prior year. This improvement is the result of increased cash flow from operating activities year over year due primarily to higher earnings after adjustment for non-cash items and positive contributions from working capital.
We expect to generate increasing positive free cash flow from our operations over the next three annual periods as a result of revenue generating opportunities relating to our planned wide-body program expansion with the delivery of Dreamliner aircraft, incremental revenue generated through expanded ancillary products and services targeting premium travellers and the launch of our ULCC, Swoop, combined with our various cost saving initiatives.
Please refer to page 59 of this MD&A for a reconciliation of non-GAAP and additional GAAP measures.
Capital Resources
In 2017, we have grown through acquisitions of Boeing 737 NG, Boeing MAX and Q400 aircraft. During 2017, all nine of our Q400 aircraft deliveries were financed by individual secured term loans with Export Development Canada (EDC) for approximately 80 per cent of the purchase price of the aircraft. We also took delivery of two Boeing 737 800 series aircraft and four Boeing MAX aircraft in 2017, funded with cash. At December 31, 2017, we had secured loans financing 26 Boeing 737 NG aircraft and 43 Q400 aircraft with a remaining debt balance of $862.2 million, net of transaction costs. This debt is financed in Canadian dollars and has no financial covenants associated with it. At the date of this MD&A, we have a total of 61 unencumbered aircraft, representing approximately one third of our total fleet. This provides us the flexibility to manage our capital requirements through varying arrangements such as direct sales, leaseback agreements and the issuance of secured debt.
We currently have an $820 million guaranteed loan agreement with EDC pursuant to which EDC will make available to WestJet Encore financing support for the purchase of Q400s. We are charged a non-refundable commitment fee of 0.2 per cent per annum on the undisbursed portion of the commitment. Under the terms of the agreement, availability of any undrawn amount will expire at the end of 2018. The expected amount available for each aircraft is up to 80 per cent of the net price with a term to maturity of up to 12 years, payable in quarterly installments. At December 31, 2017, we have $47.6 million undrawn under the loan agreement.
At December 31, 2017, we have not drawn on our revolving credit facility and therefore the undisbursed portion of the credit facility was $300 million on which we pay a standby fee for the undisbursed portion of the credit facility. Additionally, the full balance of our non-revolving $300 million four-year syndicated credit facility, drawn using Canadian dollar bankers’ acceptances, remained outstanding as at December 31, 2017. Interest is calculated by reference to the applicable base rate

WestJet Annual Report 2017 | 32
plus an applicable pricing margin based on our corporate debt credit ratings. Both our revolving and non-revolving credit facilities contain two financial covenants: (i) minimum pooled asset coverage ratio of 1.5 to 1, and (ii) minimum fixed charge coverage ratio of 1.25 to 1. At December 31, 2017, the Corporation was in compliance with both ratios.
Our total outstanding debt balance at December 31, 2017 is $2,049.0 million, net of transaction costs (December 31, 2016 - $2,046.7 million).
At December 31, 2017, we have not made any commitments for future aircraft financing, except our loan agreement with EDC described above. Our credit ratings, discussed below, are an important factor that is expected to provide WestJet with a range of public and private debt financing options in the future. We continue to evaluate the optimum balance and sources of financing available to us based on our internal requirements and capital structure as well as the external environment for aircraft financing.
Interest
During the year ended December 31, 2017, we incurred $53.7 million in interest (December 31, 2016 - $49.1 million) on our long-term debt. During the year ended December 31, 2017, $19.8 million of interest was capitalized (December 31, 2016 – $18.8 million) as it related to deposits paid for Boeing and Bombardier aircraft. Of the amount capitalized in the year ended December 31, 2016, $8.2 million related to interest incurred in periods prior to 2016.
We mitigate the earnings impact of changing interest rates on our variable rate loans through our interest rate swap agreements to fix the interest rates over the term of the loans. At December 31, 2017, the interest rate swap contracts continue to meet the criteria for designation as effective cash flow hedges for accounting purposes.
The following table presents the financial impact and statement presentation of the interest rate swap agreements on the consolidated statement of financial position at December 31, 2017 and December 31, 2016 and on the consolidated statement of earnings for the years ended December 31, 2017 and 2016.
($ in thousands) Statement presentation 2017 2016 Statement of Financial Position:
Fair value Prepaid expenses, deposits and other 2,067 - Fair value Other assets 2,814 1,359 Fair value Accounts payable and accrued liabilities (1,299) (3,285) Fair value Other liabilities (1,414) (5,746) Unrealized loss Hedge reserves (before tax) (3,106) (6,734)
($ in thousands) Statement presentation 2017 2016 Statement of Earnings: Realized loss Finance costs (2,746) (3,882)
The fair value of the interest rate swap agreements is measured based on the difference between the fixed swap rate and the forward curve for the applicable floating interest rates obtained from the counterparty, which can be observed and corroborated in the marketplace. In addition to the interest rate swap agreements, in June 2016 we entered into cross currency interest rate swaps to fix the cash flow exposure to fluctuations in the foreign exchange rate on the notional and interest portions of the US Dollar Notes (please refer to the Foreign exchange section on page 20 of this MD&A).
Credit ratings
As at December 31, 2017, our ‘BBB-’ long-term corporate credit rating from Standard & Poor’s Rating Services and our ‘Baa2’ senior unsecured notes rating from Moody’s Investor Services (Moody’s) remain unchanged from December 31, 2016. During the second quarter of 2017, Moody’s revised their outlook to negative from stable. Both of our corporate credit ratings are considered investment grade.
Credit ratings are intended to provide investors with an external measure of our overall creditworthiness. Credit ratings are not recommendations to buy, sell or hold our securities and do not address the market price or suitability of a specific security for a particular investor. There is no assurance that our ratings will remain in effect for any given period of time or that our

WestJet Annual Report 2017│ 33
ratings will not be revised or withdrawn entirely by the credit rating agencies in the future if, in their judgment, circumstances so warrant. Contractual obligations and commitments
At December 31, 2017, our contractual obligations and commitments are indicated in the following table. All US-dollar amounts have been converted at the foreign exchange rate in effect at December 31, 2017, and presented in Canadian dollars.
($ in thousands) Total Within 1 year 2 - 3 years 4 - 5 years Over 5
years Long-term debt repayments(i) 2,287,847 218,572 943,602 716,274 409,399 Leases and commitments(ii) 877,635 273,587 347,978 167,563 88,507 Purchase obligations(iii) 4,758,358 510,686 1,389,839 1,379,643 1,478,190 Total contractual obligations(iv) 7,923,840 1,002,845 2,681,419 2,263,480 1,976,096
(i) Includes contractual principal and interest payments on long-term debt. (ii) Relates to leases and commitments for aircraft, land, buildings, equipment, computer hardware, software licenses and inflight entertainment. (iii) Relates to obligations for our confirmed purchased aircraft deliveries for Boeing 737 NGs, Boeing 737 MAXs, Boeing 787-9 Dreamliners, Bombardier Q400s
and spare engines. (iv) Total contractual obligations exclude long-term liabilities, other than long-term debt repayments, due to reasons of uncertainty of timing and amount of cash
flows.
Our future US-dollar-denominated purchase commitments, including certain aircraft, are exposed to foreign exchange risk (please refer to the heading called Foreign exchange found on page 20 of this MD&A). We plan to meet our contractual obligations and commitments through our current cash and cash equivalents balance combined with cash flows from operations and future sources of financing. We continuously monitor the capital markets and assess financing alternatives available to us for our future aircraft deliveries. At this time, we are not aware of, nor do we reasonably expect, adverse changes to our future ability to access similar or other generally available sources of liquidity.
Contingencies
We are party to legal proceedings and claims that arise during the ordinary course of business. It is the opinion of management that the ultimate outcome of any outstanding matters will not have a material effect upon our financial position, results of operations or cash flows.
Fleet
Early in 2017 we unveiled our 2022 vision which included our dedication to becoming a global airline with service to new international destinations through an expanded wide-body program. In a step towards achieving this component of our vision, on May 1, 2017, we entered into a definitive purchase agreement with The Boeing Company for up to 20 Boeing 787-9 Dreamliner (Boeing 787) aircraft. The purchase agreement includes commitments for 10 Boeing 787-9 aircraft to be delivered between the first quarter of 2019 and December 2021, with options for an additional 10 aircraft to be delivered between 2020 and 2024. As part of this purchase agreement, WestJet converted 15 firm orders for the Boeing 737 MAX aircraft that were to be delivered between 2019 and 2021 to options available between 2022 and 2024. At the same time, WestJet announced it had selected General Electric's GEnx-1B engine for the Boeing 787.
In the third quarter of 2017 WestJet became the first Canadian airline to operate the Boeing MAX aircraft with the delivery of our first two Boeing 737 MAX 8 aircraft, followed by deliveries of an additional two Boeing MAX aircraft in the fourth quarter of 2017. The Boeing MAX will enhance guest experience through a quieter cabin featuring the new Boeing Sky Interior, which includes larger windows, sculpted ceilings, customized LED lighting, and more room for carry-on baggage. The Boeing MAX is powered by CFM International LEAP-1B engines and includes design updates such as Boeing’s Advanced Technology winglets, resulting in approximately 14 per cent increased fuel efficiency compared to our current Boeing 737 NG fleet.

WestJet Annual Report 2017 | 34
On October 27, 2017, we signed an amendment to our Boeing MAX aircraft purchase agreement to (i) substitute four Boeing MAX 8 aircraft and three Boeing MAX 7 aircraft for seven Boeing MAX 9 aircraft originally scheduled to be delivered in 2018 and 2019; (ii) substitute seven Boeing MAX 10 aircraft for seven MAX 8 originally scheduled to be delivered between the years 2022 and 2025; and (iii) add an incremental five Boeing MAX 10 aircraft for delivery beginning in 2022. Through this amendment, our total Boeing MAX firm purchase commitments increased from 50 to 55, as illustrated in the table below.
In total, during 2017 we took delivery of nine Q400 aircraft, two Boeing 737-800 aircraft and our first four Boeing 737 MAX 8 aircraft. We also executed a total of 11 lease extension for aircraft leases scheduled to expire in 2017 and 2018. The terms of the lease extensions ranged from 14 months to six years each. We ended the year with a fleet of 168 aircraft with an average age of 7.5 years. The combination of our firm commitments and our lease renewal options help us to optimize the size and age of our fleet. This provides us with the flexibility within our firm commitments to end 2027 with a fleet size between 190 and 231 aircraft, depending on future decisions to renew leases.
Subsequent to the end of the year, we signed a letter of intent to lease two Q400 aircraft, for terms of eight years each, with delivery scheduled for the second quarter of 2018. We also executed a lease extension for one Boeing 737-700 aircraft for an additional term of four years, expiring in 2022 and, finally, we returned one leased Boeing 737-700 aircraft in January 2018.
The following table illustrates our Boeing narrow-body, Boeing wide-body and Bombardier fleet as at December 31, 2017 and 2016 as well as our firm commitments through to 2027. Total Future Deliveries Total
Dec. 31,
2016
Dec. 31,
2017 2018 2019 2020 2021 2022-
23 2024-
27 Total 2027
Boeing narrow-body 737-600 NG 13 13 ― ― ― ― ― ― ― 13 737-700 NG(i) 56 56 ― ― ― ― ― ― ― 56
737-800 NG(ii) 46 48 ― ― ― ― ― ― ― 48
737 MAX 7(iii)(iv) ― ― ― 5 ― 1 2 15 23 23
737 MAX 8(iii)(iv) ― 4 7 1 ― 2 2 4 16 20
737 MAX 10(iii)(iv) ― ― ― ― ― ― 10 2 12 12 Boeing wide-body 767-300 ERW 4 4 ― ― ― ― ― ― ― 4
787-9 Dreamliner(v) ― ― ― 3 3 4 ― ― 10 10
Boeing aircraft 119 125 7 9 3 7 14 21 61 186
Lease expiries ― ― (2)(vi) (9) (5) (11) (12) (2) (41) (41) Boeing aircraft after lease expiries 119 125 5 ― (2) (4) 2 19 20 145
Bombardier Q400 NextGen 34 43 2 ― ― ― ― ― 2 45 Fleet 153 168 9 9 3 7 14 21 63 231 Fleet after lease expiries 153 168 7 ― (2) (4) 2 19 22 190
(i) At December 31, 2017, of the 56 Boeing 737 NG 700 aircraft in our fleet, 27 are leased (Dec. 31, 2016 – 27) and 29 are owned (Dec. 31, 2016 – 29). (ii) At December 31, 2017, of the 48 Boeing 737 NG 800 aircraft in our fleet, 14 are leased (Dec. 31, 2016 – 14) and 34 are owned (Dec. 31, 2016 – 32). (iii) We have options to purchase an additional 25 Boeing MAX aircraft between the years 2020 and 2024. (iv) WestJet’s Boeing 737 MAX 7 and MAX 8 aircraft orders can each be substituted for the other model of aircraft, or, beginning in 2022, for Boeing 737 MAX 10
aircraft. (v) We have options to purchase an additional 10 Boeing 787 aircraft between the years 2020 and 2024. (vi) Subsequent to December 31, 2017, we executed a lease extension of one Boeing 737 NG 700 aircraft for a term of four years with lease expiry in 2022.
Additionally, we returned one leased Boeing 737 NG 700 aircraft in January 2018. These items have been reflected in the table above.

WestJet Annual Report 2017│ 35
Off-Balance Sheet Arrangements and Related-Party Transactions
Aircraft operating leases
At December 31, 2017, we had 41 Boeing 737 NG aircraft under operating leases. Future cash flow commitments in connection with these aircraft totalled US $351.5 million at December 31, 2017 (December 31, 2016 – US $337.1 million) which we expect to fund through cash from operations. Although the current obligations related to our aircraft operating lease agreements are not recognized on our consolidated statement of financial position, we include an amount equal to 7.5 times our annual aircraft leasing expense in assessing our overall leverage through our adjusted debt-to-equity and adjusted net debt to EBITDAR ratios discussed previously.
Fuel and de-icing facility corporations
We are a contracted party to 18 fuel facility arrangements and three de-icing facility arrangements whereby we participate under contract in Fuel Facility Corporations (FFCs) and De-icing Facility Corporations (DFCs), along with other airlines, to obtain fuel services and de-icing services at major Canadian and US airports. The FFCs and DFCs operate on a cost-recovery basis. The purpose of these corporations is to own and finance the systems that distribute fuel and de-icing fluid, respectively, to the contracting airlines, including the leasing of land rights, while providing the contracting airlines with preferential service and pricing over non-participating entities. The operating costs, including the debt service requirements, of the FFCs and DFCs are shared pro rata among the contracting airlines. These FFCs and DFCs are not consolidated within our accounts. In the remote event that all other contracting airlines withdraw from the arrangements and we remained as sole member, we would be responsible for the costs of the FFCs and DFCs, including debt service requirements. As at the date of this MD&A, these corporations have combined total assets of approximately $898.7 million and liabilities of approximately $897.8 million, based on the FFCs and DFCs’ most recently completed financial reports.
Related-party transactions
At December 31, 2017, we had no transactions with related parties as defined in International Accounting Standard (IAS) 24 – Related Party Disclosures, except those pertaining to transactions with key management personnel in the ordinary course of their employment or directorship agreements.

WestJet Annual Report 2017 | 36
Share Capital
Outstanding share data
Our issued and outstanding voting shares, along with voting shares potentially issuable, are as follows:
February 2 2018 December 31 2017 Total voting shares issued and outstanding(i) 114,057,901 114,052,889
Stock options 9,397,483 9,429,826
RSUs – Key employee plan 231,605 231,640
RSUs – Executive share unit plan 259,672 259,672
PSUs – Executive share unit plan 488,452 488,452
Total voting shares potentially issuable 10,377,212 10,409,590
Total outstanding and potentially issuable voting shares 124,435,113 124,462,479 (i) At December 31, 2017, 76,918,114 common voting shares were outstanding and 37,134,775 variable voting shares were outstanding.
Quarterly dividend policy
Our dividend is reviewed on a quarterly basis in light of our financial position, financing policies, cash flow requirements and other factors deemed relevant. On February 5, 2018, the Board of Directors declared our 2018 first quarter dividend of $0.14 per common voting share and variable voting share payable on March 30, 2018 to shareholders of record on March 14, 2018, which remains consistent with the $0.14 per common voting share declared and paid quarterly throughout 2017. We believe this demonstrates our confidence in delivering continued profitable results and is consistent with our objective of creating and returning value to our shareholders.
Normal course issuer bid
On May 16, 2016, the Toronto Stock Exchange (TSX) accepted our notice to make a normal course issuer bid to purchase up to 4,000,000 common voting shares and variable voting shares (the Shares) on the open market (representing approximately 3.3 per cent of our issued and outstanding Shares as of April 30, 2016) during the period of May 18, 2016 to May 17, 2017 or until the bid is completed or terminated at our option (2016 bid). Any Shares purchased under the 2016 bid were purchased on the open market through the facilities of the TSX or through alternative trading systems at the prevailing market price at the time of the transaction and were cancelled. During 2017, we repurchased and cancelled 193,172 Shares for consideration of $4.2 million, completing our purchase and cancellation of all 4,000,000 Shares we were authorized to purchase under the 2016 bid.
On August 2, 2017, the TSX accepted our notice to make a normal course issuer bid to purchase up to 5,856,671 outstanding Shares (representing approximately five per cent of our issued and outstanding Shares as of July 20, 2017) on the open market during the period of August 3, 2017 to August 2, 2018 or until such time as the bid is completed or terminated at our option (the 2017 bid). Any Shares purchased under the 2017 bid will be purchased on the open market through the facilities of the TSX at the prevailing market price at the time of the transaction and cancelled. In the fourth quarter of 2017, we repurchased and cancelled 1,267,670 Shares under the 2017 bid for consideration of $32.6 million for total shares repurchased. During 2017, we repurchased and cancelled a total 3,330,425 Shares, equal to 56.9 per cent of the maximum number of Shares we are authorized to repurchase under the 2017 bid, for total consideration of $86.1 million. As of the date of this MD&A, there are 2,526,246 Shares remaining available for purchase under the 2017 bid.
A shareholder of WestJet may obtain a copy of the notice filed with the TSX in relation to the 2016 bid, free of charge, by contacting the Corporate Secretary of WestJet at 22 Aerial Place N.E., Calgary, Alberta T2E 3J1 (telephone: (403) 444-2600) or by emailing [email protected].

WestJet Annual Report 2017│ 37
Financial Instruments and Risk Management
Our financial assets and liabilities consist primarily of cash, cash equivalents and marketable securities, restricted cash, accounts receivable, derivative instruments, identified interest-bearing deposits, accounts payable and accrued liabilities and long-term debt.
We are exposed to market, credit and liquidity risks associated with our financial assets and liabilities. From time to time, we use various financial derivatives to reduce exposures from changes in foreign exchange rates, interest rates and jet fuel prices. We do not hold or use any derivative instruments for trading or speculative purposes.
Our Board of Directors has responsibility for the establishment and approval of our overall risk management policies, including those related to financial instruments. Management performs continuous assessments so that all significant risks related to financial instruments are reviewed and addressed in light of changes to market conditions and our operating activities.
Fuel risk
The airline industry is inherently dependent upon jet fuel to operate and, therefore, we are exposed to the risk of volatile fuel prices. Fuel prices are affected by a host of factors outside our control, such as significant weather events, geopolitical tensions, refinery capacity, and global demand and supply. For the year ended December 31, 2017, aircraft fuel expense represented approximately 23.4 per cent (2016 – 20.8 per cent) of our total operating expenses. Refer to Aircraft fuel on page 17 for a discussion of our sensitivity of fuel costs to changes in the market price of jet fuel and foreign exchange rate.
Under our fuel price risk management policy, we are permitted to hedge a portion of our future anticipated jet fuel purchases for up to 36 months. As at and for the year ended December 31, 2017, we are not party to any fuel hedging contracts. We will continue to monitor and adjust to movements in fuel prices and may re-visit our hedging strategy as changing markets and competitive conditions warrant.
Foreign exchange risk
Our financial results are reported in Canadian dollars, while a large portion of our expenses, debt obligations and capital commitments are in foreign currencies, primarily US dollars. Foreign exchange risk is the risk that the fair value or future cash flows of a financial instrument would fluctuate as a result of changes in foreign exchange rates. We are exposed to foreign exchange risks arising from fluctuations in exchange rates on our US-dollar-denominated monetary assets and liabilities, contractual commitments and our US-dollar-denominated operating expenditures, mainly aircraft fuel, aircraft leasing expense, the land component of vacations packages and certain maintenance and airport operation costs. For a discussion of our sensitivity to changes in the value of the Canadian dollar compared to the US dollar, refer to Foreign exchange on page 20.
To manage our exposure, we periodically use financial derivative instruments, such as US-dollar foreign exchange forward contracts. Upon proper qualification, we designate our foreign exchange forward contracts as cash flow hedges for accounting purposes. For a discussion of the nature and extent of our use of US-dollar foreign exchange derivatives, including the business purposes they serve, the financial statement classification and amount of income, expense, gain and loss associated with these instruments and the significant assumptions made in determining their fair value, please refer to Foreign exchange on page 20 of this MD&A.
Interest rate risk
Interest rate risk is the risk that the value or future cash flows of a financial instrument will fluctuate as a result of changes in market interest rates. We are exposed to interest rate fluctuations on short-term investments included in our cash, cash equivalents and marketable securities balance. A change of 50 basis points in the market interest rate would have had an approximate impact on net earnings of $3.7 million for the year ended December 31, 2017 (2016 – $2.8 million) as a result of our short-term investment activities. We are also exposed to interest rate fluctuations on our interest-bearing deposits that relate to certain airport operations which, at December 31, 2017, totalled $14.6 million (2016 – $14.6 million). A change of 50 basis points in market interest rates at December 31, 2017, would not have significantly impacted our net earnings due to the small size of these deposits.
The fixed-rate nature of the majority of our long-term debt mitigates the impact of interest rate fluctuations on our cash flows over the term of the outstanding debt. We account for our long-term fixed-rate debt at amortized cost, and, therefore, a
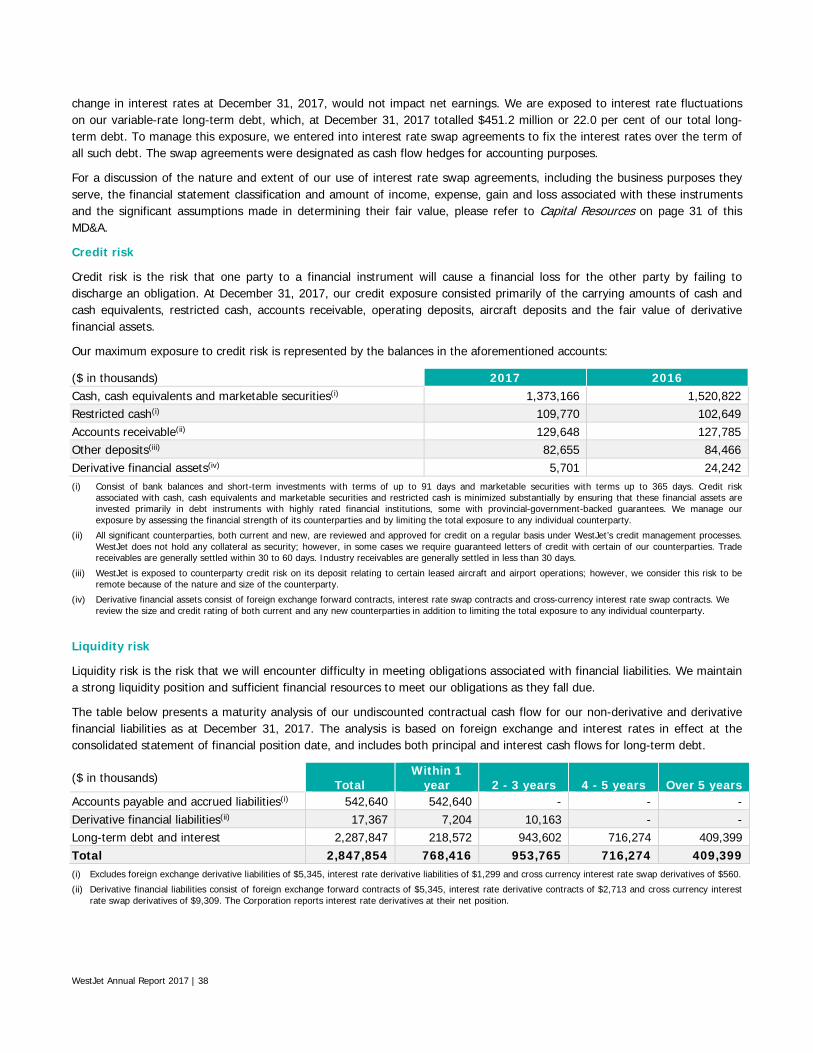
WestJet Annual Report 2017 | 38
change in interest rates at December 31, 2017, would not impact net earnings. We are exposed to interest rate fluctuations on our variable-rate long-term debt, which, at December 31, 2017 totalled $451.2 million or 22.0 per cent of our total long-term debt. To manage this exposure, we entered into interest rate swap agreements to fix the interest rates over the term of all such debt. The swap agreements were designated as cash flow hedges for accounting purposes.
For a discussion of the nature and extent of our use of interest rate swap agreements, including the business purposes they serve, the financial statement classification and amount of income, expense, gain and loss associated with these instruments and the significant assumptions made in determining their fair value, please refer to Capital Resources on page 31 of this MD&A.
Credit risk
Credit risk is the risk that one party to a financial instrument will cause a financial loss for the other party by failing to discharge an obligation. At December 31, 2017, our credit exposure consisted primarily of the carrying amounts of cash and cash equivalents, restricted cash, accounts receivable, operating deposits, aircraft deposits and the fair value of derivative financial assets.
Our maximum exposure to credit risk is represented by the balances in the aforementioned accounts:
($ in thousands) 2017 2016 Cash, cash equivalents and marketable securities(i) 1,373,166 1,520,822 Restricted cash(i) 109,770 102,649 Accounts receivable(ii) 129,648 127,785 Other deposits(iii) 82,655 84,466 Derivative financial assets(iv) 5,701 24,242 (i) Consist of bank balances and short-term investments with terms of up to 91 days and marketable securities with terms up to 365 days. Credit risk
associated with cash, cash equivalents and marketable securities and restricted cash is minimized substantially by ensuring that these financial assets are invested primarily in debt instruments with highly rated financial institutions, some with provincial-government-backed guarantees. We manage our exposure by assessing the financial strength of its counterparties and by limiting the total exposure to any individual counterparty.
(ii) All significant counterparties, both current and new, are reviewed and approved for credit on a regular basis under WestJet’s credit management processes. WestJet does not hold any collateral as security; however, in some cases we require guaranteed letters of credit with certain of our counterparties. Trade receivables are generally settled within 30 to 60 days. Industry receivables are generally settled in less than 30 days.
(iii) WestJet is exposed to counterparty credit risk on its deposit relating to certain leased aircraft and airport operations; however, we consider this risk to be remote because of the nature and size of the counterparty.
(iv) Derivative financial assets consist of foreign exchange forward contracts, interest rate swap contracts and cross-currency interest rate swap contracts. We review the size and credit rating of both current and any new counterparties in addition to limiting the total exposure to any individual counterparty.
Liquidity risk
Liquidity risk is the risk that we will encounter difficulty in meeting obligations associated with financial liabilities. We maintain a strong liquidity position and sufficient financial resources to meet our obligations as they fall due.
The table below presents a maturity analysis of our undiscounted contractual cash flow for our non-derivative and derivative financial liabilities as at December 31, 2017. The analysis is based on foreign exchange and interest rates in effect at the consolidated statement of financial position date, and includes both principal and interest cash flows for long-term debt.
($ in thousands) Total Within 1
year 2 - 3 years 4 - 5 years Over 5 years Accounts payable and accrued liabilities(i) 542,640 542,640 - - - Derivative financial liabilities(ii) 17,367 7,204 10,163 - - Long-term debt and interest 2,287,847 218,572 943,602 716,274 409,399 Total 2,847,854 768,416 953,765 716,274 409,399 (i) Excludes foreign exchange derivative liabilities of $5,345, interest rate derivative liabilities of $1,299 and cross currency interest rate swap derivatives of $560.
(ii) Derivative financial liabilities consist of foreign exchange forward contracts of $5,345, interest rate derivative contracts of $2,713 and cross currency interest rate swap derivatives of $9,309. The Corporation reports interest rate derivatives at their net position.

WestJet Annual Report 2017│ 39
Fair value of financial instruments
Fair value represents a point-in-time estimate. The carrying amount of cash and cash equivalents, accounts receivable, and accounts payable and accrued liabilities included in the statement of financial position approximate their fair values because of the short-term nature of the instruments. At December 31, 2017, the fair value of our other deposits was approximately $81.7 million (2016 - $83.6 million) and is determined by discounting the future contractual cash flows based on yield curves for zero coupon Government of Canada bonds.
The fair value of our long-term debt was approximately $1,906.2 million (2016 – $1,972.0 million). The fair value of our fixed-rate long-term debt is determined by discounting the future contractual cash flows under the current financing arrangements at discount rates presently available for loans with similar terms and remaining maturities. At December 31, 2017, the weighted average rate used in determining the fair value was 4.85 per cent (2016 – 3.69 per cent). The decrease in the fair value of our long-term debt is due to the increase in the rate used to discount our debt. The fair value of our variable-rate long-term debt approximates its carrying value, as it is at a floating market rate of interest. Please refer to Foreign exchange and Capital Resources on page 20 and page 31, respectively, of this MD&A for a discussion of the significant assumptions made in determining fair value of derivatives designated in an effective hedging relationship at December 31, 2017.

WestJet Annual Report 2017 | 40
Risks and Uncertainties
The risks described below are not intended to be an exhaustive list of all risks facing our Company. Other risks of which we are not currently aware or which we currently deem immaterial may surface and have a material adverse impact on our business.
Risks relating to the business
The failure of critical systems on which we rely could harm our business.
We are highly dependent on automated systems to operate our business and support our initiatives. These systems include our flight control systems, computerized airline reservation systems, revenue management systems, telecommunication systems, aircraft maintenance systems, airport kiosk terminals and website. The integration of these complex systems and technologies present significant challenges in terms of managing increasing technology development and maintenance costs, human resources and the development of effective internal controls. Additionally, portions of key technology systems, including our revenue accounting system and reservation systems, are outsourced to third parties on whom we are reliant for timely and accurate processing of information critical to our business.
We may occasionally experience system interruptions and delays that make our website, contact centre and services unavailable or slow to respond, which could prevent us from efficiently processing guest transactions or providing services. Our computer and communications systems and operations could be damaged or interrupted by catastrophic events such as natural disasters, power loss, computer and telecommunications failures, acts of war or terrorism, computer viruses, security breaches, and similar events or disruptions. Any disruption to these systems could result in the loss of important data, reallocation of personnel, failure to meet critical deadlines, increased expenses, and could generally harm our business, guest experience and reputation.
In the regular operation of our business, we collect and store sensitive data, including personal information of our guests, employees and business partners. We are subject to compliance with certain requirements established by credit card companies and non-compliance with these requirements, whether through system breaches or limitations, may result in substantial fines or temporary or permanent exclusion from one or more credit card acceptance programs. The inability to process one or more credit card brands could have a material adverse impact on our guest bookings and could harm our business.
Our reliance on these information systems increases our exposure to cyber security risks, which are becoming more numerous and sophisticated over time. As a result of these types of risks, we maintain and regularly update security initiatives, including a disaster recovery plan, however, it may be difficult to prevent all data security breaches or misuse of data which may result in the loss, disclosure, misappropriation of, or access to, information of our guests, employees, or business partners, which could result in legal claims or proceedings, liability or regulatory penalties under laws protecting the privacy of personal information, disruption to our operations and damage to our reputation, any or all of which could adversely affect our business.
A significant change in our unique corporate culture, guest experience or brand could have adverse operational and financial consequences.
Our corporate culture and brand recognition are key competitive advantages for us, especially in the Canadian market. We strive to maintain an innovative corporate culture that results in a unique, safe and caring guest experience that sets our company and our brand apart from our competitors. Failure to maintain our unique corporate culture that results in a safe and caring guest experience could adversely affect our strong brand, our operating results and our financial condition.
The airline industry is labour intensive and we are subject to increasing labour, retention and succession costs and further potential unionization.
The labour intensive nature of the airline industry places additional emphasis on our human resource policies such as hiring, retention, working environment and compensation policies. Given the competitive nature of the airline industry, we are constantly balancing the interests of our business and the interests of our employees. We have developed strong compensation policies that have both fixed and variable components, a mix of full-time, part-time, casual and contract labour

WestJet Annual Report 2017│ 41
and a share ownership and profit sharing program that align the interests of our employees with the interests of our business. These policies allow our business and our employees to be rewarded in strong operating environments, but also protect and sustain our business and our employees in weaker operating environments. Should our labour costs not be able to suitably respond to changes in the economic and competitive environment, our operations and earnings could be negatively impacted.
We continue to have a largely non-union workforce that we believe gives us a competitive advantage and helps foster our unique corporate culture. From time to time, certain groups of our employees have been subjected to unionization drives and may be subjected to further unionization drives in the future that could result in these classes of employees having a collective voice to bargain terms and conditions of employment outside of the scope of our existing employee association. The Canada Labour Code was amended in 2017 and currently provides that a union can once again be automatically certified where more than 50 per cent of a group of employees sign membership cards. Additionally, evidence that 35 to 50 per cent of the proposed bargaining unit are members in a union will trigger a secret ballot. When an employee group unionizes, we are required to bargain in good faith with the trade union regarding the implementation of a collective agreement. Depending on the ability to reach a collective agreement and the final terms of that agreement, we are subject to potential disruption in scheduled service, changes to our current work rules and processes and increases to our labour costs, reducing our ability to sustain our business objectives or pursue strategic initiatives. Further unionization could also fundamentally change the dynamic of our relationship with our employees and may diminish our employee-friendly corporate culture and reputation, which could ultimately have a negative impact on our earnings.
During 2017, both WestJet and WestJet Encore pilot groups voted in favour of union representation, and are now represented by the Air Line Pilots Association (ALPA). If we are unable to reach agreement with any of our unionized employee groups on current and future negotiations regarding the terms of their collective bargaining agreements, we may be subject to work interruptions or stoppages which may adversely impact our ability to conduct business. We believe our employee associations continue to play a key role in balancing the interests of the business with the interests of WestJetters through a pro-active approach to identifying and resolving issues that have important implications for our business, our employees and our culture.
Failure of strategic initiatives and changes to our business model to deliver the expected economic benefits may adversely impact our financial condition and results of operations.
WestJet operates in an increasingly competitive environment, subject to competition from existing domestic and international airlines as well as the threat of new competition from established airlines operating in WestJet’s desired future markets and new ULCCs establishing operations in current WestJet markets. Our transition from a low-cost point-to-point business model to a high value-based network airline with global operations may be impacted by factors both within and outside of our ability to control, such as the need to obtain regulatory approvals, the implementation and integration of these operations into our current operations, and the increased costs associated with the implementation of these initiatives. A delay or failure to successfully identify and implement these important strategic initiatives may adversely impact our earnings, financial condition and/or impact the demand for WestJet mainline and Encore flights.
The launch of our ULCC product, Swoop, is one of our key initiatives to defend our market position within the low-cost traveller market segment within Canada and increase our ability to attract guests currently travelling to US airports in close proximity to the Canadian border to fly with low-cost US airlines. Additionally, we are expecting to incur incremental costs associated with the establishment of the ULCC entity and supporting operations, including investments in personnel, technology and regulatory compliance, the extent of which may be difficult to predict.
The expansion of our wide-body program and increased international flying will result in the modification of certain business processes due to differences in airport operations, local operating requirements and cultural implications. Additionally, flying to new international markets increases our foreign currency risks to the extent that we choose to, or are required to, transact in currencies other than the Canadian or US dollar. Our expansion into new markets also increases our requirement to comply with the laws and regulations of new jurisdictions. Any violation by WestJet of such laws or regulations could result in penalties or fines which may adversely impact our earnings or financial condition.
Further to the launch of Swoop, our planned expansion of our wide-body program and further expansion into new international markets will be impacted by our ability to profitably operate new Boeing 787-9 Dreamliner aircraft, for which we have committed to purchase a significant number of aircraft within the upcoming periods, with deliveries beginning in 2019. Our ability to successfully introduce these aircraft into service may impact our earnings and financial condition.

WestJet Annual Report 2017 | 42
Failure to maintain our low -cost operating model would have adverse effects on our business strategy, financial condition and results of operations.
Our low-cost business model is a key factor that enables us to provide low fares to our guests, protect and increase our market share through competitive pricing and fund our future growth initiatives. We continuously monitor and evaluate our operations for current and future cost saving opportunities that enable us to maintain or enhance our low-cost business model. Although we have been effective in executing our low-cost business model to date, there is no assurance that we will be able to do so in the future, especially related to costs that are outside our control, including fuel, foreign exchange rates, interest rates, government rates and fees, insurance and competitive and inflationary labour market pressures. Should we not be able to maintain a cost advantage over our competitors, this would affect our ability to offer competitively low fares to our guests. We are particularly dependent on the cost-conscious leisure traveller and therefore our ability to profitably offer competitive and low fares is critical to protecting and increasing our market share and funding our future growth initiatives. Should we not be able to accomplish these objectives due to higher costs, this would have negative impacts on our earnings and financial condition.
Our maintenance costs w ill increase as our fleet ages.
The average age of our fleet at December 31, 2017, was 7.5 years. Our maintenance costs will increase as our fleet ages and our aircraft warranties expire. Since we began acquiring our Boeing 737 NG aircraft, 92 aircraft have come off warranty, with an additional seven coming off warranty in 2018. During 2017, eight of our Bombardier Q400 aircraft have come off warranty since we began acquiring them in 2013, with a further eight coming off warranty within 2018. None of our Boeing MAX aircraft have come off warranty and none of our Boeing 767s are under warranty. Our repair and maintenance programs include larger overhauls to engines, landing gear and airframes in addition to smaller ongoing maintenance requirements. Overhaul costs on owned components are separately capitalized and amortized over the period until the next overhaul whereas smaller ongoing maintenance activities are expensed when incurred. Overhaul costs for leased aircraft are accrued for in our maintenance provision expense and liability until the date of expected overhaul. Certain leased engines also require maintenance reserve payments to the lessor, which we expect to reclaim upon performing eligible engine overhaul activities. Unanticipated maintenance events outside our scheduled programs due to mechanical failures or mandatory aircraft directives from manufacturers or regulators would increase our maintenance costs and could potentially affect our scheduled flying by taking our aircraft out of service, both of which would negatively impact our earnings and guest experience.
We are dependent on the price and availability of jet fuel. Continued periods of high fuel costs, volatility of fuel prices and/ or significant disruptions in the supply of fuel could adversely affect our results of operations.
Jet fuel pricing represents a significant risk, representing 23.4 and 20.8 per cent of operating costs in 2017 and 2016, respectively. Fuel prices are affected by a host of factors outside our control, such as significant weather events, geopolitical tensions, refinery capacity and global demand and supply. A small change in the price of fuel can significantly affect our fuel costs and ultimately our earnings. Due to the competitive nature of the airline industry, we may not be able to increase our fares, impose fuel surcharges or otherwise increase revenues sufficiently to offset increases in fuel costs.
The ability to protect and grow our earnings in a volatile and rising fuel price environment is affected by our ability to manage fuel costs through key cost initiatives such as investments in fuel efficient aircraft as well as cost effective fuel management IT systems and fuel purchasing and dispensing services. These cost initiatives can only partially mitigate volatile and rising fuel prices, require long lead times to implement, and may or may not create a competitive cost advantage compared to the effectiveness of our competitors’ fuel savings investments and technologies at a given point in time. We discontinued our fuel hedging program in 2012 but may re-visit the program as changing markets and competitive conditions warrant. There is no assurance that any new fuel hedging program will be effective in offsetting volatile or rising fuel prices or create a competitive advantage compared to our competitors.
Other initiatives implemented to manage fuel costs may include adjustments to aircraft utilization, average flight stage length and the acquisition of fuel efficient aircraft. In 2017, we received our first deliveries of the Boeing MAX aircraft, with Boeing’s Advanced Technology winglets, resulting in approximately 14 per cent increased fuel efficiency compared to our current Boeing 737 NG fleet.
There is no guarantee that our fuel cost initiatives and revenue management practices will be effective in offsetting volatile or increasing fuel prices. If we are unable to mitigate volatile or increasing fuel prices, this would have an adverse effect on our

WestJet Annual Report 2017│ 43
earnings and our low-cost operation, which significantly contributes to our growth strategy. In turn, this could affect the timing and nature of our growth strategy and initiatives and could also result in the curtailment of scheduled service.
Our financial results are affected by foreign exchange and interest rate fluctuations.
We are exposed to foreign exchange risks arising from fluctuations in exchange rates on our US-dollar-denominated net monetary assets and liabilities and operating expenditures, mainly aircraft fuel, aircraft leasing expense, certain maintenance costs, a portion of airport operation costs, certain IT and computer reservation system fees, and the land components associated with our WestJet Vacation packages. Since our revenues are received primarily in Canadian dollars, we do not have offsetting gains therefore we are fully exposed to fluctuations in the US-dollar exchange rate with respect to these payment obligations.
As of the date of this MD&A, we are also exposed to fluctuations in the US-dollar exchange rate relating to our Boeing 737 MAX aircraft purchase commitments, Boeing 787 aircraft purchase commitments and Bombardier Q400 purchase commitments. The purchase of our Boeing and Bombardier aircraft are financed by funds drawn in Canadian dollars while the aircraft are paid for in US funds at the date of each aircraft deposit and delivery payment. As a result, we are exposed to foreign currency fluctuations prior to each deposit and delivery date.
A significant deterioration of the Canadian dollar against the US dollar would have an adverse effect on our US-dollar operating and capital costs and our earnings would be negatively impacted. In addition, our foreign exchange hedging is currently limited to certain US-dollar operating expenditures and there is no assurance that this hedging will be effective in mitigating the impact of adverse changes in the US-dollar exchange rate on our earnings.
We are also exposed to general market fluctuations in interest rates for our future aircraft purchase commitments that will be financed at prevailing market rates. We continuously review financing alternatives available to us for our future aircraft deliveries. A significant increase in market interest rates would have an adverse impact on our future borrowing costs and earnings and there is no assurance our interest rate hedging activities will be effective in mitigating these increases.
Inability to retain key personnel could harm our business.
Our success will depend, in part, on the retention of management and key personnel. If any of these individuals become unable to continue in their present role, we may have difficulty replacing these individuals, which could adversely affect our business.
Our business is labour intensive and requires large numbers of pilots, flight attendants, mechanics, guest service and other personnel. Our growth and general turnover requires us to locate, hire, train and retain a significant number of new employees each year. There can be no assurance that we will be able to locate, hire, train and retain the qualified employees that we need to meet our growth plans or replace departing employees. Our business would be adversely affected if we are unable to hire and retain qualified employees at a reasonable cost.
I f we fail to maintain the privacy and security of our guests’ information, we could damage our reputation and incur substantial costs.
In the ordinary course of our business we receive, process and store vast amounts of information from our guests and others, including personal information of our guests and employees and information of our business partners, often through online operations that depend upon the secure communication of information over public networks and in reliance on third party service providers. The secure operation of the networks and systems on which this type of information is stored, processed and maintained is critical to our business operations and strategy. Although we maintain systems to protect this information, these systems must be continuously monitored and updated and could be compromised, in which case our guest information could become subject to intrusion, tampering or theft.
Any compromise of our data security systems or the security systems of our third-party service providers could have an adverse impact on our reputation, could be costly to remediate and could result in litigation or regulatory sanctions, any of which could have a material adverse effect on our business.

WestJet Annual Report 2017 | 44
Our operations are becoming increasingly complex as we continue to add different aircraft to our fleet mix and expand into new markets. The complexities of a mixed fleet and new markets could result in unexpected costs, stronger than expected competitive reactions and weaker than expected demand environments, which could adversely affect our financial condition and results of operations.
We plan to continue adding new markets and additional frequencies to our existing markets through the growth of our regional Bombardier Q400 fleet, our Boeing MAX fleet, our wide-body Boeing 767 aircraft and future Boeing 787 aircraft purchases.
The continued expansion of our fleet through smaller regional Bombardier Q400 turboprop aircraft and larger wide-body Being 787 aircraft create additional operational complexity, new costs and stronger competition not previously encountered with our single fleet of Boeing 737 NG aircraft. Since we are both a relatively new operator in the regional space and only began to operate wide-body aircraft in 2016, we may encounter unforeseen or unexpected costs and operational complexities that may adversely affect our financial condition, results of operations and guest experience.
The addition of new markets also exposes us to further operational complexity and uncertainty, new competition and new demand environments. Should we not be able to effectively mitigate these additional complexities, competitive forces and new markets this may adversely affect our financial condition, results of operations and guest experience.
Our network and operations are increasingly dependent on a few key markets and airports including Toronto’s Pearson International Airport, Calgary International Airport and Vancouver International Airport.
To efficiently serve our network of destinations we are increasingly dependent on the markets and airport operations at Toronto’s Pearson International Airport, Calgary International Airport and Vancouver International Airport. A significant change in the demand environment in one or more of these markets, a significant change to airport rates and fees or significant operational disturbances due to weather or other acts outside our control would have an adverse impact to our operations and financial results.
There are risks associated w ith our presence in some of our international emerging markets, including political or economic instability and failure to adequately comply w ith existing legal requirements.
Emerging markets are countries which have less developed economies that are vulnerable to economic and political problems, such as significant fluctuations in gross domestic product, interest and currency exchange rates, civil disturbances, government instability, nationalization and expropriation of private assets and the imposition of taxes or other charges by governments. The occurrence of any of these events in markets served by us and the resulting instability may adversely affect our business.
We continue to expand our service to Mexico, Central America and countries in the Caribbean, some of which have less developed legal systems, financial markets, and business and political environments than Canada and the US, and therefore present greater political, economic and operational risks. We emphasize legal compliance through a code of conduct and have implemented policies, procedures and ongoing training of employees to ensure compliance with all legal requirements. However, there can be no assurance that our employees will adhere to our codes of conduct and other policies and as such we may be subject to sanctions, investigation costs and other potential penalties and costs, which could negatively affect our business and ability to continue to operate in certain jurisdictions.
We are dependent on single aircraft and engine suppliers for our Boeing 737 NG, Boeing MAX and Boeing 767 aircraft and separate single aircraft and engine suppliers for our Bombardier Q400 aircraft. Additionally, a significant number of key aircraft component parts are obtained from a single supplier. Any interruption in the provision of goods and services from these suppliers, or other significant third-party suppliers, as well as mechanical or regulatory issues associated w ith their equipment, could have a material adverse effect on our business, operating results and financial condition.
We secure goods and services from a number of third party suppliers. Any significant interruption in the provision of goods and services from such suppliers, some of which would be beyond our control, could have a material adverse effect on our business.
We are dependent on Boeing as supplier for our Boeing 737 NG and Boeing MAX aircraft, as well as certain aircraft component parts, and we are dependent on Bombardier as supplier for our Bombardier Q400 aircraft. If we were unable to acquire

WestJet Annual Report 2017│ 45
additional aircraft or parts, from these suppliers, or if they were unable or unwilling to provide adequate support for their products, our operations would be materially adversely affected. If either of the suppliers was unable to adhere to its contractual obligations in meeting scheduled delivery dates for our aircraft, we would be required to find another supplier of aircraft to fulfill our growth plans. Acquiring aircraft from another supplier would require significant transition costs and, additionally, aircraft may not be available at similar prices or received during the same scheduled delivery dates, which could adversely affect our business, operating results and financial condition. In addition, we would be materially adversely affected in the event of a mechanical or regulatory issue associated with the aircraft type, including negative perceptions from the travelling community.
We are also dependent on General Electric as supplier of aircraft engines on our Boeing 737 NG, Boeing MAX and Boeing 767 aircraft, and are dependent on Pratt & Whitney Canada as supplier of aircraft engines for our Bombardier Q400 aircraft, and would therefore be materially adversely affected in the event of a mechanical or regulatory issue associated with our engines or if either supplier was unable or unwilling to provide adequate support for their products.
Our ability to obtain parts, materials, inventory, consumables and services from third party vendors and outside service providers on commercially reasonable terms will also impact our low-cost operating structure and the loss of any such suppliers or service providers may negatively impact our business.
Additionally, numerous components within our supply-chain, including the provision of aircraft, aircraft parts and maintenance services, are sourced from suppliers within the US. Ongoing negotiations between Canada, the US, and Mexico with respect to the North American Free Trade Agreement (NAFTA) could result in supply-chain disruptions or increased costs in the form of higher tariffs or trade duties, for which we may not be able to pass on to our guests in the form of increased fares due to the competitive environment in which we operate, and as such, may adversely impact our earnings or financial condition.
We have a significant amount of fixed obligations and expect to incur significantly more fixed obligations, which could harm our ability to service our fixed obligations, obtain future sources of financing and meet our grow th strategy.
Our significant fixed obligations include our working capital requirements, long-term debt, leased aircraft maintenance provisions, future tax liabilities and certain contractual lease payments for aircraft and other operating assets and services to maintain and expand our operations. We also have significant future firm commitments for new aircraft, engines and other operating assets and services to support our growth strategy. Our existing fixed obligations require significant funds to service interest, principal and other contractual operating obligations. Our future operating performance and cash flows as well as changes in the debt and equity markets will determine whether we are able to continue to successfully service our fixed obligations as well as obtain suitable new sources of financing in the future. Adverse impacts to our future operating performance and cash flows or adverse changes in the debt and equity markets, including any adverse regulatory or government imposed changes, would negatively impact our ability to service our existing fixed obligations as well as obtain new sources of financing on reasonable terms. In turn, this could have adverse effects on our future operations and financial condition and prevent us from achieving our desired growth strategy.
Loss of contracts, changes to our pricing agreements or access to travel suppliers’ products and services could have an adverse impact on WestJet Vacations.
We depend on third parties to supply us with certain components of the travel packages sold through WestJet Vacations. We are dependent, for example, on a large number of hotels in our transborder and international destinations in the US, Mexico, Central America, the Caribbean and Europe. In general, these suppliers can terminate or modify existing agreements with us on relatively short notice. The potential inability to replace these agreements, to find similar suppliers or to renegotiate agreements at competitive rates could have an adverse effect on the results of WestJet Vacations. Furthermore, any decline in the quality of products or services provided by these suppliers, or any perception by travellers of such a decline, could adversely affect our reputation or the demand for the products and services of WestJet Vacations.
As we have expanded our use of partnership agreements w ith other airlines our financial results, network and system integration and guest experience w ill become more sensitive to the effectiveness of our airline partnership agreements.
We continue to expand our network through interline and codeshare partnerships, as well as joint ventures and capacity purchase agreements, with other airlines around the world. As our partnerships continue to mature and grow we expect to

WestJet Annual Report 2017 | 46
see a larger volume of traffic being exchanged between us and our partners resulting in a larger impact to our financial results and an increased reliance on our network and systems integration with our partners. Consequently, weaker traffic coming from our partners or unexpected costs or technical issues with our partner network and systems could have an increasingly adverse effect on our operations and financial results. Additionally, the selection of specific airline partners within a region or strengthening of certain airline partnerships, may impact our attractiveness as a partner to other airlines operating within a region, resulting in a limitation of potential airline partnerships or loss of previous airline partnership agreements which may impact our ability to service various markets within our network and adversely impact our operating results.
Our guest experience is also increasingly subject to variation as our guests increase their travel on our partner airlines. This could have an adverse effect on our business and financial results if our guests perceive a lower quality experience on our partners.
The failure by one of WestJet’s airline partners to fulfill their obligations under the respective agreements, as well as introduction of minimum guarantees in capacity purchase agreements, may limit WestJet’s ability to effectively manage capacity and related costs of operations in the event of a change in market demand conditions, which may adversely impact our financial condition or operating results.
Risks relating to the airline industry
The airline industry is intensely competitive. Reduced market grow th rates can create heightened competitive pressures, impacting the ability to increase fares and increasing competition for market share.
The airline industry is highly competitive and particularly susceptible to price discounting, since airlines incur only nominal costs to provide services to guests occupying otherwise unsold seats. We primarily compete with a small number of Canadian airlines in our domestic market and the same Canadian airlines and numerous US and international carriers in the transborder and international markets. The emergence and growth of new low-cost and ULCCs in the Canadian domestic market may result in additional competition and pricing pressures. For example, following their acquisition of NewLeaf Travel in 2017, Flair Airlines has announced their intention to expand their route network to offer a premium ULCC service in Canada. Additionally, Canada Jetlines has also announced plans to commence ULCC operations within 2018. FlyToo, formerly named JetNaked, is awaiting CTA approvals before launching operations. Other airlines regularly match or price their fares below ours, potentially preventing us from attaining a share of the guest traffic necessary to maintain profitable operations. Our ability to successfully mitigate competitive pricing depends on our ability to operate at costs lower than that of our competitors or potential competitors over the medium to long term. Should we not be able to do this, our financial results and financial condition would be adversely impacted.
Increasing competition further is the ability of guests and wholesale travel agencies to readily shop for travel services through websites with increasingly sophisticated information on product offerings and price comparisons. The growth, popularity and sophistication of Internet distribution channels has increased the overall pricing competitiveness in the airline industry, which in turn, reduces overall yield and can negatively impact revenues and profitability if these price reductions cannot be offset by sufficient increases in load factor and cost saving initiatives.
The proximity of several US airports in cities close to the Canadian border has also presented an additional challenge for us. Higher taxes and fees for guests departing from Canada travelling to the US has redirected appreciable guest traffic away from Canadian airports. Low-cost and ULCCs based in the US have and may continue to increase their capacity at these airports to attract Canadian-originating, price-sensitive, leisure guests.
Any major safety incident involving our aircraft or similar aircraft of other airl ines could materially and adversely affect our service, reputation and profitability.
A major safety incident involving our aircraft during operations could cause substantial repair or replacement costs to the damaged aircraft, a disruption in service, significant claims relating to injured guests and other parties and a negative impact on our reputation for safety, all of which may adversely affect our ability to attract and retain guests. We have an Emergency Response Plan in the event of an incident occurring.
An air carrier’s liability is limited by applicable conventions, including the Montréal and Warsaw Conventions. Any changes to these or other conventions or treaties could increase our potential liability to guests.

WestJet Annual Report 2017│ 47
We carry insurance similar to other scheduled airlines operating in the North American market. While we believe our insurance is adequate, there can be no assurance that such coverage will fully protect us against all losses that we might sustain, which could have a material adverse effect on our results of operations. There is no assurance that we will be able to obtain insurance on the same terms as we have in the past.
There is a possibility that a significant terrorist attack, pandemic or geological event could have a material impact on our operations, which could also negatively impact the insurance market and our ability to obtain coverage at current terms.
General and macroeconomic conditions may adversely affect our business, operating results and financial condition, especially in markets where we have a significant presence. Weaker economic conditions can lead to a reduction in discretionary spending and a corresponding decrease to our bookings and the price our guests are w illing to pay.
Our business is sensitive to changes in economic conditions, particularly as it affects discretionary spending for leisure travel, the larger proportion of our total traffic compared to business guests. Short-haul guests have the option to replace air travel with surface travel while business travellers may use more cost-effective measures such as teleconferencing. Weaker economic environments place a greater amount of pressure on our pricing and if we are not able to operate at a competitive and profitable price level, we would experience adverse effects to our operations, financial results, financial condition and future growth plans.
Terrorist attacks or military involvement in unstable regions may harm the airline industry.
The airline industry experienced a decline in guest traffic and revenue and increased security and insurance costs resulting from past terrorist attacks and threats. Any future incidents causing a heightened concern over potential terrorist attacks could cause a decrease in guest traffic and yields, and an increase in security measures and related costs for the airline industry generally. Increasingly restrictive security measures, such as those relating to the content of carry-on baggage, guest identification document requirements, and guest screening procedures could have a material adverse effect on guest demand for air travel and on the number of guests traveling on our flights. It could also lead to a substantial increase in insurance, airport security and other costs. Any resulting reduction in guest revenues and/or increases in costs, including insurance, security or other costs could have a material adverse effect on our business, results from operations and financial condition. Additional terrorist attacks would likely have a significant negative impact on our business and the airline industry. Should such an attack occur in Canada, the adverse impact could be material.
Government intervention, regulations, rulings or decisions rendered that impose additional requirements and restrictions on operations could increase operating costs or disrupt our operations.
The airline industry is subject to extensive laws relating to, among other things, airline safety and security, provision of services, competition, environment and labour concerns. Government entities such as Transport Canada, the Competition Bureau, the CTA, and other domestic or foreign government entities may implement new laws or regulatory schemes, or render decisions, rulings or changes in policy that could have a material adverse impact on the airline industry in general by significantly increasing the cost of airline operations, imposing additional requirements on operations or reducing the demand for air travel.
At a broader level, in 2014 the Canadian federal government undertook a review of transportation policy and the Canadian Transportation Act. The review was completed and made public in the first quarter of 2016. Post review, in late 2016 the federal government announced that it will increase the foreign ownership limit in respect of Canadian air carriers to 49% in order to expand domestic competition in the airline industry, and that it will introduce new passenger rights legislation to establish formal obligations for air carriers. Additional policy initiatives may flow from the review. Laws relating to data collection on guests and employees for security purposes and counterbalancing privacy legislation have increased costs of operations. Any material changes that add additional requirements to collecting, processing and filing data with, or otherwise reporting data to, government agencies may adversely impact our business.
The increase in security measures and clearance times required for guest travel could have a material adverse effect on guest demand and the number of guests travelling on our flights and, in turn, have a negative impact on our business.
Many aspects of airlines’ operations are subject to increasingly stringent environmental regulations, and growing concerns about climate change may result in the imposition of additional regulation particularly with respect to greenhouse gas emissions. Numerous jurisdictions around the world have implemented or announced measures to penalize for greenhouse

WestJet Annual Report 2017 | 48
gas emissions as a means to deal with climate change. Certain of these measures cover the airline industry or may do so in the future. Internationally, under the auspices of the International Civil Aviation Organization, member countries in 2016 reached agreement on developing an emission offset program to place a price on international aviation emissions as of 2020. Canada has formally stated it will adopt the program. Domestically, the Canadian federal, provincial and territorial governments have adopted or are developing emissions policies that impose a tax or emissions trading scheme on carbon emissions from fuel. The impact to us and our industry from such actions is likely to be adverse and could be significant, particularly if regulators were to conclude that emissions from commercial aircraft cause significant harm to the upper atmosphere or have a greater impact on climate change than other industries. We may be directly exposed to such measures, which could result in additional costs that could adversely affect our business. We may not be able to recover the cost of compliance with new or more stringent environmental laws and regulations from our guests, which could adversely affect our business.
Concerns about the environmental impacts of air travel and tendencies towards “green” travel initiatives where guests reduce their travel activities, could have the effect of reducing demand for air travel in Canada and abroad and could materially adversely impact our business.
Governmental fee increases discourage air travel.
All commercial service airports in Canada are regulated by the federal government. Airport authorities continue to implement or increase various user fees that impact travel costs for guests, including landing fees, navigation fees and airport improvement fees. Airport authorities generally have the unilateral discretion to implement and adjust such fees. The combination of increased fees, and increases in rents under various lease agreements between airport authorities and the Government of Canada, which in many instances are passed through to air carriers and air travellers, may negatively impact travel, in particular, discretionary travel.
Our operations are affected by a number of external factors that are beyond our control such as weather conditions, local and global pandemics and third-party work stoppages.
Delays or cancellations due to severe weather conditions and natural disasters decrease our aircraft utilization, which increases our costs, reduces our revenue and negatively impacts our guest experience. Increases in the frequency, severity or duration of thunderstorms, hurricanes or other severe weather events, including changes in the global climate, can also result in increased fuel consumption by flying through or avoiding such weather, which adversely affects our costs and potentially our on-time performance metric and guest experience.
Work stoppages or strikes by airport workers, baggage handlers, air traffic controllers, de-icing workers, fuel workers and other third-party workers not employed by us may also have a material adverse impact on our business depending on the severity of the service disruptions and the extent to which they cause delays, cancellations, increased costs and impact guest experience.
A widespread outbreak of communicable disease (whether domestic or international) or any governmental or World Health Organization travel advisories (whether relating to Canadian or international cities or regions) could affect our ability to continue full operations and could materially adversely affect demand for air travel. We cannot predict the likelihood of such a public health emergency or the effect that it may have on our business. However, any significant reduction in guest traffic on our network could have a material adverse effect on our business.

WestJet Annual Report 2017│ 49
Accounting
Critical accounting judgments and estimates
The preparation of consolidated financial statements in conformity with IFRS requires management to make judgments and estimates that could materially affect the amounts recognized in the financial statements. By their nature, judgments and estimates may change in light of new facts and circumstances in the internal and external environment. Refer to note 1 of the Notes to the Consolidated Financial Statements for a detailed discussion our accounting estimates and assumptions underlying our estimates.
The following judgments and estimates are those deemed by management to be material to the preparation of our financial statements.
Judgments
(i) Componentization
The componentization of the Corporation’s assets, namely aircraft, are based on management’s judgment of what components constitute a significant cost in relation to the total cost of an asset and whether these components have similar or dissimilar patterns of consumption and useful lives for purposes of calculating depreciation and amortization. Management has considered the market value, depreciation rates and industry practices in determining the level of componentization.
(ii) Depreciation and amortization
Depreciation and amortization methods for aircraft and related components as well as other property, plant and equipment and intangible assets are based on management’s judgment of the most appropriate method to reflect the pattern of an asset’s future economic benefit expected to be consumed. Among other factors, management considered industry standards, manufacturers’ guidelines and company-specific history and experience.
(iii) Impairment
Assessment of impairment is based on management’s judgment of whether there are sufficient internal and external factors that would indicate that an asset or cash generating unit (CGU) is impaired. The determination of CGUs is also based on management’s judgment and is an assessment of the smallest group of assets that generate cash inflows independently of other assets. Management has assessed WestJet as one CGU and considered factors such as whether an active market exists for the output produced by the asset or group of assets as well as how management monitors and makes decisions about operations to conclude that there is no impairment at December 31, 2017.
(iv) Unconsolidated structured entities
The classification of our participation in three Canadian DFCs, ten Canadian FFCs and eight US FFCs as interests in unconsolidated structured entities is based on management’s judgement of each entity including contractual relationships and the absence of equity ownership. Management has considered the restricted, narrow and well-defined objectives and activities of each FFC and DFC, the financial dependence of each FFC and DFC on the contracting airlines, including us, and the contractual terms of each FFC and DFC preventing any single airline from having control or significant influence.
(v) Operating and reportable segments
The assessment of the Corporation as one operating and reportable segment is based on management’s judgement that resource allocation decisions and performance assessments are done at a consolidated company and fleet level with a view that the Corporation manages an integrated network of markets with a consolidated fleet of different sized aircraft.
Estimates
(i) Depreciation and amortization
Depreciation and amortization on property and equipment are calculated to write off the cost, less estimated residual value, of assets on a systematic and rational basis over their expected useful lives. Estimates of residual value and useful lives are based on data and information from various sources including vendors, industry practice, and company-specific history.

WestJet Annual Report 2017 | 50
Expected useful lives and residual values are reviewed annually for any change to estimates and assumptions. Expected useful lives and amortization methods for intangible assets are reviewed annually.
(ii) Maintenance provisions
We have legal obligations to adhere to certain maintenance conditions set out in our aircraft operating lease agreements relating to the condition of the aircraft when it is returned to the lessor. To fulfill these obligations, a provision is made during the lease term. Estimates related to the maintenance provision include the likely utilization of the aircraft, the expected future cost of the maintenance, the point in time at which maintenance is expected to occur, the discount rate used to calculate the present value of future cash flows, the lifespan of life-limited parts and assumptions of lease extension terms. These estimates are based on data and information obtained from various sources including the lessor, current maintenance schedules and fleet plans, contracted costs with maintenance service providers, other vendors and company-specific history and experience.
We recognize maintenance expense in the consolidated statement of earnings based on aircraft usage and the passage of time as well as changes to previously made judgments or estimates based on new information. The unwinding of the discounted present value is recorded as a finance cost. At December 31, 2017, the Corporation’s aircraft lease maintenance provisions are discounted using a weighted average risk-free rate of approximately 1.61 per cent (December 31, 2016 – 0.96 per cent) to reflect the weighted average remaining term of approximately 40 months (December 31, 2016 – 23 months) until cash outflow. A 1.0 per cent increase in the rate we use to discount our maintenance provisions at December 31, 2017 would decrease our maintenance expense by $9.7 million in 2017.
(iii) Income taxes
Deferred tax assets and liabilities contain estimates about the nature and timing of future permanent and temporary differences as well as the future tax rates that will apply to those differences. Changes in tax laws and rates as well as changes to the expected timing of reversals may have a significant impact on the amounts recorded for deferred tax assets and liabilities. We continue to closely monitor current and potential changes to tax law and base our estimate on the best available information at each reporting date.
IFRS adopted in period
In July 2014, the International Accounting Standards Board (IASB) issued IFRS 9 – Financial instruments (IFRS 9) mandatorily effective for annual and interim reporting periods beginning on or after January 1, 2018. WestJet has adopted IFRS 9 with a date of initial application of January 1, 2017. IFRS 9 introduced new requirements for the classification and measurement of financial assets, amends the requirements related to hedge accounting and introduces a forward-looking expected loss impairment model. The standard is required to be applied retrospectively, subject to certain exemptions and exceptions, including the ability to not restate comparative information with differences being recorded in opening retained earnings in the period of initial application, prospective application of the hedge accounting requirements with limited exceptions, and no application of IFRS 9 to financial instruments that are derecognized before the date of initial application. The transition exemptions used by WestJet are discussed below.
As a result of adoption of IFRS 9 we have changed the classification of certain financial assets based on the measurement categories specified by the new accounting standard, however, there was no change to the carrying value of the financial assets or financial liabilities as a result of any changes in measurement categories of these items. Using the transitional provisions of IFRS 9, we have reclassified financial assets and liabilities based on the characteristics of each financial instrument at the date of transition.
Additionally, WestJet has elected to adopt the new general hedge accounting model in IFRS 9. The adoption of IFRS 9 did not result in any changes in the eligibility of existing hedge relationships, the accounting for derivative financial instruments designated as effective hedging instruments or the line item in which they are included in the statement of financial position. In accordance with the transitional provisions of IFRS 9, changes to hedge accounting policies have been applied prospectively.
The changes to accounting policies as a result of the implementation of IFRS 9 can be found in note 1 of the consolidated financial statements for the year ended December 31, 2017. The adoption of this standard has not had a material impact on the Corporation’s financial statements.

WestJet Annual Report 2017│ 51
Future accounting pronouncements
The IASB and International Financial Reporting Interpretations Committee (IFRIC) have issued the following standards that have not been applied in preparing our consolidated financial statements and notes thereto, for the year ended December 31, 2017 as their effective dates fall within annual periods beginning subsequent to the current reporting period.
Proposed standard Description Previous standard Effective date
IFRS 15 – Revenue from Contracts with Customers
A new standard on revenue recognition that contains a single model that applies to contracts with customers and two approaches to recognizing revenue; at a point in time or over time.
IAS 11 - Construction contracts; IAS 18 – Revenue; IFRIC 13 - Customer Loyalty Programmes; IFRIC 15 - Agreements for the Construction of Real Estate; IFRIC 18 - Transfers of Assets from Customers; SIC-31 - Revenue - Barter Transactions Involving Advertising Services
Effective for annual periods beginning on or after January 1, 2018. Early adoption is permitted.
IFRS 16 - Leases
A new standard on lease accounting addressing the principles to apply to report useful information about the amount, timing and uncertainty of cash flows arising from a lease. All lease commitments will be recognized as a liability.
IAS 17 - Leases Effective for annual periods beginning on or after January 1, 2019. Early adoption is permitted.
In May 2014, the IASB issued IFRS 15 Revenue from Contracts with Customers (IFRS 15) which provides a single revenue recognition model aimed at providing greater comparability across industries and companies. The revised IFRS standard will replace existing revenue recognition guidance and is effective for annual and interim reporting periods beginning on or after January 1, 2018. WestJet has adopted this standard on the required effective date, using the full retrospective transition method. In addition, we have elected to make use of the following practical expedients:
• WestJet applies the practical expedient in paragraph 94 of IFRS 15 and contract costs incurred related to contracts with an amortization period of less than one year will be expensed as incurred.
• WestJet applies the practical expedient in paragraph 121 of IFRS 15 and does not disclose information about remaining performance obligations that have original expected durations of one year or less.
• WestJet applies the practical expedient C5(c) of IFRS 15 and for contracts that were modified before the beginning of the earliest period presented, we do not separately evaluate the effect of the contract modification before the beginning of the earlier period presented.
• WestJet also applies the practical expedient in paragraph C5(d) of IFRS and does not disclose the amount of the transaction price allocated to the remaining performance obligations and an explanation of when we expect to recognize that amount as revenue for the year ended December 31, 2016.
We have assessed the impact of IFRS 15 and the differences are summarized below:
Passenger and ancillary breakage
We have concluded that revenue will be recognized at flight date as tickets are invalid after flight date per WestJet’s flight tariffs. Currently, breakage related to passenger tickets and ancillary fees are deferred for a period of 18 months. The impact of this change is an increase of approximately $36.1 million, net of tax, to January 1, 2017 opening retained earnings and a decrease of approximately $49.5 million to advance ticket sales.
WestJet Annual Report 2017 | 52
Consideration Payable
WestJet issues future travel credits and WestJet dollars related to flight delays, missing baggage, or other inconveniences as goodwill gestures. The current accounting policy is to record the travel credit when it is used to book a subsequent flight. Under IFRS 15, consideration payable to a customer will be recorded as a reduction to revenue and an increase to non-refundable guest credits when the travel credit is issued. This has an impact of approximately $7.8 million, net of tax, reduction to January 1, 2017 opening retained earnings and an increase of approximately $10.7 million to non-refundable guest credits.
Change fees
We have concluded that change fees, which are currently recognized at the date of the ticket change and presented in Other revenue, will be treated as a contract modification and would not be a distinct performance obligation from the guest’s subsequent flight and will be deferred until the flight occurs and presented within Guest revenue. This has an impact of approximately $3.1 million, net of tax, reduction to January 1, 2017 opening retained earnings and an increase of approximately $4.3 million to advance ticket sales.
Cancel fees
Similar to change fees, we have concluded that cancel fees, which are currently recognized at the date of ticket cancellation and credit for future travel is issued, will be treated as a contract modification and would not be a distinct performance obligation from the guest’s subsequent flight and will be deferred until the flight occurs and presented in Guest revenue. This has an impact of approximately $4.1 million, net of tax reduction to January 1, 2017 opening retained earnings and an increase of approximately $5.7 million to advance ticket sales.
Reclass of certain ancillary services
We have concluded that the majority of ancillary services, currently presented within Other revenue, will no longer be considered distinct from the guest’s associated flight and therefore, will be presented within Guest revenue. This change has no impact to January 1, 2017 opening retained earnings.
WestJet Rewards
Although we will continue to defer the revenue related to WestJet rewards received by guests until they are used towards the purchase of a new flight, the allocation methodology of how to apportion the airfare between the flight segments and WestJet rewards will change. We have evaluated the change in the allocation methodology to be immaterial and therefore there is no impact to January 1, 2017 opening retained earnings. We have also concluded that tier status is considered a marketing expense and therefore no revenue will be deferred related to the guest benefits associated with tier status.
WestJet Co-Brand MasterCard
We have assessed the impact of IFRS 15 on the WestJet MasterCard Co-Brand agreement with the Royal Bank of Canada and have identified the following performance obligations: brand, WestJet dollars, and companion vouchers. We are in the process of finalizing the valuation of each of the performance obligations identified in order to allocate the consideration received on a relative stand-alone selling price basis. We anticipate that there will be a deferral of revenue as a result of IFRS 15 as we currently do not defer any revenue related to companion vouchers.
Over the next quarter, we will continue drafting illustrative disclosures to our quarterly and annual 2018 financial statements. We will also continue to implement new business processes and internal controls required to adopt this standard.
In January 2016, the IASB issued IFRS 16 Leases (IFRS 16), effective for annual and interim reporting periods beginning on or after January 1, 2019. This standard eliminates the classification of leases as either operating leases or finance leases for a lessee, and instead, all leases are capitalized by recognizing the present value of lease payments and presenting them as either lease assets or together with property and equipment. It also allows for the service component of a lease agreement to be separated from the value of the asset and thus not reported on the statement of financial position. We anticipate the adoption of IFRS 16 will have a material impact on the statement of financial position as all aircraft operating leases will be capitalized with a corresponding lease liability. In addition to the aircraft operating leases, we must identify and review potential contracts that may contain a lease arrangement prior to quantifying the impact of IFRS 16. As at December 31,

WestJet Annual Report 2017│ 53
2017, we have completed a scoping exercise to identify the potential number and types of contracts that may contain leases within WestJet and do not anticipate an early adoption of this standard.
Controls and Procedures
Disclosure controls and procedures (DC&P)
DC&P are designed to provide reasonable assurance that all relevant information is gathered and reported to management, including the chief executive officer (CEO) and the chief financial officer (CFO), on a timely basis so that appropriate decisions can be made regarding public disclosure.
An evaluation of our DC&P was conducted, as at December 31, 2017, by management under the supervision of the CEO and the CFO. Based on this evaluation, the CEO and the CFO have concluded that, as at December 31, 2017, our DC&P, as defined in National Instrument 52-109 Certification of Disclosure in Issuers’ Annual and Interim Filings (NI 52-109), was effective.
Internal control over financial reporting (ICFR)
ICFR is designed to provide reasonable assurance regarding the reliability of financial reporting and the preparation of financial statements in accordance with GAAP. Management is responsible for establishing and maintaining adequate ICFR.
Our ICFR includes policies and procedures that pertain to the maintenance of records that provide reasonable assurance that transactions are recorded as necessary to permit preparation of the financial statements in accordance with GAAP, and that receipts and expenditures are being made only in accordance with authorizations of management and directors; pertain to the maintenance of records that in reasonable detail accurately and fairly reflect our transactions and dispositions of our assets; and are designed to provide reasonable assurance regarding prevention or timely detection of unauthorized acquisition, use or disposition of our assets that could have a material effect on our consolidated annual financial statements.
Because of its inherent limitations, ICFR can provide only reasonable assurance and may not prevent or detect misstatements. Furthermore, projections of an evaluation of effectiveness to future periods are subject to the risk that controls may become inadequate because of changes in conditions, or that the degree of compliance with the policies and procedures may deteriorate.
Management, under the supervision of the CEO and the CFO, has evaluated our ICFR using the framework and criteria established in the Internal Control – Integrated Framework (2013), issued by the Committee of Sponsoring Organizations of the Treadway Commission. Based on this evaluation, the CEO and the CFO have concluded that as at December 31, 2017, our ICFR (as defined in NI 52-109) were effective. There were no changes in our ICFR during the year ended December 31, 2017 that have materially affected, or are reasonably likely to materially affect, our ICFR.

WestJet Annual Report 2017 | 54
Forward Looking Information
This MD&A offers our assessment of WestJet’s future plans, operations and outlook and contains “forward-looking information” as defined under applicable Canadian securities legislation, including without limitation:
Forward looking statement Key assumptions Heading Page
Our plan to continue adding new destinations and additional frequencies to our existing markets through the growth of our fleet including, beginning in 2019, Boeing 787 aircraft.
Boeing and Bombardier will meet our aircraft delivery schedules and there will be availability at certain airports.
About WestJet Business development plans
7
13
We expect to complete the majority of the remaining installations of our inflight entertainment system within 2018.
Based on the current installation schedule.
Guest experience and service enhancements
11
WestJet Link flights will be operated by Pacific Coastal Airlines on a fleet of Saab 340B aircraft.
Based on the terms of the capacity purchased agreement.
Network expansion and fleet
12
A joint venture with Delta Air Lines is expected to provide our guests with access to an expanded transborder flight network and additional ancillary products and services.
Based on the current network, scheduling, and service offerings of both WestJet and Delta Air Lines.
Network expansion and fleet
12
Our expectation that as our fleet continues to expand we will establish additional profitable routes in Canada, the US and internationally.
Boeing will be able to meet our aircraft delivery commitments. Our ability and systems to assess route profitability will continue. We will have the ability to source additional aircraft capable of long haul flying to support continued international expansion.
WestJetters Network expansion and fleet
10
12
The construction of the new Calgary hangar will be completed in the spring of 2019.
Based on the current construction schedule.
Business development plans
13
Swoop will begin operating flights in June 2018, to destinations included within the initial flight network, with fares expected to be approximately 40 per cent lower than traditional airlines. We expect Swoop to achieve a CASM excluding fuel of 6.0 cents by 2019.
Based on the execution of our announced flight schedule; our ability to obtain all required regulatory approvals; execute all necessary operational agreements; and implement the required systems to support our sales and operations.
Business development plans
13
Our anticipated outlook and guidance for the first quarter of 2018 and full year 2018, where provided, for traffic, system-wide and domestic capacity, year over year change in RASM, year over year change in CASM, excluding fuel and employee profit share, fuel costs, capital expenditures and our expected effective tax rate.
Forecasted jet fuel prices of US $81 per barrel for the first quarter of 2018. Average foreign exchange rate of approximately 1.29 Canadian dollars to one US dollar for the first quarter and the full-year 2018.
No significant changes to current tax legislation. Boeing and Bombardier will meet our aircraft delivery schedules. Based on our current network planning and schedules.
Outlook
14
Our estimate of our sensitivity of fuel costs to changes in crude oil and jet fuel and sensitivity to
Forecasted full year 2018 consumption in litres and average foreign exchange
Aircraft fuel 17
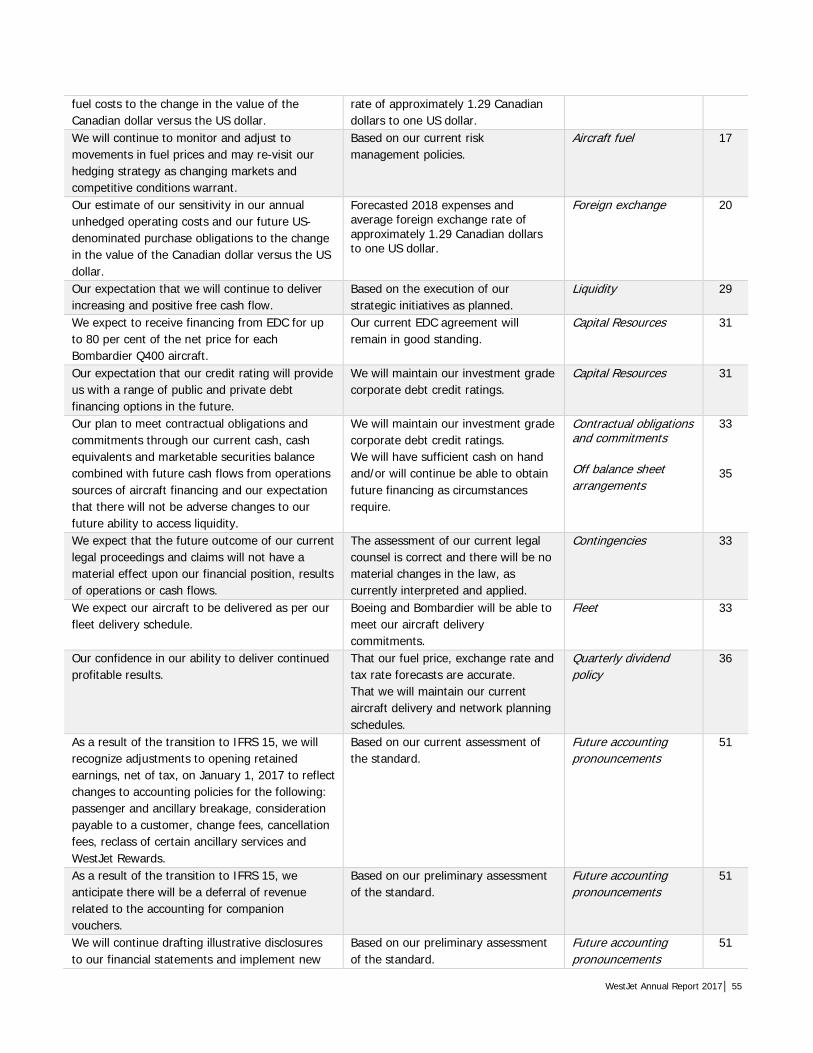
WestJet Annual Report 2017│ 55
fuel costs to the change in the value of the Canadian dollar versus the US dollar.
rate of approximately 1.29 Canadian dollars to one US dollar.
We will continue to monitor and adjust to movements in fuel prices and may re-visit our hedging strategy as changing markets and competitive conditions warrant.
Based on our current risk management policies.
Aircraft fuel 17
Our estimate of our sensitivity in our annual unhedged operating costs and our future US-denominated purchase obligations to the change in the value of the Canadian dollar versus the US dollar.
Forecasted 2018 expenses and average foreign exchange rate of approximately 1.29 Canadian dollars to one US dollar.
Foreign exchange 20
Our expectation that we will continue to deliver increasing and positive free cash flow.
Based on the execution of our strategic initiatives as planned.
Liquidity 29
We expect to receive financing from EDC for up to 80 per cent of the net price for each Bombardier Q400 aircraft.
Our current EDC agreement will remain in good standing.
Capital Resources 31
Our expectation that our credit rating will provide us with a range of public and private debt financing options in the future.
We will maintain our investment grade corporate debt credit ratings.
Capital Resources 31
Our plan to meet contractual obligations and commitments through our current cash, cash equivalents and marketable securities balance combined with future cash flows from operations sources of aircraft financing and our expectation that there will not be adverse changes to our future ability to access liquidity.
We will maintain our investment grade corporate debt credit ratings. We will have sufficient cash on hand and/or will continue be able to obtain future financing as circumstances require.
Contractual obligations and commitments Off balance sheet arrangements
33
35
We expect that the future outcome of our current legal proceedings and claims will not have a material effect upon our financial position, results of operations or cash flows.
The assessment of our current legal counsel is correct and there will be no material changes in the law, as currently interpreted and applied.
Contingencies 33
We expect our aircraft to be delivered as per our fleet delivery schedule.
Boeing and Bombardier will be able to meet our aircraft delivery commitments.
Fleet 33
Our confidence in our ability to deliver continued profitable results.
That our fuel price, exchange rate and tax rate forecasts are accurate. That we will maintain our current aircraft delivery and network planning schedules.
Quarterly dividend policy
36
As a result of the transition to IFRS 15, we will recognize adjustments to opening retained earnings, net of tax, on January 1, 2017 to reflect changes to accounting policies for the following: passenger and ancillary breakage, consideration payable to a customer, change fees, cancellation fees, reclass of certain ancillary services and WestJet Rewards.
Based on our current assessment of the standard.
Future accounting pronouncements
51
As a result of the transition to IFRS 15, we anticipate there will be a deferral of revenue related to the accounting for companion vouchers.
Based on our preliminary assessment of the standard.
Future accounting pronouncements
51
We will continue drafting illustrative disclosures to our financial statements and implement new
Based on our preliminary assessment of the standard.
Future accounting pronouncements
51

WestJet Annual Report 2017 | 56
business processes and internal controls. We anticipate the adoption of IFRS 16 will have a material impact on the statement of financial position as all aircraft operating leases will be capitalized with a corresponding lease liability. We will do not anticipate early adoption of this standard.
Based on our preliminary assessment of the standard.
Future accounting pronouncements
51

WestJet Annual Report 2017│ 57
Definition of Key Operating Indicators
Our key operating indicators are airline industry metrics, which are useful in assessing the operating performance of an airline.
Available seat miles (ASM): A measure of total guest capacity, calculated by multiplying the number of seats available for guest use in an aircraft by stage length.
Average stage length: The average distance of a non-stop flight leg between take-off and landing as defined by International Air Transport Association (IATA) guidelines.
Cost per available seat mile (CASM): Operating expenses divided by available seat miles.
Departures: One flight, counted by the aircraft leaving the ground and landing.
Load factor: A measure of total capacity utilization, calculated by dividing revenue passenger miles by total available seat miles.
Revenue passenger miles (RPM): A measure of guest traffic, calculated by multiplying the number of segment guests by stage length.
Revenue per available seat mile (RASM): Total revenue divided by available seat miles.
Segment guest: Any person who has been booked to occupy a seat on a flight leg and is not a member of the crew assigned to the flight.
Utilization: Operating hours per day per operating aircraft.
Yield (revenue per revenue passenger mile): A measure of unit revenue, calculated as the gross revenue generated per revenue passenger mile.
Non-GAAP and Additional-GAAP Measures
The following non-GAAP and additional GAAP measures are used to monitor our financial performance:
Adjusted debt: The sum of long-term debt and off-balance-sheet aircraft operating leases. Our practice, consistent with common airline industry practice, is to multiply the trailing 12 months of aircraft leasing expense by 7.5 to derive a present value debt equivalent. This measure is used in the calculation of adjusted debt-to-equity and adjusted net debt to EBITDAR, as defined below.
Adjusted diluted earnings per share: This measure is used to assess the overall performance of the Company without the effects of significant non-recurring special items that may reduce the comparability between periods and do not represent the Company’s ongoing performance. We excluded the effect of the after-tax non-cash loss of $33.2 million related to the 10 aircraft sold to Southwest being classified as held for sale in the third quarter of 2014 from net earnings to calculate adjusted diluted earnings per share for the year ended December 31, 2014.
Adjusted equity: The sum of share capital, equity reserves and retained earnings, excluding hedge reserves. This measure is used in the calculation of adjusted debt-to-equity.
Adjusted net debt: Adjusted debt less cash and cash equivalents. This measure is used in the calculation of adjusted net debt to EBITDAR, as defined below.
Adjusted net earnings: This measure is used to assess the overall performance of the Company without the effects of significant non-recurring special items that may reduce the comparability between periods and do not represent the Company’s ongoing performance. We excluded the effect of the after-tax non-cash loss of $33.2 million related to the 10 aircraft sold to Southwest being classified as held for sale in the third quarter of 2014 from net earnings to calculate adjusted diluted earnings per share for the year ended December 31, 2014.

WestJet Annual Report 2017 | 58
Adjusted EBT Margin: This measure is used to assess the profitability of the Company from period to period by measuring each dollar of profit generated from revenue without the effects of significant non-recurring special items that may reduce the comparability between periods and do not represent the Company’s ongoing performance. The adjusted EBT margin for the year ended December 31, 2014 excludes the effect of the pre-tax non-cash loss of $45.5 million related to the 10 aircraft sold to Southwest.
EBITDAR: Earnings before net finance costs, taxes, depreciation and amortization, aircraft rent and other items, such as asset impairments, gains and losses on derivatives, and foreign exchange gains or losses. Trailing 12 months EBITDAR is a measure commonly used in the airline industry to evaluate results by excluding differences in the method by which an airline finances its aircraft. The impact of gains and losses on derivatives and foreign exchange gains and losses have also been adjusted in our calculation of this measure, as these impacts are not able to be controlled by management nor are reflective of our core operating performance.
Adjusted EBITDAR: Adjusted EBITDAR excludes the effect of the pre-tax non-cash loss of $45.5 million recorded in the third quarter of 2014, related to the 10 aircraft sold to Southwest, which is not considered to represent the Company’s ongoing performance, increasing comparability between periods.
Cash to trailing 12 months of revenue: Cash as a percentage of the trailing twelve months of revenue is a measure commonly used in the airline industry to compare liquidity positions, adjusting for seasonality that may occur within a financial year.
CASM, excluding fuel and employee profit share: CASM is a measure commonly used in the airline industry to measure an airline’s cost structure and efficiency. We exclude the effects of aircraft fuel expense and employee profit share expense to assess the operating performance of our business. Fuel expense is excluded from our operating results because fuel prices are affected by a host of factors outside our control. Additionally, employee profit share expense is excluded as it varies based on the outcome of our net earnings. Excluding these expenses allows us to analyze our operating results to those of other airlines.
Return on invested capital: ROIC is a measure commonly used in the airline industry to assess the efficiency with which a company allocates its capital to generate returns. Return is calculated based on our earnings before tax, excluding special items, finance costs and implied interest on our off-balance-sheet aircraft leases. Invested capital includes average long-term debt, average finance lease obligations, average shareholders’ equity and off-balance-sheet aircraft operating leases.
Free cash flow: Operating cash flow less capital expenditures. This measure is used to calculate the amount of cash available that can be used to pursue other opportunities after maintaining and expanding the asset base.
Diluted free cash flow per share: Free cash flow divided by the diluted weighted average number of shares outstanding. This metric measures our ability to generate operating cash flows after capital expenditures on a per share basis. This metric can be used as a proxy for earnings per share and reflects our company’s solvency and ability to repay debt, pay dividends and buy back stock.
Diluted operating cash flow per share: Cash flow from operations divided by diluted weighted average shares outstanding. Measures our financial strength and our ability to generate cash from our operations on a per share basis.

WestJet Annual Report 2017│ 59
Reconciliation of non-GAAP and additional GAAP measures
The following provides a reconciliation of non-GAAP and additional GAAP measures to the nearest measure under GAAP for items presented throughout this MD&A.
CASM, excluding fuel and employee profit share
Three months ended December 31 Twelve months ended December 31 ($ in thousands) 2017 2016 Change 2017 2016 Change Operating expenses 1,039,391 932,492 106,899 4,063,360 3,682,762 380,598 Aircraft fuel expense (251,619) (210,489) (41,130) (950,043) (765,867) (184,176) Employee profit share expense (4,401) (6,454) 2,053 (46,793) (59,342) 12,549
Operating expenses, adjusted 783,371 715,549 67,822 3,066,524 2,857,553 208,971 ASMs 7,658,815,460 7,253,281,603 5.6% 30,998,306,475 29,298,340,363 5.8% CASM, excluding above items (cents) 10.23 9.87 3.6% 9.89 9.75 1.4%
Adjusted debt-to-equity
($ in thousands) December 31
2017 December 31
2016 Change
Long-term debt(i) 2,049,047 2,046,658 2,389 Off-balance-sheet aircraft operating leases(ii) 1,244,265 1,338,338 (94,073) Adjusted debt 3,293,312 3,384,996 (91,684) Total shareholders’ equity 2,212,524 2,060,702 151,822 Add: Hedge reserves 1,902 11,003 (9,101) Adjusted equity 2,214,426 2,071,705 142,721 Adjusted debt-to-equity 1.49 1.63 (8.6%) (i) At December 31, 2017, long-term debt includes the current portion of long-term debt of $153,149 (December 31, 2016 – $145,128) and long-term portion of
$1,895,898 (December 31, 2016 – $1,901,530).
(ii) Off-balance-sheet aircraft operating leases are calculated by multiplying the trailing 12 months of aircraft leasing expense by 7.5. At December 31, 2017, the trailing 12 months of aircraft leasing expenses totalled $165,902 (December 31, 2016 – $178,445).
Adjusted net debt to EBITDAR
($ in thousands) December 31
2017 December 31
2016 Change
Adjusted debt 3,293,312 3,384,996 (91,684) Less: Cash, cash equivalents and marketable securities (1,373,166) (1,520,822) 147,656 Adjusted net debt 1,920,146 1,864,174 55,972 Net earnings 283,578 295,458 (11,880)
Add: Net finance costs(i) 34,084 32,456 1,628 Taxes 120,557 120,775 (218) Depreciation and amortization 403,021 350,484 52,537 Aircraft leasing 165,902 178,445 (12,543) Other(ii) 7,303 (11,906) 19,209 EBITDAR 1,014,445 965,712 48,733 Adjusted net debt to EBITDAR(iii) 1.89 1.93 (2.1%) (i) At December 31, 2017, net finance costs includes the trailing 12 months of finance income of $19,626 (December 31, 2016 – $16,618) and the trailing 12
months of finance cost of $53,710 (December 31, 2016 – $49,074).
(ii) At December 31, 2017, other includes the trailing 12 months foreign exchange loss of $4,877 and a loss on derivatives of $2,426 (December 31, 2016 – gain of $7,402 and gain of $4,504).
(iii) At December 31, 2017 and December 31, 2016, the Corporation met its internal guideline of an adjusted net debt to EBITDAR measure of no more than 2.50.

WestJet Annual Report 2017 | 60
Operating cash flow per share
Twelve months ended December 31 ($ in thousands, except share per share data) 2017 2016 Change Cash flow from operating activities 1,012,073 704,587 307,486 Weighted average number of shares outstanding - diluted 117,364,926 120,610,704 (3,245,778) Diluted operating cash flow per share 8.62 5.84 47.6%
Free cash flow
Twelve months ended December 31 ($ in thousands, except per share data) 2017 2016 Change Cash flow from operating activities 1,012,073 704,587 307,486
Adjusted for: Aircraft additions(i) (890,815) (859,474) (31,341) Other property and equipment and intangible additions(i) (44,217) (82,868) 38,651
Free cash flow 77,041 (237,755) 314,796 Weighted average number of shares outstanding - diluted 117,364,926 120,610,704 (3,245,778) Diluted free cash flow per share 0.66 (1.97) 133.5% (i) Aircraft additions and other property and equipment and intangible additions above are net of proceeds from disposals and exclude non-cash amounts
included in the consolidated statement of cash flows.
Cash to trailing 12 months revenue
($ in thousands) December 31
2017 December 31
2016 Change
Cash, cash equivalents and marketable securities 1,373,166 1,520,822 (147,656) Trailing 12 months revenue 4,502,320 4,122,859 379,461 Cash to trailing 12 months revenue (i) 30.5% 36.9% (6.4 pts.) (i) At December 31, 2017 and December 31, 2016, the Corporation met its internal guideline of cash to trailing 12 months revenue of approximately 30 per cent.
Return on invested capital
($ in thousands) December 31
2017 December 31
2016 Change
Earnings before income taxes (trailing twelve months) 404,135 416,233 (12,098) Add: Finance costs 53,710 49,074 4,636 Implicit interest in operating leases(i) 87,099 93,684 (6,585) Return 544,944 558,991 (14,047) Invested capital: Average long-term debt(ii) 2,047,853 1,610,746 437,107 Average shareholders' equity 2,136,613 2,010,348 126,265 Off-balance-sheet aircraft leases(iii) 1,244,265 1,338,338 (94,073) Invested capital 5,428,731 4,959,432 469,299 Return on invested capital 10.0% 11.3% (1.3 pts.) (i) Interest implicit in operating leases is equal to 7.0 per cent of 7.5 times the trailing 12 months of aircraft lease expense. 7.0 per cent is a proxy and does not
necessarily represent actual for any given period.
(ii) Average long-term debt includes the current portion and long-term portion.
(iii) Off-balance-sheet aircraft operating leases are calculated by multiplying the trailing 12 months of aircraft leasing expense by 7.5. At December 31, 2017, the trailing 12 months of aircraft leasing expenses totalled $165,902 (December 31, 2016 – $178,445).

WestJet Annual Report 2017│ 61
Adjusted net debt to adjusted EBITDAR
($ in thousands) December 31, 2014 Adjusted debt 2,557,038 Less: Cash and cash equivalents (1,358,071) Adjusted net debt 1,198,967 Net earnings 283,957
Add: Net finance costs(i) 34,768 Taxes 106,350 Depreciation and amortization 226,740 Aircraft leasing 182,450 Other(ii) 2,064 EBITDAR 836,329 Special Item(iii) 45,459 Adjusted EBITDAR 881,788 Adjusted net debt to EBITDAR(iv) 1.43 Adjusted net debt to adjusted EBITDAR 1.36 (i) At December 31, 2014, net finance costs includes the trailing 12 months of finance income of $17,070 and the trailing 12 months of finance cost of $51,838.
(iv) At December 31, 2014, other includes the trailing 12 months foreign exchange loss of $2,064.
(v) Pre-tax non-cash loss of $45.5 million recorded in the third quarter of 2014 associated with the sale of 10 aircraft to Southwest.
(vi) At December 31, 2014, the Corporation met its internal guideline of an adjusted net debt to EBITDAR measure of no more than 2.50.
Adjusted EBT Margin
($ in thousands) Twelve months ended
December 31, 2014 Revenue 3,976,552 EBT 390,307 Adjusted for: Special item(i) 45,459 Adjusted EBT 435,766 Adjusted EBT margin 11.0% (i) Pre-tax non-cash loss of $45.5 million recorded in the third quarter of 2014 associated with the sale of the 10 aircraft to Southwest

WestJet Annual Report 2017 | 62
Return on invested capital
($ in thousands) December 31 2014 Earnings before income taxes (trailing twelve months) 390,307 Special item(i) 45,459 Adjusted earnings before income taxes (trailing twelve months) 435,766 Add: Finance costs 51,838 Implicit interest in operating leases(ii) 95,786 Return 583,390 Invested capital: Average long-term debt(iii) 1,033,529 Average shareholders' equity 1,683,671 Off-balance-sheet aircraft leases(iv) 1,368,375 Invested capital 4,085,575 Return on invested capital 14.3% (i) Pre-tax non-cash loss of $45.5 million recorded in the third quarter of 2014 associated with the sale of 10 aircraft to Southwest.
(ii) Interest implicit in operating leases is equal to 7.0 per cent of 7.5 times the trailing 12 months of aircraft lease expense. 7.0 per cent is a proxy and does not necessarily represent actual for any given period.
(iii) Average long-term debt includes the current portion and long-term portion.
(iv) Off-balance-sheet aircraft operating leases are calculated by multiplying the trailing 12 months of aircraft leasing expense by 7.5. At December 31, 2015, the trailing 12 months of aircraft leasing expenses totaled $174,089 (December 31, 2014 – $182,450).
Adjusted net earnings/ Adjusted diluted earnings per share
($ in thousands, except share and per share data) Twelve months ended December 31, 2014
Net earnings 283,957 Adjusted for: Special item(i) 33,231 Adjusted net earnings 317,188 Weighted average number of shares outstanding - diluted 129,142,940 Adjusted diluted earnings per share 2.46 (i) After-tax non-cash loss of $33.2 million recorded in the third quarter of 2014 associated with the sale of 10 aircraft to Southwest.

Financial Statements and Notes
Consolidated Financial Statements and Notes For the years ended December 31, 2017 and 2016
WestJet Airlines Ltd. Annual 2017 Financial Statements and Notes February 5, 2018
WestJet Annual Report 2017 │ 64
MANAGEMENT’S REPORT TO THE SHAREHOLDERS
The consolidated financial statements have been prepared by management in accordance with International Financial Reporting Standards. When a choice between accounting methods exists, management has chosen those they deem most appropriate in the circumstances. Financial statements will, by necessity, include certain amounts based on judgments and estimates. Management has determined such amounts on a reasonable basis so that the consolidated financial statements are presented fairly in all material respects. All information in this report is the responsibility of management.
Management has established systems of internal control, including disclosure controls and procedures and internal controls over financial reporting, which are designed and operated to provide reasonable assurance that financial and non-financial information is disclosed in a timely, complete, relevant and accurate manner. These systems of internal control also serve to safeguard the Corporation’s assets. The systems of internal control are monitored by management and are further supported by an internal audit department whose functions include reviewing internal controls and their applications.
The Board of Directors is responsible for the overall stewardship and governance of the Corporation, including obtaining reasonable assurance management fulfills its responsibilities for financial reporting and internal control, and reviewing and approving the consolidated financial statements. The Board carries out these responsibilities principally through its Audit Committee.
The Audit Committee of the Board of Directors, composed of independent Directors, meets regularly with management, the internal auditors and the external auditors to satisfy itself that each is properly discharging its responsibilities and to review the consolidated financial statements and management’s discussion and analysis. The Audit Committee reports its findings to the Board of Directors prior to the approval of the consolidated financial statements and management’s discussion and analysis for issuance to the shareholders. The Audit Committee also recommends, for review by the Board of Directors and approval of shareholders, the reappointment of the external auditors. The internal and external auditors have full and free access to the Audit Committee.
The consolidated financial statements have been audited by KPMG LLP, the independent external auditors, in accordance with Canadian Generally Accepted Auditing Standards on behalf of the shareholders. The auditors’ report outlines the scope of their examination and sets forth their opinion.
Gregg Saretsky Harry Taylor President and Executive Vice-President, Finance and Chief Executive Officer Chief Financial Officer
February 5, 2018 Calgary, Canada

WestJet Annual Report 2017 │ 65
INDEPENDENT AUDITORS’ REPORT
To the Shareholders of WestJet Airlines Ltd.
We have audited the accompanying consolidated financial statements of WestJet Airlines Ltd., which comprise the consolidated statements of financial position at December 31, 2017 and December 31, 2016, the consolidated statements of earnings, changes in equity, cash flows and comprehensive income for the years then ended, and notes, comprising a summary of significant accounting policies and other explanatory information.
Management's Responsibility for the Consolidated Financial Statements
Management is responsible for the preparation and fair presentation of these consolidated financial statements in accordance with International Financial Reporting Standards and for such internal controls as management determines are necessary to enable the preparation of consolidated financial statements that are free from material misstatement, whether due to fraud or error.
Auditors’ Responsibility
Our responsibility is to express an opinion on these consolidated financial statements based on our audits. We conducted our audits in accordance with Canadian Generally Accepted Auditing Standards. Those standards require that we comply with ethical requirements and plan and perform the audit to obtain reasonable assurance about whether the consolidated financial statements are free from material misstatement.
An audit involves performing procedures to obtain audit evidence about the amounts and disclosures in the consolidated financial statements. The procedures selected depend on our judgment, including the assessment of the risks of material misstatement of the consolidated financial statements, whether due to fraud or error. In making those risk assessments, we consider internal controls relevant to the entity’s preparation and fair presentation of the consolidated financial statements in order to design audit procedures that are appropriate in the circumstances, but not for the purpose of expressing an opinion on the effectiveness of the entity’s internal controls. An audit also includes evaluating the appropriateness of accounting policies used and the reasonableness of accounting estimates made by management as well as evaluating the overall presentation of the consolidated financial statements.
We believe that the audit evidence we have obtained in our audits is sufficient and appropriate to provide a basis for our audit opinion.
Opinion
In our opinion, the consolidated financial statements present fairly, in all material respects, the consolidated financial position of WestJet Airlines Ltd. at December 31, 2017 and December 31, 2016, and its consolidated financial performance and its consolidated cash flows for the years then ended in accordance with International Financial Reporting Standards.
Chartered Professional Accountants February 5, 2018 Calgary, Canada

WestJet Annual Report 2017 │ 66
Consolidated Statement of Earnings For the years ended December 31 (Stated in thousands of Canadian dollars, except per share amounts)
Note
2017
2016 Revenue: Guest 3,822,045 3,556,941
Other 680,275 565,918 4,502,320 4,122,859 Operating expenses:
Aircraft fuel 950,043 765,867 Salaries and benefits 935,145 854,056
Rates and fees 644,763 617,573 Depreciation and amortization 6 403,021 350,484 Sales and marketing 384,452 356,745 Maintenance 203,227 209,226 Aircraft leasing 165,902 178,445 Other 330,014 291,024 Employee profit share 46,793 59,342
4,063,360 3,682,762 Earnings from operations 438,960 440,097 Non-operating income (expense):
Finance income 19,626 16,618 Finance cost 14 (53,710) (49,074) Gain (loss) on foreign exchange (4,877) 7,402 Gain (loss) on disposal of property and equipment 6,562 (3,314) Gain (loss) on derivatives (2,426) 4,504
(34,825) (23,864) Earnings before income tax 404,135 416,233 Income tax expense (recovery):
Current 10 58,645 133,055 Deferred 10 61,912 (12,280)
120,557 120,775 Net earnings 283,578 295,458 Earnings per share:
Basic 13 2.44 2.46 Diluted 13 2.42 2.45
The accompanying notes are an integral part of the consolidated financial statements.

WestJet Annual Report 2017 │ 67
Consolidated Statement of Financial Position At December 31 (Stated in thousands of Canadian dollars)
Note
2017
2016 Assets Current assets:
Cash and cash equivalents 4 1,147,076 1,520,822 Marketable securities 4 226,090 - Total cash, cash equivalents and marketable securities 1,373,166 1,520,822 Restricted cash 5 109,700 102,649 Accounts receivable 18 129,648 127,785 Prepaid expenses, deposits and other 18 138,676 181,070 Inventory 18 43,045 33,535
1,794,235 1,965,861 Non-current assets:
Property and equipment 6 4,567,504 4,036,880 Intangible assets 7 59,517 66,187 Other assets 18 78,584 95,368
Total assets 6,499,840 6,164,296 Liabilities and shareholders’ equity Current liabilities:
Accounts payable and accrued liabilities 18 549,844 547,490 Advance ticket sales 695,111 626,635 Deferred rewards program 203,433 155,567 Non-refundable guest credits 43,288 42,942 Current portion of maintenance provisions 8 82,129 103,571 Current portion of long-term debt 9 153,149 145,128
1,726,954 1,621,333 Non-current liabilities:
Maintenance provisions 8 270,347 262,663 Long-term debt 9 1,895,898 1,901,530 Other liabilities 18 19,171 8,374 Deferred income tax 10 374,946 309,694
Total liabilities 4,287,316 4,103,594 Shareholders’ equity:
Share capital 11 548,977 555,716 Equity reserves 97,514 93,039 Hedge reserves (1,902) (11,003) Retained earnings 1,567,935 1,422,950
Total shareholders’ equity 2,212,524 2,060,702 Total liabilities and shareholders’ equity 6,499,840 6,164,296
The accompanying notes are an integral part of the consolidated financial statements. On behalf of the Board:
Gregg Saretsky, Director Hugh Bolton, Director

WestJet Annual Report 2017 │ 68
Consolidated Statement of Cash Flows For the years ended December 31 (Stated in thousands of Canadian dollars)
Note
2017 2016 Operating activities: Net earnings 283,578 295,458 Items not involving cash:
Depreciation and amortization 403,021 350,484 Change in maintenance provisions 65,372 82,564 Amortization of transaction costs 4,807 5,092 Amortization of hedge settlements - 833 (Gain) loss on derivatives 4,059 (2,472) (Gain) loss on disposal of property and equipment (6,562) 3,314 Share-based payment expense 11 19,050 18,432 Deferred income tax expense (recovery) 61,912 (12,280) Unrealized foreign exchange (gain) loss 2,496 (4,498)
Change in non-cash working capital 237,663 40,384 Change in restricted cash (7,051) (34,076) Change in other assets (1,296) 7,129 Change in other liabilities 6,379 (2,486) Purchase of shares pursuant to compensation plans (4,784) (7,197) Maintenance provision settlements (56,571) (36,094) 1,012,073 704,587 Investing activities: Aircraft additions (881,069) (847,718) Aircraft disposals 9,511 4,660 Other property and equipment and intangible additions and disposals (48,855) (76,996) Purchases of marketable securities (231,293) - Change in non-cash working capital (16,009) (22,288) (1,167,715) (942,342) Financing activities: Increase in long-term debt 186,796 998,715 Repayment of long-term debt (154,249) (157,193) Shares repurchased 11 (90,317) (126,152) Dividends paid 12 (64,886) (66,967) Cash interest paid (63,188) (56,046) Change in non-cash working capital (14,597) (14,026) (200,441) 578,331 Cash flow from/(used in) operating, investing and financing activities (356,083) 340,576 Effect of foreign exchange on cash and cash equivalents (17,663) (3,551) Net change in cash and cash equivalents (373,746) 337,025 Cash and cash equivalents, beginning of year 1,520,822 1,183,797 Cash and cash equivalents, end of year 1,147,076 1,520,822 Supplemental disclosure of operating cash flows Cash interest received 17,634 16,148 Cash taxes paid, net (97,911) (118,014)
The accompanying notes are an integral part of the consolidated financial statements.

WestJet Annual Report 2017 │ 69
Consolidated Statement of Changes in Equity For the years ended December 31 (Stated in thousands of Canadian dollars)
Note
2017 2016
Share capital: Balance, beginning of year 11 555,716 582,796
Issuance of shares pursuant to compensation plans 11 10,131 1,146 Shares repurchased 11 (16,870) (28,226)
548,977 555,716 Equity reserves:
Balance, beginning of year 93,039 82,713 Share-based payment expense 11 19,050 18,432 Issuance of shares pursuant to compensation plans (14,575) (8,106)
97,514 93,039 Hedge reserves:
Balance, beginning of year (11,003) 1,903 Other comprehensive income (loss) 9,101 (12,906)
(1,902) (11,003) Retained earnings:
Balance, beginning of year 1,422,950 1,292,581 Dividends declared 12 (64,886) (66,967) Shares repurchased 11 (73,447) (97,926) Purchase of shares pursuant to compensation plans (260) (196) Net earnings 283,578 295,458
1,567,935 1,422,950 Total shareholders’ equity 2,212,524 2,060,702
The accompanying notes are an integral part of the consolidated financial statements.

WestJet Annual Report 2017 │ 70
Consolidated Statement of Comprehensive Income For the years ended December 31 (Stated in thousands of Canadian dollars)
2017 2016
Net earnings 283,578 295,458 Items that are or may be reclassified to net earnings: Other comprehensive income (loss), net of tax: Amortization of hedge settlements to aircraft leasing - 833 Net unrealized loss on foreign exchange derivatives(i) (10,336) (6,042) Reclassification of net realized (gain) loss on foreign exchange derivatives(ii) 5,385 (3,683) Net unrealized gain on interest rate derivatives(iii) 5,181 1,037 Reclassification of net realized loss on interest rate derivatives(iv) 2,009 2,838 Net unrealized gain (loss) on cross-currency swap derivatives(v) 6,903 (7,718) Reclassification of net realized gain on cross-currency swap derivatives(vi) (41) (171) 9,101 (12,906) Total comprehensive income 292,679 282,552
(i) Net of income taxes of $3,814 (2016 – $2,219).
(ii) Net of income taxes of $(1,985) (2016 – $1,352).
(iii) Net of income taxes of $(1,913) (2016 – $(374)).
(iv) Net of income taxes of $(737) (2016 – $(1,044)).
(v) Net of income taxes of $(2,534) (2016 – $2,837).
(vi) Net of income taxes of $15 (2016 – $63).
The accompanying notes are an integral part of the consolidated financial statements.

Notes to Consolidated Financial Statements As at and for the years ended December 31, 2017 and 2016 (Stated in thousands of Canadian dollars, except percentage, ratio, share and per share amounts)
WestJet Annual Report 2017 │ 71
1. Statement of significant accounting policies
The annual consolidated financial statements of WestJet Airlines Ltd. (the Corporation) for the years ended December 31, 2017 and 2016 were authorized for issue by the Board of Directors on February 5, 2018. The Corporation is a public company incorporated and domiciled in Canada. The Corporation provides airline service and travel packages. The Corporation’s shares are publicly traded on the Toronto Stock Exchange (TSX) under the symbol WJA. The principal business address is 22 Aerial Place N.E., Calgary, Alberta, T2E 3J1 and the registered office is Suite 2400, 525 - 8 Avenue S.W., Calgary, Alberta, T2P 1G1.
(a) Basis of presentation
These annual consolidated financial statements and the notes hereto have been prepared in accordance with International Financial Reporting Standards (IFRS) as issued by the International Accounting Standards Board (IASB).
These annual consolidated financial statements have been prepared on an historical cost basis except for certain financial assets and liabilities, including derivative financial instruments that are measured at fair value. Where applicable, these differences have been described in the notes hereto.
Amounts presented in these annual consolidated financial statements and the notes hereto are in Canadian dollars, the Corporation’s reporting currency, unless otherwise stated. The Corporation’s functional currency is the Canadian dollar.
(b) Principles of consolidation
The accompanying consolidated financial statements include the accounts of the Corporation and its subsidiaries. Subsidiaries consist of entities over which the Corporation is exposed to, or has rights to, variable returns as well as the ability to affect those returns through the power to direct the relevant activities of the entity. A description of the Corporation’s subsidiaries is provided in Note 17. All intercompany balances and transactions between the Corporation and its subsidiaries have been eliminated.
(c) Seasonality
The airline industry is sensitive to general economic conditions and the seasonal nature of air travel. The Corporation experiences increased domestic travel in the summer months and more demand for transborder and international travel over the winter months, thus reducing the effects of seasonality on net earnings.
(d) Revenue recognition
(i) Guest
Guest revenue, including the air component of vacation packages, is recognized when air transportation is provided. Tickets sold but not yet used are reported in the consolidated statement of financial position as advance ticket sales.
(ii) Other
Other revenue includes items such as net revenue from the sale of the land component of vacation packages, ancillary fees as well as cargo and charter revenue.
Revenue for the land component of vacation packages is generated from providing agency services equal to the amount paid by the guest for products and services, less payment to the travel supplier, and is reported at the net amount received. Revenue from the land component is deferred as advance ticket sales and recognized in earnings on departure of the vacation.
Ancillary revenue is recognized when the services and products are provided to the guest. Ancillary revenues include items such as fees associated with guest itinerary changes or cancellations, Plus upgrades, baggage fees, buy-on-board sales, pre-reserved seating fees and breakage from the WestJet Rewards Program relating to partner funded credits.

Notes to Consolidated Financial Statements As at and for the years ended December 31, 2017 and 2016 (Stated in thousands of Canadian dollars, except percentage, ratio, share and per share amounts)
WestJet Annual Report 2017 │ 72
1. Statement of significant accounting policies (continued)
(d) Revenue recognition (continued)
(iii) WestJet Rewards Program
The Corporation has a rewards program that allows guests to accumulate credits based on their WestJet travel spend to be used towards future flights and vacation packages. Revenue received in relation to credits issued is deferred as a liability until the credit is utilized and air transportation is provided, at which time it is recognized in guest revenue. Revenue associated with WestJet issued credits expected to expire (breakage) is recognized in guest revenue at the time the credit is issued.
The Corporation also has a co-branded MasterCard with the Royal Bank of Canada (RBC). RBC issues and funds reward credits to cardholders as a percentage of their total retail spend. The Corporation records a receivable and liability for reward credits issued and funded by RBC for cardholder retail spend. Revenue related to reward credits redeemed is deferred as advance ticket sales at the time of booking and subsequently recognized in guest revenue at the time of travel. Revenue related to new credit cards issued is recognized in other revenue immediately upon activation.
(iv) Non-refundable guest credits
The Corporation issues future travel credits to guests for flight changes and cancellations. Where appropriate, travel credits are also issued for flight delays, missing baggage and other inconveniences. All credits are non-refundable and have expiry dates dependent upon the nature of the credit. The Corporation records a liability at face value for credits issued for flight changes and cancellations. Revenue related to flight changes and cancellations is recorded in guest revenue when air transportation is provided. When the Corporation provides travel credits related to flight delays, missing baggage or other inconveniences as goodwill gestures, a performance obligation is not created until such time as the guest utilizes the credit to book a flight. These credits are recorded as a reduction to guest revenue to offset any revenue generated from the booking.
(e) Adoption of IFRS 9 – Financial instruments
The Corporation has early adopted IFRS 9 Financial Instruments issued in July 2014 (IFRS 9), with a date of initial application of January 1, 2017. IFRS 9 introduces new requirements for the classification and measurement of financial assets, amends the requirements related to hedge accounting, and introduces a forward-looking expected loss impairment model. The adoption of this standard has not had a material impact on the Corporation’s financial statements.
IFRS 9 contains three classification categories for financial assets: measured at amortized cost, fair value through other comprehensive income (FVOCI) and fair value through profit or loss (FVTPL). The classification of financial assets under IFRS 9 is based on the business model in which a financial asset is managed and its contractual cash flow characteristics. The standard eliminates the previous IAS 39 categories of held to maturity, loans and receivables and available for sale. Most of the requirements in IAS 39 for classification and measurement of financial liabilities were carried forward in IFRS 9 and the adoption of IFRS 9 has not had an impact on the Corporations accounting policies for financial liabilities.
The following table summarizes the classification and measurement changes for each class of the Corporation’s financial assets and financial liabilities upon adoption at January 1, 2017.
IAS 39 IFRS 9 Financial Asset (Liability) Category Measurement Category Measurement Cash FVTPL Fair value Assets at amortized cost Amortized cost Cash equivalents FVTPL Fair value Assets at amortized cost Amortized cost Restricted cash FVTPL Fair value Assets at amortized cost Amortized cost Accounts receivable Loans and receivables Amortized cost Assets at amortized cost Amortized cost Deposits FVTPL Fair value Assets at amortized cost Amortized cost Foreign exchange derivatives FVTPL Fair value FVTPL Fair value Cross currency interest rate swap derivatives
FVTPL Fair value FVTPL Fair value
Interest rate derivatives FVTPL Fair value FVTPL Fair value Accounts payable and accrued liabilities
Other financial liabilities Amortized cost Financial liabilities at amortized cost
Amortized cost
Long-term debt Other financial liabilities Amortized cost Financial liabilities at amortized cost
Amortized cost

Notes to Consolidated Financial Statements As at and for the years ended December 31, 2017 and 2016 (Stated in thousands of Canadian dollars, except percentage, ratio, share and per share amounts)
WestJet Annual Report 2017 │ 73
1. Statement of significant accounting policies (continued)
(e) Adoption of IFRS 9 – Financial instruments (continued)
As a result of adopting IFRS 9, certain financial assets were reclassified from fair value through profit and loss to assets at amortized cost. The change in classification category did not result in an adjustment to the carrying amount of the related assets. In accordance with the transition provisions of IFRS 9, the financial assets and liabilities held at January 1, 2017 were reclassified based on the characteristics of each financial instrument at January 1, 2017.
The Corporation has adopted the new general hedge accounting model in IFRS 9. The adoption of IFRS 9 did not result in any changes in the eligibility of existing hedge relationships, the accounting for derivative financial instruments designated as effective hedging instruments or the line items in which they are included in the statement of financial position. In accordance with the transitional provisions of IFRS 9, changes to hedge accounting policies have been applied prospectively.
Changes in accounting policies resulting from the adoption of IFRS 9 have been applied retrospectively, except assessments relating to the determination of the business model within which a financial asset is held, which have been made on the basis of the facts and circumstances that existed at the date of initial application. Additionally, for financial assets with a low credit risk at the date of initial application of IFRS 9, the Corporation has concluded that the credit risk on the asset had not increased significantly since its initial recognition, due to the nature and term of the financial assets.
(f) Financial instruments
Financial assets are initially measured at fair value. On initial recognition, the Corporation classifies its financial assets as subsequently measured at either amortized cost or fair value, depending on its business model for managing the financial assets and the contractual cash flow characteristics of the financial assets. Financial assets are not reclassified subsequent to their initial recognition, unless the Corporation changes its business model for managing financial assets.
A financial asset is measured at amortized cost if it meets both of the following conditions and is not designated as FVTPL:
(i) The asset is held within a business model whose objective is to hold assets to collect contractual cash flows; and
(ii) The contractual terms of the financial asset give rise on specified dates to cash flows that are solely payments of principal and interest on the principal amount outstanding.
All other financial assets are subsequently measured at their fair values with changes in fair value, including any interest or dividend income, recognized in profit or loss.
The Corporation uses the “expected credit loss” model for calculating impairment and recognizes expected credit losses as a loss allowance for assets measured at amortized cost. The Corporations trade and other receivables are typically short-term with payments received within a 12-month period, and do not have a significant financing component. Therefore, the Corporation recognizes an amount equal to the lifetime expected credit losses based on the Corporation’s historical experience and including forward-looking information. The carrying amount of these assets in the consolidated statement of financial position is net of any loss allowance. As a result of the adoption of IFRS 9, no additional provision for impairment was required.
When financial assets and liabilities are designated as part of a hedging relationship and qualify for hedge accounting, they are classified and accounted for as either cash flow hedges, fair value hedges or a hedge of a net investment. The Corporation’s policy is not to utilize derivative financial instruments for trading or speculative purposes. At inception of designated hedging relationships, the Corporation documents the risk management objective and strategy for undertaking the hedge. The Corporation also documents the economic relationship between the hedged item and the hedging instrument, including whether the changes in cash flows of the hedged item and hedging instrument are expected to offset each other.
(g) Cash flow hedges
The Corporation uses forward foreign exchange contracts to hedge the variability in cash flows arising from changes in foreign exchange rates relating to U.S. dollar operating expenditures, including aircraft lease payments and the non-air component of vacation packages. Additionally, the Corporation also uses interest rate swaps to hedge the variability in cash flows resulting from fluctuations in interest rates on variable rate debt. The Corporation has elected to designate these instruments in their entirety as hedging instruments for hedge accounting purposes, including both the spot and forward elements of the contract in the valuation of the instrument. The Corporation has established a hedge ratio of 1:1 for all its hedging relationships.
Under cash flow hedge accounting, the effective portion of the change in the fair value of the hedging instrument is recognized in other comprehensive income (OCI) and presented within shareholders’ equity as hedge reserves. The ineffective portion of the change in fair value is recognized in non-operating income (expense). Upon maturity of the hedged instrument, the effective gains and losses previously accumulated in hedge reserves are recorded in net earnings under the same caption as the hedged item.

Notes to Consolidated Financial Statements As at and for the years ended December 31, 2017 and 2016 (Stated in thousands of Canadian dollars, except percentage, ratio, share and per share amounts)
WestJet Annual Report 2017 │ 74
1. Statement of significant accounting policies (continued)
(g) Cash flow hedges (continued)
With respect to hedges of foreign currency exposure, the Corporation determines the existence of an economic relationship between the hedging instrument and hedged item based on the currency, amount and timing of their respective cash flows. The Corporation assesses whether the derivative designated in each hedging relationship is expected to be and has been effective in offsetting changes in cash flows of the hedged item using the hypothetical derivative method. In these hedge relationships, the main sources of ineffectiveness are the effect of the counterparty and the Corporation’s own credit risk on the fair value of the forward foreign exchange contracts, which is not reflected in the change in the fair value of the hedged cash flows attributable to the change in the exchange rates, and the presence of embedded derivative features in the hedged item that are not included in the terms of the related hedging instrument, such as early redemption features.
For hedges of interest rate risk exposure, the Corporation determines the existence of an economic relationship between the hedging instrument and hedged item based on the reference interest rates, repricing dates and maturities and the notional amounts. The Corporation assesses whether the derivative designated in each hedging relationship is expected to be effective in offsetting changes in cash flows of the hedged item using the hypothetical derivative method. With respect to these hedging relationships, the main source of ineffectiveness relates to the effect of the counterparty and the Corporations credit risk on the fair value of the swaps, which is not reflected in the change in the fair value of the hedged cash flows. If the hedging relationship ceases to qualify for cash flow hedge accounting, then hedge accounting is discontinued prospectively and any change in fair value of the instrument from the point it ceases to qualify is recorded in non-operating income (expense). Amounts previously accumulated in hedge reserves will remain in shareholders’ equity until the hedged item is settled, at which time, the amount is recorded in net earnings under the same caption as the hedged item. If the transaction is no longer expected to occur, amounts previously accumulated in hedge reserves will be reclassified to non-operating income (expense).
(h) Foreign currency
Monetary assets and liabilities, denominated in foreign currencies, are translated into Canadian dollars at the rate of exchange in effect at the consolidated statement of financial position date, with any resulting gain or loss recognized in net earnings. Non-monetary assets, non-monetary liabilities, revenue and expenses arising from transactions denominated in foreign currencies are translated into Canadian dollars at the rates prevailing at the time of the transaction.
(i) Cash and cash equivalents
Cash and cash equivalents consist of cash and short-term investments that are highly liquid in nature and have maturity dates of up to three months.
(j) Marketable securities
Marketable securities consist of investments with maturity dates of greater than three months but less than twelve months. All marketable securities are classified as amortized cost with interest earned reflected in finance income in the consolidated statement of earnings.
(k) Inventory
Inventories are valued at the lower of cost and net realizable value, with cost being determined on a first-in, first-out basis and a specific item basis depending on the nature of the inventory. The Corporation’s inventory balance consists of aircraft fuel, de-icing fluid and aircraft expendables.

Notes to Consolidated Financial Statements As at and for the years ended December 31, 2017 and 2016 (Stated in thousands of Canadian dollars, except percentage, ratio, share and per share amounts)
WestJet Annual Report 2017 │ 75
1. Statement of significant accounting policies (continued)
(l) Property and equipment
Property and equipment is stated at cost and depreciated to its estimated residual value. Expected useful lives and depreciation methods are reviewed annually.
Asset class Basis Rate Aircraft, net of estimated residual value Straight-line 15 to 20 years Engine, airframe and landing gear overhaul Straight-line 3 to 12 years Ground property and equipment Straight-line 3 to 25 years Spare engines and rotables, net of estimated residual value Straight-line 15 to 20 years Buildings Straight-line 40 years Leasehold improvements Straight-line 5 years/Term of lease
Estimated residual values of the Corporation’s aircraft range between $2,500 and $8,700 per aircraft. Spare engines have an estimated average residual value equal to 10% of the original purchase price. Residual values, where applicable, are reviewed annually against prevailing market rates at the consolidated statement of financial position date.
Major overhaul expenditures are capitalized and depreciated over the expected life between overhauls. All other costs relating to the maintenance of fleet assets are charged to the consolidated statement of earnings on consumption or as incurred.
Rotable parts are purchased, depreciated and disposed of on a pooled basis. When parts are purchased, the cost is added to the pool and depreciated over its useful life of 15 to 20 years. The cost to repair rotable parts is recognized in maintenance expense as incurred.
(m) Intangible assets
Included in intangible assets are costs related to software, landing rights and other. Software and landing rights are carried at cost less accumulated amortization and are amortized on a straight-line basis over their respective useful lives of five to 20 years. Expected useful lives and amortization methods are reviewed annually.
(n) Impairment
Property and equipment and intangible assets are grouped into cash generating units (CGU) and reviewed for impairment when events or changes in circumstances indicate that the carrying value of the CGU may not be recoverable. When events or circumstances indicate that the carrying amount of the CGU may not be recoverable, the long-lived assets are tested for recoverability by comparing the recoverable amounts, defined as the greater of the CGU’s fair value less cost to sell or value-in-use, with the carrying amount of the CGU. Fair value is defined as the amount an asset could be exchanged, or a liability settled, between consenting parties, in an arm’s length transaction. Value-in-use is defined as the present value of the cash flows expected from the future use or eventual sale of the asset at the end of its useful life. If the carrying value of the CGU exceeds the greater of the fair value less cost to sell and value-in-use, an impairment loss is recognized in net earnings for the difference. Impairment losses may subsequently be reversed and recognized in earnings due to changes in events and circumstances, but only to the extent of the original carrying amount of the asset, net of depreciation or amortization, had the original impairment not been recognized.
(o) Maintenance
(i) Provisions
Provisions are made when it is probable that an outflow of economic benefits will be required to settle a present legal or constructive obligation in respect of a past event and where the amount of the obligation can be reliably estimated.
The Corporation’s aircraft operating lease agreements require leased aircraft to be returned to the lessor in a specified operating condition. This obligation requires the Corporation to record a maintenance provision liability for certain return conditions specified in the operating lease agreements. Certain obligations are based on aircraft usage and the passage of time, while others are fixed amounts. Expected future costs are estimated based on contractual commitments and company-specific history. Each period, the Corporation recognizes additional maintenance expense based on increased aircraft usage, the passage of time and any changes to judgments or estimates, including discount rates and expected timing and cost of maintenance activities. The unwinding of the discounted present value is recorded as a finance cost on the consolidated statement of earnings. The discount rate used by the Corporation is the current pre-tax risk-free rate approximated by the corresponding term of a US or Canadian government bond to the remaining term until cash outflow. Any difference between the provision recorded and the actual amount incurred at the time the maintenance activity is performed is recorded to maintenance expense.

Notes to Consolidated Financial Statements As at and for the years ended December 31, 2017 and 2016 (Stated in thousands of Canadian dollars, except percentage, ratio, share and per share amounts)
WestJet Annual Report 2017 │ 76
1. Statement of significant accounting policies (continued)
(o) Maintenance (continued)
(ii) Reserves
A certain number of aircraft leases also require the Corporation to pay a maintenance reserve to the lessor. Payments are based on aircraft usage. The purpose of these deposits is to provide the lessor with collateral should an aircraft be returned in an operating condition that does not meet the requirements stipulated in the lease agreement. Maintenance reserves are refunded to the Corporation when qualifying maintenance is performed, or if not refunded, act to reduce the end of lease obligation payments arising from the requirement to return leased aircraft in a specified operating condition. Where the amount of maintenance reserves paid exceeds the estimated amount recoverable from the lessor, the non-recoverable amount is recorded as maintenance expense in the period it is incurred. Non-recoverable amounts previously recorded as maintenance expense may be recovered and capitalized based on changes to expected overhaul costs and recoverable amounts over the term of the lease.
(iii) Power-by-the-hour maintenance contracts
The Corporation is party to certain power-by-the-hour aircraft maintenance agreements, whereby the Corporation makes payments to maintenance providers based on flight hours flown. Payments are capitalized when they relate to qualifying capital expenditures such as major overhauls, otherwise, payments are recorded to maintenance expense on the consolidated statement of earnings when incurred.
(p) Leases
The determination of whether an arrangement is, or contains, a lease is made at the inception of the arrangement based on the substance of the arrangement and whether (i) fulfillment of the arrangement is dependent on the use of a specific asset and (ii) whether the arrangement conveys a right to use the asset.
Operating leases do not result in the transfer of substantially all risks and rewards incidental to ownership. Non-contingent lease payments are recognized as an expense in the consolidated statement of earnings on a straight-line basis over the term of the lease. The Corporation has a variety of operating leases including, but not limited to, those for aircraft, land, hangar space and airport operations.
(q) Income taxes
Current tax assets and liabilities are recognized based on amounts receivable from or payable to a tax authority within the next 12 months. A current tax asset is recognized for a benefit relating to an unused tax loss or unused tax credit that can be carried back to recover current tax of a previous period.
Deferred tax assets and liabilities are recognized for temporary differences between the tax and accounting bases of assets and liabilities on the consolidated statement of financial position using the tax rates that are expected to apply in the period in which the deferred tax asset or liability is expected to settle. The tax rates that are expected to be applied in future periods are based on the enacted or substantively enacted rates known at the end of the reporting period. Deferred tax assets are only recognized to the extent that it is probable that a taxable profit will be available when the deductible temporary differences can be utilized. A deferred tax asset is also recognized for any unused tax losses and unused tax credits to the extent that it is probable that future taxable profit will be available for use against the unused tax losses and unused tax credits. Deferred tax assets and liabilities are not discounted.
Current and deferred tax benefit or expense is recognized in the same period as the related transaction or event is recognized in net earnings. Current and deferred tax benefit or expense related to transactions or events in OCI or equity are recognized directly in those accounts.
Current tax assets and liabilities are offset on the consolidated statement of financial position to the extent the Corporation has a legally enforceable right to offset and the amounts are levied by the same taxation authority or when the Corporation has the right to offset and intends to settle on a net basis or realize the asset and settle the liability simultaneously. Deferred tax assets and liabilities are classified as long-term.

Notes to Consolidated Financial Statements As at and for the years ended December 31, 2017 and 2016 (Stated in thousands of Canadian dollars, except percentage, ratio, share and per share amounts)
WestJet Annual Report 2017 │ 77
1. Statement of significant accounting policies (continued)
(r) Share-based payment plans
Equity-settled share-based payments to employees are measured at the fair value of the equity instrument granted. An option valuation model is used to fair value stock options issued to employees on the date of grant. The market value of the Corporation’s voting shares on the date of the grant is used to determine the fair value of the equity-based share units issued to employees.
The initial fair value of equity-settled share-based payments is recognized as compensation expense with a corresponding increase in equity reserves over the related service period provided to the Corporation. When the service period commences prior to the grant date, compensation expense is recognized at the beginning of the service period subject to specific vesting conditions and the best estimate of equity instruments expected to vest. Estimates related to vesting conditions are reviewed regularly with any adjustments recorded to compensation expense. On the vesting date, the Corporation revises, if necessary, the estimate to equal the number of equity instruments ultimately vested and adjusts the corresponding compensation expense and equity reserves accordingly.
Market conditions attached to certain equity-settled share-based payments are taken into account when estimating the fair value of the equity instruments granted.
Upon exercise or settlement of equity-based instruments, consideration received, if any, together with amounts previously recorded in the equity reserves, are recorded as an increase in share capital.
Cash-settled share-based payments are measured based on the fair value of the cash liability. The amount determined is recorded as compensation expense at the date of grant. The liability is remeasured each period with a corresponding adjustment to the related compensation expense until the date of settlement.
(s) Earnings per share
Basic earnings per share is calculated by dividing net earnings attributable to equity holders by the weighted average number of voting shares outstanding during the period, accounting for any changes to the number of voting shares outstanding, except those transactions affecting the number of voting shares outstanding without a corresponding change in resources.
Diluted earnings per share is calculated by dividing net earnings attributable to equity holders by the weighted average number of voting shares outstanding adjusted for the effects of all potentially dilutive voting shares. Potentially dilutive voting shares are only those shares that would result in a decrease to earnings per share or increase to loss per share. The calculation of potentially dilutive voting shares assumes the exercise of all dilutive instruments, both vested and unvested, at the average market price during the period with the expected proceeds received from exercise assumed to reduce the number of dilutive voting shares otherwise issued.
(t) Critical accounting judgments and estimates
The preparation of these consolidated financial statements in conformity with IFRS requires management to make judgments and estimates that could materially affect the amounts recognized in the consolidated financial statements. By their nature, judgments and estimates may change in light of new facts and circumstances in the internal and external environment. The following judgments and estimates are those deemed by management to be material to the Corporation’s consolidated financial statements.
Judgments
(i) Componentization
The componentization of the Corporation’s assets, namely aircraft, are based on management’s judgment of what components constitute a significant cost in relation to the total cost of an asset and whether these components have similar or dissimilar patterns of consumption and useful lives for purposes of calculating depreciation and amortization. These judgments are made at the time the aircraft is acquired and do not change for the life of the aircraft. Management has considered market values, depreciation rates and industry practices in determining the level of componentization.
(ii) Depreciation and amortization
Depreciation and amortization methods for aircraft and related components as well as other property and equipment and intangible assets are based on management’s judgment of the most appropriate method to reflect the pattern of an asset’s future economic benefit expected to be consumed by the Corporation. Among other factors, these judgments are based on industry standards, manufacturers’ guidelines and company-specific history and experience.

Notes to Consolidated Financial Statements As at and for the years ended December 31, 2017 and 2016 (Stated in thousands of Canadian dollars, except percentage, ratio, share and per share amounts)
WestJet Annual Report 2017 │ 78
1. Statement of significant accounting policies (continued)
(t) Critical accounting judgments and estimates (continued)
Judgments (continued)
(iii) Impairment
Assessment of impairment triggers are based on management’s judgment of whether there are sufficient internal and external factors that would indicate an asset or CGU is impaired. The determination of a CGU is also based on management’s judgment and is an assessment of the smallest group of assets that generate cash inflows independently of other assets. Management has assessed WestJet as one CGU and considered factors such as whether an active market exists for the output produced by the asset or group of assets as well as how management monitors and makes decisions about the Corporation’s operations. Management has concluded there are no triggers of impairment at December 31, 2017.
(iv) Lease classification
Assessing whether a lease is a finance lease or an operating lease is based on management’s judgment of the criteria applied in IAS 17 – Leases. The most prevalent leases of the Corporation are those for aircraft. Management has determined that all of the Corporation’s leased aircraft are operating leases.
(v) Unconsolidated structured entities
The classification of the Corporation’s participation in 10 Canadian Fuel Facility Corporations (FFCs), eight US FFCs and three Canadian De-Icing Facility Corporations (DFCs) as interests in unconsolidated structured entities is based on management’s judgment of each entity including contractual relationships and power over the relevant decisions. Management considered the restricted, narrow and well-defined objectives and activities of each FFC and DFC, the financial dependence of each FFC and DFC on the contracting airlines, and the contractual terms of each FFC and DFC preventing any single airline from having control or significant influence. Refer to Note 17 for additional disclosures of the Corporation’s interest in unconsolidated structured entities.
(vi) Operating and reportable segments
The assessment of the Corporation as one operating and reportable segment is based on management’s judgment that resource allocation decisions and performance assessments are done at a consolidated company and fleet level with a view that the Corporation manages an integrated network of markets with a consolidated fleet of different sized aircraft.
Estimates
(vii) Depreciation and amortization
Depreciation and amortization are calculated to write-off the cost, less estimated residual value, of assets on a systematic and rational basis over their expected useful lives. Estimates of residual value and useful lives are based on data and information from various sources including vendors, industry publications, and company-specific history. Expected useful lives and residual values are reviewed annually for any change to judgments and estimates.
(viii) Maintenance provisions
The Corporation has a legal obligation to adhere to certain maintenance conditions set out in its aircraft operating lease agreements relating to the condition of the aircraft at lease return. To fulfill these obligations, a provision is made during the lease term. Estimates related to the maintenance provision include the likely utilization of the aircraft, the expected future cost of the maintenance, the point in time at which maintenance is expected to occur, the discount rate used to present value the future cash flows, the lifespan of life-limited parts and assumptions of lease extension terms. These estimates are based on data and information obtained from various sources including the lessor, current maintenance schedules and fleet plans, contracted costs with maintenance service providers, other vendors and company-specific history. (ix) Income taxes
Deferred tax assets and liabilities contain estimates about the nature and timing of future permanent and temporary differences as well as the future tax rates that will apply to those differences. Changes in tax laws and rates as well as changes to the expected timing of reversals may have a significant impact on the amounts recorded for deferred tax assets and liabilities. Management closely monitors current and potential changes to tax law and bases its estimates on the best available information at each reporting date.
Notes to Consolidated Financial Statements As at and for the years ended December 31, 2017 and 2016 (Stated in thousands of Canadian dollars, except percentage, ratio, share and per share amounts)
WestJet Annual Report 2017 │ 79
2. New accounting standards and interpretations
The IASB and International Financial Reporting Interpretations Committee (IFRIC) have issued the following standards that have not been applied in preparing these consolidated financial statements as their effective dates fall within annual periods beginning subsequent to the current reporting period.
Proposed standards Description Previous standard Effective date
IFRS 15 – Revenue from Contracts with Customers
A new standard on revenue recognition that contains a single model that applies to contracts with customers and two approaches to recognizing revenue; at a point in time or over time.
IAS 11 - Construction contracts; IAS 18 – Revenue; IFRIC 13 - Customer Loyalty Programmes; IFRIC 15 - Agreements for the Construction of Real Estate; IFRIC 18 - Transfers of Assets from Customers; SIC-31 - Revenue - Barter Transactions Involving Advertising Services
Effective for annual periods beginning on or after January 1, 2018. Early adoption is permitted.
IFRS 16 - Leases
A new standard on lease accounting that results in substantially all lessee leases being recorded on the statement of financial position.
IAS 17 – Leases Effective for annual periods beginning on or after January 1, 2019. Early adoption is permitted.
IFRS 15 – Revenue from Contracts with Customers
In May 2014, the IASB issued IFRS 15 Revenue from Contracts with Customers (IFRS 15) which provides a single revenue recognition model aimed at providing greater comparability across industries and companies. The revised IFRS standard will replace existing revenue recognition guidance and is effective for annual and interim reporting periods beginning on or after January 1, 2018. The Corporation has adopted this standard on the required effective date, using the full retrospective transition method. In addition, the Corporation has elected to make use of the following practical expedients:
• The Corporation applies the practical expedient in paragraph 94 of IFRS 15 and contract costs incurred related to contracts with an amortization period of less than one year will be been expensed as incurred.
• The Corporation applies the practical expedient in paragraph 121 of IFRS 15 and does not disclose information about remaining performance obligations that have original expected durations of one year or less.
• The Corporation applies the practical expedient C5(c) of IFRS 15 and for contracts that were modified before the beginning of the earliest period presented, the Corporation does not separately evaluate the effect of the contract modification before the beginning of the earlier period presented.
• The Corporation also applies the practical expedient in paragraph C5(d) of IFRS and does not disclose the amount of the transaction price allocated to the remaining performance obligations and an explanation of when the Corporation expects to recognize that amount as revenue for the year ended December 31, 2016.
The corporation has assessed the impact of IFRS 15 and the differences are summarized below:
Passenger and ancillary breakage
The Corporation has concluded that revenue will be recognized at flight date as tickets are invalid after flight date per the Corporation’s flight tariffs. Currently, breakage related to passenger tickets and ancillary fees are deferred for a period of 18 months. This change has an impact of approximately $36.1 million increase, net of tax to January 1, 2017 opening retained earnings and an approximately $49.5 million decrease to advance ticket sales.
Consideration Payable
The Corporation issues future travel credits and WestJet dollars related to flight delays, missing baggage, or other inconveniences as goodwill gestures. The current accounting policy is to record the travel credit when it is used to book a subsequent flight. Under IFRS 15, consideration payable to a customer will be recorded as a reduction to revenue and an increase to non-refundable guest credits when the travel credit is issued. This has an impact of approximately $7.8 million, net of tax reduction to January 1, 2017 opening retained earnings and an approximately $10.7 million increase to non-refundable guest credits.

Notes to Consolidated Financial Statements As at and for the years ended December 31, 2017 and 2016 (Stated in thousands of Canadian dollars, except percentage, ratio, share and per share amounts)
WestJet Annual Report 2017 │ 80
2. New accounting standards and interpretations (continued)
Cancel fees
Similarly to change fees, the Corporation has concluded that cancel fees, which are currently recognized at the date of ticket cancellation and credit for future travel is issued, will be treated as a contract modification and would not be a distinct performance obligation from the guest’s subsequent flight and will be deferred until the flight occurs and presented in Guest revenue. This has an impact of approximately $4.1 million, net of tax reduction to January 1, 2017 opening retained earnings and an approximately $5.7 million increase to advance ticket sales
Change fees
The Corporation has concluded that change fees, which are currently recognized at the date of the ticket change and presented in Other revenue, will be treated as a contract modification and would not be a distinct performance obligation from the guest’s subsequent flight and will be deferred until the flight occurs and presented in Guest revenue. This has an impact of approximately $3.1 million, net of tax reduction to January 1, 2017 opening retained earnings and an approximately $4.3 million increase to advance ticket sales.
Reclass of certain ancillary services
The Corporation has concluded that the majority of ancillary services, currently presented within Other revenue, will no longer be considered distinct from the guest’s associated flight and therefore, will be presented within Guest revenue. This change has no impact to January 1, 2017 opening retained earnings.
WestJet Rewards
Although the Corporation will continue to defer the revenue related to WestJet rewards received by guests until they are used towards the purchase of a new flight, the allocation methodology of how to apportion the airfare between the flight segments and WestJet rewards will change. The Corporation has evaluated the change in the allocation methodology to be immaterial and therefore there is no impact to January 1, 2017 opening retained earnings. The Corporation has also concluded that tier status is considered a marketing expense and therefore no revenue will be deferred related to the guest benefits associated with tier status.
WestJet Co-Brand MasterCard
The Corporation has assessed the impact of IFRS 15 on the WestJet MasterCard Co-Brand agreement with the Royal Bank of Canada (RBC) and have identified the following performance obligations: brand, WestJet dollars, and companion vouchers. The Corporation is in the process of finalizing the valuation of each of the performance obligations identified in order to allocate the consideration received on a relative stand-alone selling price basis. The Corporation anticipates that there will be a deferral of revenue as a result of IFRS 15, as the Corporation currently does not defer any revenue related to companion vouchers.
The Corporation will also continue drafting illustrative disclosures to the quarterly and annual 2018 financial statements. The Corporation will also continue to implement new business processes and internal controls required to adopt this standard.
IFRS 16 – Leases
In January 2016, the IASB issued IFRS 16 Leases (IFRS 16), effective for annual and interim reporting periods beginning on or after January 1, 2019. This standard eliminates the classification of leases as either operating leases or finance leases for a lessee, and instead, all leases are capitalized by recognizing the present value of lease payments and presenting them as either lease assets or together with property and equipment. It also allows for the service component of a lease agreement to be separated from the value of the asset and thus not reported on the statement of financial position. The Corporation anticipates the adoption of IFRS 16 will have a material impact on the statement of financial position as all aircraft operating leases will be capitalized with a corresponding lease liability. In addition to the aircraft operating leases, the Corporation must identify and review potential contracts that may contain a lease arrangement prior to quantifying the impact of IFRS 16. As at December 31, 2017, the Corporation has completed a scoping exercise to identify the potential number and types of contracts that may contain leases within the company and does not anticipate early adoption of this standard.
Notes to Consolidated Financial Statements As at and for the years ended December 31, 2017 and 2016 (Stated in thousands of Canadian dollars, except percentage, ratio, share and per share amounts)
WestJet Annual Report 2017 │ 81
3. Capital management
The Corporation’s policy is to maintain a strong capital base in order to maintain investor, creditor and market confidence and to sustain the future development of the airline. The Corporation manages its capital structure and makes adjustments in light of changes in economic conditions and the risk characteristics of the underlying assets.
In order to manage the capital structure, the Corporation may, from time to time, purchase shares for cancellation pursuant to normal course issuer bids, issue new shares, pay dividends and adjust current and projected debt levels.
In the management of capital, the Corporation includes shareholders’ equity (excluding hedge reserves), long-term debt, cash and cash equivalents and the Corporation’s off-balance-sheet obligations related to its aircraft operating leases, all of which are presented in detail below.
The Corporation monitors its capital structure on a number of bases, including cash to trailing 12 months revenue, adjusted debt-to-equity and adjusted net debt to earnings before net finance cost, taxes, depreciation and amortization and aircraft leasing (EBITDAR). EBITDAR is a non-GAAP financial measure commonly used in the airline industry to evaluate results by excluding differences in tax jurisdictions and in the method an airline finances its aircraft. In addition, the Corporation will adjust EBITDAR for non-operating gains and losses on derivatives and foreign exchange. The calculation of EBITDAR is a measure that does not have a standardized meaning prescribed under IFRS and therefore may not be comparable to similar measures presented by other issuers. The Corporation adjusts debt to include its off-balance-sheet aircraft operating leases. To derive a present-value debt equivalent, common industry practice is to multiply the trailing 12 months of aircraft leasing expense by a multiplier. The Corporation uses a multiplier of 7.5. The Corporation defines adjusted net debt as adjusted debt less cash and cash equivalents. The Corporation defines equity as total shareholders’ equity, excluding hedge reserves.
2017 2016 Change Cash to trailing 12 months revenue Cash, cash equivalents and marketable securities 1,373,166 1,520,822 (147,656) Trailing 12 months revenue 4,502,320 4,122,859 379,461 Cash to trailing 12 months revenue(v) 30.5% 36.9% (6.4 pts) Adjusted debt-to-equity
Long-term debt(i) 2,049,047 2,046,658 2,389 Off-balance-sheet aircraft leases(ii) 1,244,265 1,338,338 (94,073)
Adjusted debt 3,293,312 3,384,996 (91,684) Total shareholders’ equity 2,212,524 2,060,702 151,822 Add: Hedge reserves 1,902 11,003 (9,101)
Adjusted equity 2,214,426 2,071,705 142,721 Adjusted debt-to-equity(v) 1.49 1.63 (8.6%) Adjusted net debt to EBITDAR Adjusted debt (as above) 3,293,312 3,384,996 (91,684) Less: Cash, cash equivalents and marketable securities (1,373,166) (1,520,822) 147,656 Adjusted net debt 1,920,146 1,864,174 55,972 Net earnings 283,578 295,458 (11,880) Add:
Net finance cost(iii) 34,084 32,456 1,628 Taxes 120,557 120,775 (218) Depreciation and amortization 403,021 350,484 52,537 Aircraft leasing 165,902 178,445 (12,543) Other(iv) 7,303 (11,906) 19,209
EBITDAR 1,014,445 965,712 48,733 Adjusted net debt to EBITDAR(v) 1.89 1.93 (2.1%)
(i) At December 31, 2017, long-term debt includes the current portion of long-term debt of $153,149 (December 31, 2016 – $145,128) and long-term debt of $1,895,898 (December 31, 2016 – $1,901,530).
(ii) Off-balance-sheet aircraft leases is calculated by multiplying the trailing 12 months of aircraft leasing expense by 7.5. At December 31, 2017, the trailing 12 months of aircraft leasing costs totaled $165,902 (December 31, 2016 – $178,445).
(iii) At December 31, 2017, net finance cost includes the trailing 12 months of finance income of $19,626 (December 31, 2016 – $16,618) and the trailing 12 months of finance cost of $53,710 (December 31, 2016 – $49,074).
(iv) At December 31, 2017, other includes the trailing 12 months foreign exchange loss of $4,877 (December 31, 2016 – gain of $7,402) and trailing 12 months non-operating loss on derivatives of $2,426 (December 31, 2016 – gain of $4,504).
(v) The Corporation has internal guidelines for cash to trailing 12 months revenue of approximately 30%, an adjusted debt-to-equity measure of no more than 2.5 and an adjusted net debt to EBITDAR measure of no more than 2.5. The Corporation’s internal guidelines are not related to any covenants.

Notes to Consolidated Financial Statements As at and for the years ended December 31, 2017 and 2016 (Stated in thousands of Canadian dollars, except percentage, ratio, share and per share amounts)
WestJet Annual Report 2017 │ 82
4. Cash, cash equivalents and marketable securities
December 31
2017 December 31
2016 Bank balances(i) 238,858 261,408 Short-term investments(ii) 908,218 1,259,414 Total cash and cash equivalents 1,147,076 1,520,822 Marketable securities(iii) 226,090 -
1,373,166 1,520,822
(i) Included in these balances, at December 31, 2017, the Corporation has US-dollar cash and cash equivalents totaling US $46,641 (December 31, 2016 – US $102,823).
(ii) Included in these balances, at December 31, 2017, the Corporation has US-dollar short-term investments totaling US $151,696 (December 31, 2016 – US $125,884).
(iii) Included in these balances, at December 31, 2017, the Corporation has US-dollar marketable securities totaling US $100,000 (December 31, 2016 – US $nil).
5. Restricted cash
December 31
2017 December 31
2016 Cash held in trust for WestJet Vacations Inc. 76,389 70,080 Security on facilities for letters of guarantee 32,234 31,013 Passenger facility charges 1,077 1,556
109,700 102,649
6. Property and equipment
January 1
2017 Net
Additions Depreciation Transfers December 31
2017 Aircraft(i) 3,125,040 46,416 (337,285) 645,568 3,479,739 Ground property and equipment 73,911 12,718 (18,945) 5,262 72,946 Spare engines and rotables 186,092 12,988 (25,089) 21,938 195,929 Deposits on aircraft 492,376 752,368 - (594,257) 650,487 Buildings 102,833 - (3,524) - 99,309 Leasehold improvements 14,180 3,648 (4,329) 4,071 17,570 Assets under development 42,448 91,658 - (82,582) 51,524 4,036,880 919,796 (389,172) - 4,567,504
January 1
2016 Net
additions Depreciation Transfers December 31
2016 Aircraft(i) 2,741,974 120,764 (290,733) 553,035 3,125,040 Ground property and equipment 72,176 17,922 (18,166) 1,979 73,911 Spare engines and rotables 167,446 32,562 (19,772) 5,856 186,092 Deposits on aircraft 319,019 640,098 - (466,741) 492,376 Buildings 106,364 - (3,531) - 102,833 Leasehold improvements 10,374 5,742 (3,159) 1,223 14,180 Assets under development 55,909 81,891 - (95,352) 42,448 3,473,262 898,979 (335,361) - 4,036,880
(i) Aircraft includes (a) aircraft (b) engine, airframe and landing gear core components (c) engine, airframe and landing gear overhaul components, and (d) inflight entertainment systems. For the year ended December 31, 2017, total aircraft depreciation expense for overhaul components was $153,660 (December 31, 2016 – $130,114).

Notes to Consolidated Financial Statements As at and for the years ended December 31, 2017 and 2016 (Stated in thousands of Canadian dollars, except percentage, ratio, share and per share amounts)
WestJet Annual Report 2017 │ 83
6. Property and equipment (continued)
December 31, 2017 Cost Accumulated depreciation Net book value
Aircraft 5,078,004 (1,598,265) 3,479,739 Ground property and equipment 169,946 (97,000) 72,946 Spare engines and rotables 307,594 (111,665) 195,929 Deposits on aircraft 650,487 - 650,487 Buildings 136,781 (37,472) 99,309 Leasehold improvements 31,641 (14,071) 17,570 Assets under development 51,524 - 51,524 6,425,977 (1,858,473) 4,567,504
December 31, 2016 Cost Accumulated depreciation Net book value
Aircraft 4,439,579 (1,314,539) 3,125,040 Ground property and equipment 198,083 (124,172) 73,911 Spare engines and rotables 278,863 (92,771) 186,092 Deposits on aircraft 492,376 - 492,376 Buildings 136,783 (33,950) 102,833 Leasehold improvements 27,431 (13,251) 14,180 Assets under development 42,448 - 42,448 5,615,563 (1,578,683) 4,036,880
The net book value of the property and equipment pledged as collateral for the Corporation’s long-term debt was $1,446,554 at December 31, 2017 (December 31, 2016 – $1,471,441).
7. Intangible assets
January 1
2017 Net
additions Amortization Transfers December 31
2017 Software 33,429 1,148 (12,869) 13,208 34,916 Landing rights 13,766 - (892) - 12,874 Other 5,521 - (88) - 5,433 Assets under development 13,471 6,031 - (13,208) 6,294 66,187 7,179 (13,849) - 59,517
January 1
2016 Net
additions Amortization Transfers December 31
2016 Software 29,641 4,698 (14,141) 13,231 33,429 Landing rights 14,595 65 (894) - 13,766 Other 5,609 - (88) - 5,521 Assets under development 13,704 12,998 - (13,231) 13,471 63,549 17,761 (15,123) - 66,187

Notes to Consolidated Financial Statements As at and for the years ended December 31, 2017 and 2016 (Stated in thousands of Canadian dollars, except percentage, ratio, share and per share amounts)
WestJet Annual Report 2017 │ 84
7. Intangible assets (continued)
December 31, 2017 Cost Accumulated amortization
Net book value
Software 90,377 (55,461) 34,916 Landing rights 17,845 (4,971) 12,874 Other 5,836 (403) 5,433 Assets under development 6,294 - 6,294 120,352 (60,835) 59,517
December 31, 2016 Cost Accumulated amortization
Net book value
Software 90,943 (57,514) 33,429 Landing rights 17,847 (4,081) 13,766 Other 5,836 (315) 5,521 Assets under development 13,471 - 13,471 128,097 (61,910) 66,187
8. Maintenance provisions and reserves
The Corporation’s operating aircraft lease agreements require leased aircraft to be returned to the lessor in a specified operating condition. The maintenance provision liability represents the present value of the expected future cost. A maintenance expense is recognized over the term of the provision based on aircraft usage and the passage of time, while the unwinding of the present value discount is recognized as a finance cost. The majority of the Corporation’s maintenance provision liabilities are recognized and settled in US dollars. Where applicable, all amounts have been converted to Canadian dollars at the period end foreign exchange rate.
December 31
2017 December 31
2016 Opening balance 366,234 329,033 Additions 45,682 72,900 Change in estimate(i) 16,544 7,560 Foreign exchange (22,559) (9,269) Accretion(ii) 3,146 2,104 Settled (56,571) (36,094) Ending balance 352,476 366,234 Current portion (82,129) (103,571) Long-term portion 270,347 262,663
(i) Reflects changes to the timing and scope of maintenance activities and the discount rate used to present value the liability.
(ii) At December 31, 2017, the Corporation’s aircraft lease maintenance provisions are discounted using a weighted average risk-free rate of approximately 1.61% (December 31, 2016 – 0.96%) to reflect the weighted average remaining term of approximately 40 months (December 31, 2016 – 23 months) until cash outflow.
A certain number of operating aircraft leases also require the Corporation to pay a maintenance reserve to the lessor. Maintenance reserves are either refunded when qualifying maintenance is performed or offset against end of lease obligations for returning leased aircraft in a specified operating condition. Where the amount of maintenance reserves paid exceeds the estimated amount recoverable from the lessor, the non-recoverable amount is recorded as maintenance expense in the period it is incurred. Non-recoverable amounts previously recorded as maintenance expense may be recovered and capitalized based on changes to expected overhaul costs and recoverable amounts over the term of the lease. The Corporation’s maintenance reserves are recognized and settled in US dollars. All amounts have been converted to Canadian dollars at the period end foreign exchange rate.
At December 31, 2017, the current portion of maintenance reserves included in prepaid expenses, deposits and other is $16,281 (December 31, 2016 – $13,727) and the long-term portion of maintenance reserves included in other assets is $13,761 (December 31, 2016 – $16,823).

Notes to Consolidated Financial Statements As at and for the years ended December 31, 2017 and 2016 (Stated in thousands of Canadian dollars, except percentage, ratio, share and per share amounts)
WestJet Annual Report 2017 │ 85
9. Long-term debt
December 31
2017 December 31
2016 Term loans – purchased aircraft(i) 59,770 128,697 Term loans – purchased aircraft(ii) 156,929 177,606 Term loans – purchased aircraft(iii) 645,501 510,067 Senior unsecured notes(iv) 399,139 398,612 Non-revolving facility(v) 288,196 299,182 USD senior unsecured notes(vi) 499,512 532,494 Ending balance 2,049,047 2,046,658 Current portion (153,149) (145,128) Long-term portion 1,895,898 1,901,530
(i) 19 individual term loans, amortized over a 12-year term, repayable in quarterly principal instalments totaling $13,505, at an effective weighted average fixed rate of 6.05%, maturing between 7201 and 2020. These facilities are guaranteed by the Export-Import Bank of the United States (Ex-Im Bank) and secured by 19 Boeing 737 Next Generation aircraft. At December 31, 2016 – 25 individual term loans, amortized over a 12-year term, repayable in quarterly principal instalments totaling $17,952, at an effective weighted average fixed rate of 5.95%, maturing between 2017 and 2020. There are no financial covenants related to these term loans.
(ii) Seven individual term loans, amortized over a 12-year term, repayable in quarterly principal instalments totaling $5,576, in addition to a floating rate of interest at the three-month Canadian Dealer Offered Rate plus a basis point spread, with an effective weighted average floating interest rate of 2.96% at December 31, 2017, maturing between 2024 and 2025. The Corporation has fixed the rate of interest on these seven term loans, at a weighted average rate of 3.20%, using interest rate swaps. These facilities are guaranteed by Ex-Im Bank and secured by seven Boeing 737 Next Generation aircraft. No change from December 31, 2016, other than the weighted average floating interest rate of 2.48%. There are no financial covenants related to these term loans.
(iii) 43 individual term loans, amortized over a 12-year term, repayable in quarterly principal instalments totaling $14,643, at an effective weighted average fixed rate of 3.18%, maturing between 2025 and 2029. Each term loan is secured by one Q400 aircraft. At December 31, 2016 – 34 individual term loans, amortized over a 12-year term, repayable in quarterly principal instalments totaling $10,971, at an effective weighted average fixed rate of 3.10%, maturing between 2025 and 2028. There are no financial covenants related to these term loans.
(iv) 3.287% Senior Unsecured Notes with semi-annual interest payments and an effective interest rate of 3.43% at December 31, 2017, with principal due upon maturity in July 2019. The notes rank equally in right of payment with all other existing and future unsubordinated debt of the Corporation, but are effectively subordinate to all of the Corporation’s existing and future secured debt to the extent of the value of the assets securing such debt. No change from December 31, 2016. There are no financial covenants related to these senior unsecured notes.
(v) Non-revolving, unsecured term loan repayable in quarterly principal instalments of $3,750 that commenced on March 31, 2017, increasing annually, with an effective weighted average floating interest rate of 3.00% at December 31, 2017, maturing in 2020. The Corporation has fixed the rate of interest on the term loan, at a weighted average rate of 2.51%, using interest rate swaps. At December 31, 2016 - effective weighted average floating interest rate of 2.49%. The credit facility contains two financial covenants: (i) minimum pooled asset coverage ratio of 1.5 to 1, and (ii) minimum fixed charge coverage ratio of 1.25 to 1 measurable on a quarterly basis. At December 31, 2017 the Corporation has met both covenants.
(vi) Senior unsecured notes denominated in US Dollars with semi-annual interest payments and a fixed effective rate of 3.78% at December 31, 2017, with principal due upon maturity in June 2021. The notes rank equally in right of payment with all other existing and future unsubordinated debt of the Corporation, but are effectively subordinate to all of the Corporation’s existing and future secured debt to the extent of the value of the assets securing such debt. There are no financial covenants related to these senior unsecured notes. No change from December 31, 2016.
Future scheduled principal and interest repayments of long-term debt at December 31, 2017 are as follows:
Within 1 year 218,572 1 – 3 years 943,602 4 – 5 years 716,274 Over 5 years 409,399 2,287,847
The Corporation has an unsecured, revolving syndicated credit facility to borrow up to $300,000. The credit facility is available for general corporate purposes, including the funding of future aircraft acquisitions, and matures in June 2020 with an option to extend the three-year term on an annual basis. Funds from the revolving credit facility can be drawn by way of: (i) Canadian dollar prime loans, (ii) US dollar base rate loans, (iii) US dollar LIBOR loans, (iv) Canadian dollar bankers’ acceptances, and (v) Canadian or US dollar fronted letters of credit. Interest is calculated by reference to the applicable base rate plus an applicable pricing margin based on the Corporation’s debt rating. The Corporation also pays a standby fee for the undisbursed portion of the revolving credit facility. At December 31, 2017, the Corporation has $nil (December 31, 2016 – $nil) drawn on the facility. The credit facility contains two financial covenants: (i) minimum pooled asset coverage ratio of 1.5 to 1, and (ii) minimum fixed charge coverage ratio of 1.25 to 1. At December 31, 2017, the Corporation has met both covenants.

Notes to Consolidated Financial Statements As at and for the years ended December 31, 2017 and 2016 (Stated in thousands of Canadian dollars, except percentage, ratio, share and per share amounts)
WestJet Annual Report 2017 │ 86
9. Long-term debt (continued)
The Corporation has an $820,000 loan agreement with Export Development Canada for the future purchase of Bombardier Q400 NextGen aircraft. The Corporation is charged a non-refundable commitment fee of 0.2 per cent per annum on the undisbursed portion of the loan. The undisbursed portion of the loan at December 31, 2017, is $47,575 (December 31, 2016 – $234,371). Availability of any undrawn amount expires on December 31, 2018. The expected amount available for each aircraft is up to 80 per cent of the net price with a term to maturity of up to 12 years, repayable in quarterly instalments, including interest at a floating or fixed rate, determined at the inception of the loan.
10. Income taxes
(a) Reconciliation of total income tax expense
The effective rate on the Corporation’s earnings before income tax differs from the expected amount that would arise using the combined Canadian federal and provincial statutory income tax rates. A reconciliation of the difference is as follows:
2017 2016 Earnings before income tax 404,135 416,233 Combined Canadian federal and provincial income tax rate 26.92% 26.93% Expected income tax provision 108,793 112,092 Add (deduct):
Non-deductible expenses 6,042 5,310 Non-deductible share-based payment expense 3,835 3,021 Effect of tax rate changes 2,082 645 Other (195) (293)
Actual income tax provision 120,557 120,775 Effective tax rate 29.83% 29.02%
The increase in the effective tax rate is due to increased non-deductible expenses as well as the general corporate income tax rate increase in British Columbia, from 11% to 12%. The rate increase in British Columbia becomes effective January 1, 2018 and while the 2017 statutory rate is not adjusted, the deferred tax liability is revalued at the increased rate.
(b) Deferred tax
Components of the net deferred tax liability are as follows:
2017 2016 Deferred tax liability:
Property and equipment (462,814) (404,012)
Deferred tax asset:
Maintenance provision 87,164 90,273
Net unrealized loss on derivatives designated in a hedging relationship 704 4,045 (374,946) (309,694)
2017 2016 Deferred tax liability at December 31, 2016: 309,694 327,028
Deferred income tax expense (recovery), period ended December 31, 2017 61,912 (12,280) Tax impact of net unrealized(gain) loss on effective portion of derivatives
designated in a hedging relationship 3,340 (5,054)
Deferred tax liability at December 31, 2017 374,946 309,694
Notes to Consolidated Financial Statements As at and for the years ended December 31, 2017 and 2016 (Stated in thousands of Canadian dollars, except percentage, ratio, share and per share amounts)
WestJet Annual Report 2017 │ 87
11. Share capital
(a) Authorized
Unlimited number of common voting shares
The common voting shares may be owned and controlled only by Canadians and shall confer the right to one vote per common voting share at all meetings of shareholders of the Corporation.
If a common voting share becomes beneficially owned or controlled by a person who is not a Canadian, such common voting share shall be converted into one variable voting share automatically and without any further act of the Corporation or the holder.
Unlimited number of variable voting shares
The variable voting shares may be beneficially owned and controlled only by a person who is not Canadian and are entitled to one vote per variable voting share unless (i) the number of issued and outstanding variable voting shares exceed 25% of the total number of all issued and outstanding variable voting shares and common voting shares collectively, including securities currently convertible into such a share and currently exercisable options and rights to acquire such shares (or any higher percentage the Governor in Council may specify pursuant to the Canada Transportation Act) or (ii) the total number of votes cast by, or on behalf of, the holders of variable voting shares at any meeting exceeds 25% (or any higher percentage the Governor in Council may specify pursuant to the Canada Transportation Act) of the total number of votes cast that may be cast at such meeting.
If either of the thresholds described in the paragraph above is surpassed at any time, the vote attached to each variable voting share will decrease automatically and without further act or formality to equal the maximum permitted vote per variable voting share. In the circumstance described in (i) in the paragraph above, the variable voting shares as a class cannot carry more than 25% (or any higher percentage the Governor in Council may specify pursuant to the Canada Transportation Act) of the aggregate votes attached to all variable voting shares and common voting shares collectively, including securities currently convertible into such a share and currently exercisable options and rights to acquire such shares. In the circumstance described in (ii) in the paragraph above, the variable voting shares as a class cannot, for a given shareholders’ meeting, carry more than 25% (or any higher percentage the Governor in Council may specify pursuant to the Canada Transportation Act) of the total number of votes that can be exercised at the meeting.
Each issued and outstanding variable voting share shall be automatically converted into one common voting share without any further intervention on the part of the Corporation or of the holder if (i) the variable voting share is or becomes owned and controlled by a Canadian or if (ii) the provisions contained in the Canada Transportation Act relating to foreign ownership restrictions are repealed and not replaced with other similar provisions in applicable legislation.
Unlimited number of non-voting shares and unlimited number of non-voting first, second and third preferred shares
The non-voting shares and non-voting preferred shares may be issued, from time to time in one or more series, each series consisting of such number of non-voting shares and non-voting preferred shares as determined by the Corporation’s Board of Directors who may also fix the designations, rights, privileges, restrictions and conditions attached to the shares of each series of non-voting shares and non-voting preferred shares. There are no non-voting shares or non-voting preferred shares issued and outstanding.
(b) Issued and outstanding
2017 2016 Number Amount Number Amount Common and variable voting shares: Balance, beginning of year 117,200,439 555,716 123,086,477 582,796 Issuance of shares pursuant to compensation plans 376,047 10,131 68,911 1,146 Shares repurchased (3,523,597) (16,870) (5,954,949) (28,226) Balance, end of year 114,052,889 548,977 117,200,439 555,716
At December 31, 2017, the number of common voting shares outstanding was 76,918,114 (December 31, 2016 – 93,972,416) and the number of variable voting shares was 37,134,775 (December 31, 2016 – 23,228,023).

Notes to Consolidated Financial Statements As at and for the years ended December 31, 2017 and 2016 (Stated in thousands of Canadian dollars, except percentage, ratio, share and per share amounts)
WestJet Annual Report 2017 │ 88
11. Share capital (continued)
(b) Issued and outstanding (continued)
On May 16, 2016, the Corporation filed a notice with the TSX to make a normal course issuer bid to purchase outstanding shares on the open market. As approved by the TSX, the Corporation was authorized to purchase up to 4,000,000 common voting shares and variable voting shares (representing approximately 3.3 per cent of the Corporation’s issued and outstanding shares as of April 30, 2016) during the period May 18, 2016 to May 17, 2017 (the 2016 bid), or until such time as the bid is completed or terminated at the Corporation’s option. Any shares purchased under this bid are purchased on the open market through the facilities of the TSX at the prevailing market price at the time of the transaction. Common voting shares and variable voting shares acquired under this bid are cancelled. The 2016 bid expired on May 17, 2017, with the Corporation purchasing and cancelling all 4,000,000 of the shares it was authorized.
On August 1, 2017, the Corporation filed a notice with the TSX to make a normal course issuer bid to purchase outstanding shares on the open market. As approved by the TSX, the Corporation is authorized to purchase up to 5,856,671 common voting shares and variable voting shares (representing approximately five per cent of the Corporation’s issued and outstanding shares as of July 20, 2017) during the period August 3, 2017 to August 2, 2018 (the 2017 bid), or until such time as the bid is completed or terminated at the Corporation’s option. Any shares purchased under this bid are purchased on the open market through the facilities of the TSX at the prevailing market price at the time of the transaction. Common voting shares and variable voting shares acquired under this bid are cancelled. At December 31, 2017, 3,330,425 shares have been repurchased under this bid with 2,526,246 remaining.
During the year ended December 31, 2017, the Corporation purchased and cancelled a total of 3,523,597 shares (December 31, 2016 – 5,954,949) for total consideration of $90,317 (December 31, 2016 – $126,152). The average book value of the shares repurchased was $4.79 per share (December 31, 2016 – $4.74) and was charged to share capital. The excess of the market price over the average book value, including transaction costs, was $73,447 (December 31, 2016 – $97,926) and was charged to retained earnings.
(c) Stock option plan
The Corporation has a stock option plan, whereby at December 31, 2017, 11,664,318 (2016 – 11,040,365) voting shares were reserved for issuance to officers and employees of the Corporation, subject to the following limitations:
(i) the number of voting shares reserved for issuance to any one optionee will not exceed 5% of the issued and outstanding voting shares at any time;
(ii) the number of voting shares reserved for issuance to insiders shall not exceed 10% of the issued and outstanding voting shares; and
(iii) the number of voting shares issuable under the stock option plan, which may be issued within a one-year period, shall not exceed 10% of the issued and outstanding voting shares at any time.
Stock options are granted at a price equal to the five-day weighted average market value of the Corporation’s voting shares preceding the date of grant and vest completely or on a graded basis on the first, second and third anniversary from the date of grant. Stock options expire no later than seven years from the date of grant.
The fair value of options granted and the assumptions used in their determination are as follows:
2017 2016 Weighted average fair value per option 3.77 3.58 Expected life of options (years) 3.6 3.7 Weighted average risk-free interest rate 1.0% 0.6% Weighted average expected volatility 26.9% 27.9% Weighted average dividend yield 2.2% 1.9%

Notes to Consolidated Financial Statements As at and for the years ended December 31, 2017 and 2016 (Stated in thousands of Canadian dollars, except percentage, ratio, share and per share amounts)
WestJet Annual Report 2017 │ 89
11. Share capital (continued)
(c) Stock option plan (continued)
Changes in the number of options, with their weighted average exercise prices, are summarized below:
2017 2016 Number of
options Weighted
exercise price Number of
options Weighted
exercise price Stock options outstanding, beginning of year 8,622,779 22.91 5,706,547 24.40 Granted 3,567,702 22.07 3,562,396 20.07 Exercised (2,530,385) 21.57 (261,890) 16.32 Forfeited (83,382) 21.45 (258,856) 22.78 Expired (146,888) 23.59 (125,418) 23.90 Stock options outstanding, end of year 9,429,826 22.95 8,622,779 22.91 Exercisable, end of year 5,196,596 23.67 4,676,301 24.63
Under the terms of the Corporation's stock option plan, with the approval of the Corporation, option holders can either (i) elect to receive shares by delivering cash to the Corporation in the amount of the exercise price of the options, or (ii) choose a cashless settlement alternative, whereby they can elect to receive a number of shares equivalent to the market value of the options over the exercise price. For the year ended December 31, 2017, option holders exercised 2,526,630 options (2016 – 259,158 options) on a cashless basis and received 372,292 shares (2016 – 66,179 shares). For the year ended December 31, 2017, 3,755 options were exercised on a cash basis (2016 – 2,732 options).
Options outstanding and exercisable at December 31, 2017:
Outstanding options Exercisable options
Range of exercise prices
Number outstanding
Weighted average remaining life
(years)
Weighted average exercise
price Number
exercisable
Weighted average exercise
price 14.73-20.00 60,775 1.84 15.43 54,452 15.36 20.01-23.00 5,866,890 3.77 21.33 1,851,033 20.29 23.01-26.00 1,370,288 1.73 23.83 1,291,134 23.83 26.01-31.16 2,131,873 1.94 26.92 1,999,977 26.93
9,429,826 3.05 22.95 5,196,596 23.67
(d) Key employee plan
The Corporation has a key employee plan (KEP), whereby restricted share units (RSU) are issued to senior management and pilots of the Corporation. The fair market value of the RSUs at the time of grant is equal to the weighted average trading price of the Corporation’s voting shares for the five trading days immediately preceding the date of grant. Each RSU entitles the employee to receive payment upon vesting in the form of voting shares of the Corporation. The Corporation intends to settle all RSUs with shares either through the purchase of voting shares on the open market or the issuance of new shares from treasury; however, wholly at its own discretion, the Corporation may settle the units in cash. The RSU’s time vest at the end of a two or three-year period, with compensation expense being recognized in net earnings over the service period. At December 31, 2017, 944,738 (2016 – 944,738) voting shares of the Corporation were reserved for issuance under the KEP plan. For the year ended December 31, 2017, the Corporation settled 96,068 RSUs through the open market and nil RSUs with shares issued from treasury (December 31, 2016 – 158,995 and nil, respectively).
Changes in the number of units, with their weighted average fair value, are summarized below:
2017 2016 Number of
units Weighted fair
value Number of
units Weighted fair
value Units outstanding, beginning of year 238,381 22.50 278,140 24.09 Granted 96,697 22.21 122,919 19.96 Units, in lieu of dividends 5,584 24.75 6,415 21.78 Settled (96,068) 23.57 (158,995) 23.21 Forfeited (12,954) 21.60 (10,098) 23.72 Units outstanding, end of year 231,640 22.04 238,381 22.50

Notes to Consolidated Financial Statements As at and for the years ended December 31, 2017 and 2016 (Stated in thousands of Canadian dollars, except percentage, ratio, share and per share amounts)
WestJet Annual Report 2017 │ 90
11. Share capital (continued)
(e) Executive share unit plan
The Corporation has an equity-based executive share unit (ESU) plan, whereby RSUs and performance share units (PSU) may be issued to senior executive officers. At December 31, 2017, 1,011,927 (2016 – 1,011,927) voting shares of the Corporation were reserved for issuance under the ESU plan.
The fair market value of the RSUs and PSUs at the time of grant is equal to the weighted average trading price of the Corporation’s voting shares for the five trading days immediately preceding the grant date.
Each RSU entitles the senior executive officers to receive payment upon vesting in the form of voting shares of the Corporation. RSUs time vest over a period of up to three years, with compensation expense being recognized in net earnings over the service period.
Each PSU entitles the senior executive officers to receive payment upon vesting in the form of voting shares of the Corporation. PSUs time vest over a period of up to three years and incorporate performance criteria established at the time of grant. Compensation expense is recognized in net earnings over the service period based on the number of units expected to vest.
The Corporation intends to settle all RSUs and PSUs with shares either through the purchase of voting shares on the open market or the issuance of new shares from treasury; however, wholly at its own discretion, the Corporation may settle the units in cash. For the year ended December 31, 2017, the Corporation settled 62,364 RSUs and 66,063 PSUs through the purchase of shares on the open market and nil through the issuance from treasury (December 31, 2016 – 83,389 and 64,619 and nil, respectively).
Changes in the number of units, with their weighted average fair value, are summarized below:
2017 2016 RSUs PSUs RSUs PSUs
Number of units
Weighted fair value
Number of units
Weighted fair value
Number of units
Weighted fair value
Number of units
Weighted fair value
Units outstanding, beginning of year 197,865 22.80 336,718 22.78 222,720 24.04 302,887 24.79
Granted 118,392 22.25 207,755 22.19 100,798 20.35 203,666 20.12 Units, in lieu of dividends 5,779 24.84 10,042 24.90 5,864 21.78 9,007 21.87 Settled (62,364) 23.37 (66,063) 23.89 (83,389) 22.65 (64,619) 22.10 Forfeited - - - - (48,128) 23.55 (114,223) 23.72
Units outstanding, end of year 259,672 22.46 488,452 22.42 197,865 22.80 336,718 22.78
(f) Share-based payment expense
The following table summarizes share-based payment expense for the Corporation’s equity-based plans:
2017 2016 Stock option plan 13,498 12,536 Key employee plan 2,109 2,341 Executive share unit plan 3,443 3,555 Total share-based payment expense 19,050 18,432
Notes to Consolidated Financial Statements As at and for the years ended December 31, 2017 and 2016 (Stated in thousands of Canadian dollars, except percentage, ratio, share and per share amounts)
WestJet Annual Report 2017 │ 91
11. Share capital (continued)
(g) Deferred share units
The Corporation has a cash-settled deferred share unit (DSU) plan as an alternative form of compensation for independent members of the Corporation’s Board of Directors. Each DSU entitles a participant to receive cash upon settlement equal to the market value of the equivalent number of shares of the Corporation. The number of DSUs granted is determined based on the closing price of the Corporation’s common shares on the trading day immediately prior to the date of grant. Total compensation expense is recognized at the time of grant. Fluctuations in the market value are recognized to compensation expense in the period in which the fluctuations occur. For the year ended December 31, 2017, 44,576 (2016 – 51,494) DSUs were granted, with $2,222 (2016 – $1,992) of expense included in salaries and benefits. During the year ended December 31, 2017, the Corporation settled 5,355 DSUs (2016 – 32,873). The carrying amount of the liability, included in accounts payable and accrued liabilities, relating to the cash-settled DSUs at December 31, 2017 is $5,784 (2016 – $4,150). At December 31, 2017, 219,411 (2016 – 180,125) DSUs are vested and outstanding. DSUs are redeemable upon the Director’s retirement from the Board.
(h) Employee share purchase plan
The Corporation has an employee share purchase plan (ESPP), whereby the Corporation matches the contributions made by employees. Under the terms of the ESPP, employees may, dependent on their employment agreement, contribute up to a maximum of 10%, 15% or 20% of their gross salary to acquire voting shares of the Corporation at the current fair market value. The contributions are matched by the Corporation and are required to be held within the ESPP for a period of one year. Employees may offer to sell ESPP shares, which have not been held for at least one year, to the Corporation, at a purchase price equal to 50% of the weighted average trading price of the Corporation’s voting shares for the five trading days immediately preceding the employee’s notice to the Corporation, to a maximum of four times per year.
Under the terms of the ESPP, the Corporation acquires voting shares on behalf of employees through open market purchases.
The Corporation’s share of the contributions in 2017 amounted to $96,945 (2016 – $92,284) and is recorded as compensation expense within salaries and benefits.
12. Dividends
During the year ended December 31, 2017, the Corporation’s Board of Directors declared quarterly cash dividends of $0.14 per common voting share and variable voting share. For the year ended December 31, 2017, the Corporation paid dividends totaling $64,886 (2016 – $66,967).
13. Earnings per share
The following reflects the share data used in the computation of basic and diluted earnings per share:
2017 2016 Weighted average number of shares outstanding – basic 116,295,497 120,257,581 Employee stock options 707,201 54,520 Key employee-RSUs 176,167 159,984 Executive-RSUs 141,135 81,976 Executive-PSUs 44,926 56,643 Weighted average number of shares outstanding – diluted 117,364,926 120,610,704
For the year ended December 31, 2017, 2,544,013 employee stock options (2016 – 7,124,866 options) were not included in the calculation of dilutive potential shares as the result would have been anti-dilutive.
14. Finance cost
2017 2016 Interest on long-term debt
73,126 65,768 Capitalized interest(i) (19,825) (18,798) Accretion on maintenance provisions 409 2,104
53,710 49,074
(i) Relates to interest capitalized on deposits paid for Boeing and Bombardier aircraft yet to be delivered using a weighted average interest rate of 3.27%. Of the total amount capitalized for the twelve months ended December 31, 2016, $8,197 relates to prior periods.

Notes to Consolidated Financial Statements As at and for the years ended December 31, 2017 and 2016 (Stated in thousands of Canadian dollars, except percentage, ratio, share and per share amounts)
WestJet Annual Report 2017 │ 92
15. Financial instruments and risk management
(a) Fair value of financial assets and financial liabilities
The Corporation’s financial assets and liabilities consist primarily of cash and cash equivalents, marketable securities, restricted cash, accounts receivable, derivatives, other interest-bearing deposits, accounts payable and accrued liabilities and long-term debt. The following tables set out the Corporation’s classification and carrying amount, together with the fair value, for each type of financial asset and financial liability at December 31, 2017 and 2016:
Fair value Amortized cost Total
December 31, 2017 Through profit
or loss Financial assets
Financial liabilities
Carrying amount
Fair value
Asset (liability): Cash and marketable securities(i) – 1,482,866 – 1,482,866 1,482,866 Accounts receivable – 129,648 – 129,648 129,648 Foreign exchange derivatives(ii) (4,525) – – (4,525) (4,525) Interest rate derivatives(iii) 2,168 – – 2,168 2,168 Cross-currency interest rate swap
derivatives(iv) (9,309) – – (9,309) (9,309) Other deposits(v) – 82,655 – 82,655 81,709 Accounts payable and accrued liabilities(vi) – – (542,640) (542,640) (542,640) Long-term debt(vii) – – (2,049,047) (2,049,047) (1,906,152)
(11,666) 1,695,169 (2,591,687) (908,184) (766,235)
Fair value Amortized cost Total
December 31, 2016 Through profit
or loss Loans and receivables
Other financial liabilities
Carrying amount
Fair value
Asset (liability): Cash(i) 1,623,471 – – 1,623,471 1,623,471 Accounts receivable – 127,785 – 127,785 127,785 Foreign exchange derivatives(ii) 6,534 – – 6,534 6,534 Interest rate derivatives(iii) (7,672) – – (7,672) (7,672) Cross-currency interest rate swap derivatives(iv) 15,158 – – 15,158 15,158 Other deposits(v) 84,466 – – 84,466 83,568 Accounts payable and accrued liabilities(vi) – – (543,014) (543,014) (543,014) Long-term debt(vii) – – (2,046,658) (2,046,658) (1,971,965)
1,721,957 127,785 (2,589,672) (739,930) (666,135)
(i) Includes restricted cash of $109,700 (December 31, 2016 – $102,649) and marketable securities of $226,090 (December 31, 2016 – nil).
(ii) Includes $820 (December 31, 2016 – $7,725) classified in prepaid expenses, deposits and other, and $5,345 (December 31, 2016 – $1,191) classified in accounts payable and accrued liabilities.
(iii) Includes $2,067 (December 31, 2016 – $nil) classified in prepaid expenses, deposits and other, $1,299 (December 31, 2016 – $3,285) classified in accounts payable and accrued liabilities, $2,814 (December 31, 2016 - $1,359) classified in other long-term assets, and $1,414 classified in other long-term liabilities (December 31, 2016 – $5,746).
(iv) Includes $nil (December 31, 2016 - $601) classified in prepaid expenses, deposits and other, $560 (December 31, 2016 - $nil) classified in accounts payable and accrued liabilities, $nil (December 31, 2016 - $14,557) classified in other long-term assets and $8,749 classified in other long-term liabilities (December 31, 2016 - $nil).
(v) Includes $36,189 (December 31, 2016 – $36,723) classified in prepaid expenses, deposits and other, and $46,466 (December 31, 2016 – $48,090) classified in other long-term assets. The fair value of the long-term aircraft deposits is determined by discounting the future contractual cash flows using an average rate of 1.49% (December 31, 2016 – 0.89%) for an average term of 2.42 years (December 31, 2016 – 2.88 years).
(vi) Excludes foreign exchange derivative liabilities of $5,345 (December 31, 2016 – $1,191), interest rate derivative liabilities of $1,299 (December 31, 2016 – $3,285) and cross-currency interest rate swap derivative liabilities of $560 (December 31, 2016 - $nil).
(vii) Includes current portion of long-term debt of $153,149 (December 31, 2016 – $145,128) and long-term debt of $1,895,898 (December 31, 2016 – $1,901,530). The fair value of the long-term debt is determined by discounting the future contractual cash flows of principal and interest under the current financing arrangements using the Corporation’s December 31, 2017 implied Corporate BBB- rate of 4.85% (December 31, 2016 – 3.69%) for a 5.07 year term (December 31, 2016 – 5.45 year term), equal to the weighted average remaining term of the Corporation’s long term debt at December 31, 2017.

Notes to Consolidated Financial Statements As at and for the years ended December 31, 2017 and 2016 (Stated in thousands of Canadian dollars, except percentage, ratio, share and per share amounts)
WestJet Annual Report 2017 │ 93
15. Financial instruments and risk management (continued)
(a) Fair value of financial assets and financial liabilities (continued)
The following items shown in the consolidated statement of financial position at December 31, 2017 and 2016, are measured at fair value on a recurring basis and classified using level 1 or level 2 inputs. Level 1 inputs are defined as quoted prices in active markets while level 2 is defined as significant other observable inputs. There are no financial assets or liabilities classified as level 3 (significant unobservable inputs) in the fair value hierarchy.
December 31, 2017 Level 1 Level 2 Total Asset (liability):
Foreign exchange derivatives − (4,525) (4,525) Interest rate derivatives − 2,168 2,168 Cross-currency interest rate swap derivatives − (9,309) (9,309)
− (11,666) (11,666)
December 31, 2016 Level 1 Level 2 Total Asset (liability):
Cash and cash equivalents 1,623,471 − 1,623,471 Foreign exchange derivatives − 6,534 6,534 Interest rate derivatives − (7,672) (7,672) Cross-currency interest rate swap derivatives − 15,158 15,158 Other deposits 84,466 - 84,466
1,707,937 14,020 1,721,957
During the years ended December 31, 2017 and 2016, there were no transfers between level 1, level 2 and level 3 financial assets and liabilities measured at fair value.
Cash and cash equivalents: Classified as level 1 at December 31, 2016, these consist of bank balances and short-term investments, primarily highly liquid instruments, with terms up to 91 days. Interest income is recorded in the consolidated statement of earnings as finance income. Due to its short-term nature, the carrying value of cash and cash equivalents approximates its fair value.
Foreign exchange derivatives: Classified as level 2, these consist of foreign exchange forward contracts where the fair value of the forward contracts is measured based on the difference between the contracted rate and the current forward price. At December 31, 2017, to fix the exchange rate on a portion of the Corporation’s US dollar aircraft lease payments and hotel costs for the next twelve months, the Corporation has entered into foreign exchange contracts with an average monthly notional of US $19,013 (December 31, 2016 – US $21,078) for a total of US $228,155 (2016 – US $252,934) at a weighted average contracted rate on the forward contracts of 1.2745 (December 31, 2016 – 1.3150) Canadian dollars to one US dollar, and the weighted average forward rate used in determining the fair value was 1.2547 (December 31, 2016 – 1.3414) Canadian dollars to one US dollar. At December 31, 2017, a portion of the change in the fair value of foreign exchange derivatives amounting to $399 (December 31, 2016- $nil) was recognized within gain (loss) on derivatives in the consolidated statement of earnings as hedge ineffectiveness. Interest rate derivatives: Classified as level 2, these consist of interest rate swap contracts that exchange a floating rate of interest with a fixed rate of interest. The fair value of the interest rate swaps is determined by measuring the difference between the fixed contracted rate and the forward curve for the applicable floating interest rates. At December 31, 2017, the Corporation’s swap contracts have an outstanding notional value of $441,831 with a weighted average fixed interest rate of 1.61% (December 31, 2016 – 1.69%). The December 31, 2017 weighted average floating forward interest rate was 2.09% (December 31, 2016 – 1.32%).
Cross-currency interest rate swap derivatives: Classified as level 2, these consist of fixed US dollar to fixed Canadian dollar uncollateralized cross-currency interest rate swap agreements to mitigate exposure to fluctuations in future cash flows that are attributable to foreign currency risk resulting from the issuance of US denominated long-term debt. The USD $400,000 notional at 3.50% interest per annum was exchanged for CAD $511,110 at a 3.56% weighted average interest per annum through the terms of the swaps, which match the 5-year maturity of the USD senior unsecured notes. The fair value of the cross-currency interest rate swap contracts was determined by discounting the difference between the contracted prices and market based yield curves.
Other deposits: Classified as level 1, these consist of deposits related to certain leased aircraft as well as airport operations.
Notes to Consolidated Financial Statements As at and for the years ended December 31, 2017 and 2016 (Stated in thousands of Canadian dollars, except percentage, ratio, share and per share amounts)
WestJet Annual Report 2017 │ 94
15. Financial instruments and risk management (continued)
(a) Fair value of financial assets and financial liabilities (continued)
The following table represents the maturity of derivative financial instruments by risk category:
(notional in 000’s) Currency Total Within 1 year 1– 5 years Over 5 years Foreign currency risk:
Foreign exchange derivatives USD 228,155 228,155 – – Cross-currency interest rate swap derivatives USD 400,000 – 400,000 –
628,155 228,155 400,000 – Interest rate risk:
Interest rate derivatives CAD 441,831 29,804 145,468 266,559
(b) Risk management related to financial instruments
The Corporation is exposed to market, credit and liquidity risks associated with its financial assets and liabilities. From time to time, the Corporation may use various financial derivatives to reduce exposures from changes in foreign exchange rates, interest rates and jet fuel prices. The Corporation does not hold or use any derivative instruments for trading or speculative purposes.
The Corporation’s Board of Directors has responsibility for the establishment and approval of the Corporation’s overall risk management policies, including those related to financial instruments. Management performs continuous assessments so that all significant risks related to financial instruments are reviewed and addressed in light of changes to market conditions and the Corporation’s operating activities.
Market risk
Market risk is the risk that the fair value or future cash flows of a financial instrument will fluctuate due to changes in market prices. The Corporation’s significant market risks relate to fuel price risk, foreign exchange risk and interest rate risk.
(i) Fuel price risk
The airline industry is inherently dependent upon jet fuel to operate and, therefore, the Corporation is exposed to the risk of volatile fuel prices. Fuel prices are impacted by a host of factors outside the Corporation’s control, such as significant weather events, geopolitical tensions, refinery capacity, and global demand and supply.
The Corporation estimates that a one-cent change in the value of the Canadian dollar versus the US dollar will have an approximate impact of $7.4 million on fuel costs and that a change of one US-dollar per barrel of West Texas Intermediate (WTI) crude oil will have an approximate impact of US $9.7 million on fuel costs. For the year ended December 31, 2017, aircraft fuel expense represented approximately 23% (2016 – 21%) of the Corporation’s total operating expenses.
(ii) Foreign exchange risk
The Corporation is exposed to foreign exchange risks arising from fluctuations in exchange rates on its US-dollar-denominated monetary assets and liabilities and its US-dollar operating expenditures, mainly aircraft fuel, aircraft leasing expense, the land component of vacations packages, aircraft purchases and depreciation and certain maintenance and airport operation costs.
US dollar monetary assets and liabilities
The gain or loss on foreign exchange included in the Corporation’s consolidated statement of earnings is mainly attributable to the changes and settlements in the value of the Corporation’s US-dollar-denominated monetary assets and liabilities. At December 31, 2017, US-dollar-denominated net monetary assets totaled approximately US $61,574 (2016 – liability of US $19,423).
The Corporation estimates that a one-cent change in the value of the US dollar versus the Canadian dollar at December 31, 2017, would have increased or decreased net earnings for the year ended December 31, 2017, by $433 (2016 – $138), as a result of the Corporation’s US-dollar-denominated net monetary asset balance.
US-dollar aircraft leasing and vacation package hotel costs
The Corporation has foreign exchange forward contracts to fix the foreign exchange rate on a portion of US-dollar hotel costs that form part of the Corporation’s vacation packages and to fix the US-dollar cost of aircraft leasing. All foreign exchange forward contracts are governed by the Corporation’s Foreign Currency Risk Management Policy. The Corporation applies cash flow hedge accounting for certain foreign exchange hedges.

Notes to Consolidated Financial Statements As at and for the years ended December 31, 2017 and 2016 (Stated in thousands of Canadian dollars, except percentage, ratio, share and per share amounts)
WestJet Annual Report 2017 │ 95
15. Financial instruments and risk management (continued)
(b) Risk management related to financial instruments (continued)
Market risk (continued)
The following table presents the financial impact and statement presentation of the Corporation’s foreign exchange derivatives on the consolidated statement of financial position:
Statement presentation 2017 2016 Fair value Prepaid expenses, deposits and other 820 7,725 Fair value Accounts payable and accrued liabilities (5,345) (1,191) Unrealized gain (loss) Hedge reserves (before tax) (4,305) 2,476
The following table presents the financial impact and statement presentation of the Corporation’s foreign exchange derivatives on the consolidated statement of earnings:
Statement presentation 2017 2016 Realized gain (loss) Aircraft leasing (2,182) 5,534 Realized loss Other revenue (5,188) (500) Realized and unrealized gain (loss) Gain (loss) on derivatives (2,426) 4,504
The following table presents the financial impact and statement presentation of the Corporation’s cross-currency swaps on the consolidated statement of financial position:
Statement presentation 2017 2016 Fair value Prepaid expenses, deposits and other - 601 Fair value Accounts payable and accrued liabilities (560) - Fair value Other assets - 14,557 Fair value Other liabilities (8,749) - Unrealized gain (loss) Hedge reserves (before tax) (9,309) 15,158
The following table presents the financial impact and statement presentation of the Corporation’s cross-currency swaps on the consolidated statement of earnings:
Statement presentation 2017 2016 Realized gain Finance cost 56 234
A one-cent change in the US-dollar exchange rate for the year ended December 31, 2017, would impact hedge reserves, net of taxes, by $1,586 (2016 – $877) and gain on derivatives, net of taxes, by $79 (2016 – $973) as a result of the Corporation’s foreign exchange derivatives.
(iii) Interest rate risk
Interest rate risk is the risk that the value or future cash flows of a financial instrument will fluctuate as a result of changes in market interest rates.
Cash, cash equivalents and marketable securities
The Corporation is exposed to interest rate fluctuations on its short-term investments, included in cash, cash equivalents and marketable securities. A change of 50 basis points in the market interest rate would have an approximate impact on net earnings of $3,673 (2016 – $2,753) as a result of the Corporation’s short-term investment activities.
Deposits
The Corporation is exposed to interest rate fluctuations on interest-bearing deposits related to airport operations, which, at December 31, 2017, totaled $14,584 (2016 – $14,584). A reasonable change in market interest rates at December 31, 2017, would not have significantly impacted the Corporation’s net earnings due to the small size of these deposits.
Long-term debt
The Corporation is exposed to interest rate risks arising from fluctuations in market interest rates on its variable-rate debt. The fixed-rate debt and interest rate swaps on the Corporation’s long-term debt mitigate the majority of the impacts of interest rate fluctuations over the term of the outstanding debt and therefore a change in interest rates at December 31, 2017, would not impact net earnings.

Notes to Consolidated Financial Statements As at and for the years ended December 31, 2017 and 2016 (Stated in thousands of Canadian dollars, except percentage, ratio, share and per share amounts)
WestJet Annual Report 2017 │ 96
15. Financial instruments and risk management (continued)
(b) Risk management related to financial instruments (continued)
Market risk (continued)
At December 31, 2017, the Corporation has entered into interest rate swaps with a weighted-average term of 6.7 years and a weighted-average fixed contracted rate was 1.61%, inclusive of a basis point spread. The Corporation applies cash flow hedge accounting to certain interest rate swaps.
The following table presents the financial impact and statement presentation of the Corporation’s interest rate derivatives on the consolidated statement of financial position:
Statement presentation 2017 2016 Fair value Prepaid expenses, deposits and other 2,067 - Fair value Other assets 2,814 1,359 Fair value Accounts payable and accrued liabilities (1,299) (3,285) Fair value Other liabilities (1,414) (5,746) Unrealized loss Hedge reserves (before tax) (3,106) (6,734)
The following table presents the financial impact and statement presentation of the Corporation’s interest rate derivatives on the consolidated statement of earnings:
Statement presentation 2017 2016 Realized loss Finance cost (2,746) (3,882)
A change of 50 basis points in market interest rates at December 31, 2017, would impact hedge reserves, net of taxes, by $3,368 (2016 – $5,583) and loss on derivatives, net of taxes, by $nil (2016 – $nil) as a result of the Corporation’s interest rate derivatives.
Credit risk
Credit risk is the risk that one party to a financial instrument will cause a financial loss for the other party by failing to discharge an obligation. At December 31, 2017, the Corporation’s credit exposure consists primarily of the carrying amounts of cash, cash equivalents and marketable securities, restricted cash, accounts receivable, other deposits and the fair value of derivative financial assets.
The Corporation’s maximum exposure to credit risk is represented by the balances in the aforementioned accounts:
2017 2016 Cash, cash equivalents and marketable securities(i) 1,373,166 1,520,822 Restricted cash(i) 109,700 102,649 Accounts receivable(ii) 129,648 127,785 Other deposits(iii) 82,655 84,466 Derivative financial assets(iv) 5,701 24,242
(i) Consist of bank balances, short-term investments with terms of up to 91 days and marketable securities with terms up to 365 days. Credit risk associated with cash, cash equivalents, marketable securities and restricted cash is minimized substantially by ensuring that these financial assets are invested primarily in debt instruments with highly rated financial institutions, some with provincial-government-backed guarantees. The Corporation manages its exposure by assessing the financial strength of its counterparties and by limiting the total exposure to any one individual counterparty.
(ii) All significant counterparties, both current and new, are reviewed and approved for credit on a regular basis under the Corporation’s credit management processes. The Corporation does not hold any collateral as security, however, in some cases the Corporation requires guaranteed letters of credit with certain of its counterparties. Trade receivables are generally settled within 30 to 60 days. Industry receivables are generally settled in less than 30 days.
(iii) The Corporation is exposed to counterparty credit risk on its deposit relating to certain leased aircraft and airport operations, however it considers this risk to be remote because of the nature and size of the counterparties.
(iv) Derivative financial assets consist of foreign exchange forward contracts and interest rate swaps. The Corporation reviews the size and credit rating of both current and any new counterparties in addition to limiting the total exposure to any one counterparty.
There were no new bad debts recorded for the year ended December 31, 2017 (2016 – $nil).

Notes to Consolidated Financial Statements As at and for the years ended December 31, 2017 and 2016 (Stated in thousands of Canadian dollars, except percentage, ratio, share and per share amounts)
WestJet Annual Report 2017 │ 97
15. Financial instruments and risk management (continued)
(b) Risk management related to financial instruments (continued)
Liquidity risk
Liquidity risk is the risk that the Corporation will encounter difficulty in meeting obligations associated with financial liabilities. The Corporation maintains a strong liquidity position and sufficient financial resources to meet its obligations as they fall due.
The table below presents a maturity analysis of the Corporation’s undiscounted contractual cash flows for its non-derivative and derivative financial liabilities at December 31, 2017. The analysis is based on foreign exchange and interest rates in effect at the consolidated statement of financial position date, and includes both principal and interest cash flows for long-term debt.
Total Within 1 year 1–3 years 4–5 years Over 5 years Accounts payable and accrued liabilities(i) 542,640 542,640 - - - Derivative financial liabilities(ii) 17,367 7,204 10,163 - - Long-term debt and interest 2,287,847 218,572 943,602 716,274 409,399 2,847,854 768,416 953,765 716,274 409,399
(i) Excludes foreign exchange derivative liabilities of $5,345, interest rate derivative liabilities of $1,299 and cross-currency swap derivative liabilities of $560.
(ii) Derivative financial liabilities consist of foreign exchange forward contracts of $5,345, interest rate derivative contracts of $2,713 and cross-currency swap derivative contracts of $9,309. The Corporation reports interest rate derivatives at their net position.
A portion of the Corporation’s cash and cash equivalents balance relates to cash collected with respect to advance ticket sales, for which the balance at December 31, 2017, was $695,111 (2016 – $626,635). The Corporation has cash and cash equivalents on hand to have sufficient liquidity to meet its liabilities, when due, under both normal and stressed conditions.
The Corporation aims to maintain a current ratio, defined as current assets over current liabilities, of approximately 1.00 or greater with the understanding that point-in-time fluctuations may periodically bring the ratio below 1.00. At December 31, 2017, the Corporation’s current ratio was 1.04 (2016 – 1.21).
At December 31, 2017, the Corporation has not been required to post collateral with respect to any of its outstanding derivative contracts.
Notes to Consolidated Financial Statements As at and for the years ended December 31, 2017 and 2016 (Stated in thousands of Canadian dollars, except percentage, ratio, share and per share amounts)
WestJet Annual Report 2017 │ 98
16. Commitments
(a) Purchased aircraft and spare engines
At December 31, 2017, the Corporation is committed to purchase 10 787-9 Dreamliner aircraft for delivery between 2019 and 2021 and 51 737 MAX aircraft for delivery between 2018 and 2027. The Corporation is also committed to purchase two Q400 NextGen aircraft for delivery in 2018 and a total of 10 Boeing and Bombardier spare engines for delivery between 2018 and 2026.
The remaining estimated deposits and delivery payments for the 63 aircraft and 10 spare engines are presented in the table below. Where applicable, US dollar commitments are translated at the period end foreign exchange rate.
Within 1 year 510,686 1 – 3 years 1,389,839 4 – 5 years 1,379,643 Over 5 years 1,478,190 4,758,358
(b) Leases and contractual commitments
The Corporation has entered into leases and other contractual commitments for aircraft, land, buildings, equipment, computer hardware, software licenses and inflight entertainment. At December 31, 2017, the future payments under these commitments are presented in the table below. Where applicable, US dollar commitments are translated at the period end foreign exchange rate.
Within 1 year 273,587 1 – 3 years 347,978 4 – 5 years 167,563 Over 5 years 88,507 877,635
(c) Letters of guarantee
At December 31, 2017, the Corporation has a revolving letter of credit facility totaling $50,000 (December 31, 2016 – $50,000). The facility requires funds to be assigned and held in cash security for the full value of letters of guarantee issued by the Corporation. At December 31, 2017, $32,234 (December 31, 2016 – $31,013) letters of guarantee were issued under the facility by assigning restricted cash.
Notes to Consolidated Financial Statements As at and for the years ended December 31, 2017 and 2016 (Stated in thousands of Canadian dollars, except percentage, ratio, share and per share amounts)
WestJet Annual Report 2017 │ 99
17. Related parties
(a) Interests in subsidiaries
The consolidated financial statements of WestJet Airlines Ltd., the parent company, include the accounts of the Corporation and its following five directly wholly-owned subsidiaries incorporated in Canada, as well as an indirectly wholly-owned Alberta partnership:
WestJet Investment Corp. (WIC) WestJet Operations Corp. (WOC) WestJet Vacations Inc. (WVI) WestJet Encore Ltd. (Encore) Swoop Inc. (Swoop) WestJet, An Alberta Partnership (Partnership)
The Partnership is the primary operating entity of the Corporation. WIC, WOC, WVI, Encore and Swoop were created for legal, tax and marketing purposes and do not operate independently of the Partnership. Their relationship is such that they depend critically on the Partnership for a variety of resources including financing, human resources and systems and technology. There are no legal or contractual restrictions on the Corporation’s and subsidiaries’ ability to access or use assets or settle liabilities of the consolidated group.
(b) Interests in consolidated structured entities
The Corporation also controls and consolidates three structured entities in which the Corporation has no equity ownership but controls and has power over all relevant activities and is exposed to and has rights to variable returns by means of contractual relationships. These entities were established for legal purposes to facilitate the financing of aircraft. These entities do not conduct any operations except to hold legal title to specific aircraft and their related debt obligations. Through these contractual relationships, the Corporation is required to fund all of the aircraft debt obligations of these entities. There are no legal or contractual restrictions between the Corporation and these entities that limit the access or use of assets or the settlement of liabilities. The full amount of the aircraft debt obligations are reported as long-term debt on the Corporation’s consolidated statement of financial position. The nature of the risks associated with these entities is limited to specific tax legislation in Canada and the U.S. Although considered remote by Management, the potential for future changes to Canadian and U.S. tax legislation affecting these entities could have potential adverse tax effects on the Corporation.
(c) Interests in unconsolidated structured entities
The Corporation is a party to 18 Fuel Facility Corporations (FFCs) and three De-Icing Facility Corporations (DFCs) for the purpose of obtaining cost effective into-plane fuel services and aircraft de-icing services at select Canadian and US airports. These operating costs are recorded in aircraft fuel and other expenses, respectively, on the consolidated statement of earnings. At December 31, 2017, the Corporation has $2,318 in operating deposits with the FFCs and DFCs classified in prepaids, deposits and other on the consolidated statement of financial position. The Corporation has no equity ownership and no control or significant influence in the FFCs or DFCs. The financing and operating costs of these entities are shared amongst numerous contracting airlines based on a variety of contractual terms including fuel volume consumption and qualifying flights. The Corporation classifies its monthly operating cost obligations to the FFCs and DFCs as other financial liabilities and these obligations are included in accounts payable and accrued liabilities on the consolidated statement of financial position. The 18 FFCs and three DFCs have combined total assets of approximately $898,696 and liabilities of $897,752 based on the most recent information received. In the event any or all contracting airlines default and withdraw from the FFCs and DFCs and no amounts are recovered through legal recourse, the Corporation and any remaining contracting airlines are liable for the outstanding obligations of the FFCs and DFCs. These obligations represent the Corporation’s maximum exposure to loss from the FFCs and DFCs.
(d) Key management personnel
The Corporation has defined key management personnel as Senior Executive Officers and the Board of Directors, as they have the collective authority and responsibility for planning, directing and controlling the activities of the Corporation. The following table outlines the total compensation expense for key management personnel for the years ended December 31, 2017 and 2016.
2017 2016 Salaries, benefits and other compensation(i) 7,840 5,860 Share-based payment expense(ii) 6,802 6,530 14,642 12,390
(i) Other compensation includes the employee share purchase plan, profit share, cash compensation paid to the Board of Directors, payments under the Corporation’s short-term incentive plan to Senior Executive Officers and amounts paid on departure.
(ii) Includes amounts expensed pursuant to the stock option plan, executive share unit plan and deferred share unit plan.

Notes to Consolidated Financial Statements As at and for the years ended December 31, 2017 and 2016 (Stated in thousands of Canadian dollars, except percentage, ratio, share and per share amounts)
WestJet Annual Report 2017 │ 100
18. Additional financial information
(a) Assets
Note 2017 2016 Accounts receivable:
Trade and industry(i) 120,518 119,375 Other 11,427 10,707 Allowance (2,297) (2,297) 129,648 127,785
Prepaid expenses, deposits and other: Prepaid expenses(ii) 81,667 122,072 Short-term deposits(iii) 36,189 36,723 Maintenance reserves – current portion 8 16,281 13,727 Derivatives 15 2,887 8,326 Other 1,652 222
138,676 181,070 Inventory:
Fuel 20,649 14,892 Aircraft expendables 21,483 17,810 De-icing fluid 380 484 Other 533 349
43,045 33,535 Other Assets:
Aircraft deposits(iv) 39,968 41,173 Maintenance reserves – long term 8 13,761 16,823 Derivatives 15 2,814 15,916 Other(v) 22,041 21,456
78,584 95,368
(i) Trade receivables include receivables relating to airport operations, fuel rebates, marketing programs and ancillary revenue products and services. Industry receivables include receivables relating to travel agents, interline agreements with other airlines and partnerships. Significant counterparties are reviewed and approved for credit on a regular basis. Trade receivables are generally settled in 30 to 60 days. Industry receivables are generally settled in less than 30 days.
(ii) Includes prepaid expenses for insurance, vacation package vendors, maintenance services on owned and leased aircraft and other operating costs.
(iii) Includes deposits relating to aircraft fuel, airport operations, deposits on leased aircraft and other operating costs.
(iv) Includes long-term deposits with lessors for leased aircraft.
(v) Includes long-term deposits for airport operations and long-term prepaid financing costs.
(b) Liabilities
Note 2017 2016 Accounts payable and accrued liabilities:
Trade and industry 478,836 450,249 Taxes payable 23,394 63,198 Derivatives 15 7,204 4,476 Other 40,410 29,567 549,844 547,490
Other liabilities: Deferred contract incentives(i) 9,008 2,628 Derivatives 15 10,163 5,746
19,171 8,374
(i) Deferred contract incentives relate to discounts received on aircraft related items as well as the net effect of rent free periods and cost escalations on land leases. Incentives, rent free periods and cost escalations are recognized on a straight-line basis over the terms of the related contracts.

Corporate information Board of Directors Clive Beddoe, Chair of the Board Brad Armitage, WEA Chair Hugh Bolton, Director Ron Brenneman, Director Christopher Burley, Vice Chair of the Board Brett Godfrey, Director Allan Jackson, Director S. Barry Jackson, Director L. Jacques Ménard, Director Janice Rennie, Director Karen Sheriff, Director Edward Sims, President and Chief Executive Officer
Executive team Edward Sims, President and Chief Executive Officer Harry Taylor, Executive Vice-President, Finance and Chief Financial Officer Bob Cummings, Executive Vice-President, Strategy Mark Porter, Executive Vice-President, People and Culture Barbara Munroe, Executive Vice-President, Corporate Services and General Counsel Cameron Kenyon, Executive Vice-President, Operations Craig Maccubbin, Executive Vice-President and Chief Information Officer Charles Duncan, Executive Vice-President and President, WestJet Encore Steven Greenway, Executive Vice-President and President, Swoop Stock exchange listing Shares in WestJet stock are publicly traded on the Toronto Stock Exchange under the symbol WJA. Investor relations contact information Phone: 1-877-493-7853 Email: [email protected] WestJet headquarters 22 Aerial Place NE Calgary, Alberta T2E 3J1 Phone: 403-444-2600 Toll-free: 888-293-7853 Annual meeting WestJet Airlines Ltd.’s annual meeting will be held at 10 a.m. (MT) on Tuesday, May 8, 2018, at WestJet’s headquarters at 22 Aerial Place NE Calgary, Alberta T2E 3J1 Auditors KPMG LLP, Calgary, Alberta Transfer agent and registrar AST Trust Company (Canada) www.astfinancial.com Toll-free in North America: 1-800-387-0825