Embed Size (px)
Citation preview
■ By late 2016, market sentiment had quickly shifted from an overly pessimistic outlook of cyclically weak stagnation toward an overly optimistic expectation of a growth acceleration. Both views are incorrect.
■ Global growth should stabilize, not stagnate. Ever-tightening labour markets should place modest upward pressure on otherwise low inflation. And further monetary stimulus (i.e. negative interest rates) will prove unproductive in spurring unlevered growth. Global bond yields are unlikely to rise materially higher until the major economies address structural impediments to higher productivity growth. The risks to the consensus outlook vary notably across markets.
■ Vanguard’s outlook for portfolio returns is modest compared with the heady returns experienced since the depths of the Global Financial Crisis. This guarded, but not bearish, outlook is unlikely to change until we see a combination of higher short-term rates and more favourable valuation metrics. In some ways, the investment environment for the next five years may prove more challenging than the previous five, underscoring the need for discipline, reasonable expectations, and low-cost strategies.
Vanguard Research December 2016
2017 economic and market outlook: Stabilization, not stagnation

Vanguard Investment Strategy GroupVanguard Global Economics Team
Joseph Davis, PhD Global Chief Economist
Americas
Roger A. Aliaga-Díaz, PhD Chief Economist, Americas
Jonathan Lemco, PhD
Harshdeep Ahluwalia, MSc
Joshua M. Hirt
Vytautas Maciulis, CFA
Zoe B. Odenwalder
David Pakula, CFA
Andrew J. Patterson, CFA
Christos Tasopoulos, MSc
Ravi Tolani
Matthew C. Tufano
Europe
Peter Westaway, PhD Chief Economist, Europe
Alexis Gray, MSc
Asia-Pacific
Qian Wang, PhD Chief Economist, Asia-Pacific
Jessica Mengqi Wu, MSc, CFA
Beatrice Yeo
Editorial noteThis publication is an update of Vanguard’s annual economic and market outlook for 2017 for key economies around the globe. Aided by Vanguard Capital Markets Model™ simulations and other research, we also forecast future performance for a broad array of fixed income and equity asset classes.
AcknowledgementsWe thank Lara de la Iglesia and Andrew S. Clarke, CFA, for their significant contributions to this piece and the work of the Global Economics Team. Further, we would like to acknowledge the work of Vanguard’s broader Investment Strategy Group, without whose tireless research efforts this piece would not be possible.
Lead authors
Joseph Davis, PhDGlobal Chief Economist
Roger A. Aliaga-Díaz, PhDChief Economist, Americas
Peter Westaway, PhDChief Economist, Europe
Qian Wang, PhDChief Economist, Asia-Pacific
Andrew J. Patterson, CFASenior Economist
Harshdeep Ahluwalia, MScSenior Investment Strategist
Contents
Global outlook summary.......................................................................................................................................................................................... 4
I. Global economic perspectives ...........................................................................................................................................................6
Global economic outlook: Low growth, not stagnation ..........................................................................................................................6
United States: Resiliency in the midst of global weakness .............................................................................................................11
Canada: Globalization hits home … eventually .............................................................................................................................................15
China: Balancing the risks of its rebalancing ...................................................................................................................................................17
Japan: Fighting against looming policy limits .................................................................................................................................................19
Europe: Year 1 A.B. (After Brexit) ............................................................................................................................................................................ 20
II. Global capital markets outlook .......................................................................................................................................................22
Global fixed income markets: Positive but muted .................................................................................................................................... 22
Global equity markets: Still guarded, but not bearish ............................................................................................................................25
Implications for balanced portfolios and asset allocation: Expect modest real returns ......................................27
III. Appendix: Vanguard Capital Markets Model™ and index simulations .............35
3
Notes on asset-return distributions
The asset-return distributions shown here represent Vanguard’s view on the potential range of risk premiums that may occur over the next ten years; such long-term projections are not intended to be extrapolated into a short-term view. These potential outcomes for long-term investment returns are generated by the Vanguard Capital Markets Model™ (VCMM—see also the description in the Appendix) and reflect the collective perspective of our Investment Strategy Group. The expected risk premiums—and the uncertainty surrounding those expectations—are among a number of qualitative and quantitative inputs used in Vanguard’s investment methodology and portfolio construction process.
IMPORTANT: The projections or other information generated by the VCMM regarding the likelihood of various investment outcomes are hypothetical in nature, do not reflect actual investment results, and are not guarantees of future results. Distribution of return outcomes from the VCMM, derived from 10,000 simulations for each modelled asset class. Simulations as of September 30, 2016. Results from the model may vary with each use and over time. For more information, see the Appendix.

Global outlook summaryGlobal economy: Stabilization, not stagnation
Since the end of the Global Financial Crisis, economic growth has fallen short of historical averages and consistently disappointed policymakers. Deflationary shocks have roiled the markets, and much of the world’s bond market offers negative yields. Some analysts still believe the world is headed for Japanese-style secular stagnation. And yet the modest global recovery—at times frustratingly weak—has endured, proving the most ardent pessimists wrong.
With forecasters having downgraded global growth outlooks for at least five consecutive years, we believe that the risks to the consensus outlook of 3% are more balanced this year. We anticipate “sustained fragility” for global trade and manufacturing, given China’s ongoing rebalancing and the need for structural business-model adjustments across emerging-market economies. We do not anticipate a Chinese “hard landing” in 2017, but we are more bearish than consensus on China’s medium-run growth prospects.
Our growth outlook for developed markets remains modest but steady. Increasingly sound economic fundamentals supported by U.S. and European policy should help offset weakness in the United Kingdom and Japan. For the United States, 3% GDP growth is possible in 2017, even as job growth cools. Our long- held estimate of 2% U.S. trend growth is neither “new” nor “subpar” when accounting for lower population growth and exclusion of the consumer-debt-fuelled boost to growth between 1980 and the Global Financial Crisis.
Inflation: Global disinflationary forces waning for now
Many developed economies will struggle to consistently achieve 2% core inflation due to a combination of depressed inflation expectations, excess capacity and structural falls in some prices associated with digital technology and excess commodity capacity in China and elsewhere. That said, some of the most pernicious deflationary forces are cyclically moderating. U.S. core inflation should modestly “overshoot” 2% in 2017, prompting the U.S. Federal Reserve to raise rates. U.K. inflation is also set to overshoot following the post-Brexit depreciation of sterling. By contrast, euro-area inflation will only return to target levels gradually.
Monetary policy and interest rates: Central banks grapple with their limits
The U.S. Federal Reserve is likely to pursue a “dovish tightening,” raising rates to 1.5% in 2017 while leaving the federal funds rate below 2% through at least 2018.
Elsewhere, further monetary stimulus seems possible, but its benefits may be waning and, in the case of negative interest rates, potentially harmful to the very same credit-transmission channel that monetary policy attempts to stimulate. Even so, the European Central Bank (ECB) and Bank of Japan (BoJ) could yet add to the quantitative easing implemented in 2016.
Chinese policymakers have the most difficult task of engineering a “soft landing” by lowering real borrowing costs and the real exchange rate without accelerating capital outflows. The margin of error is slim, and policymakers should continue to provide fiscal stimulus to the economy this year to avert a hard landing. The most important policy measure we are monitoring is the pace of reforms for China’s state-owned enterprises, which are currently key sources of over-investment and deflationary excess capacity.
4
Vanguard’s distinct approach to forecastingTo treat the future with the deference it deserves, Vanguard believes that market forecasts are best viewed in a probabilistic framework. This publication’s primary objectives are to describe the projected long-term return distributions that contribute to strategic asset allocation decisions and to present the rationale for the ranges and probabilities of potential outcomes. This analysis discusses our global outlook from the perspective of a Canadian investor with a Canadian dollar-denominated portfolio.

Investment outlook: Muted, but positive given low-rate reality
Vanguard’s outlook for global stocks and bonds remains the most guarded in ten years, given fairly high equity valuations and the low-interest-rate environment. We don’t expect global bond yields to increase materially from year-end 2016 levels.
Bonds. The return outlook for fixed income remains positive yet muted. For example, our fair-value estimate for the benchmark 10-year U.S. Treasury yield still resides near 2.5%, even with two to three near-term increases in the policy rate. As we stated in 2015, even in a rising-rate environment, duration tilts are not without risks, given global inflation dynamics and our expectations for monetary policy. Recent low volatility and compressed corporate bond spreads point to credit risks outweighing those of duration.
Stocks. After several years of suggesting that low economic growth need not equate with poor equity returns, our medium-run outlook for global equities remains guarded in the 6%–8% range. That said, our long-term outlook is not bearish and can even be viewed as positive when adjusted for the low-rate environment.
Asset allocation. Vanguard’s outlook for portfolio returns is modest across all asset allocations when compared with the heady returns experienced since the depths of the Global Financial Crisis. This guarded but not bearish outlook is unlikely to change until we see a combination of higher short-term rates and more favourable valuation metrics. The investment environment for the next five years may prove more challenging than the previous five, underscoring the need for discipline, reasonable return expectations, and low-cost strategies.
5
Indexes used in our historical calculations
The long-term returns for our hypothetical portfolios are based on data for the appropriate market indexes through September 2016. We chose these benchmarks to provide the best history possible, and we split the global allocations to align with Vanguard’s guidance in constructing diversified portfolios.
Canadian bonds: Bloomberg Barclays Canadian Aggregate Bond Index since 2002.
International bonds: Citigroup High Grade Index CAD Hedged from 1971 through 1972; Lehman Brothers US Long Credit AA Index CAD Hedged from 1973 through 1975; Bloomberg Barclays U.S. Aggregate Bond Index CAD Hedged from 1975 through 1989; Bloomberg Barclays Global Aggregate Bond Index CAD Hedged from 1990 through August 2000; Bloomberg Barclays Global Aggregate ex Canada Bond Index (CAD Hedged) thereafter.
Global bonds: From 1971 through 2002, international bonds as defined above. After 2002, 25% Canadian bonds and 75% ex-Canada bonds, rebalanced monthly.
Canadian equities: MSCI Canada Index since 1970.
International equities: MSCI World Index from 1971 through 1988; and MSCI All Country World Index thereafter.
Global equities: Through 1971, 100% Canadian equities as defined above. After 1971, 25% Canadian equities and 75% ex-Canada equities, rebalanced monthly.
Canadian inflation: Consumer price index for Canada since 1970.
I. Global economic perspectives
Global economic outlook: Low growth, not stagnation
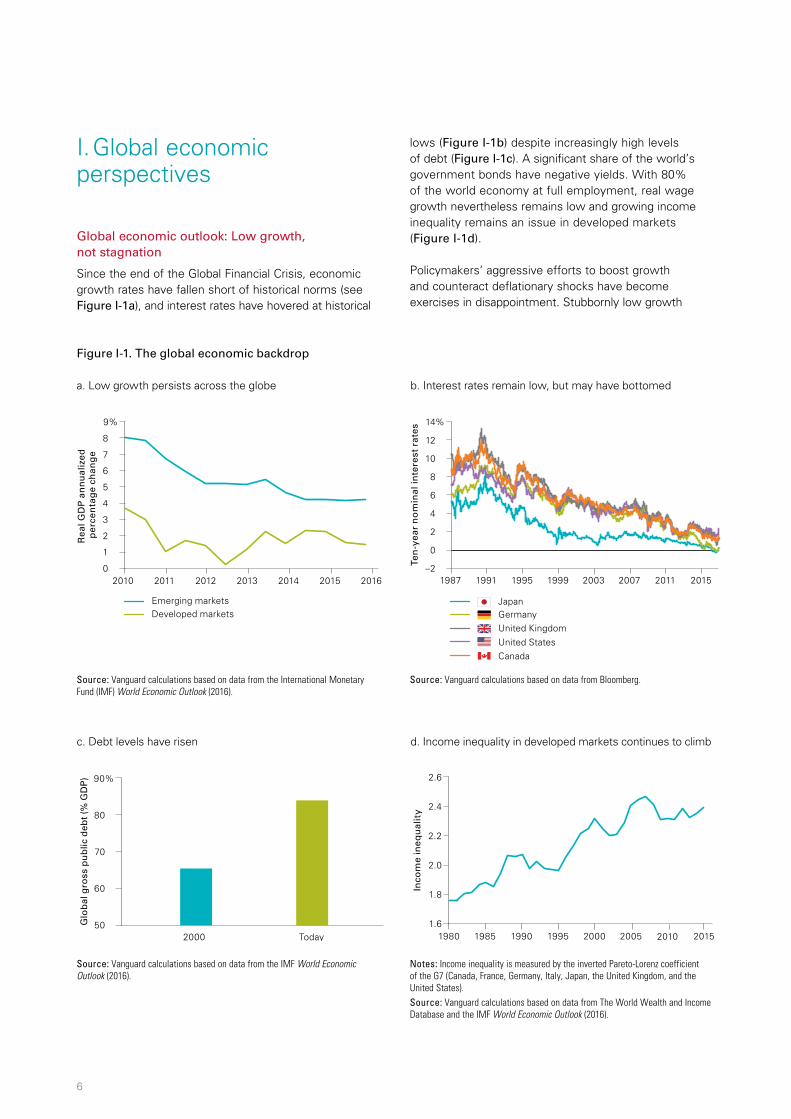
Since the end of the Global Financial Crisis, economic growth rates have fallen short of historical norms (see Figure I-1a), and interest rates have hovered at historical
lows (Figure I-1b) despite increasingly high levels of debt (Figure I-1c). A significant share of the world’s government bonds have negative yields. With 80% of the world economy at full employment, real wage growth nevertheless remains low and growing income inequality remains an issue in developed markets (Figure I-1d).
Policymakers’ aggressive efforts to boost growth and counteract deflationary shocks have become exercises in disappointment. Stubbornly low growth
6
Figure I-1. The global economic backdrop
a. Low growth persists across the globe b. Interest rates remain low, but may have bottomed
Ten
-yea
r n
om
inal
inte
rest
rat
es
–2
4
8
14%
12
6
2
1987 1995 1999 2007 2011 2015 1991 2003
United KingdomUnited StatesCanada
Japan
0
Germany
10
Notes: Income inequality is measured by the inverted Pareto-Lorenz coefficient of the G7 (Canada, France, Germany, Italy, Japan, the United Kingdom, and the United States).Source: Vanguard calculations based on data from The World Wealth and Income Database and the IMF World Economic Outlook (2016).
c. Debt levels have risen d. Income inequality in developed markets continues to climb
Source: Vanguard calculations based on data from the International Monetary Fund (IMF) World Economic Outlook (2016).
Source: Vanguard calculations based on data from Bloomberg.
Rea
l GD
P a
nn
ual
ized
p
erce
nta
ge
chan
ge
0
4
5
7
9%
2010 2011 2012 2013 2014 2015 2016
8
6
3
2
1
Emerging marketsDeveloped markets
Glo
bal
gro
ss p
ub
lic d
ebt (
% G
DP
)
50
70
90%
80
60
2000 Today
Inco
me
ineq
ual
ity
1.6
1.8
2.2
2.6
2.4
2.0
1980 1990 1995 2000 2005 20151985 2010
Source: Vanguard calculations based on data from the IMF World Economic Outlook (2016).

1 Infrastructure spending is an exception, as public investment in infrastructure would be recommended under either view. Under a secular stagnation view, infrastructure spending could provide a short-term demand-side boost no different from any other expansionary fiscal policy. Under our structural view, infrastructure spending could increase the long-term productive capacity of the economy and raise potential labour productivity growth, as well as potential GDP.
has raised concerns that the global economy is settling into a Japanese-style secular stagnation. These concerns reflect a misunderstanding of the structural forces that have shaped growth, inflation, and interest rates and will continue to do so in the years ahead.
As in the 2015 and 2016 editions of Vanguard’s Economic and Investment Outlook, we maintain that low growth reflects slowing productivity and unfavourable demographics. Interest rates, meanwhile, have also been depressed by expanding globalization and by waves of technological disruption and the challenges of a burgeoning digital economy (see Figure I-2).
Not only do these structural forces provide a coherent explanation of pre-crisis growth trends and world interest rates, but they also can reconcile currently low growth rates with full employment in most developed markets. And, although a secular stagnation view hinges on global demand weakness and thus calls for more monetary or fiscal policy stimulus, a structural view provides an intuitive explanation for the increasing ineffectiveness of such policies.1
In the near term, those structural drivers will continue to restrain global growth. Although the deleveraging cycles in the developed economies—including the United States, Japan, and Europe—have progressed, many emerging markets have barely started the deleveraging process. Meanwhile, the influence of unfavourable demographics and weaker productivity growth is unlikely to be reversed soon.
Central banks across the globe have reached a critical stage. They’re bumping up against the limits of monetary policy, which is generating diminishing benefits and increasing risks (see Vanguard Global Macro Matters—Monetary Policy Is (Barely) Carrying the World, 2016). As policymakers recognize that strategies such as negative interest rates are an insufficient response to forces that are neither cyclical nor a reflection of weak demand, they will curtail additional stimulus, and in the United States nudge short-term interest rates higher.
7
Figure I-2. Long-term structural forces intersect to shape growth, policy, and interest rates
Source: Vanguard.
Currentenvironment
Economy Markets
Policy
TechnologyFalling relative cost of technology depressing business capital investments
DemographicsPopulation aging, baby boomers, and declining dependency ratios
GlobalizationBooming emerging markets and Chinese exports; buildup of foreign-exchange reserves (emerging markets savings glut)
Structural drivers
Impact since 1980
EconomyImpact over
next five years
▼ Growth tu
▼ Inflation ▼
▲ Inequality ▲
Markets
▼ Interest rates tu
▲ Asset returns ▼
Policy metrics
▲ Government debt ▲
▲ Global trade tu
▼ Monetary policy rates ▲

2 The 0.6%–1.4% range corresponds to the interdecile range around the historical median estimate of 1%, based on Dimson Marsh Staunton data for real cash rate for the 115-year period 1900–2015.
The process will unfold at different times in different regions. In the United States, the right course for the Federal Reserve is to continue its “dovish tightening” by raising short-term rates deliberately to 1.5% in 2017 and reducing its long-term rate projections toward 2.5%, a level more consistent with an unlevered-growth world.
In Japan, where unemployment is already low, the extensive use of aggressive cyclical policies has done little to spur growth or inflation. It may be time to put these policies away and focus on structural issues such as a bifurcated labour market (see Vanguard Global Macro Matters—Japan: The Long Road Back to Inflation, 2015). In Europe, by contrast, high unemployment and low capacity utilization suggest there may still be opportunities for aggressive stimulus to awaken the economy from its cyclical slumber.
However, our outlook for long-term interest rates depends more on the direction of these structural forces than on the next move in central bank policy rates (see Figure I-3). When we evaluate the forces’ longer-term paths, we see that although they will most likely keep interest rates considerably lower than in the past three decades, these drivers are unlikely to drive rates lower.
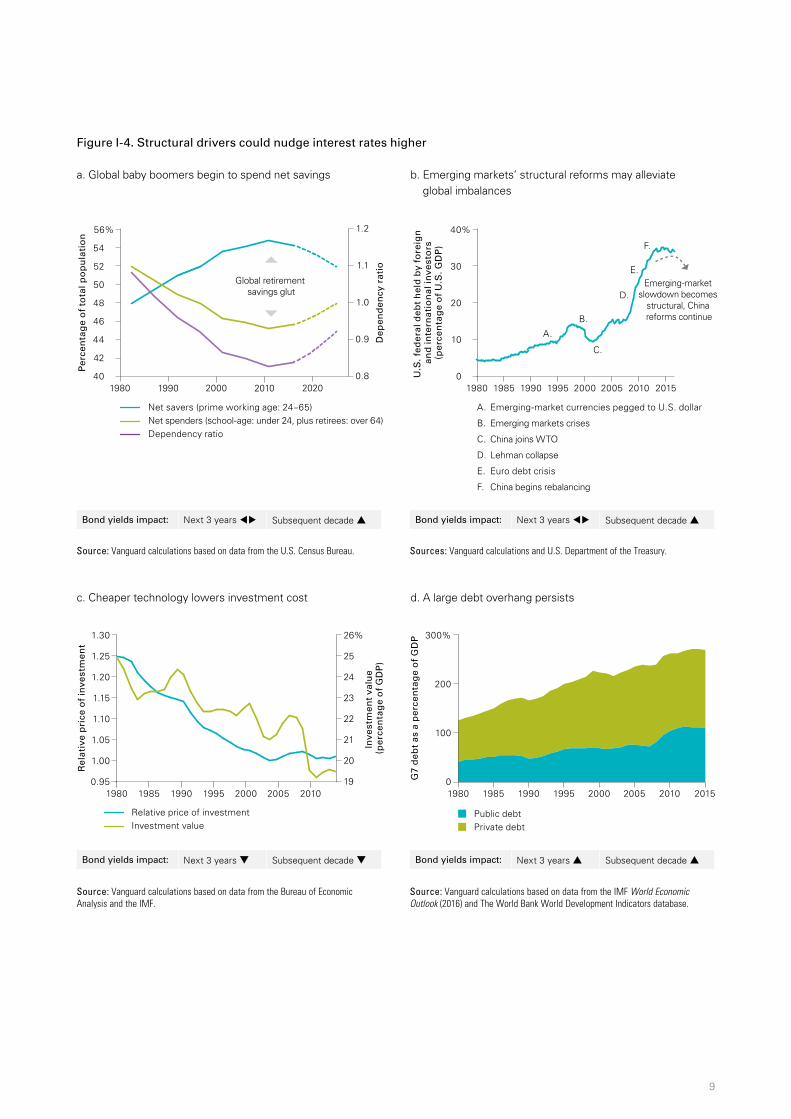
We believe that potential global growth could pick up modestly over time. Our expectation is based on the potential for a rebound in productivity growth as new digital technologies are better utilized and a slight recovery in the labour force as the baby boom generation finishes transitioning to retirement. Meanwhile, the combination of an aging population entering the spend-down phase of its investment life cycle (see Figure I-4a), the secular slowdown in emerging markets and China resulting in lower trade surpluses and less accumulation of U.S. Treasury reserves (Figure I-4b), and a continued increase in global debt levels (Figure I-4d) could put some upward pressure on rates. At the same time, the ever-falling cost of technology could serve to anchor both inflation and yields in the long term (Figure I-4c).
The central tendency of our projections does not include a significant departure from past norms, but world real interest rates somewhere near the 115-year historical range of 0.6%–1.4% are entirely possible in years to come.2 Despite potentially heightened volatility during the transition from today’s extreme levels of policy rates toward modestly higher rates, we remain cautiously optimistic about the long term. An equilibrium interest rate that is positive in inflation-adjusted terms means that investors should be reasonably compensated for saving and investing, justifying our modest, yet positive, long-term real return outlook for cash and bonds.
8
Figure I-3. Drivers of U.S. interest rates since the 1980s
Decline in inflation has been the key
Treasurychanges
explained
Residual unexplained
Decompositionof change
(Percentage points)
Change in in�ation –5.42
Term premium –1.28
Slower potential growth due to technology and demographics
–1.58
–0.15
Increased global demand for “safe” reserve assets
–0.78
Notes: The decomposition of changes in real equilibrium interest rates is based on the sequential application of three models, which are presented in the sources. Source: Vanguard calculations based on data from Holston, Laubach, and Williams (2016) and the U.S. Congressional Budget Office Budget and Economic Outlook (2016).
9
Figure I-4. Structural drivers could nudge interest rates higher
a. Global baby boomers begin to spend net savings b. Emerging markets’ structural reforms may alleviate global imbalances
c. Cheaper technology lowers investment cost d. A large debt overhang persists
Source: Vanguard calculations based on data from the Bureau of Economic Analysis and the IMF.
Source: Vanguard calculations based on data from the IMF World Economic Outlook (2016) and The World Bank World Development Indicators database.
Per
cen
tag
e o
f to
tal p
op
ula
tio
n
40
48
52
56%
54
50
46
44
42
Net savers (prime working age: 24–65)Net spenders (school-age: under 24, plus retirees: over 64)Dependency ratio
Dep
end
ency
rat
io0.8
1.0
1.2
1.1
0.9
1980 1990 2000 2010 2020
Global retirement savings glut
Emerging-market slowdown becomes
structural, China reforms continue
U.S
. fed
eral
deb
t h
eld
by
fore
ign
an
d in
tern
atio
nal
inve
sto
rs(p
erce
nta
ge
of
U.S
. GD
P)
0
20
10
30
40%
1980 1985 1990 1995 2000 2005 2010 2015
A.
B.
C.
D.
E.
F.
A. Emerging-market currencies pegged to U.S. dollar
B. Emerging markets crises
C. China joins WTO
D. Lehman collapse
E. Euro debt crisis
F. China begins rebalancing
G7
deb
t as
a p
erce
nta
ge
of
GD
P
Relative price of investmentInvestment value
0.95
1.15
1.10
1.05
1.00
1.20
1.25
1.30
Rel
ativ
e p
rice
of
inve
stm
ent
Inve
stm
ent
valu
e (p
erce
nta
ge
of
GD
P)
19
20
21
22
23
24
25
26%
1980 1985 1990 1995 2000 2005 20100
100
200
300%
Public debtPrivate debt
1980 1985 1990 1995 2000 2005 2010 2015
Source: Vanguard calculations based on data from the U.S. Census Bureau. Sources: Vanguard calculations and U.S. Department of the Treasury.
Bond yields impact: Next 3 years tu Subsequent decade ▲ Bond yields impact: Next 3 years tu Subsequent decade ▲
Bond yields impact: Next 3 years ▼ Subsequent decade ▼ Bond yields impact: Next 3 years ▲ Subsequent decade ▲
10
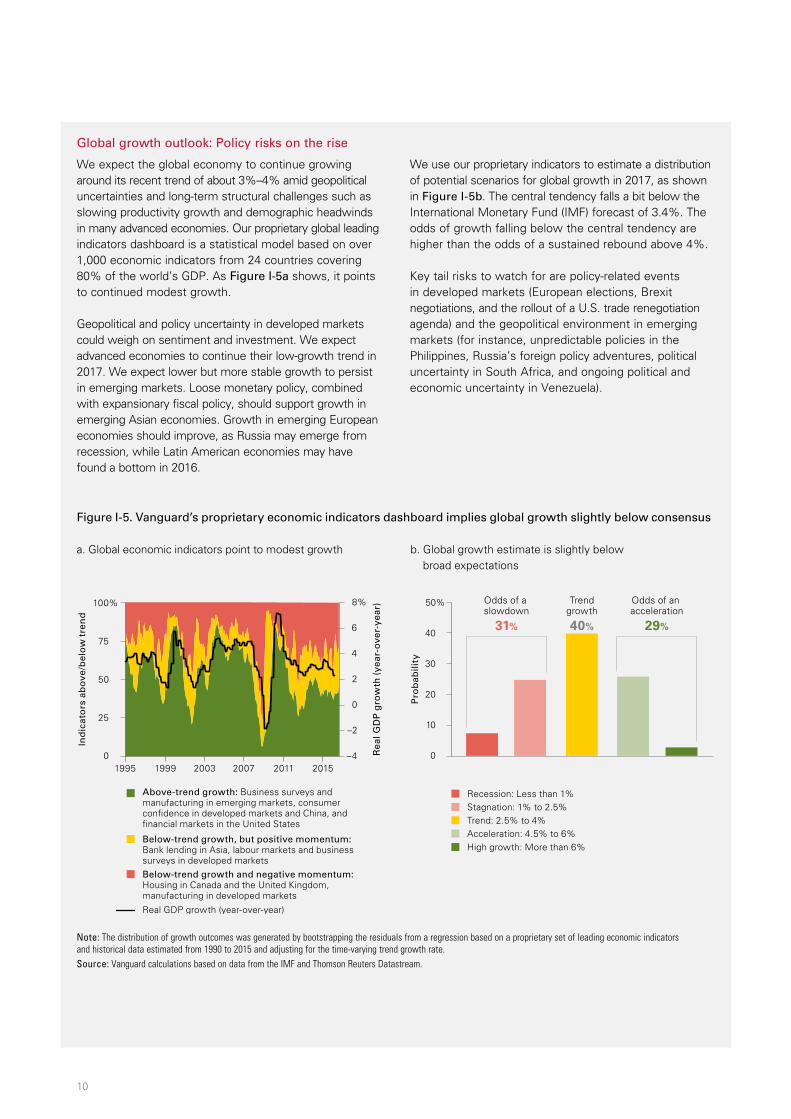
Global growth outlook: Policy risks on the rise
We expect the global economy to continue growing around its recent trend of about 3%–4% amid geopolitical uncertainties and long-term structural challenges such as slowing productivity growth and demographic headwinds in many advanced economies. Our proprietary global leading indicators dashboard is a statistical model based on over 1,000 economic indicators from 24 countries covering 80% of the world’s GDP. As Figure I-5a shows, it points to continued modest growth.
Geopolitical and policy uncertainty in developed markets could weigh on sentiment and investment. We expect advanced economies to continue their low-growth trend in 2017. We expect lower but more stable growth to persist in emerging markets. Loose monetary policy, combined with expansionary fiscal policy, should support growth in emerging Asian economies. Growth in emerging European economies should improve, as Russia may emerge from recession, while Latin American economies may have found a bottom in 2016.
We use our proprietary indicators to estimate a distribution of potential scenarios for global growth in 2017, as shown in Figure I-5b. The central tendency falls a bit below the International Monetary Fund (IMF) forecast of 3.4%. The odds of growth falling below the central tendency are higher than the odds of a sustained rebound above 4%.
Key tail risks to watch for are policy-related events in developed markets (European elections, Brexit negotiations, and the rollout of a U.S. trade renegotiation agenda) and the geopolitical environment in emerging markets (for instance, unpredictable policies in the Philippines, Russia’s foreign policy adventures, political uncertainty in South Africa, and ongoing political and economic uncertainty in Venezuela).
Figure I-5. Vanguard’s proprietary economic indicators dashboard implies global growth slightly below consensus
a. Global economic indicators point to modest growth b. Global growth estimate is slightly below broad expectations
1995 1999 2003 2007 2011 2015
Ind
icat
ors
ab
ove
/bel
ow
tre
nd
Rea
l GD
P g
row
th (
year
-ove
r-ye
ar)
0
25
50
75
100%
–4
6
4
2
0
–2
8%
Above-trend growth: Business surveys and manufacturing in emerging markets, consumer con�dence in developed markets and China, and �nancial markets in the United States Below-trend growth, but positive momentum: Bank lending in Asia, labour markets and business surveys in developed marketsBelow-trend growth and negative momentum: Housing in Canada and the United Kingdom, manufacturing in developed markets
Real GDP growth (year-over-year)
Pro
bab
ility
0
10
20
30
40
50% Odds of a slowdown
31%
Odds of an acceleration
29%
Trendgrowth
40%
Recession: Less than 1%Stagnation: 1% to 2.5%Trend: 2.5% to 4%Acceleration: 4.5% to 6%High growth: More than 6%
Note: The distribution of growth outcomes was generated by bootstrapping the residuals from a regression based on a proprietary set of leading economic indicators and historical data estimated from 1990 to 2015 and adjusting for the time-varying trend growth rate. Source: Vanguard calculations based on data from the IMF and Thomson Reuters Datastream.
11
United States: Resiliency in the midst of global weakness
In spite of a rocky start to 2016, and even recession fears, the U.S. economy remains firmly on a long-term growth path of about 2% a year. We maintain our long-held view of resiliency for the U.S. economy.
We continue to believe it is important to disentangle the structurally lower trend growth of 2% (compared with 3.25% average growth since 1950) from the short-term cyclical concerns of a weak economic recovery and the need for more policy responses. As previously mentioned, cyclical policy responses, such as monetary policy, are not well-equipped to influence the economy’s structural forces in a meaningful way.
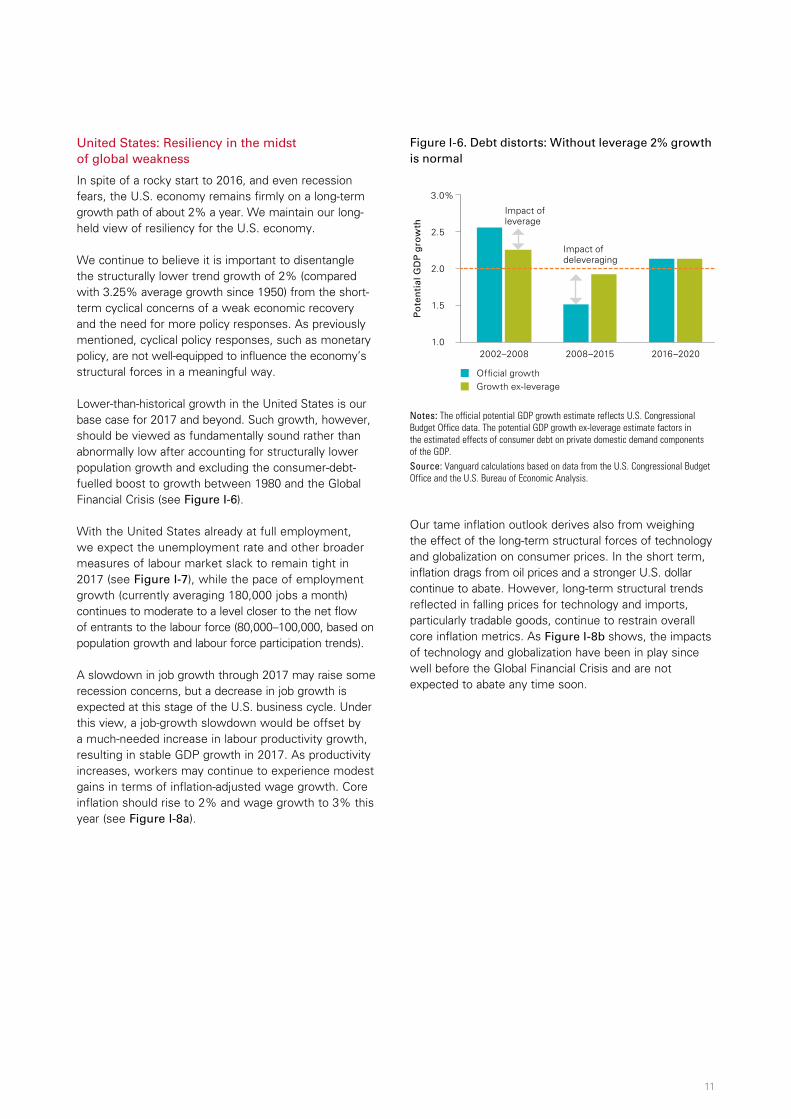
Lower-than-historical growth in the United States is our base case for 2017 and beyond. Such growth, however, should be viewed as fundamentally sound rather than abnormally low after accounting for structurally lower population growth and excluding the consumer-debt-fuelled boost to growth between 1980 and the Global Financial Crisis (see Figure I-6).
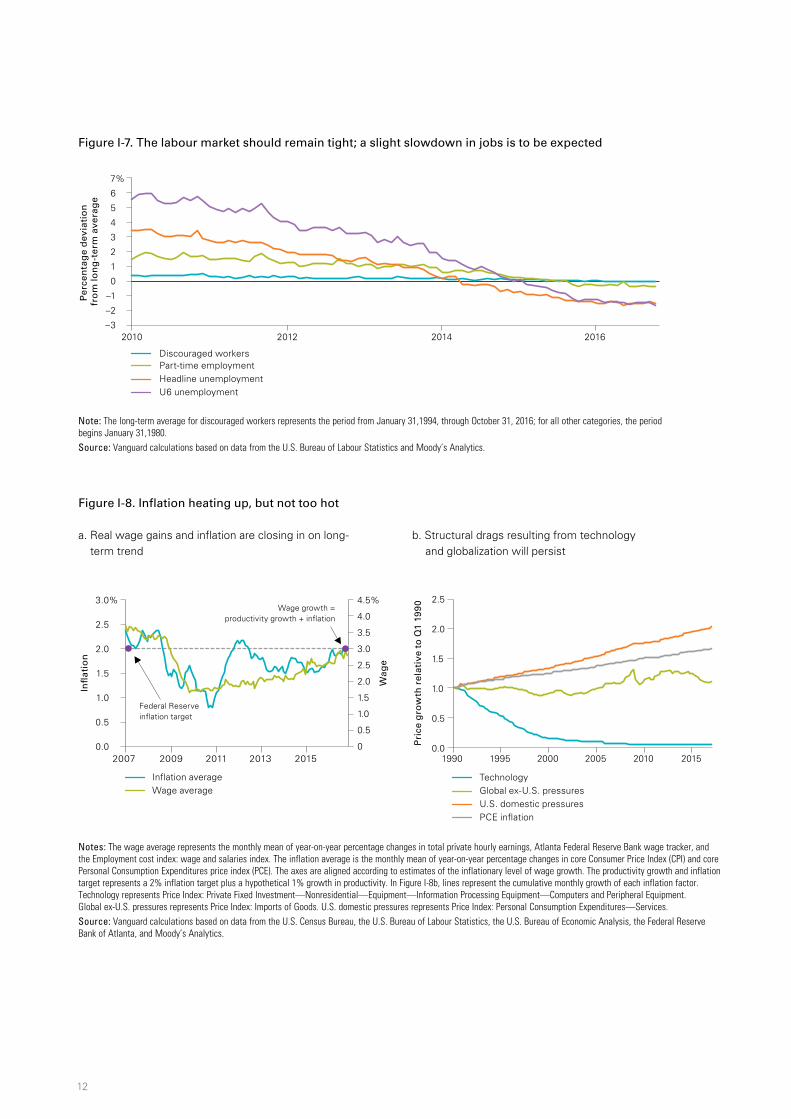
With the United States already at full employment, we expect the unemployment rate and other broader measures of labour market slack to remain tight in 2017 (see Figure I-7), while the pace of employment growth (currently averaging 180,000 jobs a month) continues to moderate to a level closer to the net flow of entrants to the labour force (80,000–100,000, based on population growth and labour force participation trends).
A slowdown in job growth through 2017 may raise some recession concerns, but a decrease in job growth is expected at this stage of the U.S. business cycle. Under this view, a job-growth slowdown would be offset by a much-needed increase in labour productivity growth, resulting in stable GDP growth in 2017. As productivity increases, workers may continue to experience modest gains in terms of inflation-adjusted wage growth. Core inflation should rise to 2% and wage growth to 3% this year (see Figure I-8a).
Our tame inflation outlook derives also from weighing the effect of the long-term structural forces of technology and globalization on consumer prices. In the short term, inflation drags from oil prices and a stronger U.S. dollar continue to abate. However, long-term structural trends reflected in falling prices for technology and imports, particularly tradable goods, continue to restrain overall core inflation metrics. As Figure I-8b shows, the impacts of technology and globalization have been in play since well before the Global Financial Crisis and are not expected to abate any time soon.
Figure I-6. Debt distorts: Without leverage 2% growth is normal
Notes: The official potential GDP growth estimate reflects U.S. Congressional Budget Office data. The potential GDP growth ex-leverage estimate factors in the estimated effects of consumer debt on private domestic demand components of the GDP.Source: Vanguard calculations based on data from the U.S. Congressional Budget Office and the U.S. Bureau of Economic Analysis.
Po
ten
tial
GD
P g
row
th
1.0
1.5
2.5
3.0%
2.0
Of�cial growthGrowth ex-leverage
2016–2020
Impact ofleverage
2002–2008
Impact ofdeleveraging
2008–2015
12
Figure I-7. The labour market should remain tight; a slight slowdown in jobs is to be expected
Note: The long-term average for discouraged workers represents the period from January 31,1994, through October 31, 2016; for all other categories, the period begins January 31,1980.Source: Vanguard calculations based on data from the U.S. Bureau of Labour Statistics and Moody’s Analytics.
Figure I-8. Inflation heating up, but not too hot
a. Real wage gains and inflation are closing in on long- b. Structural drags resulting from technology term trend and globalization will persist
Notes: The wage average represents the monthly mean of year-on-year percentage changes in total private hourly earnings, Atlanta Federal Reserve Bank wage tracker, and the Employment cost index: wage and salaries index. The inflation average is the monthly mean of year-on-year percentage changes in core Consumer Price Index (CPI) and core Personal Consumption Expenditures price index (PCE). The axes are aligned according to estimates of the inflationary level of wage growth. The productivity growth and inflation target represents a 2% inflation target plus a hypothetical 1% growth in productivity. In Figure I-8b, lines represent the cumulative monthly growth of each inflation factor. Technology represents Price Index: Private Fixed Investment—Nonresidential—Equipment—Information Processing Equipment—Computers and Peripheral Equipment. Global ex-U.S. pressures represents Price Index: Imports of Goods. U.S. domestic pressures represents Price Index: Personal Consumption Expenditures—Services. Source: Vanguard calculations based on data from the U.S. Census Bureau, the U.S. Bureau of Labour Statistics, the U.S. Bureau of Economic Analysis, the Federal Reserve Bank of Atlanta, and Moody’s Analytics.
In�
atio
n
0.0
0.5
1.5
2.5
3.0%
0
1.0
1.5
2.0
2.5
3.0
3.5
4.0
4.5%
Wag
e
2.0
1.0
0.5
In�ation averageWage average
Federal Reserve in�ation target
Wage growth =productivity growth + in�ation
0.0
0.5
1.0
1.5
2.0
2.5
Pri
ce g
row
th r
elat
ive
to Q
1 19
90
1990 1995 2000 2005 2010 2015
TechnologyGlobal ex-U.S. pressuresU.S. domestic pressuresPCE in�ation
2007 2011 2013 2015 2009
Per
cen
tag
e d
evia
tio
n
fro
m lo
ng
-ter
m a
vera
ge
–3
3
5
7%
6
4
2
1
2010 2012 2014 2016
0
–1
–2
U6 unemployment
Part-time employmentDiscouraged workers
Headline unemployment
3 “Dots” refers to charts published by the Federal Open Market Committee (FOMC) in the Fed’s Summary of Economic Projections, showing points where FOMC participants, who are kept anonymous, believe the federal funds rate should be over the next few years, in the absence of economic shocks.
13
These forces, along with the Federal Reserve’s hard-won credibility for anchoring inflation expectations, have resulted in the U.S. economy spending most of the time below the 2% inflation target since the 1990s (64% of the core personal consumption expenditure monthly inflation readouts since January 1990). This fact should not be overlooked when evaluating adequate timing for the Fed’s rate normalization.
The appropriate course for the Fed is to further its pursuit of a “dovish tightening” by raising short-term rates deliberately to 1.5% in 2017, while also lowering its long-term “dots” closer to 2.5%.3 This approach should short-circuit the negative feedback loop of the prospects for an even-stronger U.S. dollar undercutting growth and rattling global financial markets.
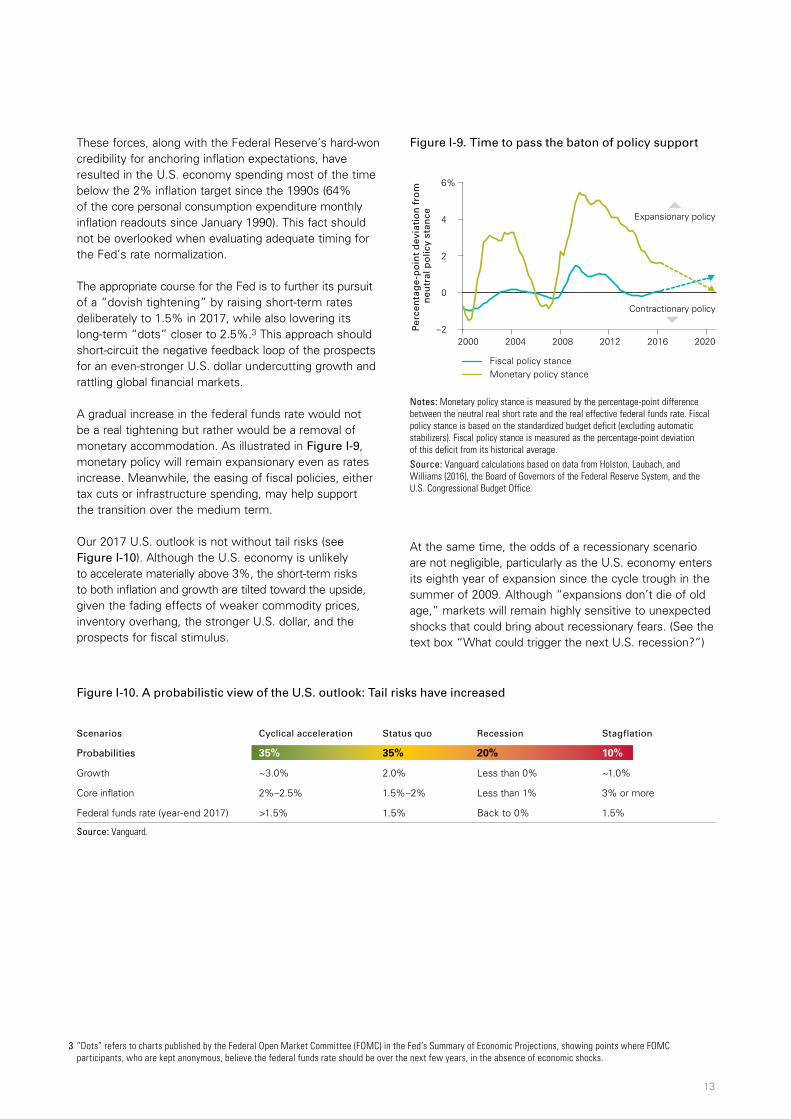
A gradual increase in the federal funds rate would not be a real tightening but rather would be a removal of monetary accommodation. As illustrated in Figure I-9, monetary policy will remain expansionary even as rates increase. Meanwhile, the easing of fiscal policies, either tax cuts or infrastructure spending, may help support the transition over the medium term.
Our 2017 U.S. outlook is not without tail risks (see Figure I-10). Although the U.S. economy is unlikely to accelerate materially above 3%, the short-term risks to both inflation and growth are tilted toward the upside, given the fading effects of weaker commodity prices, inventory overhang, the stronger U.S. dollar, and the prospects for fiscal stimulus.
At the same time, the odds of a recessionary scenario are not negligible, particularly as the U.S. economy enters its eighth year of expansion since the cycle trough in the summer of 2009. Although “expansions don’t die of old age,” markets will remain highly sensitive to unexpected shocks that could bring about recessionary fears. (See the text box “What could trigger the next U.S. recession?”)
Figure I-9. Time to pass the baton of policy support
Notes: Monetary policy stance is measured by the percentage-point difference between the neutral real short rate and the real effective federal funds rate. Fiscal policy stance is based on the standardized budget deficit (excluding automatic stabilizers). Fiscal policy stance is measured as the percentage-point deviation of this deficit from its historical average. Source: Vanguard calculations based on data from Holston, Laubach, and Williams (2016), the Board of Governors of the Federal Reserve System, and the U.S. Congressional Budget Office.
Per
cen
tag
e-p
oin
t d
evia
tio
n f
rom
n
eutr
al p
olic
y st
ance
–2
0
4
6%
2
Contractionary policy
Expansionary policy
Fiscal policy stanceMonetary policy stance
2000 2004 2008 2012 2016 2020
Figure I-10. A probabilistic view of the U.S. outlook: Tail risks have increased
Scenarios Cyclical acceleration Status quo Recession Stagflation
Probabilities 35% 35% 20% 10%
Growth ~3.0% 2.0% Less than 0% ~1.0%
Core inflation 2%–2.5% 1.5%–2% Less than 1% 3% or more
Federal funds rate (year-end 2017) >1.5% 1.5% Back to 0% 1.5%
Source: Vanguard.

14
What could trigger the next U.S. recession?
The U.S. economy has been expanding for seven years, more than doubling the average length of an expansion (38 months).
However, as the saying goes, “expansions don’t die of old age,” meaning that recessions are more than just statistical regularities of a predetermined business cycle. In reality, recessions are brought about by shocks that amplify the dislocations and excesses that build up over time during the expansion. In some instances, it takes just a relatively small shock to prick the bubble and kick-start the unwinding of such misallocations in one sector of the economy; this in turn typically spills over into broader demand weakness and pessimistic business sentiment, affecting hiring and investment decisions across the economy.
But what could be some economic triggers? Here are four possibilities, in no particular order:
The collapse of global trade
Causes could be a sharp move toward trade protectionism in the United States and a trade war; gridlock and the breakdown of Brexit negotiations within the European Union; and uncertainty surrounding anti-E.U. movements in euro-area countries, particularly the French and German elections.
Aggressive monetary policy
A sharp acceleration of rate hikes through 2017 could be triggered by an unforeseen flare-up in inflationary pressures and a rise in long-term rates due to expansionary fiscal policy (extensive infrastructure spending and tax cuts). This in turn could cause dislocation in asset markets and affect investor sentiment and confidence.
A U.S. stagflation scenario
Depending on the extent and timing of U.S. immigration and anti-trade policies, a supply-side negative shock with higher labour costs and higher imported input costs could lead to cost-push inflation. Adding cost-push inflation to the potential demand-pull inflation from expansionary fiscal policies and rising budget deficits could result in rising inflation and long-term interest rates.
China hard landing and systemic financial crisis
Capital outflows intensify in spite of capital controls, leading to a collapse in the yuan and affecting key sectors of the Chinese economy, such as real estate, local government finances, and the stock market. Global spillovers affect emerging markets via trade linkages and developed markets via financial volatility and increased risk aversion.

4 Source: The Global Competitiveness Report 2016–2017. September 2016. Geneva, Switzerland: World Economic Forum.
15
Canada: Globalization hits home … eventually
Canada ranked 15th out of 138 countries in the World Economic Forum’s 2016–2017 Global Competitiveness Index. This reflects Canada’s high ranking in health care, education, infrastructure, technological readiness, and financial market development, including some of the soundest banks in the world for the ninth consecutive year.4
While acknowledging relative strength domestically, questions about the future path of globalization loom large for Canada’s growth prospects, particularly in the longer term. What does a European Union look like without the United Kingdom? What could U.S. renegotiation of trade agreements mean for Canadian exporters? On the positive side, factors that had depressed growth in early 2016 (low commodity prices, wildfires in Alberta) will have less impact on 2017. A stabilization of global growth in 2017, particularly in the United States would be a net benefit to Canada. Concerns over domestic issues, including housing and consumer debt, cannot be overlooked but are unlikely to induce a crisis.
Along with the wildfires in Alberta, oil-price declines and an associated pullback in related investment again weighed on growth early in 2016. The effects of oil-price declines tend to be regional with most of the decrease in business investment coming in Alberta. Recent oil-price stability and proposed OPEC and non-OPEC supply cuts could offset this heading into 2017.
Concerns over home-price appreciation continue to dominate discussions of domestic risks to Canada’s economy. This issue also remains regional in nature, with prices in Toronto and Vancouver in particular outpacing gains in other cities and provinces. Recent policy action in Vancouver aimed at cooling speculation has tempered sales and price growth. The impact of a slowdown in housing services would be felt in output numbers, but more so on a regional level. For example, in Toronto, where most housing is owner-occupied, the ripple effects of any downturn would not be as severe.
On the national policy front, promises of increased infrastructure spending by the Trudeau government are beginning to take shape, with a larger-than-expected CAD 186 billion planned over the next 11 years. Longer-term benefits will depend on how well the planned spending is allocated and whether any necessary future fiscal contraction is offset by increased efficiencies. While Canada nationally, and in some cases provincially, has room for fiscal expansion in the near term, the difficult decisions made during previous periods of fiscal contraction should not be forgotten.
16
Although the ultimate benefits of an expansionary fiscal plan remain unclear, such support does take some of the weight off the Bank of Canada (BoC) to stimulate demand. With policy rates so low, further monetary easing could entail the use of unconventional tools, including negative interest rates, asset purchases, and forward guidance. On the other hand, further progress in a U.S. “dovish tightening,” particularly if unexpected, could serve to depress the loonie, adding to inflationary pressures via imports and supporting BoC rate increases later in the year. The BoC has acknowledged the difficulties of implementing policy support in a nation with a two-speed economy (those regions more dependent upon oil versus those more economically diversified). As is becoming increasingly common in other developed markets, both fiscal and monetary policy in Canada now stand ready to support growth and inflation, if deemed necessary. This is widely regarded as a positive development.
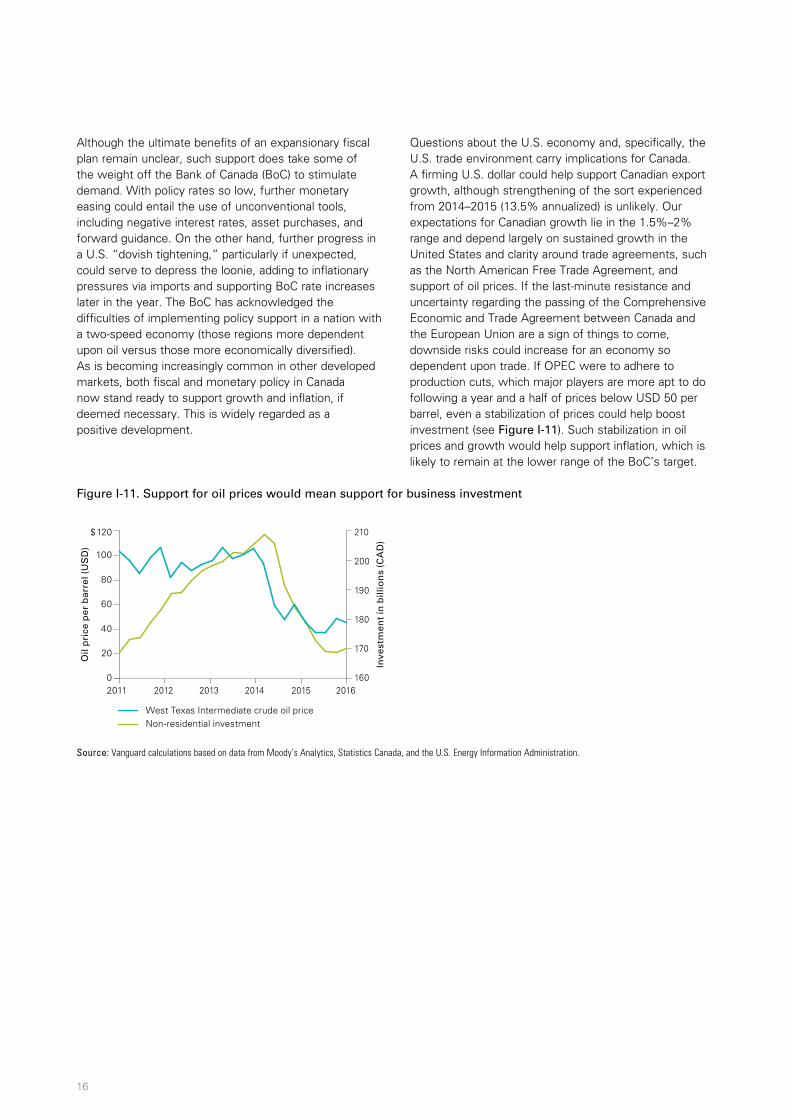
Questions about the U.S. economy and, specifically, the U.S. trade environment carry implications for Canada. A firming U.S. dollar could help support Canadian export growth, although strengthening of the sort experienced from 2014–2015 (13.5% annualized) is unlikely. Our expectations for Canadian growth lie in the 1.5%–2% range and depend largely on sustained growth in the United States and clarity around trade agreements, such as the North American Free Trade Agreement, and support of oil prices. If the last-minute resistance and uncertainty regarding the passing of the Comprehensive Economic and Trade Agreement between Canada and the European Union are a sign of things to come, downside risks could increase for an economy so dependent upon trade. If OPEC were to adhere to production cuts, which major players are more apt to do following a year and a half of prices below USD 50 per barrel, even a stabilization of prices could help boost investment (see Figure I-11). Such stabilization in oil prices and growth would help support inflation, which is likely to remain at the lower range of the BoC’s target.
Figure I-11. Support for oil prices would mean support for business investment
Source: Vanguard calculations based on data from Moody’s Analytics, Statistics Canada, and the U.S. Energy Information Administration.
Oil
pri
ce p
er b
arre
l (U
SD
)
Inve
stm
ent
in b
illio
ns
(CA
D)
$
2011 2012 2013 2014 2015 2016
West Texas Intermediate crude oil priceNon-residential investment
0
20
40
60
80
100
120
160
170
180
190
200
210
17
China: Balancing the risks of its rebalancing
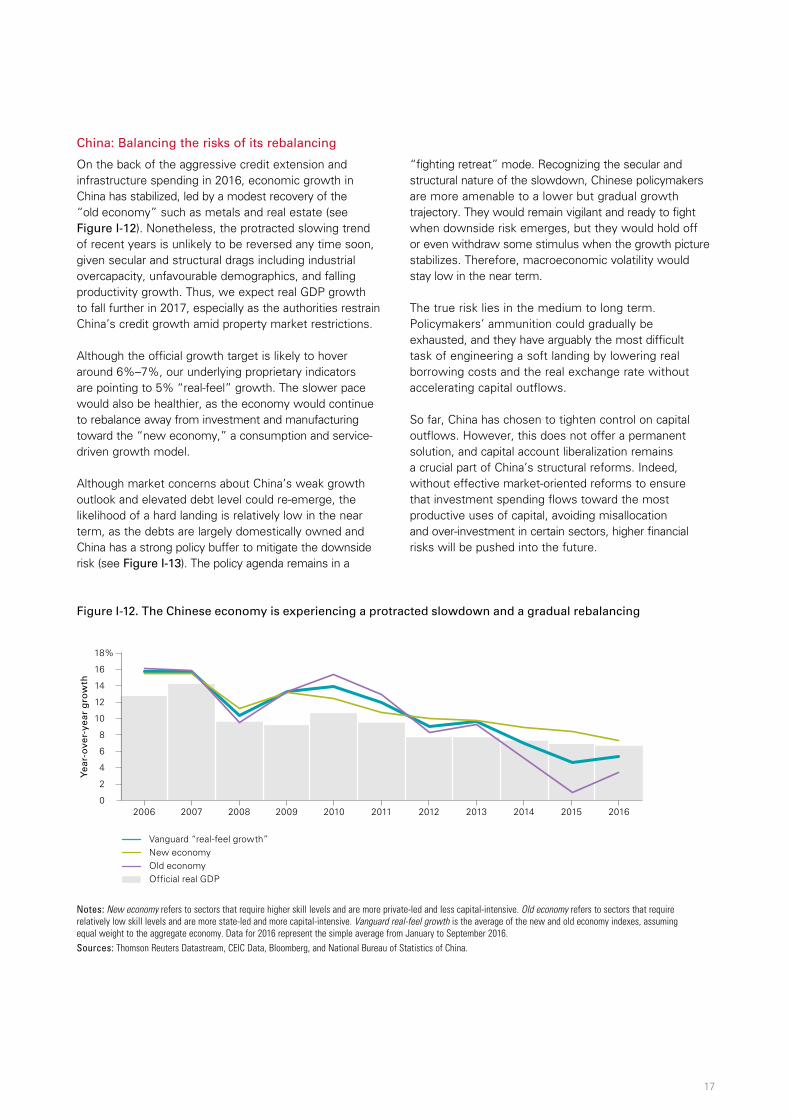
On the back of the aggressive credit extension and infrastructure spending in 2016, economic growth in China has stabilized, led by a modest recovery of the “old economy” such as metals and real estate (see Figure I-12). Nonetheless, the protracted slowing trend of recent years is unlikely to be reversed any time soon, given secular and structural drags including industrial overcapacity, unfavourable demographics, and falling productivity growth. Thus, we expect real GDP growth to fall further in 2017, especially as the authorities restrain China’s credit growth amid property market restrictions.
Although the official growth target is likely to hover around 6%–7%, our underlying proprietary indicators are pointing to 5% “real-feel” growth. The slower pace would also be healthier, as the economy would continue to rebalance away from investment and manufacturing toward the “new economy,” a consumption and service-driven growth model.
Although market concerns about China’s weak growth outlook and elevated debt level could re-emerge, the likelihood of a hard landing is relatively low in the near term, as the debts are largely domestically owned and China has a strong policy buffer to mitigate the downside risk (see Figure I-13). The policy agenda remains in a
“fighting retreat” mode. Recognizing the secular and structural nature of the slowdown, Chinese policymakers are more amenable to a lower but gradual growth trajectory. They would remain vigilant and ready to fight when downside risk emerges, but they would hold off or even withdraw some stimulus when the growth picture stabilizes. Therefore, macroeconomic volatility would stay low in the near term.
The true risk lies in the medium to long term. Policymakers’ ammunition could gradually be exhausted, and they have arguably the most difficult task of engineering a soft landing by lowering real borrowing costs and the real exchange rate without accelerating capital outflows.
So far, China has chosen to tighten control on capital outflows. However, this does not offer a permanent solution, and capital account liberalization remains a crucial part of China’s structural reforms. Indeed, without effective market-oriented reforms to ensure that investment spending flows toward the most productive uses of capital, avoiding misallocation and over-investment in certain sectors, higher financial risks will be pushed into the future.
Figure I-12. The Chinese economy is experiencing a protracted slowdown and a gradual rebalancing
Notes: New economy refers to sectors that require higher skill levels and are more private-led and less capital-intensive. Old economy refers to sectors that require relatively low skill levels and are more state-led and more capital-intensive. Vanguard real-feel growth is the average of the new and old economy indexes, assuming equal weight to the aggregate economy. Data for 2016 represent the simple average from January to September 2016.Sources: Thomson Reuters Datastream, CEIC Data, Bloomberg, and National Bureau of Statistics of China.
Yea
r-o
ver-
year
gro
wth
0
2
4
6
8
10
12
14
16
18%
2006 2007 2008 2009 2010 2011 2012 2013 2014 2015 2016
Vanguard “real-feel growth”New economyOld economyOf�cial real GDP
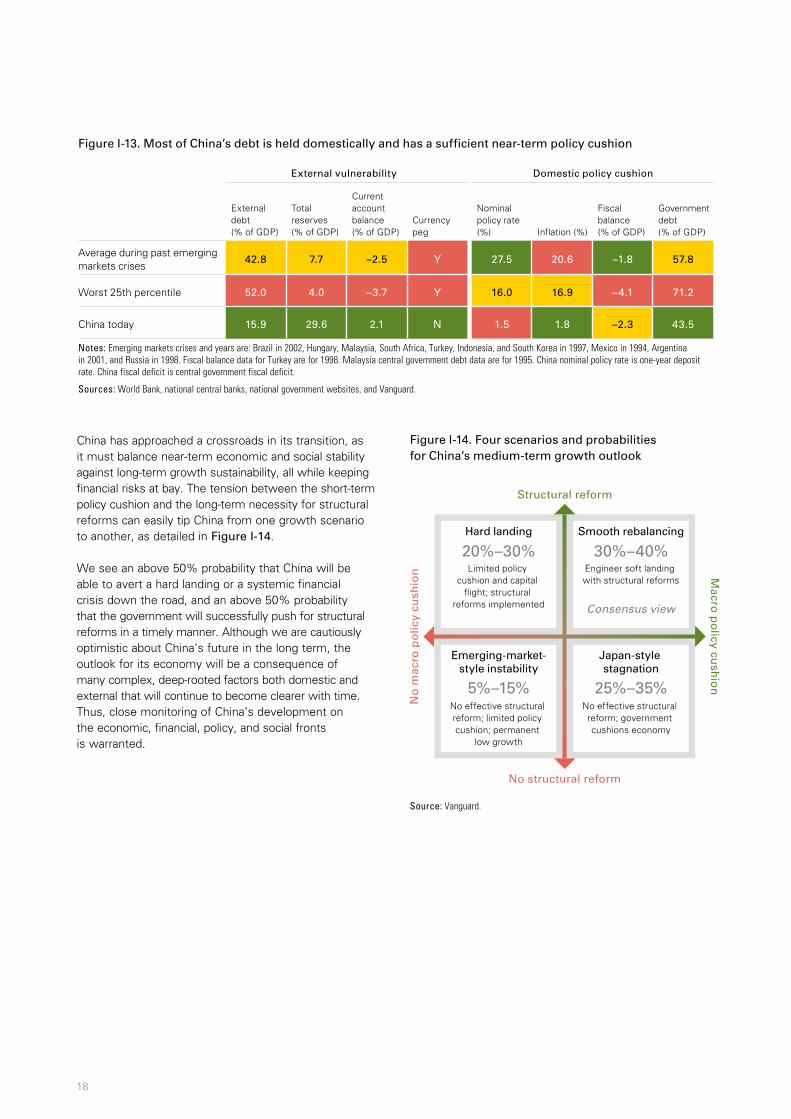
China has approached a crossroads in its transition, as it must balance near-term economic and social stability against long-term growth sustainability, all while keeping financial risks at bay. The tension between the short-term policy cushion and the long-term necessity for structural reforms can easily tip China from one growth scenario to another, as detailed in Figure I-14.
We see an above 50% probability that China will be able to avert a hard landing or a systemic financial crisis down the road, and an above 50% probability that the government will successfully push for structural reforms in a timely manner. Although we are cautiously optimistic about China’s future in the long term, the outlook for its economy will be a consequence of many complex, deep-rooted factors both domestic and external that will continue to become clearer with time. Thus, close monitoring of China’s development on the economic, financial, policy, and social fronts is warranted.
18
Figure I-13. Most of China’s debt is held domestically and has a sufficient near-term policy cushion
External vulnerability Domestic policy cushion
External debt (% of GDP)
Total reserves (% of GDP)
Current account balance (% of GDP)
Currency peg
Nominal policy rate (%) Inflation (%)
Fiscal balance (% of GDP)
Government debt (% of GDP)
Average during past emerging markets crises
42.8 7.7 –2.5 Y 27.5 20.6 –1.8 57.8
Worst 25th percentile 52.0 4.0 –3.7 Y 16.0 16.9 –4.1 71.2
China today 15.9 29.6 2.1 N 1.5 1.8 –2.3 43.5
Notes: Emerging markets crises and years are: Brazil in 2002, Hungary, Malaysia, South Africa, Turkey, Indonesia, and South Korea in 1997, Mexico in 1994, Argentina in 2001, and Russia in 1998. Fiscal balance data for Turkey are for 1998. Malaysia central government debt data are for 1995. China nominal policy rate is one-year deposit rate. China fiscal deficit is central government fiscal deficit.
Sources: World Bank, national central banks, national government websites, and Vanguard.
Figure I-14. Four scenarios and probabilities for China’s medium-term growth outlook
Source: Vanguard.
Hard landing
Limited policy cushion and capital
�ight; structural reforms implemented
20%–30%Smooth rebalancing
Engineer soft landing with structural reforms
Consensus view
30%–40%
Japan-style stagnation
No effective structural reform; government cushions economy
25%–35%
Emerging-market-style instability
No effective structural reform; limited policy cushion; permanent
low growth
5%–15%
Structural reform
No structural reform
Macro
po
licy cush
ion
No
mac
ro p
olic
y cu
shio
n

19
Although any large-scale stimulus plan appears unlikely in 2017, Chinese authorities are likely to provide some monetary and fiscal support, in a bid to cushion against the downside risks and avert a hard landing. The government could continue to focus on the fiscal side, especially on infrastructure investment through various funding channels, including public-private partnership and policy bank lending, to offset part of the weakness in business spending.
Despite modest depreciation of the renminbi against the U.S. dollar, the authorities could be more prudent on the monetary front. In particular, the room for further interest rate and required reserve ratio cuts is limited, given higher commodity prices, a housing market rally, expected U.S. Fed rate hikes, and persistent capital outflow pressure. Meanwhile, China’s 19th National Party Congress will be held in the second half of 2017; it concludes the current round of leadership turnover at both the central and local government levels. Hopefully, this could enable the government to lean toward addressing long-term issues rather than focusing on maintaining short-term stability.
Japan: Fighting against looming policy limits
Nearly four years into its bid to reflate the Japanese economy, Abenomics has reached a critical stage as the overreliance on monetary policy has generated diminishing benefits and increasing risks. Despite further asset purchases and the introduction of a negative interest rate policy (NIRP) this year, the yen strengthened against the U.S. dollar early in the year, economic growth remains sluggish, and deflation risk is on the rise again.
For 2017, we expect the economy to grow at 0.7%, modestly above its long-term 0.4% trend, and inflation could recover gradually toward 1%. Any rebound is unlikely to be significant, given the persistently strong structural headwinds, which include a declining and aging population, excessive labour market duality, weak productivity growth, and high debt levels.
As the authorities remain committed to reviving economic growth and inflation, we expect further monetary easing and fiscal stimulus next year. However, those stimulus measures are likely to remain modest, given limited room for policy manoeuvring, and their cost effectiveness will be questionable.
As the Bank of Japan is quickly approaching the limit of its monetary easing, it could take a more gradual and flexible approach in 2017, trying to strike a balance between accelerating inflation and ensuring financial stability. We expect modest expansion of purchases of risky assets such as ETFs and J-REITs, but further interest rate cuts appear less likely.
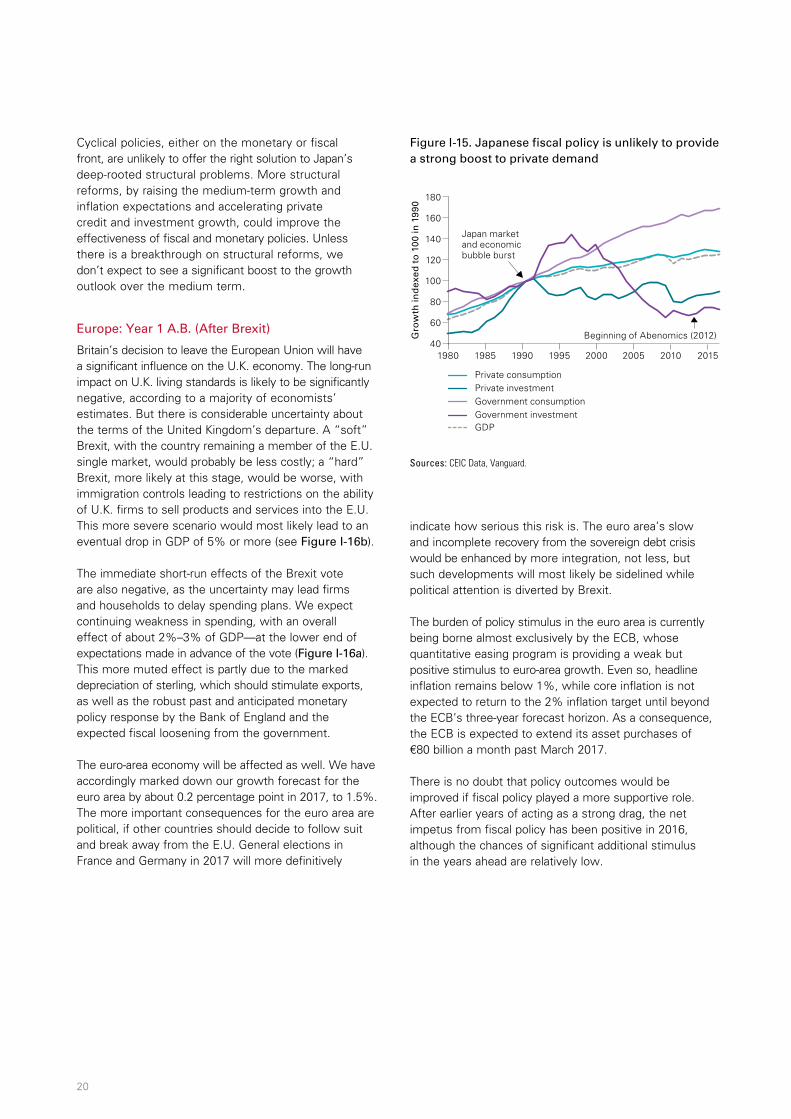
Meanwhile, the fiscal stimulus package announced in August 2016 is likely to have only a moderate impact on real economic growth in 2017. In fact, a closer look at Japan’s fiscal stimulus programs since the early 1990s reveals that they have been increasingly reliant on public consumption rather than investment, with little impact on private investment growth (see Figure I-15). Given over-investment and a relatively large capital stock, the marginal product of capital and fiscal multipliers for public investment have declined.
While the more radical policy of providing “helicopter money” is still on the table and could more effectively change the inflation expectation, the probability of this happening in our view is small in the near term as it would entail unpredictable economic risks, legal and political pressure, and significant damage to central bank independence and long-term fiscal discipline.
Cyclical policies, either on the monetary or fiscal front, are unlikely to offer the right solution to Japan’s deep-rooted structural problems. More structural reforms, by raising the medium-term growth and inflation expectations and accelerating private credit and investment growth, could improve the effectiveness of fiscal and monetary policies. Unless there is a breakthrough on structural reforms, we don’t expect to see a significant boost to the growth outlook over the medium term.
Europe: Year 1 A.B. (After Brexit)
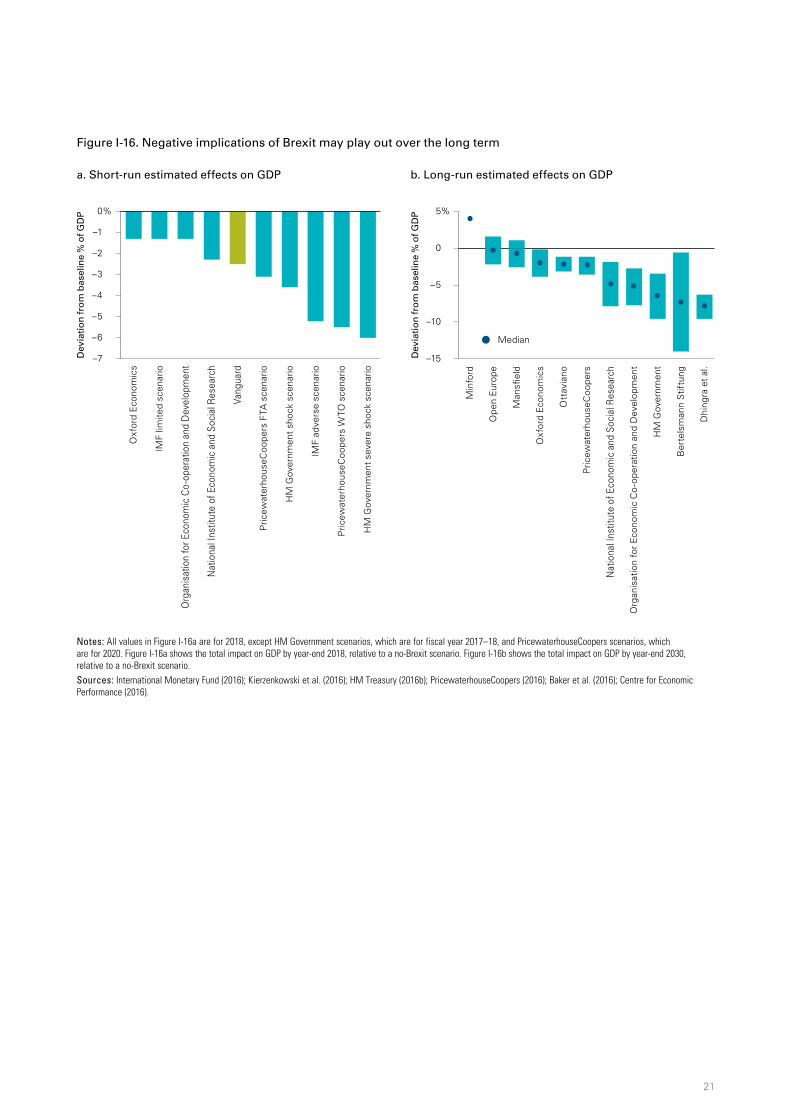
Britain’s decision to leave the European Union will have a significant influence on the U.K. economy. The long-run impact on U.K. living standards is likely to be significantly negative, according to a majority of economists’ estimates. But there is considerable uncertainty about the terms of the United Kingdom’s departure. A “soft” Brexit, with the country remaining a member of the E.U. single market, would probably be less costly; a “hard” Brexit, more likely at this stage, would be worse, with immigration controls leading to restrictions on the ability of U.K. firms to sell products and services into the E.U. This more severe scenario would most likely lead to an eventual drop in GDP of 5% or more (see Figure I-16b).
The immediate short-run effects of the Brexit vote are also negative, as the uncertainty may lead firms and households to delay spending plans. We expect continuing weakness in spending, with an overall effect of about 2%–3% of GDP—at the lower end of expectations made in advance of the vote (Figure I-16a). This more muted effect is partly due to the marked depreciation of sterling, which should stimulate exports, as well as the robust past and anticipated monetary policy response by the Bank of England and the expected fiscal loosening from the government.
The euro-area economy will be affected as well. We have accordingly marked down our growth forecast for the euro area by about 0.2 percentage point in 2017, to 1.5%. The more important consequences for the euro area are political, if other countries should decide to follow suit and break away from the E.U. General elections in France and Germany in 2017 will more definitively
indicate how serious this risk is. The euro area’s slow and incomplete recovery from the sovereign debt crisis would be enhanced by more integration, not less, but such developments will most likely be sidelined while political attention is diverted by Brexit.
The burden of policy stimulus in the euro area is currently being borne almost exclusively by the ECB, whose quantitative easing program is providing a weak but positive stimulus to euro-area growth. Even so, headline inflation remains below 1%, while core inflation is not expected to return to the 2% inflation target until beyond the ECB’s three-year forecast horizon. As a consequence, the ECB is expected to extend its asset purchases of €80 billion a month past March 2017.
There is no doubt that policy outcomes would be improved if fiscal policy played a more supportive role. After earlier years of acting as a strong drag, the net impetus from fiscal policy has been positive in 2016, although the chances of significant additional stimulus in the years ahead are relatively low.
20
Figure I-15. Japanese fiscal policy is unlikely to provide a strong boost to private demand
Sources: CEIC Data, Vanguard.
Gro
wth
ind
exed
to
100
in 1
990
40
80
100
160
180
1980 1985 1990 1995 2000 2005 2010 2015
140
120
60
Private consumptionPrivate investmentGovernment consumptionGovernment investmentGDP
Japan market and economic bubble burst
Beginning of Abenomics (2012)
21
Figure I-16. Negative implications of Brexit may play out over the long term
a. Short-run estimated effects on GDP b. Long-run estimated effects on GDP
Notes: All values in Figure I-16a are for 2018, except HM Government scenarios, which are for fiscal year 2017–18, and PricewaterhouseCoopers scenarios, which are for 2020. Figure I-16a shows the total impact on GDP by year-end 2018, relative to a no-Brexit scenario. Figure I-16b shows the total impact on GDP by year-end 2030, relative to a no-Brexit scenario.Sources: International Monetary Fund (2016); Kierzenkowski et al. (2016); HM Treasury (2016b); PricewaterhouseCoopers (2016); Baker et al. (2016); Centre for Economic Performance (2016).
Dev
iatio
n fr
om
bas
elin
e %
of G
DP
–7
–6
–4
–5
–1
–2
–3
0%
Dev
iatio
n fr
om
bas
elin
e %
of G
DP
–15
–10
–5
0
5%
Org
anis
atio
n fo
r Eco
nom
ic C
o-op
erat
ion
and
Dev
elop
men
t
Nat
iona
l Ins
titut
e of
Eco
nom
ic a
nd S
ocia
l Res
earc
h
Pric
ewat
erho
useC
oope
rs F
TA s
cena
rio
HM
Gov
ernm
ent
shoc
k sc
enar
io
IMF
adve
rse
scen
ario
Pric
ewat
erho
useC
oope
rs W
TO s
cena
rio
HM
Gov
ernm
ent
seve
re s
hock
sce
nario
IMF
limite
d sc
enar
io
Oxf
ord
Eco
nom
ics
Man
s�el
d
Oxf
ord
Eco
nom
ics
Ott
avia
no
Pric
ewat
erho
useC
oope
rs
Nat
iona
l Ins
titut
e of
Eco
nom
ic a
nd S
ocia
l Res
earc
h
Org
anis
atio
n fo
r E
cono
mic
Co
-ope
ratio
n an
d D
evel
opm
ent
HM
Gov
ernm
ent
Ber
tels
man
n S
tiftu
ng
Dhi
ngra
et
al.
Ope
n E
urop
e
Min
ford
Vang
uard
Median
II. Global capital markets outlook
Vanguard’s outlook for global stocks and bonds remains the most guarded since 2006, given the low-interest-rate and low-earnings-yield environment. We continue to view the global low-rate environment as secular, not cyclical. Although low rates are the anchor for the asset class forecasts, our outlook also includes simulations of portfolio performance in alternative interest rate regimes. We encourage investors to evaluate the role of all asset classes from a perspective of balance and diversification rather than outright return.
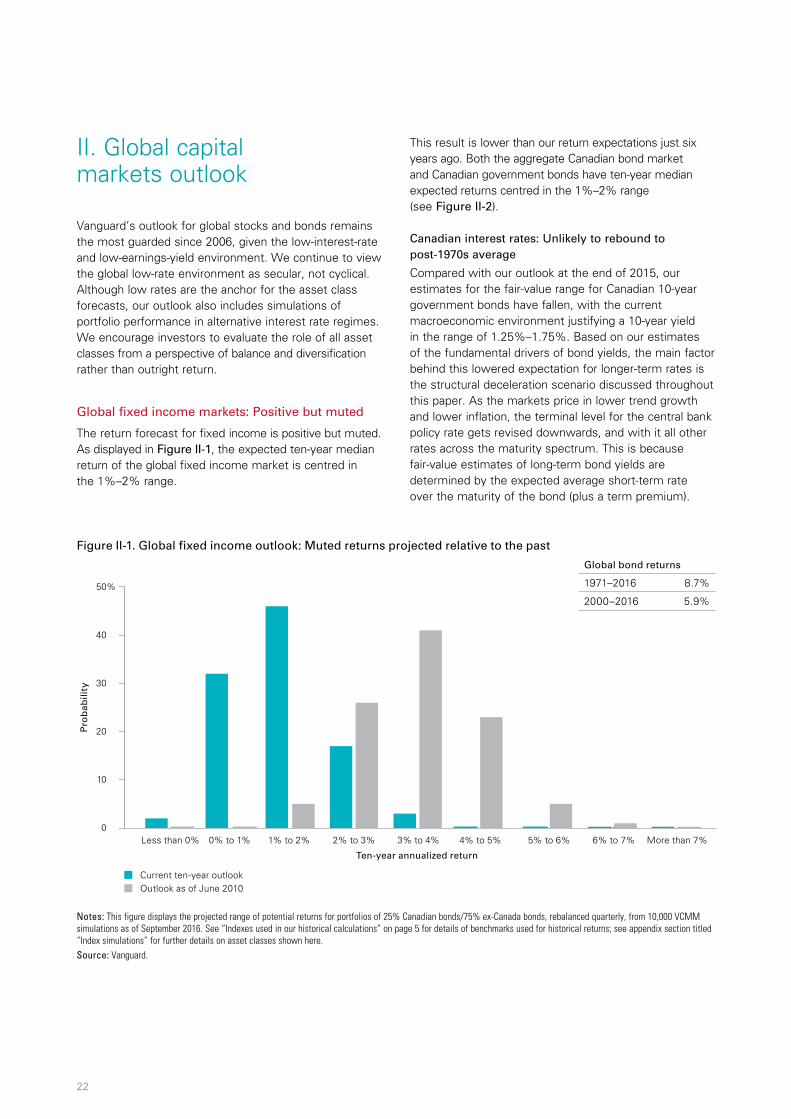
Global fixed income markets: Positive but muted
The return forecast for fixed income is positive but muted. As displayed in Figure II-1, the expected ten-year median return of the global fixed income market is centred in the 1%–2% range.
This result is lower than our return expectations just six years ago. Both the aggregate Canadian bond market and Canadian government bonds have ten-year median expected returns centred in the 1%–2% range (see Figure II-2).
Canadian interest rates: Unlikely to rebound to post-1970s average
Compared with our outlook at the end of 2015, our estimates for the fair-value range for Canadian 10-year government bonds have fallen, with the current macroeconomic environment justifying a 10-year yield in the range of 1.25%–1.75%. Based on our estimates of the fundamental drivers of bond yields, the main factor behind this lowered expectation for longer-term rates is the structural deceleration scenario discussed throughout this paper. As the markets price in lower trend growth and lower inflation, the terminal level for the central bank policy rate gets revised downwards, and with it all other rates across the maturity spectrum. This is because fair-value estimates of long-term bond yields are determined by the expected average short-term rate over the maturity of the bond (plus a term premium).
22
Figure II-1. Global fixed income outlook: Muted returns projected relative to the past
Notes: This figure displays the projected range of potential returns for portfolios of 25% Canadian bonds/75% ex-Canada bonds, rebalanced quarterly, from 10,000 VCMM simulations as of September 2016. See “Indexes used in our historical calculations” on page 5 for details of benchmarks used for historical returns; see appendix section titled “Index simulations” for further details on asset classes shown here. Source: Vanguard.
Pro
bab
ility
Current ten-year outlookOutlook as of June 2010
0
10
20
Less than 0% 0% to 1% 1% to 2% 2% to 3% 3% to 4% 4% to 5% 5% to 6% 6% to 7% More than 7%
Ten-year annualized return
30
40
50%
Global bond returns
1971–2016 8.7%
2000–2016 5.9%
23
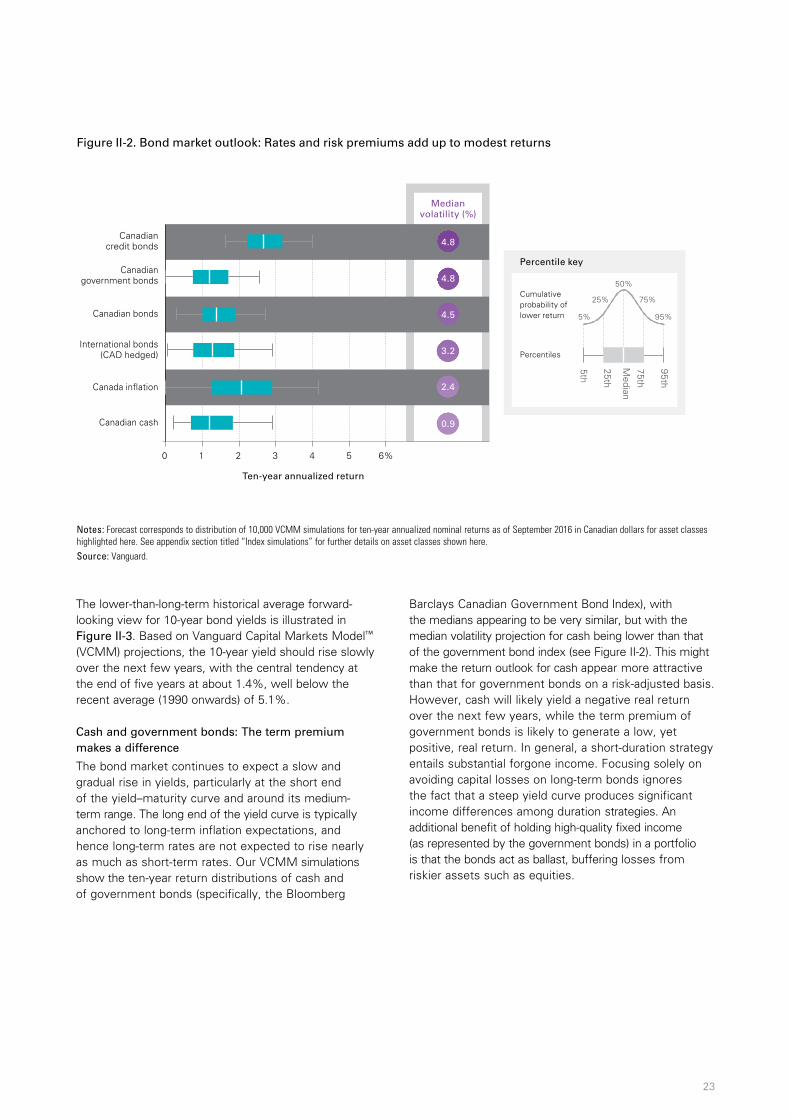
Figure II-2. Bond market outlook: Rates and risk premiums add up to modest returns
Notes: Forecast corresponds to distribution of 10,000 VCMM simulations for ten-year annualized nominal returns as of September 2016 in Canadian dollars for asset classes highlighted here. See appendix section titled “Index simulations” for further details on asset classes shown here.Source: Vanguard.
0 2 3 4 5 6%1
Canadiancredit bonds
Ten-year annualized return
International bonds(CAD hedged)
Canada in�ation
Canadian cash
Medianvolatility (%)
Canadiangovernment bonds
Canadian bonds
Percentile key
Cumulativeprobability of lower return
Percentiles
95%
75%
50%
25%
5%
5th
95th
75th
25th
Median
4.8
4.8
3.2
2.4
0.9
4.5
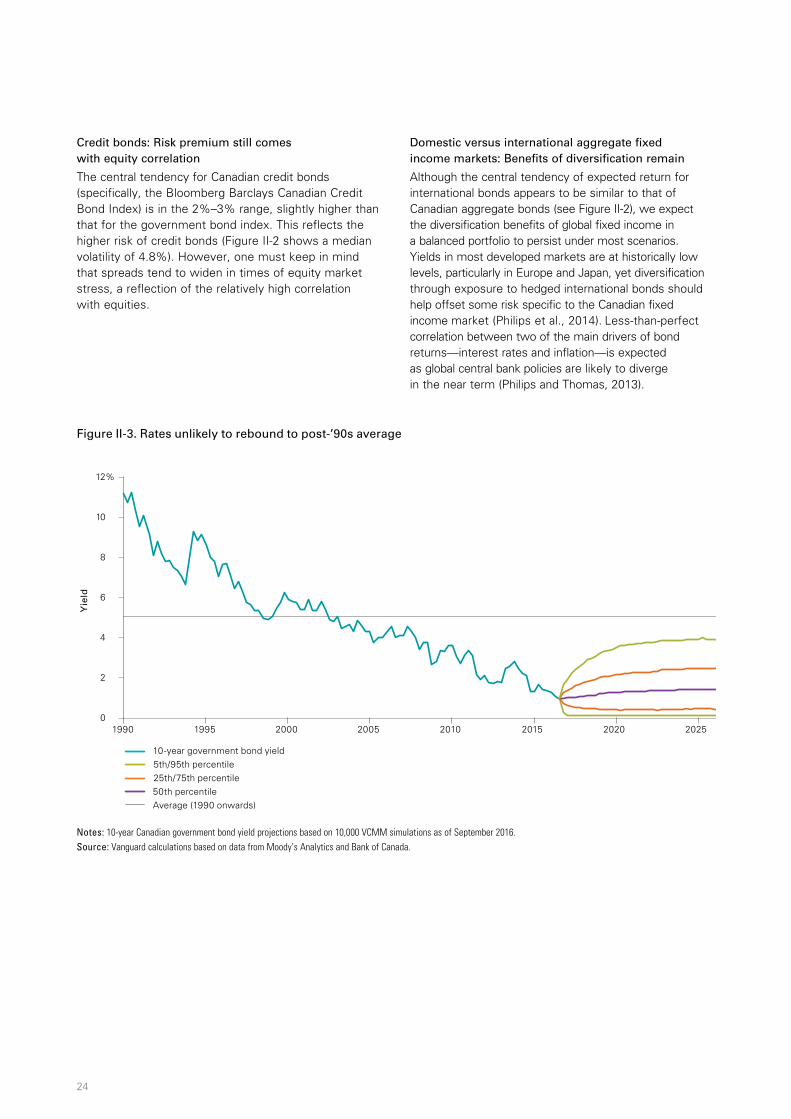
The lower-than-long-term historical average forward-looking view for 10-year bond yields is illustrated in Figure II-3. Based on Vanguard Capital Markets Model™ (VCMM) projections, the 10-year yield should rise slowly over the next few years, with the central tendency at the end of five years at about 1.4%, well below the recent average (1990 onwards) of 5.1%.
Cash and government bonds: The term premium makes a difference
The bond market continues to expect a slow and gradual rise in yields, particularly at the short end of the yield–maturity curve and around its medium- term range. The long end of the yield curve is typically anchored to long-term inflation expectations, and hence long-term rates are not expected to rise nearly as much as short-term rates. Our VCMM simulations show the ten-year return distributions of cash and of government bonds (specifically, the Bloomberg
Barclays Canadian Government Bond Index), with the medians appearing to be very similar, but with the median volatility projection for cash being lower than that of the government bond index (see Figure II-2). This might make the return outlook for cash appear more attractive than that for government bonds on a risk-adjusted basis. However, cash will likely yield a negative real return over the next few years, while the term premium of government bonds is likely to generate a low, yet positive, real return. In general, a short-duration strategy entails substantial forgone income. Focusing solely on avoiding capital losses on long-term bonds ignores the fact that a steep yield curve produces significant income differences among duration strategies. An additional benefit of holding high-quality fixed income (as represented by the government bonds) in a portfolio is that the bonds act as ballast, buffering losses from riskier assets such as equities.
24
Figure II-3. Rates unlikely to rebound to post-’90s average
Notes: 10-year Canadian government bond yield projections based on 10,000 VCMM simulations as of September 2016.Source: Vanguard calculations based on data from Moody’s Analytics and Bank of Canada.
0
2
4
1990 1995 2000 2005 2010 2015 2020 2025
10
8
6
12%
5th/95th percentile10-year government bond yield
50th percentile25th/75th percentile
Average (1990 onwards)
Yie
ld
Credit bonds: Risk premium still comes with equity correlation
The central tendency for Canadian credit bonds (specifically, the Bloomberg Barclays Canadian Credit Bond Index) is in the 2%–3% range, slightly higher than that for the government bond index. This reflects the higher risk of credit bonds (Figure II-2 shows a median volatility of 4.8%). However, one must keep in mind that spreads tend to widen in times of equity market stress, a reflection of the relatively high correlation with equities.
Domestic versus international aggregate fixed income markets: Benefits of diversification remain
Although the central tendency of expected return for international bonds appears to be similar to that of Canadian aggregate bonds (see Figure II-2), we expect the diversification benefits of global fixed income in a balanced portfolio to persist under most scenarios. Yields in most developed markets are at historically low levels, particularly in Europe and Japan, yet diversification through exposure to hedged international bonds should help offset some risk specific to the Canadian fixed income market (Philips et al., 2014). Less-than-perfect correlation between two of the main drivers of bond returns—interest rates and inflation—is expected as global central bank policies are likely to diverge in the near term (Philips and Thomas, 2013).
Global equity markets: Still guarded, but not bearish
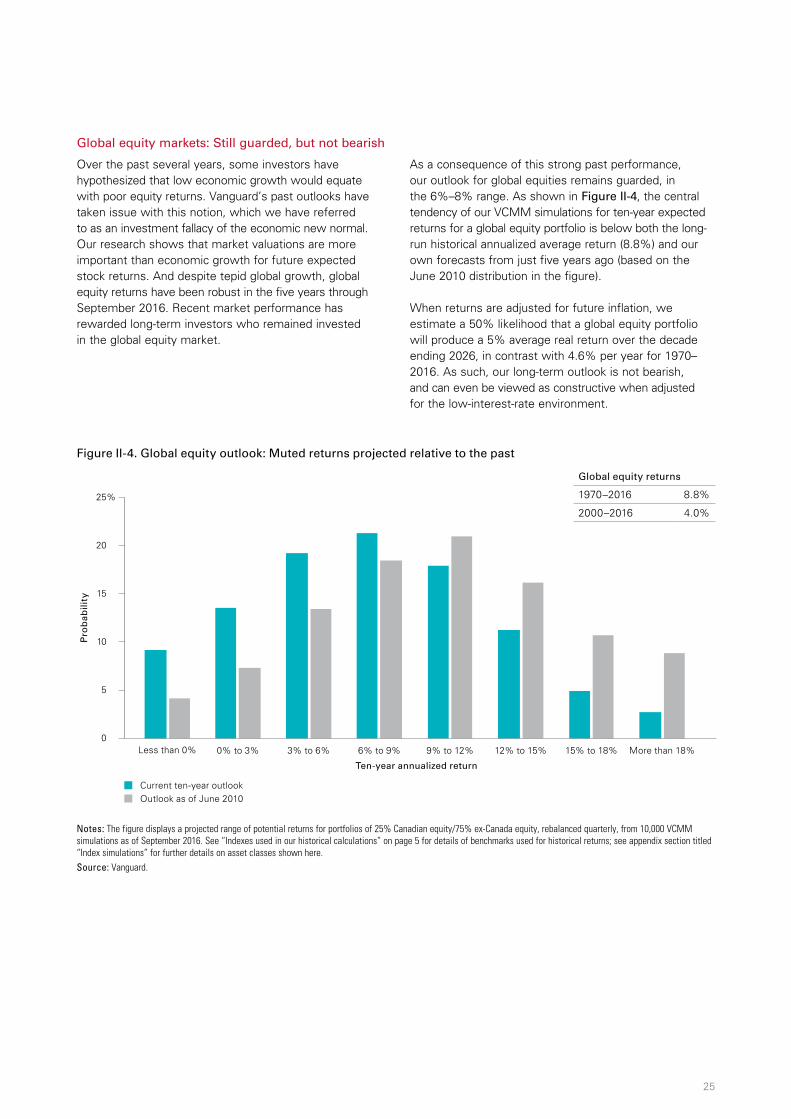
Over the past several years, some investors have hypothesized that low economic growth would equate with poor equity returns. Vanguard’s past outlooks have taken issue with this notion, which we have referred to as an investment fallacy of the economic new normal. Our research shows that market valuations are more important than economic growth for future expected stock returns. And despite tepid global growth, global equity returns have been robust in the five years through September 2016. Recent market performance has rewarded long-term investors who remained invested in the global equity market.
As a consequence of this strong past performance, our outlook for global equities remains guarded, in the 6%–8% range. As shown in Figure II-4, the central tendency of our VCMM simulations for ten-year expected returns for a global equity portfolio is below both the long-run historical annualized average return (8.8%) and our own forecasts from just five years ago (based on the June 2010 distribution in the figure).
When returns are adjusted for future inflation, we estimate a 50% likelihood that a global equity portfolio will produce a 5% average real return over the decade ending 2026, in contrast with 4.6% per year for 1970–2016. As such, our long-term outlook is not bearish, and can even be viewed as constructive when adjusted for the low-interest-rate environment.
25
Figure II-4. Global equity outlook: Muted returns projected relative to the past
Notes: The figure displays a projected range of potential returns for portfolios of 25% Canadian equity/75% ex-Canada equity, rebalanced quarterly, from 10,000 VCMM simulations as of September 2016. See “Indexes used in our historical calculations” on page 5 for details of benchmarks used for historical returns; see appendix section titled “Index simulations” for further details on asset classes shown here. Source: Vanguard.
Pro
bab
ility
Current ten-year outlookOutlook as of June 2010
0
5
10
15
Less than 0% 0% to 3% 3% to 6% 6% to 9% 9% to 12% 12% to 15% 15% to 18% More than 18%
Ten-year annualized return
20
25%
Global equity returns
1970–2016 8.8%
2000–2016 4.0%
Global equity valuations: Vanguard’s proprietary ‘fair-value’ CAPE looks beyond historical averages
Our conservative outlook for the global stock market is based primarily on market valuations, such as price/earnings (P/E) ratios. Some may wonder why our outlook is not more bearish. After all, widely followed global market valuation metrics such as the Shiller cyclically adjusted price/earnings ratio, or “CAPE,” are significantly higher than historical levels. When adjusted for lower expected growth, low interest rates, and low inflation, however, we would expect slightly higher equilibrium P/E ratios. This higher equilibrium level is the right benchmark for determining whether the market is overvalued or undervalued.
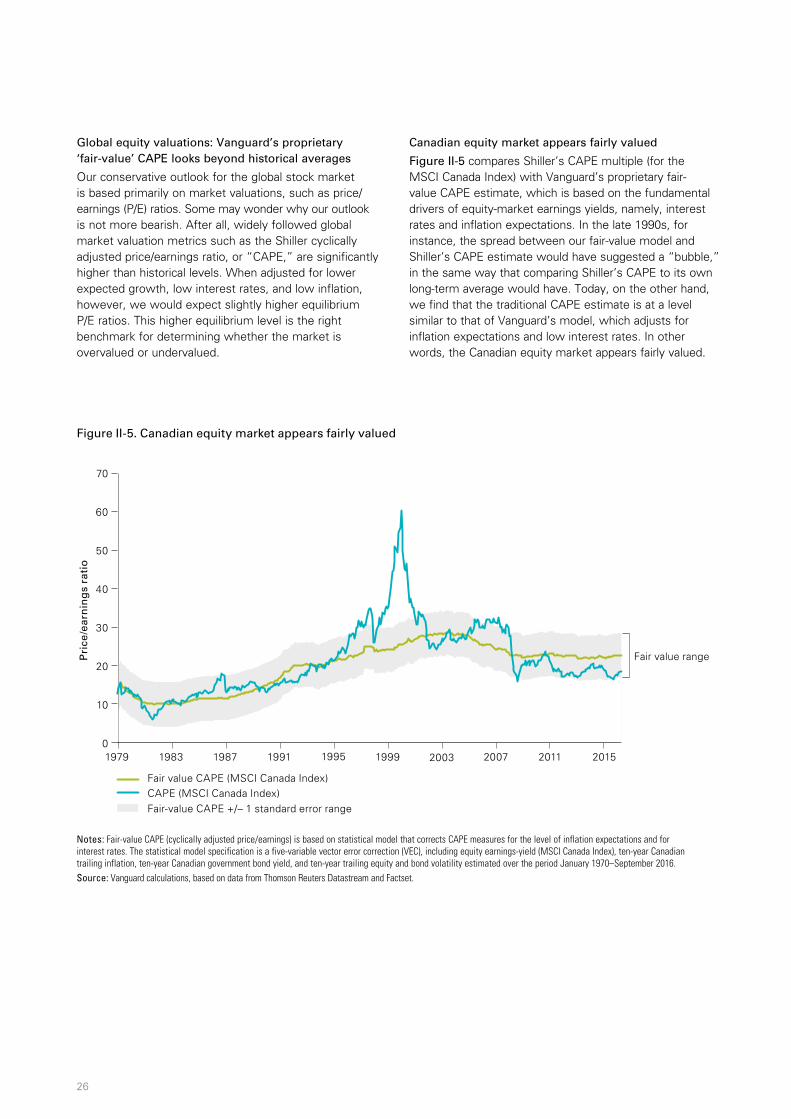
Canadian equity market appears fairly valued
Figure II-5 compares Shiller’s CAPE multiple (for the MSCI Canada Index) with Vanguard’s proprietary fair- value CAPE estimate, which is based on the fundamental drivers of equity-market earnings yields, namely, interest rates and inflation expectations. In the late 1990s, for instance, the spread between our fair-value model and Shiller’s CAPE estimate would have suggested a “bubble,” in the same way that comparing Shiller’s CAPE to its own long-term average would have. Today, on the other hand, we find that the traditional CAPE estimate is at a level similar to that of Vanguard’s model, which adjusts for inflation expectations and low interest rates. In other words, the Canadian equity market appears fairly valued.
26
Figure II-5. Canadian equity market appears fairly valued
Notes: Fair-value CAPE (cyclically adjusted price/earnings) is based on statistical model that corrects CAPE measures for the level of inflation expectations and for interest rates. The statistical model specification is a five-variable vector error correction (VEC), including equity earnings-yield (MSCI Canada Index), ten-year Canadian trailing inflation, ten-year Canadian government bond yield, and ten-year trailing equity and bond volatility estimated over the period January 1970–September 2016.Source: Vanguard calculations, based on data from Thomson Reuters Datastream and Factset.
Pri
ce/e
arn
ing
s ra
tio
0
20
30
40
70
50
60
10
Fair value CAPE (MSCI Canada Index) CAPE (MSCI Canada Index) Fair-value CAPE +/– 1 standard error range
Fair value range
1983 1991 1999 2007 20151979 1987 1995 2003 2011
Global equities: Diversification benefits and attractive valuations
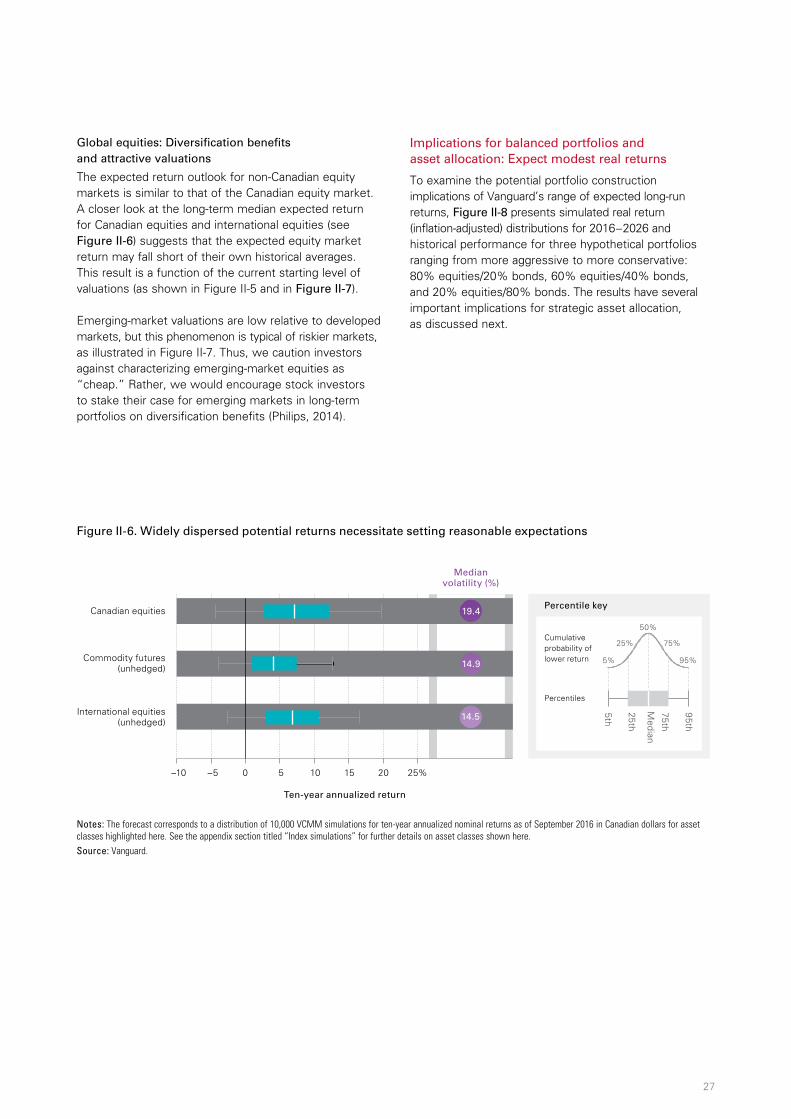
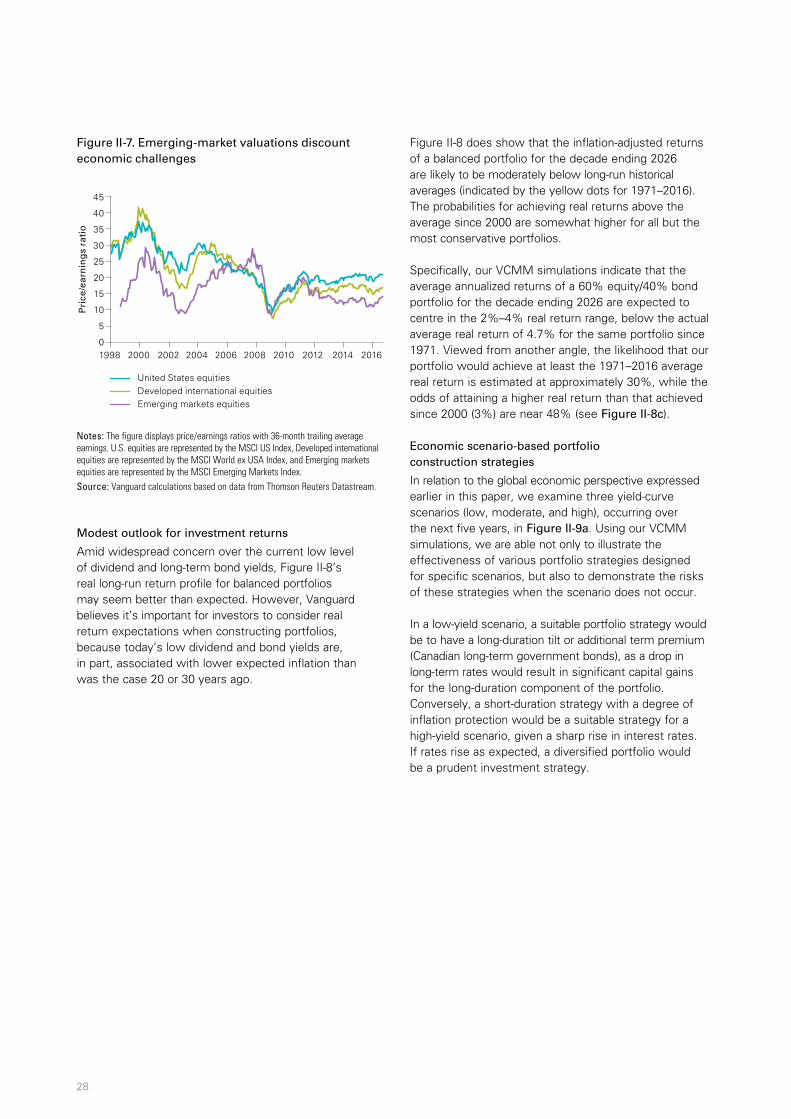
The expected return outlook for non-Canadian equity markets is similar to that of the Canadian equity market. A closer look at the long-term median expected return for Canadian equities and international equities (see Figure II-6) suggests that the expected equity market return may fall short of their own historical averages. This result is a function of the current starting level of valuations (as shown in Figure II-5 and in Figure II-7).
Emerging-market valuations are low relative to developed markets, but this phenomenon is typical of riskier markets, as illustrated in Figure II-7. Thus, we caution investors against characterizing emerging-market equities as “cheap.” Rather, we would encourage stock investors to stake their case for emerging markets in long-term portfolios on diversification benefits (Philips, 2014).
Implications for balanced portfolios and asset allocation: Expect modest real returns
To examine the potential portfolio construction implications of Vanguard’s range of expected long-run returns, Figure II-8 presents simulated real return (inflation-adjusted) distributions for 2016−2026 and historical performance for three hypothetical portfolios ranging from more aggressive to more conservative: 80% equities/20% bonds, 60% equities/40% bonds, and 20% equities/80% bonds. The results have several important implications for strategic asset allocation, as discussed next.
27
Figure II-6. Widely dispersed potential returns necessitate setting reasonable expectations
Notes: The forecast corresponds to a distribution of 10,000 VCMM simulations for ten-year annualized nominal returns as of September 2016 in Canadian dollars for asset classes highlighted here. See the appendix section titled “Index simulations” for further details on asset classes shown here.Source: Vanguard.
Ten-year annualized return
–10 –5 5 10 15 200 25%
International equities(unhedged)
Medianvolatility (%)
Percentile key
Cumulativeprobability of lower return
Percentiles
95%
75%
50%
25%
5%
5th
95th
75th
25th
Median
Commodity futures(unhedged)
Canadian equities
14.9
14.5
19.4
Ten-year annualized return
–10 –5 5 10 15 200 25%
Commodities inCAD (Unhedged)
Medianvolatility (%)
Percentile key
Cumulativeprobability of lower return
Percentiles
95%
75%
50%
25%
5%
5th
95th
75th
25th
Median
Canada equities
MedianGlobal equitiesex-Canada (unhedged)
14.9
14.5
19.4
Modest outlook for investment returns
Amid widespread concern over the current low level of dividend and long-term bond yields, Figure II-8’s real long-run return profile for balanced portfolios may seem better than expected. However, Vanguard believes it’s important for investors to consider real return expectations when constructing portfolios, because today’s low dividend and bond yields are, in part, associated with lower expected inflation than was the case 20 or 30 years ago.
Figure II-8 does show that the inflation-adjusted returns of a balanced portfolio for the decade ending 2026 are likely to be moderately below long-run historical averages (indicated by the yellow dots for 1971–2016). The probabilities for achieving real returns above the average since 2000 are somewhat higher for all but the most conservative portfolios.
Specifically, our VCMM simulations indicate that the average annualized returns of a 60% equity/40% bond portfolio for the decade ending 2026 are expected to centre in the 2%–4% real return range, below the actual average real return of 4.7% for the same portfolio since 1971. Viewed from another angle, the likelihood that our portfolio would achieve at least the 1971–2016 average real return is estimated at approximately 30%, while the odds of attaining a higher real return than that achieved since 2000 (3%) are near 48% (see Figure II-8c).
Economic scenario-based portfolio construction strategies
In relation to the global economic perspective expressed earlier in this paper, we examine three yield-curve scenarios (low, moderate, and high), occurring over the next five years, in Figure II-9a. Using our VCMM simulations, we are able not only to illustrate the effectiveness of various portfolio strategies designed for specific scenarios, but also to demonstrate the risks of these strategies when the scenario does not occur.
In a low-yield scenario, a suitable portfolio strategy would be to have a long-duration tilt or additional term premium (Canadian long-term government bonds), as a drop in long-term rates would result in significant capital gains for the long-duration component of the portfolio. Conversely, a short-duration strategy with a degree of inflation protection would be a suitable strategy for a high-yield scenario, given a sharp rise in interest rates. If rates rise as expected, a diversified portfolio would be a prudent investment strategy.
28
Figure II-7. Emerging-market valuations discount economic challenges
Notes: The figure displays price/earnings ratios with 36-month trailing average earnings. U.S. equities are represented by the MSCI US Index, Developed international equities are represented by the MSCI World ex USA Index, and Emerging markets equities are represented by the MSCI Emerging Markets Index.Source: Vanguard calculations based on data from Thomson Reuters Datastream.
Pri
ce/e
arn
ing
s ra
tio
0
20
15
10
5
40
35
30
25
45
1998 2000 2002 2004 2006 2008 2010 2012 2014 2016
United States equitiesDeveloped international equitiesEmerging markets equities

29
Figure II-9b shows the allocation of optimal portfolios for each of the scenarios and confirms the portfolio strategy discussed above. The optimal portfolios vary exposure to the following three factors, or risk premiums: (1) equity-risk premium, (2) term premium, and (3) credit premium. The portfolio outcomes relative to an efficient frontier are illustrated in Figures II-9c, and Figure II-9d summarizes the analysis.
Our VCMM simulations help in assessing the expected performance of the the above-mentioned portfolio strategies relative to the efficient frontier (see Figure II-9c). This exercise can be a useful one for investors considering strategic allocation tilts and can assist in assessing risk–return trade-offs among the strategies, especially if an expected scenario does not occur.
Portfolio construction strategies: Time-tested principles apply
Contrary to suggestions that an environment of structural deceleration, subdued inflation pressures, and permanently lower interest rates warrants some radically new investment strategy, Figure II-8 reveals that the simulated ranges of portfolio returns are upward sloping on risk. Simply put, higher portfolio risk accompanies higher (expected) return. Our analysis of equity valuations in Figure II-5 showed that the global equity risk premium endures when one adjusts for the muted expectations for global inflation and interest rates. Thus, according to our VCMM simulations, the forward-looking equity risk premium expectation over bonds may not be meaningfully lower than it has been in the past.
Nevertheless, although risk–return trade-offs and equity risk premiums may not be different, portfolio return expectations themselves need to be lowered, based on the prospects for lower global trend growth and central banks’ lifting of policy rates very gradually over time. In this environment, we expect asset yields to be lower relative to historical norms across the board, both for equities and fixed income. Investment objectives based either on fixed spending requirements or on fixed portfolio return targets may require investors to consciously assess whether the extra risk needed to reach those goals is within reasonable risk-tolerance levels. A balanced approach may also include calibrating investment objectives against reasonable portfolio return expectations and adjusting investment behaviour, such as savings and portfolio contributions.
We encourage investors to evaluate the trade-offs involved in any shifts toward risky asset classes— such as tilting a bond portfolio toward corporate and high-yield investments or making a wholesale move from bonds into equities. The global cross-currents of valuations, structural deceleration, and divergent monetary policies imply that the investment environment is likely to be more challenging and volatile in the years ahead. Both a realistic expectation of the extra return to be gained in such an environment and an understanding of the implications for holistic portfolio risk are crucial to maintaining the discipline needed for long-term investment success.
Ultimately, our global market outlook points toward a somewhat more challenging and volatile environment ahead, yet one in which investors with an appropriate level of discipline, diversification, and patience are likely to be rewarded over the next decade with fair inflation-adjusted returns.
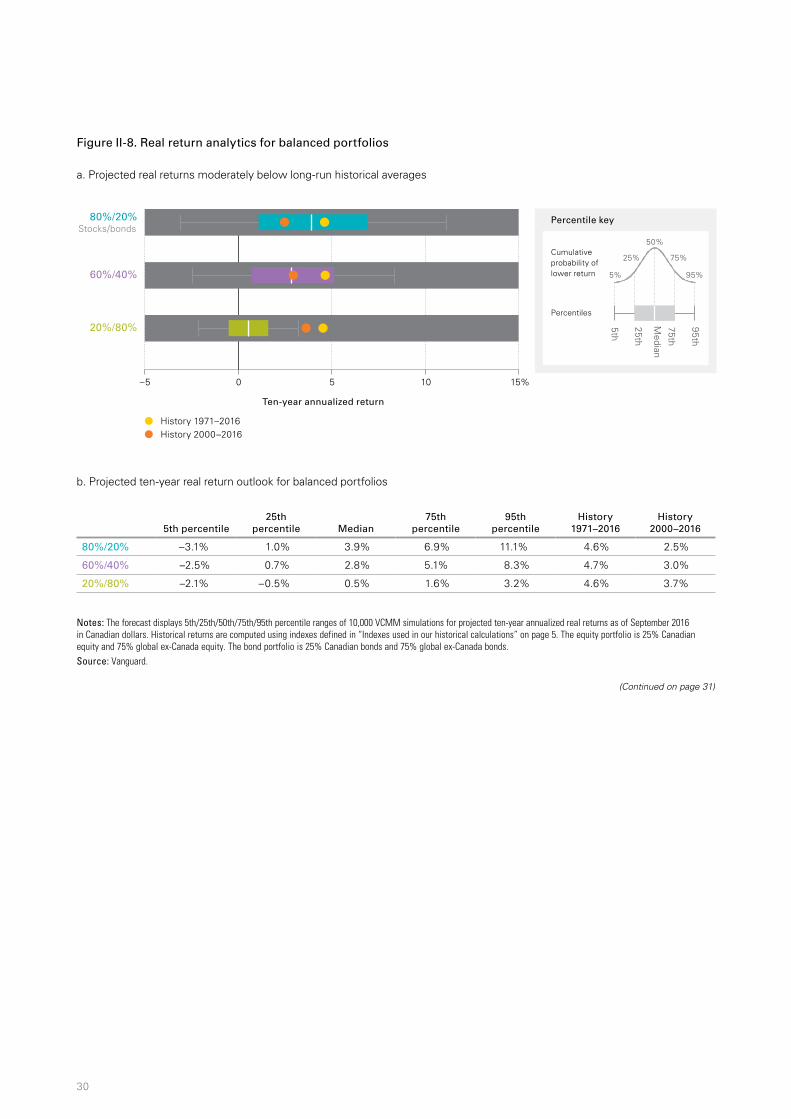
30
Figure II-8. Real return analytics for balanced portfolios
a. Projected real returns moderately below long-run historical averages
Notes: The forecast displays 5th/25th/50th/75th/95th percentile ranges of 10,000 VCMM simulations for projected ten-year annualized real returns as of September 2016 in Canadian dollars. Historical returns are computed using indexes defined in “Indexes used in our historical calculations” on page 5. The equity portfolio is 25% Canadian equity and 75% global ex-Canada equity. The bond portfolio is 25% Canadian bonds and 75% global ex-Canada bonds. Source: Vanguard.
b. Projected ten-year real return outlook for balanced portfolios
5th percentile
25th percentile
Median
75th percentile
95th percentile
History 1971–2016
History 2000–2016
80%/20% –3.1% 1.0% 3.9% 6.9% 11.1% 4.6% 2.5%
60%/40% –2.5% 0.7% 2.8% 5.1% 8.3% 4.7% 3.0%
20%/80% –2.1% –0.5% 0.5% 1.6% 3.2% 4.6% 3.7%
Ten-year annualized return
60%/40%
20%/80%
Percentile key
Cumulativeprobability of lower return
Percentiles
95%
75%
50%
25%
5%
5th
95th
75th
25th
Median
15%–5 5 100
History 1971–2016History 2000–2016
80%/20%Stocks/bonds
(Continued on page 31)
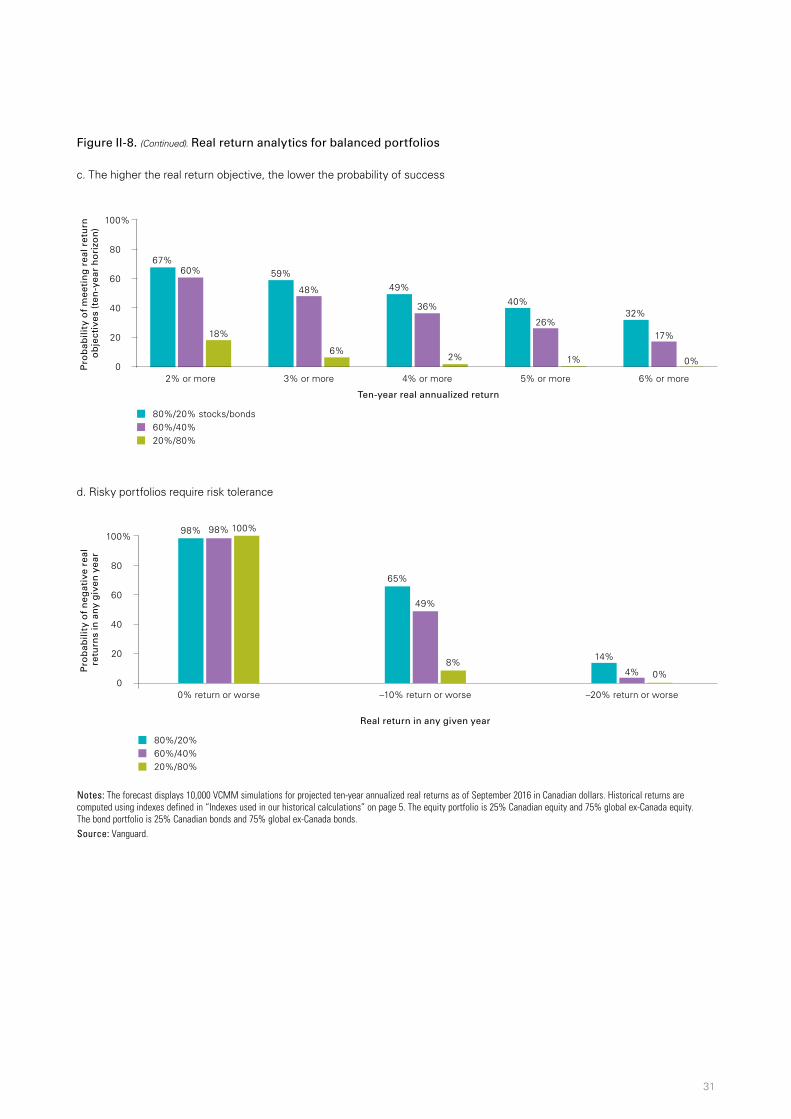
31
Figure II-8. (Continued). Real return analytics for balanced portfolios
c. The higher the real return objective, the lower the probability of success
Notes: The forecast displays 10,000 VCMM simulations for projected ten-year annualized real returns as of September 2016 in Canadian dollars. Historical returns are computed using indexes defined in “Indexes used in our historical calculations” on page 5. The equity portfolio is 25% Canadian equity and 75% global ex-Canada equity. The bond portfolio is 25% Canadian bonds and 75% global ex-Canada bonds. Source: Vanguard.
d. Risky portfolios require risk tolerance
Pro
bab
ility
of
mee
tin
g r
eal r
etu
rn
ob
ject
ives
(te
n-y
ear
ho
rizo
n)
0
20
40
80
100%
60
Ten-year real annualized return
2% or more
18%
60%67%
3% or more
6%
48%
59%
4% or more
2%
36%
49%
5% or more
1%
26%
40%
6% or more
0%
17%
32%
80%/20% stocks/bonds60%/40%20%/80%
Pro
bab
ility
of
neg
ativ
e re
al
retu
rns
in a
ny
giv
en y
ear
Real return in any given year
0
20
40
80
100%
0% return or worse
60
–10% return or worse –20% return or worse
100%98%98%
8%
49%
65%
0%4%
14%
80%/20%60%/40%20%/80%
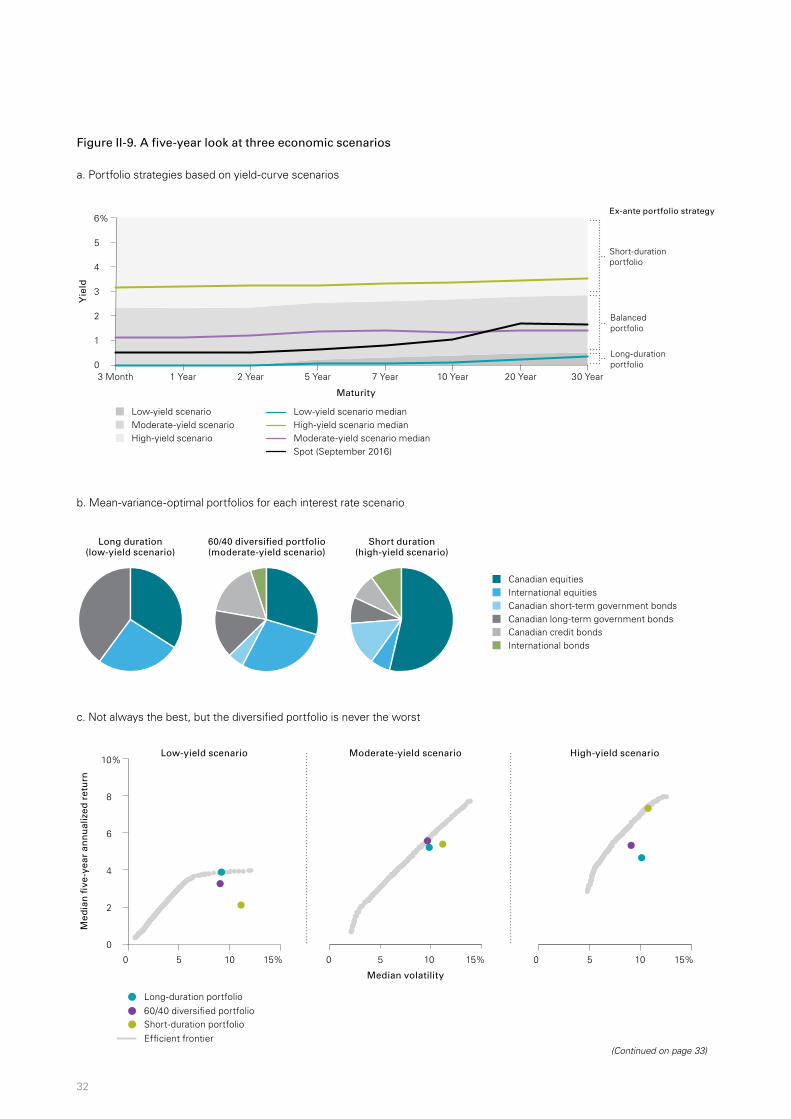
32
Figure II-9. A five-year look at three economic scenarios
a. Portfolio strategies based on yield-curve scenarios
Yie
ld
Maturity
Ex-ante portfolio strategy
0
3
Short-durationportfolio
Balancedportfolio
Long-durationportfolio
2
1
4
5
6%
3 Month 1 Year 2 Year 5 Year 7 Year 10 Year 20 Year 30 Year
Low-yield scenarioModerate-yield scenarioHigh-yield scenario
Low-yield scenario medianHigh-yield scenario medianModerate-yield scenario medianSpot (September 2016)
c. Not always the best, but the diversified portfolio is never the worst
Med
ian
�ve
-yea
r an
nu
aliz
ed r
etu
rn
Low-yield scenario
0
4
2
6
8
10%
15%0 5 10
Moderate-yield scenario
15%0 5 10 15%0 5 10
Long-duration portfolio 60/40 diversi�ed portfolio Short-duration portfolio
Median volatility
Ef�cient frontier
High-yield scenario
Long duration(low-yield scenario)
60/40 diversi�ed portfolio(moderate-yield scenario)
Short duration(high-yield scenario)
Canadian equitiesInternational equitiesCanadian short-term government bondsCanadian long-term government bondsCanadian credit bondsInternational bonds
b. Mean-variance-optimal portfolios for each interest rate scenario
(Continued on page 33)

33
d. Portfolios designed for a single scenario can be risky
Stagnation/recession (low-yield scenario)
Status quo (moderate-yield scenario)
Inflation returns (high-yield scenario)
Best-performing portfolio
2nd-best-performing portfolio
Worst-performing portfolio
Strategy upside relative to balanced portfolio
0.6 percentage point higher annualized return with similar volatility in a low-yield scenario
2.0 percentage points higher annualized return with higher volatility in a high-yield scenario
Strategy downside relative to balanced portfolio
0.7 percentage point lower annualized return with higher volatility in a high-yield scenario
1.1 percentage points lower annualized return with higher volatility in a low-yield scenario
Long-duration portfolio 60/40 diversified portfolio Short-duration portfolio
Notes: Performance is relative to the efficient frontier. The forecast displays simulations of five-year annualized returns of asset classes shown as of September 2016. Scenarios are based on sorting the VCMM simulations based on the 3-month and 30-year government bond yields at the end of every year. The three scenarios are a subset of the 10,000 VCMM simulations. See the appendix section titled “Index simulations” for further details on asset classes shown here.Source: Vanguard.
Figure II-9. (Continued). A five-year look at three scenarios
The following conclusions can be drawn from our analysis:
Portfolios designed for extreme scenarios involve important trade-offs. The risks are asymmetric.
If a low-yield scenario is realized, the short-duration portfolio underperforms the long-duration portfolio by 1.7 percentage points per year, because of forgone income resulting from the short duration.
Conversely, the long-duration portfolio underperforms the short-duration portfolio by 2.7 percentage points per year in a high-yield scenario because of capital losses incurred by long-duration fixed income portfolios.
The diversified portfolio works best for investors who do not have strong conviction on the future state of the economy.
Interestingly, across all three scenarios, the diversified portfolio is either on the frontier or second. In other words, the diversified portfolio exhibits better downside outcomes relative to long- or short-duration portfolio strategies.

34
References
Baker, Jessica, Oriol Carreras, Monique Ebell, Ian Hurst, Simon Kirby, Jack Meaning, Rebecca Piggott, and James Warren, 2016. The Short-Term Economic Impact of Leaving the EU. National Institute Economic Review, No. 236. London, United Kingdom: National Institute of Economic and Social Research.
Centre for Economic Performance, 2016. Brexit 2016: Policy Analysis from the Centre for Economic Performance. June 2016. London, United Kingdom: London School of Economics and Political Science.
Davis, Joseph H., Roger Aliaga-Díaz, Andrew J. Patterson, and Harshdeep Ahluwalia, 2014. Vanguard’s Economic and Investment Outlook. Valley Forge, Pa.: The Vanguard Group.
Davis, Joseph H., Roger Aliaga-Díaz, Andrew J. Patterson, and Harshdeep Ahluwalia, 2015. Vanguard’s Economic and Investment Outlook. Valley Forge, Pa.: The Vanguard Group.
Davis, Joseph H., Roger Aliaga-Díaz, and Charles J. Thomas, 2012. Forecasting Stock Returns: What Signals Matter, and What Do They Say Now? Valley Forge, Pa.: The Vanguard Group.
Davis, Joseph H., Roger Aliaga-Díaz, Harshdeep Ahluwalia, Frank Polanco, and Christos Tasopoulos, 2014. Vanguard Global Capital Markets Model. Valley Forge, Pa.: The Vanguard Group.
Facundo, Alvaredo, Anthony B. Atkinson, Thomas Piketty, Emmanuel Saez, and Gabriel Zucman. The World Wealth and Income Database. Accessed November 15, 2016, at www.wid.world.
Federal Open Market Committee, 2016. Economic Projections of Federal Reserve Board Members and Federal Reserve Bank Presidents Under Their Individual Assessments of Projected Appropriate Monetary Policy, September 2016. Washington, D.C.: Board of Governors of the Federal Reserve System.
Fernald, John G., 2014. Productivity and Potential Output Before, During, and After the Great Recession. Working Paper 2014-15. San Francisco, California: Federal Reserve Bank of San Francisco.
HM Treasury, 2016a. HM Treasury Analysis: The Immediate Economic Impact of Leaving the EU. May 2016, No. 9292. London, United Kingdom: HM Government.
HM Treasury, 2016b. HM Treasury Analysis: The Long-Term Economic Impact of EU Membership and the Alternatives. April 2016, No. 9250. London, United Kingdom: HM Government.
Holston, Kathryn, Thomas Laubach, and John C. Williams, 2016. Measuring the Natural Rate of Interest: International Trends and Determinants. Working Paper 2016-11. San Francisco, California: Federal Reserve Bank of San Francisco.
International Monetary Fund, 2014. World Economic Outlook: Recovery Strengthens, Remains Uneven. Washington, D.C.: International Monetary Fund.
International Monetary Fund, 2016a. United Kingdom: 2016 Article IV Consultation—Press Release and Staff Report. IMF Country Report No. 16/168. Washington, D.C.: International Monetary Fund.
International Monetary Fund, 2016b. World Economic Outlook: Subdued Demand: Symptoms and Remedies. Washington, D.C.: International Monetary Fund.
Kierzenkowski, Rafal, Nigel Pain, Elena Rusticelli, and Sanne Zwart, 2016. The Economic Consequences of Brexit: A Taxing Decision. OECD Economic Policy Paper No. 16. Paris, France: Organisation for Economic Cooperation and Development.
Philips, Christopher B., 2014. Global Equities: Balancing Home Bias and Diversification. Valley Forge, Pa.: The Vanguard Group.
Philips, Christopher B., and Charles J. Thomas, 2013. Fearful of Rising Interest Rates? Consider a More Global Bond Portfolio. Valley Forge, Pa.: The Vanguard Group.
Philips, Christopher B., Joseph H. Davis, Andrew J Patterson, and Charles J. Thomas, 2014. Global Fixed Income: Considerations for U.S. investors. Valley Forge, Pa.: The Vanguard Group.
PricewaterhouseCoopers, 2016. Leaving the EU: Implications for the UK Economy. PricewaterhouseCoopers.
Schwab, Klaus, 2016. The Global Competitiveness Report 2016–2017. 2016. Geneva, Switzerland: World Economic Forum.
U.S. Congressional Budget Office, 2016. The Budget and Economic Outlook: 2016 to 2026. January 2016, No. 51129. Washington, D.C: Congressional Budget Office.
Vanguard Group, The, 2015. Global Macro Matters—Japan: The Long Road Back to Inflation. Valley Forge, Pa.: The Vanguard Group.
Vanguard Group, The, 2016. Global Macro Matters—Monetary Policy Is (Barely) Carrying the World. Valley Forge, Pa.: The Vanguard Group.
Wallick, Daniel W., Douglas M. Grim, Christos Tasopoulos, and James Balsamo, 2015. The Allure of the Outlier: A Framework for Considering Alternative Investments. Valley Forge, Pa.: The Vanguard Group.
35
III. Appendix: VCMM and index simulations
About the Vanguard Capital Markets Model
IMPORTANT: The projections or other information generated by the Vanguard Capital Markets Model regarding the likelihood of various investment outcomes are hypothetical in nature, do not reflect actual investment results, and are not guarantees of future results. VCMM results will vary with each use and over time.
The VCMM projections are based on a statistical analysis of historical data. Future returns may behave differently from the historical patterns captured in the VCMM. More important, the VCMM may be underestimating extreme negative scenarios unobserved in the historical period on which the model estimation is based.
The VCMM is a proprietary financial simulation tool developed and maintained by Vanguard’s Investment Strategy Group. The model forecasts distributions of future returns for a wide array of broad asset classes. Those asset classes include Canadian, U.S., and international equity markets, commodities, and certain alternative investment strategies. The theoretical and empirical foundation for the Vanguard Capital Markets Model is that the returns of various asset classes reflect the compensation investors require for bearing different types of systematic risk (beta). At the core of the model are estimates of the dynamic statistical relationship between risk factors and asset returns, obtained from statistical analysis based on available monthly financial and economic data.
Using a system of estimated equations, the model then applies a Monte Carlo simulation method to project the estimated interrelationships among risk factors and asset classes as well as uncertainty and randomness over time. The model generates a large set of simulated outcomes for each asset class over several time horizons. Forecasts are obtained by computing measures of central tendency in these simulations. Results produced by the tool will vary with each use and over time.
The primary value of the VCMM is in its application to analyzing potential client portfolios. VCMM asset-class forecasts—comprising distributions of expected returns, volatilities, and correlations—are key to the evaluation of potential downside risks, various risk–return trade-offs, and the diversification benefits of various asset classes. Although central tendencies are generated in any return distribution, Vanguard stresses that focusing on the full range of potential outcomes for the assets considered, such as the data presented in this paper, is the most effective way to use VCMM output. We encourage readers interested in more details of the VCMM to read Vanguard’s white paper titled Vanguard Global Capital Markets Model (Davis et al., 2014).
The VCMM seeks to represent the uncertainty in the forecast by generating a wide range of potential outcomes. It is important to recognize that the VCMM does not impose “normality” on the return distributions, but rather is influenced by the so-called fat tails and skewness in the empirical distribution of modelled asset-class returns. Within the range of outcomes, individual experiences can be quite different, underscoring the varied nature of potential future paths. Indeed, this is a key reason why we approach asset-return outlooks in a distributional framework, as shown in Figure III-1, which highlights balanced portfolio returns before adjusting for inflation.
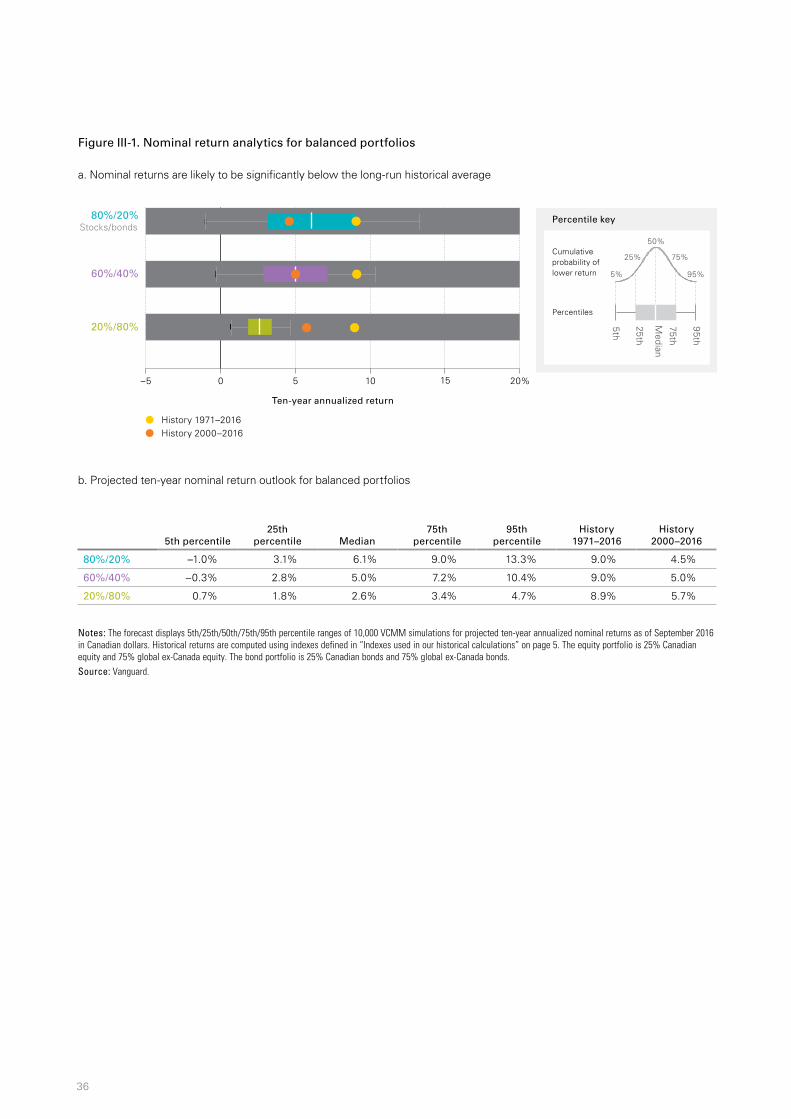
36
Figure III-1. Nominal return analytics for balanced portfolios
a. Nominal returns are likely to be significantly below the long-run historical average
Notes: The forecast displays 5th/25th/50th/75th/95th percentile ranges of 10,000 VCMM simulations for projected ten-year annualized nominal returns as of September 2016 in Canadian dollars. Historical returns are computed using indexes defined in “Indexes used in our historical calculations” on page 5. The equity portfolio is 25% Canadian equity and 75% global ex-Canada equity. The bond portfolio is 25% Canadian bonds and 75% global ex-Canada bonds. Source: Vanguard.
b. Projected ten-year nominal return outlook for balanced portfolios
5th percentile
25th percentile
Median
75th percentile
95th percentile
History 1971–2016
History 2000–2016
80%/20% –1.0% 3.1% 6.1% 9.0% 13.3% 9.0% 4.5%
60%/40% –0.3% 2.8% 5.0% 7.2% 10.4% 9.0% 5.0%
20%/80% 0.7% 1.8% 2.6% 3.4% 4.7% 8.9% 5.7%
History 1971–2016History 2000–2016
Percentile key
Cumulativeprobability of lower return
Percentiles
95%
75%
50%
25%
5%
5th
95th
75th
25th
Median
Ten-year annualized return
–5 5 10 20%0 15
60%/40%
20%/80%
80%/20%Stocks/bonds
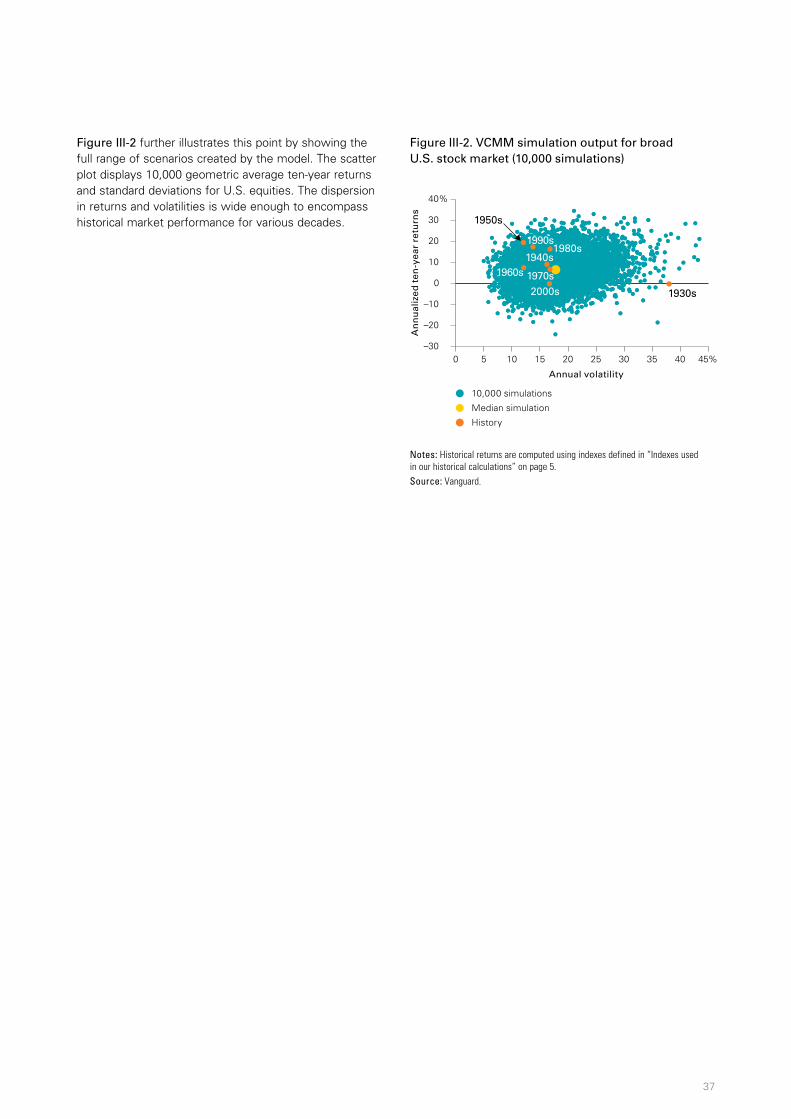
37
Figure III-2 further illustrates this point by showing the full range of scenarios created by the model. The scatter plot displays 10,000 geometric average ten-year returns and standard deviations for U.S. equities. The dispersion in returns and volatilities is wide enough to encompass historical market performance for various decades.
Figure III-2. VCMM simulation output for broad U.S. stock market (10,000 simulations)
Notes: Historical returns are computed using indexes defined in “Indexes used in our historical calculations” on page 5.Source: Vanguard.
An
nu
aliz
ed t
en-y
ear
retu
rns
Annual volatility
40%
0 5 10 15 20 25 30 35 40 45%–30
–20
–10
0
10
20
30
10,000 simulations
Median simulation
History
1950s
1940s1960s 1970s
1980s1990s
2000s 1930s
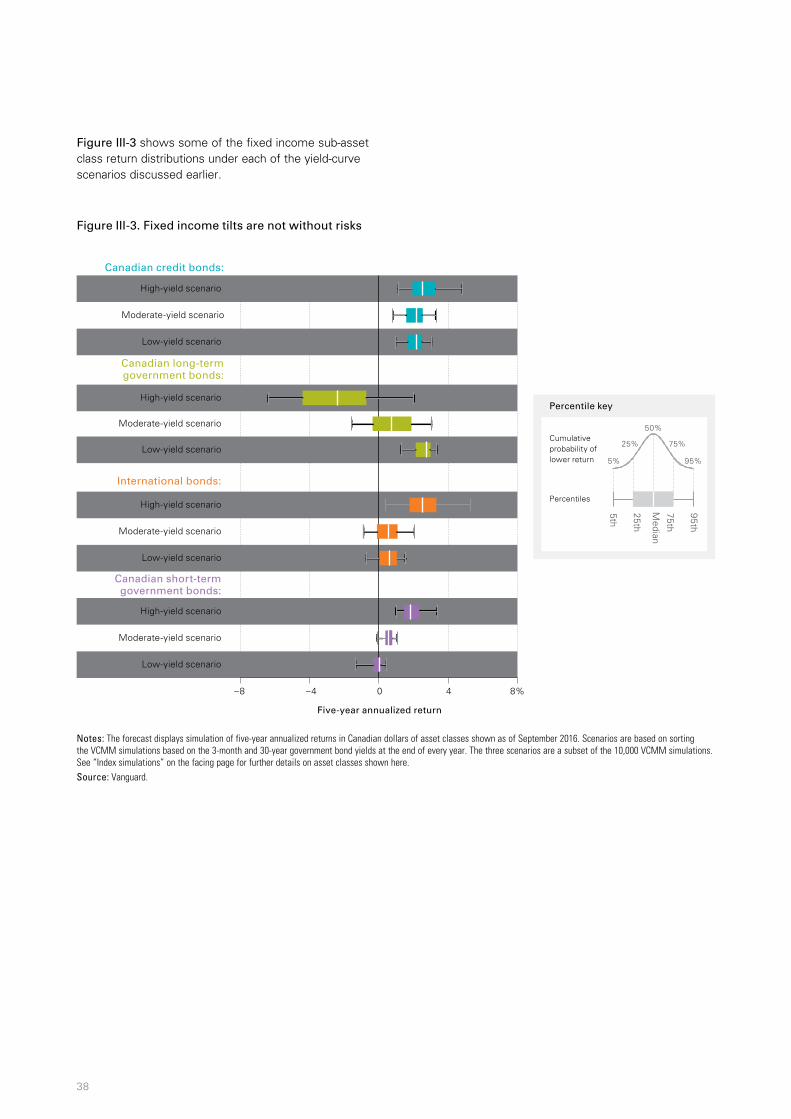
38
Figure III-3 shows some of the fixed income sub-asset class return distributions under each of the yield-curve scenarios discussed earlier.
Figure III-3. Fixed income tilts are not without risks
Notes: The forecast displays simulation of five-year annualized returns in Canadian dollars of asset classes shown as of September 2016. Scenarios are based on sorting the VCMM simulations based on the 3-month and 30-year government bond yields at the end of every year. The three scenarios are a subset of the 10,000 VCMM simulations. See “Index simulations” on the facing page for further details on asset classes shown here.Source: Vanguard.
Five-year annualized return
–4 0 4 8%
Moderate-yield scenario
Moderate-yield scenario
High-yield scenario
Low-yield scenario
Moderate-yield scenario
High-yield scenario
Low-yield scenario
Low-yield scenario
High-yield scenario
Low-yield scenario
Moderate-yield scenario
High-yield scenario
Canadian credit bonds:
Canadian long-termgovernment bonds:
International bonds:
Canadian short-termgovernment bonds:
–8
Percentile key
Cumulativeprobability of lower return
Percentiles
95%
75%
50%
25%
5%
5th
95th
75th
25th
Median

39
Index simulations
The long-term returns of our hypothetical portfolios are based on data for the appropriate market indexes through September 2016. We chose these benchmarks to provide the most complete history possible, and we apportioned the global allocations to align with Vanguard’s guidance in constructing diversified portfolios. Asset classes and their representative forecast indexes are as follows:
• Canadian equities: MSCI Canada Total Return Index.
• Canadian bonds: Bloomberg Barclays Canadian Issues 300MM.
• Canadian credit bonds: Bloomberg Barclays Canadian Issues 3000MM credit Index.
• Canadian government bonds: Bloomberg Barclays Canadian Issues 3000MM Treasury Index.
• Canadian short-term government bonds: Bloomberg Barclays Canadian Issues 3000MM 1–5-year Treasury Index.
• Canadian long-term government bonds: Bloomberg Barclays Canadian Issues 3000MM Treasury–Long Index.
• Canada inflation: Consumer price index for Canada.
• International equities: MSCI All Country World Index ex Canada in CAD.
• International bonds: Bloomberg Barclays Global Aggregate ex Canada Index (CAD Hedged).
• Commodity futures: Bloomberg Commodity Index in CAD.
• Canadian cash: Canada Treasury bills.

40

41
Notes


Notes on risk
All investing is subject to risk, including the possible loss of the money you invest. Past performance is no guarantee of future returns. Investments in bonds are subject to call risk, credit risk, income risk and interest rate risk.
Currency hedging transactions incur extra expenses, may not perfectly offset foreign currency exposures, and may eliminate any chance to benefit from favourable fluctuations in those currencies.
Investments in stocks issued by foreign companies are subject to risks including country/regional risk, which is the chance that political upheaval, financial troubles, or natural disasters will adversely affect the value of securities issued by companies in foreign countries or regions; and currency risk, which is the chance that the value of a foreign investment will decrease because of unfavourable changes in currency exchange rates.
There is a chance that the stocks of companies located in emerging markets will be substantially more volatile, and substantially less liquid, than the stocks of companies located in more developed foreign markets. There is a chance that world events—such as political upheaval, financial troubles or natural disasters—will adversely affect the value of securities issued by companies in foreign countries or regions. Country/regional risk is especially high in emerging markets. There is a chance that the value of a foreign investment, measured in Canadian dollars, will decrease because of unfavourable changes in currency exchange rates. Currency risk is especially high in emerging markets.
Important information:
The views expressed in this material are based on the authors’ assessments as of the first publication date (December 2016), are subject to change without notice and may not represent the views and/or opinions of Vanguard Investments Canada Inc. The authors may not necessarily update or supplement their views and opinions whether as a result of new information, changing circumstances, future events or otherwise.
Certain statements in this material may be considered “forward-looking information” which may be material, involve risks, uncertainties or other assumptions and there is no guarantee that actual results will not differ significantly from those expressed in or implied by these statements. Factors include, but are not limited to, general global financial market conditions, interest and foreign exchange rates, economic and political factors, competition, legal or regulatory changes and catastrophic events. Any predictions, projections, estimates or forecasts should be construed as general investment or market information and no representation is being made that any investor will, or is likely to, achieve returns similar to those mentioned herein.
While this information has been compiled from proprietary and non-proprietary sources believed to be reliable, no representation or warranty, express or implied, is made by The Vanguard Group, Inc., its subsidiaries or affiliates, or any other person (collectively, “The Vanguard Group”) as to its accuracy, completeness, timeliness or reliability. The Vanguard Group takes no responsibility for any errors and omissions contained herein and accepts no liability whatsoever for any loss arising from any use of, or reliance on, this material.
This material is for informational purposes only. This material is not intended to be relied upon as research, investment, or tax advice and is not an implied or express recommendation, offer or solicitation to buy or sell any security or to adopt any particular investment or portfolio strategy. Any views and opinions expressed do not take into account the particular investment objectives, needs, restrictions and circumstances of a specific investor and thus, should not be used as the basis of any specific investment recommendation. Investors should consult a financial and/or tax advisor for financial and/or tax information applicable to their specific situation. Please consult your financial and/or tax advisor for financial and/or tax information applicable to your specific situation.
Information, figures and charts are summarized for illustrative purposes only and are subject to change without notice.
In this material, references to “Vanguard” are provided for convenience only and may refer to, where applicable, only The Vanguard Group, Inc., and/or may include its affiliates, including Vanguard Investments Canada Inc.
This material does not constitute an offer or solicitation and may not be treated as an offer or solicitation in any jurisdiction where such an offer or solicitation is against the law, or to anyone to whom it is unlawful to make such an offer or solicitation, or if the person making the offer or solicitation is not qualified to do so.
CFA® is a registered trademark owned by CFA Institute.
© 2016 Vanguard Investments Canada Inc. All rights reserved.
ISGVEMO_CA 012017
Connect with Vanguard® > vanguardcanada.ca


![Ann cools 3 scapular rehab [compatibiliteitsmodus]](https://img.pdfslide.us/doc/110x75/556bd7aad8b42ab2138b4af1/ann-cools-3-scapular-rehab-compatibiliteitsmodus.jpg)

![Ann cools 4 screening tennis players [compatibiliteitsmodus]](https://img.pdfslide.us/doc/110x75/558c6dd0d8b42a6c298b46a4/ann-cools-4-screening-tennis-players-compatibiliteitsmodus.jpg)


![Ann cools 2 internal impingement [compatibiliteitsmodus]](https://img.pdfslide.us/doc/110x75/54c164544a795951748b45e3/ann-cools-2-internal-impingement-compatibiliteitsmodus.jpg)