Embed Size (px)
Citation preview
1
Growth and Stabilization
Introduction
The resilience of the economy of Pakistan has been tested several times by one crisis after another. The economy has witnessed numerous domestic and external shocks from 2007 onwards. The sharp rise in international oil and food prices, the internal security hazards brought on by the campaign against extremism and the repeated natural disasters in the form of successive floods have buffeted the macroeconomic strategy with shock after shock. Domestically, two floods, the difficult security situation and the energy crisis have combined to drastically impact economic growth. The campaign against extremism with its associated destruction of physical infrastructure, the displacement of thousands of people from the affected areas and the associated rise in expenditure to support the moved people has all taken their toll. The growth in our export markets has slowed down compared to last year. Gross Domestic Product (GDP) growth has been stuck at a level, which is half of the level of Pakistan’s long-term trend potential of about 6.5 percent per annum and is lower than what would be required for sustained increases in employment and income and a reduction in poverty.
Amidst the critical challenges of the floods and heavy rains of 2010 and 2011, skyrocketing oil prices and global contraction, the government’s strategy continued to focus on regaining macroeconomic stability. There have been some successes. Pakistan has been able to withstand the pressures and improve its performance in some key areas such as the check on inflation, the increase in exports and revenue generation and maintenance of comfortable foreign exchange reserve levels. The focus on reforms and austerity through the control
of public expenditures despite the difficulties has continued.
The economy is now showing signs of modest recovery. The commodity producing sectors and especially the agriculture sector are doing better. Some improvement is also witnessed in the Large Scale Manufacturing (LSM) sector. The Service sector also gained from healthy trade activities and the improvements in the commodity producing sectors. The smooth functioning of the supply chains is playing a key role in improving the economic situation and ensuring the availability of essential items. Pakistan has the potential to grow at 6 to 7 percent in the next couple of years.
The GDP growth for 2011-12 was projected at 4.2 percent on the back of 3.4 percent growth in Agriculture, 2 percent growth in LSM and 5 percent in Services sectors. However, the torrential rains in Sindh province during August 2011 compelled the government to revise its GDP growth target to 3.6 percent from 4.2 percent on the basis of 2.5 percent growth in Agriculture, 1.5 percent in LSM, and 4.4 percent growth in services sector.
The revised growth targets have been met and marginally exceeded. The economy has shown resilience. GDP growth for 2011-12 has been estimated 3.7 percent based on nine month data as compared to 3.0 percent (revised) in the previous fiscal year 2011. The Agriculture sector recorded a growth of 3.13 percent against a target of 3.4 percent and previous year’s growth rate of 2.38 percent. The Large Scale Manufacturing sector grew by 1.78 percent as compared to the target of 2.0 percent and against the growth of 1.15 percent
Chapter 1

Pakistan Economic Survey 2011-12
2
in the last year. Although the Services sector recorded steady growth of 4.02 percent as compared to 4.45 percent in 2010-11, this was
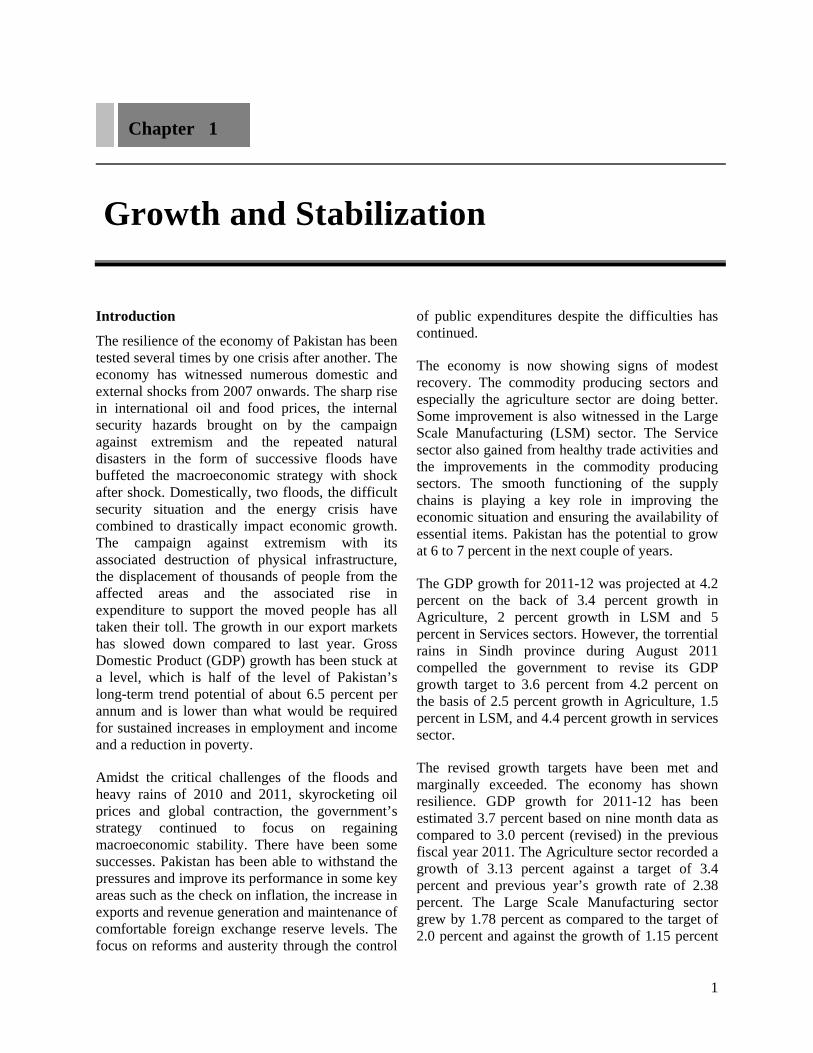
lower than the target of 5.0 percent set for the outgoing year. Figure-1.1 presents an overview of GDP growth over the previous years.
The 3.7 percent growth based on the nine months data 2011-12, up from 1.7 percent in 2008-09 and 3.0 percent last year, indicates the potential growth trajectory. The country has enormous potential to grow at much higher rates which is demonstrated by the achievement of the 3.7 percent growth this year despite the numerous internal and external shocks that the economy has been forced to withstand.
Some of Pakistan’s economic problems are structural in nature. The objectives of sustaining high growth, low inflation, and external payment viability can not be achieved without removing certain structural barriers. To this end the major structural reforms of the government have included tax legislation, trade reforms, further privatization of State Owned Enterprises (SOEs), financial sector reforms, human resource development and social protection. The EU approval of duty waiver on textile items is being pursued aggressively, which would help in improving the exports and providing support to the business environment. In recent times, Pakistan has also undergone political and constitutional changes. Civil societies and other organizations are now playing a more active and independent role and this coupled with government reforms are helping economic growth.
Global Developments
The International Monetary Fund (IMF) has warned that the euro zone debt crisis is escalating
and dragging down the entire world economy. In this scenario China has remained a bright spot. Its growth rate, although down to a forecast of 8.2 percent for this year compared to 9.2 percent last year, has remained relatively high. If China can maintain its growth, it’s good for the world, providing support for commodities markets and growth in other countries.
The IMF maintained its forecast of 2.1 percent growth for the US in the year 2012 and 2.4 percent for the year 2013. For Japan the growth rate projected for 2012 is 2.0 percent and for 2013 it is 1.7 percent. Overall, economic activity in advanced economies is likely to expand by 1.7 percent on average in 2012 and 2013. Growth in emerging economies is projected at 5.7 percent in 2012. The IMF expects growth in oil exporting countries in the Middle East and North Africa to slow to 3.9 percent in 2012, from 4.9 percent in 2011. Net oil importers in the Middle East and North Africa region are expected to record 2.6 percent growth in 2012, after sluggish growth of 1.4 percent in 2011. GDP growth across the Gulf Cooperation Council (GCC) countries is expected to be moderate at a rate of 4 percent in 2012.
Unfortunately, Europe is now caught in a vicious cycle of high debt and low growth. Highly burdened by debt, most of the economies in the region may not attain respectable levels of growth to improve their fiscal position. This will imply
2.03.1
4.7
7.59.0
5.86.8
3.7
1.73.1 3.0
3.7
0.01.02.03.04.05.06.07.08.09.0
10.020
00-0
1
2001
-02
2002
-03
2003
-04
2004
-05
2005
-06
2006
-07
2007
-08
2008
-09
2009
-10
2010
-11
2011
-12
Fig-1.1 GDP Growth (%)

Growth and Stabilization
3
potential debt servicing difficulties and limit their abilities to unshackle their growth potential. Almost 17 percent of total exports of Pakistan are to the Euro zone as are a reasonable portion of its total import from this region. Problems in this area can impact on Pakistan’s trade and hence its overall growth.
Asia on the other hand, continues to move ahead, with China and India leading the growth. There is some hope that perhaps Asia has created some distance from the OECD, and has therefore, not been dragged down so far. However, if the OECD continues its downward slide, the export-led Asian giants could see their growth prospects diminish.
Table-1.1: Comparative Real GDP Growth Rates (%)Region/Country 2009 2010 2011 2012 2013 (P) World GDP -0.5 5.3 3.9 3.5 4.1Euro Area -4.1 1.9 1.4 -0.3 0.9United States -2.6 3.0 1.7 2.1 2.4Japan -6.3 4.4 -0.7 2.0 1.7Germany -4.7 3.6 3.1 0.6 1.5Canada -2.5 3.2 2.5 2.1 2.2Developing Countries 2.7 7.5 6.2 5.7 6.0China 9.2 10.4 9.2 8.2 8.8Hong Kong SAR -2.7 6.8 5.4 2.6 4.2Korea 0.2 6.1 4.5 3.5 4.0Singapore 0.6 2.8 3.3 2.7 3.9Vietnam 5.3 6.8 5.9 5.6 6.3 ASEAN Indonesia 4.6 6.2 6.5 6.1 6.6Malaysia -1.6 7.2 5.1 4.4 4.7Thailand -2.3 7.8 0.1 5.5 7.5Philippines 1.1 7.6 3.7 4.2 4.7 South Asia India 6.6 10.6 7.2 6.9 7.3Bangladesh 5.9 6.4 6.1 5.9 6.4Sri Lanka 3.5 8.0 8.2 7.5 7.0Pakistan 1.7 3.1 3.0 3.7 4.3 Middle East Saudi Arabia 0.1 4.6 6.8 6.0 4.1Kuwait -5.2 3.4 8.2 6.6 1.8Iran 3.9 5.9 2.0 0.4 1.3Egypt 4.7 5.1 1.8 1.5 3.3 Africa Algeria 2.4 3.3 2.5 3.1 3.4Morocco 4.9 3.7 4.3 3.7 4.3Tunisia 3.1 3.1 -0.8 2.2 3.5Nigeria 7.0 8.0 7.2 7.1 6.6Kenya 2.6 5.6 5.0 5.2 5.7South Africa -1.5 2.9 3.1 2.7 3.4Source: World Economic Outlook (IMF), April 2012. P: Projected.
Pakistan’s economy is very closely linked to the rest of the world due to its high external sector exposure. Several countries of the euro zone are important trading partners of Pakistan. As such, any untoward development in these countries could
have a substantial negative impact on the economy of Pakistan. A contraction or stagnation in economic activity in the global economy, can potentially affect the level of our exports, Foreign Direct Investment (FDI) and home remittances adversely. Similarly further increase in oil prices
Pakistan E
4
can creatactivities
Box-1 Rise in Oi
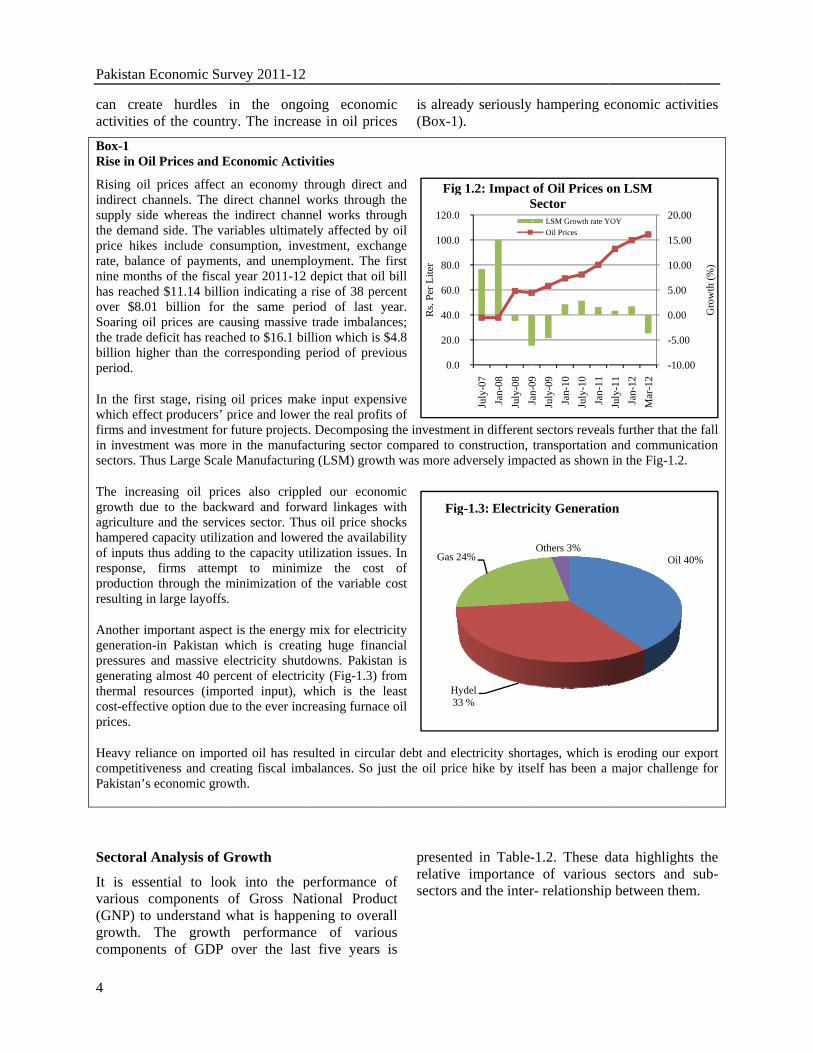
Rising oil indirect chsupply sidthe demanprice hikerate, balannine monthhas reacheover $8.0Soaring oithe trade dbillion higperiod.
In the firstwhich effefirms and iin investmsectors. Th
The increagrowth duagriculturehampered of inputs thresponse, productionresulting in
Another imgenerationpressures agenerating thermal recost-effectprices.
Heavy relicompetitivPakistan’s
Sectoral A
It is essevarious c(GNP) to growth. componen
Economic Sur
te hurdles of the countr
l Prices and E
prices affect hannels. The dde whereas thed side. The vas include con
nce of paymenhs of the fiscal
ed $11.14 billio1 billion for il prices are cadeficit has reachgher than the c
t stage, rising ect producers’ pinvestment for
ment was more hus Large Scale
asing oil pricue to the backwe and the servicapacity utilizahus adding to firms attemp
n through the mn large layoffs.
mportant aspec-in Pakistan wand massive ealmost 40 per
esources (impoive option due
iance on imporveness and crea
economic grow
Analysis of G
ential to loocomponents
understand wThe growth
nts of GDP
rvey 2011-12
in the ongory. The increa
Economic Acti
an economy tdirect channel e indirect chanariables ultimatnsumption, invnts, and unempl year 2011-12on indicating a
the same peausing massivehed to $16.1 bicorresponding
oil prices makprice and lowefuture projectsin the manufa
e Manufacturin
ces also crippward and forwices sector. Thation and lowethe capacity upt to minimminimization o.
ct is the energywhich is createlectricity shutrcent of electriorted input), w to the ever inc
rted oil has resating fiscal imwth.
Growth
ok into the pof Gross Nawhat is happeh performan
over the las
2
oing economase in oil pric
ivities
through directworks through
nnel works thrtely affected b
vestment, exchployment. The 2 depict that oia rise of 38 peeriod of last e trade imbalanillion which isperiod of prev
ke input expener the real profis. Decomposinacturing sectorng (LSM) grow
pled our econward linkages hus oil price shered the availabutilization issuemize the cosof the variable
y mix for electrting huge finatdowns. Pakisticity (Fig-1.3) which is the creasing furnac
sulted in circumbalances. So j
performance ational Produening to overce of variost five years
mic ces
is alrea(Box-1
t and h the rough by oil hange
first il bill rcent year. nces; $4.8 vious
nsive fits of ng the investmer compared to wth was more a
nomic with
hocks bility es. In t of
e cost
ricity ancial tan is from least
ce oil
ular debt and eust the oil pric
of uct rall ous
is
presentrelativesectors
H3
Gas
Fi
0.0
20.0
40.0
60.0
80.0
100.0
120.0
Rs.
Per L
iter
Fig
ady seriously ).
ent in differentconstruction,
adversely impa
lectricity shortce hike by itse
ted in Table-e importances and the inter
Hydel 33 %
24%
ig-1.3: Electric
0
0
0
0
0
0
0
July
-07
Jan-
08Ju
ly-0
8Ja
n09
g 1.2: Impact S
hampering e
t sectors revealtransportation
acted as shown
tages, which iself has been a
-1.2. These de of various r- relationship
Others 3%
city Generatio
Jan-
09Ju
ly-0
9Ja
n-10
July
-10
Jan-
11
of Oil Prices oSector
LSM Growth rate YOil Prices
economic acti
ls further that tand communi
n in the Fig-1.2
s eroding our major challen
data highlightsectors and
p between the
Oil 4
on
-10.
-5.0
0.00
5.00
10.0
15.0
20.0
July
-11
Jan-
12M
ar-1
2
on LSM
YOY
ivities
the fall ication .
export nge for
ts the d sub-em.
40%
00
0
0
0
00
00
00
Gro
wth
(%)
Growth and Stabilization
5
Table 1.2: Growth Performance of Components of Gross National Product (% Growth at Constant Factor Costs of 1999-2000)
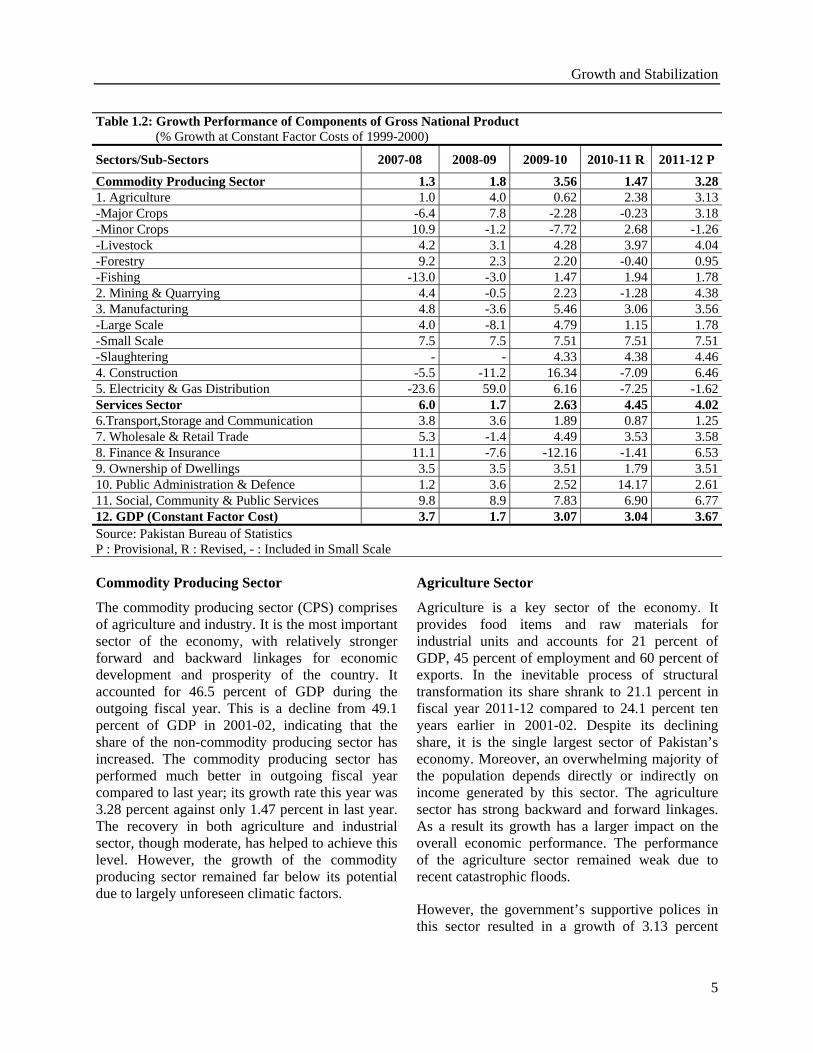
Sectors/Sub-Sectors 2007-08 2008-09 2009-10 2010-11 R 2011-12 P Commodity Producing Sector 1.3 1.8 3.56 1.47 3.281. Agriculture 1.0 4.0 0.62 2.38 3.13-Major Crops -6.4 7.8 -2.28 -0.23 3.18-Minor Crops 10.9 -1.2 -7.72 2.68 -1.26-Livestock 4.2 3.1 4.28 3.97 4.04-Forestry 9.2 2.3 2.20 -0.40 0.95-Fishing -13.0 -3.0 1.47 1.94 1.782. Mining & Quarrying 4.4 -0.5 2.23 -1.28 4.383. Manufacturing 4.8 -3.6 5.46 3.06 3.56-Large Scale 4.0 -8.1 4.79 1.15 1.78-Small Scale 7.5 7.5 7.51 7.51 7.51-Slaughtering - - 4.33 4.38 4.464. Construction -5.5 -11.2 16.34 -7.09 6.465. Electricity & Gas Distribution -23.6 59.0 6.16 -7.25 -1.62Services Sector 6.0 1.7 2.63 4.45 4.026.Transport,Storage and Communication 3.8 3.6 1.89 0.87 1.257. Wholesale & Retail Trade 5.3 -1.4 4.49 3.53 3.588. Finance & Insurance 11.1 -7.6 -12.16 -1.41 6.539. Ownership of Dwellings 3.5 3.5 3.51 1.79 3.5110. Public Administration & Defence 1.2 3.6 2.52 14.17 2.6111. Social, Community & Public Services 9.8 8.9 7.83 6.90 6.7712. GDP (Constant Factor Cost) 3.7 1.7 3.07 3.04 3.67Source: Pakistan Bureau of Statistics P : Provisional, R : Revised, - : Included in Small Scale Commodity Producing Sector
The commodity producing sector (CPS) comprises of agriculture and industry. It is the most important sector of the economy, with relatively stronger forward and backward linkages for economic development and prosperity of the country. It accounted for 46.5 percent of GDP during the outgoing fiscal year. This is a decline from 49.1 percent of GDP in 2001-02, indicating that the share of the non-commodity producing sector has increased. The commodity producing sector has performed much better in outgoing fiscal year compared to last year; its growth rate this year was 3.28 percent against only 1.47 percent in last year. The recovery in both agriculture and industrial sector, though moderate, has helped to achieve this level. However, the growth of the commodity producing sector remained far below its potential due to largely unforeseen climatic factors.
Agriculture Sector
Agriculture is a key sector of the economy. It provides food items and raw materials for industrial units and accounts for 21 percent of GDP, 45 percent of employment and 60 percent of exports. In the inevitable process of structural transformation its share shrank to 21.1 percent in fiscal year 2011-12 compared to 24.1 percent ten years earlier in 2001-02. Despite its declining share, it is the single largest sector of Pakistan’s economy. Moreover, an overwhelming majority of the population depends directly or indirectly on income generated by this sector. The agriculture sector has strong backward and forward linkages. As a result its growth has a larger impact on the overall economic performance. The performance of the agriculture sector remained weak due to recent catastrophic floods.
However, the government’s supportive polices in this sector resulted in a growth of 3.13 percent

Pakistan Economic Survey 2011-12
6
against the growth of 2.38 percent last year and 0.62 percent in fiscal year 2009-10. The improved performance is mainly attributed to a sharp pick-up in the production of rice; cotton, and sugarcane. Livestock also registered a significant growth. The agriculture sector consists of various sub-sectors which include crops, livestock, fisheries and forestry. The crop sub-sector is further divided into major crops, namely, wheat, cotton, rice, sugarcane, maize and gram and minor crops namely, pulses, potatoes, onions, chilies and garlic etc.
Major Crops: Major crops account for 31.87 of agricultural value added and registered an accelerating growth of 3.18 percent compared to a negative growth of 0.23 percent last year and -2.28 percent in fiscal year 2009-10. The major crops including cotton, sugarcane and rice witnessed growth in production of 18.6 percent, 4.9 percent and 27.7 percent respectively. However, wheat registered a negative growth of -6.7 percent. The main reason for the negative growth of wheat is the 2.6 percent decline in area under cultivation. In lower Sindh, in particular, sowing was delayed mainly because of late receding rain water which resulted in a decline in both the acreage as well as the yields. Moreover, in Punjab also the extended fog season delayed the planting of seed beyond the optimal period. The other major crops bajra, jowar, maize, sesamim, gram, barley, rapeseed and mustard and tobacco showed mixed trends but their share in the overall sector is small.
Minor Crops: Minor crops contributed 10.11 percent to value addition in overall agriculture. Production in this sub-sector declined by -1.26 percent. This negative growth is far below the 2.68 percent positive growth last year. The main reason for this negative growth of minor crops is the heavy flood in Sindh and Balochistan provinces. The growth of pulses is estimated at -3.50 percent, vegetables -10.0 percent, chilies -78.4 percent, onion -15.4 percent and oil seeds -26.9 percent.
Livestock: Global integration, rising income and living standards as well as changing dietary patterns across regions have brought a paradigm structural shift. This shift is visible in Pakistan also. The share of livestock in agriculture has increased to 55 percent. Livestock includes cattle,
buffalos, sheep, goat, camel, horses, asses, mules and poultry and their products. The demand for livestock has grown at a phenomenal pace. The increase in prices has provided incentive for greater production and spurred growth. The importance of this sector may be recognized by the fact that the majority of people living in rural areas depend directly or indirectly on the livestock and dairy sector. This sub-sector is highly labour intensive. It has also emerged as a major source of income for the small farmers as well as the landless rural poor.
Livestock has witnessed a marginally higher growth of 4.04 percent against the growth of 3.97 percent last year. The production of milk, poultry products and other livestock items has increased at the rate of 3.3 percent, 7.1 percent and 2.24 percent respectively.
Fisheries: The fisheries sector witnessed a growth of 1.78 percent against the growth of 1.94 percent last year. Components of fisheries such as marine fishing and in-land fishing, contributed to an overall increase in value addition in the fisheries sub-sector. The gross value addition of marine fish increased by 1.35 percent and that of inland fish by 1.96 percent.
Forestry: The growth of the forestry sub-sector is recorded at 0.95 percent as compared to the contraction of -0.40 percent last year. Forests are a key component of our environment and degradation of forests can pose severe socio-economic challenges for the coming generations. The main components of forestry, timber and fire wood, grew at 0.90 percent and 0.46 percent respectively.
Manufacturing Sector: The manufacturing sector contributes much to the progress of our economy. The manufacturing sector has remained under stress for the last several years, due to energy shortages, poor law and order situation. The heavy floods also depressed the supply chain and affected market demand. The share of the manufacturing sector in GDP was 17.7 percent in 2001-02. This has increased in 2011-12 to 18.6 percent of GDP. The manufacturing sector has been hard hit by international and domestic factors, which caused the slowing down of its output. The growth of the
Growth and Stabilization
7
manufacturing sector was 3.56 percent compared to the growth of 3.06 percent last year.
Manufacturing has three main sub-components; namely the Large-Scale Manufacturing (LSM), Small Scale Manufacturing and Slaughtering. Small scale manufacturing maintained its growth of last year at 7.51 percent and slaughtering growth is estimated at 4.46 percent against 4.38 percent last year. Large Scale Manufacturing (LSM) has also witnessed a slight improvement. It has shown a growth of 1.78 percent against the growth of 1.15 percent last year. The major LSM industries which registered notable growth include; refrigerators 7.56 percent, sugar 27.09 percent, beverages 10.60 percent, liquid/syrup 15.93 percent, injection 6.53 percent, soaps and detergents 8.15 percent, buses 25.0 percent, electric bulbs 15.02 percent, electric transformers 27.72 percent etc. On the whole 38 major industries group recorded positive growth. The industries which reported negative growth include; cooking oil -1.61 percent, motor tyres -25.73 percent, T.V. sets -22.19 percent and deepfreezers -49.47 percent etc.
Construction Sector: The construction sector has shown 6.46 percent growth as compared to negative growth of -7.09 percent in last year. The increase in growth is due to rapid execution of work on the rehabilitation of the flood affected areas, increased investment in small scale construction and rapid implementation of PSDP schemes which are near completion.
Mining and Quarrying: Extraction of minerals and ores through efficient mining and quarrying provides convenient and economical access to raw materials and a competitive edge to the country. The mining and quarrying sector recorded positive growth of 4.38 percent during the year 2011-12 against the negative growth of -1.28 percent last year. The contribution of this sector in GDP has expanded remarkably and now accounts for 9.45 percent of the industrial value addition. The output of chromite, bauxite, gypsum, chalk and fluoride increased by 591.54 percent, 82.15 percent, 24.43 percent, 82.18 percent and 111.28 percent respectively. This growth was also made possible in some part due to the increase in natural gas production. The extraction of bentonite, however, registered substantial decline of -47.82 percent.
Much of the country’s mining reserves exist in remote areas. Infrastructure improvements are necessary to sustain and achieve higher growth rates in future. Improvement in the security situation in the country would also lead to greater production.
Services Sector:
The importance of the services sector has been recognized all over the world. This sector has emerged as the main driver of economic growth. The services sector also plays a vital role in sustaining economic activities in Pakistan. The economy has gone through a major transformation in its economic structure. The share of the services sector has increased to 53.5 percent in 2011-12. In developed countries the share of services sector in GDP is around 75 percent. This share is 65 percent in Singapore, 52 percent in India and 42 percent in Indonesia.
The services sector consists of the following sub-sectors: Transport, Storage and Communication; Wholesale and Retail Trade; Finance and Insurance; Ownership of Dwellings; Public Administration and Defense; and Social Services. The Services sector has registered a growth rate of 4.02 percent in 2011-12. This performance is dominated by Finance and Insurance at 6.53 percent, Social and Community Services 6.77 percent and Wholesale and Retail Trade 3.58 percent. The contribution of transport, storage and communication is estimated at 1.25 percent. The recovery in agriculture and industry have resulted a positive impact on the performance of the whole sale and retail trade. Our services sector has a great potential to grow at a rapid pace. In order to develop the services sector, Pakistan has recognized the needs to liberalize operating rights and has separated regulators from operators.
Finance and Insurance Sector: The finance and insurance sector comprises the State Bank of Pakistan; all scheduled banks (domestic and foreign), Development Financial Institutions (DFIs), all insurance (life and general) companies, Modaraba/Leasing companies, Money Changers and stock exchange brokers. The financial sub-sector consists of all resident corporations principally engaged in financial intermediations or

Pakistan Economic Survey 2011-12
8
in auxiliary financial activities related to financial intermediation. Pakistan’s financial sector is integrated with the world economy and this is reflected in its performance. Finance and Insurance sector recorded positive growth of 6.53 percent in 2011-12 as against contraction of -1.41 percent last year.
Transport, Storage and Communication: The role of Transport, Storage and Communication (TS&C) sector is very important in boosting the economic activities of the country. The current global economic crisis and the level of integration of these sub-sectors in the globalized economy including the presence of multi national enterprises (MNEs) in the markets of all countries of the world puts a greater need for major investments in physical and qualitative terms to meet expected demand. Information and Communication Technologies (ICTs) are perhaps the most critical tool for a dynamic and flexible services sector. The TS&C sub-sector grew at 1.25 percent as compared to 0.87 percent last year. Water Transport has declined by -3.14 percent during 2011-12, and Air Transport by a massive -27.93 percent. Sub-sectors that showed a positive growth are; pipeline transport 34.64 percent, road transport 2.88 percent, storage 2.10 percent and communication 0.93 percent.
Wholesale and Retail Trade Sector: The wholesale and retail trade sector is based on the margins taken by traders on the transaction of commodities traded. In 2011-12, this sector grew at 3.58 percent as compared to 3.53 percent in the last year.
Public Administration and Defense: Public Administration and Defense posted a growth of 2.61 percent as compared to 14.17 percent last
year. The positive change in the wage component of public sector employees, and an increase in defense and security related expenditures were largely responsible for this growth.
Ownership of Dwellings: Ownership of Dwellings has recorded a growth of 3.51 percent during the year 2011-12 compared to 1.79 percent last year. Social Services grew by 6.77 percent against the last year’s growth of 6.90 percent. The rise in the growth of Ownership of Dwelling and social services is mainly due to the fast track work on reconstruction and rehabilitation of flood affected areas by government, NGOs and private sectors.
Contribution to Real GDP Growth (Production Approach)
As in previous years the improvements in economic growth in the fiscal year 2011-12 came mainly from the services sector. The services sector contributed 58.58 percent to overall economic growth; while the commodity producing sector (CPS) contributed only 41.4 percent. The agriculture sector contributed 17.98 percent to economic growth compared to 23.43 percent contribution by the industrial sector.
The overall growth of 3.67 percent is shared between the Commodity producing sector and Services sector. Within the commodity producing sector, agriculture contributed 0.66 percentage points to overall GDP growth, while industry contributed 0.86 percentage points. The services sector contributed the remaining 2.15 percentage points. The percentage share of agriculture, manufacturing and services in overall growth was 17.98 percent, 23.43 percent and 58.58 percent respectively. The sectoral contribution to the GDP growth is shown below in Table-1.3.
Table 1.3: Sectoral Contribution to the GDP growth (% Points) Sector 2007-08 2008-09 2009-10 2010-11 2011-12 Agriculture 0.23 0.86 0.13 0.50 0.66Industry 0.38 -0.03 1.57 0.18 0.86- Manufacturing 0.92 -0.69 0.10 0.57 0.66Services 3.08 0.89 1.37 2.36 2.15Real GDP (Fc) 3.68 1.72 3.07 3.04 3.67Source: Pakistan Bureau of Statistics
Growth and Stabilization
9
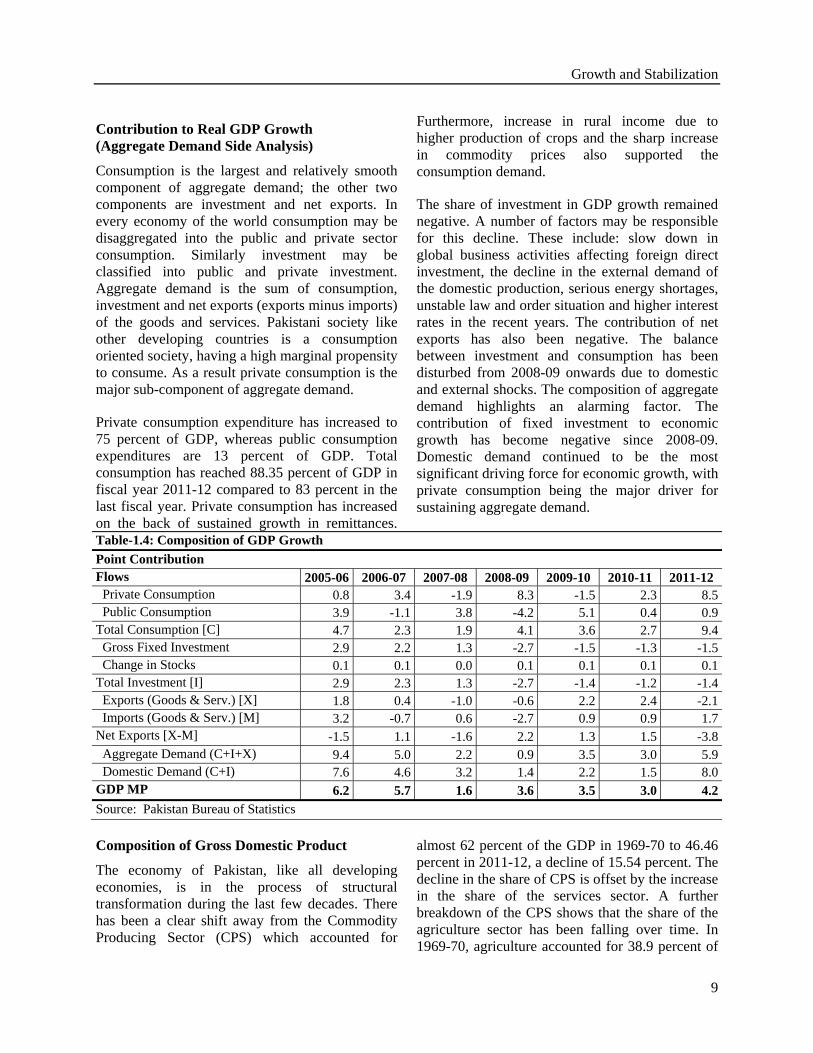
Contribution to Real GDP Growth (Aggregate Demand Side Analysis)
Consumption is the largest and relatively smooth component of aggregate demand; the other two components are investment and net exports. In every economy of the world consumption may be disaggregated into the public and private sector consumption. Similarly investment may be classified into public and private investment. Aggregate demand is the sum of consumption, investment and net exports (exports minus imports) of the goods and services. Pakistani society like other developing countries is a consumption oriented society, having a high marginal propensity to consume. As a result private consumption is the major sub-component of aggregate demand.
Private consumption expenditure has increased to 75 percent of GDP, whereas public consumption expenditures are 13 percent of GDP. Total consumption has reached 88.35 percent of GDP in fiscal year 2011-12 compared to 83 percent in the last fiscal year. Private consumption has increased on the back of sustained growth in remittances.
Furthermore, increase in rural income due to higher production of crops and the sharp increase in commodity prices also supported the consumption demand.
The share of investment in GDP growth remained negative. A number of factors may be responsible for this decline. These include: slow down in global business activities affecting foreign direct investment, the decline in the external demand of the domestic production, serious energy shortages, unstable law and order situation and higher interest rates in the recent years. The contribution of net exports has also been negative. The balance between investment and consumption has been disturbed from 2008-09 onwards due to domestic and external shocks. The composition of aggregate demand highlights an alarming factor. The contribution of fixed investment to economic growth has become negative since 2008-09. Domestic demand continued to be the most significant driving force for economic growth, with private consumption being the major driver for sustaining aggregate demand.
Table-1.4: Composition of GDP Growth Point Contribution Flows 2005-06 2006-07 2007-08 2008-09 2009-10 2010-11 2011-12 Private Consumption 0.8 3.4 -1.9 8.3 -1.5 2.3 8.5 Public Consumption 3.9 -1.1 3.8 -4.2 5.1 0.4 0.9Total Consumption [C] 4.7 2.3 1.9 4.1 3.6 2.7 9.4 Gross Fixed Investment 2.9 2.2 1.3 -2.7 -1.5 -1.3 -1.5 Change in Stocks 0.1 0.1 0.0 0.1 0.1 0.1 0.1Total Investment [I] 2.9 2.3 1.3 -2.7 -1.4 -1.2 -1.4 Exports (Goods & Serv.) [X] 1.8 0.4 -1.0 -0.6 2.2 2.4 -2.1 Imports (Goods & Serv.) [M] 3.2 -0.7 0.6 -2.7 0.9 0.9 1.7Net Exports [X-M] -1.5 1.1 -1.6 2.2 1.3 1.5 -3.8 Aggregate Demand (C+I+X) 9.4 5.0 2.2 0.9 3.5 3.0 5.9 Domestic Demand (C+I) 7.6 4.6 3.2 1.4 2.2 1.5 8.0GDP MP 6.2 5.7 1.6 3.6 3.5 3.0 4.2Source: Pakistan Bureau of Statistics Composition of Gross Domestic Product
The economy of Pakistan, like all developing economies, is in the process of structural transformation during the last few decades. There has been a clear shift away from the Commodity Producing Sector (CPS) which accounted for
almost 62 percent of the GDP in 1969-70 to 46.46 percent in 2011-12, a decline of 15.54 percent. The decline in the share of CPS is offset by the increase in the share of the services sector. A further breakdown of the CPS shows that the share of the agriculture sector has been falling over time. In 1969-70, agriculture accounted for 38.9 percent of
Pakistan Economic Survey 2011-12
10
GDP. This has gradually declined to 21.1 percent in 2011-12. The decline in the share of agriculture in GDP indicates that the non-agriculture sectors grew more quickly as compared to the agriculture sector.
Scientific development and revolutionary innovations in the business climate have encouraged the manufacturing and services sectors more than the agriculture sector. Structural, social and cultural problems of the agriculture sector, the higher risk and vulnerability to natural calamities have encouraged investors to switch to the non-agriculture sectors. The contribution of agriculture to overall GDP will continue to decline as
development takes place. This is an inevitable consequence of the process of growth and development.
It has been observed during the last two decades that the major momentum to economic growth has come from the services sector which has emerged as the main driver of the economic growth. Within the services sector, almost all the sub-sectors have increasing contributions. The share of manufacturing in GDP has remained stagnant, at around 14.7 percent, for 30 years until 1999-2000. Its contribution to GDP has increased after 1999-2000 from 14.7 percent to 18.65 percent in 2011-12.
Table 1.5: Sectoral Share in Gross Domestic Product (GDP)
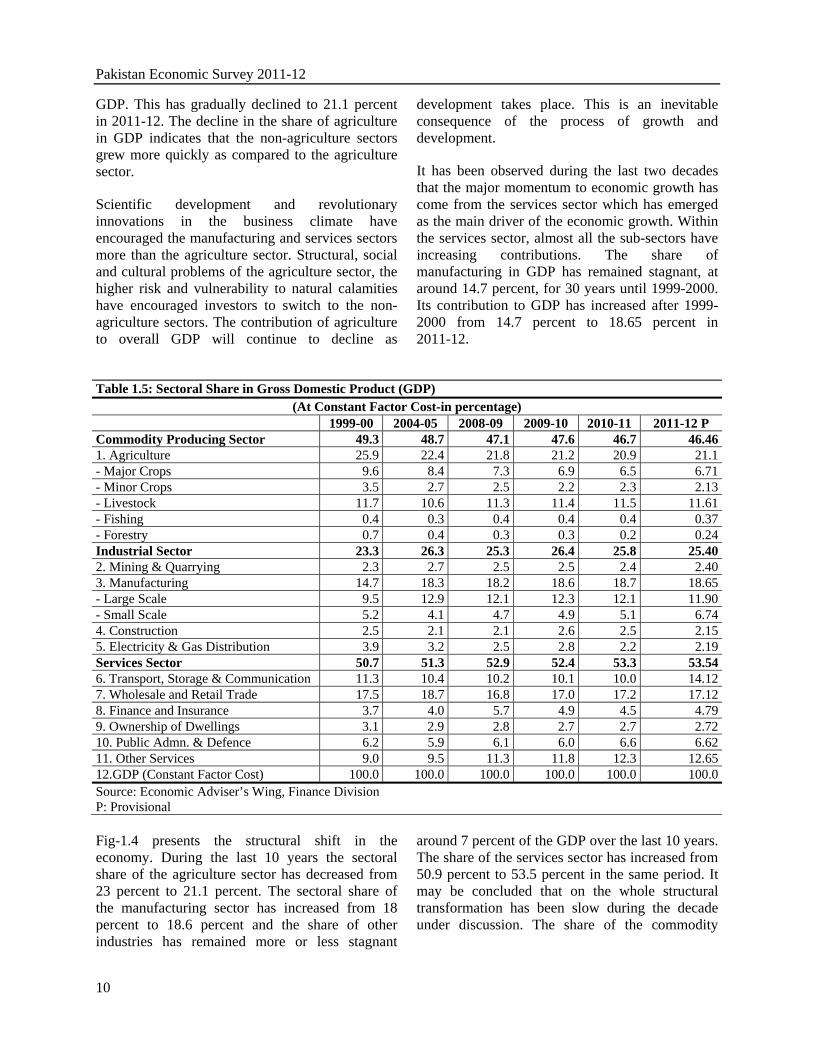
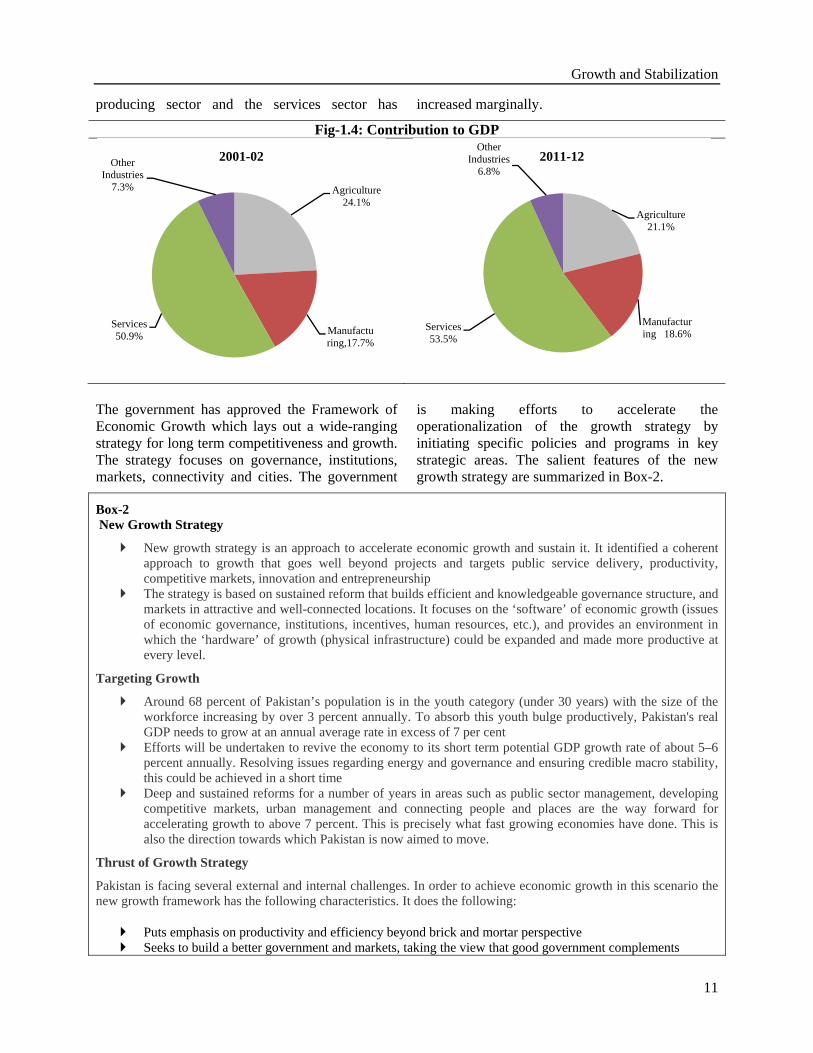
(At Constant Factor Cost-in percentage) 1999-00 2004-05 2008-09 2009-10 2010-11 2011-12 P Commodity Producing Sector 49.3 48.7 47.1 47.6 46.7 46.461. Agriculture 25.9 22.4 21.8 21.2 20.9 21.1- Major Crops 9.6 8.4 7.3 6.9 6.5 6.71- Minor Crops 3.5 2.7 2.5 2.2 2.3 2.13- Livestock 11.7 10.6 11.3 11.4 11.5 11.61- Fishing 0.4 0.3 0.4 0.4 0.4 0.37- Forestry 0.7 0.4 0.3 0.3 0.2 0.24Industrial Sector 23.3 26.3 25.3 26.4 25.8 25.402. Mining & Quarrying 2.3 2.7 2.5 2.5 2.4 2.403. Manufacturing 14.7 18.3 18.2 18.6 18.7 18.65- Large Scale 9.5 12.9 12.1 12.3 12.1 11.90- Small Scale 5.2 4.1 4.7 4.9 5.1 6.744. Construction 2.5 2.1 2.1 2.6 2.5 2.155. Electricity & Gas Distribution 3.9 3.2 2.5 2.8 2.2 2.19Services Sector 50.7 51.3 52.9 52.4 53.3 53.546. Transport, Storage & Communication 11.3 10.4 10.2 10.1 10.0 14.127. Wholesale and Retail Trade 17.5 18.7 16.8 17.0 17.2 17.128. Finance and Insurance 3.7 4.0 5.7 4.9 4.5 4.799. Ownership of Dwellings 3.1 2.9 2.8 2.7 2.7 2.7210. Public Admn. & Defence 6.2 5.9 6.1 6.0 6.6 6.6211. Other Services 9.0 9.5 11.3 11.8 12.3 12.6512.GDP (Constant Factor Cost) 100.0 100.0 100.0 100.0 100.0 100.0Source: Economic Adviser’s Wing, Finance Division P: Provisional Fig-1.4 presents the structural shift in the economy. During the last 10 years the sectoral share of the agriculture sector has decreased from 23 percent to 21.1 percent. The sectoral share of the manufacturing sector has increased from 18 percent to 18.6 percent and the share of other industries has remained more or less stagnant
around 7 percent of the GDP over the last 10 years. The share of the services sector has increased from 50.9 percent to 53.5 percent in the same period. It may be concluded that on the whole structural transformation has been slow during the decade under discussion. The share of the commodity
Growth and Stabilization
11
producing sector and the services sector has increased marginally.
Fig-1.4: Contribution to GDP
The government has approved the Framework of Economic Growth which lays out a wide-ranging strategy for long term competitiveness and growth. The strategy focuses on governance, institutions, markets, connectivity and cities. The government
is making efforts to accelerate the operationalization of the growth strategy by initiating specific policies and programs in key strategic areas. The salient features of the new growth strategy are summarized in Box-2.
Box-2 New Growth Strategy
New growth strategy is an approach to accelerate economic growth and sustain it. It identified a coherent approach to growth that goes well beyond projects and targets public service delivery, productivity, competitive markets, innovation and entrepreneurship
The strategy is based on sustained reform that builds efficient and knowledgeable governance structure, and markets in attractive and well-connected locations. It focuses on the ‘software’ of economic growth (issues of economic governance, institutions, incentives, human resources, etc.), and provides an environment in which the ‘hardware’ of growth (physical infrastructure) could be expanded and made more productive at every level.
Targeting Growth
Around 68 percent of Pakistan’s population is in the youth category (under 30 years) with the size of the workforce increasing by over 3 percent annually. To absorb this youth bulge productively, Pakistan's real GDP needs to grow at an annual average rate in excess of 7 per cent
Efforts will be undertaken to revive the economy to its short term potential GDP growth rate of about 5–6 percent annually. Resolving issues regarding energy and governance and ensuring credible macro stability, this could be achieved in a short time
Deep and sustained reforms for a number of years in areas such as public sector management, developing competitive markets, urban management and connecting people and places are the way forward for accelerating growth to above 7 percent. This is precisely what fast growing economies have done. This is also the direction towards which Pakistan is now aimed to move.
Thrust of Growth Strategy
Pakistan is facing several external and internal challenges. In order to achieve economic growth in this scenario the new growth framework has the following characteristics. It does the following:
Puts emphasis on productivity and efficiency beyond brick and mortar perspective Seeks to build a better government and markets, taking the view that good government complements
Agriculture 24.1%
Manufacturing,17.7%
Services 50.9%
Other Industries
7.3%
2001-02
Agriculture 21.1%
Manufacturing 18.6%
Services 53.5%
Other Industries
6.8%2011-12
Pakistan Economic Survey 2011-12
12
efficient, competitive and connected markets Recognizes that economic well-being is a result of the variety and frequency of economic transactions.
Policy, law and regulation must seek to minimize transaction costs and allow speedy and frequent transactions.
Focuses on urban development as a crucible for the nurturing of innovation entrepreneurship and productivity
Includes youth through community development and the provision of market opportunities while continuing to impart skills and education.
Source: Planning and Development Division
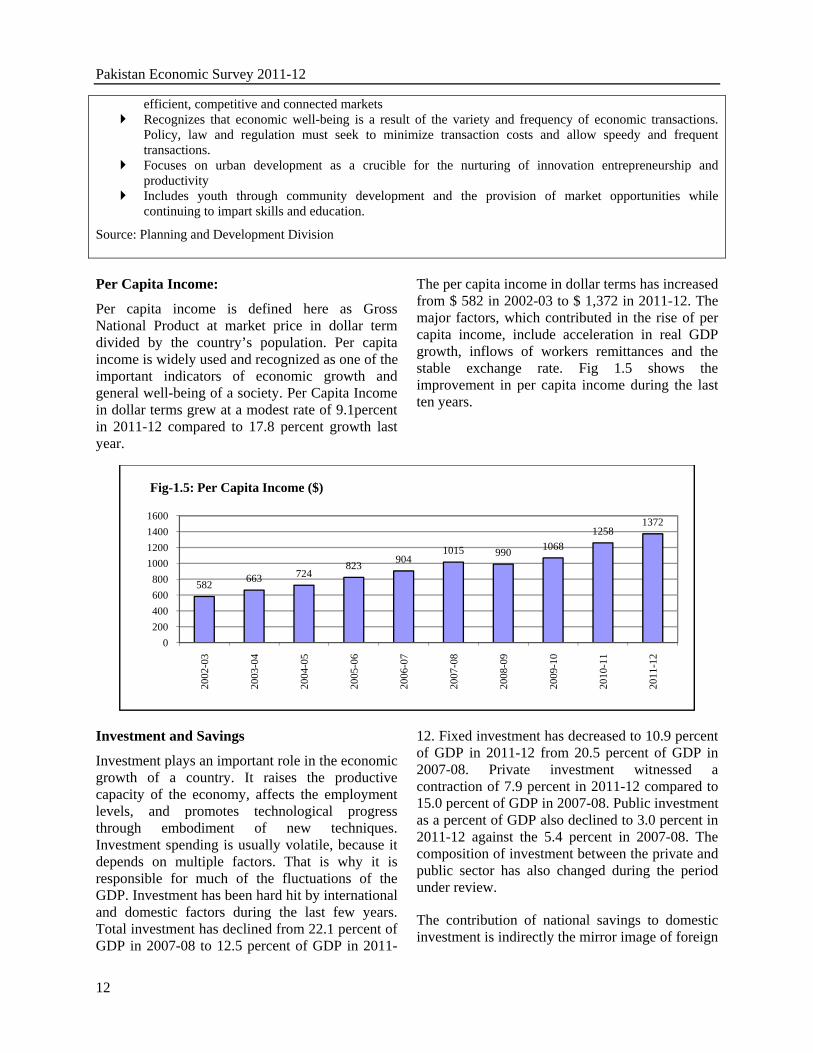
Per Capita Income:
Per capita income is defined here as Gross National Product at market price in dollar term divided by the country’s population. Per capita income is widely used and recognized as one of the important indicators of economic growth and general well-being of a society. Per Capita Income in dollar terms grew at a modest rate of 9.1percent in 2011-12 compared to 17.8 percent growth last year.
The per capita income in dollar terms has increased from $ 582 in 2002-03 to $ 1,372 in 2011-12. The major factors, which contributed in the rise of per capita income, include acceleration in real GDP growth, inflows of workers remittances and the stable exchange rate. Fig 1.5 shows the improvement in per capita income during the last ten years.
Investment and Savings
Investment plays an important role in the economic growth of a country. It raises the productive capacity of the economy, affects the employment levels, and promotes technological progress through embodiment of new techniques. Investment spending is usually volatile, because it depends on multiple factors. That is why it is responsible for much of the fluctuations of the GDP. Investment has been hard hit by international and domestic factors during the last few years. Total investment has declined from 22.1 percent of GDP in 2007-08 to 12.5 percent of GDP in 2011-
12. Fixed investment has decreased to 10.9 percent of GDP in 2011-12 from 20.5 percent of GDP in 2007-08. Private investment witnessed a contraction of 7.9 percent in 2011-12 compared to 15.0 percent of GDP in 2007-08. Public investment as a percent of GDP also declined to 3.0 percent in 2011-12 against the 5.4 percent in 2007-08. The composition of investment between the private and public sector has also changed during the period under review.
The contribution of national savings to domestic investment is indirectly the mirror image of foreign
582 663 724823 904
1015 990 10681258
1372
0200400600800
1000120014001600
2002
-03
2003
-04
2004
-05
2005
-06
2006
-07
2007
-08
2008
-09
2009
-10
2010
-11
2011
-12
Fig-1.5: Per Capita Income ($)
Growth and Stabilization
13
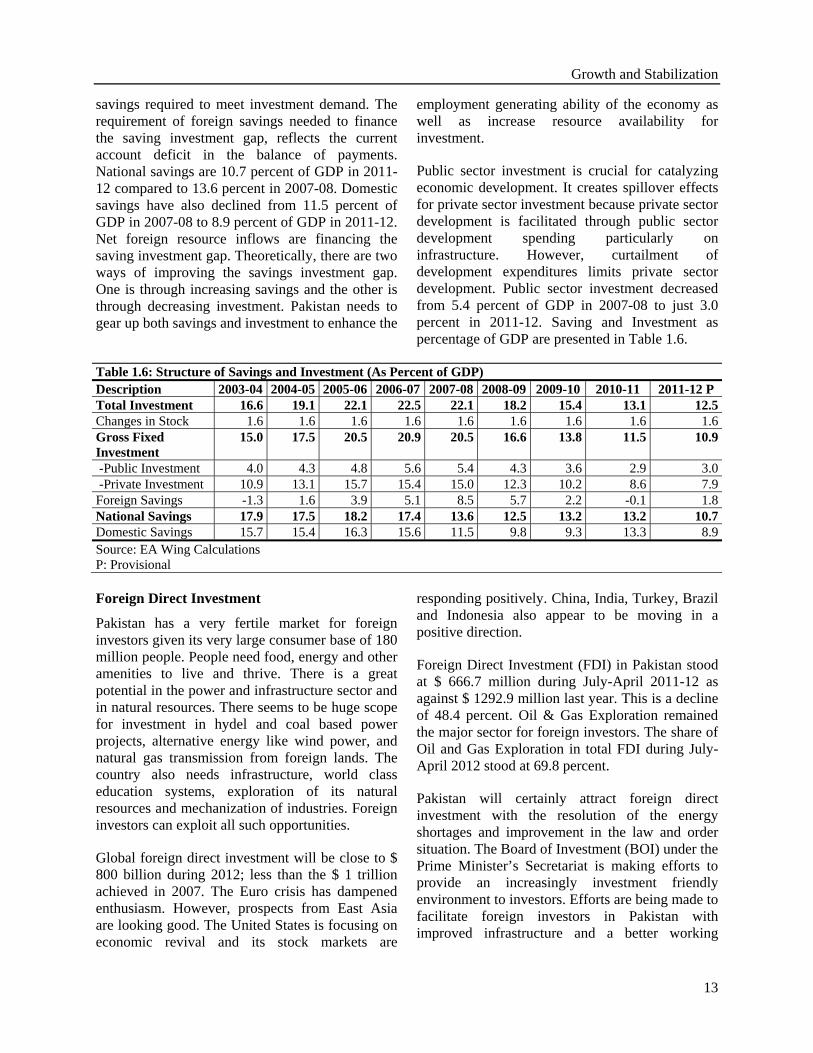
savings required to meet investment demand. The requirement of foreign savings needed to finance the saving investment gap, reflects the current account deficit in the balance of payments. National savings are 10.7 percent of GDP in 2011-12 compared to 13.6 percent in 2007-08. Domestic savings have also declined from 11.5 percent of GDP in 2007-08 to 8.9 percent of GDP in 2011-12. Net foreign resource inflows are financing the saving investment gap. Theoretically, there are two ways of improving the savings investment gap. One is through increasing savings and the other is through decreasing investment. Pakistan needs to gear up both savings and investment to enhance the
employment generating ability of the economy as well as increase resource availability for investment.
Public sector investment is crucial for catalyzing economic development. It creates spillover effects for private sector investment because private sector development is facilitated through public sector development spending particularly on infrastructure. However, curtailment of development expenditures limits private sector development. Public sector investment decreased from 5.4 percent of GDP in 2007-08 to just 3.0 percent in 2011-12. Saving and Investment as percentage of GDP are presented in Table 1.6.
Table 1.6: Structure of Savings and Investment (As Percent of GDP) Description 2003-04 2004-05 2005-06 2006-07 2007-08 2008-09 2009-10 2010-11 2011-12 P Total Investment 16.6 19.1 22.1 22.5 22.1 18.2 15.4 13.1 12.5Changes in Stock 1.6 1.6 1.6 1.6 1.6 1.6 1.6 1.6 1.6Gross Fixed Investment
15.0 17.5 20.5 20.9 20.5 16.6 13.8 11.5 10.9
-Public Investment 4.0 4.3 4.8 5.6 5.4 4.3 3.6 2.9 3.0 -Private Investment 10.9 13.1 15.7 15.4 15.0 12.3 10.2 8.6 7.9Foreign Savings -1.3 1.6 3.9 5.1 8.5 5.7 2.2 -0.1 1.8National Savings 17.9 17.5 18.2 17.4 13.6 12.5 13.2 13.2 10.7Domestic Savings 15.7 15.4 16.3 15.6 11.5 9.8 9.3 13.3 8.9Source: EA Wing Calculations P: Provisional Foreign Direct Investment
Pakistan has a very fertile market for foreign investors given its very large consumer base of 180 million people. People need food, energy and other amenities to live and thrive. There is a great potential in the power and infrastructure sector and in natural resources. There seems to be huge scope for investment in hydel and coal based power projects, alternative energy like wind power, and natural gas transmission from foreign lands. The country also needs infrastructure, world class education systems, exploration of its natural resources and mechanization of industries. Foreign investors can exploit all such opportunities.
Global foreign direct investment will be close to $ 800 billion during 2012; less than the $ 1 trillion achieved in 2007. The Euro crisis has dampened enthusiasm. However, prospects from East Asia are looking good. The United States is focusing on economic revival and its stock markets are
responding positively. China, India, Turkey, Brazil and Indonesia also appear to be moving in a positive direction.
Foreign Direct Investment (FDI) in Pakistan stood at $ 666.7 million during July-April 2011-12 as against $ 1292.9 million last year. This is a decline of 48.4 percent. Oil & Gas Exploration remained the major sector for foreign investors. The share of Oil and Gas Exploration in total FDI during July-April 2012 stood at 69.8 percent.
Pakistan will certainly attract foreign direct investment with the resolution of the energy shortages and improvement in the law and order situation. The Board of Investment (BOI) under the Prime Minister’s Secretariat is making efforts to provide an increasingly investment friendly environment to investors. Efforts are being made to facilitate foreign investors in Pakistan with improved infrastructure and a better working
Pakistan Economic Survey 2011-12
14
environment so that the favorable business climate may induce investors to initiate new investment projects. In particular, efforts are also going on to encourage the setting up of fruit processing industries and more export processing zones in the country, so that sustained high economic growth through exports may be achieved.
Workers Remittances
Remittances from overseas Pakistanis have been an important source of foreign exchange during the last four years. These have not only provided critical support to the balance of payments but have helped in stimulating the domestic economy and helped to alleviate poverty. Significant flows of remittances also helped Pakistan to partially counter the adverse effects of the oil price shocks, reduce the unemployment problem, and improve
the standard of living of recipient households.
The upsurge in the remittances may be attributed to the government’s efforts for redirecting these flows from informal to formal channels. Bilateral arrangements of commercial banks with foreign entities under Pakistan Remittance Initiatives (PRI) have helped facilitate movement in this direction. Furthermore, initiatives under the PRI such as introduced Xpress money, Inter bank Fund Transfer (IBFT) facility have also helped to improve the remittance flow to Pakistan. Increase in remittances is also the result of the higher demand of Pakistani workers. An overview of country wise remittances is presented in Table 1.7.
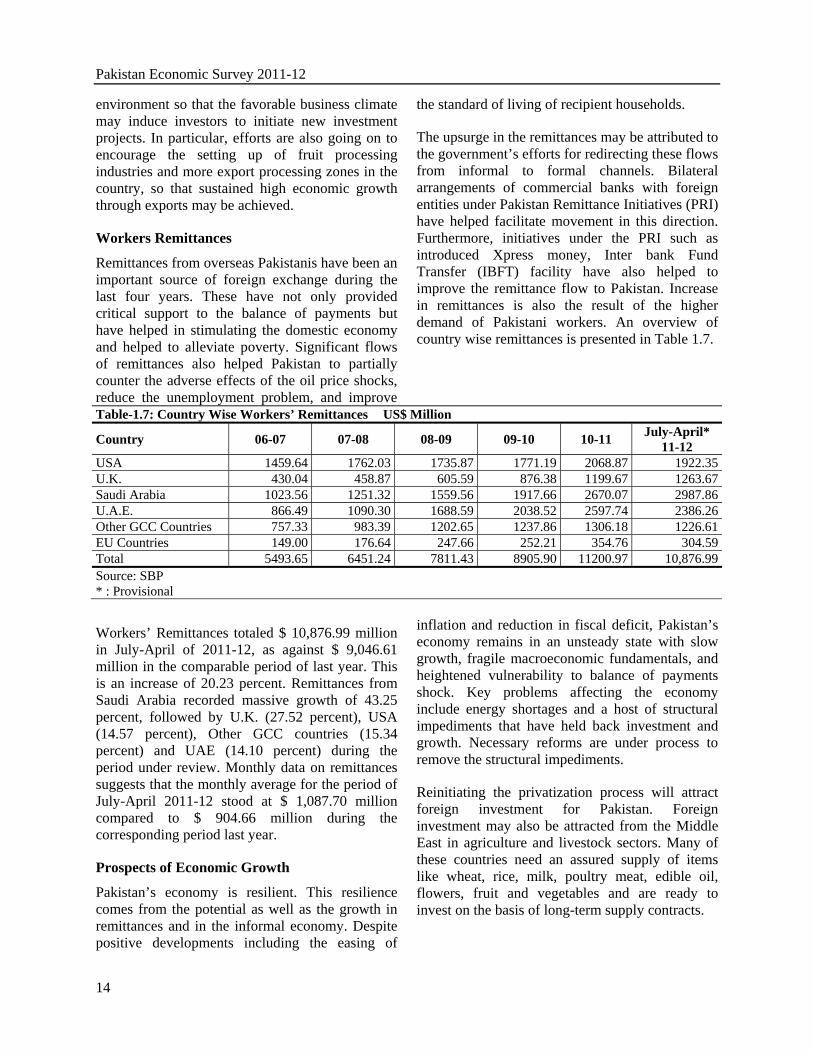
Table-1.7: Country Wise Workers’ Remittances US$ Million
Country 06-07 07-08 08-09 09-10 10-11 July-April* 11-12
USA 1459.64 1762.03 1735.87 1771.19 2068.87 1922.35U.K. 430.04 458.87 605.59 876.38 1199.67 1263.67Saudi Arabia 1023.56 1251.32 1559.56 1917.66 2670.07 2987.86U.A.E. 866.49 1090.30 1688.59 2038.52 2597.74 2386.26Other GCC Countries 757.33 983.39 1202.65 1237.86 1306.18 1226.61EU Countries 149.00 176.64 247.66 252.21 354.76 304.59Total 5493.65 6451.24 7811.43 8905.90 11200.97 10,876.99Source: SBP * : Provisional
Workers’ Remittances totaled $ 10,876.99 million in July-April of 2011-12, as against $ 9,046.61 million in the comparable period of last year. This is an increase of 20.23 percent. Remittances from Saudi Arabia recorded massive growth of 43.25 percent, followed by U.K. (27.52 percent), USA (14.57 percent), Other GCC countries (15.34 percent) and UAE (14.10 percent) during the period under review. Monthly data on remittances suggests that the monthly average for the period of July-April 2011-12 stood at $ 1,087.70 million compared to $ 904.66 million during the corresponding period last year.
Prospects of Economic Growth
Pakistan’s economy is resilient. This resilience comes from the potential as well as the growth in remittances and in the informal economy. Despite positive developments including the easing of
inflation and reduction in fiscal deficit, Pakistan’s economy remains in an unsteady state with slow growth, fragile macroeconomic fundamentals, and heightened vulnerability to balance of payments shock. Key problems affecting the economy include energy shortages and a host of structural impediments that have held back investment and growth. Necessary reforms are under process to remove the structural impediments.
Reinitiating the privatization process will attract foreign investment for Pakistan. Foreign investment may also be attracted from the Middle East in agriculture and livestock sectors. Many of these countries need an assured supply of items like wheat, rice, milk, poultry meat, edible oil, flowers, fruit and vegetables and are ready to invest on the basis of long-term supply contracts.
Growth and Stabilization
15
Savings are the mover of growth. Policies are being implemented which give savings incentives such as, tax breaks and compulsory savings in employee provident funds. The government is aware that several long term savings instruments may need to be developed to increase household savings. There is also need to expand the network of National Savings Schemes, microfinance institutions, banks and postal savings to far flung areas of the country. These have been and are the focus of the government’s attention.
Measures to stimulate growth will not yield full potential unless the structural weaknesses responsible for the decline in the investment are addressed. This decline is due largely to the unstable security situation. The shortage and high cost of energy, and the rising cost of doing business in Pakistan are also contributing to the decline. The government is making efforts to address these negative factors in order to improve investment climate in the country.
Pakistan’s middle class has expanded and is currently estimated at 35 percent of the population. Having substantial size and composition primarily urban and associated with professional white-collar
occupations the middle class may play a major role in boosting economic growth. A vibrant middle class not only generates demand of goods and services but also the savings required to fund productive investments. Moreover, the middle class households provide a breeding ground for the professional and skilled labour force. Such human capital is essential for growth in the long run. With the existence of such a vibrant middle class the consumer goods industry can provide a strong impetus to economic growth. Despite an overall slump in the economy, the consumer goods industry in Pakistan has registered a steady growth and has a great potential for further expansion.
There is rising trend of youth entrepreneurship in Pakistan. Many young entrepreneurs have succeeded in establishing various businesses that are booming. This has produced a strong demonstration effect for others to follow. These young entrepreneurs have the potential to cause a paradigm shift in the economic fortunes of Pakistan. The opening up of trade with India is another major initiative that can boost economic growth by providing greater market access as well as easy and cheaper availability of raw materials for domestic producers.

TABLE 1.1
(Rs million)`
Sectors 2003-04 2004-05 2005-06 2006-07 2007-08 2008-09 2009-10 2010-11 2011-12 2010-11/ 2011-12/R P 2009-10 2010-11
A. COMMODITY PRODUCING SECTOR 2,041,661 2,234,671 2,348,925 2,504,569 2,535,968 2,580,671 2,672,521 2,711,746 2,800,657 1.5 3.31 Agriculture 964,853 1,027,403 1,092,098 1,137,037 1,148,851 1,195,002 1,202,411 1,230,978 1,269,491 2.4 3.1
Major Crops 327,057 385,058 370,005 398,617 373,188 402,135 392,983 392,096 404,577 -0.2 3.2 Minor Crops 124,121 125,993 126,457 125,243 138,887 137,201 126,609 129,999 128,360 2.7 -1.3 Livestock 473,771 484,876 561,500 577,400 601,408 620,253 646,783 672,486 699,629 4.0 4.0 Fishing 13,611 13,691 16,540 19,080 20,834 21,319 21,632 22,051 22,443 1.9 1.8 Forestry 26,293 17,785 17,596 16,697 14,534 14,094 14,404 14,346 14,482 -0.4 0.9
A1. INDUSTRIAL SECTOR 1,076,808 1,207,268 1,256,827 1,367,532 1,387,117 1,385,669 1,470,110 1,480,768 1,531,166 0.7 3.42 Mining & Quarrying 111,473 122,621 128,288 132,254 138,047 137,348 140,415 138,616 144,685 -1.3 4.43 Manufacturing 727,439 840,243 912,953 988,301 1,036,101 998,846 1,053,362 1,085,643 1,124,266 3.1 3.6
Large Scale 492,632 590,759 639,585 695,489 723,626 665,285 697,148 705,139 717,690 1.1 1.8 Small & Household 176,841 190,121 206,656 223,365 240,139 258,173 277,562 298,407 320,817 7.5 7.5 Slaughtering 57,966 59,363 66,712 69,447 72,336 75,388 78,652 82,097 85,759 4.4 4.5Construction 82,818 98,190 108,195 134,536 127,076 112,884 131,324 122,010 129,893 -7.1 6.5
5 Electricity and Gas Distribution 155,078 146,214 107,391 112,441 85,893 136,591 145,009 134,499 132,322 -7.2 -1.6B. SERVICES SECTOR 2,173,947 2,358,559 2,511,551 2,687,140 2,847,044 2,895,045 2,971,081 3,103,283 3,227,914 4.4 4.06 Transport, Storage & Communication 461,276 477,171 496,073 519,486 539,297 558,703 569,285 574,212 581,396 0.9 1.37 Wholesale & Retail Trade 766,693 858,695 838,426 887,294 934,231 921,375 962,739 996,722 1,032,389 3.5 3.68 Finance & Insurance 141,768 185,501 265,056 304,514 338,386 312,818 274,774 270,912 288,595 -1.4 6.59 Ownership of Dwellings 126,764 131,214 135,820 140,587 145,521 150,629 155,916 158,707 164,278 1.8 3.510 Public Admn. & Defence 267,321 268,826 295,959 316,915 320,565 332,108 340,475 388,734 398,888 14.2 2.611 Social and Community Services 410,125 437,152 480,217 518,344 569,044 619,412 667,892 713,996 762,368 6.9 6.812 GDP (fc) 4,215,608 4,593,230 4,860,476 5,191,709 5,383,012 5,475,716 5,643,602 5,815,029 6,028,571 3.0 3.713 Indirect Taxes 372,029 358,455 395,440 361,841 372,651 360,584 353,432 344,977 393,779 -2.4 14.114 Subsidies 53,488 69,889 72,545 75,602 190,288 70,830 27,074 13,582 18,682 -49.8 37.515 GDP(mp) 4,534,149 4,881,796 5,183,371 5,477,948 5,565,375 5,765,470 5,969,960 6,146,424 6,403,668 3.0 4.216 Net Factor Income from Abroad 90,721 88,766 84,343 82,434 85,586 112,838 193,711 193,711 234,616 0.0 21.117 GNP(fc) 4,306,329 4,681,996 4,944,819 5,274,143 5,468,598 5,588,554 5,837,313 6,008,740 6,263,187 2.9 4.218 GNP (mp) 4,624,870 4,970,562 5,267,714 5,560,382 5,650,961 5,878,308 6,163,671 6,340,135 6,638,284 2.9 4.719 Population (in million) 151.0 154.4 157.7 161.2 164.7 168.2 171.7 175.3 178.9 2.1 2.120 Per Capita Income(fc-Rs) 28,521 30,334 31,347 32,722 33,211 33,231 33,992 34,276 35,007 0.8 2.1R: Revised Source : Pakistan Bureau of StatisticsP: Provisional
GROSS NATIONAL PRODUCT AT CONSTANT FACTOR COST OF 1999-2000
% Change
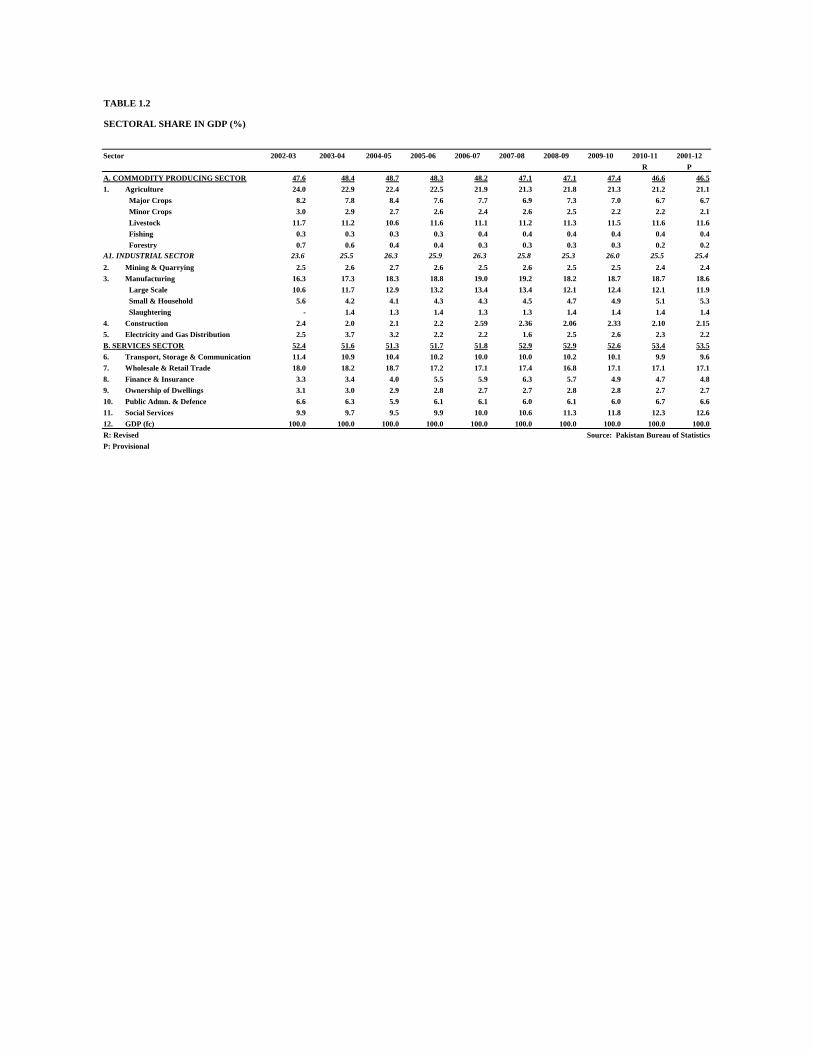
TABLE 1.2
Sector 2002-03 2003-04 2004-05 2005-06 2006-07 2007-08 2008-09 2009-10 2010-11 2001-12R P
A. COMMODITY PRODUCING SECTOR 47.6 48.4 48.7 48.3 48.2 47.1 47.1 47.4 46.6 46.51. Agriculture 24.0 22.9 22.4 22.5 21.9 21.3 21.8 21.3 21.2 21.1
Major Crops 8.2 7.8 8.4 7.6 7.7 6.9 7.3 7.0 6.7 6.7 Minor Crops 3.0 2.9 2.7 2.6 2.4 2.6 2.5 2.2 2.2 2.1 Livestock 11.7 11.2 10.6 11.6 11.1 11.2 11.3 11.5 11.6 11.6 Fishing 0.3 0.3 0.3 0.3 0.4 0.4 0.4 0.4 0.4 0.4 Forestry 0.7 0.6 0.4 0.4 0.3 0.3 0.3 0.3 0.2 0.2
A1. INDUSTRIAL SECTOR 23.6 25.5 26.3 25.9 26.3 25.8 25.3 26.0 25.5 25.42. Mining & Quarrying 2.5 2.6 2.7 2.6 2.5 2.6 2.5 2.5 2.4 2.43. Manufacturing 16.3 17.3 18.3 18.8 19.0 19.2 18.2 18.7 18.7 18.6
Large Scale 10.6 11.7 12.9 13.2 13.4 13.4 12.1 12.4 12.1 11.9 Small & Household 5.6 4.2 4.1 4.3 4.3 4.5 4.7 4.9 5.1 5.3 Slaughtering - 1.4 1.3 1.4 1.3 1.3 1.4 1.4 1.4 1.4
4. Construction 2.4 2.0 2.1 2.2 2.59 2.36 2.06 2.33 2.10 2.155. Electricity and Gas Distribution 2.5 3.7 3.2 2.2 2.2 1.6 2.5 2.6 2.3 2.2B. SERVICES SECTOR 52.4 51.6 51.3 51.7 51.8 52.9 52.9 52.6 53.4 53.56. Transport, Storage & Communication 11.4 10.9 10.4 10.2 10.0 10.0 10.2 10.1 9.9 9.67. Wholesale & Retail Trade 18.0 18.2 18.7 17.2 17.1 17.4 16.8 17.1 17.1 17.18. Finance & Insurance 3.3 3.4 4.0 5.5 5.9 6.3 5.7 4.9 4.7 4.89. Ownership of Dwellings 3.1 3.0 2.9 2.8 2.7 2.7 2.8 2.8 2.7 2.710. Public Admn. & Defence 6.6 6.3 5.9 6.1 6.1 6.0 6.1 6.0 6.7 6.611. Social Services 9.9 9.7 9.5 9.9 10.0 10.6 11.3 11.8 12.3 12.612. GDP (fc) 100.0 100.0 100.0 100.0 100.0 100.0 100.0 100.0 100.0 100.0R: Revised Source: Pakistan Bureau of StatisticsP: Provisional
SECTORAL SHARE IN GDP (%)
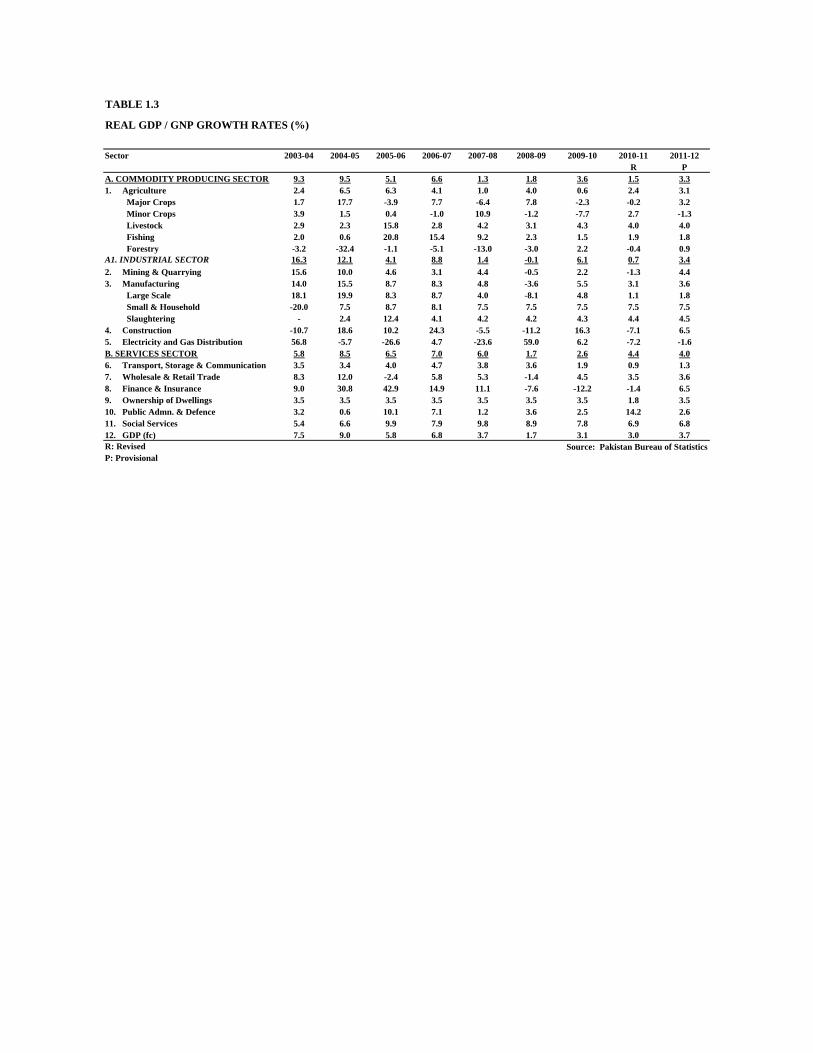
TABLE 1.3
REAL GDP / GNP GROWTH RATES (%)
Sector 2003-04 2004-05 2005-06 2006-07 2007-08 2008-09 2009-10 2010-11 2011-12R P
A. COMMODITY PRODUCING SECTOR 9.3 9.5 5.1 6.6 1.3 1.8 3.6 1.5 3.31. Agriculture 2.4 6.5 6.3 4.1 1.0 4.0 0.6 2.4 3.1
Major Crops 1.7 17.7 -3.9 7.7 -6.4 7.8 -2.3 -0.2 3.2 Minor Crops 3.9 1.5 0.4 -1.0 10.9 -1.2 -7.7 2.7 -1.3 Livestock 2.9 2.3 15.8 2.8 4.2 3.1 4.3 4.0 4.0 Fishing 2.0 0.6 20.8 15.4 9.2 2.3 1.5 1.9 1.8 Forestry -3.2 -32.4 -1.1 -5.1 -13.0 -3.0 2.2 -0.4 0.9
A1. INDUSTRIAL SECTOR 16.3 12.1 4.1 8.8 1.4 -0.1 6.1 0.7 3.42. Mining & Quarrying 15.6 10.0 4.6 3.1 4.4 -0.5 2.2 -1.3 4.43. Manufacturing 14.0 15.5 8.7 8.3 4.8 -3.6 5.5 3.1 3.6
Large Scale 18.1 19.9 8.3 8.7 4.0 -8.1 4.8 1.1 1.8 Small & Household -20.0 7.5 8.7 8.1 7.5 7.5 7.5 7.5 7.5 Slaughtering - 2.4 12.4 4.1 4.2 4.2 4.3 4.4 4.5
4. Construction -10.7 18.6 10.2 24.3 -5.5 -11.2 16.3 -7.1 6.55. Electricity and Gas Distribution 56.8 -5.7 -26.6 4.7 -23.6 59.0 6.2 -7.2 -1.6B. SERVICES SECTOR 5.8 8.5 6.5 7.0 6.0 1.7 2.6 4.4 4.06. Transport, Storage & Communication 3.5 3.4 4.0 4.7 3.8 3.6 1.9 0.9 1.37. Wholesale & Retail Trade 8.3 12.0 -2.4 5.8 5.3 -1.4 4.5 3.5 3.68. Finance & Insurance 9.0 30.8 42.9 14.9 11.1 -7.6 -12.2 -1.4 6.59. Ownership of Dwellings 3.5 3.5 3.5 3.5 3.5 3.5 3.5 1.8 3.510. Public Admn. & Defence 3.2 0.6 10.1 7.1 1.2 3.6 2.5 14.2 2.611. Social Services 5.4 6.6 9.9 7.9 9.8 8.9 7.8 6.9 6.812. GDP (fc) 7.5 9.0 5.8 6.8 3.7 1.7 3.1 3.0 3.7R: Revised Source: Pakistan Bureau of StatisticsP: Provisional
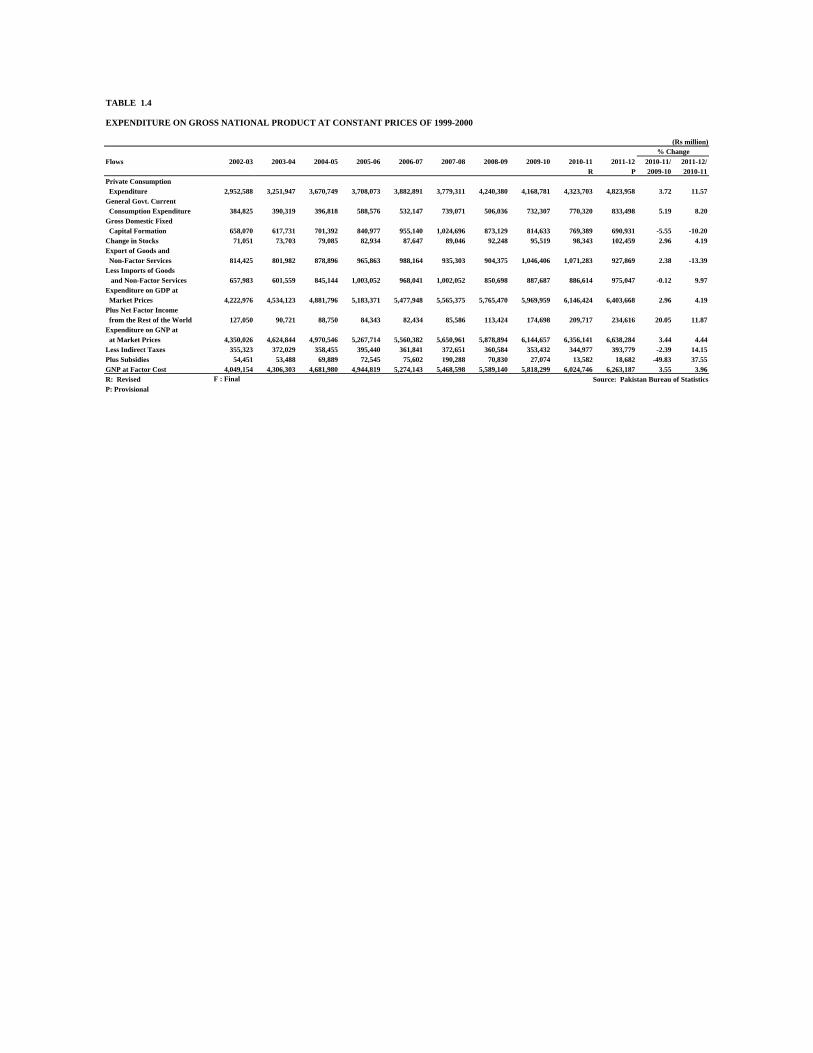
TABLE 1.4
(Rs million)
Flows 2002-03 2003-04 2004-05 2005-06 2006-07 2007-08 2008-09 2009-10 2010-11 2011-12 2010-11/ 2011-12/R P 2009-10 2010-11
Private Consumption Expenditure 2,952,588 3,251,947 3,670,749 3,708,073 3,882,891 3,779,311 4,240,380 4,168,781 4,323,703 4,823,958 3.72 11.57General Govt. Current Consumption Expenditure 384,825 390,319 396,818 588,576 532,147 739,071 506,036 732,307 770,320 833,498 5.19 8.20Gross Domestic Fixed Capital Formation 658,070 617,731 701,392 840,977 955,140 1,024,696 873,129 814,633 769,389 690,931 -5.55 -10.20Change in Stocks 71,051 73,703 79,085 82,934 87,647 89,046 92,248 95,519 98,343 102,459 2.96 4.19Export of Goods and Non-Factor Services 814,425 801,982 878,896 965,863 988,164 935,303 904,375 1,046,406 1,071,283 927,869 2.38 -13.39Less Imports of Goods and Non-Factor Services 657,983 601,559 845,144 1,003,052 968,041 1,002,052 850,698 887,687 886,614 975,047 -0.12 9.97Expenditure on GDP at Market Prices 4,222,976 4,534,123 4,881,796 5,183,371 5,477,948 5,565,375 5,765,470 5,969,959 6,146,424 6,403,668 2.96 4.19Plus Net Factor Income from the Rest of the World 127,050 90,721 88,750 84,343 82,434 85,586 113,424 174,698 209,717 234,616 20.05 11.87Expenditure on GNP at at Market Prices 4,350,026 4,624,844 4,970,546 5,267,714 5,560,382 5,650,961 5,878,894 6,144,657 6,356,141 6,638,284 3.44 4.44Less Indirect Taxes 355,323 372,029 358,455 395,440 361,841 372,651 360,584 353,432 344,977 393,779 -2.39 14.15Plus Subsidies 54,451 53,488 69,889 72,545 75,602 190,288 70,830 27,074 13,582 18,682 -49.83 37.55GNP at Factor Cost 4,049,154 4,306,303 4,681,980 4,944,819 5,274,143 5,468,598 5,589,140 5,818,299 6,024,746 6,263,187 3.55 3.96R: Revised F : Final Source: Pakistan Bureau of StatisticsP: Provisional
% Change
EXPENDITURE ON GROSS NATIONAL PRODUCT AT CONSTANT PRICES OF 1999-2000
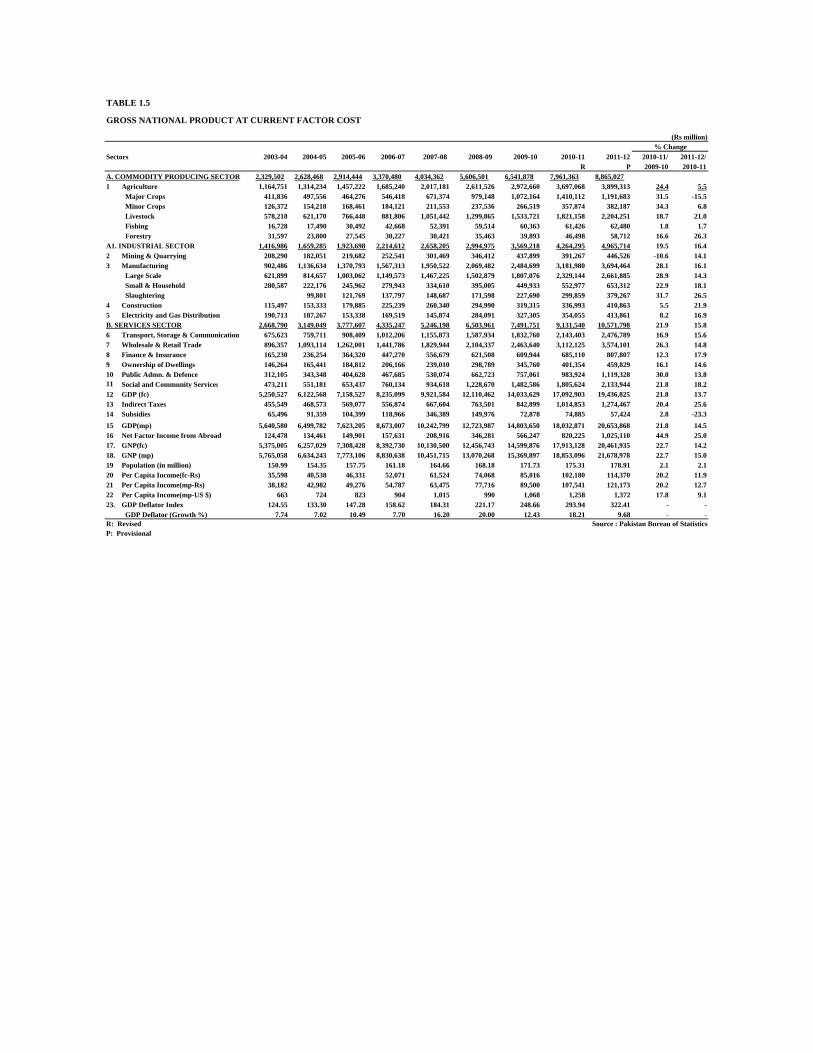
TABLE 1.5
(Rs million)
Sectors 2003-04 2004-05 2005-06 2006-07 2007-08 2008-09 2009-10 2010-11 2011-12 2010-11/ 2011-12/R P 2009-10 2010-11
A. COMMODITY PRODUCING SECTOR 2,329,502 2,628,468 2,914,444 3,370,480 4,034,362 5,606,501 6,541,878 7,961,363 8,865,0271 Agriculture 1,164,751 1,314,234 1,457,222 1,685,240 2,017,181 2,611,526 2,972,660 3,697,068 3,899,313 24.4 5.5
Major Crops 411,836 497,556 464,276 546,418 671,374 979,148 1,072,164 1,410,112 1,191,683 31.5 -15.5 Minor Crops 126,372 154,218 168,461 184,121 211,553 237,536 266,519 357,874 382,187 34.3 6.8 Livestock 578,218 621,170 766,448 881,806 1,051,442 1,299,865 1,533,721 1,821,158 2,204,251 18.7 21.0 Fishing 16,728 17,490 30,492 42,668 52,391 59,514 60,363 61,426 62,480 1.8 1.7 Forestry 31,597 23,800 27,545 30,227 30,421 35,463 39,893 46,498 58,712 16.6 26.3
A1. INDUSTRIAL SECTOR 1,416,986 1,659,285 1,923,698 2,214,612 2,658,205 2,994,975 3,569,218 4,264,295 4,965,714 19.5 16.42 Mining & Quarrying 208,290 182,051 219,682 252,541 301,469 346,412 437,899 391,267 446,526 -10.6 14.13 Manufacturing 902,486 1,136,634 1,370,793 1,567,313 1,950,522 2,069,482 2,484,699 3,181,980 3,694,464 28.1 16.1
Large Scale 621,899 814,657 1,003,062 1,149,573 1,467,225 1,502,879 1,807,076 2,329,144 2,661,885 28.9 14.3 Small & Household 280,587 222,176 245,962 279,943 334,610 395,005 449,933 552,977 653,312 22.9 18.1 Slaughtering 99,801 121,769 137,797 148,687 171,598 227,690 299,859 379,267 31.7 26.5
4 Construction 115,497 153,333 179,885 225,239 260,340 294,990 319,315 336,993 410,863 5.5 21.95 Electricity and Gas Distribution 190,713 187,267 153,338 169,519 145,874 284,091 327,305 354,055 413,861 8.2 16.9B. SERVICES SECTOR 2,668,790 3,149,049 3,777,607 4,335,247 5,246,198 6,503,961 7,491,751 9,131,540 10,571,798 21.9 15.86 Transport, Storage & Communication 675,623 759,711 908,409 1,012,206 1,155,873 1,587,934 1,832,760 2,143,403 2,476,789 16.9 15.67 Wholesale & Retail Trade 896,357 1,093,114 1,262,001 1,441,786 1,829,944 2,104,337 2,463,640 3,112,125 3,574,101 26.3 14.88 Finance & Insurance 165,230 236,254 364,320 447,270 556,679 621,508 609,944 685,110 807,807 12.3 17.99 Ownership of Dwellings 146,264 165,441 184,812 206,166 239,010 298,789 345,760 401,354 459,829 16.1 14.610 Public Admn. & Defence 312,105 343,348 404,628 467,685 530,074 662,723 757,061 983,924 1,119,328 30.0 13.811 Social and Community Services 473,211 551,181 653,437 760,134 934,618 1,228,670 1,482,586 1,805,624 2,133,944 21.8 18.212 GDP (fc) 5,250,527 6,122,568 7,158,527 8,235,099 9,921,584 12,110,462 14,033,629 17,092,903 19,436,825 21.8 13.713 Indirect Taxes 455,549 468,573 569,077 556,874 667,604 763,501 842,899 1,014,853 1,274,467 20.4 25.614 Subsidies 65,496 91,359 104,399 118,966 346,389 149,976 72,878 74,885 57,424 2.8 -23.315 GDP(mp) 5,640,580 6,499,782 7,623,205 8,673,007 10,242,799 12,723,987 14,803,650 18,032,871 20,653,868 21.8 14.516 Net Factor Income from Abroad 124,478 134,461 149,901 157,631 208,916 346,281 566,247 820,225 1,025,110 44.9 25.017. GNP(fc) 5,375,005 6,257,029 7,308,428 8,392,730 10,130,500 12,456,743 14,599,876 17,913,128 20,461,935 22.7 14.218. GNP (mp) 5,765,058 6,634,243 7,773,106 8,830,638 10,451,715 13,070,268 15,369,897 18,853,096 21,678,978 22.7 15.019 Population (in million) 150.99 154.35 157.75 161.18 164.66 168.18 171.73 175.31 178.91 2.1 2.120 Per Capita Income(fc-Rs) 35,598 40,538 46,331 52,071 61,524 74,068 85,016 102,180 114,370 20.2 11.921 Per Capita Income(mp-Rs) 38,182 42,982 49,276 54,787 63,475 77,716 89,500 107,541 121,173 20.2 12.722 Per Capita Income(mp-US $) 663 724 823 904 1,015 990 1,068 1,258 1,372 17.8 9.123. GDP Deflator Index 124.55 133.30 147.28 158.62 184.31 221.17 248.66 293.94 322.41 - -
GDP Deflator (Growth %) 7.74 7.02 10.49 7.70 16.20 20.00 12.43 18.21 9.68 - -R: Revised Source : Pakistan Bureau of StatisticsP: Provisional
GROSS NATIONAL PRODUCT AT CURRENT FACTOR COST
% Change
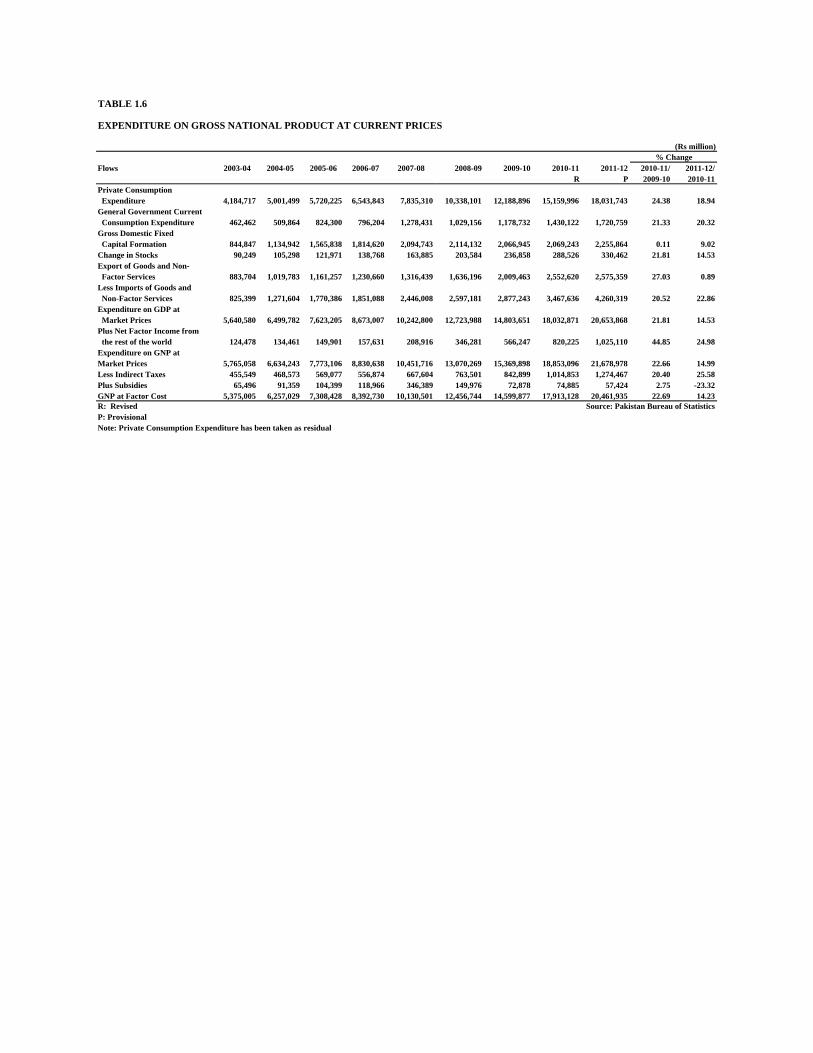
TABLE 1.6
(Rs million)
Flows 2003-04 2004-05 2005-06 2006-07 2007-08 2008-09 2009-10 2010-11 2011-12 2010-11/ 2011-12/R P 2009-10 2010-11
Private Consumption Expenditure 4,184,717 5,001,499 5,720,225 6,543,843 7,835,310 10,338,101 12,188,896 15,159,996 18,031,743 24.38 18.94General Government Current Consumption Expenditure 462,462 509,864 824,300 796,204 1,278,431 1,029,156 1,178,732 1,430,122 1,720,759 21.33 20.32Gross Domestic Fixed Capital Formation 844,847 1,134,942 1,565,838 1,814,620 2,094,743 2,114,132 2,066,945 2,069,243 2,255,864 0.11 9.02Change in Stocks 90,249 105,298 121,971 138,768 163,885 203,584 236,858 288,526 330,462 21.81 14.53Export of Goods and Non- Factor Services 883,704 1,019,783 1,161,257 1,230,660 1,316,439 1,636,196 2,009,463 2,552,620 2,575,359 27.03 0.89Less Imports of Goods and Non-Factor Services 825,399 1,271,604 1,770,386 1,851,088 2,446,008 2,597,181 2,877,243 3,467,636 4,260,319 20.52 22.86Expenditure on GDP at Market Prices 5,640,580 6,499,782 7,623,205 8,673,007 10,242,800 12,723,988 14,803,651 18,032,871 20,653,868 21.81 14.53Plus Net Factor Income from the rest of the world 124,478 134,461 149,901 157,631 208,916 346,281 566,247 820,225 1,025,110 44.85 24.98Expenditure on GNP atMarket Prices 5,765,058 6,634,243 7,773,106 8,830,638 10,451,716 13,070,269 15,369,898 18,853,096 21,678,978 22.66 14.99Less Indirect Taxes 455,549 468,573 569,077 556,874 667,604 763,501 842,899 1,014,853 1,274,467 20.40 25.58Plus Subsidies 65,496 91,359 104,399 118,966 346,389 149,976 72,878 74,885 57,424 2.75 -23.32GNP at Factor Cost 5,375,005 6,257,029 7,308,428 8,392,730 10,130,501 12,456,744 14,599,877 17,913,128 20,461,935 22.69 14.23R: Revised Source: Pakistan Bureau of StatisticsP: ProvisionalNote: Private Consumption Expenditure has been taken as residual
% Change
EXPENDITURE ON GROSS NATIONAL PRODUCT AT CURRENT PRICES
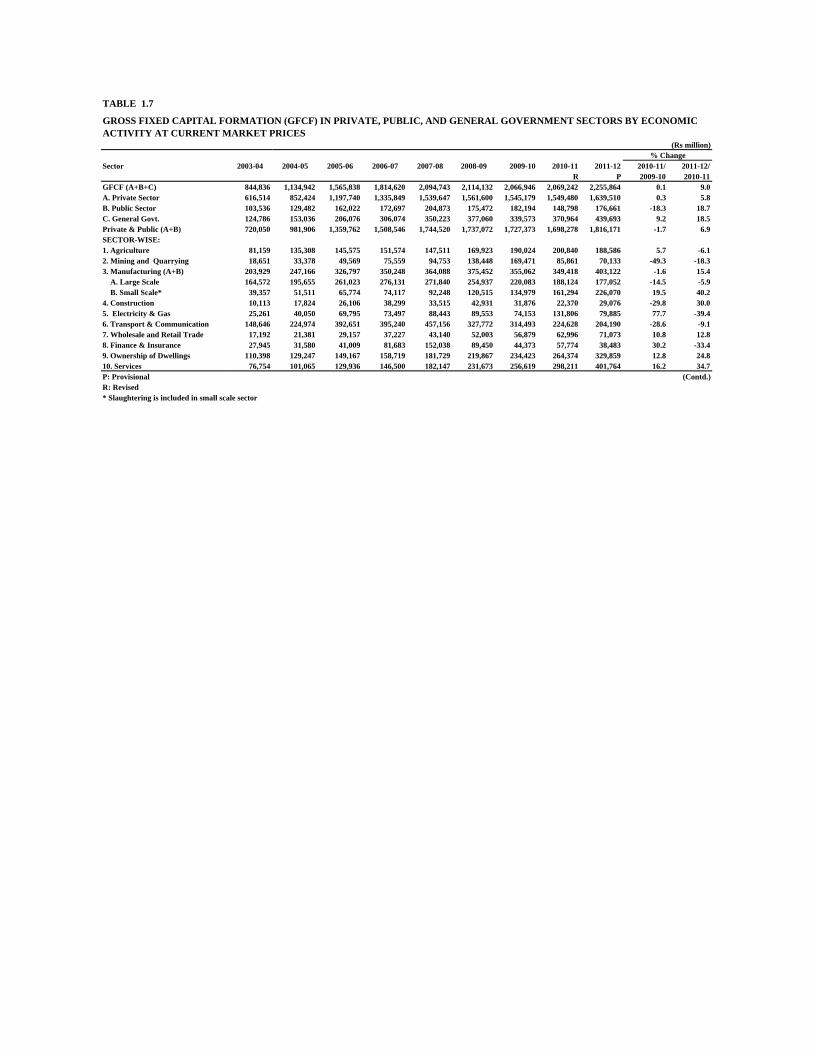
TABLE 1.7
(Rs million)
Sector 2003-04 2004-05 2005-06 2006-07 2007-08 2008-09 2009-10 2010-11 2011-12 2010-11/ 2011-12/R P 2009-10 2010-11
GFCF (A+B+C) 844,836 1,134,942 1,565,838 1,814,620 2,094,743 2,114,132 2,066,946 2,069,242 2,255,864 0.1 9.0A. Private Sector 616,514 852,424 1,197,740 1,335,849 1,539,647 1,561,600 1,545,179 1,549,480 1,639,510 0.3 5.8B. Public Sector 103,536 129,482 162,022 172,697 204,873 175,472 182,194 148,798 176,661 -18.3 18.7C. General Govt. 124,786 153,036 206,076 306,074 350,223 377,060 339,573 370,964 439,693 9.2 18.5Private & Public (A+B) 720,050 981,906 1,359,762 1,508,546 1,744,520 1,737,072 1,727,373 1,698,278 1,816,171 -1.7 6.9SECTOR-WISE:1. Agriculture 81,159 135,308 145,575 151,574 147,511 169,923 190,024 200,840 188,586 5.7 -6.12. Mining and Quarrying 18,651 33,378 49,569 75,559 94,753 138,448 169,471 85,861 70,133 -49.3 -18.33. Manufacturing (A+B) 203,929 247,166 326,797 350,248 364,088 375,452 355,062 349,418 403,122 -1.6 15.4 A. Large Scale 164,572 195,655 261,023 276,131 271,840 254,937 220,083 188,124 177,052 -14.5 -5.9 B. Small Scale* 39,357 51,511 65,774 74,117 92,248 120,515 134,979 161,294 226,070 19.5 40.24. Construction 10,113 17,824 26,106 38,299 33,515 42,931 31,876 22,370 29,076 -29.8 30.05. Electricity & Gas 25,261 40,050 69,795 73,497 88,443 89,553 74,153 131,806 79,885 77.7 -39.46. Transport & Communication 148,646 224,974 392,651 395,240 457,156 327,772 314,493 224,628 204,190 -28.6 -9.17. Wholesale and Retail Trade 17,192 21,381 29,157 37,227 43,140 52,003 56,879 62,996 71,073 10.8 12.88. Finance & Insurance 27,945 31,580 41,009 81,683 152,038 89,450 44,373 57,774 38,483 30.2 -33.49. Ownership of Dwellings 110,398 129,247 149,167 158,719 181,729 219,867 234,423 264,374 329,859 12.8 24.810. Services 76,754 101,065 129,936 146,500 182,147 231,673 256,619 298,211 401,764 16.2 34.7P: Provisional (Contd.)R: Revised* Slaughtering is included in small scale sector
GROSS FIXED CAPITAL FORMATION (GFCF) IN PRIVATE, PUBLIC, AND GENERAL GOVERNMENT SECTORS BY ECONOMIC ACTIVITY AT CURRENT MARKET PRICES
% Change
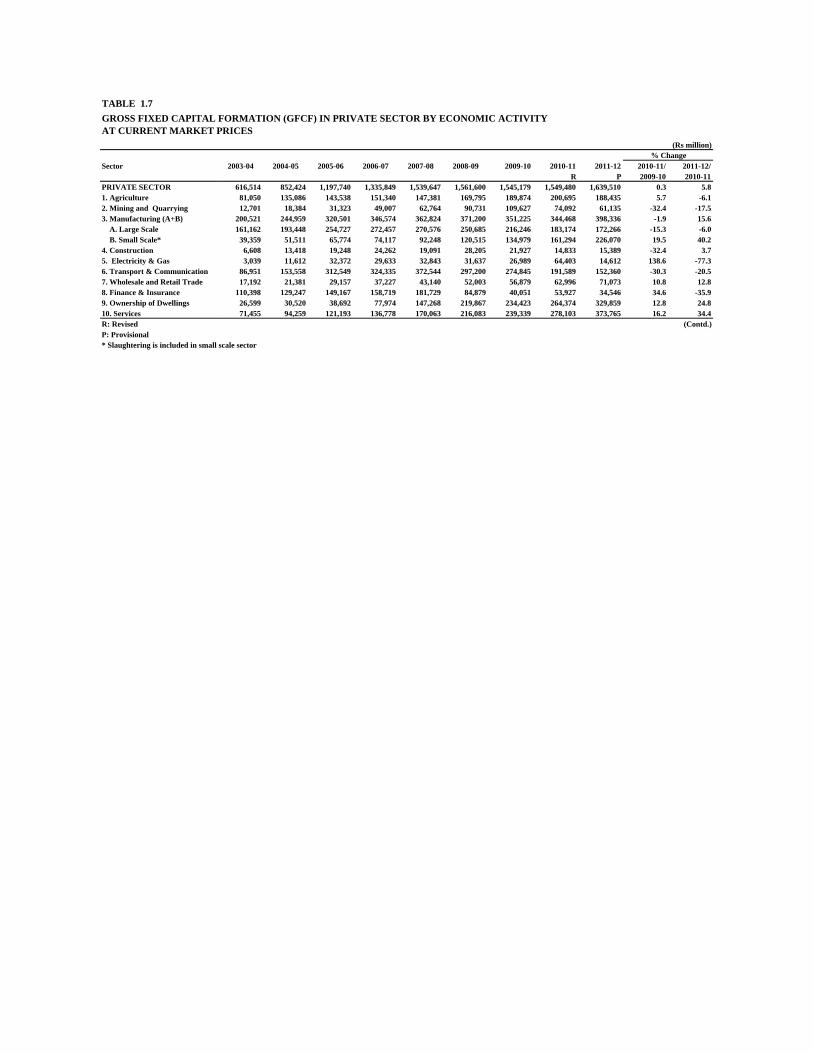
TABLE 1.7
(Rs million)
Sector 2003-04 2004-05 2005-06 2006-07 2007-08 2008-09 2009-10 2010-11 2011-12 2010-11/ 2011-12/R P 2009-10 2010-11
PRIVATE SECTOR 616,514 852,424 1,197,740 1,335,849 1,539,647 1,561,600 1,545,179 1,549,480 1,639,510 0.3 5.81. Agriculture 81,050 135,086 143,538 151,340 147,381 169,795 189,874 200,695 188,435 5.7 -6.12. Mining and Quarrying 12,701 18,384 31,323 49,007 62,764 90,731 109,627 74,092 61,135 -32.4 -17.53. Manufacturing (A+B) 200,521 244,959 320,501 346,574 362,824 371,200 351,225 344,468 398,336 -1.9 15.6 A. Large Scale 161,162 193,448 254,727 272,457 270,576 250,685 216,246 183,174 172,266 -15.3 -6.0 B. Small Scale* 39,359 51,511 65,774 74,117 92,248 120,515 134,979 161,294 226,070 19.5 40.24. Construction 6,608 13,418 19,248 24,262 19,091 28,205 21,927 14,833 15,389 -32.4 3.75. Electricity & Gas 3,039 11,612 32,372 29,633 32,843 31,637 26,989 64,403 14,612 138.6 -77.36. Transport & Communication 86,951 153,558 312,549 324,335 372,544 297,200 274,845 191,589 152,360 -30.3 -20.57. Wholesale and Retail Trade 17,192 21,381 29,157 37,227 43,140 52,003 56,879 62,996 71,073 10.8 12.88. Finance & Insurance 110,398 129,247 149,167 158,719 181,729 84,879 40,051 53,927 34,546 34.6 -35.99. Ownership of Dwellings 26,599 30,520 38,692 77,974 147,268 219,867 234,423 264,374 329,859 12.8 24.810. Services 71,455 94,259 121,193 136,778 170,063 216,083 239,339 278,103 373,765 16.2 34.4R: Revised (Contd.)P: Provisional* Slaughtering is included in small scale sector
GROSS FIXED CAPITAL FORMATION (GFCF) IN PRIVATE SECTOR BY ECONOMIC ACTIVITYAT CURRENT MARKET PRICES
% Change
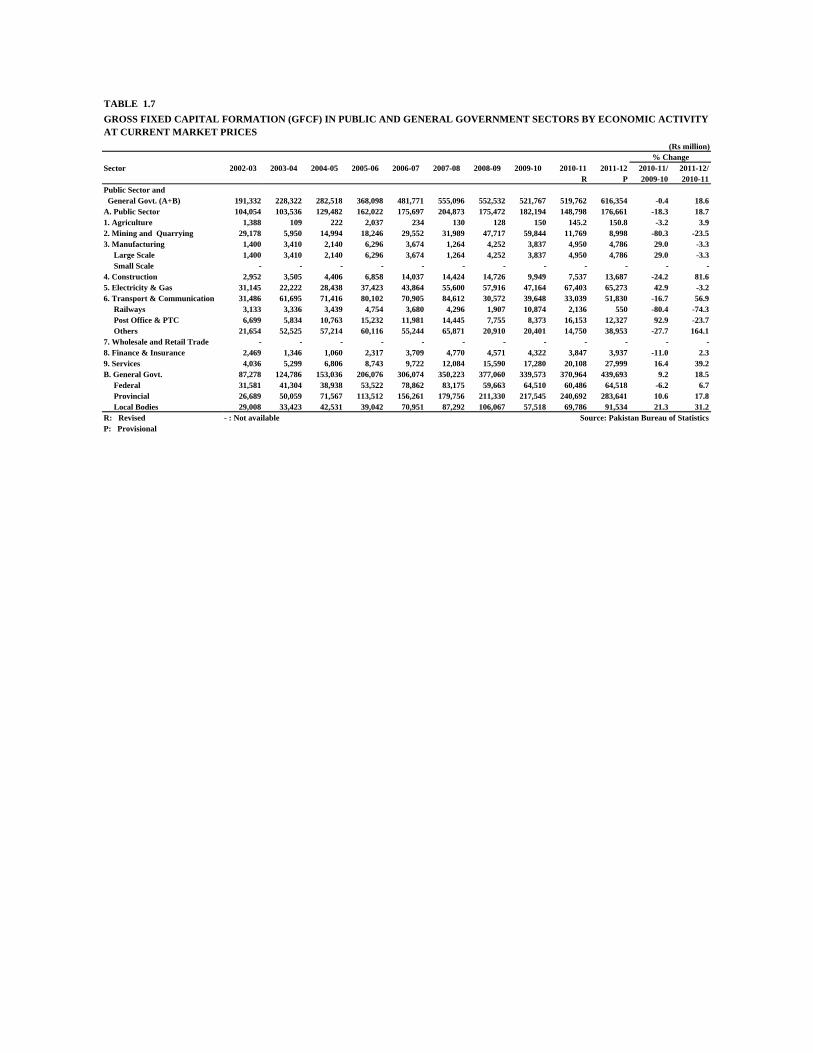
TABLE 1.7
(Rs million)
Sector 2002-03 2003-04 2004-05 2005-06 2006-07 2007-08 2008-09 2009-10 2010-11 2011-12 2010-11/ 2011-12/R P 2009-10 2010-11
Public Sector and General Govt. (A+B) 191,332 228,322 282,518 368,098 481,771 555,096 552,532 521,767 519,762 616,354 -0.4 18.6A. Public Sector 104,054 103,536 129,482 162,022 175,697 204,873 175,472 182,194 148,798 176,661 -18.3 18.71. Agriculture 1,388 109 222 2,037 234 130 128 150 145.2 150.8 -3.2 3.92. Mining and Quarrying 29,178 5,950 14,994 18,246 29,552 31,989 47,717 59,844 11,769 8,998 -80.3 -23.53. Manufacturing 1,400 3,410 2,140 6,296 3,674 1,264 4,252 3,837 4,950 4,786 29.0 -3.3 Large Scale 1,400 3,410 2,140 6,296 3,674 1,264 4,252 3,837 4,950 4,786 29.0 -3.3 Small Scale - - - - - - - - - - - -4. Construction 2,952 3,505 4,406 6,858 14,037 14,424 14,726 9,949 7,537 13,687 -24.2 81.65. Electricity & Gas 31,145 22,222 28,438 37,423 43,864 55,600 57,916 47,164 67,403 65,273 42.9 -3.26. Transport & Communication 31,486 61,695 71,416 80,102 70,905 84,612 30,572 39,648 33,039 51,830 -16.7 56.9 Railways 3,133 3,336 3,439 4,754 3,680 4,296 1,907 10,874 2,136 550 -80.4 -74.3 Post Office & PTC 6,699 5,834 10,763 15,232 11,981 14,445 7,755 8,373 16,153 12,327 92.9 -23.7 Others 21,654 52,525 57,214 60,116 55,244 65,871 20,910 20,401 14,750 38,953 -27.7 164.17. Wholesale and Retail Trade - - - - - - - - - - - -8. Finance & Insurance 2,469 1,346 1,060 2,317 3,709 4,770 4,571 4,322 3,847 3,937 -11.0 2.39. Services 4,036 5,299 6,806 8,743 9,722 12,084 15,590 17,280 20,108 27,999 16.4 39.2B. General Govt. 87,278 124,786 153,036 206,076 306,074 350,223 377,060 339,573 370,964 439,693 9.2 18.5 Federal 31,581 41,304 38,938 53,522 78,862 83,175 59,663 64,510 60,486 64,518 -6.2 6.7 Provincial 26,689 50,059 71,567 113,512 156,261 179,756 211,330 217,545 240,692 283,641 10.6 17.8 Local Bodies 29,008 33,423 42,531 39,042 70,951 87,292 106,067 57,518 69,786 91,534 21.3 31.2R: Revised - : Not available Source: Pakistan Bureau of StatisticsP: Provisional
GROSS FIXED CAPITAL FORMATION (GFCF) IN PUBLIC AND GENERAL GOVERNMENT SECTORS BY ECONOMIC ACTIVITY AT CURRENT MARKET PRICES
% Change
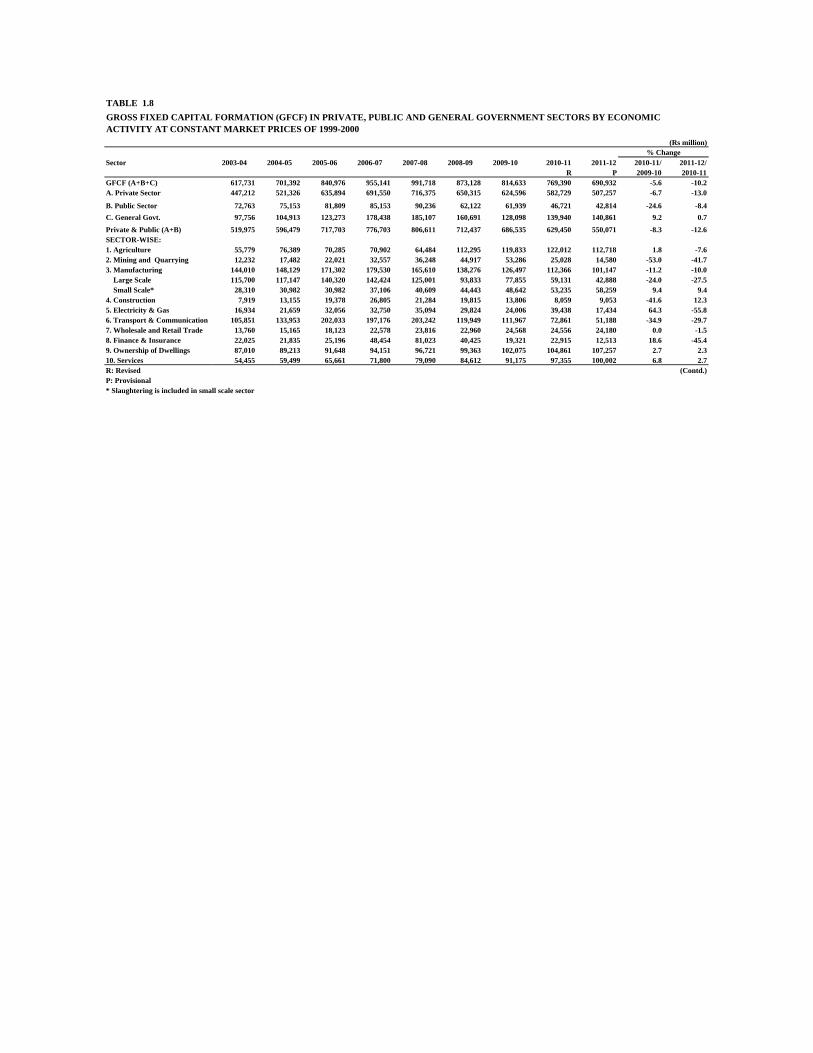
TABLE 1.8
(Rs million)
Sector 2003-04 2004-05 2005-06 2006-07 2007-08 2008-09 2009-10 2010-11 2011-12 2010-11/ 2011-12/R P 2009-10 2010-11
GFCF (A+B+C) 617,731 701,392 840,976 955,141 991,718 873,128 814,633 769,390 690,932 -5.6 -10.2A. Private Sector 447,212 521,326 635,894 691,550 716,375 650,315 624,596 582,729 507,257 -6.7 -13.0
B. Public Sector 72,763 75,153 81,809 85,153 90,236 62,122 61,939 46,721 42,814 -24.6 -8.4C. General Govt. 97,756 104,913 123,273 178,438 185,107 160,691 128,098 139,940 140,861 9.2 0.7Private & Public (A+B) 519,975 596,479 717,703 776,703 806,611 712,437 686,535 629,450 550,071 -8.3 -12.6SECTOR-WISE:1. Agriculture 55,779 76,389 70,285 70,902 64,484 112,295 119,833 122,012 112,718 1.8 -7.62. Mining and Quarrying 12,232 17,482 22,021 32,557 36,248 44,917 53,286 25,028 14,580 -53.0 -41.73. Manufacturing 144,010 148,129 171,302 179,530 165,610 138,276 126,497 112,366 101,147 -11.2 -10.0 Large Scale 115,700 117,147 140,320 142,424 125,001 93,833 77,855 59,131 42,888 -24.0 -27.5 Small Scale* 28,310 30,982 30,982 37,106 40,609 44,443 48,642 53,235 58,259 9.4 9.44. Construction 7,919 13,155 19,378 26,805 21,284 19,815 13,806 8,059 9,053 -41.6 12.35. Electricity & Gas 16,934 21,659 32,056 32,750 35,094 29,824 24,006 39,438 17,434 64.3 -55.86. Transport & Communication 105,851 133,953 202,033 197,176 203,242 119,949 111,967 72,861 51,188 -34.9 -29.77. Wholesale and Retail Trade 13,760 15,165 18,123 22,578 23,816 22,960 24,568 24,556 24,180 0.0 -1.58. Finance & Insurance 22,025 21,835 25,196 48,454 81,023 40,425 19,321 22,915 12,513 18.6 -45.49. Ownership of Dwellings 87,010 89,213 91,648 94,151 96,721 99,363 102,075 104,861 107,257 2.7 2.310. Services 54,455 59,499 65,661 71,800 79,090 84,612 91,175 97,355 100,002 6.8 2.7R: Revised (Contd.)P: Provisional* Slaughtering is included in small scale sector
GROSS FIXED CAPITAL FORMATION (GFCF) IN PRIVATE, PUBLIC AND GENERAL GOVERNMENT SECTORS BY ECONOMIC ACTIVITY AT CONSTANT MARKET PRICES OF 1999-2000
% Change
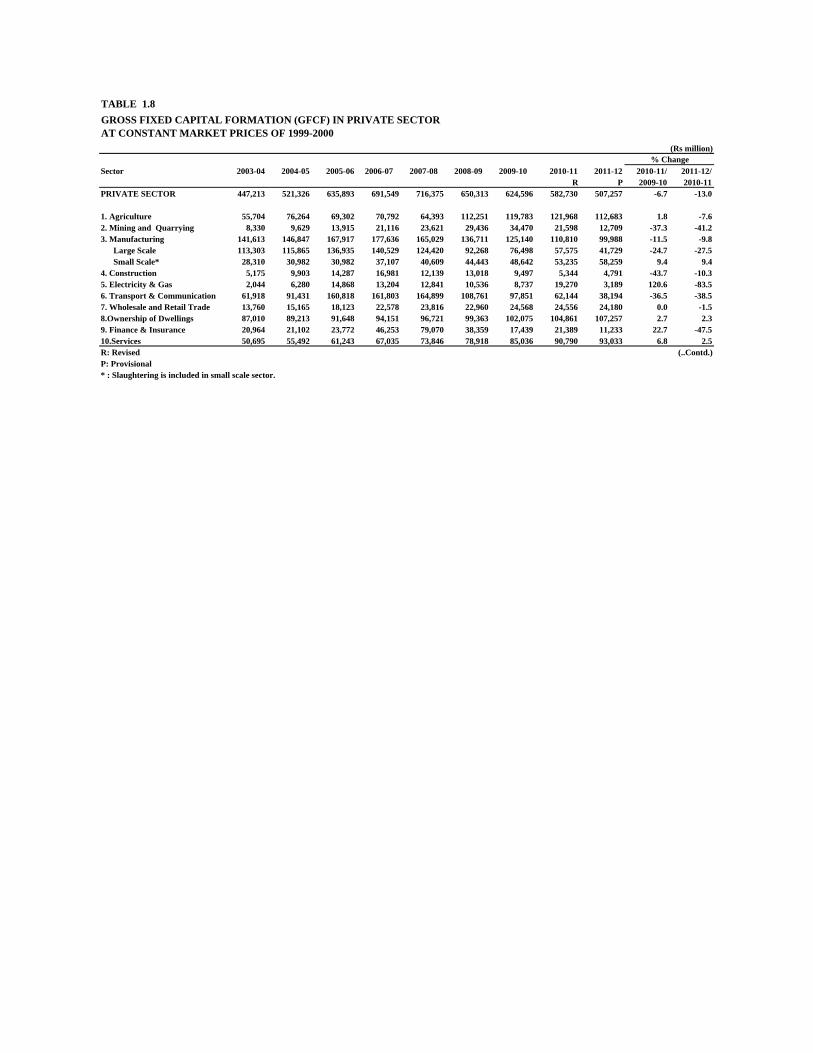
TABLE 1.8
(Rs million)
Sector 2003-04 2004-05 2005-06 2006-07 2007-08 2008-09 2009-10 2010-11 2011-12 2010-11/ 2011-12/R P 2009-10 2010-11
PRIVATE SECTOR 447,213 521,326 635,893 691,549 716,375 650,313 624,596 582,730 507,257 -6.7 -13.0
1. Agriculture 55,704 76,264 69,302 70,792 64,393 112,251 119,783 121,968 112,683 1.8 -7.62. Mining and Quarrying 8,330 9,629 13,915 21,116 23,621 29,436 34,470 21,598 12,709 -37.3 -41.23. Manufacturing 141,613 146,847 167,917 177,636 165,029 136,711 125,140 110,810 99,988 -11.5 -9.8 Large Scale 113,303 115,865 136,935 140,529 124,420 92,268 76,498 57,575 41,729 -24.7 -27.5 Small Scale* 28,310 30,982 30,982 37,107 40,609 44,443 48,642 53,235 58,259 9.4 9.44. Construction 5,175 9,903 14,287 16,981 12,139 13,018 9,497 5,344 4,791 -43.7 -10.35. Electricity & Gas 2,044 6,280 14,868 13,204 12,841 10,536 8,737 19,270 3,189 120.6 -83.56. Transport & Communication 61,918 91,431 160,818 161,803 164,899 108,761 97,851 62,144 38,194 -36.5 -38.57. Wholesale and Retail Trade 13,760 15,165 18,123 22,578 23,816 22,960 24,568 24,556 24,180 0.0 -1.58.Ownership of Dwellings 87,010 89,213 91,648 94,151 96,721 99,363 102,075 104,861 107,257 2.7 2.39. Finance & Insurance 20,964 21,102 23,772 46,253 79,070 38,359 17,439 21,389 11,233 22.7 -47.510.Services 50,695 55,492 61,243 67,035 73,846 78,918 85,036 90,790 93,033 6.8 2.5R: Revised (..Contd.)P: Provisional* : Slaughtering is included in small scale sector.
GROSS FIXED CAPITAL FORMATION (GFCF) IN PRIVATE SECTOR AT CONSTANT MARKET PRICES OF 1999-2000
% Change
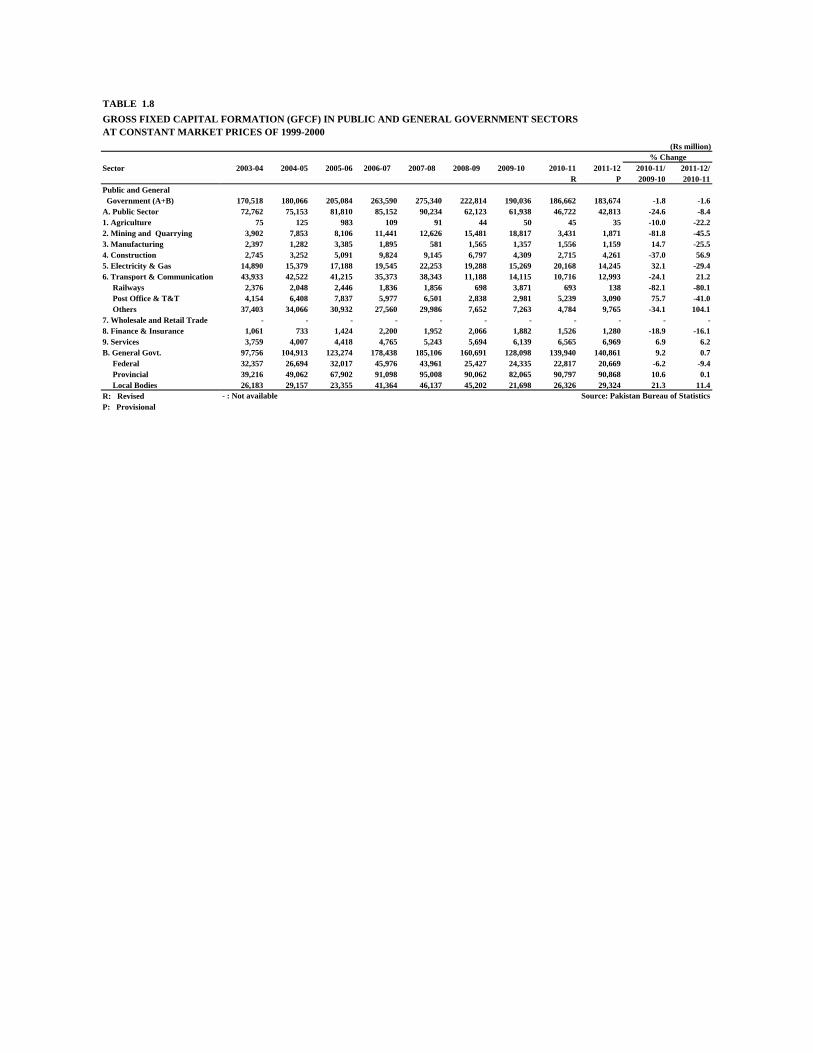
TABLE 1.8
(Rs million)
Sector 2003-04 2004-05 2005-06 2006-07 2007-08 2008-09 2009-10 2010-11 2011-12 2010-11/ 2011-12/R P 2009-10 2010-11
Public and General Government (A+B) 170,518 180,066 205,084 263,590 275,340 222,814 190,036 186,662 183,674 -1.8 -1.6A. Public Sector 72,762 75,153 81,810 85,152 90,234 62,123 61,938 46,722 42,813 -24.6 -8.41. Agriculture 75 125 983 109 91 44 50 45 35 -10.0 -22.22. Mining and Quarrying 3,902 7,853 8,106 11,441 12,626 15,481 18,817 3,431 1,871 -81.8 -45.53. Manufacturing 2,397 1,282 3,385 1,895 581 1,565 1,357 1,556 1,159 14.7 -25.54. Construction 2,745 3,252 5,091 9,824 9,145 6,797 4,309 2,715 4,261 -37.0 56.95. Electricity & Gas 14,890 15,379 17,188 19,545 22,253 19,288 15,269 20,168 14,245 32.1 -29.46. Transport & Communication 43,933 42,522 41,215 35,373 38,343 11,188 14,115 10,716 12,993 -24.1 21.2 Railways 2,376 2,048 2,446 1,836 1,856 698 3,871 693 138 -82.1 -80.1 Post Office & T&T 4,154 6,408 7,837 5,977 6,501 2,838 2,981 5,239 3,090 75.7 -41.0 Others 37,403 34,066 30,932 27,560 29,986 7,652 7,263 4,784 9,765 -34.1 104.17. Wholesale and Retail Trade - - - - - - - - - - -8. Finance & Insurance 1,061 733 1,424 2,200 1,952 2,066 1,882 1,526 1,280 -18.9 -16.19. Services 3,759 4,007 4,418 4,765 5,243 5,694 6,139 6,565 6,969 6.9 6.2B. General Govt. 97,756 104,913 123,274 178,438 185,106 160,691 128,098 139,940 140,861 9.2 0.7 Federal 32,357 26,694 32,017 45,976 43,961 25,427 24,335 22,817 20,669 -6.2 -9.4 Provincial 39,216 49,062 67,902 91,098 95,008 90,062 82,065 90,797 90,868 10.6 0.1 Local Bodies 26,183 29,157 23,355 41,364 46,137 45,202 21,698 26,326 29,324 21.3 11.4R: Revised - : Not available Source: Pakistan Bureau of StatisticsP: Provisional
GROSS FIXED CAPITAL FORMATION (GFCF) IN PUBLIC AND GENERAL GOVERNMENT SECTORSAT CONSTANT MARKET PRICES OF 1999-2000
% Change