Embed Size (px)
Citation preview
The Federal Reserve Board (FRB) released this year’s Dodd-Frank Act stress testing (DFAST) and Comprehensive Capital Analysis and Review (CCAR) results on June 23, 2016 and June 29, 2016, respectively. DFAST and CCAR are complementary exercises conducted by the FRB to assess the quality of the capital planning processes of large bank holding companies (BHCs) and whether these BHCs have sufficient capital to absorb losses through stressed economic conditions.
Overall highlights
Banks’ post-stress capital levels are higher than prior year cycle:
All BHCs have post-stress ratios that exceed regulatory minimums under the DFAST standardized capital action assumptions and CCAR adjusted capital actions. From 2009, actual common equity capital among the 33 BHCs has increased by more than $700 billion to over $1.2 trillion in 1Q 2016. The common equity tier 1 (CET1) ratio for the 33 BHCs, for example, more than doubled from 5.5 percent to 12.2 percent reflecting increased industry capital levels. On a post-stress basis, the industry as a whole is projected to have higher capital ratios compared to the prior year. Post-stress CET 1 ratio trough increased from 6.6 percent in CCAR 2015 to 7.1 percent in CCAR 2016. BHCs are expected to meet a 4.5 percent minimum post-stress CET 1 ratio, which may increase in future cycles with the potential inclusion of the G-SIB surcharge applicable to the larger and systemically important BHCs.
31 of 33 BHCs received a non-objection to their capital plan:
The FRB objected to the capital plans of two BHCs (Deutsche Bank Trust Corporation and Santander Holdings USA, Inc.). In addition, one BHC (Morgan Stanley) received a conditional non-objection and is required to remediate cited weaknesses and resubmit its capital plan by December 29, 2016.
Increase in approved total distributions:
At an industry level, the amount of firms’ requests for planned capital actions (measured in terms of post-stress common equity tier 1 ratio impact) was 130bps compared to 120bps in CCAR 2015 and 100bps in CCAR 2014 (both measured in terms of post-stress tier 1 common capital ratio impact). Similar to last year, BHCs were given the option to adjust their originally proposed capital actions downward based on DFAST results. M&T Bank Corporation is the only bank to use this option this year.
FRB acknowledges general improvement in firms’ capital planning processes though bar is expected to keep rising, especially for the largest BHCs:
The CCAR 2016 qualitative assessment program highlights the FRB’s differentiated expectations between the capital planning processes at LISCC and Large and Complex firms (SR 15-18 Firms) and the Large and Non-Complex firms (SR 15-19 Firms).
► SR 15-18 Firms, as a group, have significant work ahead as many continue to fall short of expectations especially around risk identification, critical assessment of stress scenario assumptions and results, internal controls and effectiveness of internal audit programs for capital planning.
► On the other hand, while SR 15-19 Firms, as a group, are viewed as “meeting or close to meeting supervisory expectations”, management should recognize the risk that supervisory expectations and peer practices could evolve.1. For full participant list see box on last page of
this document
Results by the numbers
31 of 33BHCs received a non-objection to their capital plan (this included one conditional non-objection). In 2015, 29 of 31 firms received a non-objection.
520 bpsAverage CET 1 ratio depletion from actuals to stress trough across the 33 participating BHCs this year. In CCAR 2015, the average depletion in the tier 1 common ratio was 480 bps.
130 bpsEstimated impact of planned capital actions on the CET 1 ratio.
6.1%Average industry projected loan loss rate, same as DFAST 2015.
2016 CCAR/ DFAST results
1
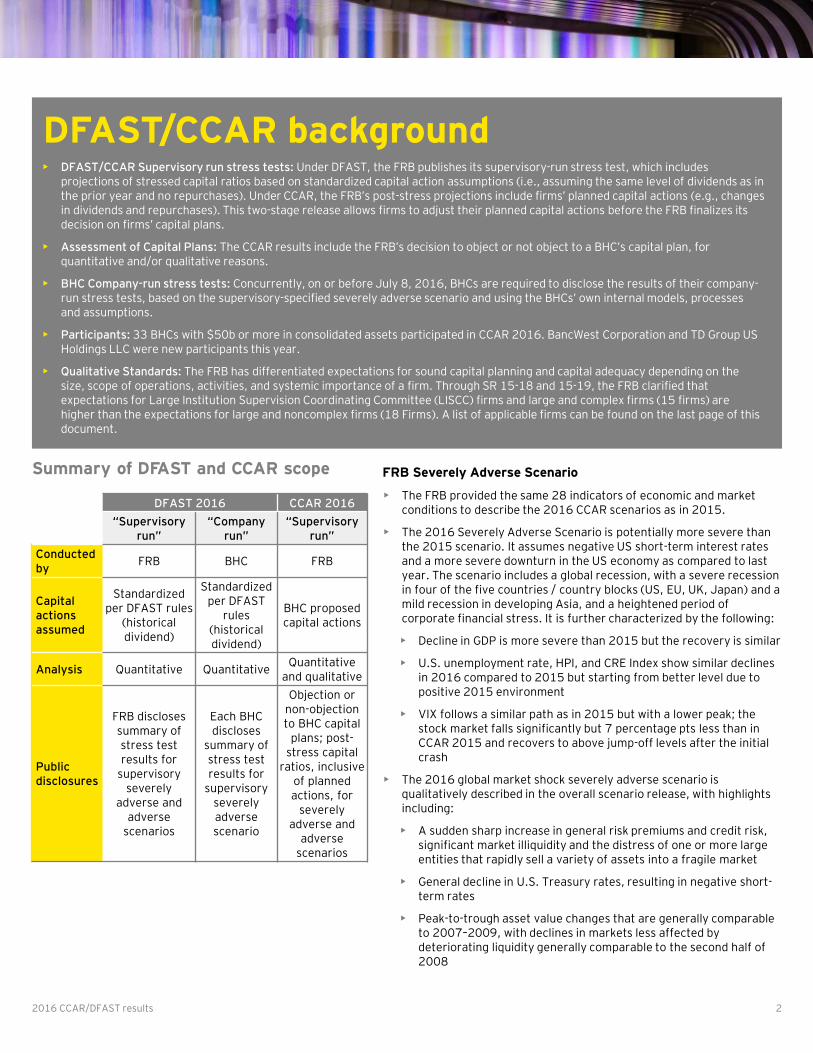
Summary of DFAST and CCAR scope FRB Severely Adverse Scenario
• The FRB provided the same 28 indicators of economic and market conditions to describe the 2016 CCAR scenarios as in 2015.
• The 2016 Severely Adverse Scenario is potentially more severe than the 2015 scenario. It assumes negative US short-term interest rates and a more severe downturn in the US economy as compared to last year. The scenario includes a global recession, with a severe recession in four of the five countries / country blocks (US, EU, UK, Japan) and a mild recession in developing Asia, and a heightened period of corporate financial stress. It is further characterized by the following:
• Decline in GDP is more severe than 2015 but the recovery is similar
• U.S. unemployment rate, HPI, and CRE Index show similar declines in 2016 compared to 2015 but starting from better level due to positive 2015 environment
• VIX follows a similar path as in 2015 but with a lower peak; the stock market falls significantly but 7 percentage pts less than in CCAR 2015 and recovers to above jump-off levels after the initial crash
• The 2016 global market shock severely adverse scenario is qualitatively described in the overall scenario release, with highlights including:
• A sudden sharp increase in general risk premiums and credit risk, significant market illiquidity and the distress of one or more large entities that rapidly sell a variety of assets into a fragile market
• General decline in U.S. Treasury rates, resulting in negative short-term rates
• Peak-to-trough asset value changes that are generally comparable to 2007–2009, with declines in markets less affected by deteriorating liquidity generally comparable to the second half of 2008
2016 CCAR/DFAST results 2
DFAST 2016 CCAR 2016
“Supervisory run”
“Company run”
“Supervisory run”
Conducted by
FRB BHC FRB
Capital actions assumed
Standardized per DFAST rules
(historical dividend)
Standardized per DFAST
rules (historical dividend)
BHC proposed capital actions
Analysis Quantitative QuantitativeQuantitative
and qualitative
Public disclosures
FRB discloses summary of stress test results for
supervisory severely
adverse and adverse
scenarios
Each BHC discloses
summary of stress test results for
supervisory severely adverse scenario
Objection or non-objection to BHC capital
plans; post-stress capital
ratios, inclusive of planned actions, for
severely adverse and
adverse scenarios
DFAST/CCAR background• DFAST/CCAR Supervisory run stress tests: Under DFAST, the FRB publishes its supervisory-run stress test, which includes
projections of stressed capital ratios based on standardized capital action assumptions (i.e., assuming the same level of dividends as in the prior year and no repurchases). Under CCAR, the FRB’s post-stress projections include firms’ planned capital actions (e.g., changes in dividends and repurchases). This two-stage release allows firms to adjust their planned capital actions before the FRB finalizes its decision on firms’ capital plans.
• Assessment of Capital Plans: The CCAR results include the FRB’s decision to object or not object to a BHC’s capital plan, for quantitative and/or qualitative reasons.
• BHC Company-run stress tests: Concurrently, on or before July 8, 2016, BHCs are required to disclose the results of their company-run stress tests, based on the supervisory-specified severely adverse scenario and using the BHCs’ own internal models, processes and assumptions.
• Participants: 33 BHCs with $50b or more in consolidated assets participated in CCAR 2016. BancWest Corporation and TD Group US Holdings LLC were new participants this year.
• Qualitative Standards: The FRB has differentiated expectations for sound capital planning and capital adequacy depending on the size, scope of operations, activities, and systemic importance of a firm. Through SR 15-18 and 15-19, the FRB clarified that expectations for Large Institution Supervision Coordinating Committee (LISCC) firms and large and complex firms (15 firms) are higher than the expectations for large and noncomplex firms (18 Firms). A list of applicable firms can be found on the last page of this document.
2016 CCAR/DFAST results 3
FRB Severely Adverse Scenario (cont’d)
• Breakdowns in historical basis spreads, with spread widening
between cash and to-be-announced forward markets and
corporate bonds and credit default swaps
• Larger widening of credit spreads for municipal, sovereign and
advanced economies’ corporate products and greater declines in
the value of private equity investments, recently issued
securitized products and non-agency residential mortgage-
backed securities compared to 2015
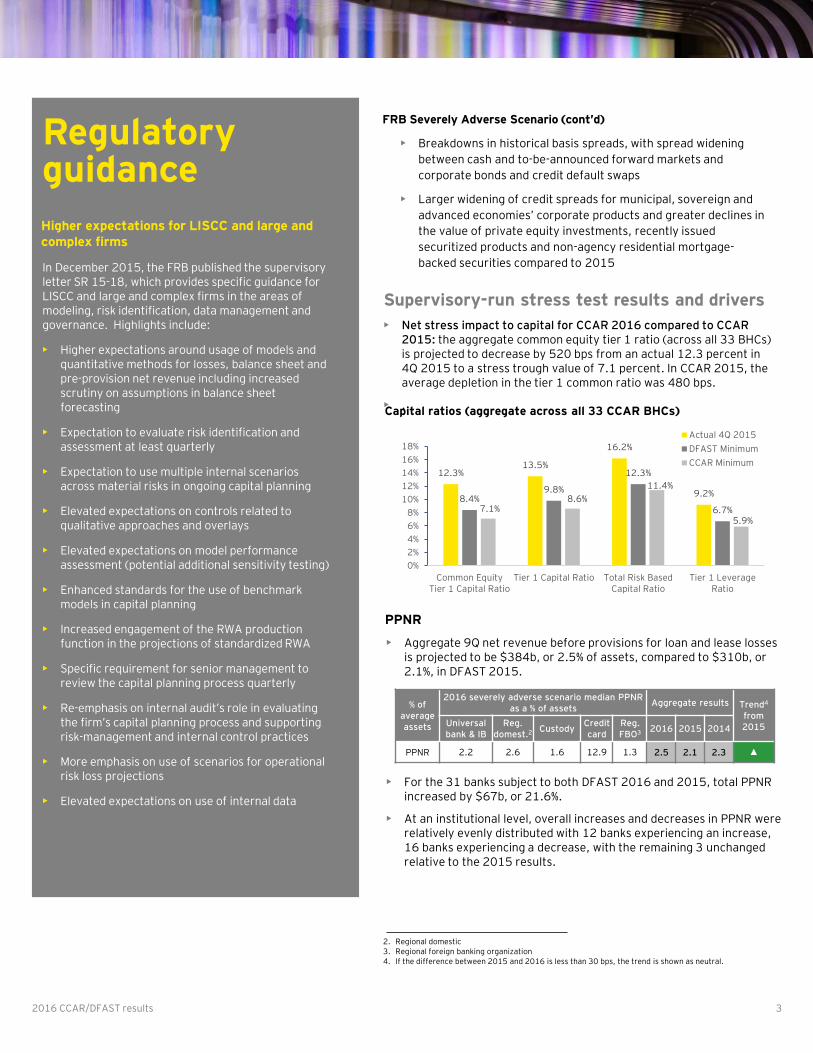
Capital ratios (aggregate across all 33 CCAR BHCs)
12.3%13.5%
16.2%
9.2%8.4%
9.8%
12.3%
6.7%7.1%8.6%
11.4%
5.9%
0%
2%
4%
6%
8%
10%
12%
14%
16%
18%
Common EquityTier 1 Capital Ratio
Tier 1 Capital Ratio Total Risk BasedCapital Ratio
Tier 1 LeverageRatio
Actual 4Q 2015
DFAST Minimum
CCAR Minimum
Supervisory-run stress test results and drivers
• Net stress impact to capital for CCAR 2016 compared to CCAR 2015: the aggregate common equity tier 1 ratio (across all 33 BHCs) is projected to decrease by 520 bps from an actual 12.3 percent in 4Q 2015 to a stress trough value of 7.1 percent. In CCAR 2015, the average depletion in the tier 1 common ratio was 480 bps.
• .
Regulatory guidance
Higher expectations for LISCC and large and complex firms
In December 2015, the FRB published the supervisory letter SR 15-18, which provides specific guidance for LISCC and large and complex firms in the areas of modeling, risk identification, data management and governance. Highlights include:
• Higher expectations around usage of models and quantitative methods for losses, balance sheet and pre-provision net revenue including increased scrutiny on assumptions in balance sheet forecasting
• Expectation to evaluate risk identification and assessment at least quarterly
• Expectation to use multiple internal scenarios across material risks in ongoing capital planning
• Elevated expectations on controls related to qualitative approaches and overlays
• Elevated expectations on model performance assessment (potential additional sensitivity testing)
• Enhanced standards for the use of benchmark models in capital planning
• Increased engagement of the RWA production function in the projections of standardized RWA
• Specific requirement for senior management to review the capital planning process quarterly
• Re-emphasis on internal audit’s role in evaluating the firm’s capital planning process and supporting risk-management and internal control practices
• More emphasis on use of scenarios for operational risk loss projections
• Elevated expectations on use of internal data
2. Regional domestic3. Regional foreign banking organization 4. If the difference between 2015 and 2016 is less than 30 bps, the trend is shown as neutral.
PPNR
• Aggregate 9Q net revenue before provisions for loan and lease losses is projected to be $384b, or 2.5% of assets, compared to $310b, or 2.1%, in DFAST 2015.
% of average assets
2016 severely adverse scenario median PPNR as a % of assets
Aggregate results Trend4
from 2015Universal
bank & IBReg.
domest.2 CustodyCredit card
Reg. FBO3 2016 2015 2014
PPNR 2.2 2.6 1.6 12.9 1.3 2.5 2.1 2.3 ▲
• For the 31 banks subject to both DFAST 2016 and 2015, total PPNR increased by $67b, or 21.6%.
• At an institutional level, overall increases and decreases in PPNR were relatively evenly distributed with 12 banks experiencing an increase, 16 banks experiencing a decrease, with the remaining 3 unchanged relative to the 2015 results.
2016 CCAR/DFAST results 4
In $ billion 2016 results 2015 results 2014 resultsTrend from
2015
8 largest BHCs 113.0 102.7 98.1 ▲
RWA and Asset Growth
• Aggregate risk-weighted assets (RWAs) are projected to increase 9.6% under the severely adverse scenario in DFAST 2016, compared to an increase of 13.2 percent in DFAST 2015 and 12.6 percent in DFAST 2014. The higher RWA growth in prior cycles is in part attributable to the regime change to the Basel III standardized approach during the projection horizon.
• The projected increase in RWA in DFAST 2016 is influenced by an associated 14.3 percent increase in assets, business and risk profile changes, as well as potential impact of model changes. For example, in 2016, the FRB made enhancements to its market RWA projection models by linking incremental risk charge and comprehensive risk measure projection models with the projected volatility in the credit market, in order to better differentiate the sensitivity of each component to scenario variables.
Supervisory-run stress test results and drivers (cont’d)
Risk-weighted assets in $
trillions
Results by BHC type Aggregate results
Universal bank & IB
Reg. domest.
CustodyCredit card
Reg. FBO
2016 2015 2014
Beginning 6.2 2.0 0.4 0.2 0.9 9.6 8.8 8.4
Ending 6.8 2.2 0.4 0.2 1.0 10.5 9.9 9.4
Growth % 9.4% 11.1% 6.3% 4.5% 10.1% 9.6% 13.2% 12.6%
Assets9 in $ trillions
Universal bank & IB
Reg. domest.
CustodyCredit card
Reg. FBO
2016 2015 2014
Beginning 9.7 2.4 0.8 0.2 1.2 14.3 13.9 13.5
Ending (estimated) 10.6 2.7 0.9 0.3 1.5 16.4 15.5 14.0
Growth % 9.7% 12.5% 10.5% 9.0% 23.5% 14.3% 11.2% 3.5%
5. $371.1b for the 31 BHCs participating in DFAST 20156. Under DFAST standardized capital actions; depicts median of BHC groupings.7. If the difference between 2015 and 2016 is less than 30 bps, the trend is shown as neutral.8. Banks subject to the GMS are BAC, C, GS, JPM, MS, WF. In addition, custody banks subject to the
counterparty default scenario under the GMS are BNY and STT9. The beginning assets balance is from the FR Y9-C and the ending assets are based on a simple linear
approximation using beginning assets and average assets, which is in turn derived by dividing total projected PPNR by the PPNR rate as disclosed by the FRB. Due to this approximation, ending assets for the individual BHC categories will not sum to the 2016 ending assets number.
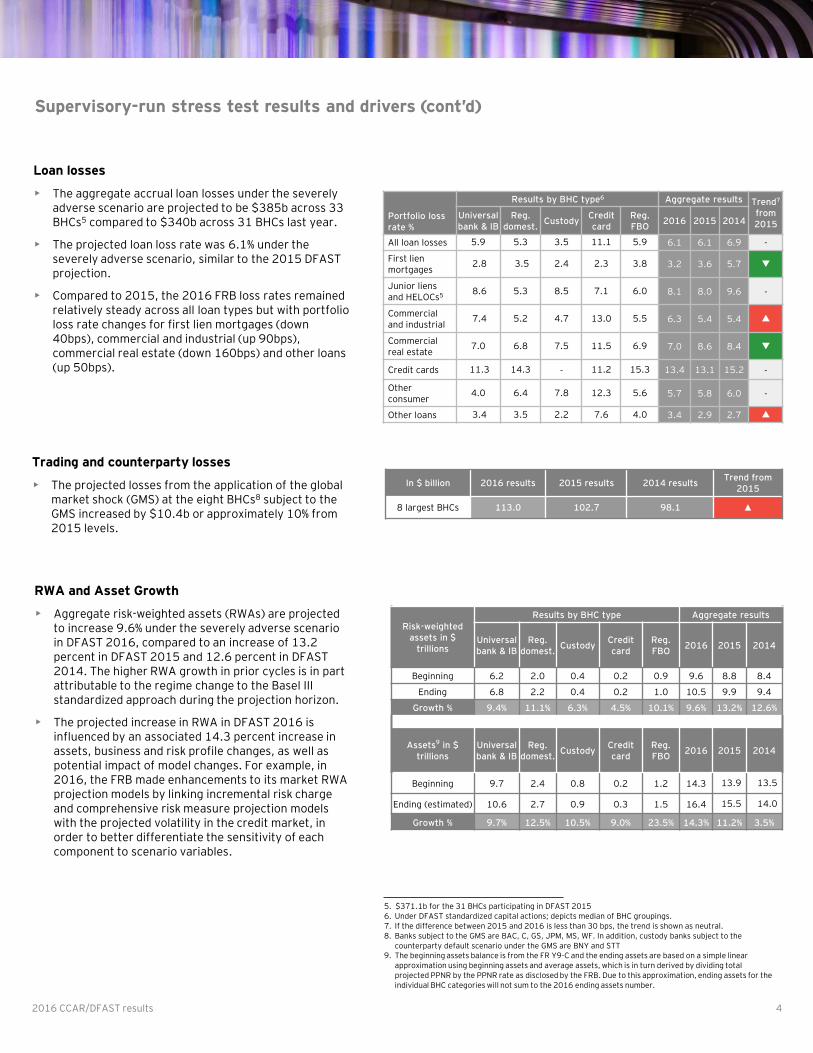
Loan losses
• The aggregate accrual loan losses under the severely adverse scenario are projected to be $385b across 33 BHCs5 compared to $340b across 31 BHCs last year.
• The projected loan loss rate was 6.1% under the severely adverse scenario, similar to the 2015 DFAST projection.
• Compared to 2015, the 2016 FRB loss rates remained relatively steady across all loan types but with portfolio loss rate changes for first lien mortgages (down 40bps), commercial and industrial (up 90bps), commercial real estate (down 160bps) and other loans (up 50bps).
Portfolio loss rate %
Results by BHC type6 Aggregate results Trend7
from 2015
Universal bank & IB
Reg. domest.
CustodyCredit card
Reg. FBO
2016 2015 2014
All loan losses 5.9 5.3 3.5 11.1 5.9 6.1 6.1 6.9 -
First lien mortgages
2.8 3.5 2.4 2.3 3.8 3.2 3.6 5.7 ▼
Junior liens and HELOCs5
8.6 5.3 8.5 7.1 6.0 8.1 8.0 9.6 -
Commercial and industrial
7.4 5.2 4.7 13.0 5.5 6.3 5.4 5.4 ▲
Commercial real estate
7.0 6.8 7.5 11.5 6.9 7.0 8.6 8.4 ▼
Credit cards 11.3 14.3 - 11.2 15.3 13.4 13.1 15.2 -
Other consumer
4.0 6.4 7.8 12.3 5.6 5.7 5.8 6.0 -
Other loans 3.4 3.5 2.2 7.6 4.0 3.4 2.9 2.7 ▲
Trading and counterparty losses
• The projected losses from the application of the global market shock (GMS) at the eight BHCs8 subject to the GMS increased by $10.4b or approximately 10% from 2015 levels.
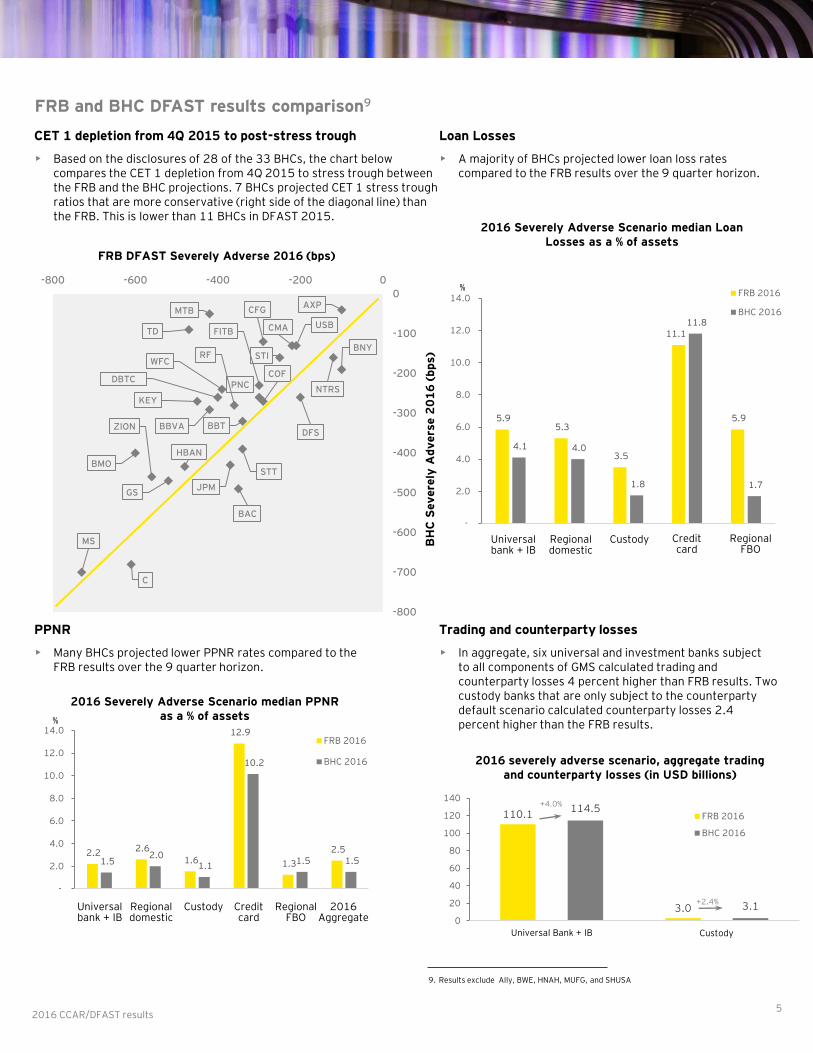
FRB and BHC DFAST results comparison9
PPNR
• Many BHCs projected lower PPNR rates compared to the FRB results over the 9 quarter horizon.
2016 Severely Adverse Scenario median Loan Losses as a % of assets
5.9 5.3
3.5
11.1
5.9
4.1 4.0
1.8
11.8
1.7
-
2.0
4.0
6.0
8.0
10.0
12.0
14.0
Universalbank & IB
Reg.domest.
Custody Creditcard
Reg. FBO
FRB 2016
BHC 2016
Credit card
Regional FBO
Universal bank + IB
Regional domestic
Custody
2.2 2.6
1.6
12.9
1.3
2.5
1.5 2.0
1.1
10.2
1.5 1.5
-
2.0
4.0
6.0
8.0
10.0
12.0
14.0FRB 2016
BHC 2016
2016 Severely Adverse Scenario median PPNR as a % of assets
2016Aggregate
Universal bank + IB
Regional domestic
Custody Credit card
Regional FBO
Loan Losses
• A majority of BHCs projected lower loan loss rates compared to the FRB results over the 9 quarter horizon.
2016 CCAR/DFAST results5
AXP
BAC
BNY
BBTBBVA
BMO
COF
C
CFG
CMA
DBTC
DFS
FITB
GS
HBAN
JPM
KEY
MTB
MS
NTRSPNC
RF
STT
STI
TDUSB
WFC
ZION
-800
-700
-600
-500
-400
-300
-200
-100
0
-800 -600 -400 -200 0
BH
C S
evere
ly A
dvers
e 2
01
6 (
bps)
FRB DFAST Severely Adverse 2016 (bps)
9. Results exclude Ally, BWE, HNAH, MUFG, and SHUSA
CET 1 depletion from 4Q 2015 to post-stress trough
• Based on the disclosures of 28 of the 33 BHCs, the chart below compares the CET 1 depletion from 4Q 2015 to stress trough between the FRB and the BHC projections. 7 BHCs projected CET 1 stress trough ratios that are more conservative (right side of the diagonal line) than the FRB. This is lower than 11 BHCs in DFAST 2015.
%
%
Trading and counterparty losses
• In aggregate, six universal and investment banks subject to all components of GMS calculated trading and counterparty losses 4 percent higher than FRB results. Two custody banks that are only subject to the counterparty default scenario calculated counterparty losses 2.4 percent higher than the FRB results.
110.1
3.0
114.5
3.1
0
20
40
60
80
100
120
140
Universal Bank + IB STT and BK
2016 severely adverse scenario, aggregate trading and counterparty losses (in USD billions)
FRB 2016
BHC 2016
+4.0%
+2.4%
Custody
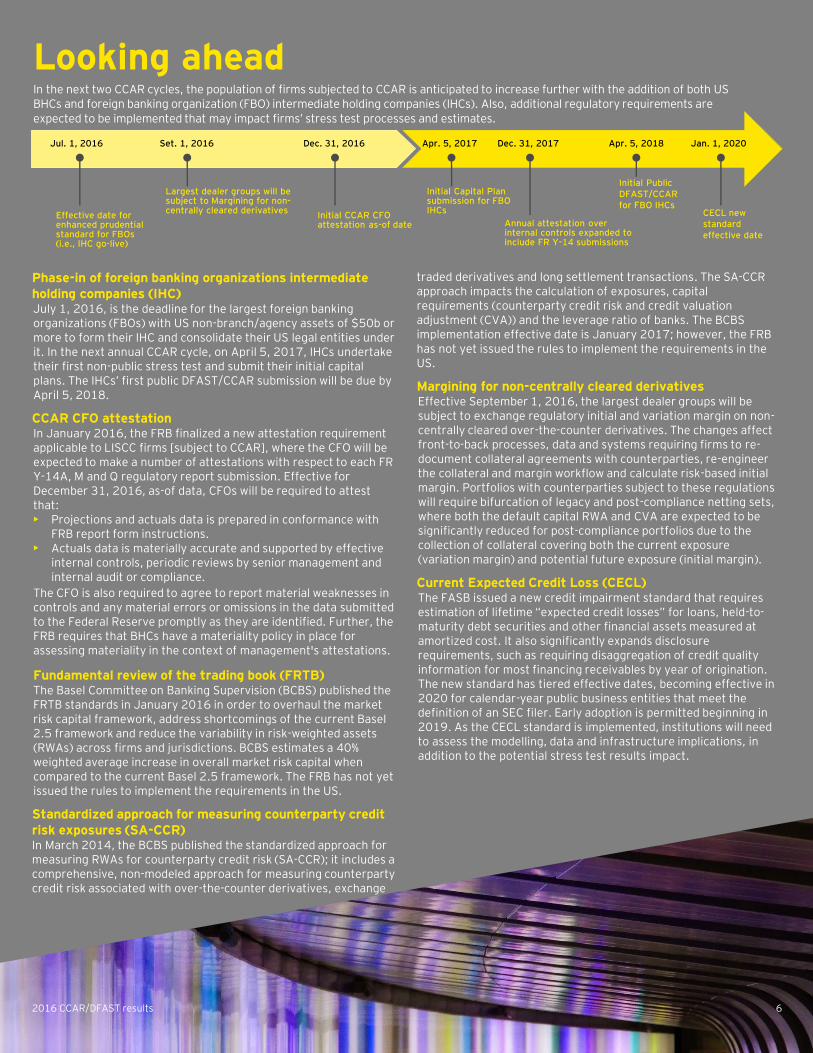
Looking aheadIn the next two CCAR cycles, the population of firms subjected to CCAR is anticipated to increase further with the addition of both US BHCs and foreign banking organization (FBO) intermediate holding companies (IHCs). Also, additional regulatory requirements are expected to be implemented that may impact firms’ stress test processes and estimates.
Phase-in of foreign banking organizations intermediate holding companies (IHC)July 1, 2016, is the deadline for the largest foreign banking organizations (FBOs) with US non-branch/agency assets of $50b or more to form their IHC and consolidate their US legal entities under it. In the next annual CCAR cycle, on April 5, 2017, IHCs undertake their first non-public stress test and submit their initial capital plans. The IHCs’ first public DFAST/CCAR submission will be due by April 5, 2018.
CCAR CFO attestationIn January 2016, the FRB finalized a new attestation requirement applicable to LISCC firms [subject to CCAR], where the CFO will be expected to make a number of attestations with respect to each FR Y-14A, M and Q regulatory report submission. Effective for December 31, 2016, as-of data, CFOs will be required to attest that:• Projections and actuals data is prepared in conformance with
FRB report form instructions.• Actuals data is materially accurate and supported by effective
internal controls, periodic reviews by senior management and internal audit or compliance.
The CFO is also required to agree to report material weaknesses in controls and any material errors or omissions in the data submitted to the Federal Reserve promptly as they are identified. Further, the FRB requires that BHCs have a materiality policy in place for assessing materiality in the context of management's attestations.
Fundamental review of the trading book (FRTB)The Basel Committee on Banking Supervision (BCBS) published the FRTB standards in January 2016 in order to overhaul the market risk capital framework, address shortcomings of the current Basel 2.5 framework and reduce the variability in risk-weighted assets (RWAs) across firms and jurisdictions. BCBS estimates a 40% weighted average increase in overall market risk capital when compared to the current Basel 2.5 framework. The FRB has not yet issued the rules to implement the requirements in the US.
Standardized approach for measuring counterparty credit risk exposures (SA-CCR)In March 2014, the BCBS published the standardized approach for measuring RWAs for counterparty credit risk (SA-CCR); it includes a comprehensive, non-modeled approach for measuring counterparty credit risk associated with over-the-counter derivatives, exchange
traded derivatives and long settlement transactions. The SA-CCR approach impacts the calculation of exposures, capital requirements (counterparty credit risk and credit valuation adjustment (CVA)) and the leverage ratio of banks. The BCBS implementation effective date is January 2017; however, the FRB has not yet issued the rules to implement the requirements in the US.
Margining for non-centrally cleared derivatives Effective September 1, 2016, the largest dealer groups will be subject to exchange regulatory initial and variation margin on non-centrally cleared over-the-counter derivatives. The changes affect front-to-back processes, data and systems requiring firms to re-document collateral agreements with counterparties, re-engineer the collateral and margin workflow and calculate risk-based initial margin. Portfolios with counterparties subject to these regulations will require bifurcation of legacy and post-compliance netting sets, where both the default capital RWA and CVA are expected to be significantly reduced for post-compliance portfolios due to the collection of collateral covering both the current exposure (variation margin) and potential future exposure (initial margin).
Current Expected Credit Loss (CECL)The FASB issued a new credit impairment standard that requires estimation of lifetime “expected credit losses” for loans, held-to-maturity debt securities and other financial assets measured at amortized cost. It also significantly expands disclosure requirements, such as requiring disaggregation of credit quality information for most financing receivables by year of origination. The new standard has tiered effective dates, becoming effective in 2020 for calendar-year public business entities that meet the definition of an SEC filer. Early adoption is permitted beginning in 2019. As the CECL standard is implemented, institutions will need to assess the modelling, data and infrastructure implications, in addition to the potential stress test results impact.
Jul. 1, 2016
Effective date for enhanced prudential standard for FBOs (i.e., IHC go-live)
Dec. 31, 2016
Initial CCAR CFO attestation as-of date
Dec. 31, 2017
Annual attestation over internal controls expanded to include FR Y-14 submissions
Initial Capital Plansubmission for FBO IHCs
Apr. 5, 2017 Apr. 5, 2018
Initial Public DFAST/CCAR for FBO IHCs
62016 CCAR/DFAST results
Largest dealer groups will be subject to Margining for non-centrally cleared derivatives
Set. 1, 2016
CECL new standard effective date
Jan. 1, 2020
EY contacts
CCAR and Stress Testing
Adam GirlingPrincipalErnst & Young LLP+1 212 773 [email protected]
Tom JacksonExecutive DirectorErnst & Young LLP+1 704 331 [email protected]
Jefrey RoblesPrincipalErnst & Young LLP+1 212 773 [email protected]
Marc SaidenbergPrincipalErnst & Young LLP+1 212 773 [email protected]
Preston ThompsonExecutive DirectorErnst & Young LLP+1 617 585 [email protected]
Trading and Counterparty
Ari CohenExecutive DirectorErnst & Young LLP+1 212 360 [email protected]
Mike SheptinPrincipalErnst & Young LLP+1 212 773 [email protected]
CCAR participant list
LISCC Firms and Large and Complex Firms: American Express Company (AXP), Bank of America Corporation (BAC), The Bank of New York Mellon Corporation (BNY), Capital One Financial Corporation (COF), Citigroup Inc. (C), Deutsche Bank Trust Corporation (DBTC), The Goldman Sachs Group (GS), HSBC North America Holdings Inc. (HNAH), JPMorgan Chase & Co. (JPM), Morgan Stanley (MS), Northern Trust Corporation (NTRS), The PNC Financial Services Group, Inc. (PNC), State Street Corporation (STT), TD Group US Holdings LLC (TD), U.S. Bancorp (USB) and Wells Fargo & Company (WFC).
Large and Non complex Firms: Ally Financial Inc. (ALLY), BancWest Corporation (BWE), BB&T Corporation (BBT), BBVA Compass Bancshares, Inc. (BBVA), BMO Financial Corp. (BMO), Comerica Incorporated (CMA), Citizens Financial Group, Inc. (CFG), Discover Financial Services (DFS), Fifth Third Bancorp (FITB), Huntington Bancshares Incorporated (HBAN), KeyCorp (KEY), M&T Bank Corporation (MTB), MUFG Americas Holdings Corporation (MUFG), Regions Financial Corporation (RF), Santander Holdings USA (SHUSA), SunTrust Banks (STI), Zions Bancorporation (ZION).

EY | Assurance | Tax | Transactions | Advisory
About EYEY is a global leader in assurance, tax, transaction and advisory services. The insights and quality services we deliver help build trust and confidence in the capital markets and in economies the world over. We develop outstanding leaders who team to deliver on our promises to all of our stakeholders. In so doing, we play a critical role in building a better working world for our people, for our clients and for our communities.
EY refers to the global organization, and may refer to one or more, of the member firms of Ernst & Young Global Limited, each of which is a separate legal entity. Ernst & Young Global Limited, a UK company limited by guarantee, does not provide services to clients. For more information about our organization, please visit ey.com.
Ernst & Young LLP is a client-serving member firm of Ernst & Young Global Limited operating in the US.
© 2016 Ernst & Young LLP. All Rights Reserved.
SCORE No. 01880-161US 1606-1958492ED None
This material has been prepared for general informational purposes only and is not intended to be relied upon as accounting, tax, or other professional advice. Please refer to your advisors for specific advice.
ey.com